a carbon footprint of four canadian wood products
TRANSCRIPT

Publication Date: November 2010
A Carbon Footprint of Four Canadian Wood Products Delivered to the UK
as per PAS 2050 Methodology

2F o r e s t r y I n n o v a t i o n I n v e s t m e n t
background paper prepared for:
Original report submitted by:
Publication Date: November 2010
James SalazarDr. Lindita Bushi
Jamie Meil

UKPAS2050: A Carbon Footprint of Four Canadian Wood Products Delivered to the UK
Final Report
ii
Executive Summary Drawing on recently completed life cycle assessment (LCA) studies by the ATHENA Institute and FPInnovations, this greenhouse (GHG) report develops a PAS 2050 compliant business-to-business (B2B) carbon footprint for 4 wood products manufactured in Canada and delivered to distributors at the port of Thamesport, United Kingdom. The four products are:
1. Softwood lumber produced in Canada; 2. Softwood plywood produced in British Columbia, Canada; 3. Western Red Cedar lumber produced in British Columbia, Canada; and 4. Western Red Cedar siding produced in British Columbia, Canada
The carbon footprint was conducted in accordance with PAS 2050:2008 and ISO 14040:2006. This study entailed documenting the carbon footprint of the 4 products across all emission sources during the process of managing and harvesting of wood fiber, the delivery of material inputs (both logs and production inputs) to the manufacturer and the manufacturing process itself, as well as the transportation of the final product to distributors in the UK. Specific North American GHG emission profiles for the various sources were multiplied by the latest IPCC 2007, 100-year global warming potential (GWP) coefficients to calculate the carbon footprint of the B2B activity profile (Appendix A). The functional unit for all four wood products was the cradle-to-gate production and delivery of one m3 of product to the United Kingdom. The results indicate that global warming potential (kg CO2 equivalent) varies from a low of 139 (Western Red Cedar lumber) to a high of 224 kg CO2e (Softwood plywood). For all products the most CO2 intensive activity is the delivery of these products from the port of Vancouver, B.C. to Thamesport in the UK (see Table ES1). Table ES1 – B2B Carbon Footprint for 4 Wood Products Delivered to the UK - 1 m3 basis Life Cycle Stage
Canadian Softwood Lumber
(1m3)
British Columbia Softwood Plywood
(1m3)
British Columbia Western Red
Cedar Lumber (1m3)
British Columbia Western Red Cedar Siding
(1m3)
Harvesting 10.33 12.07 17.31 17.31
Manufacturing 26.26 67.23 6.29 53.82
Distribution 148.29 144.46 115.73 115.73
Total (kg CO2e) 184.89 223.76 139.32 186.86
The study claims “Self Verification” of conformity with PAS 2050:2008 as per Section 10.3.4: “Greenhouse gas emission calculated by the ATHENA Institute in accordance with PAS 2050 (Table ES1), self declared”. The full 100-year GWP outcome is a function of each product’s service life during the business-to-consumer phase of the life cycle, which is beyond the scope of the present analysis. According to PAS 2050:2008, the carbon sequestration is counted as a credit to the product that contains biogenic carbon

UKPAS2050: A Carbon Footprint of Four Canadian Wood Products Delivered to the UK
Final Report
iii
based on the time-weighted average that the carbon is sequestered over the 100-year assessment period (See PAS 2050:2008 Appendix 1). For the verified B2B model, this means that the sequestration credit is excluded from the results because the timing of emissions of the sequestered carbon is unknown and dependant on usage and end of life treatment in the UK. Essentially, under PAS2050 protocol, carbon sequestration credits are calculated based on the service life of a product relative to 100-year GWP policy perspective adopted by standard; i.e., if the product only remains in service 50-years than the product is only credited with 50% of its calculated sequestered carbon, if it lasts a 100-years, then it receives full credit for the carbon contained in the product. Using the PAS2050 methodology, a projected net GWP balance is presented in the report assuming various service-lives for the products. For purposes of illustration and for the benefit of UK distributors of Canadian wood products, Table ES2 and Figure ES1 provides a net GWP balance per m3 for each product delivered to the UK. Despite the significant transportation impacts, each product represents a net carbon sink upon delivery to the UK – that is, each product stores or sequesters more carbon than was emitted in their respective harvesting, manufacture and delivery to the UK. Table ES2 – B2B Net Carbon Balance for 4 Wood Products Delivered to the UK - 1 m3 basis Life Cycle Stage Sources and Sinks
Canadian Softwood Lumber
(1m3)
British Columbia Softwood Plywood
(1m3)
British Columbia Western Red
Cedar Lumber (1m3)
British Columbia Western Red Cedar Siding
(1m3)
Fossil Carbon Emissions
(kg CO2e)
Harvesting 10.33 12.07 17.31 17.31
Manufacturing 26.26 67.23 6.29 53.82
Distribution 148.29 144.46 115.73 115.73
Sub-Total 184.89 223.76 139.32 186.86
Biogenic Carbon Sequestered
-764.55 -823.98 -631.87 -631.87
Net GWP100 Balance -580 -600 -493 -445
Note: Biogenic combustion CO2 emissions during product manufacturing are treated as being GWP neutral (as per PAS2050:2008 methodology). Carbon sequestered in product is based on 50% of the dry mass of each product being C and is converted to CO2e – see Table 2 in main report for calculation methodology.

UKPAS2050: A Carbon Footprint of Four Canadian Wood Products Delivered to the UK
Final Report
iv
Figure ES1 B2B Net Carbon Balance /m3 of Product Delivered to UK

UKPAS2050: A Carbon Footprint of Four Canadian Wood Products Delivered to the UK
Final Report
v
Acknowledgements The Athena Institute gratefully acknowledges the British Columbia Forestry Innovation Investment Ltd. for their funding of this project.

UKPAS2050: A Carbon Footprint of Four Canadian Wood Products Delivered to the UK
Final Report
vi
Table of Contents Executive Summary ....................................................................................................................................................... ii
Acknowledgements ........................................................................................................................................................ v
List of Tables ................................................................................................................................................................ viii
List of Figures ................................................................................................................................................................ ix
Abbreviations .................................................................................................................................................................. x
1 Objective ................................................................................................................................................................. 1
2 Introduction ............................................................................................................................................................. 1
3 Calculating Product Carbon Footprint ..................................................................................................................... 1
3.1 System Boundary of B2B carbon footprint ................................................................................................... 3
3.2 Functional Unit .............................................................................................................................................. 4
3.3 Allocation Rules ............................................................................................................................................ 4
3.4 Mass Balance ............................................................................................................................................... 4
3.4.1 Biogenic Carbon Emissions ........................................................................................................... 5
3.4.2 Biogenic Carbon Sequestration ..................................................................................................... 5
3.5 Referenced Product Category Rules ............................................................................................................ 6
3.6 Claims of Conformity - Level 3- Self Verification .......................................................................................... 6
3.7 Offsetting ...................................................................................................................................................... 6
3.8 Uncertainty ................................................................................................................................................... 7
4 Carbon Footprint Results by Product ...................................................................................................................... 7
4.1 Softwood Lumber ......................................................................................................................................... 7
4.1.1 Resource Harvesting ...................................................................................................................... 7
4.1.2 Manufacturing ................................................................................................................................ 8
4.1.3 Distribution ................................................................................................................................... 10
4.1.4 Business to Business Carbon Footprint Summary ....................................................................... 11
4.2 Softwood Plywood ...................................................................................................................................... 12
4.2.1 Resource Harvesting .................................................................................................................... 12
4.2.2 Manufacturing .............................................................................................................................. 13
4.2.3 Distribution ................................................................................................................................... 15
4.2.4 Business to Business Carbon Footprint Summary ....................................................................... 15
4.3 British Columbian Western Red Cedar Lumber ......................................................................................... 16
4.3.1 Resource Harvesting .................................................................................................................... 16
4.3.2 Manufacturing .............................................................................................................................. 17

UKPAS2050: A Carbon Footprint of Four Canadian Wood Products Delivered to the UK
Final Report
vii
4.3.3 Distribution ................................................................................................................................... 19
4.3.4 Business to Business Carbon Footprint Summary ....................................................................... 19
4.4 British Columbian Western Red Cedar Siding ............................................................................................ 20
4.4.1 Resource Harvesting .................................................................................................................... 20
4.4.2 Manufacturing .............................................................................................................................. 21
4.4.3 Distribution ................................................................................................................................... 23
4.4.4 Business to Business Carbon Footprint Summary ....................................................................... 23
5 Greenhouse Gas Calculation Spreadsheet ........................................................................................................... 25
6 Conclusions ........................................................................................................................................................... 25
7 References ............................................................................................................................................................ 26
8 Glossary ................................................................................................................................................................ 28
Appendix A ................................................................................................................................................................... 30

UKPAS2050: A Carbon Footprint of Four Canadian Wood Products Delivered to the UK
Final Report
viii
List of Tables Table 1 Mass Balance for wood inputs and outputs for 1 m3 product in kg and per cent ..................................... 5 Table 2 Biogenic carbon sequestration credits for four Canadian wood products at various expected service
lives – kg CO2e/m3 ................................................................................................................................... 6 Table 3 Emission source flows in the management and harvesting of Canadian wood fiber in the production of
softwood lumber – kg CO2e/m3 lumber .................................................................................................... 8 Table 4 Major greenhouse gas emissions by source in the management and harvesting of Canadian wood fiber
in the production of softwood lumber – kg CO2e/m3 lumber ................................................................... 8 Table 5 Emission source flows in the manufacture of Canadian softwood lumber – kg CO2e/m3 lumber ............. 9 Table 6 Major greenhouse gas emissions by source in the manufacture of Canadian softwood lumber – kg
CO2e/m3 lumber ..................................................................................................................................... 10 Table 7 Emission source flows in the transport of Canadian softwood lumber to the UK– kg CO2e/m3 lumber .. 11 Table 8 Major greenhouse gas emissions by source in the transport of Canadian softwood lumber to the UK –
kg CO2e/m3 lumber ................................................................................................................................ 11 Table 9 Canadian softwood lumber Business-to-Business Carbon Foot Print Summary – kg CO2e/m3 lumber . 11 Table 10 Emission source flows in the management and harvesting of Canadian wood fiber in the production of
softwood plywood – kg CO2e/m3 plywood ............................................................................................. 12 Table 11 Major greenhouse gas emissions by source in the management and harvesting of Canadian wood fiber
in the production of softwood plywood – kg CO2e/m3 plywood .............................................................. 13 Table 12 Emission source flows in the manufacture of Canadian softwood plywood – kg CO2e/m3 plywood ....... 14 Table 13 Major greenhouse gas emissions by source in the manufacture of Canadian softwood plywood – kg
CO2e/m3 plywood .................................................................................................................................. 14 Table 14 Emission source flows in the transport of Canadian of softwood plywood to the UK– kg CO2e/m3
plywood .................................................................................................................................................. 15 Table 15 Major greenhouse gas emissions by source in the transport of Canadian softwood plywood to the UK –
kg CO2e/m3 plywood .............................................................................................................................. 15 Table 16 Canadian softwood plywood Business-to-Business Carbon Foot Print Summary – kg CO2e/m3 plywood
............................................................................................................................................................... 16 Table 17 Emission source flows in the management and harvesting of Canadian wood fiber in the production of
Western Red Cedar lumber – kg CO2e/m3 lumber ................................................................................ 17 Table 18 Major greenhouse gas emissions by source in the management and harvesting of Canadian wood fiber
in the production of Western Red Cedar lumber – kg CO2e/m3 lumber ................................................ 17 Table 19 Emission source flows in the manufacture of Western Red Cedar lumber – kg CO2e/m3 lumber .......... 18 Table 20 Major greenhouse gas emissions by source in the manufacture of Western Red Cedar lumber – kg
CO2e/m3 lumber ..................................................................................................................................... 18 Table 21 Emission source flows in the transport of Western Red Cedar Lumber to the UK– kg CO2e/m3 lumber
............................................................................................................................................................... 19 Table 22 Major greenhouse gas emissions by source in the transport of Western Red Cedar lumber to the UK –
kg CO2e/m3 lumber ................................................................................................................................ 19 Table 23 Western Red Cedar lumber Business-to-Business Carbon Foot Print Summary – kg CO2e/m3 lumber 20 Table 24 Emission source flows in the management and harvesting of Canadian wood fiber in the production of
Western Red Cedar siding – kg CO2e/m3 siding ................................................................................... 21

UKPAS2050: A Carbon Footprint of Four Canadian Wood Products Delivered to the UK
Final Report
ix
Table 25 Major greenhouse gas emissions by source in the management and harvesting of Canadian wood fiber in the production of Western Red Cedar siding – kg CO2e/m3 siding ................................................... 21
Table 26 Emission source flows in the manufacture of Western Red Cedar siding – kg CO2e/m3 siding ............. 22 Table 27 Major greenhouse gas emissions by source in the manufacture of Western Red Cedar siding – kg
CO2e/m3 siding ...................................................................................................................................... 22 Table 28 Emission source flows in the transport of Western Red Cedar siding to the UK– kg CO2e/m3 siding .... 23 Table 29 Major greenhouse gas emissions by source in the transport of Western Red Cedar siding to the UK –
kg CO2e/m3 siding .................................................................................................................................. 23 Table 30 Western Red Cedar Siding Business-to-Business Carbon Foot Print Summary – kg CO2e/m3 siding ... 24
List of Figures Figure 1 Carbon footprint system ............................................................................................................................ 3

UKPAS2050: A Carbon Footprint of Four Canadian Wood Products Delivered to the UK
Final Report
x
Abbreviations B2B Business-to-Business
B2C Business-to-Consumer
BC British Columbia, Canada
CH4 Methane
CIPEC Canadian Industry Program for Energy Conservation
CO2 Carbon Dioxide
CO2e Carbon Dioxide Equivalents
GHG Greenhouse Gas
GWP Global Warming Potential
ISO International Standards Organization
kg Kilogram
km Kilometer
kWh kiloWatt hours
LCA Life cycle assessment
LCI Life cycle inventory
mbfm Thousand board foot measure
msf Thousand square feet
N2O Nitrous Oxide
odkg Oven dry kilogram
PAS Publicly available standard
PCR Product category rule
tkm ton*kilometer
WRC Western Red Cedar

UKPAS2050: A Carbon Footprint of Four Canadian Wood Products Delivered to the UK
Final Report
1
1 Objective The project objective is to develop a transparent and credible business-to-business (B2B) carbon footprint for four Canadian wood products delivered to the UK in accordance with the 2008 British Standards Institute Publicly Available Specification 2050 (PAS2050:2008). The four products of interest include:
1. Softwood lumber produced in Canada; 2. Softwood plywood produced in British Columbia, Canada; 3. Western Red Cedar lumber produced in British Columbia, Canada; and 4. Western Red Cedar siding produced in British Columbia, Canada
2 Introduction The UK, like most Kyoto Protocol signatory countries, is targeting an ambitious shift towards a more sustainable, low carbon economy. Since 2005, the British Parliament has been developing policies and legislations in an effort to secure its future, within the mandates of the UK “sustainable development strategy.” The UK enacted its Climate Change Act in 2008, becoming the first country in the world to have a legally-binding long-term framework to cut carbon emissions1. In the same year, the UK published a specification for greenhouse gas or carbon footprinting. The “Specification for the assessment of the life cycle greenhouse gas emissions of goods and services”2 was released in October 2008 and was developed by the British Standards Institute in collaboration with the Department for Environment, Food and Rural Affairs and with the Carbon Trust. Also known as PAS 2050 (“publicly available specification” 2050), this is one of the world’s first nationally oriented standards that assesses greenhouse gas emissions of individual products and services using life cycle assessment standards (ISO14040/44)3 as a basis for the specification. Many other countries are reviewing this standard in the course of developing their own approaches to national greenhouse gas assessments for products and services. The Athena Institute, in collaboration with FPInnovations, has recently completed ISO compliant cradle-to-gate LCAs of Canadian softwood lumber (April 2009), Canadian (BC) softwood plywood (March 2008), BC Western Red Cedar (WRC) lumber and siding (2008), CIPEC4 Status of Energy Use in the Canadian Wood Products Sector (2010) and a “Woodmiles” transportation metric for the shipment of Canadian forest products to the UK (March 2010). These recent product LCA and transportation studies present an opportunity to develop a timely and credible business-to-business (B2B) carbon footprint for Canadian softwood lumber, BC plywood and WRC lumber and siding delivered to the UK according to the PAS 2050 methodology.
3 Calculating Product Carbon Footprint This section describes the life cycle assessment (LCA) approach taken by Athena Institute in accordance
1 http://www.defra.gov.uk/environment/climate/legislation/index.htm 2PAS2050:2008: “Specification for the assessment of the life cycle greenhouse gas emissions of goods and services” British Standards Institute, Publicly Available Specification, October 2008. 3 ISO 14040:2006, Environmental Management - Life Cycle Assessment - Principles and Framework and ISO 14044:2006, Environmental Management - Life Cycle Assessment – Requirements and Guidelines. 4 CIPEC stands for Canadian Industry Program for Energy Conservation.

UKPAS2050: A Carbon Footprint of Four Canadian Wood Products Delivered to the UK
Final Report
2
with PAS 2050:2008 to evaluate the GHG emissions associated with the four Canadian wood products. The latest 2007, 100-year global warming potential (GWP) coefficients as presented in PAS 2050:2008, Annex A, are used in calculations for this B2B carbon footprint study (Appendix A). It also sets out the system boundary or supply chain considered for the four wood products delivered to the UK as per the PAS2050:2008 methodology. The GHG accounting and reporting approach adheres to these five major principles: relevance, completeness, consistency, accuracy and transparency. As recommended in PAS 2050:2008, the calculation of the carbon footprint for the 4 Canadian products was based on five basic steps: Step 1 Building a process map Step 2 Checking boundaries and prioritization Step 3 Collecting data Step 4 Calculating the footprint Step 5 Checking uncertainty (optional) – a qualitative assessment is conducted. Carbon footprints of Canadian wood products have been quantified at the "GHG source" level. This approach generally requires two types of information. One describes the level of activity for a GHG source (e.g. the amount of electricity consumed) and the other defines the GHG emission factor associated with the source (e.g. emission factor associated with electricity production in kg or tonnes CO2e/kWh). Individual GHG emissions by source type are reported separately to differentiate each greenhouse gas (e.g. CO2 fossil, CO2 biogenic, CH4, N2O and other GHGs). Once GHG emissions are calculated for each activity they are converted to CO2e using the relevant global warming potential (GWP) equivalence factors described in PAS 2050 Table A.1, and summed for an overall measure of GHG emissions for each source. Then the calculation itself simply involves multiplying the activity data by the appropriate emission factors, as shown in formula 1 [2].
Carbon footprint of a given activity = Activity data (mass/volume/kWh/km) × Emission factor (CO2e per unit)
Then the GHG results for all sources are “rolled up” on a process system such as harvesting, manufacturing, and distribution and summed for each individual Canadian wood product (see Section 5). As recommended in PAS 2050:2008 Guide, calculating the carbon footprint normally requires a “mass balance” to ensure all input, output and waste streams are accounted for (see Section 3.4). In respect to the GHG emissions, PAS 2050:2008, section 5.3 requirements are strictly followed and more specifically;
• CO2 emissions arising from fossil carbon sources are included in the calculation of GHG emissions from the life cycle of products;
• CO2 emissions arising from biogenic carbon sources are tracked, but excluded from the calculation of GHG emissions from the life cycle of products;

UKPAS2050: A Carbon Footprint of Four Canadian Wood Products Delivered to the UK
Final Report
3
• Non-CO2 emissions arising from both fossil and biogenic carbon sources are included in the calculation of GHG emissions from the life cycle of products.
The carbon stored in wood products can be included in the assessment, but PAS 2050 requires an adjustment made for expected life (i.e., how long the carbon is stored) relative to the 100-year GWP assessment period used in the standard. This stored or sequestered carbon in the product is particularly relevant for a business-to-consumer (B2C) carbon footprint, which is one step beyond the focus of this particular study, which deals with only the business-to-business segment of the carbon life cycle. However, Section 3.4 of the report documents the projected carbon footprint for each of the four Canadian wood products based on the methodological guidance provided in PAS2050 subject to the conditions described in PAS 2050:2008, section 5.4.3 and 5.4.4. 3.1 System Boundary of B2B carbon footprint Figure 1 depicts the supply chain system boundary for the four wood products.
Figure 1 Carbon footprint system
This assessment of the life cycle GHG emissions of products is made using the attributional approach. In this LCI modeling framework, the inputs and output flows of all processes of a system are inventoried as they occur- by modeling process along an existing supply-chain. The elements and processes within the boundary of the system include:

UKPAS2050: A Carbon Footprint of Four Canadian Wood Products Delivered to the UK
Final Report
4
• Harvesting: Forest management and resource extraction and inbound transportation of
consumables;
• Manufacturing: Manufacturing processes, input materials production (excluding wood fibre) and in-bound transportation of materials and consumables, energy sources, operation of premises (lighting, heating, cooling, ventilation, humidity control and other environmental controls over the premises - if applicable), storage of raw materials and products and waste disposal (wood and non-wood) including transportation; and
• Distribution: Delivery to business customer - Out-bound transportation of Canadian wood
products from the mill to the port of Vancouver and delivery to the UK (port of Thamesport) via the port of Vancouver.
The elements and processes excluded from the system boundary include:
• Capital goods; • Human energy inputs to processes and/or preprocessing (e.g. logs barked by hand rather than by
machinery); • Transport of consumers to and from the point of retail purchase; • Transport of employees to and from their normal place of work; and • Animals providing transport services.
3.2 Functional Unit As specified and required in PAS 2050:2008, section 5.8, assessment of the GHG emissions arising from the life cycle of products is carried out in a manner that allows the mass of CO2e to be reported per functional unit for the product.” The functional unit is the production and delivery of one m3 of each Canadian wood product. A cubic meter of product is equivalent to the following conventional units of measure in the North American market:
• Lumber: 0.63 mbfm (thousand board foot measure) • Plywood: 1,184 square feet of 3/8” thick plywood • Siding: 0.51 mbfm (thousand board foot measure)
3.3 Allocation Rules In conformance with the PCR 2003:8-Wood particle boards [13], the best recommended allocation rules for the wood sector [14-16] and ISO 14040/44:2006 [3-4], the following rules are applied. "Allocation among co-products of unit processes should be avoided by detailed system description. If it is not possible, allocation can be done on a mass basis”. Where necessary, mass allocation was applied in the course of completing this carbon footprint analysis. 3.4 Mass Balance As required in PAS 2050:2008, page 20, a mass balance is conducted for each product of interest to ensure all inputs, outputs and waste streams are accounted for. Table 1 presents the mass balance for each wood product system of interest.

UKPAS2050: A Carbon Footprint of Four Canadian Wood Products Delivered to the UK
Final Report
5
Table 1 Mass balance for wood inputs and outputs for 1 m3 product in kg and per cent
Softwood Lumber
Softwood Plywood
Western Red Cedar Lumber
Western Red Cedar Siding
Roundwood (with bark) 968.05 100.00% 883.89 97.90% 1312.31 100.00% 2764.18 100.00%
Purchased Veneer 18.96 2.10%
Total Inputs 968.05 100.00% 902.84 100.00% 1312.31 100.00% 2764.18 100.00%
Primary Product 417.03 43.08% 449.44 49.78% 344.66 26.26% 344.66 12.47%
Pulpchips 334.20 34.52% 175.13 19.40% 390.89 29.79% 961.15 34.77%
Wood Hogfuel 0.00 0.00% 193.91 21.48% 14.93 1.14% 31.45 1.14%
Other Coproducts 216.82 22.40% 84.36 9.34% 561.84 42.81% 1426.93 51.62%
Total Outputs 968.05 100.00% 902.84 100.00% 1312.31 100.00% 2764.18 100.00% 3.4.1 Biogenic Carbon Emissions
PAS 2050:2008 5.3.1: CO2 emissions arising from biogenic carbon sources shall be excluded from the calculation of GHG emissions over the life cycle of products, except where the CO2 arises from land use change. 3.4.2 Biogenic Carbon Sequestration
According to PAS 2050:2008, carbon sequestration is counted as a credit to the product that contains biogenic carbon based on the time-weighted average that the carbon is sequestered over the 100-year assessment period (See PAS 2050:2008 Appendix 1 for methodology). For the B2B model, this means that the sequestration credit is excluded from the results because the timing of emissions of the sequestered carbon is unknown and dependant on usage and end of life treatment in the UK. Based on the dry mass of the products, several illustrative examples of carbon sequestration have been calculated assuming the biogenic carbon is fully emitted in year 50, year 75, or year 100 (see Table 2). Essentially, under PAS2050 protocol, carbon sequestration credits are calculated based on the service life of a product relative to 100-year GWP policy perspective adopted by standard; i.e., if the product only remains in service 50-years than the product is only credited with 50% of its calculated sequestered carbon, if it lasts a 100-years, then it receives full credit for the carbon contained in the product.

UKPAS2050: A Carbon Footprint of Four Canadian Wood Products Delivered to the UK
Final Report
6
Table 2 Biogenic carbon sequestration credits for four Canadian wood products at various expected service lives – kg CO2e/m3
Year Emitted
Softwood Lumber
Softwood Plywood
Western Red Cedar
Lumber
Western Red Cedar Siding
(kg CO2e) (kg CO2e) (kg CO2e) (kg CO2e)
50 382.27 411.99 315.93 315.93 75 573.41 617.98 473.90 473.90
100 764.55 823.98 631.87 631.87 Notes:
1. Based on a bone-dry weight of 417.03 kg per m3 for Canadian softwood lumber and by weight, wood is 50% carbon (C) and can be expressed on a CO2 equivalent basis using the molecular weight of CO2 (44) relative to C (12) – e.g., 417.03 kg x 0.5 x 44/12 = 764.55 kg assuming a 100-year expected life or 382.28 kg CO2 equivalent at an expected life of 50-years
2. BC Plywood basic product density = 449.44 kg per m3 x 0.5 x 44/12 = 823.98 3. BC WRC basic product density = 344.66 kg per m3 x 0.5 x 44/12 = 631.87
3.5 Referenced Product Category Rules As specified in PAS 2050:2008 Specification document [1], page 1 and in PAS 2050:2008 Guide document [2], page 12 and 13, the relevant product category rules (PCRs) where available should be adapted. The PCR 2003:8 - Wood particleboards, The Swedish Environmental Management Council, Version 1.0, 2003-12-15, http://www.environdec.com/pcr/e_psr0308.pdf, is the only wood product PCR consulted for this analysis. Please note that the PCR for "Products of wood, cork, straw and plaiting materials" is unavailable because of an ongoing update of this document. http://www.environdec.com/pageID.asp?id=131&menu=3,7,0&pcrId=271 3.6 Claims of Conformity - Level 3- Self Verification As specified in PAS 2050:2008 [1], Level 3 of Verification: a self-verification process was conducted by the Athena Institute to claim conformance with PAS 2050:2008. As required in PAS 2050:2008 [1], the appropriate method for self-verification and presentation of the results outlined in ISO 14021:1999 is followed. 3.7 Offsetting In respect to “Offsetting”, as specified in PAS 2050:2008, section 5.7, GHG emissions offset mechanisms, including but not limited to, voluntary offset schemes or nationally or internationally recognized offset mechanisms, are not used at any point in the life cycle of the Canadian wood products in order to claim reduction in the emissions associated with the product.

UKPAS2050: A Carbon Footprint of Four Canadian Wood Products Delivered to the UK
Final Report
7
Athena Institute is in agreement with PAS 2050:2008 that the use of an energy source that results in lower GHG emissions to the atmosphere and therefore achieves a lower emission factor, such as renewable electricity or conventional thermal generation with carbon capture and storage, is not a form of offsetting. 3.8 Uncertainty Based on the operational experience and our professional judgment, the overall uncertainty has been estimated to be low. Primary (measured) input/output data on Canadian lumber, plywood, WRC lumber and WRC siding products manufacturing, resource harvesting and raw materials transportation, collected in the last few years, are drawn on for this project. Canadian mills did provide measured activity data for their facilities and for this type of data the uncertainty is expected to be low. Canadian LCI profiles have also been benchmarked against the U.S LCI profiles for the softwood lumber and plywood data. The GHG emissions data sources are mostly based on Canadian Government publications from 2006-2007 and the U.S LCI database, which have received a high level of scrutiny and therefore, are also of a high quality.
4 Carbon Footprint Results by Product This section presents an overview and the detailed information used to arrive at a PAS2050 compliant carbon footprint statement. A detailed spreadsheet documenting each product’s carbon footprint is also available (filename: PAS2050 Carbon Footprint Finl.xls) 4.1 Softwood Lumber
The softwood lumber industry is by far the single largest sector within the Canadian wood products industry. In 2007, the industry produced about 72 million m3 of lumber. There are over 1,000 softwood sawmills in Canada, ranging in capacity up to one billion board feet (1.6 million m3). While softwood lumber is produced across the country, production is concentrated in B.C. Alberta, Ontario and Quebec.
The softwood lumber mills that participated in the study were well distributed across the country, and provided a good representation of geographical distribution of the Canadian softwood lumber industry. Except for one mill located in New Brunswick, all the mills included in the study operated in the four primary producing provinces as follows: B.C (3 mills), Alberta (2 mills), Ontario (4 mills) and Quebec (5 mills). The size of participating production facilities ranged from about 28 to 300 million board feet annually.
4.1.1 Resource Harvesting
The harvesting and forest management LCI data used in this study was derived from a survey of 12 Canadian forestlands covering the same data sample period – 2006/2007 calendar/fiscal-year. As part of the survey of softwood lumber mills, the study questionnaire sought material and energy use information associated with resource extraction (wood harvesting), forest management and transportation of fiber to these mills, to determine the energy use and the environmental load involved in this key upstream activity. Note as per PAS2050, fiber transportation is reported under the manufacturing activity stage for the purposes of this carbon footprint.

UKPAS2050: A Carbon Footprint of Four Canadian Wood Products Delivered to the UK
Final Report
8
Harvesting of wood is dominated by mechanical systems in both eastern and western Canada. Diesel is the primary fuel type used in both the harvesting and management of Canadian forests. Table 3 presents the fuel and consumables use in the production of cubic meter of log as well as per cubic meter of lumber basis inclusive of conversion efficiency and applied mass allocation conventions. Table 4 then shows the related greenhouse gas emissions associated with the fuel use and consumables; again on a cubic meter of log and lumber basis.
Table 3 Emission source flows in the management and harvesting of Canadian wood fiber in the production of softwood lumber – kg CO2e/m3 lumber
Emission Source Unit Usage per 1 m3
Logs
Usage per 1m3 Lumber
GWP (kg CO2e)
%
Gasoline l 4.11E-05 4.58E-05 1.17E-04 0.00% Diesel l 2.84 3.17 10.14 98.10% Liquefied petroleum gas l 5.80E-04 6.47E-04 1.33E-03 0.01% Electricity, Canada kWh 0.03 0.03 0.01 0.09% Hydraulic Fluid and Lubricants l 0.03 0.04 0.03 0.26% Seedlings and Fertilizer mixed 0.16 1.54%
Total Harvesting 10.33 100.00%
Table 4 Major greenhouse gas emissions by source in the management and harvesting of Canadian wood fiber in the production of softwood lumber - kg CO2e/m3 lumber
Emission Source Fossil CO2 (kg)
Biogenic CO2 (kg)
CH4 (kg)
N20 (kg)
Other GHGs (kg)
Gasoline 0.00 0.00 0.00 2.89E-09 8.44E-13 Diesel 9.80 0.01 0.01 7.59E-06 1.76E-06 Liquefied petroleum gas 0.00 0.00 0.00 7.67E-08 8.32E-12 Electricity, Canada 0.01 0.00 0.00 1.76E-09 2.38E-11 Hydraulic Fluid and Lubricants 0.03 0.00 0.00 2.01E-08 2.87E-10 Seedlings and Fertilizer 0.15 0.00 0.00 3.49E-06 4.59E-09 Total Harvesting 9.98 0.01 0.01 1.12E-05 1.77E-06
Notes: other GHGs (greenhouse gases) are all other identified sources as per IPCC (Appendix A) Biogenic CO2 not included in total 4.1.2 Manufacturing
The softwood lumber manufacturing system accounts for the following unit processes:

UKPAS2050: A Carbon Footprint of Four Canadian Wood Products Delivered to the UK
Final Report
9
• Sawing: Sawing encompasses all log handling from reception at mill gate to the breakdown of the logs into rough green lumber;
• Kiln drying: Drying encompasses the kilns, loading area, and unloading/cooling (storage) and air drying areas; and
• Planing: Planing encompasses the unstacker, planer, and packaging areas. Each of these includes conveyance to the next unit process or plant gate.
In addition, various input consumables (lubricating and hydraulic fluids, greases and packaging materials) are also included in the LCI profile underlying this carbon footprint profile. Tables 5 and 6 report the various emission sources and associated greenhouse emissions in the manufacture of softwood lumber, respectively.
Table 5 Emission source flows in the manufacture of Canadian softwood lumber – kg CO2e/m3 lumber
Emission Source Unit Usage per 1 m3
Lumber
GWP (kg CO2e)
%
Natural gas m3 2.51 6.13 23.35% Gasoline l 0.02 0.05 0.19% Diesel l 1.16 3.71 14.13% Liquefied petroleum gas l 0.07 0.15 0.58% Hogfuel odkg 23.15 0.06 0.23% Electricity, Canada kWh 32.14 8.76 33.36% Combination truck, diesel tkm 72.96 6.81 25.93% Hydraulic Fluid and Lubricants l 0.12 0.09 0.34% Packaging mixed 0.49 1.85% Waste Collection and Landfill kg 4.38 0.01 0.04%
Total Manufacturing 26.26 100.00%

UKPAS2050: A Carbon Footprint of Four Canadian Wood Products Delivered to the UK
Final Report
10
Table 6 Major greenhouse gas emissions by source in the manufacture of Canadian softwood lumber – kg CO2e/m3 lumber
Emission Source Fossil CO2 (kg)
Biogenic CO2 (kg)
CH4 (kg)
N2O (kg)
Other GHGs (kg)
Natural gas 5.42 0.00 0.02 1.54E-06 8.41E-09 Gasoline 0.05 0.00 0.00 1.23E-06 3.58E-10 Diesel 3.59 0.00 0.00 2.78E-06 6.45E-07 Liquid petroleum gas 0.14 0.00 0.00 8.75E-06 9.50E-10 Hogfuel 0.00 20.31 0.00 0.00E+00 3.49E-05 Electricity, Canada 8.30 0.00 0.02 1.72E-06 2.31E-08 Combination truck, diesel 6.55 0.00 0.01 1.50E-04 4.09E-08 Hydraulic Fluid and Lubricants 0.08 0.00 0.00 6.78E-08 9.69E-10
Packaging 0.37 0.00 0.00 2.45E-06 9.73E-09 Waste Collection and Landfill 0.01 0.00 0.00 7.35E-09 1.70E-09
Total Manufacturing 24.53 20.33 0.06 1.69E-04 3.56E-05 Notes: other GHGs (greenhouse gases) are all other identified sources as per IPCC (Appendix A) Biogenic CO2 not included in total 4.1.3 Distribution
The transportation mode and distance to the port of Vancouver was established based on the five Western Canada softwood lumber mills that participated in the original lumber LCA study and are most likely to use this port for shipment to Europe. The transportation distance to Vancouver included trucking to the nearest rail yard, train transportation to Vancouver, and trucking directly to the port for the mills located closer to the port. The details of this weighted average transportation calculation is contained within the worksheet “Trans&Seq” in the spreadsheet that accompanies this report (filename: PAS2050 Carbon Footprint Finl.xls). The weighted average transportation mode and distance from mill-to-port for softwood lumber is 113 km by truck and 690 km by train. Transportation of wood products from Canada to the UK was previously examined in the FPInnovation’s UK Woodmiles study [12]. This study determined that wood products are transported on average 16,447 km by container ship through the Panama Canal to the port of Thamesport. Tables 7 and 8 report the distribution emission sources and associated greenhouse emissions in the manufacture of softwood lumber, respectively.

UKPAS2050: A Carbon Footprint of Four Canadian Wood Products Delivered to the UK
Final Report
11
Table 7 Emission source flows in the transport of Canadian softwood lumber to the UK– kg CO2e/m3 lumber
Emission Source Unit Usage per 1 m3 Lumber
GWP (kg CO2e)
%
Combination truck, diesel tkm 50.72 4.73 3.19% Train, diesel tkm 310.94 6.89 4.65%
Ocean freighter, average fuel tkm 7407.53 136.67 92.16%
Total Distribution 148.29 100.00%
Table 8 Major greenhouse gas emissions by source in the transport of Canadian softwood lumber to the UK – kg CO2e/m3 lumber
Emission Source Fossil CO2 (kg)
Biogenic CO2 (kg)
CH4 (kg)
N20 (kg)
Other GHGs (kg)
Combination truck, diesel 3.24 0.00 0.00 7.41E-05 2.02E-08 Train, diesel 6.63 0.00 0.01 1.52E-04 4.15E-08 Ocean freighter, average fuel 131.59 0.09 0.16 2.69E-03 8.12E-07
Total Distribution 142.78 0.10 0.17 2.95E-03 8.82E-07 Notes: other GHGs (greenhouse gases) are all other identified sources as per IPCC (Appendix A) Biogenic CO2 not included in total 4.1.4 Business to Business Carbon Footprint Summary
Table 9 summarizes the B2B carbon footprint for Canadian softwood lumber delivered to the UK. 80% of the resulting carbon footprint is ascribed to the transport of Canadian softwood lumber to the UK. Table 9 Canadian softwood lumber Business-to-Business Carbon Foot Print Summary – kg CO2e/m3 lumber
Life Cycle Stage
Fossil CO2 (kg)
Biogenic CO2 (kg)
CH4 (kg)
N20 (kg)
Other GHGs (kg)
Total GWP
(kg CO2e)
%
Harvesting 9.98 0.01 0.01 1.12E-05 1.77E-06 10.33 5.6%
Manufacturing 24.53 20.33 0.06 1.69E-04 3.56E-05 26.26 14.2%
Distribution 142.78 0.10 0.17 2.95E-03 8.82E-07 148.29 80.2%
Total 177.29 20.43 0.25 3.13E-03 3.83E-05 184.89 100.0%

UKPAS2050: A Carbon Footprint of Four Canadian Wood Products Delivered to the UK
Final Report
12
4.2 Softwood Plywood Canada’s structural softwood plywood production was approximately 2.6 billion sq. ft. in 2006. Over 80% of all softwood sheathing plywood production is located in the province of BC. In 2006 there were 12 softwood plywood sheathing plants operating in Canada. The three BC mills participating in this study represent 25% of all plants producing softwood plywood in Canada. 4.2.1 Resource Harvesting
The same harvesting and forest management LCI data used in the preparation of the softwood lumber carbon footprint are also drawn on to calculate the carbon footprint for softwood plywood (see Section 4.1.1). Note as per PAS2050, fiber transportation is reported under the manufacturing activity stage for the purposes of this carbon footprint.
Table 10 presents the fuel and consumables used in the production of cubic meter of log as well as on a cubic meter of plywood (9mm basis) inclusive of conversion efficiency and applied mass allocation conventions. Table 11 then shows the related greenhouse gas emissions associated with the fuel and consumables; again on a cubic meter of log and plywood basis.
Table 10 Emission source flows in the management and harvesting of Canadian wood fiber in the production of softwood plywood – kg CO2e/m3 plywood Emission Source Unit Usage
per 1 m3 Logs
Usage Per 1m3 Plywood
GWP (kg CO2e)
%
Gasoline l 4.1E-05 4.5E-05 1.37E-04 0.00% Diesel l 2.84 3.12 11.85 98.18% Liquefied petroleum gas l 0.00 0.00 0.00 0.01% Electricity, British Columbia kWh 0.03 0.03 0.00 0.01% Hydraulic Fluid and Lubricants l 0.03 0.04 0.03 0.26% Seedlings and Fertilizer mixed 0.19 1.54%
Total Harvesting 12.07 100.00%

UKPAS2050: A Carbon Footprint of Four Canadian Wood Products Delivered to the UK
Final Report
13
Table 11 Major greenhouse gas emissions by source in the management and harvesting of Canadian wood fiber in the production of softwood plywood – kg CO2e/m3 plywood Emission Source Fossil
CO2 (kg)
Biogenic CO2 (kg)
CH4 (kg)
N20 (kg)
Other GHGs (kg)
Gasoline 0.00 0.00 0.00 3.38E-09 9.87E-13 Diesel 11.46 0.01 0.01 8.88E-06 2.06E-06 Liquefied petroleum gas 0.00 0.00 0.00 8.97E-08 9.73E-12 Electricity, British Columbia 0.00 0.00 0.00 1.17E-10 1.92E-12 Hydraulic Fluid and Lubricants 0.03 0.00 0.00 2.35E-08 3.36E-10 Seedlings and Fertilizer 0.17 0.00 0.00 4.08E-06 5.37E-09
Total Harvesting 11.66 0.01 0.02 1.31E-05 2.07E-06 Notes: other GHGs (greenhouse gases) are all other identified sources as per IPCC (Appendix A) Biogenic CO2 not included in total 4.2.2 Manufacturing
The softwood plywood manufacturing system includes the following unit processes:
• Log Processing: The log emerges from the debarker after having been stripped of its bark.
• Log Conditioning: The logs are conditioned using steam or hot water to improve peel quality.
• Lathing: At the lathe, a sharp blade peels the log, now called a block, into a continuous sheet of veneer (peeling and clipping) and is sorted by moisture content (which is a function of the percentage of sapwood and heartwood in the sheet) in preparation for drying.
• Veneer Drying: Green veneer is dried in steam or gas heated ovens. Veneers are dried in “continuous dryers” to 3-8% moisture content; this center includes re-drying, a practice where 10-20% of the veneer processed through the dryer is still too wet, so it is re-dried.
• Veneer Coating: Veneers are coated with phenol-formaldehyde (PF) resin and composed into panels for hot pressing (lay-up).
• Curing: Heat and pressure are used to cure the resin, thereby bonding the veneers together to make plywood (pressing).
• Finishing line: After pressing, the plywood panels are trimmed, squared (trimming and sawing) and selected for grade.
In addition, various input consumables (lubricating and hydraulic fluids, greases, PF resin and packaging materials) are also included in the LCI profile underlying this carbon footprint profile. Tables 12 and 13

UKPAS2050: A Carbon Footprint of Four Canadian Wood Products Delivered to the UK
Final Report
14
report the various emission sources and associated greenhouse emissions in the manufacture of softwood plywood, respectively.
Table 12 Emission source flows in the manufacture of Canadian softwood plywood – kg CO2e/m3 plywood Emission Source Unit Usage
per 1 m3 Plywood
GWP (kg
CO2e)
%
Natural gas m3 12.42 30.38 45.19% Gasoline l 0.02 0.05 0.07% Diesel l 0.97 3.12 4.63% Liquefied petroleum gas l 0.22 0.44 0.66% Hogfuel odkg 57.03 0.15 0.23% Electricity, British Columbia kWh 81.28 2.96 4.41% Combination truck, diesel tkm 126.28 11.78 17.53% Hydraulic Fluid and Lubricants l 0.20 0.15 0.22% PF resin kg 7.25 17.71 26.35% Catalyst, extenders, fillers kg 2.38 0.48 0.72%
Total Manufacturing 67.23 100.00%
Table 13 Major greenhouse gas emissions by source in the manufacture of Canadian softwood plywood – kg CO2e/m3 plywood Emission Source Fossil
CO2 (kg)
Biogenic CO2 (kg)
CH4 (kg)
N20 (kg)
Other GHGs (kg)
Natural gas 26.85 0.01 0.12 7.61E-06 4.17E-08 Diesel 0.05 0.00 0.00 1.18E-06 3.45E-10 Liquefied petroleum gas 3.01 0.00 0.00 2.33E-06 5.42E-07 Hogfuel 0.42 0.00 0.00 2.55E-05 2.77E-09 Electricity, British Columbia 0.00 50.04 0.01 1.17E-10 8.60E-05 Combination truck, diesel 2.78 0.00 0.01 2.47E-07 4.04E-09 Hydraulic Fluid and Lubricants 11.34 0.01 0.01 2.60E-04 7.08E-08 Catalyst, extenders, fillers 0.14 0.00 0.00 1.13E-07 1.61E-09 PF Resin 15.76 0.02 0.08 1.48E-05 1.43E-07 Waste Collection and Landfill 0.22 0.00 0.00 8.20E-04 6.07E-09
Total Manufacturing 60.58 50.08 0.23 1.13E-03 8.68E-05 Notes: other GHGs (greenhouse gases) are all other identified sources as per IPCC (Appendix A) Biogenic CO2 not included in total

UKPAS2050: A Carbon Footprint of Four Canadian Wood Products Delivered to the UK
Final Report
15
4.2.3 Distribution
Transportation of wood products from Canada to the UK was previously examined in FPInnovations Woodmiles study [12]. This study determined that wood products are transported 80 km by truck from the mill to port, and 16,447 kms by boat through the Panama Canal. Tables 14 and 15 report the distribution emission sources and associated greenhouse emissions in the manufacture of softwood plywood, respectively. Table 14 Emission source flows in the transport of Canadian of softwood plywood to the UK– kg CO2e/m3 plywood Emission Source Unit Usage per
1 m3 Plywood
GWP (kg
CO2e)
%
Combination truck, diesel tkm 37.17 3.47 2.40% Ocean freighter, average fuel tkm 7641.74 140.99 97.60%
Total Distribution 144.46 100.00% Table 15 Major greenhouse gas emissions by source in the transport of Canadian softwood plywood to the UK – kg CO2e/m3 plywood Emission Source Fossil
CO2 (kg)
Biogenic CO2 (kg)
CH4 (kg)
N20 (kg)
Other GHGs (kg)
Combination truck, diesel 3.34 0.00 0.00 7.65E-05 2.08E-08 Ocean freighter, average fuel 135.75 0.09 0.16 2.77E-03 8.37E-07
Total Distribution 139.09 0.09 0.17 2.85E-03 8.58E-07 Notes: other GHGs (greenhouse gases) are all other identified sources as per IPCC (Appendix A) Biogenic CO2 not included in total 4.2.4 Business to Business Carbon Footprint Summary
Table 16 summarizes the B2B carbon footprint for softwood plywood delivered to the UK. Almost two-thirds of the resulting carbon footprint is ascribed to the transport of the plywood to the UK.

UKPAS2050: A Carbon Footprint of Four Canadian Wood Products Delivered to the UK
Final Report
16
Table 16 Canadian softwood plywood Business-to-Business Carbon Foot Print Summary – kg CO2e/m3 plywood Life Cycle Stage
Fossil CO2 (kg)
Biogenic CO2 (kg)
CH4 (kg)
N20 (kg)
Other GHGs (kg)
Total GWP
(kg CO2e)
%
Harvesting 11.66 0.01 0.02 1.31E-05 2.07E-06 12.07 5.39%
Manufacturing 60.58 50.08 0.23 1.13E-03 8.68E-05 67.23 30.05%
Distribution 139.09 0.09 0.17 2.85E-03 8.58E-07 144.46 64.56%
Total 211.34 50.19 0.41 3.99E-03 8.97E-05 223.76 100.00%
Notes: other GHGs (greenhouse gases) are all other identified sources as per IPCC (Appendix A) Biogenic CO2 not included in total 4.3 British Columbian Western Red Cedar Lumber
Cedar logs are harvested from forests located in the Pacific Northwest of the United States and from coastal British Columbia. Cedar products are often used untreated for both exterior and indoor applications as western red cedar is naturally resistant to decay and insect damage. Cedar decking is produced at both large scale sawmills, called integrated mills, that convert logs into various sizes of lumber and siding and smaller scale remanufacturers who produce both siding and decking from lumber purchased from the integrated mills.
Primary manufacturing data were collected from surveys completed by two western red cedar lumber mills located in B.C. for the 2007 calendar production year.
4.3.1 Resource Harvesting
The same harvesting and forest management LCI data used in the preparation of the softwood lumber carbon footprint are also drawn on to calculate the carbon footprint for softwood plywood (see Section 4.1.1). Note as per PAS2050, fiber transportation is reported under the manufacturing activity stage for the purposes of this carbon footprint.
Table 17 presents the fuel and consumables use in the production of cubic meter of log as well as on a cubic meter of cedar lumber basis inclusive of conversion efficiency and applied mass allocation conventions. Table 18 then shows the related greenhouse gas emissions associated with the fuel and consumables; again on a cubic meter of log and cedar lumber basis.

UKPAS2050: A Carbon Footprint of Four Canadian Wood Products Delivered to the UK
Final Report
17
Table 17 Emission source flows in the management and harvesting of Canadian wood fiber in the production of Western Red Cedar lumber – kg CO2e/m3 lumber Emission Source Unit Usage
per 1 m3 Logs
Usage Per 1m3 Lumber
GWP (kg
CO2e)
%
Gasoline l 4.11E-05 7.68E-05 0.00 0.00% Diesel l 2.84 5.31 16.99 98.18% Liquefied petroleum gas l 0.00 0.00 0.00 0.01% Electricity, British Columbia kWh 0.03 0.06 0.00 0.01% Hydraulic Fluid and Lubricants l 0.03 0.06 0.04 0.26% Seedlings and Fertilzer mixed 0.27 1.54%
Total Harvesting 17.31 100.00%
Table 18 Major greenhouse gas emissions by source in the management and harvesting of Canadian wood fiber in the production of Western Red Cedar lumber – kg CO2e/m3 lumber Emission Source Fossil
CO2 (kg)
Biogenic CO2 (kg)
CH4 (kg)
N20 (kg)
Other GHGs (kg)
Gasoline 0.00 0.00 0.00 4.85E-09 1.42E-12 Diesel 16.43 0.01 0.02 1.27E-05 2.95E-06 Liquefied petroleum gas 0.00 0.00 0.00 1.29E-07 1.40E-11 Electricity, British Columbia 0.00 0.00 0.00 1.68E-10 2.75E-12 Hydraulic Fluid and Lubricants 0.04 0.00 0.00 3.37E-08 4.82E-10 Seedlings and Fertilizer 0.25 0.00 0.00 5.86E-06 7.70E-09
Total Harvesting 16.72 0.02 0.02 1.88E-05 2.96E-06 Notes: other GHGs (greenhouse gases) are all other identified sources as per IPCC (Appendix A) Biogenic CO2 not included in total
4.3.2 Manufacturing
The western red cedar lumber manufacturing system includes the following unit processes:
• Sawing: Sawing encompasses all log handling from reception at mill gate to the breakdown of the logs into rough green lumber.
• Kiln drying: Drying encompasses the kilns, loading area, and unloading/cooling (storage) and air drying areas. Kiln drying utilizes internally generated hogfuel for heat. Note that the majority of WRC lumber is not dried prior to sale as it most often is used as decking lumber or is remanufactured and dried by the distributor.
UKPAS2050: A Carbon Footprint of Four Canadian Wood Products Delivered to the UK
Final Report
18
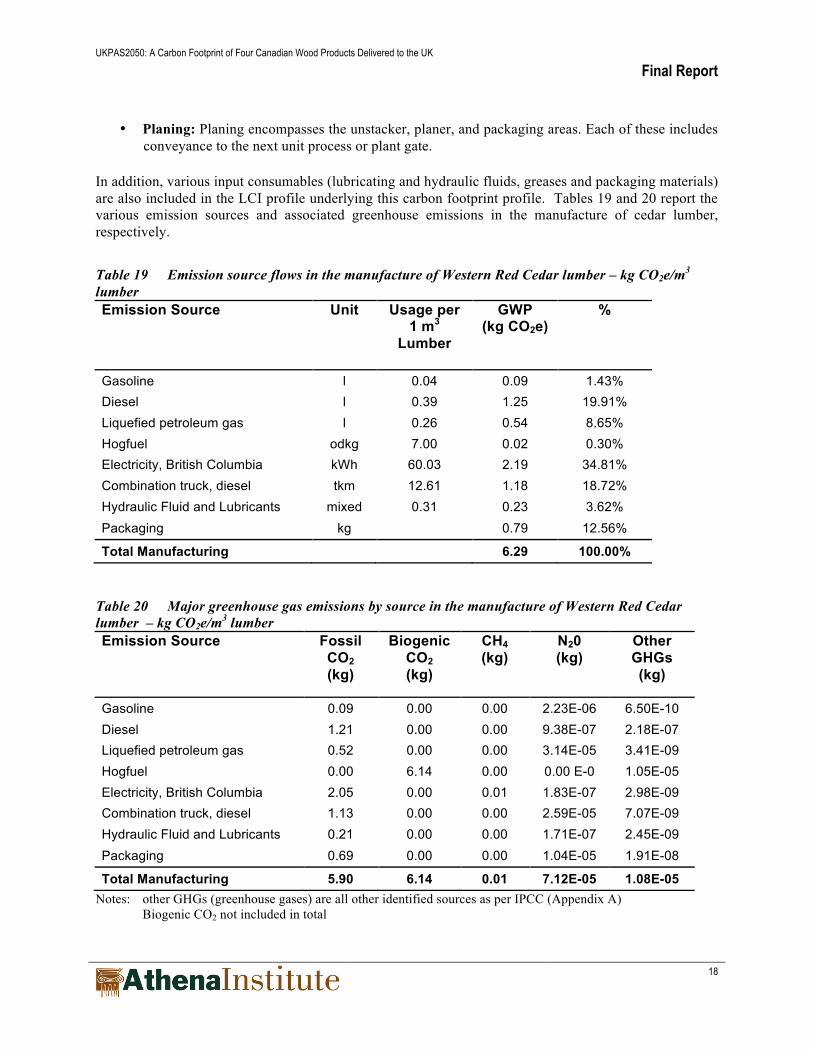
• Planing: Planing encompasses the unstacker, planer, and packaging areas. Each of these includes conveyance to the next unit process or plant gate.
In addition, various input consumables (lubricating and hydraulic fluids, greases and packaging materials) are also included in the LCI profile underlying this carbon footprint profile. Tables 19 and 20 report the various emission sources and associated greenhouse emissions in the manufacture of cedar lumber, respectively.
Table 19 Emission source flows in the manufacture of Western Red Cedar lumber – kg CO2e/m3 lumber Emission Source Unit Usage per
1 m3 Lumber
GWP (kg CO2e)
%
Gasoline l 0.04 0.09 1.43% Diesel l 0.39 1.25 19.91% Liquefied petroleum gas l 0.26 0.54 8.65% Hogfuel odkg 7.00 0.02 0.30% Electricity, British Columbia kWh 60.03 2.19 34.81% Combination truck, diesel tkm 12.61 1.18 18.72% Hydraulic Fluid and Lubricants mixed 0.31 0.23 3.62% Packaging kg 0.79 12.56%
Total Manufacturing 6.29 100.00% Table 20 Major greenhouse gas emissions by source in the manufacture of Western Red Cedar lumber – kg CO2e/m3 lumber Emission Source Fossil
CO2 (kg)
Biogenic CO2 (kg)
CH4 (kg)
N20 (kg)
Other GHGs (kg)
Gasoline 0.09 0.00 0.00 2.23E-06 6.50E-10 Diesel 1.21 0.00 0.00 9.38E-07 2.18E-07 Liquefied petroleum gas 0.52 0.00 0.00 3.14E-05 3.41E-09 Hogfuel 0.00 6.14 0.00 0.00 E-0 1.05E-05 Electricity, British Columbia 2.05 0.00 0.01 1.83E-07 2.98E-09 Combination truck, diesel 1.13 0.00 0.00 2.59E-05 7.07E-09 Hydraulic Fluid and Lubricants 0.21 0.00 0.00 1.71E-07 2.45E-09 Packaging 0.69 0.00 0.00 1.04E-05 1.91E-08
Total Manufacturing 5.90 6.14 0.01 7.12E-05 1.08E-05 Notes: other GHGs (greenhouse gases) are all other identified sources as per IPCC (Appendix A) Biogenic CO2 not included in total

UKPAS2050: A Carbon Footprint of Four Canadian Wood Products Delivered to the UK
Final Report
19
4.3.3 Distribution
Transportation of wood products from Canada to the UK was previously examined in the FPInnovations’s Woodmiles study [12]. This study determined that wood products are transported 80 km by truck from the mill to port, and 16,447 kms by boat through the Panama Canal. Tables 21 and 22 report the distribution emission sources and associated greenhouse emissions in the manufacture of cedar lumber, respectively. Table 21 Emission source flows in the transport of Western Red Cedar Lumber to the UK– kg CO2e/m3 lumber Emission Source Unit Usage per
1 m3 Lumber
GWP (kg CO2e)
%
Combination truck, diesel tkm 29.78 2.78 2.40% Ocean freighter, average fuel tkm 6122.03 112.95 97.60%
Total Distribution 115.73 100.00% Table 22 Major greenhouse gas emissions by source in the transport of Western Red Cedar lumber to the UK – kg CO2e/m3 lumber Emission Source Fossil
CO2 (kg)
Biogenic CO2 (kg)
CH4 (kg)
N20 (kg)
Other GHGs (kg)
Combination truck, diesel 2.67 0.00 0.00 6.13E-05 1.67E-08 Ocean freighter, average fuel 108.76 0.07 0.13 2.22E-03 6.71E-07
Total Distribution 111.43 0.07 0.13 2.28E-03 6.88E-07 Notes: other GHGs (greenhouse gases) are all other identified sources as per IPCC (Appendix A) Biogenic CO2 not included in total 4.3.4 Business to Business Carbon Footprint Summary
Table 23 summarizes the B2B carbon footprint for BC Western Red Cedar lumber delivered to the UK. More than 80% of the resulting carbon footprint is ascribed to the transport of cedar lumber to the UK. It should be noted that due to the fact that almost all WRC lumber is sold without being kiln-dried prior to transport and with BC’s electricity grid primarily derived from renewable hydro, the actual manufacturing related greenhouse gases are particularly small relative to resource harvesting and transportation activites.

UKPAS2050: A Carbon Footprint of Four Canadian Wood Products Delivered to the UK
Final Report
20
Table 23 Western Red Cedar lumber Business-to-Business Carbon Foot Print Summary – kg CO2e/m3 lumber Life Cycle Stage
Fossil CO2 (kg)
Biogenic CO2 (kg)
CH4 (kg)
N20 (kg)
Other GHGs (kg)
Total GWP
(kg CO2e)
%
Harvesting 16.72 0.02 0.02 1.88E-05 2.96E-06 17.31 12.42%
Manufacturing 5.90 6.14 0.01 7.12E-05 1.08E-05 6.29 4.51%
Distribution 111.43 0.07 0.13 2.28E-03 6.88E-07 115.73 83.07%
Total 134.06 6.23 0.17 2.37E-03 1.44E-05 139.32 100.00%
Notes: other GHGs (greenhouse gases) are all other identified sources as per IPCC (Appendix A) Biogenic CO2 not included in total 4.4 British Columbian Western Red Cedar Siding
The western red cedar siding carbon footprint was developed by integrating the harvesting and manufacturing data for western red cedar lumber with the additional siding milling that occurs to manufacture this product. Cedar siding is manufactured at both integrated mills and at remanufacturing mills that purchase rough green lumber from other facilities. The majority (90+%) of WRC remanufacturing occurs in a 100 km radius of the cities of Vancouver, B.C., Seattle, Washington, and Portland, Oregon. It should be noted that relative to WRC lumber, siding is typically kiln-dried using biomass as the primary fuel source. In addition, the siding product study does not have paint applied at the manufacturing facility – this would typically be done by a third-party distributor or as an on-site construction activity. 4.4.1 Resource Harvesting
The same harvesting and forest management LCI data source used to calculate the BC WRC lumber carbon footprint is used to construct the BC WRC siding profile. Note as per PAS2050, fiber transportation is reported under the manufacturing activity stage for the purposes of this carbon footprint.
Table 24 presents the fuel and consumables use in the production of cubic meter of log as well as per cubic meter of cedar siding basis inclusive of conversion efficiency and applied mass allocation conventions. Table 25 then shows the related greenhouse gas emissions associated with the fuel and consumables; again on a cubic meter of log and cedar siding basis.

UKPAS2050: A Carbon Footprint of Four Canadian Wood Products Delivered to the UK
Final Report
21
Table 24 Emission source flows in the management and harvesting of Canadian wood fiber in the production of Western Red Cedar siding – kg CO2e/m3 siding Emission Source Unit Usage
per 1 m3 Logs
Usage Per 1m3 Siding
GWP (kg CO2e)
%
Gasoline l 4.11E-05 7.68E-05 1.96E-04 0.00% Diesel l 2.84 5.31 16.99 98.18% Liquefied petroleum gas l 0.00 0.00 0.00 0.01% Electricity, British Columbia kWh 0.03 0.06 0.00 0.01% Hydraulic Fluid and Lubricants l 0.03 0.06 0.04 0.26% Seedlings and Fertilizer mixed 0.27 1.54%
Total Harvesting 17.31 100.00% Table 25 Major greenhouse gas emissions by source in the management and harvesting of Canadian wood fiber in the production of Western Red Cedar siding – kg CO2e/m3 siding Emission Source Fossil
CO2 (kg)
Biogenic CO2 (kg)
CH4 (kg)
N20 (kg)
Other GHGs (kg)
Gasoline 0.00 0.00 0.00 4.85E-09 1.42E-12 Diesel 16.43 0.01 0.02 1.27E-05 2.95E-06 Liquefied petroleum gas 0.00 0.00 0.00 1.29E-07 1.40E-11 Electricity, British Columbia 0.00 0.00 0.00 1.68E-10 2.75E-12 Hydraulic Fluid and Lubricants 0.04 0.00 0.00 3.37E-08 4.82E-10 Seedlings and Fertilizer 0.25 0.00 0.00 5.86E-06 7.70E-09
Total Harvesting 16.72 0.02 0.02 1.88E-05 2.96E-06 Notes: other GHGs (greenhouse gases) are all other identified sources as per IPCC (Appendix A) Biogenic CO2 not included in total 4.4.2 Manufacturing
Cedar siding undergoes the same rough lumber manufacturing processes described under cedar decking and then leaves the mill gate as a kiln-dried surfaced building material. Kiln-drying is the most energy intensive process in manufacturing cedar siding and therefore, compared to cedar decking, cedar siding is a more energy intensive building material.
• Sawing: Sawing encompasses all log handling from reception at mill gate to the breakdown of the logs into rough green lumber.
• Kiln drying: Drying encompasses the kilns, loading area, and unloading/cooling (storage) and air drying areas. Kiln drying utilizes internally generated hogfuel for heat.
• Siding Milling: Secondary milling rips the boards in half and moulds the edges to create the siding profile.

UKPAS2050: A Carbon Footprint of Four Canadian Wood Products Delivered to the UK
Final Report
22
In addition, various input consumables (lubricating and hydraulic fluids, greases and packaging materials) are also included in the LCI profile underlying this carbon footprint profile. Tables 26 and 27 report the various emission sources and associated greenhouse emissions in the manufacture of cedar siding, respectively.
Table 26 Emission source flows in the manufacture of Western Red Cedar siding – kg CO2e/m3 siding Emission Source Unit Usage per
1 m3 Siding
GWP (kg CO2e)
%
Natural Gas m3 9.05 22.14 41.13% Gasoline l 0.17 0.44 0.81% Diesel l 2.17 6.94 12.89% Liquefied petroleum gas l 1.46 3.00 5.58% Hogfuel odkg 29.00 0.08 0.14% Electricity, British Columbia kWh 285.73 10.41 19.35% Combination truck, diesel tkm 55.73 5.20 9.66% Hydraulic Fluid and Lubricants l 1.53 1.12 2.08% Packaging mixed 4.49 8.34%
Total Manufacturing 53.82 100.00% Table 27 Major greenhouse gas emissions by source in the manufacture of Western Red Cedar siding – kg CO2e/m3 siding Emission Source Fossil
CO2 (kg)
Biogenic CO2 (kg)
CH4 (kg)
N20 (kg)
Other GHGs (kg)
Natural Gas 19.57 0.01 0.09 5.54E-06 3.04E-08 Gasoline 0.41 0.00 0.00 1.08E-05 3.15E-09 Diesel 6.71 0.00 0.01 5.20E-06 1.21E-06 Liquefied petroleum gas 2.86 0.00 0.00 1.73E-04 1.88E-08 Hogfuel 0.00 25.45 0.00 0.00E+00 4.37E-05 Electricity, British Columbia 9.77 0.00 0.03 8.69E-07 1.42E-08 Combination truck, diesel 5.01 0.00 0.01 1.15E-04 3.13E-08 Hydraulic Fluid and Lubricants 1.06 0.00 0.00 8.45E-07 1.21E-08 Packaging 3.86 0.01 0.02 1.13E-04 1.51E-07
Total Manufacturing 49.23 25.48 0.16 4.24E-04 4.52E-05 Notes: other GHGs (greenhouse gases) are all other identified sources as per IPCC (Appendix A) Biogenic CO2 not included in total
UKPAS2050: A Carbon Footprint of Four Canadian Wood Products Delivered to the UK
Final Report
23
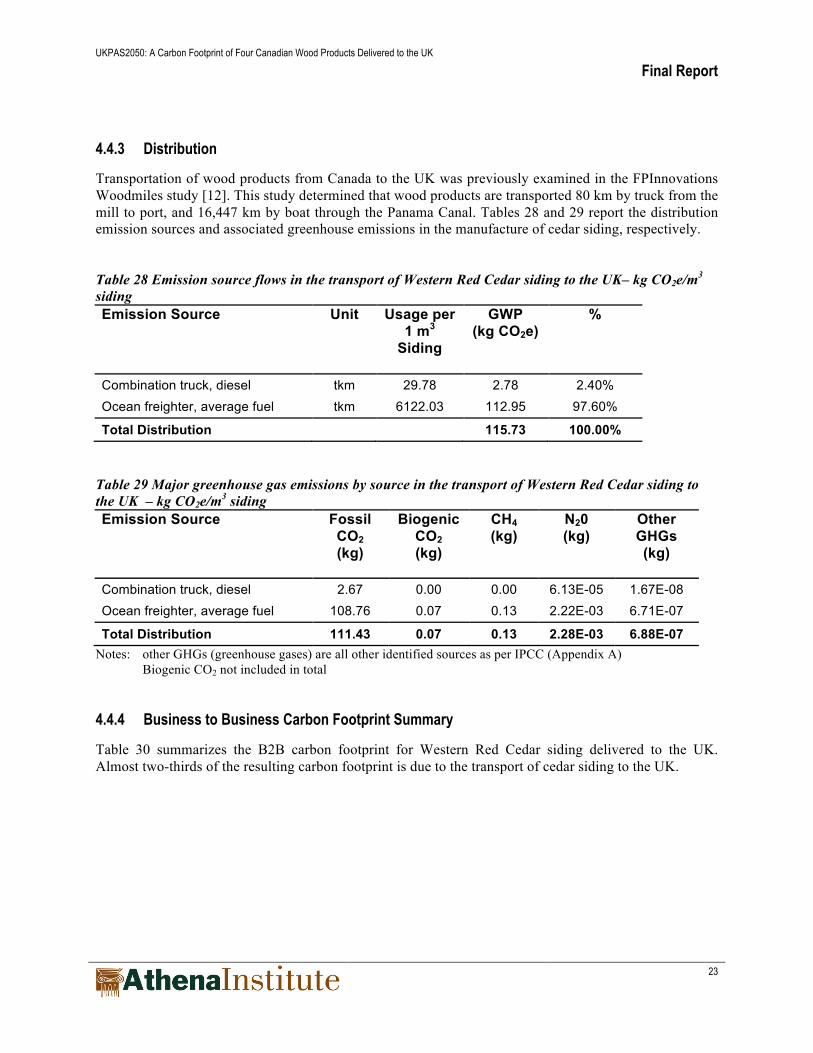
4.4.3 Distribution
Transportation of wood products from Canada to the UK was previously examined in the FPInnovations Woodmiles study [12]. This study determined that wood products are transported 80 km by truck from the mill to port, and 16,447 km by boat through the Panama Canal. Tables 28 and 29 report the distribution emission sources and associated greenhouse emissions in the manufacture of cedar siding, respectively. Table 28 Emission source flows in the transport of Western Red Cedar siding to the UK– kg CO2e/m3 siding Emission Source Unit Usage per
1 m3 Siding
GWP (kg CO2e)
%
Combination truck, diesel tkm 29.78 2.78 2.40% Ocean freighter, average fuel tkm 6122.03 112.95 97.60%
Total Distribution 115.73 100.00% Table 29 Major greenhouse gas emissions by source in the transport of Western Red Cedar siding to the UK – kg CO2e/m3 siding Emission Source Fossil
CO2 (kg)
Biogenic CO2 (kg)
CH4 (kg)
N20 (kg)
Other GHGs (kg)
Combination truck, diesel 2.67 0.00 0.00 6.13E-05 1.67E-08 Ocean freighter, average fuel 108.76 0.07 0.13 2.22E-03 6.71E-07
Total Distribution 111.43 0.07 0.13 2.28E-03 6.88E-07 Notes: other GHGs (greenhouse gases) are all other identified sources as per IPCC (Appendix A) Biogenic CO2 not included in total 4.4.4 Business to Business Carbon Footprint Summary
Table 30 summarizes the B2B carbon footprint for Western Red Cedar siding delivered to the UK. Almost two-thirds of the resulting carbon footprint is due to the transport of cedar siding to the UK.

UKPAS2050: A Carbon Footprint of Four Canadian Wood Products Delivered to the UK
Final Report
24
Table 30 Western Red Cedar Siding Business-to-Business Carbon Foot Print Summary – kg CO2e/m3 siding Life Cycle Stage
Fossil CO2 (kg)
Biogenic CO2 (kg)
CH4 (kg)
N20 (kg)
Other GHGs (kg)
Total GWP
(kg CO2e)
%
Harvesting 16.72 0.02 0.02 1.88E-05 2.96E-06 17.31 9.26%
Manufacturing 49.23 25.48 0.16 4.24E-04 4.52E-05 53.82 28.80%
Distribution 111.43 0.07 0.13 2.28E-03 6.88E-07 115.73 61.94%
Total 177.39 25.57 0.32 2.73E-03 4.88E-05 186.86 100.00%

UKPAS2050: A Carbon Footprint of Four Canadian Wood Products Delivered to the UK
Final Report
25
5 Greenhouse Gas Calculation Spreadsheet A spreadsheet has also been provided that shows the carbon footprint calculation for the four products (filename: PAS 2050 Carbon Footprint Final.xls). Four summary worksheets are included that summarize the B2B carbon footprint analysis. These are "P1 B2B", "P2 B2B", "P3 B2B", and "P4 B2B" - with P1-4 referring the four products softwood lumber, softwood plywood, WRC lumber and WRC siding, respectively. These worksheets build off of four worksheets that breakdown the harvesting effects of the products ("P1-4 Harv"), four worksheets that breakdown the manufacturing effects ("P1-4 Man"), and the worksheet "Trans&Seq" that shows the footprint of the distribution of products from Canada to the UK as well as the potential carbon sequestration effect of the products over their service life in the UK. The harvesting and manufacturing worksheets build on the process data gathered for projects that were previously completed for the North American market and were based on units of measure more typical to this audience. The conversion of the processing data to the appropriate metric equivalents is shown in these worksheets to make the translation of the processing data in these studies transparent.
6 Conclusions The UK’s policy and accompanying regulatory shift towards a low carbon economy holds promise for all wood products. Wood product based construction assemblies are already acknowledged as preferred products from an environmental perspective and biomass energy has gained a preferred carbon neutral status in the UK via PAS 2050. The challenge is to grow the market for wood as a preferred material and capitalize on wood’s low carbon intensity and thus elevate Canadian wood products to a preferred source in the UK. The provision of PAS2050 conforming carbon footprint is a valuable step in the process to objectively position Canadian and BC wood products in the carbon aware UK. As demonstrated in this study, it is of utmost importance to have the positive carbon storage aspect of wood, net of its production and transport, recognized as it enters the UK.

UKPAS2050: A Carbon Footprint of Four Canadian Wood Products Delivered to the UK
Final Report
26
7 References Normative References [1] PAS 2050:2008- Specification for the assessment of the life cycle greenhouse gas emissions of
goods and services. [2] PAS 2050:2008- Guide to PAS 2050 - How to assess the carbon footprint of goods and services. [3] ISO 14040:2006- Environmental management — Life cycle assessment — Principles and
framework. [4] ISO 14044:2006- Environmental management — Life cycle assessment — Requirements and
guidelines. [5] ISO 14021:1999- Environmental labels and declarations — Self-declared environmental claims
(Type II environmental labelling). [6] CarbonTrust 2008- Code of Good Practice for Product Greenhouse Gas Emissions and Reduction
Claims- Guidance to support the robust communication of product carbon footprints, www.carbontrust.co.uk .
[7] DEFRA 2003- Green Claims – Practical Guidance, How to Make a Good Environmental Claim,
www.defra.gov.uk/environment/consumerprod/pdf/genericguide.pdf. Report References and LCA Software: [8] CIPEC 2010- Status of Energy Use in the Canadian Wood Products Sector. FPInnovations,
Forintek Division, Vancouver, B.C for Natural Resources Canada [9] Athena Institute 2009 - A Cradle-to-Gate Life Cycle Assessment of Canadian Softwood Lumber,
Prepared for: FP Innovations, Forintek Division, Vancouver, BC. [10] Athena Institute 2008 - A Cradle-to-Gate Life Cycle Assessment of Canadian Softwood Plywood
Sheathing, Prepared for: FP Innovations, Forintek Division, Vancouver, BC. [11] FPInovations 2009- Life Cycle Assessment of Western Red Cedar Siding, Decking, and
Alternative Products, Prepared for: Western Red Cedar Lumber Association. [12] FPInovations 2010- Wood Miles UK: A Canadian Situational Analysis, Confidential. [13] The PSR 2003:8 - Wood particleboards, The Swedish Environmental Management Council,
Version 1.0, 2003-12-15, http://www.environdec.com/pcr/e_psr0308.pdf. [14] Gerfried Jungmeier, Frank Werner, Anna Jarnehammar, Catharina Hohenthal and Klaus Richter-
Allocation in LCA of Wood-based Products, Part I. Methodology, Experiences of Cost Action E9, Int J LCA 7 (5) 290 – 294 (2002).

UKPAS2050: A Carbon Footprint of Four Canadian Wood Products Delivered to the UK
Final Report
27
[15] Gerfried Jungmeier, Frank Werner, Anna Jarnehammar, Catharina Hohenthal and Klaus Richter- Allocation in LCA of Wood-based Products, Part II. Examples, Experiences of Cost Action E9, Int J LCA 7 (6) 369 – 375 (2002).
[16] Gerfried Jungmeier, Fred McDarby, Anders Evald, Catharina Hohenthal, Ann-Kristin Petersen,
Hannes-Peter Schwaiger and Bernhard Zimmer- Energy Aspects in LCA of Forest Products, Guidelines from Cost Action E9, Int J LCA 8 (2) 99 – 105 (2003).
[17] LCA SimaPro Software Version 7.1.

UKPAS2050: A Carbon Footprint of Four Canadian Wood Products Delivered to the UK
Final Report
28
8 Glossary Based on PAS 2050:2008- Terms and Definition Section [1]. allocation partitioning the input or output flows of a process or a product system between the product system under study and one or more other product systems. biogenic derived from biomass, but not fossilized or from fossil sources. carbon dioxide equivalent (CO2e) unit for comparing the radiative forcing of a GHG to carbon dioxide. carbon sequestration removal of carbon from the atmosphere. carbon storage retaining carbon of biogenic or atmospheric origin in a form other than as an atmospheric gas. emission factor amount of greenhouse gases emitted, expressed as carbon dioxide equivalent and relative to a unit of activity. fossil derived from fossil fuel or another fossil source, including peat. functional unit quantified performance of a product system for use as a reference unit. global warming potential (GWP) factor describing the radiative forcing impact of one mass-based unit of a given greenhouse gas relative to an equivalent unit of carbon dioxide over a given period of time. greenhouse gases (GHGs) gaseous constituents of the atmosphere, both natural and anthropogenic, that absorb and emit radiation at specific wavelengths within the spectrum of infrared radiation emitted by the Earth's surface, the atmosphere, and clouds. life cycle assessment (LCA) compilation and evaluation of inputs, outputs and potential environmental impacts of a product system throughout its life cycle. offsetting mechanism for claiming a reduction in GHG emissions associated with a process or product through the removal of, or preventing the release of, GHG emissions in a process unrelated to the life cycle of the product being assessed.

UKPAS2050: A Carbon Footprint of Four Canadian Wood Products Delivered to the UK
Final Report
29
product category rules (PCRs) set of specific rules, requirements and guidelines for developing Type III environmental declarations for one or more product categories. product system collection of unit processes with elementary and product flows, performing one or more defined functions, that models the life cycle of a product.

UKPAS2050: A Carbon Footprint of Four Canadian Wood Products Delivered to the UK
Final Report
30
Appendix A

UKPAS2050: A Carbon Footprint of Four Canadian Wood Products Delivered to the UK
Final Report
31