a business process driven approach for generating software...
TRANSCRIPT

A Business Process Driven Approach for Generating Software Architecture Xulin Zhao, Ying Zou
Department of Electrical and Computer Engineering Queen’s University,
Kingston, Ontario, Canada {xulin.zhao, ying.zou}@queensu.ca
Abstract—Business processes describe business operations of an organization and capture business requirements. Business applications provide automated support for an organization to achieve business objectives. Software architecture represents the gross structure of a business application and shows the distribution of business requirements among software components. However, mainstream design approaches rely on software architects’ craftsmanship to derive software architectures from business requirements. Such a manual approach is inefficient and often leads to inconsistency between business requirements and business applications. To address this problem, we propose an approach to derive software architecture from business processes. We use clustering analysis to analyze dependencies among data and tasks captured in business processes and distribute functionalities to software components. A case study is conducted to generate software architecture from a collection of business processes specified in an industrial setting. The experiment results demonstrate that our proposed approach can generate meaningful software architecture with high modularity.
Keywords-Business process, Software architecture generation, Clustering algorithms
I. INTRODUCTION A business process specifies a collection of tasks for an
organization to achieve business objectives. Typically, a business process is composed of a set of interrelated tasks which are joined together by data flows and control flow constructs. Data flows describe inputs into tasks and outputs generated from tasks. Data items are abstract representations of information flowed among tasks. Control flows specify valid execution orders of tasks. Control flow constructs specify the order (e.g., sequential, parallel, or alternative) of the execution of tasks. For example, the business process for purchasing a product on-line consists of the following sequence of tasks such as Select product, Add to the shopping cart, and Validate buyer’s credit card. The data item, product, can be generated from the task, Select product. Business applications automate business processes to assist business users performing tasks. In this ever changing business environment, business processes are continuously customized to meet the requirements of an organization. Business applications are also modified to add new functional features without referencing to the business processes. In today’s reality, the key challenge is to maintain the consistency between business requirements and business applications. Industrial reports [30] indicate that over 50% business applications fail to address their business requirements.
Software architecture is widely used to bridge the gap between business requirements and business applications. Software architecture represents the gross structure of a business application using software components, the interactions among software components (i.e., connectors), and the constraints on the components and connectors. More specifically, a component captures a particular functionality. Connectors define control and data transitions among components. Constraints specify how components and connectors are combined and the properties of components and connectors. Mainstream design approaches [27] [28] [29] rely on software architects’ craftsmanship to create components and connectors using their past experience. However, real-world, large scale business applications need to satisfy hundreds of business requirements that contain numerous intrinsic dependencies [17]. Quite often, a manual design approach is inefficient and leads to inconsistency between business requirements and business applications.
To facilitate the alignment of business requirements with business applications, we propose an approach that automatically generates software architecture from business processes. Our generation approach consists of two major steps: 1) derive a functional software architecture from business processes to fulfill functional requirements and 2) apply software architectural styles and design patterns to address quality requirements. In this paper, we present our approach for generating functional software architecture from business processes. More specifically, we aim to 1) generate components that group relevant tasks together to deliver unique functionality; and 2) improve modularity of the architecture design by minimizing the inter-dependencies among components to ease the change and evolution of software components in development and maintenance stages. However, business requirements are embedded in numerous tasks in business processes. The functionality of a task is simply described as task names using short descriptive terms (e.g., Create a customer order). In our work, the challenge lies in identifying major functionalities embedded in business processes and distributing them into software components. Instead of manually understanding the meaning of each task name, we identify the data and control dependencies among tasks by analyzing various entities (e.g., tasks and data items) captured in business processes. We apply clustering algorithms [18] to automatically group functionally similar tasks and distribute functionalities to components. We also provide a technique to identify interactions among components by analyzing the transitions among tasks distributed in different components.
The rest of this paper is organized as follows. Section II

Figure 1. Business process driven software architecture generation
gives an overview of clustering algorithms. Section III discusses the overall steps for generating software architectures. Section IV presents the techniques for identifying software components and their interactions from business processes. Section V evaluates our proposed approach through a case study. Section VI reviews the related work. Finally, Section VII concludes this paper and proposes the future work.
II. OVERVIEW OF CLUSTERING ALGORITHMS Clustering algorithms group entities with strong
dependencies to form clusters. Similarity measures evaluate the strength of dependencies between entities by assessing the number of common features or connections between entities. For example, the Ellenberg measure [6] evaluates the degree of similarity between components by calculating the percentage of common features shared by components, such as data members, previous components, and subsequent components.
⎪⎪⎩
⎪⎪⎨
⎧
=
>−
−=∑∑==
1
12/)1(
1
1,,
1
kA
kkk
E
k
AMQ
k
jiji
k
ii (1)
⎪⎩
⎪⎨⎧
≠
=== ji
NN
jiE
NA
ji
jijii
ii
2
0,,2
εμ
Partitional algorithms [1] and hierarchical algorithms
[2][3][4][5][7] are two commonly used clustering algorithms to cluster entities using similarity measures. More specifically, partitional algorithms define heuristics to optimize a set of initial clusters which can be a set of randomly grouped entities or the result of other clustering algorithms. For example, Mancoridis et al. [8] generate initial clusters by randomly grouping a set of entities, and then apply hill climbing algorithms and genetic algorithms to optimize the initial clusters using the modularization quality (MQ) metric. The MQ metric measures the cohesion and coupling of software components by evaluating inter-connectivity among components and intra-connectivity within components. The definition of MQ is shown in
formula (1). In general, the value of the MQ metric is bounded between -1 and 1. -1 means that a software system has no cohesion and 1 indicates that the software system has no coupling. Neither of the extreme values can be achieved in practical software systems. The exact range of a MQ value is determined by the intrinsic dependencies within the requirements of a software system. If requirements have strong dependencies to each other, the MQ value tends to close to -1. If requirements can be divided into multiple independent groups, the MQ value tends to close to 1.
Agglomerative algorithms and divisive algorithms are hierarchical algorithms which form a hierarchy of clusters. Agglomerative algorithms are bottom-up approaches that generate clusters by grouping entities in the lowest level of the granularity and moving up to coarser grained entities in a stepwise fashion. Divisive algorithms are top-down approaches that produce clusters by gradually dividing the coarsest grained entities into more fine grained entities. Using an agglomerative algorithm, the most similar pair of entities is selected to form a new cluster. When more than two entities have the same similarity, the algorithm makes arbitrary decisions by randomly merging two entities. However, arbitrary decisions are harmful to clustering quality and should be avoided in the clustering process [13]. The weighted combined algorithm (WCA) [6] is used to reduce arbitrary decisions and information loss. A study [31] shows that clustering results of WCA are more consistent with expert decompositions than other hierarchical algorithms. Therefore, we choose to use WCA to produce software architectures in conformance with those designed by software architects.
III. AN APPROACH FOR GENERATING SOFTWARE ARCHITECTURE FROM BUSINESS PROCESSES
Fig. 1 gives the overview of our approach that generates software architectures from business processes. The generation process consists of three major steps: 1) business process analysis which analyzes business processes to extract the entities relevant to tasks and their dependencies; 2) system decomposition which breaks the gross functional requirements in business processes into a collection of more specific functionalities implemented by software components; and 3) architecture representation which represents the generated architecture in a format to be understood by software architects for further improvement.

Figure 2. The meta-model for business processes
A. Business Process Analysis Business processes are generally represented using
graphical notations in a business process modeling tool, such as IBM WebSphere Business Modeler (WBM) [14]. A business process can also be stored as documents in an XML format. Business process modeling (BPM) languages, such as integrated definition methods (IDEF) [10], business process modeling notation (BPMN) [11] and business process execution language (BPEL) [12], define standard notations to represent entities in business processes. To provide a generic solution to handle business processes described in different languages, we create a meta-model to capture commonality among these BPM languages as shown in Fig. 2. Fig. 3 illustrates an example business process for purchasing books. In a business process, a task can be performed by a particular role, such as a customer or a bank teller (shown in Fig. 3). A sub-process is a group of tasks that can be reused in different business processes. A data item contains information required for performing a task and captures the output from the task. For example shown in Fig. 3, the data item, book_info, represents the structure for describing the book information and the data item, book, specifies the format for representing the searching result. Tasks in a sequence are executed one after another. Loops define a set of tasks to be repeated multiple times. Alternative allows one execution path to be selected among multiple alterative execution paths. Parallels describe multiple execution paths to be executed simultaneously. We develop a parser to extract information from business process specifications in XML format.
B. System Decomposition In general, business requirements can be decomposed
into different software components in three ways [24][25]: functional decomposition, data oriented decomposition, and object oriented design. More specifically, functional
decomposition recursively refines high-level functional requirements into a collection of more concrete functional requirements. Eventually, each software component implements one concrete functional requirement. Data oriented decomposition first defines a set of essential data structures from the requirements. Each software component is intended to implement one data structure. Object oriented design combines both approaches by forming packages that are composed of data structures and their associated functions. Each package corresponds to one software component.
In a business process specification, functionalities are reflected in tasks and data structures are also well-specified in the data items flowing between tasks. To fully use the information available in the business processes, we use the object oriented design approach to create software components. The data items and tasks specified in business processes represent the lowest level details. One type of data items can be used to form other types of data items. However, it is infeasible to directly map a task or its related data items into a software component. This results in a large amount of fine grained components and makes the architecture difficult to understand. Therefore, our work focuses on clustering data items to form independent data structures. Each data structure is composed of multiple closely related data items in business processes. Furthermore, we group tasks to describe operations on the identified data structures which collect the input or output data items of tasks.
C. Architecture Representation A major purpose for designing software architecture is to
support the communication and collaboration among different stakeholders such as end-users, software developers, and system engineers [40]. To achieve this purpose, software architectures should be represented in a way that is easy for different stakeholders to understand and use. In our work, we represent the generated software architectures using 4+1 view model supported by UML (Unified Modeling Language) and IEEE 1471 (IEEE Recommended Practice for Architectural Description of Software-Intensive Systems) [41]. More specifically, the 4+1 view model consists of five interrelated software architecture views: logical view, process view, development view, physical view, and scenario.
• A logical view describes the distribution of business requirements among components.
Figure 3. The p1:Purchase book business process

• A process view captures the dynamic behaviors of a business application.
• A development view presents the static structure of a business application.
• A physical view defines mappings between components and hardware.
• Scenarios describe how business requirements are fulfilled using components of a business application
Each of the views can be described by different UML diagrams. For example, we use UML component diagrams to represent logical views and UML deployment diagrams to depict physical view. In the following section, we show our techniques for generating and representing the logical view from business processes. Other views can be produced from the logical view using model transformations [43][44].
IV. SYSTEM DECOMPOSITION In this section, we discuss our approach that first
identifies data groups that can form initial software components and then assigns related tasks which use the data items in data groups to components in order to enhance the modularity of the generated components.
A. Grouping data items To improve the cohesion within a software component,
we strive for identifying a group of strongly inter-dependent data items to form a data group used in a component. To analyze the dependencies among data items, we create a data dependency graph to analyze data flows within business processes. Essentially, a data dependency graph contains a set of nodes and connectors. A node denotes a data item in a business process. A connector represents a transition from an input data item to a task to an output data item from the task. For example shown in Fig. 3, the data item, d2:book_info is the input data item of the task, t3: Find book; and the data item, d3:book, is the output from the task. Therefore, a connector is created between data items, d2 and d3. Fig. 4 illustrates the data dependency graph generated from the example business process.
We conduct clustering analysis on the data items in a data dependency graph. In particular, we choose WCA clustering algorithm to reduce arbitrary decisions. As a result, the WCA algorithm produces a number of data groups at different levels of granularity. To select an optimal grouping result, we use the MQ metric to evaluate the quality of data groups. We aim to achieve high cohesion within a data group and low coupling among data groups. The MQ metric only concerns direct dependencies among components. Therefore, we analyze dependencies among data items and their adjacent data items and do not consider transitivity of dependencies.
Figure 4. The data dependency graph for p1:Purchase book
DataDependency=<PreviousDataItem, SubsequentDataItem, ContainingBusinessProcess>; PreviousDataItem =<d1, d2, …, dm>; SubsequentDataItem =<d1, d2, …, dm>; ContainingBusinessProcess =<p1, p2, …, pv>; Subscripts m and v are the number of data items and business processes respectively.
Figure 5. The format of data dependency vectors
TABLE I. THE DATA DEPENDENCY TABLE
PreviousDataItem SubsequentDataItemContaining Business Process
Dataitem
d1 d2 d3 d4 d1 d2 d3 d4 p1
d1 0 0 0 0 0 0 0 1 1 d2 0 0 0 0 0 0 1 0 1 d3 0 1 0 0 0 0 0 1 1 d4 1 0 1 1 0 0 0 1 1
To group data items, we examine three features of data
items for describing dependencies of a data item: previous data items, subsequent data items, and the containing business processes. These features are organized as a dependency vector (i.e., DataDepenency shown in Fig. 5), which consists of three data components: PreviousDataItem, SubsequentDataItem, and ContainingBusinessProcess. Furthermore, each data component in a dependency vector is also defined as a vector. More specifically, PreviousDataItem for a current data item is represented as PreviousDataItem =<d1, d2, …, di, …, dm>, where di represents to one data item defined in a business process, and m is the total number of data items defined in the business processes. di is set to 1 when di is the incoming data items of the current data item. Otherwise, di is set to 0. Similarly, the SubsequentDataItem vector marks the data items that appear as the outgoing data items of the current data item as 1. The ContainingBusinessProcess vector, i.e., <p1, p2, …, pi,…, pv>, represents a collection of business processes that need to be implemented in a business application. v is the total number of business processes. pi refers to a business process. It is set to 1 when pi uses the current data item; otherwise, pi is set to 0. For example, Table I illustrates the values of the vectors for the data dependency graph shown in Fig. 4. Each row in the table represents a dependency vector of a data item. For example shown in Fig. 4, the data item, d1: customer_profile, has no previous data item, one subsequent item, d4: order, and one containing business process, p1: Purchase book. Therefore, we set d4 in the SubsequentDataItem vector and p1 in the ContainingBusinessProcess vector of d1 to 1 illustrated in Table I.
Using the data dependency vectors, we evaluate the similarities among any pairs of data items using the Ellenberg measure, which evaluates the percentage of common features (i.e., previous data items, subsequent data items, or containing business processes) shared by two data

items. The definition of the Ellenberg measure is shown in formula (2) [6]. We demonstrate the calculation of the similarity between data items, d3 and d4, in Fig. 7. Data items, d3 and d4, are described by two data dependency vectors whose values are listed in Table I. The similarities among any pair of data items in the example business process shown in Fig. 3 are listed in Table II. The more common features the two data items present, the more similar they are.
cbMME
a
a
++=
2/2/ (2)
21
21
nnfff ii
i ++
= (3)
Using the similarities of any pairs of data items, we
iteratively cluster data items in the five steps listed in Fig. 6.
1) Initialize a data item as a data group; 2) Merge the two data groups that have the highest
similarity value to form a new data group. For example,we choose d1 and d3 to create the data group,DataGroup <1>, shown in Fig. 9 (a);
3) Calculate features of the newly formed data group usingformula (3) [6]. For example, we calculate features ofthe merged data group, DataGroup <1>, using the data dependency vectors of data items, d1 and d3, illustratedin Fig. 8. For a given feature in the merged data group,DataGroup<1>, we calculate the sum of thecorresponding feature values in the data items, d1 and d3. For example, the second features of d1 and d3 are 0 and 1, respectively. Therefore, the sum of the secondfeature is 0+1=1. We also normalize feature values withthe total number of data items in the newly formed datagroup. The merged data group, DataGroup <1>contains two data items (i.e., d1 and d3). Hence, wedivide the second feature value of DataGroup<1> by 2 and use ½ as the normalized feature value in the data dependency vector of DataGroup<1>;
4) Calculate similarities between the newly formed data group and other data groups using formula (1); and
5) Repeat steps 2) to 4) until only one data group is left. Figure 6. The data grouping process
TABLE II. THE DATA SIMILARITY TABLE
Data item d1 d2 d3 d4 d1 - 1/3 2/3 2/5 d2 - - 1/4 1/6 d3 - - - 1/3 d4 - - - -
31
312/42/4
2/2/
=++
=++
=cbM
MEa
a
Figure 7. The process for calculating similarity
=
+×
31
1nn
Figure 8. The process for calculating the feature for DataGroup <1>
Figure 9. The data grouping process for the example business process
Figure 10. The result hierarchy of data groups
Figure 11. The selected data grouping result
TABLE III. MQ VALUES OF THE THREE DATA GROUPING RESULTS
Cutting level Grouping result MQ 1 {book_info}, {order},
{customer_profile}, {book} -0.358
2 {book_info}, {order}, {customer_profile, book}
-0.219
3 {book_info}, {order, customer_profile, book}
-0.172
For example, Fig. 9 shows the three iterations for grouping data items defined in the example business process (shown in Fig. 3). One data group is generated in each iteration. We organize the generated data groups in a hierarchy as shown in Fig. 10. Leaves of the hierarchy are data items in the business process. Internal nodes represent data groups created by each iteration in a bottom-up fashion. The levels in the hierarchy denote the order of the data items being merged in the clustering process. For example, the data group, DataGroup<1> (i.e., {customer_profile, book}) in level 1 is generated in the first iteration. In the clustering algorithm, the most similar data items are grouped first. Therefore, data items merged (or data groups) in a lower level are more similar than those merged in a higher level of the hierarchy. For example shown in Fig. 10, the similarity between customer_profile and book is 0.667 in the data group, DataGroup <1>, while the similarity between order and DataGroup <1> is 0.333 in the data group, DataGroup <2>. A high similarity value indicates a strong dependency. Therefore, data groups in lower levels have stronger intra-dependencies (i.e., high cohesion) while data groups in higher level have looser inter-dependencies (i.e., low coupling). To generate software architectures with high modularity, we use the MQ metric defined in formula (1) to balance cohesion and coupling and choose an optimal data grouping result.
We can get multiple grouping results by cutting the hierarchy of data groups at different levels. Cutting the hierarchy of data groups at a certain level generates a data group that collects all data items appearing in the lower levels. For example, cutting the hierarchy of data groups shown in Fig. 10 at level 2 results in three data groups: {book_info}, {order}, and DataGroup <1>. Furthermore, the data group, DataGroup <1>, contains two data items, customer_profile and book. Therefore, the data grouping result can also be represented as {book_info}, {order}, and {customer_profile, book}. We can obtain three different data grouping results by cutting the hierarchy of data groups in each of the three levels, as listed in Table III.
The MQ metric, uses only the interactions between components to calculate their dependencies, as specified in formula (1). It is not sufficient to assess the cohesion and coupling using multiple quality attributes of components. To compare the modularity of the different data grouping results, we extend the definition of MQ to evaluate cohesion and coupling using data dependency vectors, defined in Fig. 5. We use the intra-dependency of data items within a data group i to evaluate the cohesion of the data group and extend the definition of μi to the sum of similarities between all data items inside the data group. We use the inter-dependency between two data groups i and j to assess their coupling and extend εi,j to the sum of similarities of all data items in the two data groups. The value range of the extended MQ is between -1 and 1. For example, we apply the extended MQ metric to evaluate the modularity of the three data grouping results listed in Table III. Result MQ values are also shown in Table III. Comparing these MQ values, we find that the data grouping result generated from level 3, {book_info}, {order, customer_profile, book}, has the highest MQ value
which indicates the best modularity. As a consequence, we separate data items into two groups as illustrated in Fig. 11.
B. Associating tasks with data groups To identify functionalities for components, we assign
tasks to data groups using the dependencies between data groups and tasks. We classify tasks into two categories: inner tasks and outer tasks.
Inner tasks depend on data items within a data group. More specifically, the data group contains both input data items and output data items of the task. All information required to performing this type of tasks is located in one data group. Therefore, we group inner tasks with their dependent data groups into one component. For example shown in Fig. 11, we can create two components from the data grouping result. One component contains the data item, d2: book_info. The other component contains three data items: d1: customer_profile, d3: book, and d4: order. The task, t4: Create order, takes data items, d1: customer_profile and d3: book, as input and generates data item, d4: order, as output. All these data items belong to the data group, DataGroup <2>. Therefore, we merge the task, t4: Create order, to the latter component.
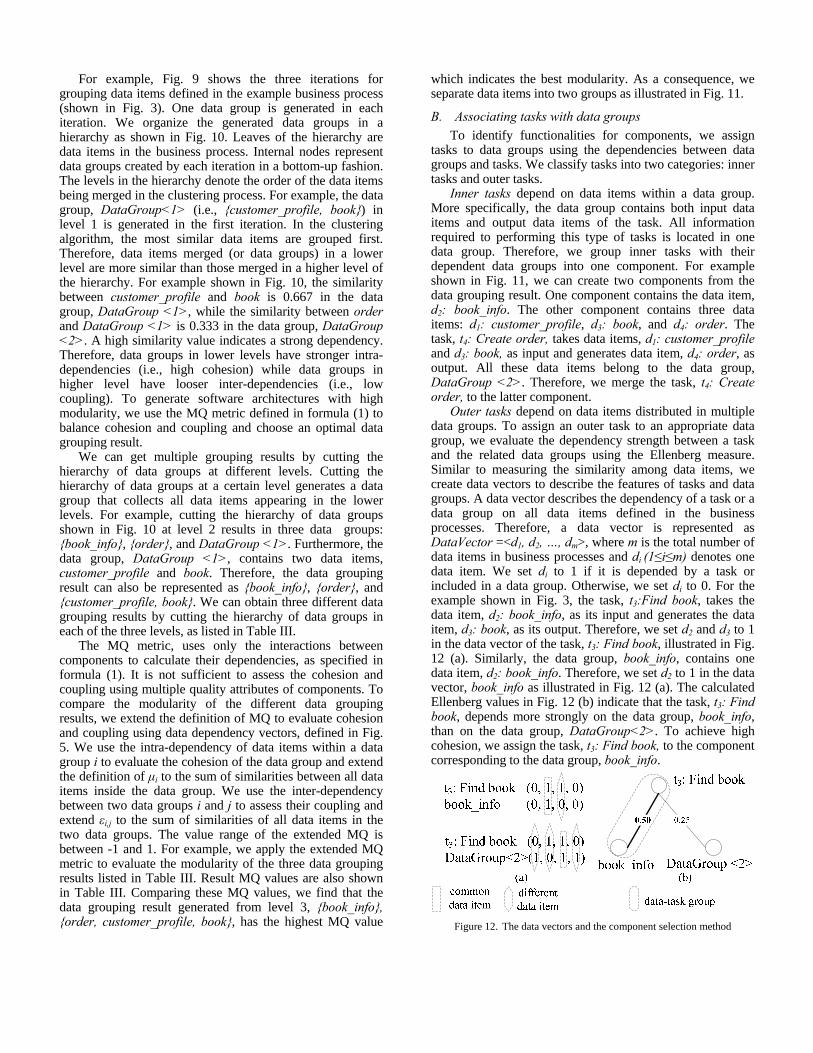
Outer tasks depend on data items distributed in multiple data groups. To assign an outer task to an appropriate data group, we evaluate the dependency strength between a task and the related data groups using the Ellenberg measure. Similar to measuring the similarity among data items, we create data vectors to describe the features of tasks and data groups. A data vector describes the dependency of a task or a data group on all data items defined in the business processes. Therefore, a data vector is represented as DataVector =<d1, d2, …, dm>, where m is the total number of data items in business processes and di (1≤i≤m) denotes one data item. We set di to 1 if it is depended by a task or included in a data group. Otherwise, we set di to 0. For the example shown in Fig. 3, the task, t3:Find book, takes the data item, d2: book_info, as its input and generates the data item, d3: book, as its output. Therefore, we set d2 and d3 to 1 in the data vector of the task, t3: Find book, illustrated in Fig. 12 (a). Similarly, the data group, book_info, contains one data item, d2: book_info. Therefore, we set d2 to 1 in the data vector, book_info as illustrated in Fig. 12 (a). The calculated Ellenberg values in Fig. 12 (b) indicate that the task, t3: Find book, depends more strongly on the data group, book_info, than on the data group, DataGroup<2>. To achieve high cohesion, we assign the task, t3: Find book, to the component corresponding to the data group, book_info.
Figure 12. The data vectors and the component selection method

Figure 13. The generated logical view of the software architecture
To produce a logical view of the software architecture, we further identify connectors between components by analyzing task transitions among components. For example, Fig. 13 shows the two components generated from the example business process shown in Fig. 2. The first component contains data items in the data group, DataGroup<2>, and tasks associated to them. The second component is composed of the data item in the data group, book_info, and the task associated to it. The connector between these two components are identified from the transition between the task, t3:Find book, and the task, t4:Create order.
V. CASE STUDY To evaluate the effectiveness of our proposed approach,
we generate software architecture from a collection of business processes used to describe the functionality of IBM WebSphere Commerce server [9], a commercial platform for building e-commerce web sites and applications. IBM WebSphere Commerce server implements business processes to support B2B (business-to-business) transactions and B2C (business-to-consumer) transactions. Table IV shows a summary of tasks in IBM WebSphere Commerce server.
The business processes for IBM WebSphere Commerce server are available online [9]. These business processes are modeled using WebSphere Business Modeler [14] and stored as XML documents. We developed a business process parser to parse the XML documents and extract entities specified in our meta-model (shown in Fig. 2).
TABLE IV. A SUMMARY OF TASKS OF IBM WEBSPHERE COMMERCE
Category Number of businessprocesses
Number of tasks
Marketing 7 69 Merchandise management 16 66 Order management 21 204 Customer management 6 17 Customer service 5 22 Total 55 378
A. Evaluation Setup
%100))),(max(
),(1()( ×∀
−=BAmno
BAmnoMMoJoFM (4)
To assess the effectiveness of our approach, we compare
our generated software architecture with the as-implemented software architecture. The generated software architecture provides a logical view of the architecture of IBM WebSphere Commerce server. We also manually recover the as-implemented software architecture from its application programming interfaces (APIs). In particular, the APIs show the dependencies among the functions. Furthermore, we use metrics to quantitatively evaluate the similarity between the two software architectures. MoJoFM [16] metric is used to assess the structural similarity between the two software architectures. It counts the number of operations required to change from one software architecture to another. The definition of the MoJoFM metric is shown in formula (4). Two types of operations are used to change software architectures: move and join. A move operation moves one task from a component to another. A join operation merges two components to form a new component. The value of MoJoFM is bounded between 0 and 100%. 0 means that two software architectures are completely different and 100% indicates that two software architectures are exactly the same.
However, even if the generated architecture is similar to the as-implemented architecture, it doesn’t indicate that the generated architecture or the as-implemented architecture has the desired quality. We further evaluate the modularity of the generated architecture in terms of high cohesion and low coupling. We use the MQ metric as defined in formula (1) to assess the quality of the two software architectures. More specifically, we use the intra-connectivity of tasks within a component to evaluate the cohesion of components. The inter-connectivity of tasks among different components is used to assess the coupling of components.

Figure 14. The recovered as-implmented software architecture
B. Comparision of Software Archiectures We manually recover software architecture of IBM
WebSphere Commerce server from its documentation following a class name based approach adapted from [38] and [39]. The documentation describes the implementation of the IBM WebSphere Commerce using a hierarchy of packages and classes. Leaves of the hierarchy are classes of the IBM WebSphere Commerce server. Branches of the hierarchy are packages that represent components at various granularity levels. A package is composed of a number of classes or fine-grained packages. Packages with the coarsest granularity designate the as-implemented decomposition of the functionality of IBM WebSphere Commerce server. We identify architectural components by analyzing packages of the APIs and recover tasks in each component by analyzing classes, such as task commands and access beans defined in packages. The recovered software architecture is shown in Fig. 14. The functionality of each component is summarized from the collection of contained tasks. The Tools component provides a set of utility operations to find data items from the databases or create input data items. The rest of components are created by grouping functionally similar tasks. We develop a prototype tool to generate software architecture using business processes of IBM WebSphere Commerce server. The generated software architecture represents an initial decomposition of the functionality of the IBM WebSphere Commerce server. Architectural components can be further decomposed using our proposed approach to provide more detailed descriptions of the software architecture. The generated software architecture is shown in Fig. 15.
We compare the as-implemented software architecture with the generated one by manually inspecting the components in both architectures. The two software architectures represent two distinct initial decompositions of the functionality of the IBM WebSphere Commerce server. The as-implemented components appearing in the generated architecture (shown in Fig. 15) are marked by underlines. Comparing Fig. 14 and Fig. 15, we find that the generated software architecture is composed of more fine grained components than the as-implemented software architecture. The Order component in the as-implemented software architecture is broken down into three components in the generated software architecture: Order, Shipping, and Inventory. The Marketing component is divided into two components: Promotion and Marketing campaign. We evaluate that the generated software architecture has higher
Figure 15. The generated software architecture
TABLE V. RESULTS OF QUALITY EVALUATION
Software architecture MQ Cohesion Coupling Recovered 0.025 0.034 0.009 Generated 0.042 0.048 0.006
cohesion than the recovered software architecture. Connectors in Fig. 14 and Fig. 15 only show directions of interactions among components and do not show the number of interactions in each direction.
C. Evaluation of Both Architectures To evaluate the similarity of both architectures, we
calculate the MoJoFM value by comparing components of the generated software architecture with the recovered software architecture. The result MoJoFM value is 75%. It shows that 25% of tasks in the as-implemented software architecture are moved to form the generated software architecture. As discussed by Wen and Tzerpos [16], such a value is desirable and shows that the components generated by our proposed approach are consistent with those designed by software architects.
To evaluate the modularity, we calculate the MQ values of both software architectures. Table V lists the result MQ values and their corresponding cohesion values and coupling values. As illustrated in Table V, the generated software architecture has more desirable values in three metrics. Differences between the two software architectures are introduced from the decomposition of components. As aforementioned in Section B, two components in the as-implemented software architecture are broken down to smaller components in the generated software architecture. This results in the improvement of the average cohesion of components. With high cohesion and low coupling, components can be easily understood, implemented, and changed with little effect on other components. Therefore, increasing cohesion and decreasing coupling can reduce the development cost for business applications and improve a

number of quality attributes of business applications such as maintainability, reusability, and flexibility [32][33].
D. Threats to validity We discuss the influences that might threat the validity
of our case study. We assess three types of threats to validity: construct validity, internal validity, and external validity.
Construct validity concerns whether the selected metrics are appropriate for the purpose of our case study [26]. A common technique to evaluating a clustering algorithm is to compare its output with an authoritative clustering result [16]. MoJoFM is a metric specifically designed to compare the structural similarity of two clustering results. Cohesion and coupling are the major concerns in the modularization stage of a software system. MQ is used to evaluate the modularity of software architecture. However, both metrics are relative measures and their effectiveness depends heavily on the quality of the benchmark software architecture. Although the success of IBM WebSphere Commerce server ensures that its software architecture is well-designed, we cannot assure that the software architecture is an optimal one. In the future, we plan to further evaluate the effectiveness of our proposed approach by comparing the generated software architecture with expert decompositions created by other software architects.
Threats to internal validity are factors that can affect the accuracy of our observations [26]. We predict interactions among components from transitions among tasks in our case study. However, the mapping between task transitions and component interactions may not necessarily an one to one mapping. In the implementation stage, one task transition might be mapped to multiple interactions among components (e.g., a handshake process in network protocols). Moreover, one component interaction can be implemented as multiple interactions among tasks. In the future, we aim to further assess the effectiveness of our approach by clarifying the coherence between task transitions and component interactions.
Threats to external validity are factors that can hinder the generalization of our conclusion [26]. We conduct our experiment on IBM WebSphere Commerce server, a commercial e-commerce platform. The success of the platform can ensure that it can be considered as a representative from the business application domain. We envision that our approach can be customized to generate software architecture for other business applications. However, we plan to further assess the generality of our approach by investigating the feasibility of generating software architectures from the business processes specified for other domains.
VI. RELATED WORK The problem of building a software architecture that
satisfies business requirements is central to software engineering. A great deal of efforts has been devoted to bring forward approaches to guide the design of software architecture. Garlan and Shaw [19] and Buschmann [20] summarized common paradigms in software architecture
design and presented a number of software architecture styles. Such a design paradigm provides significant support for software architects to address quality requirements. Software architecture frameworks provide structured and systematic approaches for designing software architecture. Typical software architecture frameworks include Zachman Framework for Enterprise Architecture (ZF) [21], 4+1 View Model of Architecture [22], and The Open Group Architecture Framework (TOGAF) [23]. These frameworks provide solutions to a wide spectrum of software architecture design problems and can be tailored to specific needs in different domains. However, it still relies on software architects’ manual work to create components. Our proposed approach automates the creation of components. In the future, we aim to investigate the feasibility of generating software architecture using software architectural styles and frameworks.
Lung et al. [15] used clustering techniques to decompose requirements to subsystems. The authors manually identify dependencies among requirements and apply the hierarchical agglomerative clustering method to produce a hierarchy of clusters. However, the approach does not consider quality requirements. In our approach, we reuse business processes in the business domain as the starting point and automatically generate software architectures with desired modularity.
Mitra [34] and Koehler et al. [35] presented business driven development approaches that use business processes to guide the development of business applications. A set of heuristics are provided to guide software architects manually create models and components. Arsanjani [36] and Zimmermann et al. [37] use decision models to assistant the identification of components from business requirements. The proposed approaches aim to reuse legacy components and create new components to reduce the development cost of business applications. Different from our approach, we combine clustering analysis and quality metrics to automatically generate software architecture with desired modularity. Such generated architecture can be used an initial guide for the future architecture design.
VII. CONCLUSION In this paper, we presented an approach to automatically
generate software architecture from business processes. Our proposed approach improves the efficiency of software architecture design by automating the creation of components and their interactions. Furthermore, the consistency between business requirements and software architecture can be assured by our proposed approach. Results of our case study illustrate that our proposed approach can generate meaningful software architecture with desired modularity. In the future, we plan to further assess the effectiveness of our generated architecture with those created by experts in software architecture design. We plan to investigate the feasibility of our approach to generate software architectures using business processes specified for other domains. We also want to investigate the generation of software architecture with other quality attributes, such as reusability, portability and security.

REFERENCES [1] S. Mancoridis, B. S. Mitchell, Y. Chen, and E. R. Gansner, “Bunch:
A Clustering Tool for the Recovery and Maintenance of Software System Structures”, Proc. of the IEEE International Conference on Software Maintenance (ICSM’99), pp. 50 (1999)
[2] DH. Hutchens and VR. Basili, “System Structure Analysis Clustering with Data Bindings”, IEEE Transactions on Software Engineering. vol. 11(8), pp. 749-757 (1985).
[3] N. Anquetil and TC. Lethbridge, “Experiments with clustering as a software re-modularization method”, In the 6th Working Conference on Reverse Engineering (WCRE’99), pp. 235–255 (1999).
[4] O. Maqbool and HA. Babri, “Hierarchical Clustering for Software Architecture Recovery”, IEEE Transactions on Software Engineering. vol. 33(11), pp. 759-780 (2007).
[5] CH. Lung, “Software Architecture Recovery and Restructuring through Clustering Techniques”, Proc. of the third international workshop on Software architecture. Pp. 101-104 (1998).
[6] O. Maqbool and HA. Babri, “The weighted combined algorithm: a linkage algorithm for software clustering”, In Conference on Software Maintenance and Re-engineering (CSMR’04), pp. 15–24 (2004).
[7] CH. Lung, M. Zaman, and A. Nandi, “Applications of clustering techniques to software partitioning, recovery and restructuring”, Journal of Systems and Software. vol. 73(2), pp. 227-244 (2004).
[8] S. Mancoridis, BS. Mitchell, C. Rorres, and Y. Chen, “Using automatic clustering to produce high level system organizations of source code”, Proc. of the 6th International Workshop on Program Comprehension. pp. 45 (1998).
[9] IBM WebSphere Commerce infocenter, http://publib.boulder.ibm.com/infocenter/wchelp/v6r0m0/index.jsp
[10] Integrated definition methods (IDEF), http://www.idef.com/ [11] Business process modeling notation (BPMN), http://www.bpmn.org/ [12] Business process execution language (BPEL),
http://www.ibm.com/developerworks/library/specification/ws-bpel/ [13] A. Van Deursen, and T. Kuipers, “Identifying objects using cluster
and concept analysis”, Proc. of the 21st international conference on Software engineering, pp. 246–255 (1999)
[14] IBM WBI Modeler, http://www-01.ibm.com/software/integration/wbimodeler/
[15] CH. Lung, X. Xu, and M. Zaman, “Software Architecture Decomposition Using Attributes”, International Journal of Software Engineering and Knowledge Engineering, Special Issue on Selected Papers from ICSEKE 2005, (2005)
[16] Z. Wen, and V. Tzerpos, “An Effective measure for software clustering algorithms”, Proc. of the IEEE International Workshop on Program Comprehension, pp. 194 - 203 (2004)
[17] R. Briggs and P. Gruenbacher, “EasyWinWin: Managing Complexity in Requirements Negotiation with GSS”, Proc. of the 35th Annual Hawaii International Conference on System Sciences (HICSS’02), vol. 1 (2002)
[18] TA. Wiggerts, “Using clustering algorithms in legacy systems re-modularization”, In the 4th Working Conference on Reverse Engineering (WCRE’97), pp. 33–43 (1997).
[19] D. Garlan and M. Shaw, “An Introduction to Software Architecture”, In Advances in Software Engineering and Knowledge Engineering, vol. 1 (1993)
[20] F. Buschmann, R. Meunier, H. Rohnert, P. Sommerlad, and M. Stal, “Pattern-Oriented Software Architecture”, Wiley, 1996.
[21] JA. Zachman, “A framework for information systems architecture”, IBM Systems Journal, vol.26 (3), pp. 276-292 (1987)
[22] P. Kruchten, “Architectural Blueprints—The 4+1 View Model of Software Architecture”, IEEE Software, vol.12 (6), pp.42-50 (1995)
[23] The Open Group Architecture Framework (TOGAF), www.opengroup.org/togaf/
[24] AI. Wasserman, “Toward a Discipline of Software Engineering,” IEEE Software, pp. 23-31 (1996)
[25] LM. Northrop, and WE. Richardson, “Design Evolution: Implications for Academia and Industry”, Proc. of the SEI Conference on Software Engineering Education, pp.205-217 (1991)
[26] DE. Perry, AA. Porter, and LG. Votta, “Empirical Studies of Software Engineering: A Roadmap”. Proc. of the Conference on The Future of Software Engineering, pp: 345 - 355, (2000)
[27] C. Hofmeister, P. Kruchten, RL. Nord, H. Obbink, A. Ran, and P.America, “Generalizing a Model of Software Architecture Design from Five Industrial Approaches”, Proc. of the 5th Working IEEE/IFIP Conference on Software Architecture, pp. 77 – 88 (2005)
[28] A. Tang, J. Han, and P. Chen, “A Comparative Analysis of Architecture Frameworks”, Proc. of the 11th Asia-Pacific Software Engineering Conference, pp.: 640–647, (2004)
[29] L. Bass, P. Clements, and R. Kazman, “Software Architecture in Practice”, 2nd ed., Reading, MA: Addison-Wesley, (2003)
[30] D. McDavid, “The Business-IT Gap: A Key Challenge”, IBM Research Memo, http://www.almaden.ibm.com/coevolution/pdf/mcdavid.pdf.
[31] O. Maqbool, and H. Babri, “Hierarchical Clustering for Software Architecture Recovery”, IEEE Transactions on Software Engineering, vol. 33 (11), pp. 759-780 (2007)
[32] BS. Mitchell, “A Heuristic Search Approach to Solving the Software Clustering Problem”, PhD Thesis, Drexel University, Philadelphia, PA, (2002)
[33] H. Dhama, “Quantitative models of cohesion and coupling in software”, Journal of Systems and Software, vol. 29 (1), pp. 65–74 (1995)
[34] T. Mitra, “Business-driven development”, IBM developerWorks article, http://www.ibm.com/developerworks/webservices/library/ws-bdd, IBM, (2005)
[35] J. Koehler, R. Hauser, J. Küster, K. Ryndina, J. Vanhatalo, and M. Wahler, “The Role of Visual Modeling and Model Transformations in Business driven Development”, In Fifth International Workshop on Graph Transformation and Visual Modeling Techniques, pp. 1-10 (2006)
[36] A. Arsanjani, “Service-oriented modeling and architecture (SOMA)”, http://www-128.ibm.com/developerworks/webservices/library/ws-soadesign1/, IBM (2004)
[37] O. Zimmermann, J. Koehler, and F. Leymann, “Architectural Decision Models as Micro-Methodology for Service-Oriented Analysis and Design”, In Workshop on Software Engineering Methods for Service Oriented Architecture, (2007)
[38] V. Tzerpos, and RC. Holt, “ACDC : An Algorithm for Comprehension-Driven Clustering”, Proc. of the Seventh Working Conference on Reverse Engineering (WCRE'00), p. 258, (2000)
[39] N. Anquetil, and TC. Lethbridge, “Recovering Software Architecture from the Names of Source Files”, Journal of Software Maintenance: Research and Practice, vol. 11 (3), pp. 201 - 221 (1999)
[40] L. Bass, P. Clements, and R. Kazman, “Software Architecture in Practice”, Addison Wesley, Boston, MA, USA, 2nd edition, (2003)
[41] IEEE, “IEEE Recommended Practice for Architectural Description of Software-Intensive Systems”, Institute of Electrical and Electronics Engineers, (2000)
[42] IBM Rational Software, http://www-01.ibm.com/software/rational/ [43] J. Merilinna, “A Tool for Quality Driven Architecture Model
Transformation”, PhD thesis, VTT Electronics, VTT Technical Research Centre of Finland, (2005
[44] V. Ambriola and A. Kmiecik, “Transformations for Architectural Restructuring” , Journal of Informatica. vol. 28(2), pp. 117-128 (2004)