a bridge-height sensing and database management … · gis geographic information system ... usb...
TRANSCRIPT

A Bridge-Height Sensing and Database Management System. . .
Technical Documentation Page
1. Report No. 2. Government Accession No. 3. Recipient’s Catalog No.
CA08-02564. Title and Subtitle 5. Report Date
A Bridge-Height Sensing and Database Management System for Re-liable and Efficient Oversize Permitting and Routing
February 28th, 2005
6. Performing Organization Code
7. Author(s): 8. Performing Organization Report No.
Kin S. Yen, Travis Swanston, Jagannath Hiremagalur, Bahram Ra-vani, & Ty A. Lasky
UCD-ARR-05-02-28-01
9. Performing Organization Name and Address 10. Work Unit No. (TRAIS)
AHMCT Research CenterUCD Dept of Mechanical & Aeronautical Engineering 11. Contract or Grant
Davis, California 95616-5294 IA 65A013112. Sponsoring Agency Name and Address 13. Type of Report and Period Covered
California Department of Transportation Final ReportSacramento, CA 95819 March 2002 - February 2005
14. Sponsoring Agency Code
15. Supplementary Notes
16. Abstract
This report presents STRUCTVIEW, a vehicle-based system for the measurement of roadway structureprofiles, which uses a scanning laser rangefinder to measure various structure and roadway featureswhile traveling at highway speed. Measurement capabilities include horizontal and vertical clearanceswhich can be used to support issuing permits based on vehicle height.
17. Key Words 18. Distribution Statement
Bridge profile, Clearance measurement, Structuremaintenance, Highway maintenance, STRUCTVIEW
No restrictions. This document is available to thepublic through the National Technical InformationService, Springfield, Virginia 22161.
20. Security Classif. (of this report) 20. Security Classif. (of this page) 21. No. of Pages 22. Price
Unclassified Unclassified 42

California AHMCT ProgramUniversity of California at DavisCalifornia Department of Transportation
A BRIDGE-HEIGHT SENSING ANDDATABASE MANAGEMENT SYSTEM FOR
RELIABLE AND EFFICIENT OVERSIZEPERMITTING AND ROUTING*
Kin S. Yen1, Travis Swanston1,Jagannath Hiremagalur1, Bahram Ravani1, &
Ty A. Lasky1, Principal Investigator
AHMCT Research ReportUCD-ARR-05-02-28-01
Final Report of Contract IA 65A0131
February 28th, 2005
Affiliations:1. AHMCT Research Center, Department of Mechanical & Aeronautical Engineering, University ofCalifornia, Davis, CA 95616-5294
* This report has been prepared in cooperation with the State of California, Business Transportation andHousing Agency, Department of Transportation, and is based on work supported by Contract Number IA65A0131 through the Advanced Highway Maintenance and Construction Technology Research Center atthe University of California at Davis.

A Bridge-Height Sensing and Database Management System. . .
Form DOT F 1700.7 (872) Reproduction of completed page authorized
(PF V2.1, 6/30/92)
i

A Bridge-Height Sensing and Database Management System. . .
ii

Abstract
This report presents STRUCTVIEW, a vehicle-based system for the measurement of road-way structure profiles, which uses a scanning laser rangefinder to measure various struc-ture and roadway features while traveling at highway speed. Measurement capabilitiesinclude horizontal and vertical clearances which can be used to support issuing permitsbased on vehicle height.
iii

A Bridge-Height Sensing and Database Management System. . .
iv

Table of Contents
Abstract iii
Table of Contents v
List of Figures vii
Disclaimer/Disclosure ix
Acronyms and Abbreviations xi
Acknowledgments xiii
1 Introduction 1
2 The STRUCTVIEW Concept 5
3 STRUCTVIEW Hardware 9
3.1 Laser Rangefinding Unit . . . . . . . . . . . . . . . . . . . . . . . . . . . . . . 9
3.2 Coaxial Spinning Mirror with Encoder . . . . . . . . . . . . . . . . . . . . . . 10
3.3 Radar Speed Sensor . . . . . . . . . . . . . . . . . . . . . . . . . . . . . . . . . 10
3.4 GPS . . . . . . . . . . . . . . . . . . . . . . . . . . . . . . . . . . . . . . . . . . 11
3.5 Human-Machine Interface (HMI) . . . . . . . . . . . . . . . . . . . . . . . . . 12
3.6 Camera . . . . . . . . . . . . . . . . . . . . . . . . . . . . . . . . . . . . . . . . 12
3.7 Computing, Power, and Communications . . . . . . . . . . . . . . . . . . . . 12
4 STRUCTVIEW Software 15
v

A Bridge-Height Sensing and Database Management System. . .
4.1 Sensor Application . . . . . . . . . . . . . . . . . . . . . . . . . . . . . . . . . 15
4.2 User Application . . . . . . . . . . . . . . . . . . . . . . . . . . . . . . . . . . 15
5 Conclusions and Future Work 21
References 25
vi

List of Figures
2.1 The profile sensing system and its block diagram. . . . . . . . . . . . . . . . 5
2.2 STRUCTVIEW scan geometry of a simple structure as viewed from behind.Sample STRUCTVIEW profile dimensions are indicated. . . . . . . . . . . . . 6
2.3 STRUCTVIEW scan geometry of a simple structure. The helical nature of thescan data is shown by the purple helix, and the scan axis is indicated by thegreen arrows. The sample spacing (from sample Si to Si+1) is exaggeratedin the illustration. . . . . . . . . . . . . . . . . . . . . . . . . . . . . . . . . . . 6
2.4 Sample California Department of Transportation (Caltrans) roadway clear-ance diagram [6]. . . . . . . . . . . . . . . . . . . . . . . . . . . . . . . . . . . 7
3.1 The scanning laser rangefinder. . . . . . . . . . . . . . . . . . . . . . . . . . . 10
4.1 User application screenshot. . . . . . . . . . . . . . . . . . . . . . . . . . . . . 16
4.2 Close-up view illustrating paint stripe identification. The red points depictlaser range samples, and the search window is a heuristic device used inthe detection process. . . . . . . . . . . . . . . . . . . . . . . . . . . . . . . . . 17
4.3 Triangle ∆abc from a triangulated paint stripe is mapped into the xz planealong with candidate points U from the overhead structure and V fromthe road surface. Points in U and V whose corresponding mappings arefound to be convex combinations of (a, b, c) are known to project verticallythrough ∆abc. y-values from these points are then used to determine theminimum vertical clearance above ∆abc. . . . . . . . . . . . . . . . . . . . . 18
vii

A Bridge-Height Sensing and Database Management System. . .
viii

Disclaimer/Disclosure
The research reported herein was performed as part of the Advanced Highway Main-tenance & Construction Technology (AHMCT) Research Center, within the Departmentof Mechanical and Aeronautical Engineering at the University of California Davis, andthe Division of Research and Innovation at the California Department of Transportation.It is evolutionary and voluntary. It is a cooperative venture of local, State and Federalgovernments and universities.
The contents of this report reflect the views of the authors who are responsible forthe facts and the accuracy of the data presented herein. The contents do not necessarilyreflect the official views or policies of the State of California, the Federal Highway Ad-ministration, or the University of California. This report does not constitute a standard,specification, or regulation.
ix

A Bridge-Height Sensing and Database Management System. . .
x

Acronyms and Abbreviations
Acronyms used within this document are defined below.
AASHTO American Association of State and Highway Transportation Officials
AHMCT Advanced Highway Maintenance & Construction Technology
API Application Programming Interface
ASCII American Standard Code for Information Interchange
BDI Bridge Diagnostics, Incorporated
C/A coarse acquisition
Caltrans California Department of Transportation
CDOT Colorado DOT
CEP Circular Error Probable
ConnDOT Connecticut DOT
DC Direct Current
DOT Department of Transportation
DRI Division of Research and Innovation
EIA Electronic Industries Alliance
FEA Finite Element Analysis
FHWA Federal Highway Administration
FOH first-order hold
GIS Geographic Information System
GNU GNU’s Not Unix
xi

A Bridge-Height Sensing and Database Management System. . .
GPS Global Positioning System
HDOP Horizontal Dilution of Precision
HMI Human-Machine Interface
HSIF high-speed interface
HTTP HyperText Transfer Protocol
JPEG Joint Photographic Experts Group
NDOR Nebraska Department of Roads
NMEA-0183 National Marine Electronics Association GPS communications standard
OBD-II On-Board Diagnostics
PVT position, velocity, and time
RSA returned signal amplitude
RS-232 EIA serial communications standard
SDK Software Development Kit
USB Universal Serial Bus
USDOT U.S. Department of Transportation
WAAS Wide Area Augmentation System
WGS-84 World Geodetic System 84
xii

Acknowledgments
The authors thank the California Department of Transportation (Caltrans) for their guid-ance and support; in particular, the guidance and review provided by the Bridge ProfileSystem project team and Technical Advisory Group. The authors also acknowledge thededicated efforts of the AHMCT development team members. Special thanks to ArvernLofton of the Caltrans Division of Research and Innovation (DRI), and to the CaltransStructures Maintenance Engineers, particularly Rick Jorgensen and Michael Johnson, whohave been instrumental in the design of this system.
xiii

A Bridge-Height Sensing and Database Management System. . .
xiv

Chapter 1
Introduction
Accurate data on the vertical clearances of roadway structures is critically important inoversize route planning and to the nation’s economy [1]. Horizontal clearance measure-ments must also be maintained for security and military purposes [20, 16]. Collectingthis data can be dangerous or can cause congestion, and is currently performed by engi-neers working on or adjacent to the roadway. These work crews are subject to significanttraffic hazards, and must obtain measurements during available traffic breaks, which canintroduce errors. In addition, from a system-wide perspective, clearance information isin many cases incomplete, inaccurate, difficult to maintain, and difficult to access. Fi-nally, maintaining clearance databases often involves several potentially erroneous man-ual steps between acquiring the data and updating the database. This report presentsSTRUCTVIEW, a vehicle-based system for the measurement of roadway structure pro-files. The sensing system uses a scanning laser rangefinder to measure various structureand roadway features while traveling at highway speed. Measurement capabilities in-clude horizontal and vertical clearances as specified by American Association of State andHighway Transportation Officials (AASHTO) guidelines [1] and Federal requirements,which can be used to support issuing permits based on vehicle height. STRUCTVIEW ad-dresses safety hazards by removing the workers from the roadway, and communicationissues by reducing the number of manual steps involved in updating the database.
The U.S. Department of Transportation (USDOT) Federal Highway Administration(FHWA) Saxton Highway Electronics Laboratory performed pioneering research on theapplication of laser sensing for structure profiling in 1997 [10]. The system provideda one-dimensional (1D) slice of the structure profile from a vehicle-mounted system, athighway speed, using a single-point laser and a wheel-speed sensor integrated to providelongitudinal distance. Vertical sensing accuracy was very high (0.254 cm, 0.1 in); however,it appears that the system did not have a provision for minimizing or accounting for vehi-cle bounce, so overall accuracy could be degraded in practice. This prototype system wassubsequently tested by the Connecticut DOT (ConnDOT) [17]. In ConnDOT’s testing, theprototype structure clearance measurement system was mounted on their existing pho-tolog vehicles, so that clearance data could be obtained during an existing Departmentof Transportation (DOT) operation. Such combinations, done properly, can introduce sig-
1
A Bridge-Height Sensing and Database Management System. . .
nificant efficiencies into transportation operations and maintenance—in addition, therecan be synergies with regard to available sensors and other supporting in-vehicle infras-tructure. One advantage of the 1D approach is that a high sampling rate can be used(up to 500 Hz in the ConnDOT tests), resulting in excellent longitudinal resolution (forConnDOT, down to 4.47 cm (1.76 in) at 22 m/s (50 mi/hr)), more than sufficient to detectmost overhead structural features, with the possible exception of some thinner signs.
A similar commercial system, available from Bridge Diagnostics, Incorporated (BDI),www.bridgetest.com), is discussed by Mystkowski and Schulz [19]. BDI’s system, whichwas field-tested by the Colorado DOT (CDOT), measures vehicle bounce using an ultra-sonic range sensor, thus providing true clearance over the lane stripe. In the cited CDOTtesting, due to low sampling rates, vehicle speed was limited to 8 km/hr (5 mi/hr)—atthis speed, a rolling lane closure using an attenuator truck (a.k.a. a shadow vehicle) isrequired. Subsequent versions of the BDI system (currently the ClearanceMaster 3000TM)support measurement at highway speed, with a laser sensor sampling rate of 10 kHz,and seven data points per inch at 34 m/s (75 mi/hr). For all 1D systems, multiple passesmust be made through the structure to determine approximate minimum clearance. Inaddition, by nature they cannot provide horizontal clearance information—essential fornational defense and homeland security purposes [20, 16].
Fixed three-dimensional (3D) scanners are seeing increased use in transportation ap-plications. Closely related to the current system, the Nebraska Department of Roads(NDOR) conducted a pilot study using 3D scanning (with a Riegl LMS-Z360) from road-side locations to develop full point-cloud models and determine clearances for 400 struc-tures [25]. Noteworthy, NDOR has also developed automated Internet-based permittingand routing based on their clearance data. The 3D scanner approach is a strong candidatefor this and many other applications. For the structure clearance application, one draw-back in some situations is that this approach will require multiple scan locations near thestructure to develop the full 3D model needed, and it is often difficult to establish enoughsafe scanning locations protected from traffic and other hazards; however, the scan lo-cations should still be safer than the current practice of measuring directly on the laneswith or without a lane closure. In addition, to register (or correlate) the multiple scans, itis usually necessary to place known targets (e.g. high-reflectivity spheres) in the scene atlocations that will be visible from all planned scan locations, although this requirement isbecoming less of an issue as 3D scanning technology evolves. The method does providevery high accuracy (the NDOR study verified vertical clearance accuracies to approxi-mately 3.2 mm (1/8 inch)), and a full 3D model of the structure (thus supporting bothvertical and horizontal clearance determination)—such a model will have uses beyondclearance determination, e.g. structure visualization. Jaselskis et al. [14] provides an ex-cellent overview of transportation applications for 3D scanning, including a pilot studyperformed for the Iowa DOT using a Cyrax 2500 scanning unit. Optech Incorporated(www.optech.ca) applied their ILRIS-3D scanner and InnovMetric’s PolyWorksTM soft-ware in a pilot study for the Florida DOT to investigate the effectiveness of 3D scanningfor bridge deflection analysis [22]. Boehler and Marbs [3] overview 3D laser scanninginstruments, while Boehler et al. [4] overview 3D scanning software. Boehler et al. [5]
2

A Bridge-Height Sensing and Database Management System. . .
present a detailed study of laser scanner accuracy; the results of their study, that of Jasel-skis et al. [14], and our experimental results all indicate that fixed or mobile 3D laserscanning is an ideal candidate for the structure profile application.
Several companies offer software for visualization and manipulation of data obtainedusing 3D laser scanners. While there are several categories, including scanner control,surface model generation, and data and project management [4], the category of greatestrelevance to the current system is point cloud treatment. Point cloud processing softwareincludes, for example (all TM or c© of their respective owners), PolyWorks from Innov-Metric Software [12], Cyclone CloudWorx from Leica Geosystems [18], and RealWorksSurvey from Trimble [26]. Point cloud software typically performs the following tasks:visualization, data cleaning in single point clouds, data filtering and point thinning, reg-istration, data cleaning in registered point clouds, point thinning after registration, andgeneration of simple plots derived from point clouds [4].
In this report we present the first phase research and development of an alternate ap-proach to the measurement of roadway structure profiles, STRUCTVIEW, which matchesthe speed, safety, and cost of the current 1D solutions, yet produces a 3D model that canbe used to measure features that previously required the use of a stationary 3D scanneror the deployment of a survey crew onto the roadway. STRUCTVIEW operation is at high-way speed, eliminating the need for road closures and the associated congestion. Thissystem was developed by the Advanced Highway Maintenance & Construction Technol-ogy (AHMCT) Research Center to meet the needs of the California Department of Trans-portation (Caltrans), particularly their Structures Maintenance engineers who are respon-sible for obtaining structure clearance data, and Traffic Operations, which uses structureprofile data for permitting and route planning for vehicles with oversize loads.
3

A Bridge-Height Sensing and Database Management System. . .
4

Chapter 2
The STRUCTVIEW Concept
GPS
LaserRanger
DopplerRadar
802.11gAP / Router
Power Input
Integrated GPS /WAAS Antenna
Control Computer
RS232 /PWR, 1Hz
SpeedSensor
RS232 / PWR
Laser Ranger
Fuse/PowerSupply
12 VDC
Figure 2.1: The profile sensing system and its block diagram.
The STRUCTVIEW sensing system, shown in Figure 2.1, is a self-contained unit whichattaches to the rear of the host vehicle via standard trailer-mount receptacle and power—STRUCTVIEW is highly portable among vehicles of different types, supporting sharingamong DOT districts, with resultant cost benefits. Operation is at highway speed andis controlled wirelessly from within the vehicle with a laptop computer. The sensingsystem employs a laser rangefinding unit with a coaxial spinning mirror oriented to con-tinuously sweep the beam in the plane normal to the vehicle’s axis of travel. With thevehicle in motion, this results in a helical scan pattern with screw axis (z) aligned alongthe roadway. 3D fixes for objects in the beam path are acquired in a cylindrical coordi-nate system (r, θ, z) (see Figure 2.2 and Figure 2.3 on the next page) with data obtainedfrom three primary sensors. Data from the laser rangefinder is used to determine radial
5
A Bridge-Height Sensing and Database Management System. . .
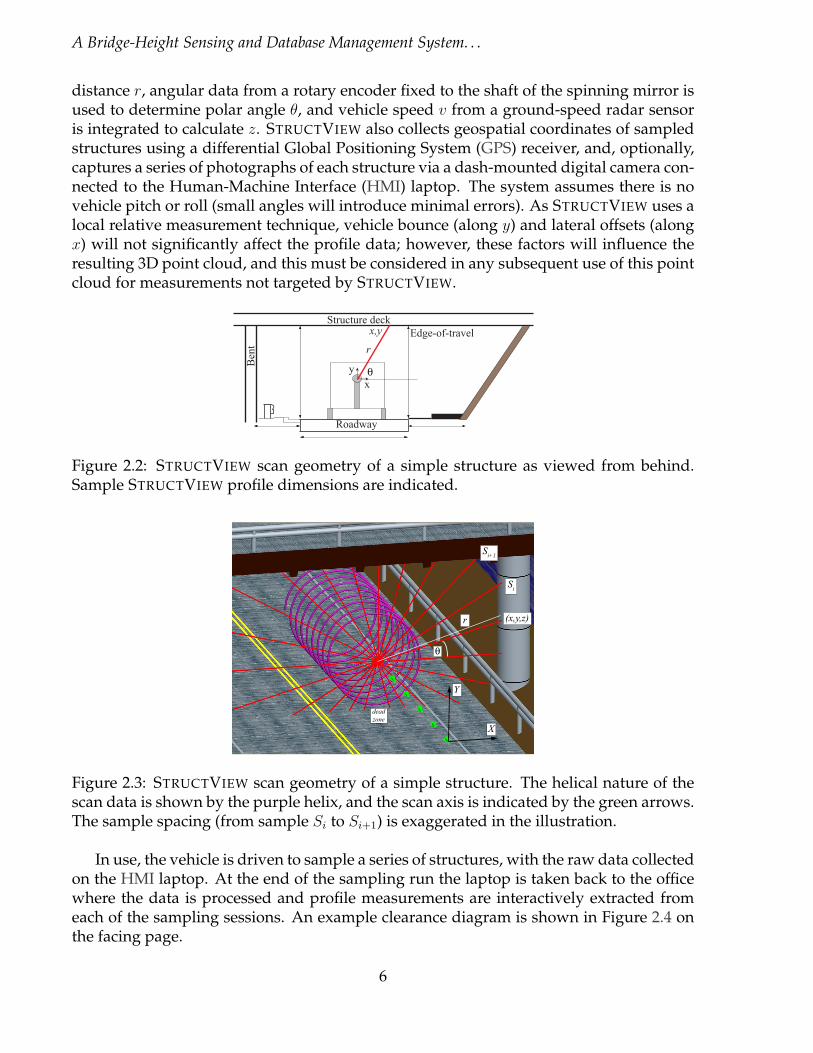
distance r, angular data from a rotary encoder fixed to the shaft of the spinning mirror isused to determine polar angle θ, and vehicle speed v from a ground-speed radar sensoris integrated to calculate z. STRUCTVIEW also collects geospatial coordinates of sampledstructures using a differential Global Positioning System (GPS) receiver, and, optionally,captures a series of photographs of each structure via a dash-mounted digital camera con-nected to the Human-Machine Interface (HMI) laptop. The system assumes there is novehicle pitch or roll (small angles will introduce minimal errors). As STRUCTVIEW uses alocal relative measurement technique, vehicle bounce (along y) and lateral offsets (alongx) will not significantly affect the profile data; however, these factors will influence theresulting 3D point cloud, and this must be considered in any subsequent use of this pointcloud for measurements not targeted by STRUCTVIEW.
Structure deckEdge-of-travel
Ben
t
Roadway
xy θ
r
x,y
Figure 2.2: STRUCTVIEW scan geometry of a simple structure as viewed from behind.Sample STRUCTVIEW profile dimensions are indicated.
(x,y,z)
θ
deadzone
Si
r
X
Y
Si+1
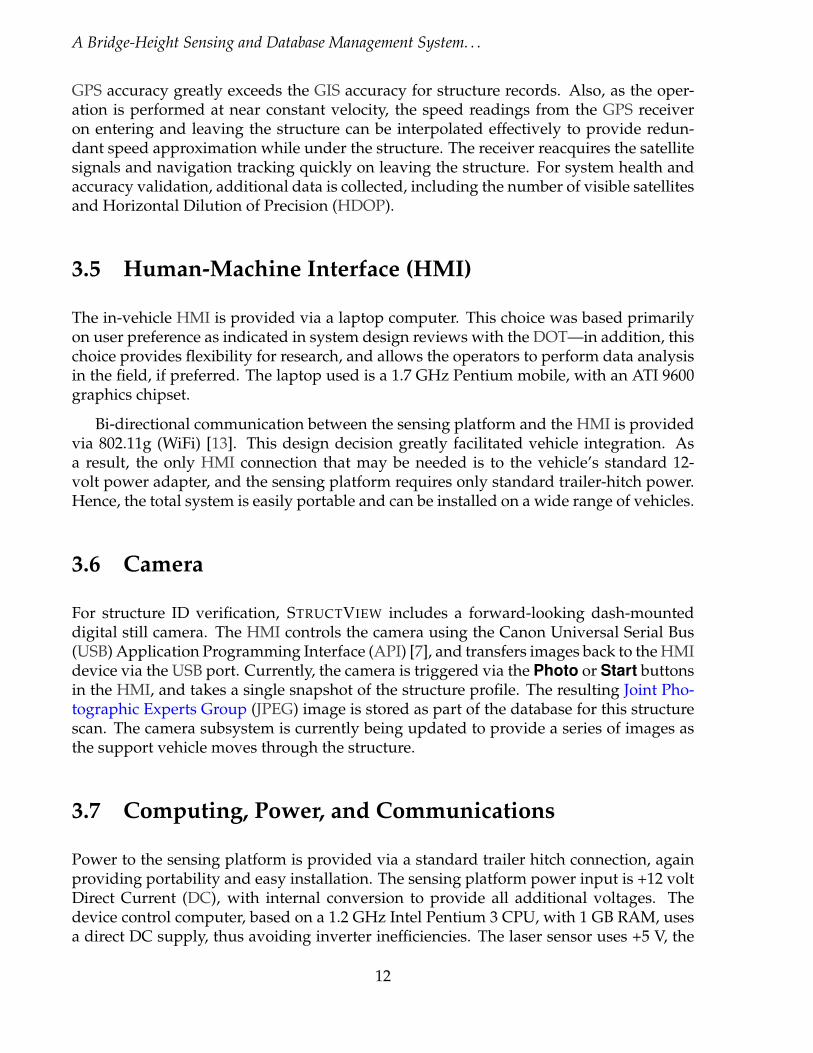
Figure 2.3: STRUCTVIEW scan geometry of a simple structure. The helical nature of thescan data is shown by the purple helix, and the scan axis is indicated by the green arrows.The sample spacing (from sample Si to Si+1) is exaggerated in the illustration.
In use, the vehicle is driven to sample a series of structures, with the raw data collectedon the HMI laptop. At the end of the sampling run the laptop is taken back to the officewhere the data is processed and profile measurements are interactively extracted fromeach of the sampling sessions. An example clearance diagram is shown in Figure 2.4 onthe facing page.
6

A Bridge-Height Sensing and Database Management System. . .
Figure 2.4: Sample Caltrans roadway clearance diagram [6].
STRUCTVIEW is a multirate sampled-data system [2], with high-rate sampling for thelaser rangefinder and the encoder (frequency fl = fe = 50 kHz, period Tl = Te = 20 µs),and low-rate sampling for the ground-speed radar (fv = 10 Hz, Tv = 100 ms) and theGPS (fg = 1 Hz, Tg = 1 s). The sampled-data signals, denoted for example as r∗(t), arethe impulse series signals corresponding to the continuous signals, e.g. r(t), at timekTi (i = l, e, v, g), so that, for example,
r∗(t) =∞∑
k=0
r(kTl)δ(t− kTl) (2.1)
For the low-rate data (GPS and ground-speed radar), a non-causal first-order hold (FOH)is used to linearly interpolate between samples. For example, the low-rate radar ground-speed data is interpolated in this manner to obtain the longitudinal dimension, z, as
z(t) = −∫ t
t0
v(τ)dτ , or z∗(kTl) = −Tl
k∑i=0
FOH(v∗(iTl)) (2.2)
Here, t0 is the starting time for each scan (i.e., the integration is reset for each scan toremove error accumulation), FOH() denotes the non-causal first-order hold operation,and v is obtained from the ground-speed sensor based on equation (3.1). Based on theCartesian frame used (see Figure 2.3 on the preceding page), z will always be negative.
The system maintains both cylindrical and Cartesian coordinates. To complete thelocalized Cartesian coordinates, data is converted from the natural polar coordinates ofthe laser rangefinder and encoder (see Figure 2.2 on the facing page) at rate fl as
(x∗(t), y∗(t)) = r∗(t)(cos θ∗(t), sin θ∗(t)) (2.3)
7

A Bridge-Height Sensing and Database Management System. . .
8

Chapter 3
STRUCTVIEW Hardware
Figure 2.1 on page 5 provides an overview of the core hardware components, which willbe discussed in detail in this chapter. The photo shows the STRUCTVIEW prototype hard-ware mounted on a research vehicle, requiring only a standard trailer mount receptacleand connection to the vehicle 12-volt power via standard trailer power connector, so thatSTRUCTVIEW is highly portable among vehicles of different types.
As system portability is an important constraint, the weight of the system was min-imized in the design. However, structural rigidity was important, based on the sensingaccuracy requirements. Finite Element Analysis (FEA) was used to optimize the weightvs. rigidity. The detailed FEA study is not included here. Additional weight optimizationis occurring in ongoing research efforts. In particular, now that STRUCTVIEW prototypecomponent selection is final, improvements can be achieved by reducing the electronicsenclosure’s size and weight.
3.1 Laser Rangefinding Unit
The scanning laser rangefinder is the primary STRUCTVIEW sensor; the prototype usesa factory-modified version of the Acuity Research (Schmitt Measurement Systems, Inc.)AR4000-LV, a time-of-flight rangefinder based on a 5 mW 670 nm wavelength visible redlaser diode [24]. This Class IIIa sensor provides range r(t) and returned signal amplitude(RSA) a(t) in the 0 - 16.5 m (0 - 54 ft) range. RSA is important as it is used withinSTRUCTVIEW in the identification of retroreflective paint stripes, and thus for horizon-tal dimension extraction; it also plays a significant role in STRUCTVIEW’s noise filtering.For a general overview of laser range sensors and accuracy characterization, see worksby Boehler et al. [4, 3, 5].
9

A Bridge-Height Sensing and Database Management System. . .
3.2 Coaxial Spinning Mirror with Encoder
The AR4000-LV, combined with Acuity’s AccuRange Line Scanner and high-speed interface(HSIF) card (all TM Schmitt Measurement Systems, Inc.), provides a laser scanner (see Fig-ure 3.1) with circular sweep (provided by a spinning mirror) at ω = 272 rad/s (2600 RPM,43.3 Hz, 23.1 ms per sweep), with angular position provided by an integrated 4096-countoptical encoder (1.534 mrad/count). With laser sweep rate ω and forward vehicle veloc-ity v, the longitudinal resolution (along the road) for the integrated system is given byρz = 2πv/ω. As integrated for the structure scanning operation, this sweep rate combinedwith forward velocity v = 24.6 m/s (55 mi/hr) yields ρ = 0.57 m (1.9 ft). The combinedsensing package provides target range r, RSA a, and laser beam angle θ, at sampling ratefl = 50 kHz. The line scanner mounting blocks the signal, creating a dead zone of 1.05 rad(60o) directly below the laser with the off-the-shelf mount. STRUCTVIEW uses a modifiedmount to reduce the dead zone to approximately 0.44 rad (25o). With the sensor mountingheight of approximately 1.4 m (4.5 ft), this yields about 0.6 m (2.0 ft) of blocked pavementlaterally, varying of course with mount height and vehicle bounce. The mount locationwas selected to place this dead zone near the center of the driving lane, so that it willnot impact STRUCTVIEW operation and output, based on system requirements (heightabove lane stripes) and operating mode. The laser scanner data, combined with the inte-grated vehicle velocity, yields a 3D point cloud of the structure and roadway, includingRSA, while also retaining the intrinsic helical scan structure exploited in the subsequentprocessing.
Figure 3.1: The scanning laser rangefinder.
3.3 Radar Speed Sensor
Generally speaking, a vehicle’s ground speed and distance traveled can be provided viaits built-in sensors, GPS, or other means. Use of built-in vehicle sensors, e.g. via the On-Board Diagnostics (OBD-II) connector, introduces uncertainty in terms of accuracy andcalibration, and was not pursued here in order to maximize portability between vehicletypes. GPS is also not an appropriate choice for the primary speed sensor in the appli-cation, as the satellite signals are blocked while passing through structures. However,structures are typically short (except for tunnels) and speed is generally constant duringthe scanning process, so simple interpolation of GPS-obtained speed before entering and
10

A Bridge-Height Sensing and Database Management System. . .
after leaving the structure can provide a fair estimate of speed through the structure, al-lowing GPS to act as a redundant speed sensor. Future work may include more advancedsensor integration via Kalman filtering.
Based on the application requirements and the limitations of built-in speed sensorsand GPS, a Doppler radar sensor, the Decatur SI-2, was selected as STRUCTVIEW’s pri-mary speed sensor. This sensor operates in the K-band (f0 = 24.150 GHz ± 50 MHz),with 0.21 rad (12o) beam width, and 10 mW nominal output power [8]. Sensor range is3 - 320 km/hr (2 - 200 mi/hr), with accuracy of ±0.1 km/hr. Doppler shift is approxi-mately fd = 45 Hz/(km/hr), or 72 Hz/(mi/hr). The fundamental relation for speed fromDoppler shift is [11]
vz(t) = − c
2 cos θss
(fd(t)
f0
)(3.1)
where c is the speed of light, θss is the angle between the horizontal (road) plane and thesensor centerline, and the negative sign is specific to the sensor mounting and choice ofz-axis (opposite of travel direction). The SI-2 configuration includes input of θss, and theRS-232 interface provides the derived speed in American Standard Code for InformationInterchange (ASCII) format. Sensor power (+12 V) is provided through the EIA serialcommunications standard (RS-232) DB9 connector.
3.4 GPS
STRUCTVIEW uses a GPS receiver [9] for structure identification and coordination withthe DOT’s Geographic Information System (GIS) database. The unit is a NovAtel SmartAntenna [21], an integrated antenna and GPS receiver board based on the Superstar IIchipset. This receiver provides 12-channel L1-frequency coarse acquisition (C/A) codesolution with better than 5 m Circular Error Probable (CEP) accuracy, and carrier phasetracking combined with the Wide Area Augmentation System (WAAS) for differentialcorrections to achieve better than 1.5 m CEP. This level of accuracy is more than sufficientfor the current application and avoids the need for a fixed base station, improving theportability and range of the structure profile assessment system.
The GPS receiver also provides redundant velocity sensing (0.05 m/s RMS) while en-tering and leaving the structure. The GPS unit provides position, velocity, and time (PVT)in National Marine Electronics Association GPS communications standard (NMEA-0183)format via an RS-232 serial interface. The output data (World Geodetic System 84 (WGS-84) global reference frame) includes latitude φ(t), longitude λ(t), and altitude or heighth(t), i.e., the distance from the WGS-84 ellipsoid.
By the very nature of GPS, this sensor is not available while traveling through thestructure. Given the functional requirements (structure identification / verification, andredundant velocity sensing at structure end points), this is not a problem in the currentapplication. Structure identification and verification requires only very coarse accuracyand a single-point reading (coordinated with the camera discussed below)—typically the
11
A Bridge-Height Sensing and Database Management System. . .
GPS accuracy greatly exceeds the GIS accuracy for structure records. Also, as the oper-ation is performed at near constant velocity, the speed readings from the GPS receiveron entering and leaving the structure can be interpolated effectively to provide redun-dant speed approximation while under the structure. The receiver reacquires the satellitesignals and navigation tracking quickly on leaving the structure. For system health andaccuracy validation, additional data is collected, including the number of visible satellitesand Horizontal Dilution of Precision (HDOP).
3.5 Human-Machine Interface (HMI)
The in-vehicle HMI is provided via a laptop computer. This choice was based primarilyon user preference as indicated in system design reviews with the DOT—in addition, thischoice provides flexibility for research, and allows the operators to perform data analysisin the field, if preferred. The laptop used is a 1.7 GHz Pentium mobile, with an ATI 9600graphics chipset.
Bi-directional communication between the sensing platform and the HMI is providedvia 802.11g (WiFi) [13]. This design decision greatly facilitated vehicle integration. Asa result, the only HMI connection that may be needed is to the vehicle’s standard 12-volt power adapter, and the sensing platform requires only standard trailer-hitch power.Hence, the total system is easily portable and can be installed on a wide range of vehicles.
3.6 Camera
For structure ID verification, STRUCTVIEW includes a forward-looking dash-mounteddigital still camera. The HMI controls the camera using the Canon Universal Serial Bus(USB) Application Programming Interface (API) [7], and transfers images back to the HMIdevice via the USB port. Currently, the camera is triggered via the Photo or Start buttonsin the HMI, and takes a single snapshot of the structure profile. The resulting Joint Pho-tographic Experts Group (JPEG) image is stored as part of the database for this structurescan. The camera subsystem is currently being updated to provide a series of images asthe support vehicle moves through the structure.
3.7 Computing, Power, and Communications
Power to the sensing platform is provided via a standard trailer hitch connection, againproviding portability and easy installation. The sensing platform power input is +12 voltDirect Current (DC), with internal conversion to provide all additional voltages. Thedevice control computer, based on a 1.2 GHz Intel Pentium 3 CPU, with 1 GB RAM, usesa direct DC supply, thus avoiding inverter inefficiencies. The laser sensor uses +5 V, the
12
A Bridge-Height Sensing and Database Management System. . .
GPS uses +12 V, and the ground speed radar uses +12 V. The camera and the HMI laptopare battery-powered, but can also use the in-vehicle 12 V supply if needed.
System communications between the HMI and the sensing computer is via 802.11gwireless [13]. Communications (data and control) between the HMI computer and the stilldigital camera is over a wired USB connection [7]. Communications within the sensingplatform is typically via RS-232, as noted in the detailed discussion for the hardwarecomponents.
13

A Bridge-Height Sensing and Database Management System. . .
14

Chapter 4
STRUCTVIEW Software
The STRUCTVIEW software components were written in C++ and built on Trolltech’sQtTM development framework. Initial development was carried out in a GNU’s NotUnix (GNU) / Linux environment, but Microsoft’s Windows XP R© was ultimately se-lected for production, primarily due to the availability of vendor-supplied drivers andSoftware Development Kits (SDKs) for some of the more proprietary hardware used inthe system. The software consists of two packages: the sensor application which runs onthe device controller, and the user application which runs on the HMI laptop.
4.1 Sensor Application
The sensor application runs on the device controller and serves as the interface to thesystem’s sensors, coordinating all control and data acquisition activities. At startup, itspawns a dedicated thread for each STRUCTVIEW sensor. Each thread is responsible forall configuration and data acquisition for its sensor, and is controlled by the applicationvia sockets and shared memory. While in its “ready” state, the sensor application waits forand responds to commands issued by the user application. Communication between thesensor platform and the user application on the HMI is by means of an HyperText Trans-fer Protocol (HTTP)-based protocol. During a sampling session, each thread initializesits sensor and begins to acquire and log data, time-stamping it for later synchronization.Sensor logs for the session are organized into a batch and tagged with a unique identi-fier. When the session is terminated, the batch is compressed and transferred to the userapplication.
4.2 User Application
The user application runs on the HMI laptop, handling all user interaction, includingconfiguring the system, performing and organizing sampling sessions, as well as the
15

A Bridge-Height Sensing and Database Management System. . .
subsequent visualization and analysis of acquired data. Sampling sessions can also beannotated with voice or text.
Based on prototype development and initial testing with end users, a simple button-based graphical interface was chosen; however, hot-keys are also available for expertusers. A key STRUCTVIEW requirement is the ability to rapidly cycle through the sam-pling process for closely-spaced structures. Structure spacing is sometimes on the orderof 0.4 km (0.25 mile), so at highway speed, there may be as little as 10 - 15 seconds be-tween sampling operations. This can be quite demanding on the user, and significantlyimpacted the design, driving the need for simplicity and efficient data handling.
After sampling is complete and data has been processed, the user application rendersa 3D view of the dataset. The user can then explore, manipulate, and measure a variety ofstructural features, including the vertical and horizontal clearances specified by AASHTOguidelines [1] and Federal requirements [20, 16]. Minimum vertical clearances are deter-mined above road edges and above each paint stripe, making paint stripe identificationan important feature recognition function. An example of such an operation is shown inFigure 4.1.
Figure 4.1: User application screenshot.
To support this functionality, the data recorded from each sampling operation passesthrough a preprocessing stage before the user can interact with it. First, the logs fromeach sensor (rangefinder/encoder, radar speed sensor, GPS) are parsed and any relevantcalibration is applied. These sensors produce data at different rates, so the timestampsrecorded during the sampling operation are then used to synchronize the three datastreams. The GPS and speed sensor streams are then merged into the much higher-raterangefinder stream through linear interpolation and resampling, producing a 50 kHz setof datapoints, each point of which contains data reflecting measurements from all threesensors.
Next, various filters are applied to these datapoints to remove noise and other arti-facts, including invalid range samples in the dead zone described above. Following this,the datapoints are mapped into a cylindrical coordinate system (r, θ, z) with z aligned
16

A Bridge-Height Sensing and Database Management System. . .
opposite the vehicle’s direction of travel (refer to Figure 2.3 on page 6). The r axis repre-sents the range of each point from the sensor, angle θ is derived from the discrete (0-4095)encoder value, and z is an approximation of the longitudinal location of the point fromequation (2.2). The origin is defined such that r = 0 is the location of the laser rangefinder,θ = 0 is horizontal toward the vehicle’s starboard, and z = 0 is set at the location of thelaser rangefinder at the instant of the first sample taken in the dataset. To enhance theperformance of subsequent processing, the points are also mapped into a Cartesian coor-dinate system. Both of these coordinate systems share the same origin and z axis. The xaxis of the Cartesian system is aligned with θ = 0.
Finally, the datapoints are organized into a time-ordered set of “cycle structures”, eachof which is itself a time-ordered set of datapoints collected during one full (2π rad) sweepof the beam. Arranging the data in this way allows the sample set to be quickly tra-versed for the detection and identification of features such as paint stripes, curbs andstructural and roadway surfaces (Figure 4.2). Without this arrangement there is only ageneral unordered point cloud, which would require use of computationally expensivesurface identification algorithms. For example, one of the tools offered by the user ap-plication allows for the interactive identification of paint stripes on the road surface. Todo this, the tool needs to be able to quickly traverse the set of datapoints representingthe road surface, searching for patterns in the returned signal amplitude that potentiallyfit the profile of a paint stripe. Using the cycle structures, a raster-like scan of the roadsurface can be performed by iterating, in order, through the datapoints in each cycle.
cycle N+2
search window
cycle N+1
cycle N
Si
Si+1
a
c
b
Figure 4.2: Close-up view illustrating paint stripe identification. The red points depictlaser range samples, and the search window is a heuristic device used in the detectionprocess.
One of the main requirements of the system is the ability to determine the minimumclearance of an overhead structure (e.g. a bridge) above the lanes on the road or abovethe paint stripes that divide them. Once the paint stripes and lanes have been identified as
17

A Bridge-Height Sensing and Database Management System. . .
c
bat Road
V
c~
b~a~t~
xz plane
StructureU
xz
y
Figure 4.3: Triangle ∆abc from a triangulated paint stripe is mapped into the xz planealong with candidate points U from the overhead structure and V from the road surface.Points in U and V whose corresponding mappings are found to be convex combinationsof (a, b, c) are known to project vertically through ∆abc. y-values from these points arethen used to determine the minimum vertical clearance above ∆abc.
discussed above, they are triangulated. The resulting set of triangles T = {ti | i ∈ N, i ≤ n},along with a set of candidate points U from the overhead structure and a set of candidatepoints V from the road surface1, is then orthographically projected onto the xz plane asshown in Figure 4.3. Now reduced to two dimensions, a point-triangle inclusion test (de-scribed below) is performed for each projected triangle ti ∈ T against all the points inprojected sets U and V . Since the point sets Ucc ⊆ U and Vcc ⊆ V which pass the ti inclu-sion test all lie in or on ti, it also holds that the vertical projections of those points’ corre-sponding preimages (in Ucc, Vcc) must pass through that triangle’s preimage, ti (in T ). Theminimum overhead clearance hi above the triangle ti is then calculated as the differencebetween the minimum y-value found among the points in Ucc and the maximum y-valuefound among the points in Vcc. This process is repeated for each ti ∈ T , and the lowestclearance value found is then considered to be the minimum overhead clearance along T :
MOHC(T ) = minhi. (4.1)
This technique is useful not only in determining minimum vertical clearances, but alsoanywhere the software needs to perform orthographic distance measurements betweensections of surfaces defined by point sets.
1U and V are the result of a coarse subdivision and culling procedure that separates overhead structurepoints from road surface points and eliminates most of the points that are not relevant to the clearancecalculations.
18

A Bridge-Height Sensing and Database Management System. . .
The 2D point-triangle inclusion test mentioned above is accomplished by consideringsome given point p as an affine combination of the points that define a triangle ∆abc:
p = λaa + λbb + λcc (4.2)
λa + λb + λc = 1 (4.3)
The linear system defined by (4.2) and (4.3) can be solved to yield the coefficients2 (λa, λb, λc),which can then be used to classify p’s relationship to ∆abc [23, 15]. One of the proper-ties of these coefficients is that if (and only if) they are all non-negative, then p lies on orwithin ∆abc, i.e.,
p ∈ ∆abc⇐⇒ λa, λb, λc ≥ 0. (4.4)
In other words, p is a convex combination of (a, b, c).
2These coefficients are commonly known as the barycentric coordinates of p with respect to ∆abc. Thecoefficients can be thought of as a coordinate system (barycentric space) for the plane defined by Tabc.
19

A Bridge-Height Sensing and Database Management System. . .
20

Chapter 5
Conclusions and Future Work
STRUCTVIEW provides a vehicle-based approach to obtaining structure profile measure-ments needed by DOTs for issuing permits based on vehicle height, as well as the hor-izontal dimensions needed by the military and Homeland Security. It allows sensingat highway speed, and yields a full 3D point cloud. The STRUCTVIEW user applicationsupports extraction of all the required structure profile dimensions in an efficient andcost-effective manner. STRUCTVIEW gets the Structures Maintenance workers off of theroadway and into a safe environment in the host vehicle. In addition, the sensing andanalysis workflow removes many of the opportunities for human error inherent in man-ual data collection and documentation. With the resulting improvement in the accuracyand timeliness of structure profile information and resulting oversize permitting, therewill be a lower probability of related bridge strikes, with associated cost, safety, and con-gestion benefits. Finally, as highway-speed sensing removes the need for fixed or rollinglane closures, the traveling public will not be impacted by the lane closures required bymost current approaches. In summary, STRUCTVIEW will enhance the overall mobility ofthe transportation system.
While STRUCTVIEW provides a significant advance in the state of the art for struc-ture profile assessment, there are areas for future work that are being investigated at theAHMCT Research Center. In the current incarnation, all system function is initiated bythe user via the HMI. It is desirable to automate some of the functionality further. Forexample, sampling could be initiated based on vehicle location using the GPS receiver.Conceptually, this is simple. In practice, based on discussions with the DOT, such an ap-proach is typically impractical to date, as the highway and structure location data in theexisting State GIS database is far too inaccurate to support this operating mode; however,the researchers and the DOT are considering improvements to the GIS data. Work is cur-rently in progress to automate generation of complete Caltrans format structure profilediagrams from the processed sensor data. Additional ruggedization and hardware im-provements are underway to increase the potential for deployment and field use of thesystem. Finally, additional improvements in noise reduction and surface recognition arerecommended to improve the reliability of the clearance measurement results, followedby additional detailed testing and evaluation by Caltrans.
21

A Bridge-Height Sensing and Database Management System. . .
22

References
[1] American Association of State Highway and Transportation Officials. Manual forCondition Evaluation of Bridges, 2nd edition, 2000.
[2] Mituhiko Araki and Koichiro Yamamoto. Multivariable multirate sampled-data sys-tems: State-space description, transfer characteristics, and Nyquist criterion. IEEETransactions on Automatic Control, AC-31(2):145–154, February 1986.
[3] W Boehler and A Marbs. 3D scanning instruments. In CIPA Heritage Documen-tation, International Workshop on Scanning for Cultural Heritage Recording, pages 9–12, Corfu, Greece, September 2002. URL http://www.i3mainz.fh-mainz.de/publicat/korfu/p05_Boehler.pdf.
[4] W Boehler, G Heinz, A Marbs, and M Siebold. 3D scanning software: An in-troduction. In CIPA Heritage Documentation, International Workshop on Scanning forCultural Heritage Recording, pages 47–51, Corfu, Greece, September 2002. URLhttp://www.i3mainz.fh-mainz.de/publicat/korfu/p11_Boehler.pdf.
[5] W Boehler, M Bordas Vicent, and A Marbs. Investigating laser scan-ner accuracy. In XIXth CIPA Symposium, Antalya, Turkey, September2003. URL http://www.i3mainz.fh-mainz.de/publicat/cipa2003/laserscanner_accuracy.pdf.
[6] California Department of Transportation. Area Bridge Maintenance Engineer(ABME) structure maintenance procedures. Technical report, Business, Transporta-tion and Housing Agency, January 1995.
[7] Canon USA. Canon developer support site, 2005. URL www.developersupport.canon.com.
[8] Decatur Electronics, Inc. Speed interface, SI-2 (regular speed), October 2002. URLwww.decaturradar.com.
[9] Alan G. Evans, Robert W. Hill, Geoffrey Blewitt, Everett R. Swift, Thomas P. Yunck,Ron Hatch, Stephen M. Lichten, Stephen Malys, John Bossler, and James P. Cunning-ham. The Global Positioning System geodesy odyssey. ION Journal of Navigation, 49(1):7–33, 2002.
23

A Bridge-Height Sensing and Database Management System. . .
[10] FHWA Turner-Fairbanks Highway Research Center. Research & technology trans-porter on-line: Overpass height measuring goes high tech, September 1997. URLwww.tfhrc.gov/trnsptr/rttsep97/tr997p8.htm.
[11] GMH Engineering. Application note 1000: Fundamentals of non-contact speed mea-surement using Doppler radar, 2003. URL www.gmheng.com/pdf/an1000.pdf.
[12] InnovMetric Software Inc. PolyWorks for 3D digitizer and 3D scanner, 2005. URLwww.innovmetric.com/Surveying/english/home.html.
[13] Institute of Electrical and Electronics Engineers Inc. IEEE std 802.11g: Wireless LANMedium Access Control (MAC) and Physical Layer (PHY) specifications: Furtherhigher-speed physical layer extension in the 2.4 GHz band, 2003.
[14] Edward J. Jaselskis, Zhili Gao, Alice Welch, and Dennis O’Brien. Pilot study onlaser scanning technology for transportation projects. In Mid-Continent TransportationResearch Symposium, Ames, Iowa, 2003.
[15] Juan Jose Jimenez, Rafael J. Segura, and Francisco R. Feito. Efficient collision detec-tion between 2D polygons. Journal of WSCG, 12(1–3):191–198, 2004.
[16] David Keever and Julie Soutuyo. Coordinating military deployments on roads andhighways: A guide for state and local agencies (Chapter 3: Typical military de-ployment movements on public roads). Technical Report FHWA-HOP-05-029, U.S.Department of Transportation Federal Highway Administration, May 2005. URLwww.ops.fhwa.dot.gov/OpsSecurity/dev-mx/index.htm#toc.
[17] Robert G. Lauzon. Automated vertical clearance measurement during photolog op-erations. Technical Report 2220-F-2000-4, Connecticut Department of Transportation,Bureau of Engineering and Highway Operations, Division of Research, September2000.
[18] Leica Geosystems. Cyclone software - where it all “comes together”,2005. URL http://www.leica-geosystems.com/corporate/en/ndef/lgs_3490.htm.
[19] W. Mystkowski and J.L. Schulz. Development and use of a laser-based roadwayclearance measurement system. In Proceedings of TRB 8th International Bridge Man-agement Conference, pages B–11/1–B–11/9, 1999.
[20] Louis G. Neudorff, Jeffrey E. Randall, Robert Reiss, and Robert Gordon. Freewaymanagement and operations handbook: Final report (Chapter 12: Freeway man-agement during emergencies and evacuations). Technical Report FHWA-OP-04-003, U.S. Department of Transportation Federal Highway Administration, Septem-ber 2003. URL http://ops.fhwa.dot.gov/freewaymgmt/freeway_mgmt_handbook/toc.htm.
[21] NovAtel, Inc. Novatel’s smart antenna, 2005. URL www.novatel.ca/Documents/Papers/SMRT_ant.pdf.
24

A Bridge-Height Sensing and Database Management System. . .
[22] Optech Incorporated. Field notes, civil engineering: Bridge deflection analysis, 2002.URL www.innovmetric.com/Surveying/english/pdf/optech.pdf.
[23] Joseph O’Rourke. Computational Geometry in C. Cambridge University Press, 1998.
[24] Schmitt Measurement Systems, Inc. Acuity AR4000 laser rangefinder equipmentoverview, 2005. URL www.acuityresearch.com/products/ar4000/index.shtml.
[25] Russ L. Tamblyn. Viable viaducts, February 2004. URL www.innovmetric.com/Surveying/english/pdf/viaducts.pdf. Point of Beginning.
[26] Trimble. RealWorks Survey, 2005. URL www.trimble.com/realworks.shtml.
25

A Bridge-Height Sensing and Database Management System. . .
26