a. bosotti, r. paparella, f. puricelli
TRANSCRIPT

PI piezo Life Time Test Report
A. Bosotti, R. Paparella, F. Puricelli

2
1. Introduction..................................................................................................................................3
1.1. Vacuum ................................................................................................................................4 1.2. Temperature .........................................................................................................................4 1.3. Preload .................................................................................................................................4 1.4. Driving signal.......................................................................................................................4
2. General features and conceptual scheme .....................................................................................6 2.1. Experimental setup...............................................................................................................6
2.1.1. The vertical cryostat.....................................................................................................6 2.1.2. The insert......................................................................................................................7 2.1.3. The piezoelectric actuator ............................................................................................8 2.1.4. The test setup ...............................................................................................................9
2.2. Main features of the test.....................................................................................................11 3. Test results .................................................................................................................................12
3.1. Vacuum ...................................................................................................................................12 3.2. Temperature ............................................................................................................................12 3.3. LN2 Evaporation .....................................................................................................................13 3.4. Load ........................................................................................................................................14 3.5. Piezo behavior.........................................................................................................................14
3.5.1. Electrical capacitance.......................................................................................................15 3.5.2. Anti-Resonance Frequency ..............................................................................................15 3.5.3. Hysteresis figure and max stroke .....................................................................................16
4. Conclusions................................................................................................................................17 5. Appendix: schedule and run-time adjustments ..........................................................................18

3
1. Introduction The purpose of this test is to investigate the behavior of piezoelectric ceramics in condition equivalent to 10 years of operation as actuator in active frequency tuner for ILC superconducting cavities (SC). To do this a Physik Instrumente PI P-888.90 PIC255 piezoelectric ceramic has been cooled down in LN2 and has been excited uninterruptedly for a month up to its limits, sustaining about 1.5 109 cycles of switching, up to nearly the maximum stroke, a good estimate of ten years as actuator for ILC cavities. The piezo is a good representative of the kind of ceramic to be used in active tuners at cryogenic temperatures. So even if this model will not be the final choice, the device to be used will not be substantially different from it for what concern the major characteristic of the ceramic (in the UMI tuner will be probably used a different actuator, with higher stroke and blocking force, but with ceramic properties close to the PI item). During the test the piezo temperature and current were constantly monitored and, in order to emulate the working condition in the tuner, four parameters were considered:
- vacuum - temperature - preload - driving signal
Some approximations were introduced for each one, mainly to overcome actual technical difficulties. They will be now discussed in detail.

4
1.1. Vacuum The actuator, once installed, will operate inside the cryomodule in a region where an isolation vacuum has been made. The vacuum is necessary to avoid freezing of humidity on electric contacts making short circuits, and doesn’t affect the piezo-ceramic behavior. The isolation vacuum will be granted in the chamber that hosts the piezo by a rotary pump. The pressure values will be reported in the following sections.
1.2. Temperature In the actual cryogenic environment, the actuator is not placed in super fluid helium bath and so, considering that the tuner is installed under the 4K shield, the actuator temperature should be lying in a range from 2 to 4 K. Because the lifetime test means a long period of cool down in vertical cryostat, using LHe would be very expensive. So, considering that the mechanical stresses for a ceramic are quite the same at 4K and at 77K, we have chosen to perform the lifetime test in LN2 bath. Moreover, due to the liquid nitrogen higher thermal capacity, less refilling were needed, simplifying the test procedure.
1.3. Preload It is widely proved that the correct value of preload grants a longer lifetime for this kind of piezoelectric actuators. For what concerns piezo theory, literature shows different values for the optimum preload, ranging from 20 to 50 percent of the maximum generated force value (i.e. blocking force). We therefore use for this test an equipment capable of generating a known force on the piezo acting via a steel rod (see next chapter for details). We choose, as a guideline, to keep the preload limited to 1 – 1.5 kN, with a reference value of 1.2 kN. This is also a reasonable estimation of the value expected for the actual system, where the actuator will receive the main part of its preload from the thermally shrunk cavity, acting as a spring load.
1.4. Driving signal The main contribution to the actuator-driving signal, once installed, will be due to the need to compensate Lorentz Force Detuning with a feed-forward loop, driving the piezoelectric actuator with a signal that will be approximately as long as the whole RF pulse, i.e. 1.3 ms for TTF, at a repetition rate up to 10 Hz. While the exact shape of the signal needs to be finely developed in the real machine, we choose to keep the pulse duration, while switching to use a sinusoidal waveform. Finally, in order to reach quickly the wanted number of cycles count, the frequency of the signal was shifted up (in three steps) to 997 Hz (about 1 ms period, less time to complete 1.5 109 cycles).

5
The choice for an odd value grants the possibility to have phase-locked measurements without interfering power supply noise. Regarding the voltage amplitude of the signal, a full range operation is usually not recommendable but in the real system high stroke will be required. Balancing these factors the amplitude was at the end limited to 10% - 90% of the maximum applicable voltage sweep.

6
2. General features and conceptual scheme The facility for the lifetime test has been developed starting from the devices already in use at LASA laboratory for piezo and load cell characterization. Main elements will be now introduced in details.
2.1. Experimental setup
2.1.1. The vertical cryostat The test was hosted by a vertical cryostat from Criotec. Picture, scheme and its main features follow.
Fig. 1. The vertical cryostat used for our tests (right) and its technical drawing (left)
Low Temperature Piezo Low Temperature Piezoeffect, Tieftemperatur Piezoeffekt Piezoaktorik Piezo Aktor Piezomechanics Piezomechanik, Piezo Aktor Multilayer Low Temperature Piezo Piezo actuators, Lifetime
7
Table 1. Main features of our vertical cryostat
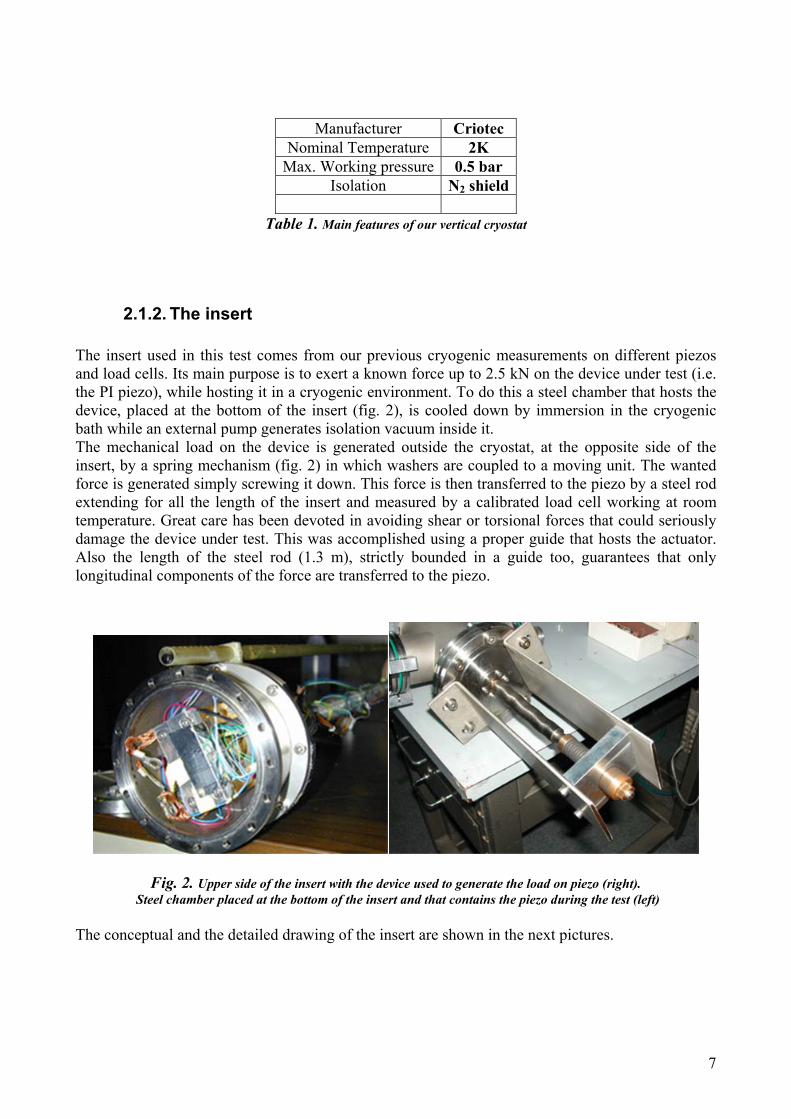
2.1.2. The insert The insert used in this test comes from our previous cryogenic measurements on different piezos and load cells. Its main purpose is to exert a known force up to 2.5 kN on the device under test (i.e. the PI piezo), while hosting it in a cryogenic environment. To do this a steel chamber that hosts the device, placed at the bottom of the insert (fig. 2), is cooled down by immersion in the cryogenic bath while an external pump generates isolation vacuum inside it. The mechanical load on the device is generated outside the cryostat, at the opposite side of the insert, by a spring mechanism (fig. 2) in which washers are coupled to a moving unit. The wanted force is generated simply screwing it down. This force is then transferred to the piezo by a steel rod extending for all the length of the insert and measured by a calibrated load cell working at room temperature. Great care has been devoted in avoiding shear or torsional forces that could seriously damage the device under test. This was accomplished using a proper guide that hosts the actuator. Also the length of the steel rod (1.3 m), strictly bounded in a guide too, guarantees that only longitudinal components of the force are transferred to the piezo.
Fig. 2. Upper side of the insert with the device used to generate the load on piezo (right). Steel chamber placed at the bottom of the insert and that contains the piezo during the test (left)
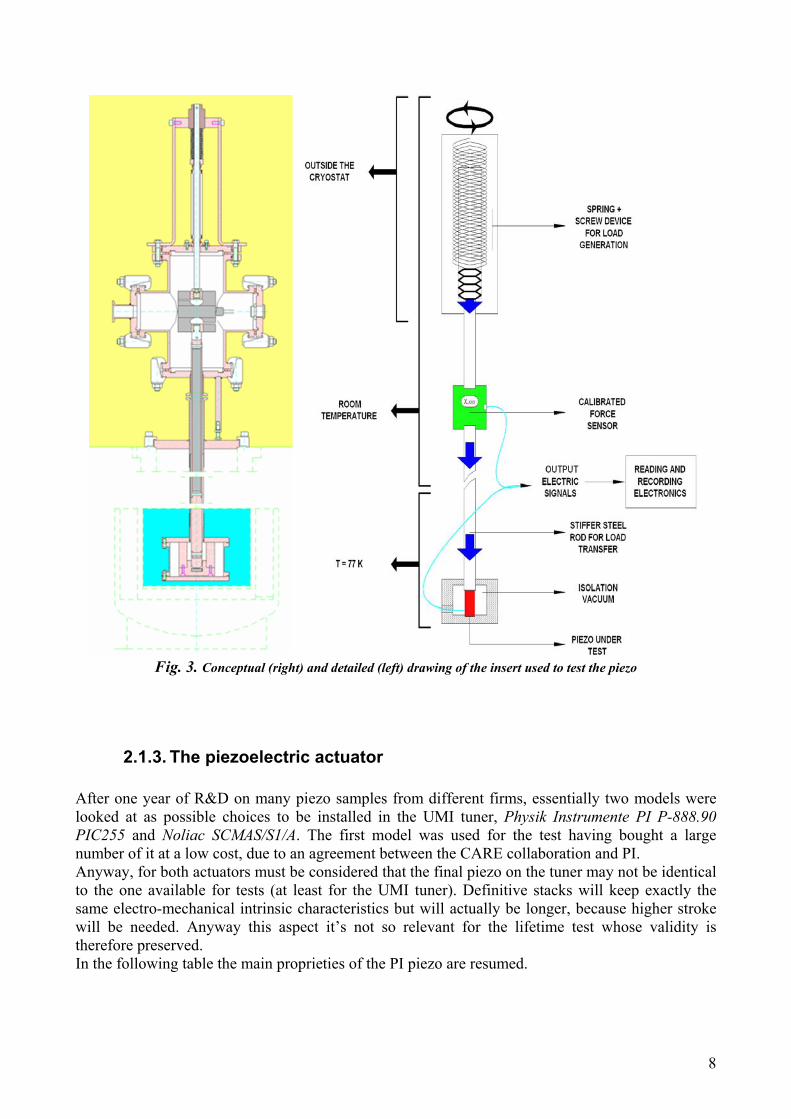
The conceptual and the detailed drawing of the insert are shown in the next pictures.
Manufacturer Criotec Nominal Temperature 2K
Max. Working pressure 0.5 bar Isolation N2 shield
8
Fig. 3. Conceptual (right) and detailed (left) drawing of the insert used to test the piezo
2.1.3. The piezoelectric actuator After one year of R&D on many piezo samples from different firms, essentially two models were looked at as possible choices to be installed in the UMI tuner, Physik Instrumente PI P-888.90 PIC255 and Noliac SCMAS/S1/A. The first model was used for the test having bought a large number of it at a low cost, due to an agreement between the CARE collaboration and PI. Anyway, for both actuators must be considered that the final piezo on the tuner may not be identical to the one available for tests (at least for the UMI tuner). Definitive stacks will keep exactly the same electro-mechanical intrinsic characteristics but will actually be longer, because higher stroke will be needed. Anyway this aspect it’s not so relevant for the lifetime test whose validity is therefore preserved. In the following table the main proprieties of the PI piezo are resumed.

Piezoaktorik Tieftemperatur-Piezo Effekt Low Temperature Piezo Low Temperature Piezo effect, PiezoAktoren PiezoAktor Piezomechanic Piezomechanik, Multilayer Low-Temperature Piezo Piezo actuators, Long-Life Piezos
9
PROPERTIES PI P-888.90 Unit
Material PZT-PIC 255 Case/preload No
Length 36 mm Cross section 100 mm2
Young modulus 48,3 kN/mm2 Stiffness 0,105 kN/um
Max. stroke 35 µm Blocking force 3600 N
Res. frequency @ no load 40 kHz Density 7,8 x 10³ kg/m3
Min. voltage -20 V Max. voltage 120 V
Capacity - nominal 12,4 µF Capacity - measured 13,6 µF
Loss Factor 0,015 Tanδ Table 2. Main features and parameters of the tested piezo
2.1.4. The test setup The whole setup of the test facility has been designed in order to acquire different simultaneous measurements:
- setup status: -temperature outside the insert -isolation vacuum pressure
- piezo status: -drive current flow -drive voltage -generated force -temperature - ancillaries: -load to piezo -liquid to gas N2 total evaporate Here follows the scheme of the complete test facility, as it was set when the test started. Not reported in the scheme of figure 4, a standard flux meter was connected to the cryostat in order to have a measure of the liquid N2 evaporation, flowing outside the cryostat. Both the inner chamber and the outer N2 shield of the cryostat were connected to the counter so the flux measured results from the sum of the two.

10
Fig. 4. Complete scheme of the experimental apparatus

11
2.2. Main features of the test As previously mentioned, the goal of the test was to achieve 1.5 109 working cycles for the piezo under test. During run time, the test required continuous adjustments, mainly in order to refill the cryogenic liquid and keep the exerted force value close to the average value chosen. In order to avoid unwanted damage to piezo due to high current flow, the frequency of the driving signal was increased slowly and in 3 steps, in this way a more accurate check was possible. Basics layout of the test has been resumed in the following table 3. Detailed results are finally showed in the following chapter (Paragraph 3).
Start 26 Nov 2004 Stop 20 Dec 2004
Hours 622 Cycles 1.505 109
Frequency 117 Hz for 4 days 497 Hz for 6 days 997 Hz for 16 days
Average Preload 1.25 kN Average Temperature 81 K
Table 3. Main features of the life time test
12
3. Test results In the next paragraphs we discuss in detail the experimental data obtained from the test.
3.1. Vacuum As we have already said in paragraph 1.1 a rotary pump granted the vacuum condition. The pressure inside the piezo box was measured by a Pirani sensor and its value has been stable at about 2x10⁻³ mbar for all the test time.
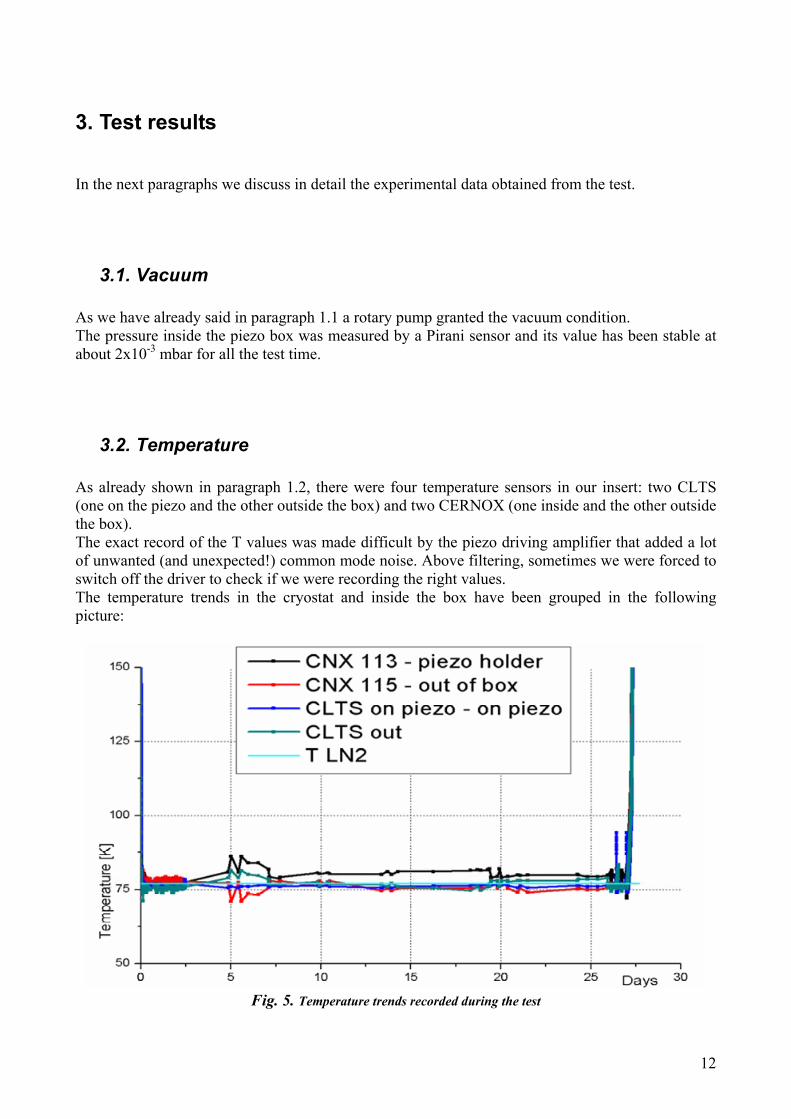
3.2. Temperature As already shown in paragraph 1.2, there were four temperature sensors in our insert: two CLTS (one on the piezo and the other outside the box) and two CERNOX (one inside and the other outside the box). The exact record of the T values was made difficult by the piezo driving amplifier that added a lot of unwanted (and unexpected!) common mode noise. Above filtering, sometimes we were forced to switch off the driver to check if we were recording the right values. The temperature trends in the cryostat and inside the box have been grouped in the following picture:
Fig. 5. Temperature trends recorded during the test

13
From the figure above, one can see that all temperatures have been quite stable for all the test duration: variations are small and are mainly due to the LN2 low level in the cryostat just before we refill it. This last consideration is evident because the CLTS on piezo, which was the less sensitive to this phenomenon, is the most stable and presents an average value at about 80K. Even due to the high heat capacity of LN2 and good DUT thermal equilibrium, no critical self-heating was recorded.
3.3. LN2 Evaporation The LN2 evaporation rate measurements were made with a standard flux meter; in particular the instrument counter was reset at every refilling of the cryostat (to normalize every measure). Obtained data are shown in fig. 6:
Fig. 6. LN2 evaporation trend
We observe that our graph doesn’t have the asymptotic trend that one could expect. This is due to the fact that such behavior is evident only for longer times: our interpolating function has to be considered as an approximation of the real trend for very short times.

14
3.4. Load The historical graph of the applied preload on the piezo is shown in the figure
Fig. 7. Load applied to the piezo during the test
The saw-tooth shape is due to mechanical relaxations and successive readjustment of the piezo preload. During test the average preload on test was about 128 kg (1.25 kN).
3.5. Piezo behavior The lifetime test was performed not only to see long times piezo failures, but also to check any variation of piezo main parameters after ten years of stresses. So before and after test the following parameters were measured at room temperature:
• electrical capacitance • resonance frequency • hysteresis figure • maximum stroke.

15
3.5.1. Electrical capacitance The electrical capacitance has been measured for the unloaded piezo with a test bench capacitance meter. The values obtained are:
BEFORE TEST AFTER TEST 13.6 µF 13.56 µF
Table 4. Electrical piezo capacitance measured before and after the life time test
3.5.2. Anti-Resonance Frequency Also in this case we measured the resonance frequency for the unloaded piezo. The circuit analysis was then made with a Standford Research Signal Analyzer SR785: the piezo was connected to form a voltage divider with a resistor as is shown in figure 8.
Resistor
piezoactuator
Vpiezo
The final resultis Zpiezo(s)
SR785 signal analyzer
sourceout
signalin
Fig. 8. Circuit scheme used to calculate the piezo impedance
The instrument is used in the network analysis mode: amplitude and phase are recorded. The piezo
impedance can be calculated from the relation )(1
)(sG
sGR−
, where )()(
)(sVsV
sGin
piezo= .
Our results are shown in the following table:
BEFORE TEST AFTER TEST 45.94 kHz 45.2 kHz
Table 5. Piezo anti-resonance frequency comparison
16
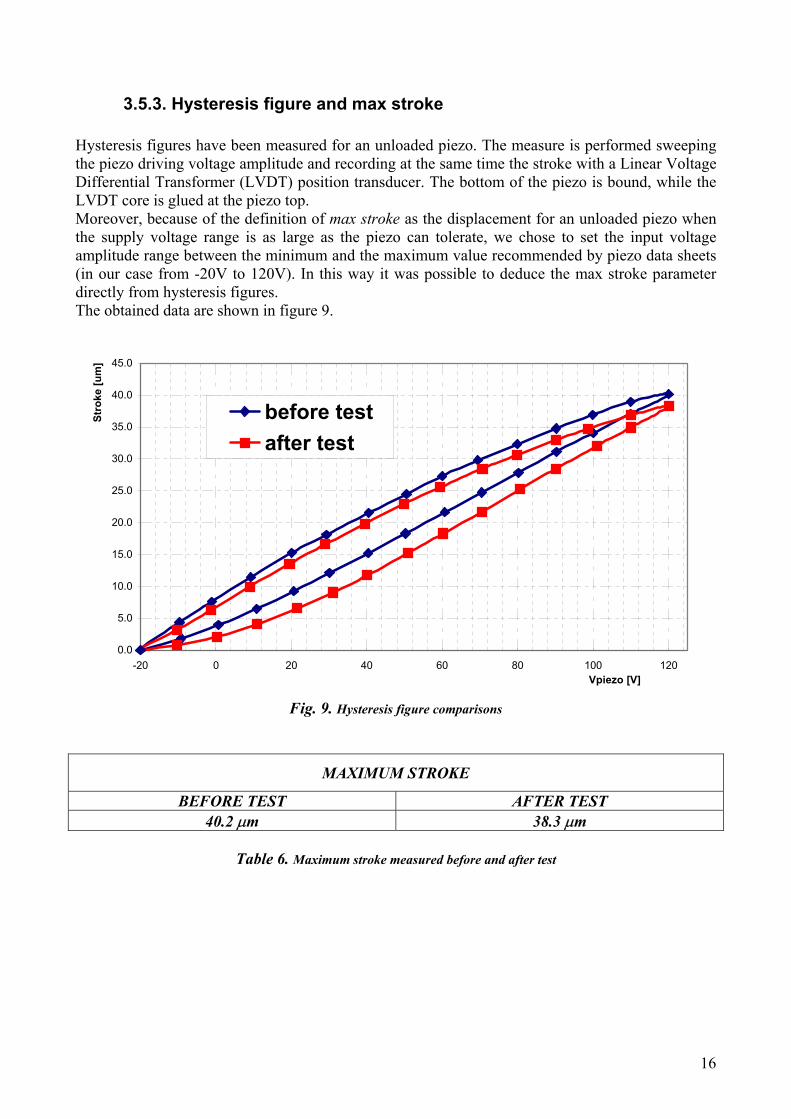
3.5.3. Hysteresis figure and max stroke Hysteresis figures have been measured for an unloaded piezo. The measure is performed sweeping the piezo driving voltage amplitude and recording at the same time the stroke with a Linear Voltage Differential Transformer (LVDT) position transducer. The bottom of the piezo is bound, while the LVDT core is glued at the piezo top. Moreover, because of the definition of max stroke as the displacement for an unloaded piezo when the supply voltage range is as large as the piezo can tolerate, we chose to set the input voltage amplitude range between the minimum and the maximum value recommended by piezo data sheets (in our case from -20V to 120V). In this way it was possible to deduce the max stroke parameter directly from hysteresis figures. The obtained data are shown in figure 9.
0.0
5.0
10.0
15.0
20.0
25.0
30.0
35.0
40.0
45.0
-20 0 20 40 60 80 100 120Vpiezo [V]
Stro
ke [u
m]
before testafter test
Fig. 9. Hysteresis figure comparisons
MAXIMUM STROKE
BEFORE TEST AFTER TEST 40.2 µm 38.3 µm
Table 6. Maximum stroke measured before and after test

17
4. Conclusions After one month of operation in LN2 environment in extreme conditions, the equivalent of ten years of switching in ILC active tuning systems, the piezo is still working. Data and graphs exposed in paragraph 3, show that the piezo under test doesn’t have any significant variation both of electrical (capacity and resonance frequency), mechanical (max stroke) and electromechanical properties (hysteresis figure). Therefore, from this point of view, we can expect that the actuator has enough lifetime for ILC operation, provided to avoid any stresses in directions different from the longitudinal one. About this we are going to do some comments:
• our experiment has been made in an environment that is quite different from the one that will be in the accelerator. In fact while the test pressure is a good approximation of the cryomodule condition, this is not true for what concerns the temperature, (see paragraph 1.2). Anyway mechanical strains and stresses on piezo produced by the cryogenic environment are about the same at 77K and 4K.
• Even if this actuator will not be placed in the UMI tuner, a similar one will be employed. So this test has also validity for this case.

18
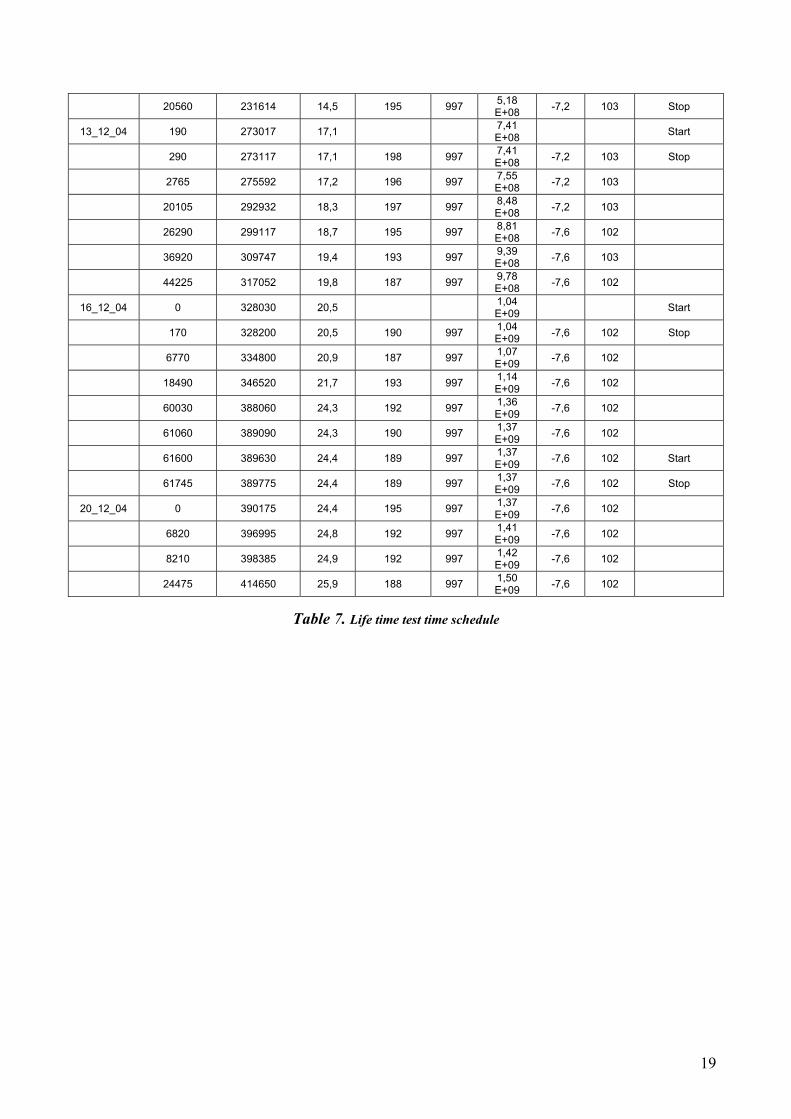
5. Appendix: schedule and run-time adjustments During the 26 days of the test no critical element arise, just the ordinary maintenance was needed. It is now reported (table 7) an extract of the log diary of the test. Log file Relative
sample Absolute sample Time Current
to piezo Freq. Cycles Vmin Vmax LN2 refuellings
[Days] [mA] rms [Hz] [Volt] [Volt]
26_11_04
(I part) 640 640 0,0 117 4,04 E+05 0 100
42000 42000 2,6 32 117 2,65 E+07 0 100
44840 44840 2,8 32 117 2,83 E+07 0 100
59950 59950 3,7 32 117 3,79 E+07 0 100
60160 60160 3,8 33 117 3,80 E+07 0 100
61060 61060 3,8 33 117 3,86 E+07 0 100 Start
61390 61390 3,8 33 117 3,88 E+07 0 100 Stop
62230 62230 3,9 35 117 3,93 E+07 0 100
26_11_04 (II part) 77540 77540 4,8 117 487 4,90
E+07 0 100
77733 77733 4,9 120 487 4,95 E+07 0 100 Start
77870 77870 4,9 120 487 4,99 E+07 0 100 Stop
80342 80342 5,0 119 497 5,64 E+07 -6 102
95490 95490 6,0 118 497 9,70 E+07 -5,6 102
98050 98050 6,1 114 497 1,04 E+08 -5,6 102
113120 113120 7,1 119 497 1,44 E+08 -5,6 102
113530 113530 7,1 117 497 1,45 E+08 -5,6 102
3_12_04 (I part) 1710 115261 7,2 122 497 1,50
E+08 -5,6 102 Start
1985 115536 7,2 125 497 1,51 E+08 -5,6 102 Stop
43690 157241 9,8 120 497 2,63 E+08 -5,6 102 Start
44570 158121 9,9 120 497 2,65 E+08 -5,6 102 Stop
45160 158711 9,9 119 497 2,67 E+08 -4,4 107
3_12_04 (II part) 55450 169001 10,6 123 497 2,94
E+08 -4,4 107
9_12_04 0 211054 13,2 189 997 4,07 E+08 -7,2 103 Start
180 211234 13,2 189 997 4,08 E+08 -7,2 103 Stop
2720 213774 13,4 189 997 4,22 E+08 -7,2 103
8295 219349 13,7 195 997 4,52 E+08 -7,2 103
20250 231304 14,5 193 997 5,16 E+08 -7,2 103 Start
19
20560 231614 14,5 195 997 5,18 E+08 -7,2 103 Stop
13_12_04 190 273017 17,1 7,41 E+08 Start
290 273117 17,1 198 997 7,41 E+08 -7,2 103 Stop
2765 275592 17,2 196 997 7,55 E+08 -7,2 103
20105 292932 18,3 197 997 8,48 E+08 -7,2 103
26290 299117 18,7 195 997 8,81 E+08 -7,6 102
36920 309747 19,4 193 997 9,39 E+08 -7,6 103
44225 317052 19,8 187 997 9,78 E+08 -7,6 102
16_12_04 0 328030 20,5 1,04 E+09 Start
170 328200 20,5 190 997 1,04 E+09 -7,6 102 Stop
6770 334800 20,9 187 997 1,07 E+09 -7,6 102
18490 346520 21,7 193 997 1,14 E+09 -7,6 102
60030 388060 24,3 192 997 1,36 E+09 -7,6 102
61060 389090 24,3 190 997 1,37 E+09 -7,6 102
61600 389630 24,4 189 997 1,37 E+09 -7,6 102 Start
61745 389775 24,4 189 997 1,37 E+09 -7,6 102 Stop
20_12_04 0 390175 24,4 195 997 1,37 E+09 -7,6 102
6820 396995 24,8 192 997 1,41 E+09 -7,6 102
8210 398385 24,9 192 997 1,42 E+09 -7,6 102
24475 414650 25,9 188 997 1,50 E+09 -7,6 102
Table 7. Life time test time schedule