a bold and global wealth and asset management
TRANSCRIPT

Global Wealth and Asset Management
Paul Lorentz, President and CEO, Manulife Investment Management
June 29, 2021
Unlocking the next stage of growth

Agenda
2
• Overview of Manulife Investment
Management (MIM)
• Strong track record of execution
• A clear path for growth

Key Messages
3
• Manulife Investment Management is a primary growth engine for Manulife
• Our insurance heritage gives us a competitive advantage versus stand alone
wealth and asset management businesses
• Diversified business with global presence and scale across three business lines
• Strong track record of operating results over the last five years and demonstrated
resilience throughout the global pandemic
• Delivered positive net flows in ten of the past eleven years, supported by
solid investment performance
• A clear path for future growth and uniquely positioned to capitalize on emerging
global trends
Note: Past performance cannot guarantee future performance.

4
Overview of
Manulife
Investment
Management

Manulife Investment Management has a global presence across three business lines, providing investors with
local insights on a global scale
5
1 Assets under management and administration (AUMA) as of March 31, 2021. AUMA is a Non-GAAP measure. See slide entitled “Performance and Non-GAAP Measures” in 2021 Investor Day Legal Slides. 2 Offices in the U.S., Canada, Japan, Hong Kong,
Singapore, Taiwan, Indonesia, Vietnam, Malaysia, India, the Philippines, England, Ireland, Switzerland and China. In addition, we have timberland/farmland offices in Australia, New Zealand and Chile. 3 Source: Pensions & Investments Money Managers 2020
Survey, released May 2021. 4 As of December 31, 2020.
AUMA1
Retirement
Retail
Institutional
27 thlargest money manager
globally3
Over
100year history in Canada, Asia
and the U.S.4
18geographies globally2,4
~14Mcustomers globally4
C$764B
Global market leader
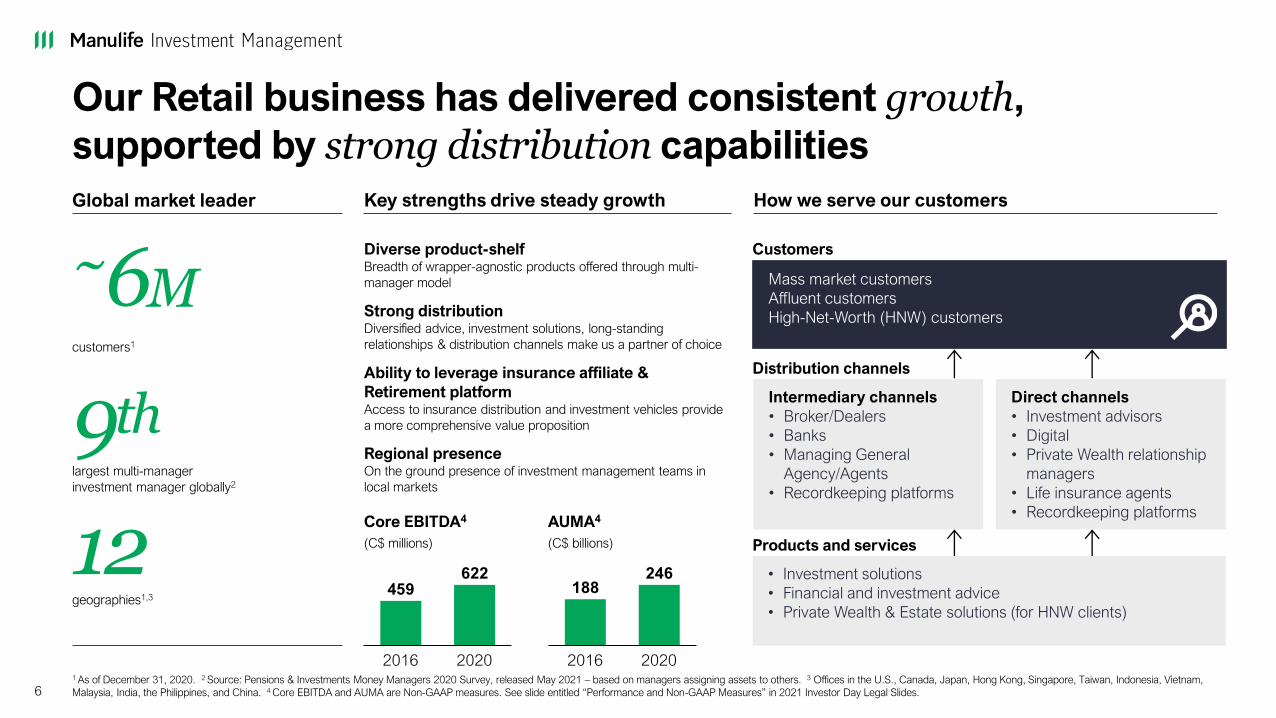
Our Retail business has delivered consistent growth,
supported by strong distribution capabilities
61 As of December 31, 2020. 2 Source: Pensions & Investments Money Managers 2020 Survey, released May 2021 – based on managers assigning assets to others. 3 Offices in the U.S., Canada, Japan, Hong Kong, Singapore, Taiwan, Indonesia, Vietnam,
Malaysia, India, the Philippines, and China. 4 Core EBITDA and AUMA are Non-GAAP measures. See slide entitled “Performance and Non-GAAP Measures” in 2021 Investor Day Legal Slides.
Diverse product-shelfBreadth of wrapper-agnostic products offered through multi-
manager model
Strong distributionDiversified advice, investment solutions, long-standing
relationships & distribution channels make us a partner of choice
Ability to leverage insurance affiliate &
Retirement platformAccess to insurance distribution and investment vehicles provide
a more comprehensive value proposition
Regional presenceOn the ground presence of investment management teams in
local markets
Customers~6Mcustomers1
9thlargest multi-manager
investment manager globally2
12geographies1,3
Key strengths drive steady growth How we serve our customers
622459
2016 2020
188246
2016 2020
Mass market customers
Affluent customers
High-Net-Worth (HNW) customers
Distribution channels
Intermediary channels
• Broker/Dealers
• Banks
• Managing General
Agency/Agents
• Recordkeeping platforms
Direct channels
• Investment advisors
• Digital
• Private Wealth relationship
managers
• Life insurance agents
• Recordkeeping platforms
Products and services
Core EBITDA4
(C$ millions)
AUMA4
(C$ billions)
• Investment solutions
• Financial and investment advice
• Private Wealth & Estate solutions (for HNW clients)

Global market leader
We have a leading global Retirement business,
with significant growth potential
71 As of December 31, 2020. 2 Internal calculation, based on assets under management (AUM) as at December 2019. 3 Offices in the U.S., Canada, Hong Kong, Indonesia and Malaysia. 4 Core EBITDA and AUMA are Non-GAAP measures. See slide entitled
“Performance and Non-GAAP Measures” in 2021 Investor Day Legal Slides. 5 Rollover individuals represent plan participants who leave sponsor plans due to early exit or retirement from current employer.
Trusted brand & strong market positionProvides peace of mind to our customers & helps to advance
conversation as being best-in-class solution provider
Diverse capabilitiesAbility to leverage platform to provide wide range of products,
investment solutions and advice
Ability to leverage insurance agents in AsiaAccess to agents’ client base, allows us to reach more customers
Deeper connections with high-touch supportDedicated relationship management teams & member services
Global scaleAbility to leverage global scale across markets, as well as
integrate our investment solutions, enhances value proposition
~8Mcustomers1
8thlargest global Defined Contribution
plan provider2
5geographies1,3
Key strengths drive steady growth How we serve our customers
7311 009
20202016
286397
2016 2020
• Financial and investment advice
• Investment solutions
• Recordkeeping services
Customers
Distribution channels
Products and services
Plan participants
Plan sponsors
Rollover individuals5
Intermediary channels
• Financial advisors
• Third party administrators
• Consultants/Brokers
Direct channels
• Rollover advisory services
• Life insurance agents
Core EBITDA4
(C$ millions)
AUMA4
(C$ billions)

Growing Institutional Asset Management presence backed by
a deep history of managing assets over a long-time horizon
Global market leader
8
1 Source: Pensions & Investments Money Managers 2020 Survey, released May 2021. 2 AUM as of December 31, 2020. Assets managed by Hancock Natural Resource Group. 3 Offices in the U.S., Canada, Japan, Hong Kong, Singapore, Taiwan, Indonesia,
Vietnam, Malaysia, India, the Philippines, England, Ireland, Switzerland and China. In addition, we have timberland/farmland offices in Australia, New Zealand and Chile. As of December 31, 2020. 4 Recognized in the PRI Leaders Group 2020. 5 Core EBITDA
and AUMA are Non-GAAP measures. See slide entitled “Performance and Non-GAAP Measures” in 2021 Investor Day Legal Slides.
Investment expertiseBroad range of global investment capabilities with significant
tenure across asset classes, and ‘boots on the ground’ locally3
Commitment to sustainable investing & ESGRecognized as a leader in ESG investing across public
and private markets4
Access to parent’s balance sheetAllows for development of new capabilities using seed capital,
and potential to invest General Account assets alongside
third-party investors
Global scaleDevelop investment products at scale to distribute across global
Retail, Retirement and Institutional channels
46thlargest Institutional money manager
globally1
US$10.6Bof timberland assets managed globally for
institutional investors, making us the world’s
largest timberland manager2
18geographies3
Key strengths drive steady growth How we serve our customers
19
45
2016 2020
80110
20202016
• Investment capabilities across public and private asset classes
• Outcome-oriented solutions
Customers
Distribution channels
Products and services
Pension plans Financial institutions
Endowments Foundations
Sovereign Wealth Funds
Intermediary channels
• Consultants
• Gatekeepers
Direct channels
• Direct sales
Core EBITDA5
(C$ millions)
AUMA5
(C$ billions)

Given our integrated business lines and differentiated offering
we have a clear right to win…
9
Right to win
• Strong brand presence allows us to increase our outreach to a large, diverse customer base
• Insurance heritage enables us to leverage insurance platform and strong distribution to reach more clients, and access to capital
provides additional opportunities for growth
• Proven track record of delivering solid investment performance, plus on the ground regional teams that engender trust
• Long-term investment management expertise enables us to manufacture solutions across public & private asset classes
• Ability to sell multi-format solutions through different channels, at global scale
• Integration across business lines allows us to offer a more compelling value proposition while generating a higher margin
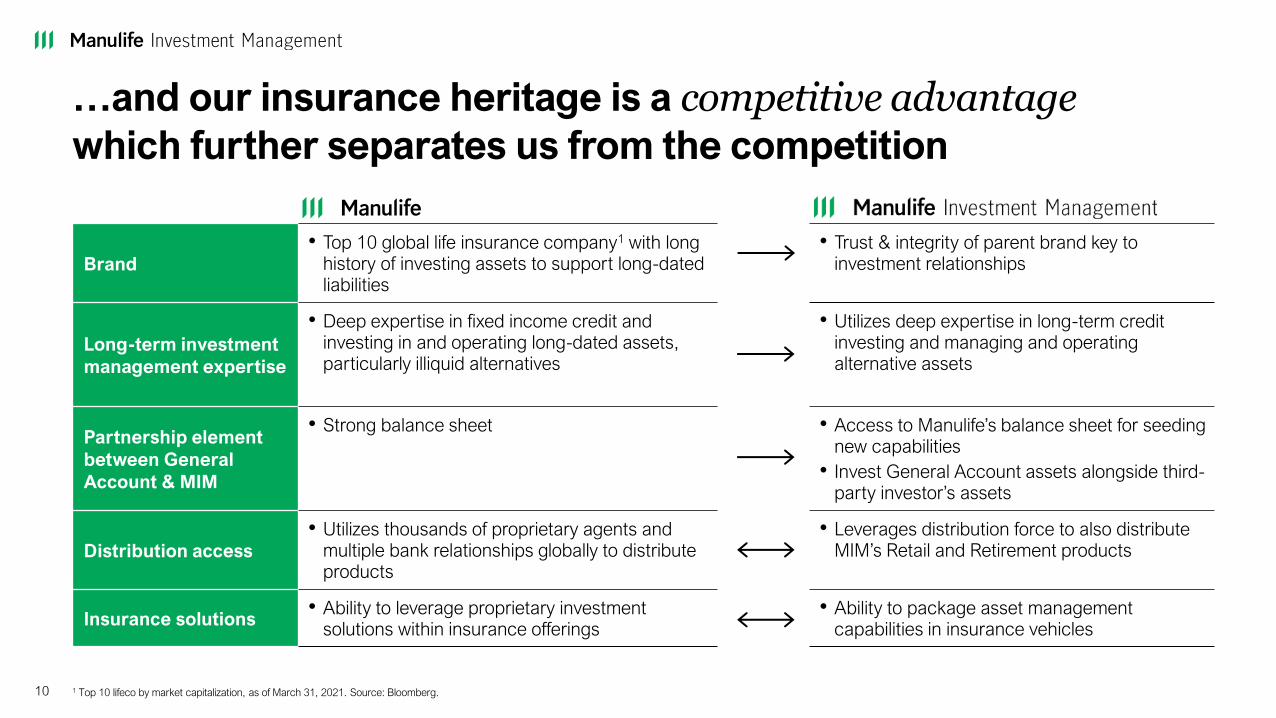
Brand• Top 10 global life insurance company1 with long
history of investing assets to support long-dated liabilities
• Trust & integrity of parent brand key to investment relationships
Long-term investment
management expertise
• Deep expertise in fixed income credit and investing in and operating long-dated assets, particularly illiquid alternatives
• Utilizes deep expertise in long-term credit investing and managing and operating alternative assets
Partnership element
between General
Account & MIM
• Strong balance sheet • Access to Manulife’s balance sheet for seeding new capabilities
• Invest General Account assets alongside third-party investor’s assets
Distribution access• Utilizes thousands of proprietary agents and
multiple bank relationships globally to distribute products
• Leverages distribution force to also distribute MIM’s Retail and Retirement products
Insurance solutions• Ability to leverage proprietary investment
solutions within insurance offerings• Ability to package asset management
capabilities in insurance vehicles
…and our insurance heritage is a competitive advantage which further separates us from the competition
10 1 Top 10 lifeco by market capitalization, as of March 31, 2021. Source: Bloomberg.

In addition, we manage assets on behalf of
other segments which provides further scale and value
11
182
231
20202018
+16% CAGR
Asia 42% U.S. 37% Canada 21%
AUMA managed on behalf of other segments1,2AUMA managed on behalf of other segments1
(C$ billions)
1 Percentage change is stated on a constant exchange rate basis. AUMA and constant exchange rate basis are Non-GAAP measures. See slide entitled “Performance and Non-GAAP Measures” in 2021 Investor Day Legal Slides. 2 As of December 31, 2020.
C$231B

Compared to our peers, these characteristics uniquelyposition us to capture the emerging trends across the industry
12 1 Source: OECD population projection, (February 2021). 2 Source: United Nations World Population Prospects 2019. 3 Source: World Economic Forum: Investing in (and for) our Future (June 2019). 4 Source: Manulife & Oliver Wyman estimates.
The 60 and older demographic is
the fastest growing market globally
(% of population 60 and over)1
The retirement gap is projected to
expand at a rapid pace
(US$ trillions)3
Global life expectancy continues
to increase
(Life expectancy at birth for world population)2
13
16
19
21
2040F 2050F2020A 2030F
311 11
28
1326
119
137
JapanCanada China US
4.3x2.4x
10.8x
4.9x
2015 2050F
70
68
72
66
65
67
69
71
73
20151990 1995 2000 2005 2010
Net household wealth in Asia is
expected to increase rapidly by 2025
(Household wealth, US$ trillions)4
76 73
97
119
North America Asia
1.3x
1.6x
2020 2025F

13
Strong track
record
of execution

Retail
Retirement
Institutional
Asia
Canada
U.S.2
#1 Peer $485
#2 Peer $72
#3 Peer $57
#4 MIM $44
#5 Peer $40
#6 Peer $10
#7 Peer $(18)
#8 Peer $(46)
#9 Peer $(67)
We have delivered positive net flows in ten of the past eleven
years, driven by our diverse business model…
Net Flows(C$ billions)
Outflow
Inflow
Total Net Flows since 20163
(C$ billions)
Note: Past performance cannot guarantee future performance. Net flows is a Non-GAAP measure. See slide entitled “Performance and Non-GAAP Measures” in 2021 Investor Day Legal Slides. 1 Net flows trend line is indexed to 2010’s net flows to show
increase/decrease of flows relative to a common starting point and is calculated as a simple average. Peer net flow data sourced from public company disclosures and includes Amundi, Great-West Lifeco, Invesco, Principal Financial Group, Prudential, Sun
Life, T. Rowe Price and Voya. Note 2010 & 2011 data excludes Voya as it was spun off from ING in 2013 and established independent financial backing through an IPO. These peers were selected based on their similarities to MIM’s businesses and
geographical presence. FX rates utilized based on annual averages and sourced from Bloomberg. 2 U.S. business line includes Europe. 3 Peer net flow data sourced from public company disclosures and includes Amundi, Great-West Lifeco, Invesco, Principal
Financial Group, Prudential, Sun Life, T. Rowe Price and Voya. These peers were selected based on their similarities to MIM’s businesses and geographical presence. FX rates utilized based on annual averages and sourced from Bloomberg.
Won three large institutional
mandates in Canada and Asia as
well as robust inflows in U.S. RetailSignificant outflow as a large
institutional client decided to
internalize their asset management
14
$6 $6
$20 $18 $18
$2
-$1
$9
20192011 20152010 20162012 2013 2014 2017 2018 2020
$12
$34
$16
Peers net flows trend1
MIM net flows trend1
MIM absolute net flows

…and strong net flows have been supported by
solid investment performance
15
Note: Past performance cannot guarantee future performance. Investment performance is as of December 31, 2020 and assesses Retail, Institutional, Insurance and Retirement platforms globally compared to peers or their respective index. 1 Fixed Income
includes Money Market. 2 Investment performance assets under management of C$598 billion, reflects GWAM assets under management (AUM) but excludes certain assets managed on behalf of other MFC segments, as well as 3rd party products, liability-
driven investing assets, select Private Markets strategies, select Retirement assets in Canada and passive strategies. Asset Allocation AUM has not been adjusted for allocations to proprietary products in other asset categories.
Asset Class 1-Year 3-Year 5-Year
Equity 71% 65% 65%
Fixed Income1 80% 75% 75%
Asset Allocation 55% 64% 70%
Balanced 90% 91% 100%
Alternatives 51% 63% 60%
Total2 71% 69% 72%
% of Assets Above Peer/Index 70-89%50-69% 90-100%
Further enhancing investment performance remains a key area of focus
1. Optimize product offerings to focus
on key areas of strength
2. Added investment talent to strengthen
core capabilities
3. Enhanced succession planning to
ensure long-term stability

Sustainability is an integral component of our
investment process, providing both enhanced
risk mitigation and alpha creation properties
16
Integration into investment process Responsible investing products Stewardship
• View incorporation of ESG factors as extension of
active bottom-up, fundamental approach
• Incorporate material ESG considerations across
investment lifecycle, within a robust governance
framework
• As stewards of client capital, committed to a strong
engagement process with companies we invest in
– Recognized in PRI Leaders Group 20201
Public market equity and fixed-income
strategies fully integrate ESG279%
dedicated sustainability professionals globally3
• Committed to expanding our sustainable investing
products and natural climate solutions
– Manulife Global Climate Pooled Strategy4
– Manulife Global ESG High Yield Bond
Strategy4
– Sustainable Asia Bond Strategy4
– Manulife ESG Asian Multi-Asset Income
Strategy4
• Thematic investments in timberland and
agriculture offer nature-based solutions
• Drive positive change through active engagement
with investee companies
• Collaborate with stakeholders to influence
adoption of best practices
• Incorporating high standards & sustainability
considerations in the operation of real assets
1 Principles for Responsible Investment, recognized for responsible investment work in climate reporting. As of December 31, 2020. 2 Based on a proprietary framework and AUM as of December 31, 2020. 3 As of April 2021. 4 Strategies may not be available in all jurisdictions.
23

Our solid performance and strong distribution
model have resulted in double-digit earnings growth
and solid asset expansion…
17Order of the vertical bars on the chart correspond to the order in the legend. 1 Percentage changes are stated on a constant exchange rate basis. Core earnings, AUMA and constant exchange rate basis are Non-GAAP measures. See slide entitled
“Performance and Non-GAAP Measures” in 2021 Investor Day Legal Slides.
Core earnings1
(C$ millions)
AUMA1
(C$ billions)
• Delivered core earnings CAGR of 14% since 2016 fueled by
strong growth in both Retirement & Retail, and highlighting the
power of diversity
• AUMA expansion continues to be solid, CAGR of 9% since 2016,
with contributions across all three business lines
• Supported by disciplined expense management
662
816
985 1,021
641
435
24
20192016 2017 2018 2020
1,100
+14% CAGR
Retirement InstitutionalRetail
286 311 312 356 397
188211 198
22724680
87 9998
110
554
20172016 20202019
681
2018
609 609
754
+9% CAGR
Retirement Retail Institutional

…and the diversity of the MIM franchise is reflected in the
stable Net Fee Income Yield and growing core EBITDA margins
18
Order of the vertical bars on the chart correspond to the order in the legend. 1AUM by Asset Class includes all GWAM managed assets under management, including assets managed by GWAM business units on behalf of other MFC segments.
Alternatives mainly includes Private Markets managed real estate, timberland, private equity, infrastructure, agriculture and other ALDA assets. 2 AUM, Average AUMA, Net Fee Income Yield, Core EBITDA and core EBITDA margin are non-GAAP
measures. See slide entitled “Performance and Non-GAAP Measures” in 2021 Investor Day Legal Slides. 3 Core EBITDA for 2016 and 2017 have been updated to reflect changes in reporting.
0
100
200
300
400
500
600
700
800
900
1,000
AUM
(C$ billions)
768
4Q20 1Q211Q20 2Q20 3Q20
710786
822 826
AUM by Asset Class1, 2 Core EBITDA & core EBITDA margin
1,209
1,4261,497 1,536
1 009
622
45
0
4
8
12
16
20
24
28
322,100
500
1,300
100
700
300
900
1,100
1,500
1,700
1,900
2018 2019
24.5
27.5
Core
EBITDA2,3
(C$ millions)
Core EBITDA2
Margin
(%)
2016
27.4
2017
27.4
29.2
2020
1,676
Retirement Retail InstitutionalMoney Market
Asset Allocation
Equity
Balanced
Alternatives
Fixed Income
680 672708 733
765
44.7 43.6 43.8 44.1 43.4
0
5
10
15
20
25
30
35
40
45
0
100
200
300
400
500
600
700
800
900
1,000
4Q201Q20
Average
AUMA2
(C$ billions)
Net Fee
Income Yield2
(bps)
2Q20 3Q20 1Q21
Average AUMA & Net Fee Income Yield
Average AUMA

Our strong momentum continued in 1Q21,
as we delivered record results across gross flows,
core EBITDA margins and core earnings
19Note: Percentage changes are stated on a constant exchange rate basis. Gross flows, core EBITDA margin, core earnings and constant exchange rate basis are Non-GAAP measures. See slide entitled “Performance and Non-GAAP Measures” in 2021
Investor Day Legal Slides.
Gross flows
(C$ billions)
Core earnings
(C$ millions)
Core EBITDA margin
(%)
27.330.7 30.7
1Q211Q20 4Q20
+340 bps
38.2
31.5
39.7
1Q20 4Q20 1Q21
250
304 312
1Q20 4Q20 1Q21
+29% CAGR

20
A clear path
for growth

We have a clear strategic direction that will allow us to
capitalize on the industry’s future growth drivers
21
Strengthen our
commitment to Retail
• Enhance customer reach and experience through expanded distribution, enriched digital capabilities and through the launch of new investment vehicles
• Leverage our global scale to drive efficiency
Provide advice and solutions to
Retirement participants to help
them save and prepare
• Target select segments of the market and enhance client experience through digital, and drive margin expansion by increasing proprietary investment management solutions
• Leverage data, analytics and diverse product shelf to prepare participants for retirement and increase roll-over capture rates
Augment our asset
management capabilities
• Develop differentiated public and private market investment strategies, while building scale in our Private Markets business
• Lead at driving ESG awareness and offering unique integrated solutions
And, well positioned for long-term
growth in high growth markets China India

1 Source: Cerulli Associates. Asia Retail projected AUM growth includes China, Japan, Hong Kong, Taiwan, Singapore, Indonesia, Malaysia, the Philippines and India. 2 Retail wealth management projected AUM based on internal and external research
estimates. See slide entitled “Caution regarding forward looking statements” in 2021 Investor Day Legal Slides.
Capturing the Retail growth opportunity by partnering with
our intermediaries, while focusing on our advice channels
22
Demand for human-delivered-advice remains
• Individuals continue to want both the expertise of
an advisor and an omni-channel experience
Large opportunity in select market segments
• Wealth concentration continues to increase among
high-net-worth customers, as well as underserved
segments such as women and millennials
Increase in wealth concentration
• Individuals are consolidating assets with one or two
primary providers that can offer comprehensive
advice and solutions
Demand for innovative products on the rise
• Increasing interest in sustainability focused
offerings, as well as non-traditional offerings such
as alternatives
Market trends and opportunity Our growth drivers
Asia projected AUM growth1
(US$ trillions)
46
2019 2024E
+10% CAGR
Canada projected AUM growth2
(C$ trillions)
5 6
2024E2019
+5% CAGR
U.S. projected AUM growth2
(US$ trillions)
34 45
2019 2024E
+6% CAGR
Prioritize investment in highest potential geographies
• Canada and Asia provide the opportunity to fully integrate
capabilities and expand margin
Expand customer base through advice and Asia agency force
• Increase our advice channels and leverage our growing agency
force in Asia to drive customer acquisition
Leverage the power of scale and data
• Leverage global scale and data and analytics to increase the
efficiency of our distribution platform
Extend unique investment capabilities across multiple vehicles
• Expand unique offerings across the ETF & SMA structure
Invest in digital capabilities to drive expansion
• Secure intermediary shelf space & enter new channels with digital
ESG & Asia asset management expertise drives innovation
• Leverage ESG leadership position and unique Asia capabilities to
offer differentiated solutions to investors outside of Asia
Re
tail

In Asia we are developing digital channels to deepencustomer relationships by leveraging our life insurance
distribution potential
23 1 IFTA Fintech Achievement Awards 2019, Platinum Award - Financial Planning Tech. 2 As of April 30, 2021, the Philippines, Hong Kong and Malaysia. 3 As of May 2021.
iFunds: A one-stop digital platform for simplified
portfolio management
Currently over 120K accounts &
~US$1.8B in AUM3
• Successfully launched in the Philippines & Hong Kong
in 2019, and Malaysia in 2020 with additional markets in
the pipeline
• Clients can easily open accounts, seamlessly transact and
monitor their fund portfolio & cash balances
• Provides clients with digital fund analysis capabilities,
such as the "Performance Snapshot" feature
• Allows advisors to quickly engage customers and assist
them in navigating fund choices digitally as the platform is
integrated with the advisor experience
• Manulife iFunds won the Platinum Award for Financial
Planning Tech at the 2019 IFTA Fintech Achievement Awards1
Since launch, 57% of new mutual accounts opened digitally2
Digital 57%
Other Channels 43%
Re
tail

The Retirement business provides an opportunity to help
individuals plan, save and ultimately transition to retirement
24
Retaining plan participants
• Capturing asset rollover as individuals leave
corporate plans is a growing opportunity
Enhancing digital customer experience
• Plan participants’ expectations are increasing, and
a digital omni-channel experience is table stakes
Extension into adjacencies across the broader
retirement “ecosystem” that meet clients’ needs
across health, wealth, wellness, and planning
Strong demand for income solutions
• Individuals worried they will outlive savings,
creating needs to annuitize financial assets
Asia could become a bigger opportunity
• Southeast Asia is expected to experience strong
growth and demand for private pension solutions
• Foreign insurers continue to enter China to
innovate and develop potential pension solutions
Market trends and opportunity Our growth drivers
Asia projected AUM growth1
(US$ trillions)
0.8 1.6
2019 2024E
+13% CAGR
Canada projected AUM growth2
(C$ trillions)
2.0 2.6
2019 2024E
+5% CAGR
U.S. projected AUM growth2
(US$ trillions)
16 20
2019 2024E
+5% CAGR
Win in specific segments of employer sponsored plan market
• Grow number of participants by targeting select segments and
improve margins by expanding offering of proprietary solutions
Invest in customer facing digital capabilities
• To drive improved experience for in-plan participants by digitizing
customer journeys and increasing automation
Improve both rollover capture rates and persistency
• Convert in-plan participants to individual customers by improving
rollover experience and drive higher persistency of participants
through comprehensive financial advice and innovative solutions
Engage members to provide predictable income solutions
• Develop customer engagement platforms to provide advice to
customers and offer income products at scale
Leverage the power of scale
• Ability to offer investment solutions and leverage global scale
ensures we can continue to win in the local markets
1 Source: Cerulli Report Asset Management in Southeast Asia 2020, Cerulli Report Asian Distribution Dynamics 2020 and Cerulli Report Global Markets 2020. Asia Retirement projected AUM growth includes Hong Kong, Malaysia, Thailand, Singapore,
Indonesia and China. 2 Retirement projected AUM based on internal and external research estimates. See slide entitled “Caution regarding forward looking statements” in 2021 Investor Day Legal Slides.
Re
tirem
en
t

The Retirement business has grown, and our rollover retention strategy has produced consistent flows
25
Note: Past performance cannot guarantee future performance. 1 Rollover capture rate means the percentage of member participants retained after the members have left employee sponsored plan. Rollover capture rate includes stay-in-plan members. 2 Includes sub-advised and third-party strategies. 3 Gross flows
percentage change stated on a constant exchange rate basis. Gross flows and constant exchange rate basis are Non-GAAP measures. See slide entitled “Performance and Non-GAAP Measures” in 2021 Investor Day Legal Slides.
Global participants
(millions)
Global rollover capture rate1
(%)
Assets managed internally Rollover driven gross flows3
(C$ millions)
6,759 6,7837,290
8,230
2017 20202018 2019
+6% CAGR
Third party strategies2 66%
Proprietary affiliated strategies 34%
6.87.3 7.6 7.9
20202017 2018 2019
+5% CAGR
26.325.0 26.2
30.0
201920182017 2020
Re
tirem
en
t
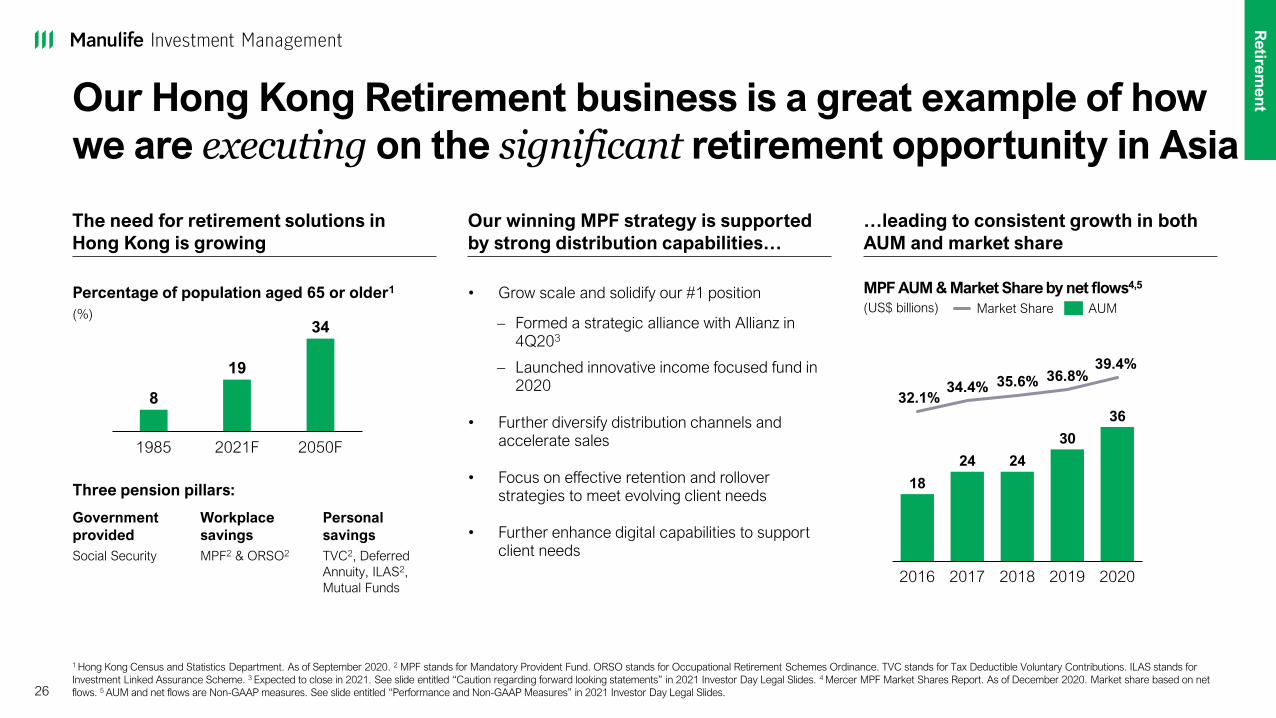
Our Hong Kong Retirement business is a great example of how
we are executing on the significant retirement opportunity in Asia
26
1 Hong Kong Census and Statistics Department. As of September 2020. 2 MPF stands for Mandatory Provident Fund. ORSO stands for Occupational Retirement Schemes Ordinance. TVC stands for Tax Deductible Voluntary Contributions. ILAS stands for
Investment Linked Assurance Scheme. 3 Expected to close in 2021. See slide entitled “Caution regarding forward looking statements” in 2021 Investor Day Legal Slides. 4 Mercer MPF Market Shares Report. As of December 2020. Market share based on net
flows. 5 AUM and net flows are Non-GAAP measures. See slide entitled “Performance and Non-GAAP Measures” in 2021 Investor Day Legal Slides.
Percentage of population aged 65 or older1
(%)
8
19
34
2050F2021F1985
Three pension pillars:
• Grow scale and solidify our #1 position
– Formed a strategic alliance with Allianz in 4Q203
– Launched innovative income focused fund in 2020
• Further diversify distribution channels and accelerate sales
• Focus on effective retention and rollover strategies to meet evolving client needs
• Further enhance digital capabilities to support client needs
MPF AUM & Market Share by net flows4,5
(US$ billions)
18
24 24
30
36
2016
32.1%34.4%
2018
35.6%
2017
36.8%
2019
39.4%
2020
AUM Market Share
Government
provided
Social Security
Workplace
savings
MPF2 & ORSO2
Personal
savings
TVC2, Deferred
Annuity, ILAS2,
Mutual Funds
The need for retirement solutions in
Hong Kong is growing
Our winning MPF strategy is supported
by strong distribution capabilities…
…leading to consistent growth in both
AUM and market share
Re
tirem
en
t

We are augmenting our asset management capabilities to
drive growth, while creating new revenue streams
27
Demand for active solutions remains strong
• Clients continue to seek alpha generation
through focused active management strategies
Private solutions are becoming mainstream
• The democratization of private markets
continues, as retail and institutional investors
seek out diversification
Interest in ESG accelerating
• Increase in demand for ESG investing is evident
in thematic and ESG-integrated styles in
institutional mandates
Market trends and opportunity Our growth drivers
Active public asset projected
AUM growth1
(US$ trillions)
2430
2019 2024E
+5% CAGR
Private asset projected AUM
growth2
(US$ trillions)
812
2019 2024E
+8% CAGR
Be the partner of choice for institutional clients globally
• Through our broad capability set and best-in-class asset
management capabilities
Expand public and private market investment capabilities
• Focus on differentiated public strategies, including global fixed
income, specialty equity and growing Private Markets
Leverage Asia investment expertise to enhance distribution
• Take advantage of strong Asia franchise by distributing our Asia
investment capabilities globally
Create value as a leader in ESG
• Continue to lead with ESG integration into our public market
investment process & leverage Private Markets timberland and
agriculture business to help clients achieve their ESG ambitions
Assist asset owners in achieving their desired outcomes
• Leverage insurance heritage and long-term approach to managing
liabilities to provide clients with unique solutions
1 Based on internal and external research estimates and includes active equity, active fixed income, and active multi-assets. 2 Based on internal and external research estimates and includes real estate funds, private equity funds, infrastructure funds, private
debt funds, structured products, commodity funds, absolute return/liquid alternatives, and rest of active alternatives. See slide entitled “Caution regarding forward looking statements” in 2021 Investor Day Legal Slides.
Asse
t Ma
na
ge
me
nt

Our strategic long-term investments in China & India will
drive growth beyond our medium-term planning horizon
28 1 Projected mutual fund AUM source: Cerulli Report Asian Distribution Dynamics 2020. See slide entitled “Caution regarding forward looking statements” in 2021 Investor Day Legal Slides. 2 Wholly foreign-owned enterprise.
Z
Market attractiveness
in the medium-term Our presence in the market Value proposition
China
JV
WFOE2
Strategic Partnership with Albamen Capital Partners
• Manulife TEDA provides both domestic
fixed income and equity solutions
• Manulife WFOE provides ability to develop
non-domestic public fixed income & equity,
as well as private management solutions
• This partnership with a leading China
infrastructure private equity manager aims
to capitalize on the global energy revolution
India
JV • This joint venture aims to expand fund
offerings, drive fund penetration and
achieve long-term wealth creation in India
1 8973 616
2019 2024E
+14% CAGR
Lo
ng
-term
gro
wth
Mutual Fund AUM1
(US$ billions)
346571
2019 2024E
+11% CAGR
Mutual Fund AUM1
(US$ billions)

Key Messages
29
• Manulife Investment Management is a primary growth engine for Manulife
• Our insurance heritage gives us a competitive advantage versus stand alone
wealth and asset management businesses
• Diversified business with global presence and scale across three business lines
• Strong track record of operating results over the last five years and demonstrated
resilience throughout the global pandemic
• Delivered positive net flows in ten of the past eleven years, supported by
solid investment performance
• A clear path for future growth and uniquely positioned to capitalize on emerging
global trends
Note: Past performance cannot guarantee future performance.

30
Appendix
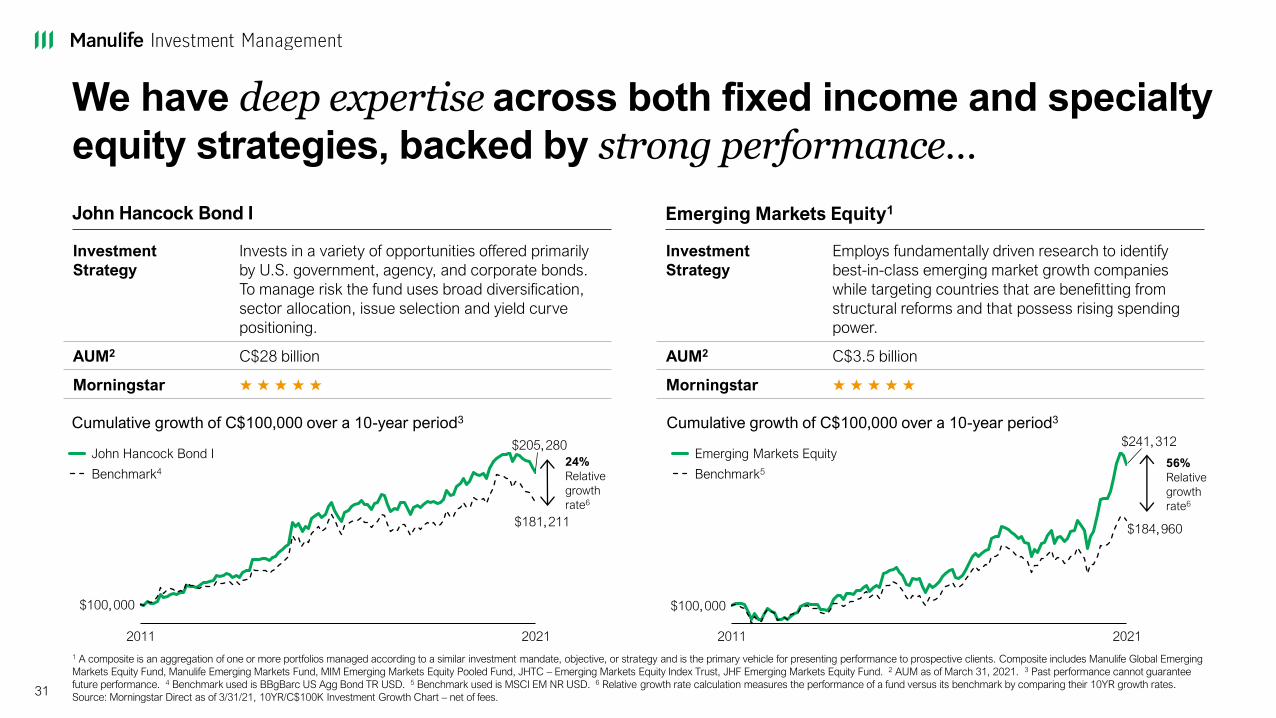
We have deep expertise across both fixed income and specialty equity strategies, backed by strong performance…
31
1 A composite is an aggregation of one or more portfolios managed according to a similar investment mandate, objective, or strategy and is the primary vehicle for presenting performance to prospective clients. Composite includes Manulife Global Emerging
Markets Equity Fund, Manulife Emerging Markets Fund, MIM Emerging Markets Equity Pooled Fund, JHTC – Emerging Markets Equity Index Trust, JHF Emerging Markets Equity Fund. 2 AUM as of March 31, 2021. 3 Past performance cannot guarantee
future performance. 4 Benchmark used is BBgBarc US Agg Bond TR USD. 5 Benchmark used is MSCI EM NR USD. 6 Relative growth rate calculation measures the performance of a fund versus its benchmark by comparing their 10YR growth rates.
Source: Morningstar Direct as of 3/31/21, 10YR/C$100K Investment Growth Chart – net of fees.
John Hancock Bond I Emerging Markets Equity1
Cumulative growth of C$100,000 over a 10-year period3
24%
Relative
growth
rate6
Cumulative growth of C$100,000 over a 10-year period3
Investment
Strategy
Invests in a variety of opportunities offered primarily
by U.S. government, agency, and corporate bonds.
To manage risk the fund uses broad diversification,
sector allocation, issue selection and yield curve
positioning.
AUM2 C$28 billion
Morningstar ★ ★ ★ ★ ★
Investment
Strategy
Employs fundamentally driven research to identify
best-in-class emerging market growth companies
while targeting countries that are benefitting from
structural reforms and that possess rising spending
power.
AUM2 C$3.5 billion
Morningstar ★ ★ ★ ★ ★
$205,280
$100,000
$181,211
2011 2021
John Hancock Bond I
Benchmark456%
Relative
growth
rate6
$241,312
$100,000
$184,960
2011 2021
Emerging Markets Equity
Benchmark5

…and we complement our proprietary offerings with select third party managers
321 AUM is aggregate amount of the Fund and the Class. AUM as of March 31, 2021. 2 Past performance cannot guarantee future performance. 3 Benchmark used is MSCI ACWI Ex USA Growth NR USD. 4 Benchmark used is MSCI EAFE GR CAD. 5 Relative growth rate calculation measures the performance of a fund versus its benchmark by comparing their 10YR growth rates. Source: Morningstar Direct as of 3/31/21, 10YR/C$100K Investment Growth Chart – net of fees.
John Hancock International Growth I Manulife World Investments F
Cumulative growth of C$100,000 over a 10-year period2
98%
Relative
growth
rate5
Cumulative growth of C$100,000 over a 10-year period2
Investment
Strategy
Targets high-quality, growing companies to
potentially limit participation in falling markets while
keeping pace in rising markets.
AUM1 C$16.0 billion
Morningstar ★ ★ ★ ★
Investment
Strategy
Intends to provide long-term growth potential and
risk diversification through non-North American
companies. Investing primarily in European and
Asian companies that are likely to have stable and
recurring revenues.
AUM1 C$2.4 billion
Morningstar ★ ★ ★ ★ ★
$345,275
$100,000
$246,884
2011 2021
John Hancock International Growth I
Benchmark3
$261,797
$100,000
$231,768
2011 2021
Manulife World Investments F
Benchmark4
30%
Relative
growth
rate5

33