a bobber’s perspective on angler-driven vectors of
TRANSCRIPT

A bobber’s perspective on angler-driven vectors of invasive species transmission 97
A bobber’s perspective on angler-driven vectors of invasive species transmission
Rachel M. Fricke1, Spencer A. Wood2, Dustin R. Martin3, Julian D. Olden1
1 School of Aquatic and Fishery Sciences, University of Washington, Seattle, Washington 98195, USA 2 eScien-ce Institute, University of Washington, Seattle, Washington 98195, USA 3 ReelSonar, Inc., Seattle, Washington 98109, USA
Corresponding author: Julian D. Olden ([email protected])
Academic editor: S. M. Thomaz | Received 28 May 2020 | Accepted 8 August 2020 | Published 2 September 2020
Citation: Fricke RM, Wood SA, Martin DR, Olden JD (2020) A bobber’s perspective on angler-driven vectors of invasive species transmission. NeoBiota 60: 97–115. https://doi.org/10.3897/neobiota.60.54579
AbstractPrevention of aquatic invasive species is a fundamental management challenge. With hundreds of mil-lions of people participating in fishing trips each year, understanding angler movements that transmit invasive species can provide critical insight into the most effective locations and scales at which to apply preventative measures. Recent evidence suggests that mobile technologies provide new opportunities to understand different types of angler movement behaviour beyond what is possible with infrequently and sparsely conducted in-person boat surveys and mail questionnaires. Here we capitalise on data provided by ReelSonar’s iBobber, a sonar-enabled bobber with over 5 M recorded fishing locations, globally. By quantifying geographic patterns of fishing activities and assessing how these patterns change seasonally, we explore angler behaviour across the entire continental United States in terms of fishing frequency and distance travelled between sites and characterise the attributes of fished ecosystems. We found that iBob-ber users (anglers) undertook 66,918 trips to 20,049 different water-bodies over a two-year period. An-glers who use iBobber were more likely to visit larger, deeper and more urbanised water-bodies and these water-bodies were over five times more likely to be a reservoir compared to a lake. Inter-water-body travel road distances averaged 93 km (SD = 277 km; range < 1–300 km) and nearly half of these movements occurred over a timespan of two days or less, a timeframe that we show falls well within the desiccation tolerance window of many prevalent plant and animal invasive species. Our study offers novel insight into spatiotemporal patterns of angler behaviour well beyond the geographical and temporal extent of con-ventional ground-collected approaches and carries important implications for predicting and preventing future transmission of aquatic invasive species via recreational fishing.
Keywordsbig data, desiccation tolerance, invasion risk, recreational fishing, species transmission, vectors
Copyright Rachel M. Fricke et al. This is an open access article distributed under the terms of the Creative Commons Attribution License (CC BY 4.0), which permits unrestricted use, distribution, and reproduction in any medium, provided the original author and source are credited.
NeoBiota 60: 97–115 (2020)
doi: 10.3897/neobiota.60.54579
http://neobiota.pensoft.net
RESEARCH ARTICLE
Advancing research on alien species and biological invasions
A peer-reviewed open-access journal
NeoBiota
Rachel M. Fricke et al. / NeoBiota 60: 97–115 (2020)98
Introduction
Technological innovations in ecology have evolved significantly in recent decades, now serving a much more common and indispensable role in scientific research and man-agement. The application of technology in conservation biology is rapidly growing and becoming more widespread (Joppa 2015; Pimm et al. 2015; Berger-Tal and Lahoz-Monfort 2018; Toivonen et al. 2019). Mobile app-derived data, for instance, are in-creasingly used to provide information for management strategies related to outdoor recreational use and planning, such as hiking and nature-based tourism (e.g. Wood et al. 2013; Fisher et al. 2018). This wealth of new data allows practitioners to map human recreational activities and relate individual behaviour to real-world conditions (Levin et al. 2017; Hausmann et al. 2018). For example, digital footprints in the form of geotagged photographs proportionally reflect human visitation rates at freshwater lakes and reservoirs (Keeler et al. 2015). However, broader incorporation of these data formats into freshwater management remains limited and user-generated data con-tinue to be under-utilised in scientific studies (Venturelli et al. 2017).
Recreational freshwater fishing generates significant net economic benefits in the United States and Canada by engaging over 30 million participants annually, whose equipment and trip expenditures total in the tens of billions USD each year (U.S. Department of the Interior 2016; Fisheries and Oceans Canada 2019). However, high rates of participation in fishing have significant social, ecological and economic conse-quences. Anglers have repeatedly been implicated as vectors of non-indigenous species by entraining organisms in bait buckets, on fishing lines and on boat motors, hulls and trailers (Rothlisberger et al. 2010; Drake and Mandrak 2014; Smith et al. 2020). Insufficient gear-cleaning allows hitchhiking invaders to be moved overland between water-bodies, promoting both their initial introduction into new catchments and sec-ondary spread into adjacent lakes and reservoirs (Anderson et al. 2014). Angling activ-ity frequently moves invasive species over short distances, but can also distribute them across regions and nations via jump dispersal (Buchan and Padilla 1999; Wilson et al. 2009). In North America, higher numbers of non-native species have been found to coincide with areas of greater recreational fishing demand (Davis and Darling 2017). Examples of ubiquitous nuisance species whose translocation has been partly attrib-uted to angling and boat movements include zebra mussel Dreissena polymorpha, Eura-sian milfoil Myriophyllum spicatum, spiny water flea Bythotrephes longimanus and rusty crayfish Orconectes rusticus (Lodge et al. 2000; Minchin et al. 2003; Rothlisberger et al. 2010; Kerfoot et al. 2011).
Mobile technologies provide new opportunities to understand angler movement behaviour in ways that have traditionally challenged researchers. Emerging methods for tracing angler movement include trip logs on online fishing forums and mobile applications, remote traffic counters, geocoding wildlife recreational licences, text and data mining of social media and personal fishing gear with enhanced technological capabilities (e.g. Martin et al. 2014; Mogollón and Villamagna 2014; Papenfuss et al. 2015; Monkman et al. 2018; van Poorten and Brydle 2018). These new mobile-based data offer prospects for more robust spatiotemporal estimation of angler activ-
A bobber’s perspective on angler-driven vectors of invasive species transmission 99
ity (Venturelli et al. 2017). This contrasts with conventional approaches that rely on in-person surveys at boat launches and mail-in questionnaires to licensed anglers and thus only provide a limited snapshot in time of angling activity at a particular location (Rothlisberger et al. 2010; Anderson et al. 2014). Moreover, the shift in demographics of recreational fishing towards younger and more technologically savvy anglers (Rec-reational Boating and Fishing Foundation 2018) suggests that mobile-based data may shed novel insights into the movement behaviour of individuals who are less likely to engage with long-standing survey instruments.
Given the pivotal role anglers play in transporting harmful freshwater invasive species, understanding when and where fishing activity occurs is critical for providing information for more strategic preventative measures (Muirhead and MacIsaac 2005; Vander Zanden and Olden 2008). Human transportation networks determine the large-scale geographic pathways available to anglers and, hence, the routes by which invasive species may hitchhike between water-bodies. Preventative measures are placed adjacent to these pathways and at the water-body access points they connect (Drake and Mandrak 2010; Meekan et al. 2017). Joining angler movement data with existing invasive species distributions allows for the identification of invasion hubs – areas from which non-indigenous species are frequently moved into nearby locales (Muirhead and MacIsaac 2005; Stewart-Koster et al. 2015). Enhancing our knowledge of hu-man movement behaviour will improve our ability to deploy vector management and prioritise locations for a suite of preventative approaches, including early detection monitoring at access points, roadside boat and gear inspection stations and education in the form of billboards and awareness signs (Sharp et al. 2017; Cimino and Strecker 2018; Reaser et al. 2020).
The potential for invasive species introduction into new water-bodies via angler-driven vectors is constrained not only by the spatial distributions of nuisance species and angler movement, but also by those factors that influence survival during trans-port, such as species’ desiccation tolerance (Havel 2011; Wood et al. 2011; Leuven et al. 2014; Coughlan et al. 2018). Thus, it is important to account for the duration over which angler movement occurs across the landscape after potential entrainment of non-indigenous propagules in an angler transportation pathway (Johnson et al. 2001). In comparison to recreational boaters, anglers may enhance the likelihood for dispers-ing aquatic invasive species as they are more capable of accessing smaller water-bod-ies in remote locations (Drake and Mandrak 2010). Previous studies, however, have been unable to account for time when assessing risk of invasive species’ introduction and spread via angler movement because such fine-scale data are not generated from conventional survey approaches. Consideration of the temporal dimension of angler movement provides greater resolution into this invasion vector by allowing for explicit consideration of movement events that are shorter in duration and likely to entrain viable propagules (Jerde et al. 2012; Banha and Anastácio 2014). Additionally, this approach has the advantage of integrating species-specific information (i.e. desiccation tolerance) into vector-based invasive species risk assessments.
In this study, we demonstrate how large-scale angler movement behaviour – a major contributor to the spread of invasive species – can be estimated from data col-
Rachel M. Fricke et al. / NeoBiota 60: 97–115 (2020)100
lected by mobile fishing technology. Specifically, we used angler location data from ReelSonar’s iBobber – a sonar-enabled castable fish-finder with over 5,000,000 georef-erenced global records of fishing activities uploaded since the device’s launch – to ana-lyse spatial patterns in angler movement across the continental United States. iBobber devices passively collect data upon submersion in water and, thus, have the advantage of representing all angling activity regardless of whether a user actively records a fish catch. Our objectives were to assess the geography of angler activities and movement dynamics while explicitly accounting for spatial distributions of aquatic nuisance spe-cies and limitations on propagule viability between water-bodies according to species’ desiccation tolerance. The findings of this research offer novel insights into spatiotem-poral patterns of angler behaviour and carry important implications for predicting and preventing future transmission of aquatic invasive species via recreational fishing.
Methods
iBobber technology and data processing
iBobbers are small castable, personal fish-finders that sync through Bluetooth with a smartphone application to provide users with real-time information on fish and vegeta-tion presence in the water column, map water-body depth and estimate water and air temperature, wind speed and direction and a suite of additional weather variables. iBobber users include shore-based anglers and those fishing from kayaks, canoes and other boats. iBobbers (distributed by ReelSonar of Seattle, WA) are widely available for purchase in stores and on the web and are primarily used in North America, Europe and east Asia.
Anonymised data were acquired from all iBobber devices that were used over a two-year period (January 2017 – December 2018). When submerged in water, each bobber records a “hotspot” of its geographic location in 30-second intervals, along with time, date, fish presence, depth and a host of other variables. Each device is identified by its unique bobber ID code and iBobber users can view these metrics in real-time using the iBobber phone app. As owners often test their devices initially in their home sinks and pools, we first filtered the data spatially by excluding hotspots that were lo-cated outside of a 50-m buffer of the > 379,000 lakes and reservoirs contained in the National Hydrography Dataset, v2 (NHD) for the continental U.S. (U.S. Geological Survey 2018). Timestamped locations were then compiled into single fishing trips by pooling hotspots with the same bobber ID, water-body and date.
Angling trip and water-body metrics
We calculated summary metrics to describe angler fishing activities according to iBob-ber records, including the number of trips (i.e. distinct visits to a water-body in time)
A bobber’s perspective on angler-driven vectors of invasive species transmission 101
by each user, total trips per month and day of the week across all water-bodies and us-ers and density of trips (# km2) across the continental U.S. Water-body characteristics were obtained from the EPA’s LakeCat Dataset, which classifies lakes and reservoirs within the NHD by surrounding land use and lithography, size, surface area and ad-ditional variables (Hill et al. 2018). We compared the percent urban land cover in the contributing basin of water-body and the maximum depth and surface area of water-bodies fished by iBobber users to that of all water-bodies within LakeCat us-ing a parametric comparison of means according to a two-sample Z-test. In addition, we identified which lakes were reservoirs with USGS’ Reservoir Morphology Dataset (Rodgers 2017), compared the likelihood of natural lakes and reservoirs being fished by iBobber users with a two-tailed chi-squared test of independence and assessed the effect size of this likelihood using the odds ratio.
Angler movement events and duration between water-bodies
Least-cost ground transportation distances between consecutive anglers’ trips to wa-ter-bodies were determined by routing angler locations through GraphHopper’s route optimiser, which uses OpenStreetMap as a base map. This is termed an angler (inter-water-body) movement event. GraphHopper routes geographic coordinates through the closest road access point for each water-body, thus most often estimating the trans-portation distance between public boat launches. We calculated the duration of each angler movement event as the number of days between consecutive trips by iBobber users. Furthermore, we conducted a literature search to identify all nuisance fresh-water invasive species with reported tolerated exposure to desiccation (the length of time) in an overland vector, resulting in values for hydrilla Hydrilla verticillata (16 hours: Barnes et al. 2013), Eurasian milfoil (2 days: Barnes et al. 2013), New Zealand mudsnail Potamopyrgus antipodarum (3 days: Havel et al. 2014), zebra mussel (5 days: Ricciardi et al. 1995), Asian clam Corbicula fluminea (23 days: Collas et al. 2014) and Chinese mystery snail Cipangopaludina chinensis (63 days: Havel et al. 2014). We then calculated the number of movement events that fell within each species desicca-tion tolerance range. Lastly, we visualised a subset of angler movements in a region of Wisconsin, U.S. to demonstrate high traffic road routes utilised by anglers and to as-sess the frequency of movements from non-invaded to invaded water-bodies. We first determined whether angling was a potential vector for a range of invasive species using the USGS Nonindigenous Aquatic Species database (2018) and then classified invaded water-bodies within the angler movement subset as those containing at least one of the identified species (Asian clam, banded mystery snail Viviparus georgianus, curly-leaf pondweed Potamogeton crispus, Chinese mystery snail, Eurasian milfoil, flowering rush Butomus umbellatus, purple loosestrife Lythrum salicaria, ornamental water lilies Nym-phaea sp., rusty crayfish, spiny water flea, zebra mussel) according to presence/absence records from the Wisconsin Department of Natural Resources (2016).
Rachel M. Fricke et al. / NeoBiota 60: 97–115 (2020)102
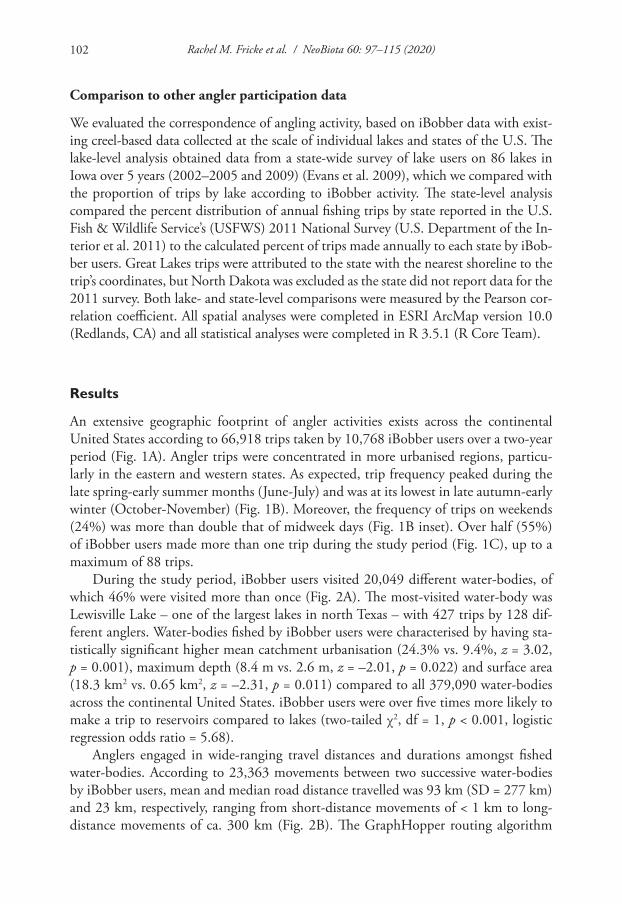
Comparison to other angler participation data
We evaluated the correspondence of angling activity, based on iBobber data with exist-ing creel-based data collected at the scale of individual lakes and states of the U.S. The lake-level analysis obtained data from a state-wide survey of lake users on 86 lakes in Iowa over 5 years (2002–2005 and 2009) (Evans et al. 2009), which we compared with the proportion of trips by lake according to iBobber activity. The state-level analysis compared the percent distribution of annual fishing trips by state reported in the U.S. Fish & Wildlife Service’s (USFWS) 2011 National Survey (U.S. Department of the In-terior et al. 2011) to the calculated percent of trips made annually to each state by iBob-ber users. Great Lakes trips were attributed to the state with the nearest shoreline to the trip’s coordinates, but North Dakota was excluded as the state did not report data for the 2011 survey. Both lake- and state-level comparisons were measured by the Pearson cor-relation coefficient. All spatial analyses were completed in ESRI ArcMap version 10.0 (Redlands, CA) and all statistical analyses were completed in R 3.5.1 (R Core Team).
Results
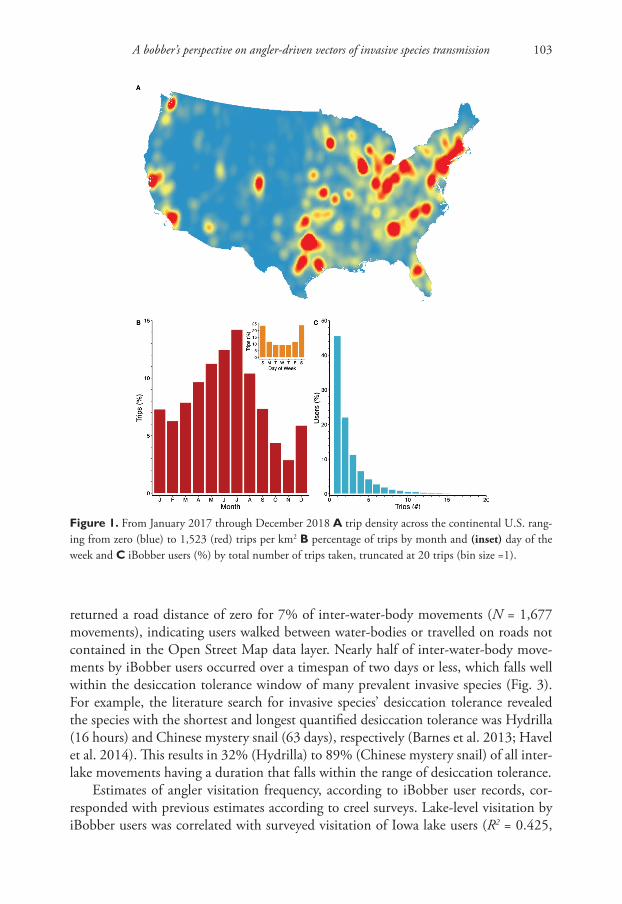
An extensive geographic footprint of angler activities exists across the continental United States according to 66,918 trips taken by 10,768 iBobber users over a two-year period (Fig. 1A). Angler trips were concentrated in more urbanised regions, particu-larly in the eastern and western states. As expected, trip frequency peaked during the late spring-early summer months (June-July) and was at its lowest in late autumn-early winter (October-November) (Fig. 1B). Moreover, the frequency of trips on weekends (24%) was more than double that of midweek days (Fig. 1B inset). Over half (55%) of iBobber users made more than one trip during the study period (Fig. 1C), up to a maximum of 88 trips.
During the study period, iBobber users visited 20,049 different water-bodies, of which 46% were visited more than once (Fig. 2A). The most-visited water-body was Lewisville Lake – one of the largest lakes in north Texas – with 427 trips by 128 dif-ferent anglers. Water-bodies fished by iBobber users were characterised by having sta-tistically significant higher mean catchment urbanisation (24.3% vs. 9.4%, z = 3.02, p = 0.001), maximum depth (8.4 m vs. 2.6 m, z = –2.01, p = 0.022) and surface area (18.3 km2 vs. 0.65 km2, z = –2.31, p = 0.011) compared to all 379,090 water-bodies across the continental United States. iBobber users were over five times more likely to make a trip to reservoirs compared to lakes (two-tailed χ2, df = 1, p < 0.001, logistic regression odds ratio = 5.68).
Anglers engaged in wide-ranging travel distances and durations amongst fished water-bodies. According to 23,363 movements between two successive water-bodies by iBobber users, mean and median road distance travelled was 93 km (SD = 277 km) and 23 km, respectively, ranging from short-distance movements of < 1 km to long-distance movements of ca. 300 km (Fig. 2B). The GraphHopper routing algorithm
A bobber’s perspective on angler-driven vectors of invasive species transmission 103
Figure 1. From January 2017 through December 2018 A trip density across the continental U.S. rang-ing from zero (blue) to 1,523 (red) trips per km2 B percentage of trips by month and (inset) day of the week and C iBobber users (%) by total number of trips taken, truncated at 20 trips (bin size =1).
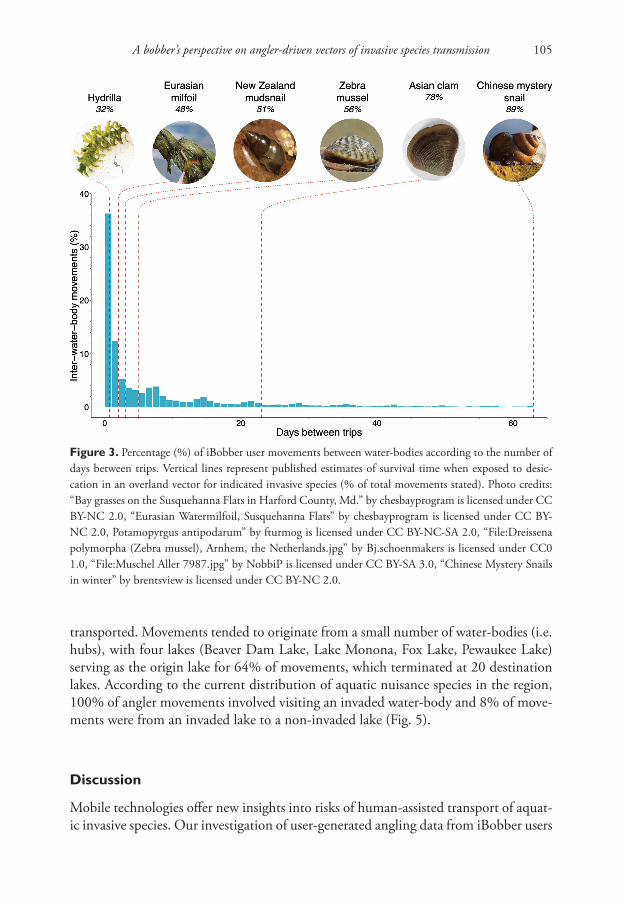
returned a road distance of zero for 7% of inter-water-body movements (N = 1,677 movements), indicating users walked between water-bodies or travelled on roads not contained in the Open Street Map data layer. Nearly half of inter-water-body move-ments by iBobber users occurred over a timespan of two days or less, which falls well within the desiccation tolerance window of many prevalent invasive species (Fig. 3). For example, the literature search for invasive species’ desiccation tolerance revealed the species with the shortest and longest quantified desiccation tolerance was Hydrilla (16 hours) and Chinese mystery snail (63 days), respectively (Barnes et al. 2013; Havel et al. 2014). This results in 32% (Hydrilla) to 89% (Chinese mystery snail) of all inter-lake movements having a duration that falls within the range of desiccation tolerance.
Estimates of angler visitation frequency, according to iBobber user records, cor-responded with previous estimates according to creel surveys. Lake-level visitation by iBobber users was correlated with surveyed visitation of Iowa lake users (R2 = 0.425,

Rachel M. Fricke et al. / NeoBiota 60: 97–115 (2020)104
p < 0.001, N = 53) (Fig. 4A). Similarly, for the continental United States, the state-lev-el visitation frequency by iBobber users was positively correlated with relative angling activity by state reported in the most recent USFWS National Survey (R2 = 0.342, p < 0.001, N = 47) (Fig. 4B). Amongst states, Texas had the greatest disparity between percentage of angling activity in the iBobber (11.6%) and USFWS (5.5%) datasets.
The utility of data from mobile fishing apps to elucidate regional-scale angler move-ment behaviour was demonstrated using water-bodies around Milwaukee, WI (Fig. 5). For 29 water-bodies, we observed 50 angler trips along 41 visualised road routes – demonstrating the diffuse geographic routes by which non-native species could be
Figure 2. A Percentage of water-bodies according to the number of trips taken by iBobber users, trun-cated at 20 trips (bin size = 1) and B the frequency (%) of movements between two subsequently visited water-bodies by road distance (km) (bin size = 25), truncated at 1,000 km.
A bobber’s perspective on angler-driven vectors of invasive species transmission 105
transported. Movements tended to originate from a small number of water-bodies (i.e. hubs), with four lakes (Beaver Dam Lake, Lake Monona, Fox Lake, Pewaukee Lake) serving as the origin lake for 64% of movements, which terminated at 20 destination lakes. According to the current distribution of aquatic nuisance species in the region, 100% of angler movements involved visiting an invaded water-body and 8% of move-ments were from an invaded lake to a non-invaded lake (Fig. 5).
Discussion
Mobile technologies offer new insights into risks of human-assisted transport of aquat-ic invasive species. Our investigation of user-generated angling data from iBobber users
Figure 3. Percentage (%) of iBobber user movements between water-bodies according to the number of days between trips. Vertical lines represent published estimates of survival time when exposed to desic-cation in an overland vector for indicated invasive species (% of total movements stated). Photo credits: “Bay grasses on the Susquehanna Flats in Harford County, Md.” by chesbayprogram is licensed under CC BY-NC 2.0, “Eurasian Watermilfoil, Susquehanna Flats” by chesbayprogram is licensed under CC BY-NC 2.0, Potamopyrgus antipodarum” by fturmog is licensed under CC BY-NC-SA 2.0, “File:Dreissena polymorpha (Zebra mussel), Arnhem, the Netherlands.jpg” by Bj.schoenmakers is licensed under CC0 1.0, “File:Muschel Aller 7987.jpg” by NobbiP is licensed under CC BY-SA 3.0, “Chinese Mystery Snails in winter” by brentsview is licensed under CC BY-NC 2.0.

Rachel M. Fricke et al. / NeoBiota 60: 97–115 (2020)106
Figure 4. A Total Iowa iBobber user activity by lake (%) versus the total visits by lake (%) as quantified by an Iowa State University state-wide survey (p = 7.5 x 10⁻⁸, R2 = 0.425) (Evans et al. 2011) B total iBob-ber user activity by state (%) versus total angling activity by state (%) as quantified by the 2011 USFWS National Survey (U.S. Department of the Interior 2014).
Figure 5. Road-routed movements by iBobber users between lakes in the greater Milwaukee, WI area. Movements between lakes with invasive species present are indicated by blue routes while movements from an invaded lake to a non-invaded lake are indicated by red routes.

A bobber’s perspective on angler-driven vectors of invasive species transmission 107
across the United States demonstrates the potential to characterise angler site pref-erence and movement activities well beyond the geographical and temporal extent of conventional ground-collected approaches. Furthermore, our mobile data affirms previous observations that fished water-bodies are commonly large, urban reservoirs. Here, we discuss the relevance of our findings for enhanced prevention of invasive spe-cies, evaluate the key benefits and challenges of employing new mobile data forms and suggest future steps to enhance the value of mobile data in invasion biology.
User-generated data sources represent a cost-effective means of mapping human geography of interactions with environments (Deville et al. 2014; Toivonen et al. 2019). iBobbers, as well as similar devices and mobile applications, could provide re-source managers with information regarding angler traffic at broader spatiotemporal scales than have previously been available (Venturelli et al. 2017). Given the impor-tance of interstate pathways in facilitating transmission of invasive species and water-borne diseases between lake networks (e.g. Buchan and Padilla 1999; Muirhead and MacIsaac 2005; Stewart-Koster et al. 2015), understanding the dynamics of angler movement across traditional jurisdictional boundaries that often serve as spatial limits for conventional creel surveys is vital (Peters and Lodge 2009). Indeed, data that sup-port coordinated management decisions across neighbouring regions are fundamental to successful management of invasive species in complex social landscapes (Epanchin-Niell et al. 2010). We found that the road distance travelled between water-bodies by iBobber users, for example, exceeded estimates for Wisconsin (mean: 93 vs. 34 km: Buchan and Padilla 1999), but was significantly less than Ontario, Canada (median: 23 vs. 292 km: Drake and Mandrak 2010) according to angler surveys.
Use of geotagged angler data from mobile technology allows for seamless cross-referencing of information about angler behaviour with characteristics of source and destination lakes, such as the pool of non-indigenous species available to be entrained into the vector and key environmental determinants of species establishment. For ex-ample, by linking to readily-available species distribution databases for a region in Wisconsin, we showed that approximately one-in-ten movements were from lakes con-taining aquatic invasive species to lakes currently not invaded. For the U.S., we show that the large population of iBobber users fish reservoirs at five times the rate relative to natural lakes, while concurrent research shows that reservoirs are two to 300 times more likely to support established aquatic invasive species (Johnson et al. 2008). Other predictors of angling activity included facility quality (e.g. boat launch presence) and destination size (e.g. lake area), both well-established determinants of site choice in recreational fisheries (Hunt et al. 2019). Taken together, many opportunities exist to integrate angler movement patterns derived from mobile technology with spatiotem-poral data describing propagule pressure and factors related to establishment success.
Timestamped mobile-based data offer opportunities to capture the temporal di-mension of angler movements across the landscape by estimating the duration of time between visits to water-bodies. As most iBobber user movement between water-bodies occurs over relatively short timeframes, our analysis suggests that a greater diversity of potential hitchhikers transported by users will be viable, according to desiccation
Rachel M. Fricke et al. / NeoBiota 60: 97–115 (2020)108
tolerance, upon arrival at a destination water-body. If entrained on angling or boating gear, species with a longer desiccation tolerance, such as the Chinese mystery snail, are more likely to survive and establish (89% of inter-water-body movements taken by iBobber users) than species with shorter tolerances, such as Hydrilla (32% of move-ments) (Havel et al. 2014). As an aside, our literature search returned robust estimates of temporal limitations on desiccation tolerance for relatively few species, suggesting that further studies are needed to clarify the length of time invasive species can with-stand exposure out of water.
Mobile technologies also facilitate road routing of angler movement between fish-ing locations. Geotagged fishing locations are particularly amenable to this method, because they allow us to identify the most likely access point of a water-body, which determines the direction from which anglers may approach a lake or reservoir. Under-standing the spatial configuration of human movement helps identify crucial nexuses across time and space for intercepting hitchhiking invaders. For example, junctions at which frequently-travelled routes between invaded and non-invaded lakes converge can be prioritised for interceptive approaches, such as watercraft inspection stations and recent modelling efforts to optimise the operating times and locations of such stations will benefit tremendously from the fine-scale timing and direction data that mobile sources offer (Fischer et al. 2020).
Angler mobile applications represent a cost-effective approach to understand an-gler-assisted vectors for aquatic invasive species and, in some instances, as in the case of iBobber, offer an opportunity for passive collection of angler activity data. This offers a number of advantages. First, as younger anglers’ participation in fishing increases, mo-bile platforms offer management agencies an opportunity to outreach and learn more about these demographics, as these are also less likely to engage with mail-in or in-person surveys (Fisher 1996; Recreational Boating and Fishing Foundation Outdoor Foundation 2018; Gundeland et al. 2020). Second, mobile-based data provide infor-mation about the movement of a largely unknown group of anglers accessing water-bodies using non-motorised recreational boats, such as canoes and kayaks and who are similarly dispersal vectors for aquatic invasive species (Stasko et al. 2012; Anderson et al. 2014), but are not subject to conventional creel surveys conducted at boat launches. In summary, while prior work has demonstrated that actively collected mobile data (i.e. records of angler presence at a location which must be initiated by the user, such as fishing logs or catch records) generally reflect the spatiotemporal distribution of creel surveys, here we have shown that passively collected data are similarly valuable (Martin et al. 2014; Papenfuss et al. 2015). This is an important distinction, as self-initiated logs of angler presence at a water-body may not include all fished locations (we also recognise that iBobber users may not always use their device). Anglers will likely prefer to record and share trips during which they made a catch and, thus, actively collected data may be prone to success bias.
Though user-generated datasets of angling activity derived from mobile technol-ogy successfully address a number of limitations of traditional creel surveys in terms of their spatiotemporal resolution, they may also introduce new biases. In our analysis, slightly more than half of users only used their iBobber on more than one trip during
A bobber’s perspective on angler-driven vectors of invasive species transmission 109
the two-year period. However, the substantial number of total iBobber users does allow us to infer movement patterns of a large sample population. Angler activity, according to iBobber users, was found to be comparable to estimates according to creel-based data collected at the scale of individual lakes and entire states of the United States. Much like creel surveys, the demographics of users of a particular mobile application or device are also unlikely to be fully representative of the entire population of interest (Hargittai 2015). For example, the cost of a single iBobber starts at 100 USD, thus imposing a socioeconomic filter on which anglers are likely to purchase and use the device. In fact, the number of iBobber users is estimated to represent less than 1% of anglers across the U.S.; this is similar to the proportion of angler populations represented in traditional survey-based approaches. Additionally, iBobber owners must possess a smartphone, because real-time data from an iBobber is communicated to users via the device’s as-sociated phone application. Previous work analysing spatial and demographic biases in other social media applications (Twitter) across the US identified a significant positive influence of higher median income, urbanisation, higher proportion of younger resi-dents and higher proportion of minority residents on the frequency of geotagged posts (Malik et al. 2015). Despite these considerations, it is well recognised that conventional approaches are limited by the tendency to: (1) favour surveying anglers of higher eco-nomic status who own boats, (2) demonstrate biases in gender, age and location of respondents to mail questionnaires (Dempson et al. 2012), in part because of non-re-sponse and recall bias (Tarrant et al. 1993) and (3) potentially measure intended rather than actual angler behaviour (Venturelli et al. 2017). Moving forward, the extent to which demographic biases may influence the conclusions drawn from user-generated datasets about water-bodies remains unclear and should be a priority for future study.
Creel surveys and other traditional data forms continue to be highly valuable sources of information regarding angler movement of invasive species, particularly when implemented by a dedicated team of resource managers and volunteers aiming to intercept identified target species (Cooke et al. 2015). For example, boat inspection station volunteers at a single location can ask boaters which water-body they visited last and cross-reference their responses in databases of invaded water-bodies. However, for the vast majority of water-bodies with limited local funds and resources dedicat-ed to support such intensive outreach efforts, managers working to prevent invasive introductions into an entire state or region may benefit significantly from insights gained from readily-available, even possibly real-time, mobile data. Despite this, such data are often not publicly available and will require data agreements with technol-ogy companies. Moreover, even when data are public (e.g. citizen science initiatives), lack of data sharing with larger initiatives and databases continues to pose a barrier to implementation of emerging data sources in research and management (Johnson et al. 2020). The most effective management strategies will couple an appropriate synthesis of traditional and emerging data sources based on the scope and connectivity of target water-bodies, but this will require a significant investment in web infrastructure to col-late, update and disseminate disparate data sources and formats.
The ongoing creation of fishing-orientated technology and mobile applications pre-sents an exciting opportunity for collaboration amongst researchers, technology devel-
Rachel M. Fricke et al. / NeoBiota 60: 97–115 (2020)110
opers and resource managers. Integration of mobile data into angler network models, for example, could lead to new developments in graph-theory methods to identify the most influential nodes (water-bodies) and edges (pathways between water-bodies) in terms of propagule pressure (Martin et al. 2017), beyond what is currently supported by more limited in-person or mail survey data (e.g. Muirhead and MacIsaac 2005; Stewart-Koster et al. 2015). Ultimately, such network approaches will benefit substantially from incorporation of water-body-level invasive species records to enable identification of movements from invaded to non-invaded water-bodies. Collaborative efforts could also identify long-standing data gaps in understanding angler behaviour (e.g. bait and gear use tendencies) and intentionally request this information in trip logs and user profiles (Venturelli et al. 2017). iBobber users have the option to self-report this information in their application profile, but our analysis of this data revealed that the vast majority leave these fields blank. Application developers often increase platform use through promo-tional incentives, such as gear giveaways and similar incentives could also be developed to encourage profile completion. Bait and gear use are particularly informative for invasive species prevention, as the pool of potential species moved by anglers is dependent on their gear (e.g. bait buckets) and method (shore versus boat) of fishing (Drake and Man-drak 2014). Incorporating more specific data on the type of fishing engaged in by recrea-tional anglers into our understanding of propagule pressure will allow resource managers to further narrow preventative approaches to target the specific species most likely to be relocated between water-bodies, based on common fishing practices in a given region.
Conclusion
Mobile fishing applications and devices such as iBobber represent a valuable new pas-sively-collected mobile data source which, along with other types of actively-collected mobile data (e.g. Papenfuss et al. 2015), offer new opportunities to provide informa-tion about invasive species management, particularly as it relates to propagule pressure from angler behaviour. User-generated, mobile data expand spatiotemporal estimates of angling activity beyond what is possible with traditional creel surveys and poten-tially minimise survey costs. The future holds many exciting possibilities to incorporate both digital user-generated and ground-collected data into modelled social-ecological systems to guide more efficient and effective invasive species prevention campaigns.
Acknowledgements
This work was supported by a Data Science Environments project award from the Gordon and Betty Moore Foundation (Award #2013-10-29) and the Alfred P. Sloan Foundation (Award #3835) to the University of Washington eScience Institute. RMF was supported by Edward Allen Power, W.F. Thompson and Mary Gates En-dowment scholarships. We thank three anonymous reviewers for comments that improved the final paper.
A bobber’s perspective on angler-driven vectors of invasive species transmission 111
References
Anderson LG, White PCL, Stebbing PD, Stentiford GD, Dunn AM (2014) Biosecurity and vector behaviour: Evaluating the potential threat posed by anglers and canoeists as path-ways for the spread of invasive non-native species and pathogens. PLoS ONE 9(4): e92788. https://doi.org/10.1371/journal.pone.0092788
Banha F, Anastácio PM (2014) Desiccation survival capacities of two invasive crayfish species. Knowledge and Management of Aquatic Ecosystems (413): 1–5. https://doi.org/10.1051/kmae/2013084
Barnes MA, Jerde CL, Keller D, Chadderton WL, Howeth JG, Lodge DM (2013) Viability of aquatic plant fragments following desiccation. Invasive Plant Science and Management 6(2): 320–325. https://doi.org/10.1614/IPSM-D-12-00060.1
Berger-Tal O, Lahoz-Monfort JJ (2018) Conservation technology: The next generation. Con-servation Letters 11(6): 1–6. https://doi.org/10.1111/conl.12458
Buchan LAJ, Padilla DK (1999) Estimating the probability of long-distance overland dis-persal of invading aquatic species. Ecological Applications 9(1): 254–265. https://doi.org/10.2307/2641184
Cimino SA, Strecker AL (2018) Boater knowledge and behavior regarding aquatic invasive species at a boat wash station. Northwest Science 92(3): 1–224. https://doi.org/10.3955/046.092.0308
Collas FPL, Koopman KR, Hendriks AJ, van der Velde G, Verbrugge LNH, Leuven RSEW (2014) Effects of desiccation on native and non-native molluscs in rivers. Freshwater Biol-ogy 59(1): 41–55. https://doi.org/10.1111/fwb.12244
Cooke SJ, Arlinghaus R, Johnson BM, Cowx IG (2015) Recreational fisheries in inland wa-ters. In: Craig JF (Ed.) Freshwater Fisheries Ecology. John Wiley & Sons, Ltd., 449–465. https://doi.org/10.1002/9781118394380
Coughlan NE, Cuthbert RN, Kelly TC, Jansen MAK (2018) Parched plants: survival and vi-ability of invasive aquatic macrophytes following exposure to various desiccation regimes. Aquatic Botany 150: 9–15. https://doi.org/10.1016/j.aquabot.2018.06.001
Davis AJS, Darling JA (2017) Recreational freshwater fishing drives non-native aquatic spe-cies richness patterns at a continental scale. Diversity and Distributions 23(6): 692–702. https://doi.org/10.1111/ddi.12557
Dempson JB, Robertson MJ, Cochrane NM, O’Connell MF, Porter G (2012) Changes in angler participation and demographics: Analysis of a 17-year licence stub return system for Atlantic salmon. Fisheries Management and Ecology 19(4): 333–343. https://doi.org/10.1111/j.1365-2400.2012.00848.x
Deville P, Linard C, Martin S, Gilbert M, Stevens FR, Gaughan AE, Blondel VD, Tatem AJ (2014) Dynamic population mapping using mobile phone data. Proceedings of the National Acad-emy of Sciences, USA 111(45): 15888–15893. https://doi.org/10.1073/pnas.1408439111
Drake DAR, Mandrak NE (2010) Least-cost transportation networks predict spatial in-teraction of invasion vectors. Ecological Applications 20(8): 2286–2299. https://doi.org/10.1890/09-2005.1
Drake DAR, Mandrak NE (2014) Bycatch, bait, anglers, and roads: Quantifying vector activ-ity and propagule introduction risk across lake ecosystems. Ecological Applications 24(4): 877–894. https://doi.org/10.1890/13-0541.1
Rachel M. Fricke et al. / NeoBiota 60: 97–115 (2020)112
Epanchin-Niell RS, Hufford MB, Asian CE, Sexton JP, Port JD, Waring TM (2010) Control-ling invasive species in complex social landscapes. Frontiers in Ecology and the Environ-ment 8(4): 210–216. https://doi.org/10.1890/090029
Evans KS, Herriges JA, Kling CL (2011) A Report to the Iowa Department of Natural Re-sources: The Iowa Lakes Valuation Project 2009 Summary and Findings. http://www.card.iastate.edu/lakes/
Fischer SM, Beck M, Herborg LM, Lewis MA (2020) Managing aquatic invasions: optimal locations and operating times for watercraft inspection stations. arXiv:2003.06092v1
Fisher DM, Wood SA, White EM, Blahna DJ, Lange S, Weinberg A, Tomco M, Lia E (2018) Recreational use in dispersed public lands measured using social media data and on-site counts. Journal of Environmental Management 222: 465–474. https://doi.org/10.1016/j.jenvman.2018.05.045
Fisher MR (1996) Estimating the effect of nonresponse bias on angler surveys. Transac-tions of the American Fisheries Society 125: 118–126. https://doi.org/10.1577/1548-8659(1996)125<0118:ETEONB>2.3.CO;2
Fisheries and Oceans Canada (2019) Survey of Recreational Fishing in Canada, 2015. https://waves-vagues.dfo-mpo.gc.ca/Library/40753220.pdf
Gundeland C, Arlinghaus R, Baktoft H, Hyder K, Venturelli P, Skov C (2020) Insights into the users of a citizen science platform for collecting recreational fisheries data. Fisheries Research 229: 105597. https://doi.org/10.1016/j.fishres.2020.105597
Hargittai E (2015) Is bigger always better? Potential biases of big data derived from social net-work sites. Annals of the American Academy of Political and Social Science 659: 63–76. https://doi.org/10.1177/0002716215570866
Hausmann A, Toivonen T, Slotow R, Tenkanen H, Moilanen A, Heikinheimo V, Di Minin E (2018) Social media data can be used to understand tourists’ preferences for nature-based experiences in protected areas. Conservation Letters 11(1): 1–10. https://doi.org/10.1111/conl.12343
Havel JE (2011) Survival of the exotic Chinese mystery snail (Cipangopaludina chinensis mal-leata) during air exposure and implications for overland dispersal by boats. Hydrobiologia 668: 195–202. https://doi.org/10.1007/s10750-010-0566-3
Havel JE, Bruckerhoff LA, Funkhouser MA, Gemberling AR (2014) Resistance to desiccation in aquatic invasive snails and implications for their overland dispersal. Hydrobiologia 741: 89–100. https://doi.org/10.1007/s10750-014-1839-z
Hill RA, Weber MH, Debbout RM, Leibowitz SG, Olsen AR (2018) The Lake-Catchment (LakeCat) Dataset: Characterizing landscape features for lake basins within the contermi-nous USA. Freshwater Science 37(2): 208–221. https://doi.org/10.1086/697966
Hunt LM, Morris DM, Drake DAR, Buckley JD, Johnson TB (2019) Predicting spatial pat-terns of recreational boating to understand potential impacts to fisheries and aquatic eco-systems. Fisheries Research 211: 111–120. https://doi.org/10.1016/j.fishres.2018.11.007
Jerde CL, Barnes MA, DeBuysser EK, Noveroske A, Chadderton WL, Lodge DM (2012) Eura-sian watermilfoil fitness loss and invasion potential following desiccation during simulated overland transport. Aquatic Invasions 7(1): 135–142. https://doi.org/10.1007/s10530-011-0078-8

A bobber’s perspective on angler-driven vectors of invasive species transmission 113
Johnson LE, Ricciardi A, Carlton JT (2001) Overland dispersal of aquatic invasive species: A risk assessment of transient recreational boating. Ecological Applications 11(6): 1789–1799. https://doi.org/10.2307/3061096
Johnson PTJ, Olden JD, Vander Zanden MJ (2008) Dam invaders: Impoundments facili-tate biological invasions into freshwaters. Frontiers in Ecology and the Environment 6(7): 357–363. https://doi.org/10.1890/070156
Johnson BA, Mader AD, Dasgupta R, Kumar P (2020) Citizen science and alien species: An analysis of citizen science initiatives using information and communications technology (ICT) to collect invasive alien species observations. Global Ecology and Conservation 21: e00812. https://doi.org/10.1016/j.gecco.2019.e00812
Joppa LN (2015) Technology for nature conservation: An industry perspective. Ambio 44(4): 522–526. https://doi.org/10.1007/s13280-015-0702-4
Keeler BL, Wood SA, Polasky S, Kling C, Filstrup CT, Downing JA (2015) Recreational de-mand for clean water: Evidence from geotagged photographs by visitors to lakes. Frontiers in Ecology and the Environment 13(2): 76–81. https://doi.org/10.1007/s13280-015-0702-4
Kerfoot WC, Yousef F, Hobmeier MM, Maki RP, Jarnagin ST, Churchill JH (2011) Tem-perature, recreational fishing and diapause egg connections: Dispersal of spiny water fleas (Bythotrephes longimanus). Biological Invasions 13(11): 2513–2531. https://doi.org/10.1007/s13280-015-0702-4
Levin N, Lechner AM, Brown G (2017) An evaluation of crowdsourced information for as-sessing the visitation and perceived importance of protected areas. Applied Geography 79: 115–126. https://doi.org/10.1016/j.apgeog.2016.12.009
Leuven RSEW, Collas FPL, Koopman KR, Matthews J, van der Velde G (2014) Mass mortal-ity of invasive zebra and quagga mussels by desiccation during severe winter conditions. Aquatic Invasions 9(3): 243–252. https://doi.org/10.3391/ai.2014.9.3.02
Lodge DM, Taylor CA, Holdich DM, Skurdal J (2000) Reducing impacts of exotic crayfish introductions: New policies needed. Fisheries 25(8): 21–23.
Malik MM, Lamba H, Nakos C, Pfeffer J (2015) Population bias in geotagged tweets. AAAI Workshop – Technical Report WS-15–18: 18–27. https://www.aaai.org/ocs/index.php/ICWSM/ICWSM15/paper/view/10662/10551
Martin DR, Christopher JC, Eskridge KM, Pope KL (2014) Using posts to an online social network to assess fishing effort. Fisheries Research 157: 24–27. https://doi.org/10.1016/j.fishres.2014.03.013
Martin DR, CJ Chizinski, Pope KL (2017) Network analysis of a regional fishery: Implications for management of natural resources, and recruitment and retention of anglers. Fisheries Research 194: 31–41. https://doi.org/10.1016/j.fishres.2017.05.007
Meekan MG, Duarte CM, Fernández-Gracia J, Thums M, Sequeira AMM, Harcourt R, Eguíl-uz VM (2017) The ecology of human mobility. Trends in Ecology and Evolution 32(3): 198–210. https://doi.org/10.1016/j.tree.2016.12.006
Minchin D, Maguire C, Rosell R (2003) The zebra mussel (Dreissena polymorpha Pallas) invades Ireland: Human mediated vectors and the potential for rapid intranational dispersal. Biol-ogy and Environment 103(1): 23–30. https://doi.org/10.3318/BIOE.2003.103.1.23

Rachel M. Fricke et al. / NeoBiota 60: 97–115 (2020)114
Mogollón B, Villamagna AM (2014) Updating the manager׳s toolbox: Mapping spatio-tempo-ral trends in freshwater fishing. Journal of Outdoor Recreation and Tourism 7–8: 89–95. https://doi.org/10.1016/j.jort.2014.09.009
Monkman GG, Kaiser MJ, Hyder K (2018) Text and data mining of social media to map wild-life recreation activity. Biological Conservation 228: 89–99. https://doi.org/10.1016/j.biocon.2018.10.010
Muirhead JR, MacIsaac HJ (2005) Development of inland lakes as hubs in an invasion network. Journal of Applied Ecology 42(1): 80–90. https://doi.org/10.1111/j.1365-2664.2004.00988.x
Papenfuss JT, Phelps N, Fulton D, Venturelli PA (2015) Smartphones reveal angler behavior: A case study of a popular mobile fishing application in Alberta, Canada. Fisheries 40(7): 318–327. https://doi.org/10.1080/03632415.2015.1049693
Peters JA, Lodge DM (2009) Invasive species policy at the regional level: A multiple weak links problem. Fisheries 34(8): 373–380. https://doi.org/10.1577/1548-8446-34.8.373
Pimm SL, Alibhai S, Bergl R, Dehgan A, Giri C, Jewell Z, Joppa L, Kays R, Loarie S (2015) Emerging technologies to conserve biodiversity. Trends in Ecology and Evolution 30(11): 685–696. https://doi.org/10.1016/j.tree.2015.08.008
van Poorten BT, Brydle S (2018) Estimating fishing effort from remote traffic counters: Op-portunities and challenges. Fisheries Research 204: 231–238. https://doi.org/10.1016/j.fishres.2018.02.024
Reaser JK, Burgiel SW, Kirkey J, Brantley KA, Veatch SD, Burgos-Rodríguez J (2020) The early detection of and rapid response (EDRR) to invasive species: a conceptual framework and federal capacities assessment. Biological Invasions 22(1): 1–19. https://doi.org/10.1007/s10530-019-02156-w
Recreational Boating and Fishing Foundation (2018) 2018 Special Report on Fishing. https://outdoorindustry.org/wp-content/uploads/2015/03/2018-Special-Report-on-Fishing_FI-NAL.pdf
Ricciardi A, Serrouya R, Whoriskey FG (1995) Aerial exposure tolerance of zebra and quagga mussels (Bivalvia: Dreissenidae): Implications for overland dispersal. Canadian Journal of Fisheries and Aquatic Sciences 52: 470–477. https://doi.org/10.1139/f95-048
Rodgers KD (2017) A reservoir morphology database for the conterminous United States. Page Data Series. Reston. https://doi.org/10.3133/ds1062
Rothlisberger JD, Chadderton WL, McNulty J, Lodge DM (2010) Aquatic invasive species transport via trailered boats: What is being moved, who is moving it, and what can be done. Fisheries 35(3): 121–132. https://doi.org/10.1577/1548-8446-35.3.121
Sharp RL, Cleckner LB, DePillo S (2017) The impact of on-site educational outreach on recre-ational users’ perceptions of aquatic invasive species and their management. Environmental Education Research 23(8): 1200–1210. https://doi.org/10.1577/1548-8446-35.3.121
Smith ERC, Bennion H, Sayer CD, Aldridge DC, Owen M (2020) Recreational angling as a pathway for invasive non-native species spread: awareness of biosecurity and the risk of long distance movement into Great Britain. Biological Invasions 22(3): 1135–1159. https://doi.org/10.1007/s10530-019-02169-5
A bobber’s perspective on angler-driven vectors of invasive species transmission 115
Stasko AD, Patenaude T, Strecker AL, Arnott SE (2012) Portage connectivity does not predict establishment success of canoe-mediated dispersal for crustacean zooplankton. Aquatic Ecology 46: 9–24. https://doi.org/10.1007/s10452-011-9378-4
Stewart-Koster B, Olden JD, Johnson PT (2015) Integrating landscape connectivity and habi-tat suitability to guide offensive and defensive invasive species management. Journal of Applied Ecology 52(2): 366–378. https://doi.org/10.1111/1365-2664.12395
Tarrant MA, Manfredo MJ, Bayley PB, Hess R (1993) Effects of recall bias and nonresponse bias on self-report estimates of angling participation. North American Journal of Fisheries Management 13(2): 217–222. https://doi.org/10.1577/1548-8675(1993)013<0217:EORBAN>2.3.CO;2
Toivonen T, Heikinheimo V, Fink C, Hausmann A, Hiippala T, Järv O, Tenkanen H, Di Minin E (2019) Social media data for conservation science: A methodological overview. Biologi-cal Conservation 233: 298–315. https://doi.org/10.1016/j.biocon.2019.01.023
U.S. Department of the Interior, U.S. Fish and Wildlife Service, U.S. Department of Com-merce, U.S. Census Bureau (2011) National Survey of Fishing, Hunting, and Wildlife-associated Recreation. https://www.census.gov/library/publications/2014/demo/fhw-11-nat.html
U.S. Department of the Interior, U.S. Fish and Wildlife Service, U.S. Department of Com-merce, U.S. Census Bureau (2016) National Survey of Fishing, Hunting, and Wildlife-associated Recreation. https://www.census.gov/library/publications/2018/demo/fhw-16-nat.html
U.S. Geological Survey (2018) Nonindigenous Aquatic Species Database. Gainesville, Florida. [Accessed 6/1/2018] https://nas.er.usgs.gov/
U.S. Geological Survey (2019) National Hydrography Dataset (ver. USGS National Hydrog-raphy Dataset Best Resolution (NHD) for Hydrologic Unit (HU) 4 – 2001). [Accessed 4/10/2019] https://www.usgs.gov/core-science-systems/ngp/national-hydrography/access-national-hydrography-products
Venturelli PA, Hyder K, Skov C (2017) Angler apps as a source of recreational fisheries data: opportunities, challenges and proposed standards. Fish and Fisheries 18(3): 578–595. htt-ps://doi.org/10.1111/faf.12189
Wisconsin Department of Natural Resources (2016) Surface Water Integrated Monitoring Sys-tem. [Accessed 9/20/2019] http://dnr.wi.gov/topic/surfacewater/swims/
Wilson JRU, Dormontt EE, Prentis PJ, Lowe AJ, Richardson DM (2009) Something in the way you move: dispersal pathways affect invasion success. Trends in Ecology and Evolution 24(3): 136–144. https://doi.org/10.1016/j.tree.2008.10.007
Wood AM, Haro CR, Haro RJ, Sandland GJ (2011) Effects of desiccation on two life stages of an invasive snail and its native cohabitant. Hydrobiologia 675(1): 167–174. https://doi.org/10.1007/s10750-011-0814-1
Wood SA, Guerry AD, Silver JM, Lacayo M (2013) Using social media to quantify nature-based tourism and recreation. Scientific Reports 3(1): 1–2976. https://doi.org/10.1038/srep02976