a biplanar x-ray method for three-dimensional analysis … · new standard for evidence-based...
TRANSCRIPT
Palaeontologia Electronica palaeo-electronica.org
PE Article Number: 16.1.1TCopyright: Palaeontological Association January 2013Submission: 13 April 2012. Acceptance: 4 January 2013
Ellis, Richard G. and Gatesy, Stephen M. 2013. A biplanar X-ray method for three-dimensional analysis of track formation, Palaeontologia Electronica Vol. 16, Issue 1; 1T, 16p; palaeo-electronica.org/content/2013/371-x-ray-track-analysis
A biplanar X-ray method for three-dimensional analysis of track formation
Richard G. Ellis and Stephen M. Gatesy
ABSTRACT
Tracks arise through a complex interplay between animal and substrate. Studyingthis dynamic process is challenging because most foot-sediment and sediment-sedi-ment interactions are rapid and hidden from view. Herein, we describe a new methodfor visualizing and quantifying three-dimensional movements of both a morphologicallyaccurate indenter and realistic sediment during track formation. Our method usesbiplanar X-ray imaging and an animation-based workflow to reconstruct the trajectoriesof metal beads seeded throughout the sediment volume. X-rays allow sub-surfacemotion normally concealed by the foot and opaque matrix to be analyzed at 30 framesper second with sub-millimeter resolution. Results from two case studies of tridactyltracks in semi-liquid mud provide novel, animated visualizations, examples of ensem-ble and particle-specific data, as well as measures of precision and accuracy. Thismethodology has the potential to mechanistically link specific track morphologies tofoot movement, clarify undertrack formation, validate computational models, and set anew standard for evidence-based reconstruction of locomotion from fossil footprints.
Richard G. Ellis. Department of Ecology and Evolutionary Biology, Brown University, Providence, Rhode Island, USA and Structure and Motion Lab, The Royal Veterinary College, Hawkshead Lane, North Mymms, Hatfield, Hertfordshire, AL9 7TA United Kingdom [email protected] M. Gatesy (correspondence author). Department of Ecology and Evolutionary Biology, Brown University, Providence, Rhode Island, USA [email protected]
Keywords: track formation; three-dimensional motion analysis; experimental methods; X-ray; footkinematics
ELLIS AND GATESY: X-RAY TRACK ANALYSIS
2
INTRODUCTION
Many tetrapod tracks form as the foot plungesinto, moves through, and withdraws from the sub-strate. Track morphology can be further altered bysubsequent settlement, compression, and erosion.Given that the ichnological record preserves only afinal snapshot of this entire process, reconstructingdetails of foot kinematics from fossil tracks remainsa complex problem. Such difficulty is amplified fordeep tracks, as the relationship between footmovement and sub-surface track morphology isstill poorly understood.
We seek to explore a fundamental question inichnology: how do sedimentary particles movefrom their starting locations in untrod ground totheir ultimate resting places? Our goal is to developa method to follow the three-dimensional trajectoryof individual particles within a substrate volumeduring track formation. A technique that can relatesediment displacement, both spatially and tempo-rally, to the moving foot throughout a step wouldhelp reveal the origin, modification, and interactionof specific track features, as well as their useful-ness for motion reconstruction.
Experimental studies using layered clay, sand,cement, and plaster have revealed basic patternsof sub-surface deformation created by simplepunches (Allen, 1989, 1997), more realistic footmodels (Manning, 2004; Jackson et al., 2009,2010), and severed feet (Milàn and Bromley, 2006,2008). Such approaches are well suited for docu-menting the distortion of interfaces between layers,but are unable to discern the displacement of sedi-ment within each layer (Gatesy, 2003). Indentedarrays of square Plasticine prisms have providedadditional detail (Allen, 1997), but spatial resolutionremains limited. All of these methods involveopaque materials that require destructive section-ing or splitting, which precludes dynamic analysisof the sequence of track formation.
Herein, we describe the novel application ofbiplanar X-ray video to study footprints. Hardwareand software tools originally created for capturingthree-dimensional skeletal motion (Brainerd et al.,2010; Gatesy et al., 2010) are applied to recon-struct both foot movement and particle trajectoriesduring track development. We present results fromtwo case studies using artificial mud laced withmetal beads, which serve as markers. In the first, arigid cast model mounted on a linear actuator wasrepeatedly plunged down and forward into the sed-iment. In the second series, a cadaver turkey footwas manipulated to emulate a more realistic step-ping motion. We report the X-ray system’s accu-
racy and precision for tracing three-dimensionalkinematics, present examples of the novel datathat can be acquired, and discuss the strengthsand weaknesses of the method.
METHODS
Overview
Our general approach involves animating thethree-dimensional trajectory of radio-dense beadsseeded in a volume of sediment using two (bipla-nar) X-ray beams oriented approximately 90°apart. Following distortion correction and calibra-tion, “virtual cameras” are created with the three-dimensional animation software Maya 2010(Autodesk, Inc.) so that paired video frames can beviewed from the perspectives of the real X-raysources. Digital bead models are aligned to theircorresponding images in each frame and used toreconstruct three-dimensional trajectories of sedi-ment markers as well as the position and orienta-tion of the indenter. Such animations serve asaccurate visualizations of track formation and pro-vide the raw data for quantitative analysis.
X-ray Hardware, Settings, Distortion Correction, and Calibration
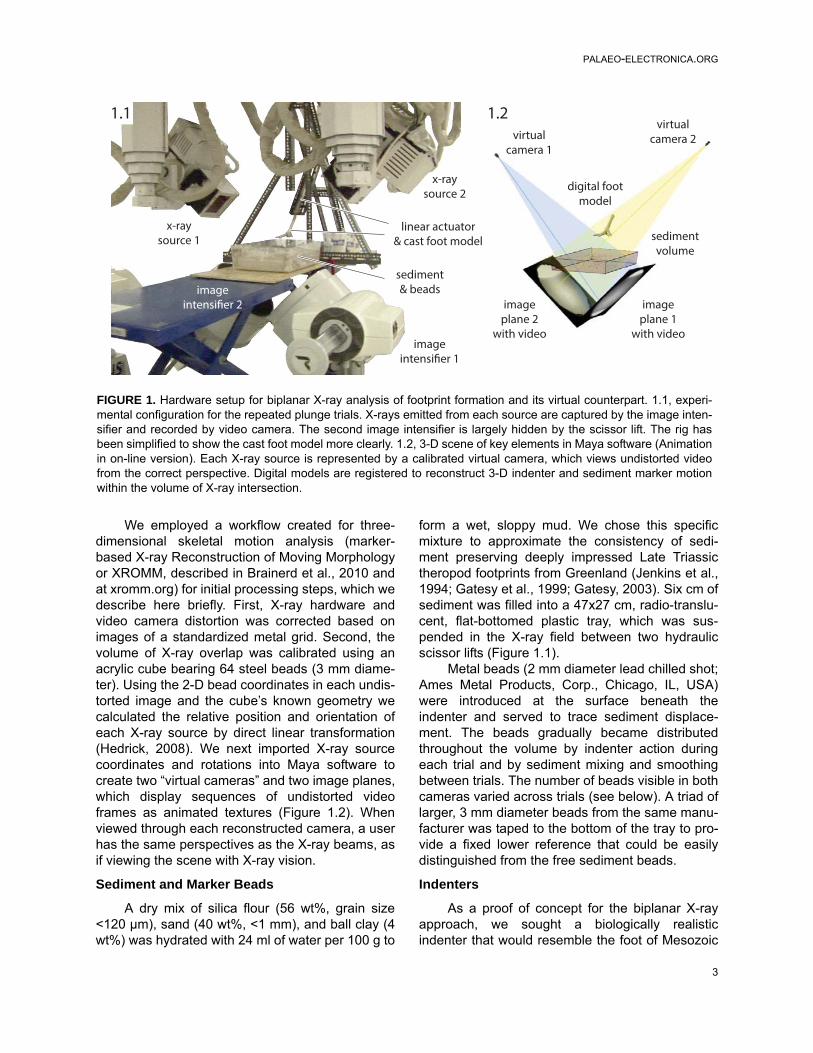
Video recordings were made in the W.M. KeckFoundation XROMM Facility, a custom-built bipla-nar X-ray room at Brown University (Figure 1.1).The facility contains two X-ray generation andrecording systems, each of which consists of anEMD Technologies model EPS 45-80 pulsed X-raygenerator, a Varian model G-1086 X-ray tube sus-pended from the ceiling on a telescoping crane, aDunlee model TH9447QXH590 image intensifier(40.64 cm diameter) mounted on a mobile-armbase, and a Phantom v9.1 high-speed digital videocamera. The imaging chain achieves an overallresolution of approximately 2.3 line pairs/mm.
Two X-ray beams were oriented downward atapproximately +45° and -45° from vertical to inter-sect at the sediment volume. Source to image dis-tances were 96 cm and 105 cm. A 30 Hz pulsedbeam (5 ms duration) of 110 kV and 320 mA pro-duced images that were recorded at 1808x1800pixel resolution and 30 fps with an exposure time of700 μs. These X-ray energies were higher thanthose used in traditional skeletal recordings, butwere required to penetrate the dense sedimentmixture. All trials were also recorded from aboveusing a high definition video camera (Sony Handy-cam HDR-FX1; 30 fps) to document the exposedindenter and sediment surface.
PALAEO-ELECTRONICA.ORG
3
We employed a workflow created for three-dimensional skeletal motion analysis (marker-based X-ray Reconstruction of Moving Morphologyor XROMM, described in Brainerd et al., 2010 andat xromm.org) for initial processing steps, which wedescribe here briefly. First, X-ray hardware andvideo camera distortion was corrected based onimages of a standardized metal grid. Second, thevolume of X-ray overlap was calibrated using anacrylic cube bearing 64 steel beads (3 mm diame-ter). Using the 2-D bead coordinates in each undis-torted image and the cube’s known geometry wecalculated the relative position and orientation ofeach X-ray source by direct linear transformation(Hedrick, 2008). We next imported X-ray sourcecoordinates and rotations into Maya software tocreate two “virtual cameras” and two image planes,which display sequences of undistorted videoframes as animated textures (Figure 1.2). Whenviewed through each reconstructed camera, a userhas the same perspectives as the X-ray beams, asif viewing the scene with X-ray vision.
Sediment and Marker Beads
A dry mix of silica flour (56 wt%, grain size<120 μm), sand (40 wt%, <1 mm), and ball clay (4wt%) was hydrated with 24 ml of water per 100 g to
form a wet, sloppy mud. We chose this specificmixture to approximate the consistency of sedi-ment preserving deeply impressed Late Triassictheropod footprints from Greenland (Jenkins et al.,1994; Gatesy et al., 1999; Gatesy, 2003). Six cm ofsediment was filled into a 47x27 cm, radio-translu-cent, flat-bottomed plastic tray, which was sus-pended in the X-ray field between two hydraulicscissor lifts (Figure 1.1).
Metal beads (2 mm diameter lead chilled shot;Ames Metal Products, Corp., Chicago, IL, USA)were introduced at the surface beneath theindenter and served to trace sediment displace-ment. The beads gradually became distributedthroughout the volume by indenter action duringeach trial and by sediment mixing and smoothingbetween trials. The number of beads visible in bothcameras varied across trials (see below). A triad oflarger, 3 mm diameter beads from the same manu-facturer was taped to the bottom of the tray to pro-vide a fixed lower reference that could be easilydistinguished from the free sediment beads.
Indenters
As a proof of concept for the biplanar X-rayapproach, we sought a biologically realisticindenter that would resemble the foot of Mesozoic
FIGURE 1. Hardware setup for biplanar X-ray analysis of footprint formation and its virtual counterpart. 1.1, experi-mental configuration for the repeated plunge trials. X-rays emitted from each source are captured by the image inten-sifier and recorded by video camera. The second image intensifier is largely hidden by the scissor lift. The rig hasbeen simplified to show the cast foot model more clearly. 1.2, 3-D scene of key elements in Maya software (Animationin on-line version). Each X-ray source is represented by a calibrated virtual camera, which views undistorted videofrom the correct perspective. Digital models are registered to reconstruct 3-D indenter and sediment marker motionwithin the volume of X-ray intersection.
1.2
linear actuator& cast foot model
imageintensifier 1
sediment& beads
x-raysource 1
x-raysource 2
imageplane 2
with video
imageplane 1
with video
sedimentvolume
digital footmodel
virtualcamera 1
virtualcamera 2
imageintensifier 2
1.1
ELLIS AND GATESY: X-RAY TRACK ANALYSIS
4
theropods responsible for deep tracks in Green-land (Jenkins et al., 1994; Gatesy et al., 1999) andthe Connecticut Valley (Hitchcock, 1858, Rainforth,2005). Rather than sculpting a model based on fos-sil material, we used the severed right foot of amale turkey, in accordance with previous emuexperiments (Milàn and Bromley, 2006, 2008).
Case Study 1: Repeatable Plunge Trials
For our first series of recordings, we created arigid cast turkey model to simplify foot kinematicsas much as possible. To more closely approximatethe inferred primitive theropod condition (Gatesy etal., 1999; Padian, 2003), we wired the severed tur-key foot to a foam block with the tarsometarsusraised 30° above the plane of the toes and the hal-
lux pointed anteromedially. The foot was then fro-zen, molded in silicon putty (Knead-A-Mold, A2ZSolutions), and cast with polyurethane (Por-A-KastMark 2; Synair Corp.). To calculate rigid body kine-matics, we marked the plastic foot cast with fourlead beads (3 mm diameter) secured with cyano-acrylate adhesive into drilled pits in the dorsal sur-face near the base of tarsometatarsus, midwayalong digit II, and on the claws of digits III and IV.We further modified the cast by removing the meta-tarsal spur and trimming the interdigital webbing.We created a digital copy using a MicroScan3Dlaser sensor system mounted to a MicroScribeMLX articulated arm (RSI, Oberursel, Germany) tocollect a point cloud and form a polygonal model.In Maya software, we hand fit sphere models to the
2.1b
2.1a
2.1c
2.2
2.3
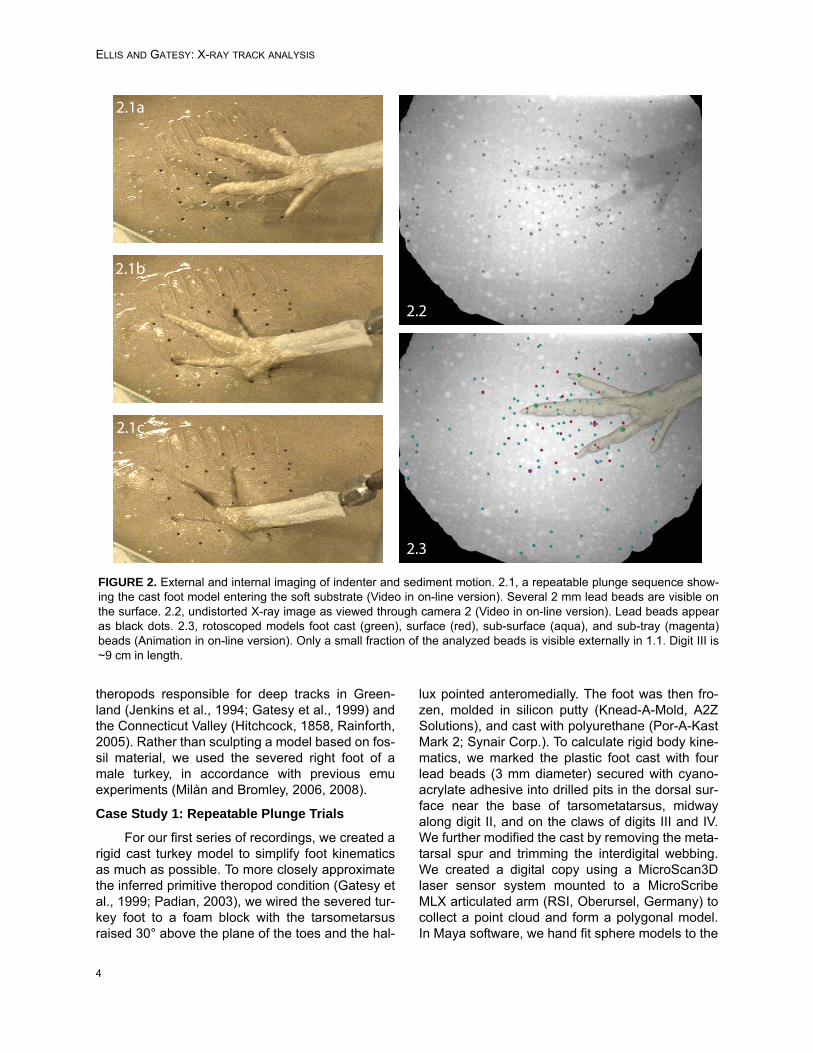
FIGURE 2. External and internal imaging of indenter and sediment motion. 2.1, a repeatable plunge sequence show-ing the cast foot model entering the soft substrate (Video in on-line version). Several 2 mm lead beads are visible onthe surface. 2.2, undistorted X-ray image as viewed through camera 2 (Video in on-line version). Lead beads appearas black dots. 2.3, rotoscoped models foot cast (green), surface (red), sub-surface (aqua), and sub-tray (magenta)beads (Animation in on-line version). Only a small fraction of the analyzed beads is visible externally in 1.1. Digit III is~9 cm in length.

PALAEO-ELECTRONICA.ORG
5
locations of the polygonal foot mesh representingeach implanted bead.
We plunged the foot model into the sedimentat 39° below horizontal to within 1.5 cm of the bot-tom using an electric linear actuator (20.3 cmtravel; McMaster-Carr) mounted on a rigid metalframe (Figures 1.1, 2.1). Approximately 50 beads(2 mm diameter) were placed on the mud’s surfacein the first trial. We conducted a total of 14 trials,adding beads between sequences to reach a maxi-mum of approximately 190 markers, not all ofwhich appeared in both X-ray videos.
Case Study 2: Full Motion Trials
For our second series of recordings, the intactfoot was manipulated through the sediment with amore realistic motion pattern. To increase X-rayvisibility in the dense substrate, we implanted 3mm markers in the proximal/distal tarsometatarsus,spur, and ungual of each digit, as well 2 mm diame-ter beads along the length of digits II-IV. Werecorded two artificial tracks by simulating both footentry and withdrawal using the thawed cadaver tur-key foot. A long wooden dowel firmly fastened tothe tarsometatarsus allowed us to manipulate thefoot by hand from a safe distance above the X-rayfield. We manually spread the toes, plunged thefoot down and forward into the sediment, androtated the tarsometatarsus prior to withdrawal. Wemimicked stance flexion and toe convergenceduring liftoff by applying tension to the flexor digito-rum longus tendon with a stiff, braided string andsurgical hemostat (Gatesy et al., 1999).
Bead and Foot Animation
Calibration of the three-dimensional spaceallows the creation of virtual cameras in Maya ani-mation software that match the relative positionsand orientations of the X-ray beams in the realworld. By viewing undistorted pairs of video framesfrom these perspectives, we reconstructed eachbead’s three-dimensional position by rotoscoping.Rotoscoping entails simultaneously aligning or reg-istering a digital sphere model to its two X-rayshadows (Figure 2.2, 2.3; as described in Gatesyet al., 2010). We saved or “keyed” each model’sXYZ coordinates for multiple frames. Maya soft-ware automatically interpolates between thesekeyframes to form a continuous animation. Notevery frame required registration; keyframes couldbe widely spaced in periods of bead stasis.
We animated the cast foot using the coordi-nates of its four embedded beads, which wereexported to calculate the rigid body kinematics of
the bead cluster. Three translations and three rota-tions computed by singular value decomposition(Söderkvist and Wedin, 1993) were applied to thedigital foot model (Brainerd et al., 2010). For therepeatable series, the consistent motion of the lin-ear actuator permitted us to combine data from the14 plunges. We temporally aligned each trial andthen imported all foot and bead animations into asingle animation that summarized the plungeresults. For the full step trials, we animated the 11foot markers and linked them together with cylin-ders to create a simplified stick representation.
RESULTS
Field of View, Precision, and Accuracy
In our specific configuration, the two conicalX-ray beams (Figure 1) intersected to form a bipla-nar volume totaling ~18000 cm3 (Beyer et al.,1987). Of this, sediment filled a roughly rectangularregion 22 cm long, 27 cm wide, and 6 cm deep,resulting in ~3600 cm3 of sediment imaged by bothcameras for three-dimensional analysis.
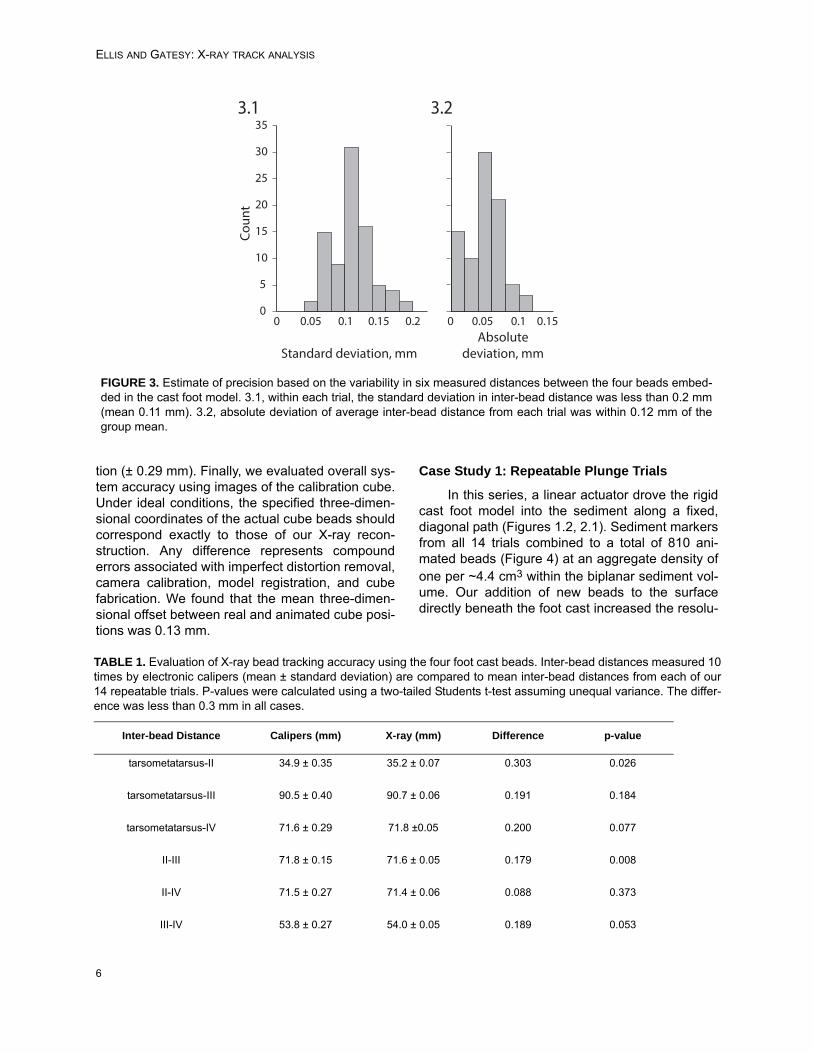
To validate the biplanar X-ray approach toparticle analysis, we used four different metrics toensure that reconstructed bead positions throughtime reflect true three-dimensional motion. As awhole, the distributed sediment markers do nothave a fixed or know geometry, but the spatial rela-tionship among the four beads embedded in thecast foot remained constant in repeatable trials.We therefore calculated six inter-bead distances ateach of the first 65 frames of the 14 repeatableplunge trials. Within each trial, the standard devia-tion in distance between any two foot beads aver-aged only 0.11 mm (Figure 3.1). Moreover, acrossall 14 trials the average inter-bead distance fromeach trial was within 0.12 mm of the group mean(Figure 3.2). Together, these suggest that inter-and intra-trial variability were less than ~0.12 mmfor our setup and analysis method under dynamicconditions. These findings are consistent withthose of Miranda et al. (2011) for this hardwaresystem.
To test that the X-ray method did not introducea systematic bias, we measured inter-bead dis-tances among the model foot beads 10 times withstandard electronic calipers. We compared thesemeasurements to the average distance betweenany two markers across our 14 trials average(Table 1). Although inter-bead distances rangedfrom ~35 mm to ~91 mm, the two measurementtechniques yielded results within 0.3 mm in allcases, which is comparable to our caliper resolu-
ELLIS AND GATESY: X-RAY TRACK ANALYSIS
6
tion (± 0.29 mm). Finally, we evaluated overall sys-tem accuracy using images of the calibration cube.Under ideal conditions, the specified three-dimen-sional coordinates of the actual cube beads shouldcorrespond exactly to those of our X-ray recon-struction. Any difference represents compounderrors associated with imperfect distortion removal,camera calibration, model registration, and cubefabrication. We found that the mean three-dimen-sional offset between real and animated cube posi-tions was 0.13 mm.
Case Study 1: Repeatable Plunge Trials
In this series, a linear actuator drove the rigidcast foot model into the sediment along a fixed,diagonal path (Figures 1.2, 2.1). Sediment markersfrom all 14 trials combined to a total of 810 ani-mated beads (Figure 4) at an aggregate density ofone per ~4.4 cm3 within the biplanar sediment vol-ume. Our addition of new beads to the surfacedirectly beneath the foot cast increased the resolu-
3.1 3.2
0 0.05 0.15 0.20
5
15
20
25
30
35
0 0.05 0.1 0.15Absolute
deviation, mm
Cou
nt
0.1
Standard deviation, mm
10
FIGURE 3. Estimate of precision based on the variability in six measured distances between the four beads embed-ded in the cast foot model. 3.1, within each trial, the standard deviation in inter-bead distance was less than 0.2 mm(mean 0.11 mm). 3.2, absolute deviation of average inter-bead distance from each trial was within 0.12 mm of thegroup mean.
TABLE 1. Evaluation of X-ray bead tracking accuracy using the four foot cast beads. Inter-bead distances measured 10times by electronic calipers (mean ± standard deviation) are compared to mean inter-bead distances from each of our14 repeatable trials. P-values were calculated using a two-tailed Students t-test assuming unequal variance. The differ-ence was less than 0.3 mm in all cases.
Inter-bead Distance Calipers (mm) X-ray (mm) Difference p-value
tarsometatarsus-II 34.9 ± 0.35 35.2 ± 0.07 0.303 0.026
tarsometatarsus-III 90.5 ± 0.40 90.7 ± 0.06 0.191 0.184
tarsometatarsus-IV 71.6 ± 0.29 71.8 ±0.05 0.200 0.077
II-III 71.8 ± 0.15 71.6 ± 0.05 0.179 0.008
II-IV 71.5 ± 0.27 71.4 ± 0.06 0.088 0.373
III-IV 53.8 ± 0.27 54.0 ± 0.05 0.189 0.053

PALAEO-ELECTRONICA.ORG
7
tion within this 660 cm3 sub-volume of interest toan average density of one per ~1.9 cm3.
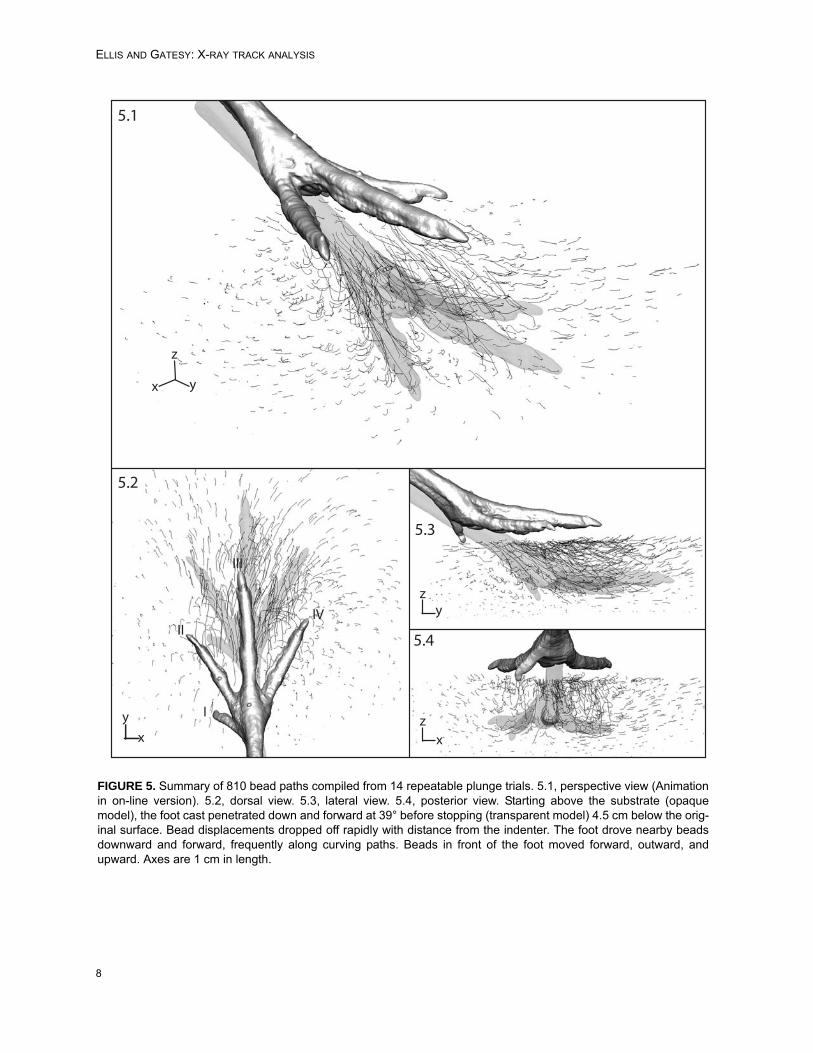
For an overall picture, we depict the recon-structed three-dimensional paths of all 810 beadmodels as an ensemble displacement field (Figure5). From their starting positions prior to foot con-tact, bead locations are shown every 33.3 ms forthe 1.43 s interval sediment was in motion. Mark-ers directly in the indenter’s path exhibited the lon-gest and most complex displacements; those farfrom the foot model (Figure 5.2) or very deep (Fig-ure 5.3, 5.4) had limited movement. Markersbeneath the foot were driven forward and down,while those in front moved forward and up (Figure5.3). Only 242 of the 810 beads (~30%) showednet downward motion.
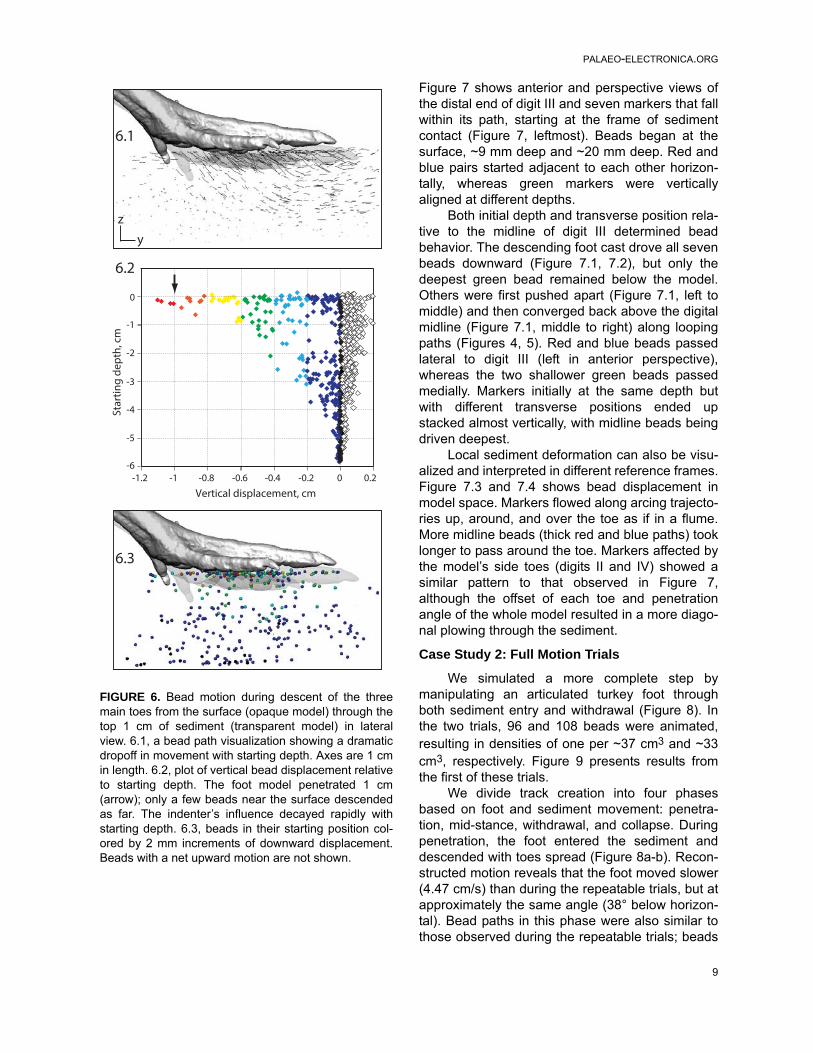
We next explore subsets of the completedataset to address specific spatial and temporalaspects of track formation. Figure 6 shows bead
motion during the period in which the model’s threemain toes descend through the top 1 cm of sedi-ment. In lateral view, bead paths showed a dra-matic drop-off in length with starting depth (Figure6.1). We can also quantify specific dimensionduring this interval. For example, plotting verticaldisplacement versus starting depth shows thesteep gradient in maximum descent (Figure 6.2).Only a few shallow beads moved down as much asthe indenter (arrow). Beads starting 3 cm below thesurface mostly moved anteriorly, with maximumdescent decaying to less than 3 mm. Markers nearthe bottom demonstrated almost no verticalchange. We can also view this spatial patternthrough differential coloring of beads in their posi-tions prior to foot contact (Figure 6.3).
Our method provides high resolution data,allowing us to examine the trajectories of specificparticles of interest with respect to the indenter.
x y
z
FIGURE 4. Position of 810 beads and the foot cast model compiled from 14 repeatable plunge trials (Animation in on-line version). Axes are 1 cm in length.
ELLIS AND GATESY: X-RAY TRACK ANALYSIS
8
5.3
5.4
5.2
I
II
III
IV
5.1
yz
xz
xy
x y
z
FIGURE 5. Summary of 810 bead paths compiled from 14 repeatable plunge trials. 5.1, perspective view (Animationin on-line version). 5.2, dorsal view. 5.3, lateral view. 5.4, posterior view. Starting above the substrate (opaquemodel), the foot cast penetrated down and forward at 39° before stopping (transparent model) 4.5 cm below the orig-inal surface. Bead displacements dropped off rapidly with distance from the indenter. The foot drove nearby beadsdownward and forward, frequently along curving paths. Beads in front of the foot moved forward, outward, andupward. Axes are 1 cm in length.
PALAEO-ELECTRONICA.ORG
9
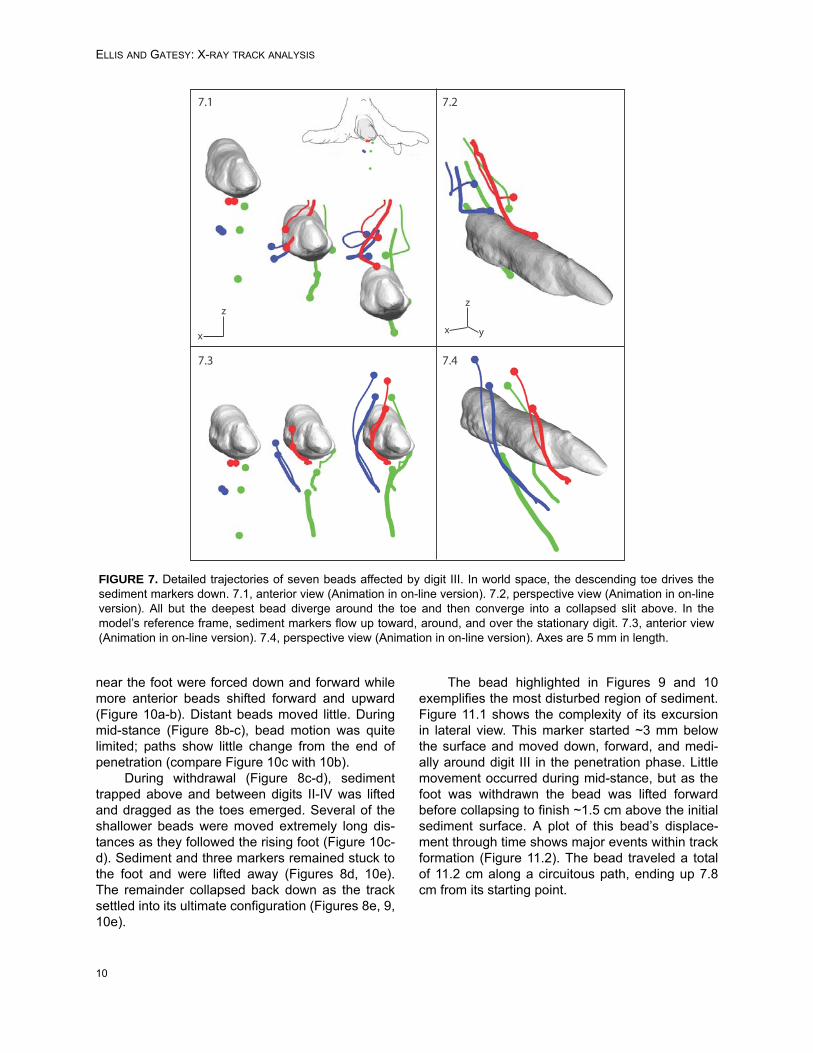
Figure 7 shows anterior and perspective views ofthe distal end of digit III and seven markers that fallwithin its path, starting at the frame of sedimentcontact (Figure 7, leftmost). Beads began at thesurface, ~9 mm deep and ~20 mm deep. Red andblue pairs started adjacent to each other horizon-tally, whereas green markers were verticallyaligned at different depths.
Both initial depth and transverse position rela-tive to the midline of digit III determined beadbehavior. The descending foot cast drove all sevenbeads downward (Figure 7.1, 7.2), but only thedeepest green bead remained below the model.Others were first pushed apart (Figure 7.1, left tomiddle) and then converged back above the digitalmidline (Figure 7.1, middle to right) along loopingpaths (Figures 4, 5). Red and blue beads passedlateral to digit III (left in anterior perspective),whereas the two shallower green beads passedmedially. Markers initially at the same depth butwith different transverse positions ended upstacked almost vertically, with midline beads beingdriven deepest.
Local sediment deformation can also be visu-alized and interpreted in different reference frames.Figure 7.3 and 7.4 shows bead displacement inmodel space. Markers flowed along arcing trajecto-ries up, around, and over the toe as if in a flume.More midline beads (thick red and blue paths) tooklonger to pass around the toe. Markers affected bythe model’s side toes (digits II and IV) showed asimilar pattern to that observed in Figure 7,although the offset of each toe and penetrationangle of the whole model resulted in a more diago-nal plowing through the sediment.
Case Study 2: Full Motion Trials
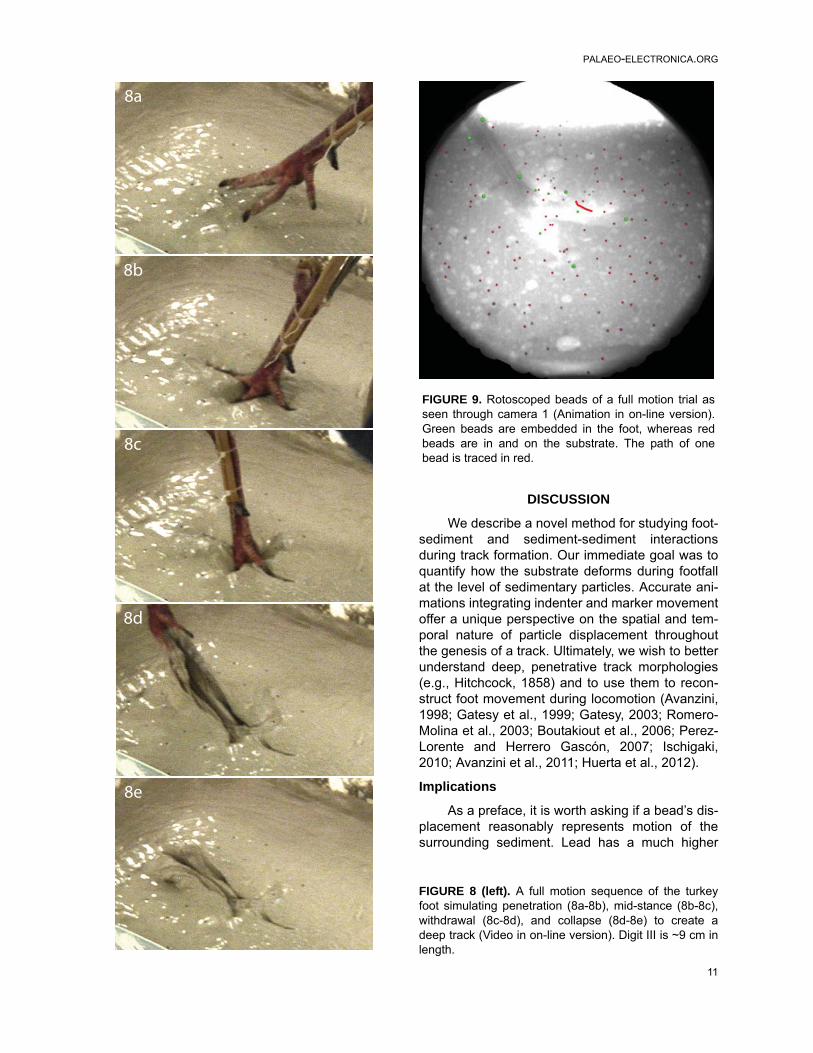
We simulated a more complete step bymanipulating an articulated turkey foot throughboth sediment entry and withdrawal (Figure 8). Inthe two trials, 96 and 108 beads were animated,resulting in densities of one per ~37 cm3 and ~33cm3, respectively. Figure 9 presents results fromthe first of these trials.
We divide track creation into four phasesbased on foot and sediment movement: penetra-tion, mid-stance, withdrawal, and collapse. Duringpenetration, the foot entered the sediment anddescended with toes spread (Figure 8a-b). Recon-structed motion reveals that the foot moved slower(4.47 cm/s) than during the repeatable trials, but atapproximately the same angle (38° below horizon-tal). Bead paths in this phase were also similar tothose observed during the repeatable trials; beads
y
z
6.2
6.1
6.3
Star
ting
dept
h, c
m
0.20-0.2-0.4-0.6-0.8-1-1.2
Vertical displacement, cm
0
-1
-2
-3
-4
-5
-6
FIGURE 6. Bead motion during descent of the threemain toes from the surface (opaque model) through thetop 1 cm of sediment (transparent model) in lateralview. 6.1, a bead path visualization showing a dramaticdropoff in movement with starting depth. Axes are 1 cmin length. 6.2, plot of vertical bead displacement relativeto starting depth. The foot model penetrated 1 cm(arrow); only a few beads near the surface descendedas far. The indenter’s influence decayed rapidly withstarting depth. 6.3, beads in their starting position col-ored by 2 mm increments of downward displacement.Beads with a net upward motion are not shown.
ELLIS AND GATESY: X-RAY TRACK ANALYSIS
10
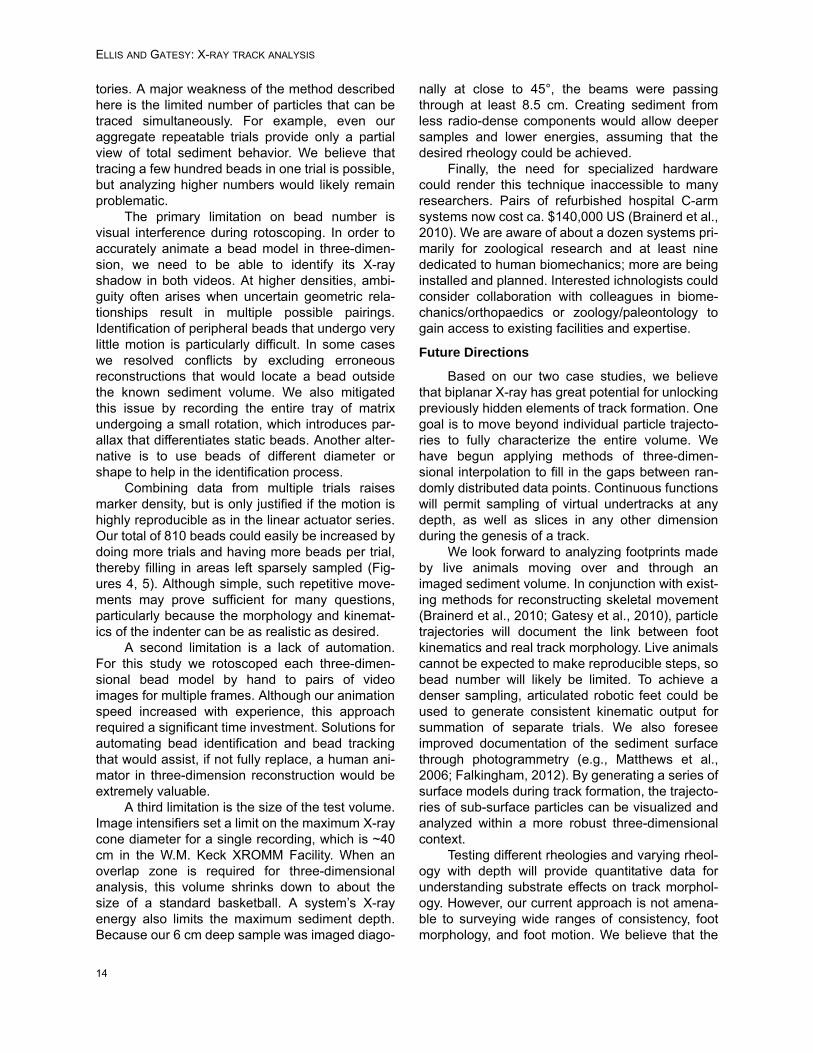
near the foot were forced down and forward whilemore anterior beads shifted forward and upward(Figure 10a-b). Distant beads moved little. Duringmid-stance (Figure 8b-c), bead motion was quitelimited; paths show little change from the end ofpenetration (compare Figure 10c with 10b).
During withdrawal (Figure 8c-d), sedimenttrapped above and between digits II-IV was liftedand dragged as the toes emerged. Several of theshallower beads were moved extremely long dis-tances as they followed the rising foot (Figure 10c-d). Sediment and three markers remained stuck tothe foot and were lifted away (Figures 8d, 10e).The remainder collapsed back down as the tracksettled into its ultimate configuration (Figures 8e, 9,10e).
The bead highlighted in Figures 9 and 10exemplifies the most disturbed region of sediment.Figure 11.1 shows the complexity of its excursionin lateral view. This marker started ~3 mm belowthe surface and moved down, forward, and medi-ally around digit III in the penetration phase. Littlemovement occurred during mid-stance, but as thefoot was withdrawn the bead was lifted forwardbefore collapsing to finish ~1.5 cm above the initialsediment surface. A plot of this bead’s displace-ment through time shows major events within trackformation (Figure 11.2). The bead traveled a totalof 11.2 cm along a circuitous path, ending up 7.8cm from its starting point.
x
z
x y
z
7.3 7.4
7.1 7.2
FIGURE 7. Detailed trajectories of seven beads affected by digit III. In world space, the descending toe drives thesediment markers down. 7.1, anterior view (Animation in on-line version). 7.2, perspective view (Animation in on-lineversion). All but the deepest bead diverge around the toe and then converge into a collapsed slit above. In themodel’s reference frame, sediment markers flow up toward, around, and over the stationary digit. 7.3, anterior view(Animation in on-line version). 7.4, perspective view (Animation in on-line version). Axes are 5 mm in length.
PALAEO-ELECTRONICA.ORG
11
DISCUSSION
We describe a novel method for studying foot-sediment and sediment-sediment interactionsduring track formation. Our immediate goal was toquantify how the substrate deforms during footfallat the level of sedimentary particles. Accurate ani-mations integrating indenter and marker movementoffer a unique perspective on the spatial and tem-poral nature of particle displacement throughoutthe genesis of a track. Ultimately, we wish to betterunderstand deep, penetrative track morphologies(e.g., Hitchcock, 1858) and to use them to recon-struct foot movement during locomotion (Avanzini,1998; Gatesy et al., 1999; Gatesy, 2003; Romero-Molina et al., 2003; Boutakiout et al., 2006; Perez-Lorente and Herrero Gascón, 2007; Ischigaki,2010; Avanzini et al., 2011; Huerta et al., 2012).
Implications
As a preface, it is worth asking if a bead’s dis-placement reasonably represents motion of thesurrounding sediment. Lead has a much higher
8a
8b
8c
8d
8e
FIGURE 8 (left). A full motion sequence of the turkeyfoot simulating penetration (8a-8b), mid-stance (8b-8c),withdrawal (8c-8d), and collapse (8d-8e) to create adeep track (Video in on-line version). Digit III is ~9 cm inlength.
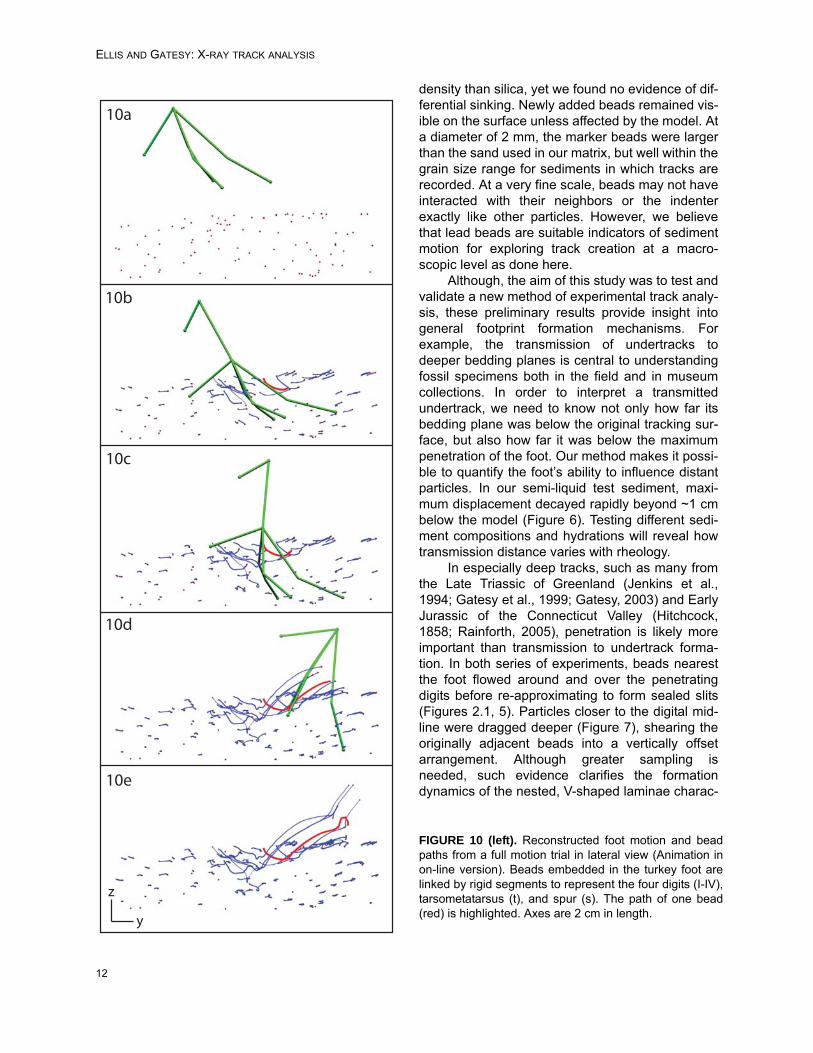
FIGURE 9. Rotoscoped beads of a full motion trial asseen through camera 1 (Animation in on-line version).Green beads are embedded in the foot, whereas redbeads are in and on the substrate. The path of onebead is traced in red.
ELLIS AND GATESY: X-RAY TRACK ANALYSIS
12
density than silica, yet we found no evidence of dif-ferential sinking. Newly added beads remained vis-ible on the surface unless affected by the model. Ata diameter of 2 mm, the marker beads were largerthan the sand used in our matrix, but well within thegrain size range for sediments in which tracks arerecorded. At a very fine scale, beads may not haveinteracted with their neighbors or the indenterexactly like other particles. However, we believethat lead beads are suitable indicators of sedimentmotion for exploring track creation at a macro-scopic level as done here.
Although, the aim of this study was to test andvalidate a new method of experimental track analy-sis, these preliminary results provide insight intogeneral footprint formation mechanisms. Forexample, the transmission of undertracks todeeper bedding planes is central to understandingfossil specimens both in the field and in museumcollections. In order to interpret a transmittedundertrack, we need to know not only how far itsbedding plane was below the original tracking sur-face, but also how far it was below the maximumpenetration of the foot. Our method makes it possi-ble to quantify the foot’s ability to influence distantparticles. In our semi-liquid test sediment, maxi-mum displacement decayed rapidly beyond ~1 cmbelow the model (Figure 6). Testing different sedi-ment compositions and hydrations will reveal howtransmission distance varies with rheology.
In especially deep tracks, such as many fromthe Late Triassic of Greenland (Jenkins et al.,1994; Gatesy et al., 1999; Gatesy, 2003) and EarlyJurassic of the Connecticut Valley (Hitchcock,1858; Rainforth, 2005), penetration is likely moreimportant than transmission to undertrack forma-tion. In both series of experiments, beads nearestthe foot flowed around and over the penetratingdigits before re-approximating to form sealed slits(Figures 2.1, 5). Particles closer to the digital mid-line were dragged deeper (Figure 7), shearing theoriginally adjacent beads into a vertically offsetarrangement. Although greater sampling isneeded, such evidence clarifies the formationdynamics of the nested, V-shaped laminae charac-
st
II
I
IVIII
y
z
10a
10b
10c
10d
10e
FIGURE 10 (left). Reconstructed foot motion and beadpaths from a full motion trial in lateral view (Animation inon-line version). Beads embedded in the turkey foot arelinked by rigid segments to represent the four digits (I-IV),tarsometatarsus (t), and spur (s). The path of one bead(red) is highlighted. Axes are 2 cm in length.

PALAEO-ELECTRONICA.ORG
13
teristic of penetrative tracks (Olsen, 2002; Gatesy,2003; Rainforth, 2005).
The more complete tracks made with thearticulated turkey foot leave us optimistic aboutreconstructing motion from deep fossil tracks(Gatesy et al., 1999; Gatesy, 2003; Romero-Molinaet al., 2003; Boutakiout et al., 2006; Perez-Lorenteand Herrero Gascón, 2007; Ischigaki, 2010; Avan-zini et al., 2011; Huerta et al., 2012). Foot with-drawal left obvious exit traces (Figure 8) similar tothose seen in live birds and described from Green-land (Gatesy et al., 1999). In Figure 11 we empha-size the complex journey of one bead, but not allunderwent such large movements. Many beadsdisplaced during penetration were relatively unaf-fected by withdrawal (Figure 10), suggesting thatevidence of all phases of ground contact can sur-vive to enter the fossil record.
Advantages of a Biplanar X-ray Approach
The primary benefit of our method is the abilityto study the three-dimensional dynamics of sub-surface phenomena normally concealed within anopaque matrix. In this we follow previous workersthat used X-rays to image burrowing invertebrates(Howard, 1968; Charboneau et al., 1997; Gingraset al., 2008), fish (Gidmark et al., 2011), and lizards(Maladen et al., 2009). For footprints, however, ourgoal was to visualize and quantify motion of notonly the organism, but also of the sediment itself.In both of our case studies, marker beads near thefoot followed long and kinematically interesting
paths that would not be accessible using traditionaltechniques. Knowing which sediment remains rela-tively undisturbed is equally important, as differen-tial displacement is the essence of track formation.
Our animation-based approach also providesaccess to poorly understood temporal aspects oftrack formation dynamics. Destructive experimen-tal studies provide only single snapshots of the cre-ation process (Allen, 1989, 1997; Manning, 2004;Milàn and Bromley, 2006, 2008; Jackson et al.,2009, 2010). A layered substrate can be used oncebefore being sectioned or disassembled, so aseries of trials must be aborted at different stagesto reconstruct a sequence (e.g., Allen, 1997). TheX-ray method provides as much temporal resolu-tion as desired. We recorded at 30 fps, but thevideo cameras connected to the image intensifiersare capable of rates as fast as 1000 fps if needed.
Biplanar X-ray studies also offer an unprece-dented opportunity to validate computer simula-tions. As models of foot-sediment and sediment-sediment interactions become more and moresophisticated (e.g., Falkingham et al., 2009;Maladen et al., 2011), the need to ground-truthsynthetic footprints becomes essential. Actualthree-dimensional trajectories of sub-surface mark-ers offer rich new data for evaluating simulatedsediment displacements.
Caveats and Possible Solutions
Thorough characterization of sediment motionrequires reconstruction of many, many bead trajec-
11.1
Dis
plac
emen
t, cm
11.2
0 1 2 3 4 5 6
Time, seconds
0
2
4
6
8
10
12
mid-stance
mid-stance
pre-contact
collapse
collapse
untrod surface
release
release
penetration
penetration
withdra
wal
withdrawal
pre-contact
directionof travel
y
z
FIGURE 11. Motion of the bead highlighted in Figures 9 and 10. 11.1, lateral view of the bead’s trajectory (one pointper frame) relative to the undisturbed sediment surface. Major events and the penetration, mid-stance, withdrawal,and collapse phases are designated. Axes are 1 cm in length. 11.2, cumulative displacement versus time graph.Phases of the tracking event are distinguished by changes in velocity (slope).
ELLIS AND GATESY: X-RAY TRACK ANALYSIS
14
tories. A major weakness of the method describedhere is the limited number of particles that can betraced simultaneously. For example, even ouraggregate repeatable trials provide only a partialview of total sediment behavior. We believe thattracing a few hundred beads in one trial is possible,but analyzing higher numbers would likely remainproblematic.
The primary limitation on bead number isvisual interference during rotoscoping. In order toaccurately animate a bead model in three-dimen-sion, we need to be able to identify its X-rayshadow in both videos. At higher densities, ambi-guity often arises when uncertain geometric rela-tionships result in multiple possible pairings.Identification of peripheral beads that undergo verylittle motion is particularly difficult. In some caseswe resolved conflicts by excluding erroneousreconstructions that would locate a bead outsidethe known sediment volume. We also mitigatedthis issue by recording the entire tray of matrixundergoing a small rotation, which introduces par-allax that differentiates static beads. Another alter-native is to use beads of different diameter orshape to help in the identification process.
Combining data from multiple trials raisesmarker density, but is only justified if the motion ishighly reproducible as in the linear actuator series.Our total of 810 beads could easily be increased bydoing more trials and having more beads per trial,thereby filling in areas left sparsely sampled (Fig-ures 4, 5). Although simple, such repetitive move-ments may prove sufficient for many questions,particularly because the morphology and kinemat-ics of the indenter can be as realistic as desired.
A second limitation is a lack of automation.For this study we rotoscoped each three-dimen-sional bead model by hand to pairs of videoimages for multiple frames. Although our animationspeed increased with experience, this approachrequired a significant time investment. Solutions forautomating bead identification and bead trackingthat would assist, if not fully replace, a human ani-mator in three-dimension reconstruction would beextremely valuable.
A third limitation is the size of the test volume.Image intensifiers set a limit on the maximum X-raycone diameter for a single recording, which is ~40cm in the W.M. Keck XROMM Facility. When anoverlap zone is required for three-dimensionalanalysis, this volume shrinks down to about thesize of a standard basketball. A system’s X-rayenergy also limits the maximum sediment depth.Because our 6 cm deep sample was imaged diago-
nally at close to 45°, the beams were passingthrough at least 8.5 cm. Creating sediment fromless radio-dense components would allow deepersamples and lower energies, assuming that thedesired rheology could be achieved.
Finally, the need for specialized hardwarecould render this technique inaccessible to manyresearchers. Pairs of refurbished hospital C-armsystems now cost ca. $140,000 US (Brainerd et al.,2010). We are aware of about a dozen systems pri-marily for zoological research and at least ninededicated to human biomechanics; more are beinginstalled and planned. Interested ichnologists couldconsider collaboration with colleagues in biome-chanics/orthopaedics or zoology/paleontology togain access to existing facilities and expertise.
Future Directions
Based on our two case studies, we believethat biplanar X-ray has great potential for unlockingpreviously hidden elements of track formation. Onegoal is to move beyond individual particle trajecto-ries to fully characterize the entire volume. Wehave begun applying methods of three-dimen-sional interpolation to fill in the gaps between ran-domly distributed data points. Continuous functionswill permit sampling of virtual undertracks at anydepth, as well as slices in any other dimensionduring the genesis of a track.
We look forward to analyzing footprints madeby live animals moving over and through animaged sediment volume. In conjunction with exist-ing methods for reconstructing skeletal movement(Brainerd et al., 2010; Gatesy et al., 2010), particletrajectories will document the link between footkinematics and real track morphology. Live animalscannot be expected to make reproducible steps, sobead number will likely be limited. To achieve adenser sampling, articulated robotic feet could beused to generate consistent kinematic output forsummation of separate trials. We also foreseeimproved documentation of the sediment surfacethrough photogrammetry (e.g., Matthews et al.,2006; Falkingham, 2012). By generating a series ofsurface models during track formation, the trajecto-ries of sub-surface particles can be visualized andanalyzed within a more robust three-dimensionalcontext.
Testing different rheologies and varying rheol-ogy with depth will provide quantitative data forunderstanding substrate effects on track morphol-ogy. However, our current approach is not amena-ble to surveying wide ranges of consistency, footmorphology, and foot motion. We believe that the

PALAEO-ELECTRONICA.ORG
15
greatest strength of biplanar X-ray imaging lies inits ability to ground-truth computer simulations.Once well-validated, the digital environment will bethe better place to explore the many combinationsof parameters involved in track formation.
Ultimately, we believe motion analysis usingbiplanar X-rays fosters a unique, particle-basedperspective that has much to offer. Horizontal bed-ding typically limits ichnologists to studying sur-faces at layer interfaces. Yet changes in layerthickness, depth, and shape only come aboutthrough the more fundamental spatial reconfigura-tion of their affiliated particles. Our approachrecords motion within each layer in all dimensions,not just depth, during track formation
CONCLUSIONS
We describe a biplanar X-ray method forstudying footprint formation dynamics using an ani-mation-based workflow. Ensemble bead paths pro-vide unprecedented visualization of the changingdisplacement field. The system’s high accuracyand precision permits detailed, quantitative analy-sis of local, regional, and global sediment reconfig-uration relative to the foot. By unlocking previouslyinaccessible dimensions of sediment motion, a par-ticle-based approach generates crucial data formodel validation, promotes a truly three-dimen-sional perspective of track formation, and providesnovel insight into the genesis of track morphology.
ACKNOWLEDGEMENTS
We thank J. Whiteside and B. Brainerd fortheir advice and support, P. Falkingham for fruitfuldiscussions, and two reviewers for critical com-ments. M. Dawson assisted throughout the X-rayprocedures and K. Wellspring provided help withspecimens in the Beneski Museum of Natural His-tory, Amherst College. Supported by National Sci-ence Foundation grants IOS- 0925077 and DBI-0552051, the W.M. Keck Foundation, the BushnellFamily Research and Education Fund, andAutodesk, Inc.
REFERENCES
Allen, J.R.L. 1989. Fossil vertebrate tracks and indentermechanics. Journal of the Geological Society Lon-don, 146:600–602.
Allen, J.R.L. 1997. Subfossil mammalian tracks (Flan-drian) in the Severn Estuary, S.W. Britain: mechanicsof formation, preservation and distribution. Philo-sophical Transcript of the Royal Society of London,352:481–518.
Avanzini, M. 1998. Anatomy of a footprint: bioturbationas a key to understanding dinosaur walk dynamics.Ichnos 6:129–139.
Avanzini, M., Piñuela, L., and Garcia-Ramos, J.C. 2011.Late Jurassic footprints reveal walking kinematics oftheropod dinosaurs. Lethaia 45:238–252.
Beyer, W.A., Fawcett, L.R., Mauldin, R.D., and Swartz,B.K. 1987. The volume common to two congruent cir-cular cones whose axes intersect symmetrically.Journal of Symbolic Computation, 4:381–390.
Boutakiout, M., Hadri, M., Naouri, J., Caro, S., andPérez-Lorente, F. 2006. The syngenetic structuresuite of dinosaur footprints in finely laminated sand-stones: site n°1 of Bin el Ouidane (1BO; CentralAtlas, Morocco). Ichnos 13:69–79.
Brainerd, E.L., Baier, D.B., Gatesy, S.M., Hedrick, T.L.,Metzger, K.A., Gilbert, S.L., and Crisco, J.J. 2010. X-ray reconstruction of moving morphology (XROMM):precision, accuracy and applications in comparativebiomechanics research. Journal of ExperimentalZoology, 313A:262–279.
Charbonneau, P., Hare, L., and Carignan, R. 1997. Useof X-ray images and a contrasting agent to study thebehavior of animals in soft sediments. Limnology andOceanography, 42:1823–1828.
Falkingham, P.L. 2012. Acquisition of high resolution 3Dmodels using free, open-source, photogrammetricsoftware. Palaeontologia Electronica, 15(1):15p.
Falkingham, P.L., Margetts, L., Smith, I.M., and Manning,P.L. 2009. Reinterpretation of palmate and semi-pal-mate (webbed) fossil tracks; insights from finite ele-ment modeling. Palaeogeography, Paleoclimatology,Palaeoecology, 271:69–76.
Gatesy, S.M. 2003. Direct and indirect track features:what sediment did a dinosaur touch? Ichnos, 10:91–98.
Gatesy, S.M., Baier, D.B., Jenkins, F.A. Jr., and Dial, K.P.2010. Scientific rotoscoping: a morphology-basedmethod of 3-D motion analysis and visualization.Journal of Experimental Zoology, 313A:244–261.
Gatesy, S.M., Middleton, K.M., Jenkins, F.A., Jr., andShubin, N.H. 1999. Three dimensional preservationof foot movements in Triassic theropod dinosaurs.Nature, 399:141–144.
Gidmark, N.J., Strother, J.A., Horton, J.M, Summers,A.P., and Brainerd, E.L. 2011. Locomotory transitionfrom water to sand and its effects on undulatory kine-matics in sand lances (Ammodytidae). Journal ofExperimental Biology, 214:657–664.
Gingras, M.K., Pemberton, S.G., Dashtgard, S., andDafoe, L. 2008. How fast do marine invertebratesburrow? Palaeogeography, Palaeoclimatology,Palaeoecology, 270:280–286.
Hedrick, T.L. 2008. Software techniques for two- andthree-dimensional kinematic measurements of bio-logical and biomimetic systems. Bioinspiration & Bio-mimetics, 3:6p.
ELLIS AND GATESY: X-RAY TRACK ANALYSIS
16
Hitchcock, E. 1858. Ichnology of New England: a reporton the sandstone of the Connecticut Valley, espe-cially its fossil footmarks, made to the government ofthe Commonwealth of Massachusetts, W. White, 220p.
Howard, J.D. 1968. X-ray radiography for examination ofburrowing in sediments by marine invertebrateorganisms. Sedimentology, 11:249–258.
Huerta, P., Torcida Fernández-Baldor, F., Farlow, J.O.,and Montero, D. 2012. Exceptional preservation pro-cesses of 3D dinosaur footprint casts in Costalomo(Lower Cretaceous, Cameros Basin, Spain). TerraNova 00:1–6.
Ishigaki, S. 2010. Theropod trampled bedding plane withlaboring trackways from the Upper CretaceousAbdrant Nuru fossil site, Mongolia. HayashibaraMuseum of Natural Sciences Research Bulletin3:133–141.
Jackson, S.J., Whyte, M.A., and Romano, M. 2009. Lab-oratory-controlled simulations of dinosaur footprintsin sand: a key to understanding vertebrate track for-mation and preservation. Palaios, 24:222–238.
Jackson, S.J., Whyte, M.A., and Romano, M. 2010.Range of experimental dinosaur (Hypsilophodonfoxii) footprints due to variation in sand consistency:how wet was the track? Ichnos, 17:197–214.
Jenkins, F.A., Jr., Shubin, N.H., Amaral, W.W., Gatesy,S.M., Schaff, C.R., Clemmensen, L.B., Downs, W.R.,Davidson, A.R., Bonde, N., and Osbaeck, F. 1994.Late Triassic continental vertebrates and depositionalenvironments of the Fleming Fjord Formation,Jameson Land, East Greenland. Meddelelser omGrønland, Geoscience, 32:1–25.
Maladen, R.D., Ding, Y., Li, C., and Goldman, D.I. 2009.Undulatory swimming in sand: subsurface locomo-tion of the sandfish lizard. Science, 325:314–318.
Maladen, R.D., Ding, Y., Umbanhowar, P.B., Kamor, A.,and Goldman, D.I. 2011. Mechanical models of sand-fish locomotion reaveal principles of high perfor-mance subsurface sand-swimming. Journal of theRoyal Society Interface, 8:1332–1345.
Manning, P.L. 2004. A new approach to the analysis andinterpretation of tracks: examples from the dinosau-ria. The Application of Ichnology to Paleoenviron-mental and Stratigraphic Analysis. GeologicalScoiety of London Special Publications, 228:93–123.
Matthews, N.A., Noble, T.A., and Breithaupt, B.H. 2006.The application of photogrammetry, remote sensingand geographic information systems (GIS) to fossilresource management. Bulletin New MexicoMuseum of Natural History and Science, 34:119–131.
Milàn, J. and Bromley, R.G. 2006. True tracks, under-tracks and eroded tracks, experimental work with tet-rapod tracks in laboratory and field.Palaeogeography, Palaeoclimatology, Palaeoecol-ogy, 231:253–264.
Milàn, J. and Bromely, R.G. 2008. The impact of sedi-ment consistency on track and undertrack morphol-ogy: experiments with emu tracks in layered cement.Ichnos, 15:19–27.
Miranda, D.L., Schwartz, J.B., Loomis, A.C., Brainerd,E.L., Fleming, B.C., and Crisco, J.J. 2011. Static anddynamic error of a biplanar videoradiography systemusing marker-based and markerless tracking tech-niques. Journal of Biomechanical Engineering,133:8p.
Olsen, P.E. 2002. Field guide for non-marine boundaryevents in the Newark Basin (New Jersey, Pennsylva-nia, and Connecticut), Eastern United States andtheir litho-, chrono- and biostratigraphic context.Guidebooks for Field Workshops of the InternationalGeological Correlation Programme, 458:181p.
Padian, K.P. 2003. Pterosaur stance and gait and theinterpretation of trackways. Ichnos, 10:115–126.
Pérez-Lorente, F. and Herrero Gascón, J. 2007. El movi-miento de un dinosaurio deducido de una rastrilladaterópoda con estructuras de inmersión de los pies enbarro y de arrastre de cola (Formación Villar DelArzobispo. Galve, Teruel, España). Revista Españolade Paleontología 22:157–174.
Rainforth, E.C. 2005. Ichnotaxonomy of the fossil foot-prints of the Connecticut Valley (Early Jurassic, New-ark Supergroup, Connecticut and Massachusetts).PhD dissertation, Columbia University, 1302p.
Romero-Molina, M.M., Sargeant, W.A.S., Pérez-Lorente,F., López, A., and Requeta, E. 2003. Orientation andcharacteristics of theropod trackways from the LasLosas palaeoichnological site. Ichnos 10:241–254.
Söderkvist, R. and Wedin, P. 1993. Determining themovements of the skeleton using well-configuredmarkers. Journal of Biomechanics, 26:1473–1477.
Thulborn, R.A. 1990. Dinosaur Tracks. London: Chap-man & Hall.