a baseline assessment of attitudes and behaviours in the silviculture industry
TRANSCRIPT

���������������� ������������������������������������������������������������������������������������������������������������������������������������������������������������������� !!"����
��#�����$����%�������������&����������

Table of Contents
Introduction 1 1 Methodology 2
1.1 The Sample 2 1.2 The Questionnaires 5 1.3 Interviews 6
2 Results of the Research 7 2.1 Demographics and Experience 7
2.1.1 Job Titles 7 2.1.2 Years Planting 8 2.1.3 Years With Company 8 2.1.4 Days Worked in Season 9 2.1.5 Age 9 2.1.6 Sex 9 2.1.7 BC Resident 10 2.1.8 Education 10 2.1.9 Classification 10 2.1.10 Demographic Summary 11
2.2 Health and Safety Performance and Compliance Indicators 11 2.2.1 Likelihood of Planters to Engage in Unsafe Behavior 14 2.2.2 Likelihood of Others to Engage in Unsafe Behavior 15 2.2.3 Expectations Among Planters for Supervisors to Correct Unsafe Behavior 16 2.2.4 Likelihood of Supervisors to Correct Unsafe Behavior 17 2.2.5 Importance for Supervisors to Correct Unsafe Behavior 18 2.2.6 Likelihood of Planters to Refuse Unsafe Work 19 2.2.7 Likelihood of Planters to Report Unsafe Behavior 20 2.2.8 Likelihood of Supervisors to Engage in Unsafe Behavior 21 2.2.9 Likelihood of Other Supervisors to Engage in Unsafe Behavior 22 2.2.10 Importance of Correcting Unsafe Behavior Among Supervisors 23
2.3 General Workplace Attitudes and Perceptions 24 2.4 Summary of Data and Assessing Change Over Time 28
3 Relating Variables 29 3.1 Individual Behavior and Perceptions of Others: Planters 29 3.2 Individual Behavior and Perceptions of Others: Supervisors 30 3.3 Gaps Between the Workforce Strata 31 3.4 Age, Experience, and Compliance 32 3.5 Job-site and Compliance 34 3.6 Earnings, Competition and Compliance 36
4 Recommendations 37 5 Acknowledgements 39 6 References 39

1
Introduction This report contains a detailed summary of a field research project on health and safety in the tree planting sector of the silviculture industry. The research took place during the summer of 2004, and was supported by the Forest Industry Safety Association (FISA) and the Western Silviculture Contractors Association (WSCA). The project focused on attitudes and behaviors related to health and safety in the workplace, and included detailed information on the demographic makeup of the workforce. The head researcher, Jordan Tesluk, is a graduate student in the Simon Fraser University School of Criminology. He has sat on the FISA Silvicultural Advisory Committee since the summer of 2003, and has spent 11 years planting trees in British Columbia. His experience in the workplace and participation with industry members in safety program development has informed this project. Additional consultation on this research was provided by members of the FISA Silvicultural Advisory Committee. This report does not concentrate heavily on the methodology or other academic issues. Instead, it focuses on providing a comprehensible summary of the research in a readily accessible format. In short, this report has been written for the industry, about the industry. It is assumed that those reading this report will already have a basic understanding of the industry and its environment. The main purpose of this report is to identify the characteristics of the workforce, and provide a baseline assessment of the range of attitudes and behaviors in the industry. This information will be useful for developing programs for the industry, assessing changes in attitudes and behaviors within the workforce, and for informing future inquiries into the field. The main body of this research focuses specifically on compliance with occupational health and safety regulations. This issue has been investigated by assessing the likelihood of workers to engage in behaviors that would be deemed to be violations of the Occupational Health and Safety Regulation, and their attitudes and expectations towards such activities. It is acknowledged that compliance with appropriate health and safety regulations is only one of many factors that affect health and safety in the workplace. However, it is assumed that recognition of and compliance with appropriate regulations is a critical step in the creation and maintenance of a safe workplace. The term health and safety “performance” is used in this report to generally refer to the likelihood of workers to engage in unsafe behavior, combined with the attitudes, expectations, and other behaviors they exhibit. The term “workers” includes both planters and supervisors, while the term “supervisors includes camp supervisors, forepersons, checkers, and any worker performing supervisory duties.1 The first section of this report will supply a brief explanation of the research strategy, explain the sampling method, and provide a brief description of the questionnaires used in the research. The second section will provide a summary of the data, including a general assessment of the baseline levels of health and safety performance in the industry. These measures are the main focus of this report. They are the primary measures to which future assessments of health and safety in the industry may be compared, and the foundation for more complex forms of analysis. The third section will explore some of the more complex patterns of attitudes and behavior in the workplace, and examine some of the issues that were considered to be important by members of the industry. A number of recommendations will be made at the end of this section for program development and the administration of health and safety within the workplaces.
1 In order to avoid confusion, these distinctions were made clear to respondents when filling out the questionnaires.

2
1 Methodology
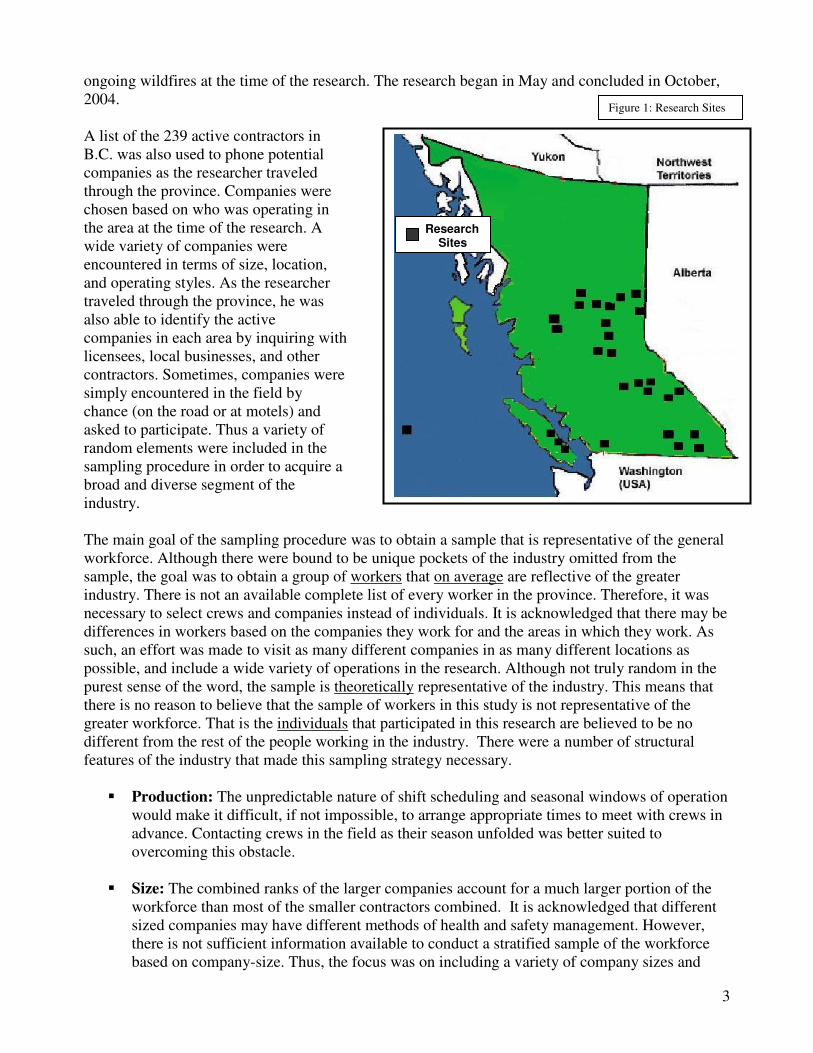
1.1 The Sample The main instrument used in the research was an 11-page questionnaire that was distributed to each worker in each workplace visited. This included planters, forepersons, supervisors, and checkers, but not kitchen staff. Overall, the research was extremely well received, indicating a strong interest in health and safety issues within the workforce. Over 35 contractors were contacted during the course of the research, and only one declined to participate. There were many other contractors who offered to participate, but could not be worked into the research schedule in the limited time that was available. The participation rate within the worksites was also very high, with an overall response rate of 84.9% (15.1% non-response). The response rate was equal among supervisory personnel and planters. The response rate was calculated by comparing the numbers of collected responses with the number of workers present at the worksite according to the supervisor. This response rate actually understates the willingness of the workforce to participate in the research. Fourteen workers were not issued questionnaires because they had been encountered at previous worksites. Also, many workers were missed simply because they were busy with other activities at the time the questionnaires were distributed, or had not yet returned from work. As such, there may have been many more workers willing to participate that were included in the 15.1% non-response group. It was exceedingly rare for anyone to explicitly refuse the questionnaire. A total of 669 questionnaires were collected, and 8 were omitted from the final results2, yielding a total of 661 valid responses (see table 1). The size of the sample allows for the observations to be made with a confidence interval of (plus/minus) 4% at a confidence level of 95%. According to the rules of probability, this means that any basic statistics observed in the sample can be assumed to be within 4% of the greater workforce population.3 Twenty-seven different worksites were visited during the research, including members and non-members of the WSCA. Crew sizes varied from only 5, to more than 100. Work locations were visited in the interior and on the coast, with a mixture of camp, hotel, and commuter crews included in the coverage. A general map (see figure 1) of the research sites has been provided, but more precise information on location has not been included in order to avoid identifying any specific companies. Certain areas of the province could not be visited due to transportation limitations and
2 Questionnaires were omitted if the results indicated that the respondent had not filled out the form in earnest, or if insufficient information had been supplied. 3 Technically, it means that the observation can be assumed to be within 4% of 95% of all other similar sample groups. This confidence interval also assumes that the research sample is representative of the greater population. This point is discussed in finer detail.
� ��������������������� � � � � ���������������� � � � � ������������������� � � � ����������������������� � � ���������������������������������� � ����� ������������������������������� � � �������������������������������� � !!�"����������������������������� � ##
Table 1: Worksites and Responses
3
ongoing wildfires at the time of the research. The research began in May and concluded in October, 2004. A list of the 239 active contractors in B.C. was also used to phone potential companies as the researcher traveled through the province. Companies were chosen based on who was operating in the area at the time of the research. A wide variety of companies were encountered in terms of size, location, and operating styles. As the researcher traveled through the province, he was also able to identify the active companies in each area by inquiring with licensees, local businesses, and other contractors. Sometimes, companies were simply encountered in the field by chance (on the road or at motels) and asked to participate. Thus a variety of random elements were included in the sampling procedure in order to acquire a broad and diverse segment of the industry. The main goal of the sampling procedure was to obtain a sample that is representative of the general workforce. Although there were bound to be unique pockets of the industry omitted from the sample, the goal was to obtain a group of workers that on average are reflective of the greater industry. There is not an available complete list of every worker in the province. Therefore, it was necessary to select crews and companies instead of individuals. It is acknowledged that there may be differences in workers based on the companies they work for and the areas in which they work. As such, an effort was made to visit as many different companies in as many different locations as possible, and include a wide variety of operations in the research. Although not truly random in the purest sense of the word, the sample is theoretically representative of the industry. This means that there is no reason to believe that the sample of workers in this study is not representative of the greater workforce. That is the individuals that participated in this research are believed to be no different from the rest of the people working in the industry. There were a number of structural features of the industry that made this sampling strategy necessary.
� Production: The unpredictable nature of shift scheduling and seasonal windows of operation would make it difficult, if not impossible, to arrange appropriate times to meet with crews in advance. Contacting crews in the field as their season unfolded was better suited to overcoming this obstacle.
� Size: The combined ranks of the larger companies account for a much larger portion of the
workforce than most of the smaller contractors combined. It is acknowledged that different sized companies may have different methods of health and safety management. However, there is not sufficient information available to conduct a stratified sample of the workforce based on company-size. Thus, the focus was on including a variety of company sizes and
Research Sites
Figure 1: Research Sites

4
maintaining a focus on sampling the people of the workforce in general, and not necessarily the companies.
� Overlap: It is well known that many planters work for several different companies over the
course of the season. It is therefore believed that the sample taken in this research, actually applies to a larger portion of the operations than were actually visited. Many of the workers encountered during the research worked with other contractors previously in the year or went on to do so later. Workers that were previously encountered, were not asked to participate in the research a second time.
� Research Considerations: The questionnaires had to be administered in person, in the field,
in order to protect the interests of the participants. It was not deemed appropriate to ask companies to hand the questionnaires out and allow supervisors access to information on self-reporting of health and safety activities. The protection of the identities and contributions of all parties (companies and workers alike) was a primary consideration in the ethical guidelines of this research. It was also necessary to visit workers in the actual workplaces, in order to obtain the most accurate responses possible in relation to the subject matter.
� Coastal/Interior Divide: It is acknowledged that health and safety considerations may vary
not only according to location, relative to the coast and interior of the province, but also with the unique demands of each area of the province. As such, several crews were visited on the coast, albeit a smaller number than in the interior considering the relatively larger size of the interior industry. However, many of the workers and companies visited in the interior are also active on the coast, and therefore assist in bridging potential gaps between these two areas of the industry. Also, the questionnaire included a variety of issues that were deemed to be representative of issues that could be relevant in any area of the provinces.
� Industry Sectors: The research focused specifically on the tree planting sector of the
silviculture industry, and included questions that were task-specific to the industry. Developing separate questionnaires for different sectors (such as firefighting or brushing) would have demanded a significantly higher level of time and resources. Utilizing more general (non-task specific) questionnaires that are relevant to all sectors of the industry was deemed to be an undesirable strategy because it would not supply enough detail and context to make the questionnaire relevant to workers’ particular environments. The overlap between the tree planting sector and other sectors of the silviculture industry was assessed in order to determine if there are any differences between workers that participate in multiple sectors and those that restrict their activity to tree planting only. In regard to the use of this data as a baseline for the entire industry, it is believed that any changes in the tree planting sector should be duplicated within other sectors so long as they are subject to the same regulations and have access to the same programs

5
1.2 The Questionnaires The questionnaires were 11 pages long, included approximately 90 different items (questions), and took respondents approximately 20 minutes to complete. The length of the questionnaire limited the number of issues that could be examined, but an effort was made to include a range of health and safety issues that would address the concerns of all members of the workplace. Supervisors (including forepersons and checkers4) were issued a questionnaire that was slightly different from the one issued to planters in order to accommodate their distinct role in health and safety compliance in the workplace. The questionnaires were issued to workers soon after returning from work, usually during the dinnertime hours. Questionnaires were handed directly back to the researcher and no other parties were allowed to view the responses. Both workers and employers were given specific assurances that the research would not reveal any information about any particular company or individual. These assurances will continue to be recognized in this report, and in any other presentation related to the research. The first section of the questionnaire dealt with demographics and industry involvement. The second section (the main section) presented workers with a number of different detailed scenarios related to health and safety practices in the workplace. A series of questions were presented that assessed workers’ likelihood to avoid such activities, the likelihood of others to avoid in such activities, and their attitudes and expectations related to the activities. An example of a scenario and the accompanying questions has been included below.
A planter is not wearing a seatbelt while traveling as a passenger in a company vehicle on the way to work.
A How likely do you think OTHER PLANTERS at your workplace would be to do this? B How likely would YOU be to do this? C How likely do you think a supervisor would be to correct a planter who is seen doing this? D How important do you think it is for a supervisor to correct a planter who is seen doing this?
Driving and vehicle safety was one of the primary issues dealt with in the study, with 5 of the 15 scenarios based on safe use of automobiles or all terrain vehicles. The types of unsafe behavior chosen for the questionnaire were based upon three different factors.
4 All of these positions were included under the general term “supervisor”. This distinction was made clear to the respondents and printed in bold on the front page of the questionnaire. It is acknowledged that supervisors and forepersons may play distinctively different roles in various workplaces. However, this research chose to distinguish these positions from that of planters based on their general role in the workplace and their duties under the Occupational Health and Safety Regulation.
VERY LIKELY 1 2 3 4 5 VERY UNLIKELY
VERY LIKELY 1 2 3 4 5 VERY UNLIKELY
VERY LIKELY 1 2 3 4 5 VERY UNLIKELY
VERY IMPORTANT 1 2 3 4 5 VERY UNIMPORTANT
Figure 2. Example Question

6
� The first factor was the types of hazards are considered to be the most common, and most important, in the industry, according to prior interviews and industry input.
� The second factor was the most frequent types of injuries suffered by tree planters as noted by Ellis, Morford, and Turner in their Needs Analysis Regarding Silviculture Industry Health and Safety in British Columbia (2003). For instance, the high number of all-terrain vehicle related injuries prompted the inclusion of several questions related to the use of such vehicles in the workplace.
� The third factor in selecting and developing the scenarios related to unsafe behavior was tying them to the Occupational Health and safety Regulation. This particular feature will be explained in greater detail later in this report.
The final section asked workers about their general attitudes towards health and safety and their job in general. Workers were also provided with an opportunity to make additional commentary at the end in order to address any important issues not covered in the questionnaire, or to comment on any other matters of personal interest.
1.3 Interviews A small number of informal interviews were conducted with workers following the distribution of the questionnaires. Respondents were asked about their opinions regarding the questionnaires and how appropriate the questions were in relation to their work environment. The respondents were also asked about concerns that may have been omitted from the questionnaires, and what they felt should to be done to improve health and safety in the industry. These interviews were gathered predominantly for academic purposes and have not yet been fully transcribed. They will be taken into consideration in future analyses focusing on the type of corrective activity that would be most effective and appropriate for obtaining improved compliance within the workplace.

7
2 Results of the Research This section will present the basic findings of the research, and include a detailed list of the averages (means) and frequencies for the data. The first section will deal with demographics; the second with attitudes, behaviors, and expectations towards specific health and safety issues; the third with general attitudes about health and safety and the work environment.
2.1 Demographics and Experience This section of the data describes the general make-up of the workforce and its level of experience. Obtaining reliable information on these aspects of the workforce can form the foundation of future research on the industry, and assist in the delivery of programs to the workforce. It can also be useful in identifying what sections of the working population are most in need of program attention. The results of the demographics obtained in this research were also compared with the results obtained during a study by Coopers and Lybrand in 1997. Several of the questions used in this survey were identical to those asked in the previous research. However, the previous study relied upon estimates provided by contractors and a limited number of worker interviews. The statistical significance of the previous study cannot be assumed to be as accurate as the current research. In fact, statistics drawn from their sample of 50 workers can only be assumed to be within 28% of the greater workforce population, compared to the 4% confidence interval in the current research.
2.1.1 Job Titles A total of 574 tree planters and 88 supervisors were surveyed during the research. As mentioned previously, the term “supervisor” has been used broadly and represents forepersons, checkers, and other personnel occupying positions involving the supervision and direction of other workers. This distinction was made clear to all respondents.�
Job Title
574 86.7 86.7 86.742 6.3 6.3 93.127 4.1 4.1 97.110 1.5 1.5 98.69 1.4 1.4 100.0
662 100.0 100.0
Tree planterForepersonSupervisorCheckerOtherTotal
ValidFrequency Percent Valid Percent
CumulativePercent
Table 2

8
2.1.2 Years Planting
The average number of years planting is 6.01 years. There is a defined drop-off in experience after the fifth year. It is believed that this is due to the likelihood of workers to leave the industry once their education is finished. Other features of the research supported this, indicating 48% of the workers with 5 years or less experience participate in the industry to fund their schooling, and plan to “retire” upon graduation. The industry is comprised of approximately 15% first-year workers. This is considerably lower than the 24% reported in the Coopers and Lybrand study. Approximately 33% of the workforce has more than 5 years experience; considerably more than the 27% reported in the previous study. Thus, the industry appears to be characterized by a slightly more experienced workforce than indicated by previous research.
2.1.3 Years With Company
The average number of years that the respondents had worked with their company was 3.34 years. While approximately 1/6th of the industry are rookies, more than twice that amount reported being in their first year with their current company. This indicates the high mobility of the workers between companies and the high rates of employee turnover within the industry. This feature suggests that the industry would be well-served by greater consistency in health and safety practices so that workers do not have to adjust their practices or expectations as they move between workplaces. �
Yrs Planting
Yrs Planting
3430252321191715131197531Fr
eque
ncy
120
100
80
60
40
20
0
Yrs w/ Co.
30
25
22
20
18
16
14
13
12
11
10
9
8
7
6
5
4
3
2
1
Freq
uenc
y
300
200
100
0
Figure 3
Figure 4

9
�2.1.4 Days Worked in Season
Respondents were asked how many days they expected to work by the end of the year. The average was 72.49 days. The most common response was 60 days. The range of 5 to nearly 200 days of work indicates a wide spectrum of the workforce was captured, including coastal planters that work significantly longer seasons than those that limit themselves to the interior season. It was not possible to compare this data with the information from the Coopers and Lybrand study, because the previous research included consideration of days worked in other sectors of the industry. This is reflected in the finding that only 13% of the workers in this study expect to work over 100 days, compared to 39% in the previous research. �
2.1.5 Age The average age of the sample is 26.5 years. The youngest respondent was 15 years old, and the oldest was 60. Previous research observed that 60% of the workforce was over the age of 24. However, the current study finds that only 55% of the workforce is over 24, indicating the existence of a slightly younger workforce than may have previously been believed. The average age of supervisors in the current data is 31.6 years, while the average planter age is 25.7 years.
2.1.6 Sex
The sample included 467 men and 195 women. This amounts to a 7:3 ratio of men to women. This was higher than the expectations and estimates expressed during exploratory research prior to this project. This also reflected a slightly higher number of women than were recorded in the Coopers and Lybrand study, which observed 7.7 men for every 2.3 women.
Days by yr end
1801351058867564838305
Freq
uenc
y
120
100
80
60
40
20
0
Age
5552494643403734312825221915
Freq
uenc
y
70
60
50
40
30
20
10
0
Figure 5
Figure 6

10
�2.1.7 BC Resident
Approximately 54% of the workforce reported being a year-round BC resident, with the rest of the workforce spending their off-season in other provinces or countries$�The sample included 355 respondents who reported BC as their year-round home, and 303 who did not5. The number of workers arriving from out of the province appears to be much higher than the 25% observed in previous research. However, this may be due to the fact the previous research relied upon telephone surveys, and the current research was done in the field.
2.1.8 Education
The industry is characterized by surprisingly high levels of education. Approximately 80% of the workforce possesses some university/college schooling or a degree. This is likely due to the large number of students that depend upon the industry to fund their schooling. The level of education appears to be much higher than observed in previous research, in which only 42% of the respondents reported having some college or university schooling.
2.1.9 Classification
Workers were asked about their attachment to the industry and asked to classify themselves according to four basic categories. � Career Silviculturalist: silviculture is your main source of employment. You return each year to
the silviculture industry and work for more than 4 months per year. � Regular seasonal: you return each year, working 4 months or less � Student: you are working to put yourself through school and will leave the industry upon
graduation. � Occasional worker: you take the occasional job in the silviculture industry when they are
available- silviculture is not your preferred occupation but you work in it when you need employment.
5 Four respondents did not answer this question.
Education
No Answer
University/College D
Some University/Coll
Vocational training
Highschool
Some highschool
Freq
uenc
y
300
200
100
0
Figure 7

11
Classification
168 25.4 25.5 25.5198 29.9 30.0 55.5216 32.6 32.7 88.2
78 11.8 11.8 100.0660 99.7 100.0
2 .3662 100.0
Career SilviculturalistRegular seasonalStudentOccasional workerTotal
Valid
No AnswerMissingTotal
Frequency Percent Valid PercentCumulative
Percent
As shown in table 3, here is a relatively even mixture of students, regular seasonal workers, and career silviculture workers in the industry, with a smaller number of people who identify themselves as occasional workers. The number of workers describing themselves as career silviculturalists is much lower in this study (25.5%) than in observed in previous research (64%). Also, the number of students is much larger at 32.7% compared to the previously observed 12%. There are also a larger number of workers identifying themselves as regular seasonal workers. Overall, this indicates that a lower portion of the industry identifies silviculture as their career, and a higher portion of the industry is comprised of transient and temporary workers and students.
2.1.10 Demographic Summary The average age of the workforce is 26.5 years old with an average experience level of 6 years in the planting industry, and 3.3 years with their current company. Only one quarter of the industry identify silviculture as their career profession and over 62% of the workers identify themselves as students or regular seasonal workers. The industry is approximately 70% male and 30% female, with only 54% of the workforce identifying British Columbia as their year-round place of residence. The industry generally appears to be characterized by a large number of young temporary workers, many of whom plan to leave the industry upon finishing their education.
2.2 Health and Safety Performance and Compliance Indicators This section of the data describes respondents’ attitudes, behaviours, and expectations related to a selected group of scenarios related to health and safety in the workplace. This data will be used to define specific and general indicators of attitudes, behaviours, and expectations by examining them as individual items, or by combining them into broader assessments. In the questionnaires used in this research, respondents were presented with scenarios in which an unsafe behaviour was performed in the workplace, and asked several questions relating to the scenario. The questionnaire included 15 specific different scenarios involving health and safety issues in the workplace. It is acknowledged that some members of the industry may argue whether or not the listed behaviors are unsafe. Furthermore, it has been suggested that how individuals react to the scenarios presented may be dependent upon situational circumstances and other factors in the workplace. However, there can be little argument as to whether or not they amount to violations of the OSHR, no matter how trivial the infraction may seem to the individual. The questionnaire was an assessment of how closely individuals abide by the regulations in principle, despite what other factors may be affecting them in the workplace. The scenarios are listed below, along with the corresponding section of the OSHR that applies to the situation. Some of the behaviors may be
Table 3

12
subject to multiple sections of the OSHR, and in some cases other bodies of legislation. However, only one section of the OSHR has been listed in order to provide a simple and concise connection to the regulations of the workplace
1. Planter failing to wash hands before dinner with the crew Section 5.83b: Personal Hygiene, Worker’s Responsibility
2. Planter running downhill through a cutblock in a reckless manner Section 4.25: Workplace Conduct, Prohibition
3. Planter smoking marijuana while working Section 4.20: Impairment by alcohol, drug, or other substance
4. Planter failing to wear a seatbelt while traveling in a company vehicle Section 17.3(3): Transportation of Workers, Seatbelts.
5. Planter failing to wear protective gloves while handling chemically treated seedlings Section 5.83a: Personal Hygiene, Worker’s Responsibility
6. Planter failing to wear caulks in conditions requiring such footgear Section 8.23: Slippery Surfaces
7. Planter drinking and driving from company worksite Section 4.20: Impairment by alcohol, drug, or other substance
8. Planter refusing unsafe work on steep unstable terrain Section 3.12: Refusal of Unsafe Work
9. Planter refusing unsafe work with hazardous substances Section 3.12: Refusal of Unsafe Work
10. Planter reporting supervisor speeding while driving company vehicle Section 3.10: Reporting Unsafe Conditions
11. Planter reporting another worker recklessly endangering self near cliff Section 3.10: Reporting Unsafe Conditions
12. Supervisor operating all-terrain vehicle without wearing proper helmet Section 8.12: Safety Headgear: Use with all-terrain vehicles…
13. Supervisor recklessly endangering self near cliff Section 4.25: Workplace Conduct, Prohibition
14. Supervisor transporting workers as passengers on all-terrain vehicle Section 16.31: Rider Restriction
15. Supervisor ignoring danger tree conditions Section 26.17: Weather Conditions
For each scenario, respondents were asked a number of questions. These included the following items6:
� How likely workers would be to avoid the behavior � How likely they believe others would be to avoid the behavior � How important workers believe it is to correct the behavior � How likely workers think a supervisor would be to correct the behavior � How likely workers would be to report the behavior � How likely they think others would be to report the behavior
Respondents were also asked an open-ended question about what they think a supervisor would do to correct an unsafe behavior. However, this portion of the questionnaire received a limited response, and produced a variety of answers. As such, it has not been summarized along with the rest of the
6 However, every question was not asked about every scenario due to the varying context of the scenarios.

13
quantitative information. It will, however, be considered in future analyses. All other questions (corresponding with the categories listed above) were answered on a scale of 1 to 5 in the same manner as the example provided earlier in this document (see figure 3). The specific behaviors that have been identified as “unsafe” in this study are based upon the range of most frequent concerns mentioned by research respondents during interviews prior to this project. Additionally, a trial run was conducted and additional consultations were held in order to identify common behaviors in the industry that not only pose a risk to the health and safety of the workforce, but also correspond with violations of the Occupational Health and Safety Regulation (OSHR). It is acknowledged that in some cases respondents may not necessarily identify the behaviors as violations, or even as unsafe for that matter. However, the purpose of the research was not to gauge the workforce’s understanding of the regulations, but rather to ascertain their earnest opinions on the frequency and seriousness of the said activities. As mentioned previously, it may indeed be arguable as to how safe or unsafe some of the listed behaviors may be. However, in keeping with Part 3 Division 3 of the OSHR, it is necessary not only for all employees to follow regulations, but also for employers to ensure that all of their employees fulfill their duties in this regard. This research therefore focuses on how workers follow the regulations. Whether or not the regulations are valid is to be determined by the WCB, and those that supply input to their decisions. Another important consideration relates to the external validity of the results. In other words, how accurately do the statistical results shown in this report actually reflect the actual actions and behaviors in the actual workplace. It is acknowledged that the use of questionnaires to approximate human behavior is subject to the manner in which respondents interpret the questions, and the accuracy and honesty of their answers. However, it is believed that distortions in one direction will be counteracted by distortions in the opposite direction when a large enough sample is used. Furthermore, these distortions are mostly relevant in terms of establishing the veritable incidence of particular activities or phenomena. They are not as crucial in the measurement of relationships between variables, or the assessment of change over time. First of all, the relationship of variables should remain a constant despite any distortions that may be present, as long as the two variables utilize equivalent scales of measurement. Secondly, change over time is insulated from such concerns as long as the same measurements (and companying conditions) are used in both assessments. In regards to the honesty of responses, careful measures were taken to ensure that workers felt comfortable in supplying earnest feedback to the questions they were asked. The researcher was careful to ensure that all respondents were aware that he was not working for their employer, the WCB, or any other enforcement agency. Strict precautions and promises were used to ensure the anonymity of the responses, and ensure that there would be no way for anyone (including the researcher) to trace any response back to any particular individual. A strict policy of confidentiality was also adopted in regard to the identity of the companies that participates in order to ensure their willingness to allow the researcher to visit their workplace. The sections that follow contain summaries of workers’ responses concerning their likelihood of avoiding unsafe behavior, and their attitudes and expectations in relation to such activities. Each section will contain a list of the average responses for the individual questions, and a general measurement of the average response to each broad set of issues.

14
2.2.1 Likelihood of Planters to Engage in Unsafe Behavior
Planters were asked how likely they would be to engage in 7 different forms of unsafe behavior. Their answers were given on a scale of 1 to 5. These scores reflect answers from planters only. The likelihood of supervisors to avoid unsafe behavior was assessed using a different set of questions. The lower the score, the more likely the planter would be to engage in the unsafe behavior. A table is supplied below with the average response throughout the industry for how likely planters would be to avoid particular unsafe behaviors. Type of Unsafe Behavior Average
Score Planter failing to wash hands before dinner with the crew 4.12 Planter running downhill through a cutblock in a reckless manner 3.31 Planter smoking marijuana while working 3.34 Planter failing to wear a seatbelt while traveling in a company vehicle 3.72 Planter failing to wear protective gloves while handling chemically treated seedlings 3.58 Planter failing to wear caulks in conditions requiring such footgear 2.84 Planter drinking and driving from company worksite 4.50
By adding the response for each question together, a general measure has been created that expresses how likely planters are to engage in unsafe behavior in general. Combining the seven scales of 1 to 5 produces a set of scores on a scale of 7 to 35. The lower the score, the more likely the planter would be to engage in unsafe behavior in general. This measure is one of the primary measures of health and safety performance among the planters. It is also the basic measure for compliance with health and safety regulations, as it deals with planters’ likelihood to engage in or avoid behavior that is in contravention of the regulations. The average score for all planters was 25.44, based on a total of 549 valid responses7. A chart has been supplied to illustrate the distribution of scores related to planters’ likelihood of engaging in unsafe behavior in general. The chart shows that there is a wide distribution of scores, ranging from planters that are extremely unlikely to avoid any of the unsafe behaviors, to those that are very likely to avoid most of the unsafe behaviors.
7 Supervisors were not asked this question. Secondly, any worker not replying to any one of the seven questions included in the index were excluded from calculation of the general measure.
Self Likely Index
Self Likely Index
343230282624222018161412107
Freq
uenc
y
60
50
40
30
20
10
0
Table 4
Figure 8

15
2.2.2 Likelihood of Others to Engage in Unsafe Behavior All workers (including supervisors) were asked how likely they felt other planters would be to engage in 7 different forms of unsafe behavior. These scores reflect answers from planters and supervisors. Their answers were given on a scale of 1 to 5. The lower the score, the more likely the worker expected other planters would be to engage in the unsafe behavior. A table is supplied below with the average response throughout the industry. The response for each question has been added together to create a general measure that expresses how likely workers believed other planters would be to engage in unsafe behavior in general. This measure is useful for determining the awareness of supervisors of unsafe behavior, and the relationship between perceptions of group activity and personal choices of action. For example, this report will later examine the relationship between how likely planters are to engage in unsafe behavior and their perceptions of group activity based on their belief in how likely others are to engage in unsafe behavior. Once again, combining the seven scales of 1 to 5 produces a set of scores on a scale of 7 to 45. The lower the score, the more likely the worker would be to engage in unsafe behavior in general. The average score for this measure was 21.3 out of 35, based 630 valid responses8. A chart has been supplied to illustrate the distribution of scores for this measurement. The relationship between perceptions of other planters likelihood to engage in unsafe behavior, and planters’ own choices was moderately strong. A correlation of .604 was observed9, implying that the more likely that planters thought others would be to engage in unsafe behavior, the more likely they would be to do so themselves. The same relationship regarding supervisors’ decisions to engage in unsafe behavior is examined later. 8 As in all other index measures, any worker not replying to any one of the questions included in the index were excluded from calculation of the general measure. 9 This relationship was significant beyond the .001 level of probability.
Type of Unsafe Behavior Average Score
Planter failing to wash hands 3.51 Planter running downhill 3.28 Planter smoking marijuana 2.11 Planter failing to wear a seatbelt 3.12 Planter failing to wear gloves 3.01 Planter failing to wear caulks 2.54 Planter drinking and driving 3.74
Others Likely Index
Others Likely Index
343230282624222018161412107
Freq
uenc
y
70
60
50
40
30
20
10
0
Table 5
Figure 9

16
2.2.3 Expectations Among Planters for Supervisors to Correct Unsafe Behavior The following set of scores represent how likely planters thought a supervisor would be to correct a planter that is seen engaging in an unsafe behavior. This score applies reflects answers from planters only. Their answers were given on a scale of 1 to 5. In this case, the lower the score, the more likely the worker would expect a supervisor to correct the unsafe behavior. A table is supplied below with the average response throughout the industry. The response for each question has been added together to create a general measure that expresses how likely planters expected supervisors would be to correct unsafe behavior in general. This measure is useful for determining how closely planters expect to be supervised in the workplace. The average score for this measure was 23.2 out of 35, based on 537 valid responses. A chart has been supplied to illustrate the distribution of scores for this measurement.
Type of Unsafe Behavior Average Score
Planter failing to wash hands 3.46 Planter running downhill 3.75 Planter smoking marijuana 3.45 Planter failing to wear a seatbelt 2.61 Planter failing to wear gloves 4.01 Planter failing to wear caulks 3.75 Planter drinking and driving 2.09
Likelihood of Correction Index
3331292725232119171513119
Freq
uenc
y
50
40
30
20
10
0
Table 6
Figure 10

17
2.2.4 Likelihood of Supervisors to Correct Unsafe Behavior
The following set of scores represents how likely supervisors reported they would be to correct an unsafe behavior. This score reflects answers from supervisors only. Their answers were given on a scale of 1 to 5. The lower the score the more likely the supervisor would be to correct the unsafe behavior. The response for each question has been added together to create a general measure that expresses how likely supervisors would be to correct unsafe behavior in general. The average score for this measure was 18.9 out of 35, based on 82 valid responses. The chart illustrating the distribution of these scores shows that there is a wide range of supervisory approaches, ranging from those that are very likely to correct unsafe behavior with scores as high as 31, and those that are extremely unlikely to do so with scores as low as 7. This measure is useful for determining how well supervisors are fulfilling due diligence by correcting unsafe behavior in accordance with their duties under the OSHR.. It is also useful to compare the responses of supervisors with those of planters to see if there are any differences between the two groups in regards to their expectations regarding corrective actions. There is in fact a large difference between planters and supervisors in their expectations regarding corrective action (Supervisors = 18.9 Planters = 23.2)10. On average, supervisors report that they are more likely to correct unsafe behavior than planters generally expect. 10 This difference is significant at the .001 level of probability.
Type of Unsafe Behavior Average Score
Planter failing to wash hands 2.99 Planter running downhill 2.93 Planter smoking marijuana 3.65 Planter failing to wear a seatbelt 1.74 Planter failing to wear gloves 3.25 Planter failing to wear caulks 2.82 Planter drinking and driving 1.67
Likelihood of Correction Index
Likelihood of Correction Index
31282624222018161412107
Freq
uenc
y
10
8
6
4
2
0
Table 7
Figure 11

18
2.2.5 Importance for Supervisors to Correct Unsafe Behavior
The following scores represent how important workers felt it was for a supervisor to correct unsafe behaviors. These scores represent answers for supervisors and planters. Their answers were given on a scale of 1 to 5. The lower the score the more important workers felt it was for a supervisor to correct the unsafe behavior. The response for each question has been added together to create a general measure that expresses how important workers felt it was for a supervisor to correct unsafe behavior in general. The average score for this general measure was 19.9 out of 35, based on 612 valid responses. This measure is useful for determining the general attitude that workers have towards safety in the workplace, and how important they believe it is for supervisors to correct planters that engage in unsafe activities.
Type of Unsafe Behavior Average Score
Planter failing to wash hands 2.69 Planter running downhill 3.23 Planter smoking marijuana 3.79 Planter failing to wear a seatbelt 2.03 Planter failing to wear gloves 3.27 Planter failing to wear caulks 3.23 Planter drinking and driving 1.61
Importance to Correct Index
Importance to Correct Index
343230282624222018161412108
Freq
uenc
y
70
60
50
40
30
20
10
0
Table 8
Figure 12

19
2.2.6 Likelihood of Planters to Refuse Unsafe Work
Planters were asked how likely they would be to refuse unsafe work based on two different scenarios. The first involved working in steep and unstable terrain where there were sliding logs. The second scenario involved using fertilizing chemicals that are causing the planter to have adverse reactions. The answers were given on a scale of 1 to 5. The higher the score, the less likely workers would be to refuse the unsafe work detail. The average score for refusing to work in the steep unstable terrain was 3.91 out of 5, based on 557 valid responses. The average score for refusing to work with the fertilizer was 2.59 out of 5, based on 547 valid responses. The charts below illustrate that the difference between these scores is accounted for by a large number of planters that were very unlikely to refuse to work in the steep unstable terrain with sliding logs, compared to a large number of workers that were very likely to refuse to work with the fertilizer when it is causing a toxic reaction.
While many workers may be aware that they have the right to refuse unsafe work, many may not be aware that they have a duty to do so if they believe that a situation possesses a strong risk to cause serious injury. However, based on the difference in the two scenarios, there appear to be other situational or conditional factors that influence workers willingness to refuse unsafe work. Workers (both planters and supervisors) were also asked how likely they believed other planters would be to refuse unsafe work. The average score for the steep unstable terrain was 3.8, and the average score for the fertilizer was 2.9. On average, the difference between the two scenarios was similar to how likely planters would be to refuse unsafe work themselves. Finally, workers were asked how important they believe it is to refuse unsafe work. The answers were given on a scale from 1 to 5. The lower the score, the more important the workers believed it was to refuse the unsafe work. The average score for the steep unstable terrain was 2.66, and the average score for the fertilizer was 1.83.
Self refuse slash
Very Unlikely
Unlikely
Neither likely nor u
Likely
Very Likely
Freq
uenc
y
300
200
100
0
Self refuse fert
Very Unlikely
Unlikely
Neither likely nor u
Likely
Very Likely
Freq
uenc
y
200
100
0
Figure 13 Figure 14

20
2.2.7 Likelihood of Planters to Report Unsafe Behavior
Planters were asked how likely they would be to report unsafe behavior based on two different scenarios. The first involved a supervisor who is speeding while driving a loaded crew vehicle to the jobsite, and the second involves a planter that is working dangerously close to the edge of a high cliff. The answers were given on a scale of 1 to 5. The lower the score, the more likely the planter would be to report the unsafe behavior. The average score for how likely a planter would be to report a supervisor speeding was 2.85 out of 5, based on 556 valid responses. The average score for how likely a planter would be to report another planter working too close to a cliff was 3.81 out of 5, based on 555 valid responses.
There were very few planters reporting that they would be very likely to report another planter for working too close to a cliff. This may have been due to the way in which the scenario was presented in the questionnaire, and many respondents commented on this particular question. However, there was an even distribution of answers to how likely planters would be to report supervisors for speeding, indicating that workers vary greatly in regards to how likely they would be to report unsafe behavior by others. In an isolated work environment such as the silviculture industry, it is important for the workers on the front lines to play an active role in observing and reporting unsafe behavior so that it can be corrected before it results in serious injuries to members of the workforce. Workers (both planters and supervisors) were asked how likely they believed other planters would be to report unsafe behavior. The average score for the supervisor speeding was 2.9, and the average score for the planter working too close to the cliff was 3.9. Again, the difference between the two scenarios is similar to how likely planters would be to report unsafe behavior themselves. Finally, workers (both planters and supervisors) were asked how important they believe it is for planters to report unsafe behavior. The lower the score, the more important the worker believed it is for planters to report unsafe behavior. The average score for the supervisor speeding was 1.9, and the average score for the planter working too close to the cliff was 3.1.
Self report super speed
Very Unlikely
Unlikely
Neither likely nor u
Likely
Very Likely
Freq
uenc
y
160
140
120
100
80
60
40
20
0
Self report planter steep
Very Unlikely
Unlikely
Neither likely nor u
Likely
Very Likely
Freq
uenc
y
300
200
100
0
Figure 15 Figure 16

21
2.2.8 Likelihood of Supervisors to Engage in Unsafe Behavior
Supervisors were also asked how likely they would be to engage in unsafe behavior in the workplace, based on 4 different scenarios. Their answers were given on a scale of 1 to 5. The lower the score, the more likely the supervisor would be to engage in the unsafe behavior. A table is supplied below with the average response throughout the industry for how likely supervisors would be to engage in particular unsafe behaviors. Type of Unsafe Behavior Average
Score Supervisor operating all-terrain vehicle without wearing proper helmet 3.15 Supervisor recklessly endangering self near cliff 2.83 Supervisor transporting workers as passengers on all-terrain vehicle 3.48 Supervisor ignoring danger tree conditions 3.91 By adding the response for each question together, a general has been created that expresses how likely supervisors are to engage in unsafe behavior in general. Combining the four scales of 1 to 5 produces a set of scores on a scale of 4 to 20. The lower the score, the more likely the supervisor would be to engage in unsafe behavior in general. This measure is one of the primary measures of health and safety performance among the supervisors. It is also the best indicator of compliance as it deals with supervisors’ likelihood to engage in or avoid behavior that is in contravention of the regulations. The average score for all supervisors was 13.3 out of 20, based on a total of 84 valid responses11. A chart has been supplied to illustrate the distribution of these scores. As with the planters, the chart shows that there is a wide range of scores, from supervisors that strictly avoid unsafe behavior to those that apparently engage in it quite frequently.
11 Planters were not asked these questions. Secondly, any supervisor not replying to any one of the seven questions included in the index were excluded from calculation of the general measure.
Supervisor likely index
Supervisor likely index
20191817161514131211109876
Freq
uenc
y
12
10
8
6
4
2
0
Table 9
Figure 17

22
2.2.9 Likelihood of Other Supervisors to Engage in Unsafe Behavior All workers (including planters) were asked how likely they felt supervisors would be to engage in unsafe behavior, based on the 4 different scenarios. These scores reflect answers from planters and supervisors. Their answers were given on a scale of 1 to 5. The lower the score, the more likely the worker expected supervisors would be to engage in the unsafe behavior. A table is supplied with the average response throughout the industry for the particular scenarios. The response for each question has been added together to create a general measure that expresses how likely workers believed supervisors would be to engage in unsafe behavior in general. The lower the score, the more likely workers expected supervisors would be to engage in unsafe behavior in general. The average score for all workers was 13.1 out of 20, based on a total of 620 valid responses. A chart has been supplied to illustrate the distribution of the scores for this measure. This measure is useful in determining how careful workers believe supervisors are to engage in unsafe behavior. Also, it can be related to the supervisors’ own behaviors to determine the relationship between their perceptions of others in their position and their own choices. This relationship actually appears to be extremely prominent based on the observations of the data. There is a correlation of .851 between supervisors’ likelihood to engage in unsafe behavior, and how likely they expect other supervisors would be to engage in the same behavior12. In statistical terms, this is an extremely strong relationship. In plain terms, this means that the more likely a supervisor expects other supervisors would be to engage in unsafe behavior, the more likely the supervisor is to do the same. The relationship between individual choice and perceptions of others is even stronger among supervisors than it is among planters. Earlier in this report, it was observed that planters exhibit a .604 correlation13 in this relationship; moderately strong but not nearly as substantial as the same relationship among supervisors.
12 This relationship is significant beyond the .001 level of probability. 13 Significant beyond the .001 level of probability.
Type of Unsafe Behavior Average Score
Operating ATV without helmet 3.12 Working too close to cliff 3.19 Transporting workers on ATV 3.34 Ignoring dangerous conditions 3.46
Supervisors expected by others
Supervisors expected by others
2019181716151413121110987654
Freq
uenc
y
80
60
40
20
0
Table 10
Figure 18

23
2.2.10 Importance of Correcting Unsafe Behavior Among Supervisors
All workers (including planters) were asked how important they feel it is to correct supervisors would engage in unsafe behavior. These scores reflect answers from planters and supervisors. Their answers were given on a scale of 1 to 5. The lower the score, the more important the worker felt it was to correct supervisors who engage in unsafe behavior. A table is supplied with the average response throughout the industry for the particular scenarios. The response for each question has been added together to create a general measure that expresses how important workers feel it is to correct supervisors would engage in unsafe behavior in general. The lower the score, the more important workers felt it was to correct supervisors. The average score for all workers was 11.1 out of 20, based on a total of 620 valid responses. A chart has been supplied to illustrate the distribution of the scores for this measure. This measure is useful in determining the general attitude of workers towards unsafe behavior by supervisors and how important it is to correct them.
Importance of correcting supervisor
Importance of correcting supervisor
2019181716151413121110987654
Freq
uenc
y
80
70
60
50
40
30
20
10
0
Type of Unsafe Behavior Average Score
Operating ATV without helmet 2.56 Working too close to cliff 3.17 Transporting workers on ATV 3.14 Ignoring dangerous conditions 3.22
Table 11
Figure 19

24
2.3 General Workplace Attitudes and Perceptions Workers were asked about their attitudes and perceptions regarding workplace relations and general safety issues. These included indicators of job satisfaction and health and safety activities. The response for each question was scored on a scale from 1 to 5. These questions were asked in order to assess the general attitudes, and to determine the presence of any relationship between these attitudes and the aforementioned measures of health and safety performance. A summary of these questions and their results has been included below along with charts to illustrate the distribution of the scores. 1) In your opinion, how much TIME do supervisors in your workplace spend to ensure that everyone is following appropriate health and safety requirements? The average response for this question was 3.0, with 1 representing “Too much time” and 5 representing “Not enough time”. 2) In your opinion, how much TIME is spent discussing health and safety in your current workplace? The average response for this question was 2.95, with 1 representing “Too much time” and 5 representing “Not enough time”.
Time spent ensuring compliance
Time spent ensuring compliance
Not enoughA bit lessAbout rightA bit muchToo much
Freq
uenc
y
500
400
300
200
100
0
Time spent discussing H&S
Time spent discussing H&S
Not enoughA bit lessAbout rightA bit muchToo much
Freq
uenc
y
500
400
300
200
100
0
Figure 20
Figure 21

25
3) How likely do you think it is that YOU will be injured while working this year? The average response for this questions was 3.45, with 1 representing “Very likely” and 5 representing “Very Unlikely.” 4) How likely do you think it is that SOMEONE ELSE at your workplace will be injured while working? The average response for this questions was 2.40, with 1 representing “Very likely” and 5 representing “Very Unlikely.” 5) In your opinion, how FRIENDLY are relations between supervisors and planters in your workplace? The average response for this questions was 1.58, with 1 representing “Very friendly” and 5 representing “Very unfriendly”.
Likelihood self injured
Very Unlikely
Unlikely
Neither likely nor u
Likely
Very Likely
Freq
uenc
y
200
100
0
Likelihood others injured
Very Unlikely
Unlikely
Neither likely nor u
Likely
Very Likely
Freq
uenc
y
300
200
100
0
Friendliness supers-planters
Very Unfrinedly
Unfriendly
Neutral
Friendly
Very friendly
Freq
uenc
y
500
400
300
200
100
0
Figure 22
Figure 23
Figure 24

26
6) In your opinion, how COMPETITIVE are the planters in your workplace with each other? The average response for this questions was 2.75, with 1 representing “Very competitive” and 5 representing “Not competitive at all.” 7) How SATISFIED are you with the camp or accommodations supplied to you by your company? The average response for this questions was 2.19, with 1 representing “Extremely satisfied” and 5 representing “Extremely dissatisfied.” 8) How SATISFIED are you with the wages you are currently earning? The average response for this questions was 2.86, with 1 representing “Extremely satisfied” and 5 representing “Extremely dissatisfied.”
Competitive planters
Not Competitive at A
Uncompetitive
Neutral
Competitive
Very Competitive
Freq
uenc
y
300
200
100
0
Satsifaction with accomodations
Extremely Dissatisfi
Dissatisfied
Neutral
Satisfied
Extremely Satisfied
Freq
uenc
y
300
200
100
0
Satisfaction with earnings
Extremely Dissatisfi
Dissatisfied
Neutral
Satisfied
Extremely Satisfied
Freq
uenc
y
200
100
0
Figure 25
Figure 26
Figure 27

27
9) In your opinion, how CLOSE are the planters in your workplace as a group? The average response for this questions was 2.17, with 1 representing “Very close” and 5 representing “Not close at all.” Respondents were also asked several “yes or no” questions about their general experiences in the workplace. A summary of these questions and their results is included below. 1) Has a supervisor in your current workplace ever corrected you during this season for an activity related to health and safety? 2) Has a supervisor in your current workplace checked on you during this season to ensure that are complying with a health and safety requirement? (check one)
3) Do you usually carry an emergency whistle? 4) Do you usually work with a partner?
5) Have you ever suffered any type of injury while planting and had to miss work?
Closeness of planters
Not Close at AllNot CloseNeutralCloseVery Close
Freq
uenc
y
300
200
100
0
Yes 34.5% No 65.5%
Yes 51.6% No 48.4%
Yes 61.5% No 38.5%
Yes 42.5% No 57.5%
Yes 44.1% No 55.9%
Figure 28

28
2.4 Summary of Data and Assessing Change Over Time The main compliance measures indicate that there is a wide range of attitudes and behavior in the industry, including those that are very risk-aversive and careful to abide by their duties and responsibilities, and those that frequently engage in risk-prone behavior and require correction through education, training, or inspection in order to improve their health and safety performance. The preceding data summaries have been supplied in order to provide an illustration of the range of health and safety performance, and to establish a baseline that can be used to assess changes in the industry. Each measure provides a numerical representation of an approximated behavior or attitude (or set of thereof). These measures can in turn be examined in terms of their relationship with each other, and with other variables, to determine the presence of more complex patterns of attitude and behavior in the workplace. Some of the other variables will be summarized in the following section. The measures summarized thus far offer another valuable purpose: the ability to determine changes in the industry over time. A repetition of this study can be conducted within several years in order to determine if workers have changed in regard to their likelihood to avoid unsafe behavior, report unsafe behavior, refuse unsafe work, or any other issue investigated in this research. The observation of any differences in the results would be useful for determining whether or not there has been any improvement in the industry in regards to the issues addressed. This may assist in the evaluation of substantial efforts to improve health and safety in the industry, and the better protection of future generations of workers. A successful repetition of this research project would require the closest duplication of the research instrument and research conditions possible. The same questionnaire would need to be used in a similar set of work sites during a similar time frame. The research would need to be presented to the workers in a similar (if not identical) manner, and the individual conducting the research would have to share similar characteristics as those held by the current researcher. The current researcher’s close involvement with the industry, and his membership in the workforce itself, was felt to be a key ingredient in cultivating the cooperation of the workforce in responding to the questionnaires. If this research project is to be repeated, it would be best for it to be conducted by a person who is an “insider” to the industry, and for that person to hold comparable knowledge of social science and field research techniques. Finally, any future research will need to be compared against the raw findings from the current research. This database can be made available in the future, if a repetition of the study is undertaken. In the meantime, there were additional issues examined during the research that may be immediately important to employers and those responsible for developing health and safety programs for the industry.. The industry was consulted about what issues they felt were important and a number of recurring themes were observed during the interviews that led to the investigation of a number of more complex patterns of attitudes and behaviors in the workforce. Some of the patterns of behavior observed may be directly valuable in improving the health and safety performance of the industry in the future Some basic inquiries were conducted using standard statistical techniques in order to shed light on some of these issues. The following section examines some of the issues in detail, and a number of general recommendations have been made based on the findings.

29
3 Relating Variables In this section, the data is explored in greater detail in order to investigate more specific issues in the silviculture industry, such as the relationship between age of the workers, and health and safety performance. Investigating the relationship between different variables in the data is useful for identifying patterns of attitudes and behavior that may be important to employers and those in charge of developing health and safety programs for the industry. The relationships examined in this report represent a small part of the data that is available for analysis, but a number of key issues were selected for presentation within this brief report.
3.1 Individual Behavior and Perceptions of Others: Planters One of the first relationships investigated was the relationship between the likelihood of workers to engage in unsafe behavior, and how likely they believed others would be to engage in unsafe behavior. The question this examination sought to answer is whether there is a link between worker behavior and their perceptions of others. In other words, are workers likely to make independent choices and engage in safe work practices, even though they see others doing different? Or are workers more likely to follow suit with what they believe others are doing around them? The data indicated that there is a moderate relationship among planters in this regard. The data exhibited an “r” value of .604 for the relationship between how likely workers are to engage in unsafe behavior and how likely they believe others are to engage in unsafe behavior. The positive value of the score indicates that the more likely workers believe others are to engage in unsafe behavior, the more likely they are to engage in the same unsafe behaviors themselves. In more precise terms, this means that approximately 36% of the variation in scores for these general measures of health and safety performance is accounted for by the relationship between the variables. In plain terms, about one third of the variation in how likely workers are to engage in unsafe behavior can be accounted for (or predicted by) how likely they expect other workers would be to engage in the same unsafe behaviors. Each individual question that formed the general indexes used in this correlation was examined in order to determine whether or not there are any specific unsafe behaviors that are more strongly related to perceptions of others. However, the range of correlations were all within the moderate to weak range, indicating that the general relationship between decisions to engage in unsafe behavior and perceptions of others is a relatively consistent trend throughout the individual scenarios that were presented in the questionnaires. The significance of these statistics to employers and program developers is that there may be a moderate relationship between workers behaviors and their perceptions of others. However, the relationship is not strong enough to accurately predict more than a third of the scores in the workforce. Therefore, it is likely that many workers engage in unsafe behavior, regardless of how
Correlations
1 .604**. .000
548 545.604** 1.000 .545 630
Pearson CorrelationSig. (2-tailed)NPearson CorrelationSig. (2-tailed)N
Self Likely Index
Others Likely Index
Self LikelyIndex
OthersLikely Index
Correlation is significant at the 0.01 level (2-tailed).**.
Table 12 Table 12

30
likely they believe others are to do the same thing. However, on the flip side, this also means that workers may avoid in unsafe behavior even though they believe others are unlikely to do the same. The relationship between individual choices and perceptions of others was considerable stronger when it came to refusing unsafe work and reporting unsafe work by other workers. The “r” values for the relationships observed for these issues ranged from .669 to .733. In turn this means that between 45% and 54% of the variance in the likelihood of workers to refuse or report unsafe work could be accounted for by their perceptions of how likely they believed other workers would be to do the same. Based on these observations, employers and program developers may be well-served to note that there is not necessarily a compelling link between individual choice and perceptions of other workers in regard to likelihood to engage in or avoid unsafe behavior. However, there is a stronger relationship between how likely workers are to report or refuse unsafe work and how likely they believe others are to do the same. Therefore, it is important to ensure workers feel free to report or refuse unsafe work and perceive that such activities are likely to be undertaken by other workers. Citing examples of situations where members of the crew have refused unsafe work or reported unsafe work by others may be useful in encouraging other workers to do the same in future situations.
3.2 Individual Behavior and Perceptions of Others: Supervisors The relationship between the likelihood of supervisors to engage in unsafe behavior and their perceptions of other supervisors was far more profound than the relationship observed among planters. The “r” value for this relationship was .851, meaning that 72% of the variance in how likely supervisors would be to engage in unsafe behavior could be accounted for by the relationship with how likely they thought other supervisors would be to do the same. In plain terms, the more likely that supervisors thought other supervisors would be to engage in unsafe behavior, the more likely they were to do the same themselves. These observations indicate that is even more important for supervisors to set positive examples for each other as it is for planters. Therefore employers and program-developers need to be aware that supervisors (even more so than planters) have a tendency to make choices that are consistent with their perceptions of others. Therefore, it is important for supervisors to set positive examples of appropriate health and safety performance in order to encourage others to do the same and improve the state of compliance among supervisors in the industry.
Correlations
1 .851**. .000
84 84.851** 1.000 .
84 620
Pearson CorrelationSig. (2-tailed)NPearson CorrelationSig. (2-tailed)N
Supervisor likely index
Supervisors expectedby others
Supervisorlikely index
Supervisorsexpected by
others
Correlation is significant at the 0.01 level (2-tailed).**.
Table 13

31
3.3 Gaps Between the Workforce Strata Another issue that was examined was whether or not there are any substantial differences between planters and supervisors in terms of their perceptions about safety-related behavior. The importance of investigating these issues is to determine whether or not planters and supervisors are “on the same page” so to speak. Are they observing the same behaviors? Do they share the same opinions? These issue was examined on several bases. Although planters and supervisors represent different workforce strata, and each possess different duties and responsibilities under the Occupational Health and Safety Regulation, effective communication and common understanding between these groups is a vital component in developing successful comprehensive health and safety programs in the industry. A series of independent samples t-tests were conducted to determine if there were any notable differences between planters and supervisors on the key measures of health and safety performance recorded in the data. A summary of the most notable findings follows 1) There is a significant difference between planters and supervisors in regard to how likely they believe planters are to engage in unsafe behavior in general. Supervisors exhibited an average score of 23.01 for the index indicating how likely they thought planters would be to engage in unsafe behavior. Planters meanwhile exhibited an average score of 21.04 for the same measure. There was a difference of 1.97 (on a scale from 7 to 35) between the two groups14. Although the difference is not huge, it means that planters are slightly less likely than supervisors to expect other planters to engage in unsafe behavior. The difference between the scores suggests that planters may be observing more frequent health and safety infractions by their fellow planters. This raises the questions as to whether or not supervisors are doing an adequate job of monitoring planters in regards to health and safety activities. 2) There is a slightly larger difference between planters and supervisors in regards to how important they believe it is to correct unsafe behavior. Supervisors exhibited an average score of 20.32 for the index indicating how important they feel it is to correct unsafe behavior in general. Planters, meanwhile, exhibited an average score of 16.84 for the same score, resulting in a mean difference of 3.48 (on a scale of 7 to 35). This means that supervisors attach more importance to correcting unsafe behavior than planters do. This difference suggests that supervisors and employers may need to do a better job of communicating the importance of avoiding unsafe behavior to planters, and explain why correcting such behaviors is an integral component in ensuring a safe workplace. 3) There is a substantial difference between supervisors and planters in regard to how likely they think it is for a planter to be corrected for engaging in unsafe behavior in general. Supervisors exhibited an average score of 23.19 (on a scale from 7 to 35) for the index indicating how likely they would be to correct unsafe behavior by a planter. Planters, meanwhile, exhibited an average score of 18.90 for how likely they felt supervisors would be to correct unsafe planters. This yields a mean difference of 4.2915, meaning that supervisors report they are substantially more likely to correct planters for unsafe behavior than planters themselves may expect. This difference suggests two different possibilities. First, supervisors may not be adequately following through on their stated intentions to correct unsafe behavior that they witness in the workplace. Secondly, supervisors may not be doing an adequate job of informing planters that such unsafe behavior will be corrected. Whichever the case may be, there appears to be a gap between planters and supervisors in regard to how they expect unsafe behavior will be responded to in the workplace. In order to implement
14 This difference is significant at the .001 level of probability. 15 This difference is significant beyond the .001 level of probability.

32
effective compliance assurance programs in the industry, it is important for supervisors and employers to effectively communicate to workers the way in which unsafe behavior will be treated, and for supervisory personnel to follow through on such mandates. 4) There are also differences between planters and supervisors in regard to how important they feel it is for planters to report unsafe behavior. Examining the two scenarios dealing with reporting unsafe behavior, it was found that supervisors felt it was more important to report the behavior than the planters did in both cases. Mean differences of 0.51 and 0.76 (on scales of 1 to 5) were observed for reporting planters working too close to cliffs and supervisors speeding, respectively16. This implies that supervisors and employers may need to more to inform planters of their duty to report unsafe behavior and communicate that ensuring health and safety is perceived as a shared responsibility in the workplace for all parties, not just supervisors.
3.4 Age, Experience, and Compliance The relationship between age and compliance is of particular importance for the industry, due to the large number of young workers that participate in tree planting. Questions have been raised whether workers enter the industry and learn to be compliant with the rules of the workplace as they gain experience, or if workers enter the industry and adopt non-compliant patterns of behavior. The answer to this question may be a bit little bit of both situations, depending upon the behaviors in questions. However, by using the data acquired in through this research, any obvious trends should become apparent. As indicated earlier, 45% of all workers in the industry are 24 years of age or younger. Approximately 19% of all workers are 21 years of age or younger. In order to investigate the relationship between age and health and safety performance, two different standards of age were used: the first involved using the full spectrum of age as a continuum ranging from the youngest workers to the oldest workers, the second involved dividing workers into those that are older than 24 years of age and those that are 24 or younger. The full spectrum of age was correlated with numerous variables (such as the general measures defined earlier in this report) to determine the presence of any significant relationships. Secondly, a series of independent sample t-tests were conducted to investigate the presence of any significant differences between workers (over and under 24) on the same variables. The first step in investigating the role of age was to use the full spectrum of age and run a series of correlations. The data indicates there is a weak negative relationship between age and likelihood of avoiding unsafe behavior in general. (r=.171). This suggests that younger workers may be very slightly more likely to engage in unsafe behavior. However, the relationship is so weak that there does not appear to be any substantial relationship between age and likelihood of engaging in unsafe behavior based on this calculation. Each individual scenario was examined in addition to the general measure of engaging in unsafe behavior, and again no substantial differences were noted. There were also no relationships noted between age and refusing or reporting unsafe work. Using the full spectrum of age also did not reveal any substantial relationships, and dividing the workforce between those over and under the age of 24 yielded similar findings. Again, there was a tendency for workers over 24 years of age to be slightly less likely to engage in unsafe behavior, but
16 Both of these differences were significant beyond the .001 level of probability.

33
the difference was quite small. There was a noticeable difference between older and younger workers in regard to their attitudes and behaviors surrounding the use of caulked boots, with older workers being both more likely to wear them and attaching more importance to correcting failure to wear proper footgear. However, this was the only outstanding difference in the workforce based on the division between those over or under 24 years of age. It is important to note that despite the modest difference observed within the data, the role of age in workplace health and safety should not be dismissed altogether. Young workers form a large part of the workforce, and that part may be growing in consideration of previous research. Therefore, even the slightest relationship between age and compliance should encourage employers to do everything necessary to confirm that their young workers are receiving the training, guidance, and supervision necessary to ensure their safe participation in the workplace. Workers were also examined based on their level of experience in order to determine whether there are any substantial relationships between experience and health and safety performance. There were no substantial relationships between compliance and level of experience, nor was there any difference in compliance between workers with more or less than 2 years of experience. Finally, a regression analysis was conducted to examine the combined effects of age and experience on compliance. This inquiry produced no substantial findings to indicate that younger less experienced workers are any more or less likely to engage in unsafe behavior. Overall, there is weak support for any claims that younger or less experienced workers are any more likely to engage in unsafe behavior. If anything, these findings advocate a consistent program of compliance assurance that pays equal attention to all segments of the workforce. Companies with predominantly older more experienced workers should not make immediate assumptions that their workers have safer work habits than younger counterparts. However, it as noted earlier, it should be maintained that younger workers do require appropriate training and need to be provided with the necessary information to navigate their workplace in a safe and healthy manner. This includes informing them of their rights and duties according to the Occupational Health and Safety Regulation. Considering how large a segment of the workforce they constitute, any substantial change in industry performance will likely rely upon effective training and education of future workforce cohorts.

34
3.5 Job-site and Compliance Another concern for the industry is whether there are any differences in the level of health and safety performance based on the type of job-site involved. The performance of camp-based planters was compared with those working from hotel or commuter contracts, and a number of significant differences were observed. A set of t-tests (see table 14) were conducted, and camp based workers were observed to be both slightly more likely to engage in unsafe behavior, and slightly more likely to expect other planters to engage in unsafe behavior. (Remember that the lower the score, the more likely the worker would be to engage in unsafe behavior)
The average score for camp-based planters on the general index of engaging in unsafe behavior was 24.93 on a scale from 7 to 35, compared to an average score of 26.97 for commuting and hotel-based workers. This yields a mean difference of 1.98, indicating that camp-based workers appear to be slightly more likely to engage in unsafe behavior. The average score for camp-based planters on the general index of how likely they expected other planters to be to engage in unsafe behavior was 20.37, compared to an average of 22.86 among other planters. This yields a mean difference of 2.50, meaning that camp-based planters are also more likely to expect other planters to engage in unsafe behavior.
Independent Samples Test
3.849 .050 -5.378 544 .000 -2.50 .464 -3.410 -1.586
-5.688 295.142 .000 -2.50 .439 -3.362 -1.634
4.620 .032 -4.164 546 .000 -1.98 .476 -2.917 -1.047
-4.576 320.746 .000 -1.98 .433 -2.834 -1.130
Equal variancesassumedEqual variancesnot assumedEqual variancesassumedEqual variancesnot assumed
Others Likely Index
Self Likely Index
F Sig.
Levene's Test forEquality of Variances
t df Sig. (2-tailed)Mean
DifferenceStd. ErrorDifference Lower Upper
95% ConfidenceInterval of the
Difference
t-test for Equality of Means
Table 14
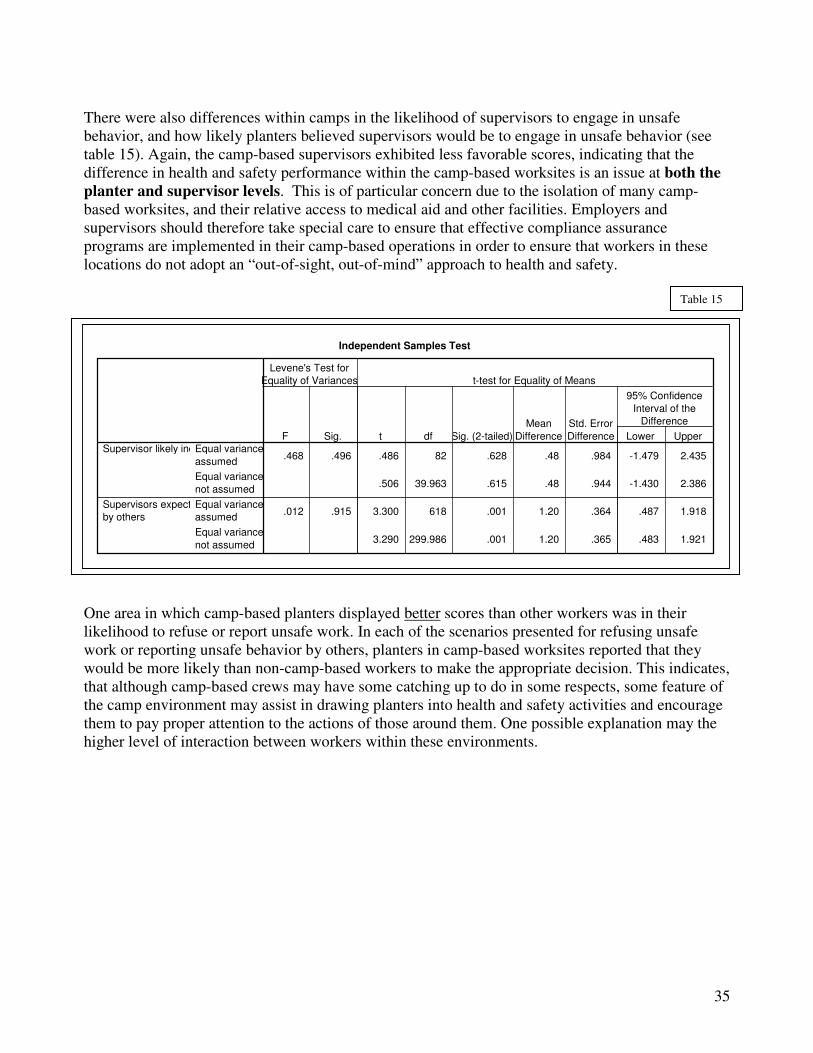
35
There were also differences within camps in the likelihood of supervisors to engage in unsafe behavior, and how likely planters believed supervisors would be to engage in unsafe behavior (see table 15). Again, the camp-based supervisors exhibited less favorable scores, indicating that the difference in health and safety performance within the camp-based worksites is an issue at both the planter and supervisor levels. This is of particular concern due to the isolation of many camp-based worksites, and their relative access to medical aid and other facilities. Employers and supervisors should therefore take special care to ensure that effective compliance assurance programs are implemented in their camp-based operations in order to ensure that workers in these locations do not adopt an “out-of-sight, out-of-mind” approach to health and safety. One area in which camp-based planters displayed better scores than other workers was in their likelihood to refuse or report unsafe work. In each of the scenarios presented for refusing unsafe work or reporting unsafe behavior by others, planters in camp-based worksites reported that they would be more likely than non-camp-based workers to make the appropriate decision. This indicates, that although camp-based crews may have some catching up to do in some respects, some feature of the camp environment may assist in drawing planters into health and safety activities and encourage them to pay proper attention to the actions of those around them. One possible explanation may the higher level of interaction between workers within these environments.
Table 15
Independent Samples Test
.468 .496 .486 82 .628 .48 .984 -1.479 2.435
.506 39.963 .615 .48 .944 -1.430 2.386
.012 .915 3.300 618 .001 1.20 .364 .487 1.918
3.290 299.986 .001 1.20 .365 .483 1.921
Equal variancesassumedEqual variancesnot assumedEqual variancesassumedEqual variancesnot assumed
Supervisor likely index
Supervisors expectedby others
F Sig.
Levene's Test forEquality of Variances
t df Sig. (2-tailed)Mean
DifferenceStd. ErrorDifference Lower Upper
95% ConfidenceInterval of the
Difference
t-test for Equality of Means

36
3.6 Earnings, Competition and Compliance It has frequently been suggested during interviews that the pressure to make money is a powerful influence on compliance among planters. Some respondents have suggested that when money is scarce, planters are more likely to cut corners in regard to health and safety. Others disagree with this position and contest that planters are more likely to make compromises in health and safety when earnings are higher in order to maximize their most profitable times. A broad inquiry was conducted into this issues, and there was no significant relationship observed between satisfaction with earnings and the general likelihood of planters to engage in unsafe behavior. There was also no substantial relationship between the competitiveness of planters and their likelihood to engage in unsafe behavior. Thus, the data does not lend support to any general statements concerning financial incentives, competition, and health and safety compliance. It is acknowledged, however, that not all of the health and safety related behaviors among planters that are listed in the questionnaire would offer any incentive to more competitive or money-driven planters. For example, it does not make any intuitive sense for amore competitive worker to be any more or less likely to wear a seatbelt, or wash his or her hands. Therefore, a more detailed examination was conducted on behaviors that are more likely to be related to production incentives. This included the wearing of gloves, running through cut-blocks, and wearing of caulks. However, there were no substantial relationships observed between these activities and planters satisfaction with their earnings, or their perceptions of competition. Small differences were observed, but these were simply too slim to support any general statements about these attitudes.

37
4 Recommendations The following recommendations have been made based on the observations summarized in the previous sections. (1) Employers and supervisors should take increased measures to ensure that workers feel free to refuse unsafe work and report unsafe behavior by other workers. It is also important for workers to perceive that such activities are likely to be undertaken by other workers. Citing examples of situations where members of the crew have refused unsafe work or reported unsafe work by others may be useful in encouraging other workers to do the same in future situations. (2) It is important for supervisors to set positive examples for each other in regard to health and safety performance in the workplace. Employers and program-developers need to be aware that supervisors (even more so than planters) have a tendency to make choices that are consistent with their perceptions of others. The data indicates that supervisors that perceive other supervisors as being compliant are more likely to be compliant themselves. Examples of supervisors acting in accordance with health and safety regulations should be recognized and possibly even publicized in order to encourage others to do the same and improve the state of compliance among supervisors in the industry. (3) Data indicates that planters expect more non-compliant behavior by other planters than supervisors do, and that considerable risky behavior among planters may be going undetected. Employers and supervisors need to ensure that they are doing an adequate job of monitoring the workers that they are responsible for. Due diligence requires that supervisors and employers take whatever steps are reasonably necessary to fulfill these duties. This should include checking on workers to ensure compliance with necessary regulations, and also taking appropriate corrective measures when necessary. Workers indicate that a wide variety of measures are used to correct unsafe behavior in the workplace. More consistency in correcting problems within companies and between companies would be helpful in improving the performance of an industry where turnover is high and workers frequently move between crews and companies. (4) Data indicates that supervisors attach more importance to correcting unsafe behavior than planters do. This difference suggests that supervisors and employers may need to do a better job of communicating the importance of avoiding unsafe behavior to planters, and explain why correcting such behaviors is an integral component in ensuring a safe workplace. Methods of improving the workforce’s understanding of the hazards and risks of the workplace by improving communication within the workplace would be helpful in this regard. (5) Data indicates that supervisors are substantially more likely to correct planters for unsafe behavior than planters themselves may expect. Thus, there appears to be a gap between planters and supervisors in regard to how they expect unsafe behavior will be responded to in the workplace. In order to implement effective compliance assurance programs in the industry, it is important for supervisors and employers to effectively communicate to workers the way in which unsafe behavior will be treated, and for supervisory personnel to follow through on such mandates. This calls not only for improved communication within the workplace, but proper implementation of measures designed to deter unsafe behavior. Employers and supervisors cannot simply promise consequences for unsafe behavior, they must follow through on them.

38
(6) Data indicates that supervisors attach more importance to refusing unsafe work and reporting unsafe work by others. Employers and supervisors may need to do more to inform planters of their duty to report unsafe behavior, and ensure that health and safety is perceived as a shared responsibility in the workplace for all parties, not just supervisors. (7) Problems with health and safety should not be attributed to younger or less experienced workers and their particular attitudes and behaviors. However, it should be maintained that younger workers do require appropriate training and need to be provided with the necessary information to navigate their workplace in a safe and healthy manner. This includes informing them of their rights and duties according to the Occupational Health and Safety Regulation. Many young workers may never have worked outside the home before, and may not be familiar with the physical or legal features of their new work environment. Considering how large a segment of the workforce they constitute, any substantial change will likely rely upon effective training and education of future workforce cohorts. The data indicates that the workforce may be younger and less experienced than previously believed17, and this issue may be more important than ever. (8) Employers running camp-based operations need to do ensure that they are committing sufficient energy and resources to compliance assurance programs within their workplaces. The performance levels of camp-based workers are substantially lower than those of their motel and commuter-based counterparts. Considering the isolation of such workplaces and the risks posed by the frequent difficulty of reaching medical aid, improved performance is a desirable goal. (9) Greater consistency in health and safety practices throughout the industry would assist companies in integrating new workers. This is especially important in light of the high rates of employee turnover that are apparent. Although this research did not specifically study the individual practices of each operation, a great range in practice was generally observed. With approximately one third of the workforce reporting to be in their first year with their company, substantial time and resources could be conserved if health and safety practices were consistent between workplaces. This would require information sharing by competing operators, and agreement on best operating procedures. Having more a more uniform state of health and safety practices throughout the industry in terms of communication, training, and correction of unsafe behavior would also assist employers in ensuring the compliance of their workers and avoid confusion among workers in regard to what is acceptable in any particular location or operation.
17 Either due to sampling error in previous research, or actual shifts in the demographics of the industry.

39
5 Acknowledgements
This research was supported by the Forest Industry Safety Association and the Western Silviculture Contractors Association. I would like to express my gratitude to all who assisted in this research, especially the men and women of the tree planting industry who generously took time to participate in the study at the end of their working days. I also would like to thank the company owners who welcomed me into their workplaces and provided me with the opportunity to speak with their workers. The input of all members of the FISA Silvicultural Advisory Committee and Joan Brockman from the Simon Fraser University School of Criminology was also extremely helpful in sculpting the direction of the study. Special thanks is directed to Jo Graber, John Betts, and Tony Harrison who were particularly instrumental in the success of this research. 6 References Coopers & Lybrand Consulting. (1997) “Profile of Core Silviculture Contracting Activities in British Columbia: Western Silviculture Contractors Association Final Report.” . Ellis, Doug, and Morford, Shawn, and Jennifer, Turner. (2003) “Needs Analysis Regarding Silviculture Industry Health and Safety in British Columbia.” FORREXX: Nanaimo.
Any further questions about this research can be directed to: Jordan Tesluk 1968 West Third Avenue Vancouver B.C. V6J 1L1 [email protected]