a and treatment dwi offenders in maryland … · determination on this assessment was what was...
TRANSCRIPT
ASSESSMENT AND TREATMENT OF DWI OFFENDERS
IN MARYLAND, 1995‐2003: Current Findings
FINAL REPORT SEPTEMBER 2005
Submitted to: Peter F. Luongo, Ph.D., Director Maryland Alcohol and Drug Abuse Administration Authors: Amelia M. Arria, Ph.D., Kevin O’Grady, Ph.D., Peter Smith, B.A., Nadine Connell, M.A., and Eric D. Wish, Ph.D. Center for Substance Abuse Research (CESAR) University of Maryland College Park
This project was funded by grant #50499 to CESAR from the Substance Abuse Policy Research
Program of the Robert Wood Johnson Foundation. Special acknowledgement is made to Dr. Michael Wagner at CESAR and Mr. William T. Rusinko, M.A., and Ms. Vickie Kaneko at ADAA for their assistance.

1
Clarification: Regarding the second sentence on page 33: This study involved people who were assessed and entered treatment after being arrested for driving while impaired; the researchers did not have access to information about who was mandated for treatment. This is the first step toward future research that can be done on both those who were and were not mandated for treatment. Center for Substance Abuse Research (CESAR) University of Maryland College Park 4321 Hartwick Rd, Suite 501 College Park, MD 20740 301‐405‐9770 301‐403‐8342 (fax) [email protected] http://www.cesar.umd.edu

2
ASSESSMENT AND TREATMENT OF DWI OFFENDERS IN MARYLAND 1995‐2003: CURRENT FINDINGS
Table of Contents Page A. Introduction 4 B. Background 8 1. The Prevalence and Consequences of Driving While Impaired 8 2. Characteristics of DWI Offenders 9 3. Characteristics of Repeat DWI Offenders 10 4. Preventing DWI through Legislation 11 5. Assessment and Treatment of DWI Offenders 12 C. Methods Used in this Study 13 1. Research Design 13 2. Data Sources 14 a. Interviews with Assessment Center Staff 14 b. DWI Assessment Data 14 c. Alcohol and Drug Treatment Data (SAMIS) 16 3. Data Linking Procedures 17 4. Summary of Analytic Plan 19 D. Results 20 1. Characteristics of DWI Offenders in Maryland 20 2. The Assessment Process for DWI Offenders in Maryland 22 3. The Process of Entering Alcohol Treatment among DWI Offenders 23 4. Predicting DWI Re‐assessment among DWI Offenders 27 E. Limitations 31 F. Policy Implications and Recommendations 32 G. References 35
Appendix 1. DWI Assessment Form Appendix 2. Details of Steps in Data Cleaning and Number of Cases Excluded
at Each Step Appendix 3. County‐level Reports on Treatment Experiences of DWI Offenders

3
Tables and Figures Page Table 1 DWI Assessment Form: Summary of Variables 16 Table 2 Client Level Information Available on the SAMIS Form 17 Figure 1 Summary of Analytic Plan 19 Table 3 Demographic Characteristics of the Sample of DWI Offenders Assessed
for 1995‐2003, inclusive (n = 79,277) 21
Figure 2 BAC among DWI Offenders 1995‐2003 22 Figure 3 Assessment Instruments Used at Assessment Centers (based on 161
interviews with assessment center personnel) 23
Figure 4 County‐level Variation in Assessing Individuals as “Problem Drinkers” 24 Figure 5 Sex Differences in Problem Drinker Determination 25 Figure 6 Problem Drinker Determination and Income Level 25 Figure 7 Problem Drinker Determination and BAC 26 Figure 8 Difference Between Public and Private Assessment Centers on the
Proportion of DWI Arrestees Assessed as “Problem Drinkers” 27
Figure 9 Problem Determination and Treatment Entry 28 Figure 10 County‐level Variation in the Proportion of Problem Drinkers Entering
Treatment 28
Figure 11 Summary of Treatment Experiences of Individuals who Received a “Problem Drinker Determination” on their DWI Assessment (Statewide)
30
Figure 12 Summary of Treatment Experiences of Individuals who Received a “Social Drinker Determination” on their DWI Assessment (Statewide)
30
4
A. Introduction
Driving while impaired (DWI) remains one of the most pressing public
health issues in the United States, accounting for more than 17,000 deaths
annually. Not only is DWI associated with significant economic costs, it affects
every segment of society in terms of injury, loss of life, and emotional suffering.
Thus, it is of considerable importance to determine effective methods of both
preventing drunk driving and reducing re‐assessment for DWI offenses. While
considerable attention has been focused on criminal justice sanctions to reduce
DWI offenses and recidivism, the data on treatment effectiveness for DWI
offenders are surprisingly limited and incomplete. The scientific literature is
replete with studies demonstrating the effectiveness of substance abuse
treatment. Maryland’s evaluation of drug treatment showed that treatment
completion was associated with an increased likelihood of employment and a
reduction in the chance of arrest. Moreover, few studies have been conducted
that investigate the enforcement of policies regarding mandatory assignment to
treatment programs for DWI offenders.
This study of the DWI assessment and treatment process in Maryland
aimed to fill these critical gaps in our knowledge with respect to DWI offender
characteristics, their placement into treatment, and, finally, factors that predict
re‐assessment. In Maryland, the current COMAR regulations (Section
11.17.08.04.B) state that “regardless of the number of alcohol incidents, if, as the
result of investigation, pre‐reinstatement conference or alcohol assessment, an
applicant is determined to have alcoholism or a drinking problem that has not
been addressed, the Administration (the Motor Vehicle Administration) may
require evidence of at least 6 months of satisfactory current participation in a
certified alcohol treatment program.” Offenders are assessed by a state‐
approved agency resulting in a recommendation as to the type of intervention

5
that the DWI offender should receive. This recommendation is called a “problem
determination.” DWI offenders are categorized by the assessment as either
“social drinkers” or “problem drinkers.” Although information could not be
located as to what constitutes the distinction between “problem” and “social”
drinkers, our anecdotal evidence suggested that a problem drinker
determination on this assessment was what was referred to in the COMAR
regulations stated above. Moreover, individuals receiving the “social drinker
determination” typically are referred to an approved alcohol education program
where they should receive six weekly two‐hour educational sessions.
Anecdotal evidence gathered before this project began suggested that the
process by which DWI arrestees are assessed for treatment varied widely in
Maryland, with some assessment centers using standardized criteria while others
were more brief and unstructured. Moreover, it was reported anecdotally that
many DWI offenders fell through the cracks and did not receive appropriate
services to address a potential substance abuse problem. It was unclear how
many entered treatment services, even given a problem drinker determination.
Maryland is unique with respect to having advanced statewide data
collection systems to monitor the assessment and treatment process to make this
sort of research possible. This study linked two statewide databases, both of which
have been ongoing since the early 1990s and are maintained by the Alcohol and
Drug Abuse Administration. The first, the Maryland DWI Assessment Database,
contains a record on DWI arrests that have been court‐referred for an assessment
to determine treatment eligibility. This statewide database includes pertinent
information on the offender’s history and treatment placement recommendation.
The second, the Maryland Substance Abuse Management Information System (SAMIS)
database, contains a record of all admissions and discharges within all certified
alcohol and drug treatment programs, both public and private. By merging these
6
two separate electronic statewide databases for the period of 1995 to 2003, analyses
were conducted that focused on assessment and subsequent treatment experiences
of 78,336 adult DWI offenders during this time period.
Merging these two databases also allowed us to investigate what
proportion of DWI offenders, given both problem and social drinker
determinations, were re‐assessed. It was decided that analyses on re‐assessment
would be conducted on a subset of individuals who were assessed during the
time period of 1995 to 1999. In this way, a long enough window of opportunity
for being re‐assessed was allowed. Therefore, assessment records of all
individuals who had an original assessment during 1995 to 1999 were merged
with all available treatment records (from the SAMIS database). We then
compared the proportion of DWI offenders assessed as problem drinkers who
did and did not enter treatment on whether or not they were eventually re‐
assessed. Merging these two separate electronic statewide databases created a
datafile containing 50,089 DWI offenders. Multiple logistic regression models
were developed to estimate the impact of treatment entry on re‐assessment,
holding constant demographic characteristics and blood alcohol concentration
(BAC).
In summary, the overarching goal of the study was to gain a better
understanding of the process by which DWI offenders move through Maryland’s
system, from arrest to assessment to entry into treatment, and the factors that
predicted re‐assessment. It was also of specific interest to understand how
problem drinkers and social drinkers differ with respect to demographic
variables and BAC to assess whether the distinction is meaningful. Third, the
study allowed for estimation of the number of individuals assessed as problem
drinkers who fall through the cracks and do not receive treatment services.
Lastly, the study aimed to assess the effectiveness of treatment in reducing the
7
likelihood of being re‐assessed. Re‐assessment is used as a proxy in this study for
re‐arrest; the estimates of re‐assessments underestimate the number of re‐arrests.
By understanding the current system, it is now possible to make
recommendations for improvement to reduce the overall burden of drunk
driving.
Research Questions
The questions answered in this study fall under the following three policy‐
relevant areas:
1) Assessment Process of DWI Offenders: How does the assessment process
vary from the perspective of personnel working at assessment centers in
Maryland? What factors (e.g., BAC at arrest, alcohol problem severity,
repeat‐offense status of DWI arrestees, and/or demographic
characteristics) predict problem determination (i.e., social vs. problem
drinker)? To what degree does problem determination vary by county, or
by public vs. privately funded assessment centers? How has the
proportion of individuals who are classified as problem drinkers changed
throughout time?
2) The Process of Entering Alcohol Treatment among DWI Offenders: What
proportion of DWI offenders classified as problem drinkers actually enter
treatment from those who were assigned to treatment? Do individuals
who enter treatment differ from those who do not enter treatment on
BAC, county, and/or demographic characteristics? How has the
proportion of DWI offenders who enter treatment changed throughout
time?
3) DWI Re‐assessment among DWI Offenders: Does treatment reduce the
likelihood of DWI re‐assessment? What other factors, such as higher BACs
at arrest, other drug problems, and demographic characteristics, predict

8
DWI re‐assessment? How has the frequency of re‐assessment changed
throughout time?
B. Background
1. The Prevalence and Consequences of Driving While Impaired:
Driving while impaired (DWI) is associated with enormous societal costs, both in
terms of physical injuries, emotional suffering, lost productivity, and premature
mortality. With 40% of all fatal motor vehicle accidents involving alcohol use
nationally and 37% in Maryland, it remains the leading factor in motor vehicle
deaths (Greenfeld, 1998; NHTSA, 2005). More than 17,000 persons were killed in
drunk driving accidents in 2003 (NHTSA, 2005). Each year, it is estimated that
more than four million people are victimized by drunk drivers through injury or
vehicle damage (Miller, et al, 1990). In the year 2000, alcohol‐related crashes in
the U.S. cost the public more than $143 billion and Maryland citizens $1.7 billion
(NHTSA, 2003). Epidemiologic surveys have reported that, annually, 18 million
people (20% of the U.S. population) age 16 and older drive under the influence of
alcohol or other drugs. Less than 10% of these individuals reported ever getting
arrested for drunk driving. The latest statistics indicate that in 2002, 1.5 million
people in the U.S. were arrested for driving under the influence of alcohol or
other drugs (NHTSA, 2005).
Significant progress has been made on a national level in reducing the
magnitude of consequences associated with DWI. During the 1980s, there was a
noteworthy increase in educational, legislative, and enforcement activity
(Hingson, 1993). Numerous citizen‐action groups were also formed (e.g.,
Mothers Against Drunk Driving, Students Against Drunk Driving). During the
past decade, rates of intoxication among drivers in fatal accidents have declined
for every age group in the U.S. (Greenfeld, 1998). Between 1988 and 1998, the
9
number of highway fatalities attributable to alcohol dropped by about 7,000
annually, which is a 29% decrease (Greenfeld, 1998). Moreover, enforcement of
DWI laws increased during the 1980s. Arrests for DWI peaked in 1983 when
there were 1.9 million arrests (Greenfeld, 1998) and have been decreasing in
recent decades. Between 1990 and 1997, the number of arrests for DWI decreased
18% (Maruschak, 1999). Several possible reasons could explain these decreases,
including heightened public awareness, an increase in the minimum drinking
age, a decline in the proportion of younger drivers, a decrease in per capita
alcohol consumption, and an increased emphasis on alternatives to legal
deterrents, including mandated treatment.
Despite the encouraging news, there is some evidence that the gains made
in the late 1990s are leveling off. Overall, drunk driving fatalities have increased
for the second year in a row in every age group except 16‐ to 17‐year‐olds
(NHTSA, 2002). Moreover, the number of women who were arrested for DWI
offenses has increased approximately 5% during the last decade and the number
of women involved in fatal crashes has increased 28% during the same time
period.
2. Characteristics of DWI Offenders: Many studies have documented the
demographic characteristics of DWI offenders. One‐third of all individuals
arrested for DWI are males between the ages of 21 and 24 (Greenblatt &
Bertolucci, 1994) and women account for 11% of the DWI offender population.
As a result of changes in the Federal highway funds legislation, all states raised
the minimum drinking age to 21, resulting in a decrease in the proportion of
DWI arrestees who were under 21. In 1980, individuals under 21 accounted for
10% of licensed drivers, but 15% of DWI offenses. With regard to BACs, about
80% of DWI fatalities have a BAC of 0.10 or more.

10
3. Characteristics of Repeat DWI Offenders: Almost two‐thirds of the 1.5
million drivers arrested for DWI are multiple offenders (Voas, 2001). One study
estimated that 35 to 40% of fatally injured drivers are prior DWI offenders
(Simpson, 1995). A 1998 study showed that one out of nine intoxicated drivers in
fatal crashes had a prior DWI conviction within the past three years (NHTSA,
1999). Data from California indicate that for alcohol‐related traffic accidents,
crash risk increases with number of prior arrests in a linear fashion (Jones &
Lacey, 2000).
Most studies of repeat offenders have been conducted on treatment
samples and, therefore, have limited generalizability. These studies have
observed that repeat offenders are primarily white, male, under age 50, from a
low‐income bracket, and unmarried (Donovan, 1993); Jones & Lacey, 1998;
Langworthy & Latessa, 1993; Wieczorek, 1992; Wiliszowski, 1996;). Re‐offenders
tend to have a higher BAC and greater histories of criminal activity than first‐
time offenders (Greenfeld, 1998). Our own preliminary work (O’Grady, Arria, et
al., 2002) suggests that re‐assessment can be predicted on the basis of being male,
white, less educated, and having a lower income. Available data indicate a
higher alcohol‐crash involvement among repeat offenders than among drivers
with one or zero prior offenses (Jones & Lacey, 2000). In a comparison of repeat
offenders with first‐time offenders, no significant differences with respect to age,
race, number of years licensed, educational level, SES, and marital status were
observed. However, the repeat offenders had significantly higher mean BAC at
time of arrest and 72% of repeat offenders had a prior criminal record (other than
DWI arrests) compared to 54% of first offenders (Gould & Gould, 1992). Also,
repeat offenders were more likely to be alcohol dependent than first‐time
offenders (Veneziano et al., 1993; Wieczorek et al., 1990).

11
4. Preventing DWI through Legislation: DWI prevention efforts during
the last twenty‐five years have stemmed from a variety of legislative actions that
imposed sanctions for DWI offenders. These sanctions fall under three
categories: restriction, recovery, and restitution. Restriction refers to
confinement; most states have enacted administrative license suspension and
revocation laws, as well as jail sentences for first‐time DWI drivers. Some states
also allow vehicle impoundment or withdrawal of registration (Hingson, 1993).
Recovery refers to treatment and rehabilitation measures, which almost always
operate in conjunction with law enforcement measures. Restitution involves the
collection of fines that are meant to serve as a general deterrent for first‐time
offenses as well as a specific deterrent for preventing recidivism.
Laws lowering BAC limits have also proved useful in reducing the
number of alcohol‐related traffic fatalities (Hingson, 1998). The first law enacting
BAC limits for driving was passed in 1939 in Indiana, which set the limit at 0.15%
(NHTSA, 2000). The laws subsequently passed in the U.S. lowered the limit to
0.10% or 0.08% (NHTSA, 2000). In Maryland, the 0.08 BAC law went into effect
in April 2001.
The threat or experience of jail is not a strong deterrent for DWI offenders
(Simpson, Mayhew, & Burness, 1996; Voas & Williams, 1986). Also, license
suspension does not appear to be a significant deterrent, since 75% of suspended
drivers still drive (Ross & Gonzales, 1988), even though they drive more carefully
and less often (Nichols & Ross, 1990).
In sum, law enforcement countermeasures may fail in part because many
drunk drivers are serious problem drinkers and are in need of intensive
intervention to reduce their problematic drinking. Understanding how DWI
offenders from the criminal justice system become linked to the treatment service

12
delivery system and the effectiveness of that treatment in reducing re‐assessment
is the major focus of this study.
5. Assessment and Treatment of DWI Offenders: In most states,
including Maryland, as DWI offenders pass through the criminal justice system,
they are mandated to receive an assessment that guides the placement or
assignment of the individual into either an educational program or a treatment
facility. States vary significantly with regard to the procedures they follow and
the criteria they use to assign individuals to different types of treatment.
Typically, the assessment is multi‐modal and includes the results of standardized
assessment tools such as the Michigan Alcoholism Screening Test (MAST) or the
Alcohol Use Inventory (AUI), as well as information on prior DWI convictions
and BAC at the time of arrest. Moreover, although states have written legislation
that governs the assessment process, in many cases, these assessment protocols
are not consistently followed. Although comprehensive data are lacking, it
appears that many individuals fall through the cracks, escape detection by the
assessment process, for a variety of reasons, and do not complete treatment.
As more states formalize their assessment procedures, there is an
increased need to know what designates an appropriate placement—that is, to
answer the question of whether or not individuals who are assigned to a
particular type of treatment have successful outcomes. Aside from our own
preliminary work (Arria et al., 2002 ; O’Grady, Arria, et al., 2002) showing that
demographic characteristics are predictive of assignment to treatment, few other
studies have been conducted in this area. Few longer‐term studies of treatment
outcomes among DWI offenders have been published. In contrast to mainstream
alcoholism treatment, where the primary goal is to reduce problematic drinking,
specific treatment for DWI offenders involves providing education and guidance

13
to reduce recidivism. Therefore, one challenge to treatment outcome research for
DWI offenders lies in the definition of successful outcomes.
Since an early review of the treatment literature from 1980 to 1991 by
Jones and Lacey (1991), which concluded that alcohol‐related crashes were not
significantly reduced by treatment and rehabilitation programs, more recent
evidence has supported the effectiveness of treatment (Hubbard et al, 1984;
Nochajski et al. 1997. However, the literature on this topic is incomplete and the
studies are plagued with methodological problems, including small sample sizes,
high attrition, and lack of generalizability. Wells‐Parker et al. (1995) concluded,
from a more recent meta‐analysis of the efficacy of treatment and rehabilitation
programs, that the “better” studies suggested that treatment reduced DWI
recidivism by an average of 8 to 9% compared to those who did not receive
treatment. Unfortunately, repeat offenders were not analyzed separately.
There have been only three recent studies to examine the efficacy of
treatment specifically for repeat offenders. The results indicated that the
treatment groups did only marginally better than comparison groups (DeYoung,
1997; Langworthy & Latessa, 1993; Peck et al., 1994).
One consistent finding from the literature on treatment of DWI offenders
is that treatment in the absence of legal actions might have little impact on the
subsequent crash rates of either first‐time or repeat offenders (e.g., Nichols &
Ross, 1990; Sadler et al., 1991). Results show that for all levels of prior DWI
convictions, combining alcohol treatment with either driver license restriction or
suspension is associated with the lowest DWI recidivism rates (DeYoung, 1997).
C. Methods Used in this Study
1. Research Design: Secondary data was used to create longitudinal
records of DWI offenders during the time period of 1995 to 2003, inclusive.

14
2. Data Sources: The proposed study linked and analyzed two statewide
epidemiologic databases: 1) the Maryland DWI Assessment Database that contains
records on all DWI arrests in the state; and 2) the Maryland Substance Abuse and
Management Information System Database that contains information on all
admissions and discharges to all public and private certified treatment programs.
The Maryland Alcohol and Drug Abuse Administration (ADAA) maintains both
databases.
a. Interviews with Assessment Center Staff: Through in‐depth phone
interviews with 161 individuals from different assessment centers, data were
gathered on caseloads of assessment center staff, the types of questionnaires and
interviews that are performed to arrive at a social or problem drinker
determination, and other pieces of information about the assessment process.
The sample was based on a voluntary random selection of centers from
Maryland, which has in total more than 300 assessment centers.
b. DWI Data: ADAA has been collecting data on DWI arrests in Maryland
since the early 1990s. Offenders who present themselves in court following their
arrest either come to court with the results of an assessment or are mandated by
the judge to have an assessment that recommends that they attend either a
treatment program or an educational program. For a variety of reasons,
individuals arrested for DWI might not ever appear in court and are
unfortunately lost to the system. Bench warrants are issued for these individuals,
but often the resources are not available to apprehend them. If a person who
received an assessment is re‐arrested, appears in court, and receives a
subsequent assessment, their record would appear again in the assessment
database. Currently, this is the only way to track DWI recidivism in Maryland.
We are fully aware that there may be differences in the characteristics of DWI
offenders who complete the assessment process and those who do not.

15
Unfortunately, there is no way to quantify these differences given the current
state of electronic record keeping in Maryland. It appears that Maryland is not
alone in this respect. It is anticipated that one of the results of this study will be
to highlight these issues and encourage more comprehensive record‐keeping by
the states to prevent individuals from falling through the cracks and being lost to
the system. Thus, for the purposes of this project, re‐assessment, or re‐
appearance of the individual in the assessment database, is a proxy measure of
DWI recidivism. The assessment is completed by a staff member at a certified
treatment program or a certified assessor at the court itself. The assessment
contains standard demographic information, driver’s license number, social
security number, BAC, as well as information on a number of other variables. (A
copy of the form is included in Appendix 1). Also recorded is a variable called
“problem determination”—where the individual is coded as either a “problem
drinker,” “social drinker,” or “drug involved driver.” The designation of
“problem drinker” is made on the basis of several factors: a) having a previous
DWI or other alcohol‐related offense; b) a drinking history that indicates alcohol
abuse or alcoholism (can include information on the BAC of the current offense);
and c) test results from the MAST or the AUI indicating an alcoholism problem.
“Social Drinker” status is given by an assessor to a client who does not appear to
have a serious problem with alcohol other than the immediate offense.
Table 1 summarizes the content of the DWI Assessment form (see
Appendix 1). Since 1995, more than 110,000 records have been scanned. For the
purposes of this study, assessment records from 1995 to 2003 were merged into
one datafile, inspected, and cleaned. The resulting datafile contained 78,366
individual records. Individuals who had two or more assessment records for the
same offense were excluded. More details on the datafile exclusion rules and the
number of cases deleted at each step is included in Appendix 2.

16
Table 1. DWI Assessment Form: Summary of Variables
Assessment Date Marital Status MD Driver’s License Number
Assessment County Education Offense Date County of Residence Sex Blood Alcohol
Concentration County Center Occupation Court Disposition Date Social Security
Number Employment Status Number of DWI Arrests
Race/Ethnic Background
Primary Source of Income Assessment Determination
Date of Birth Gross Annual Income Placement Recommendation
c. Alcohol and Drug Treatment Data: Maryland’s ADAA requires that all
public and private certified addiction treatment programs in Maryland report to
the SAMIS on a monthly basis. Information on treatment clients is reported to
SAMIS at two points—admission to treatment and discharge from treatment.
Clients who are recorded in SAMIS must be formally admitted and have
individualized treatment plans. They must receive at least one direct treatment
service every 30 days for their record to remain active.
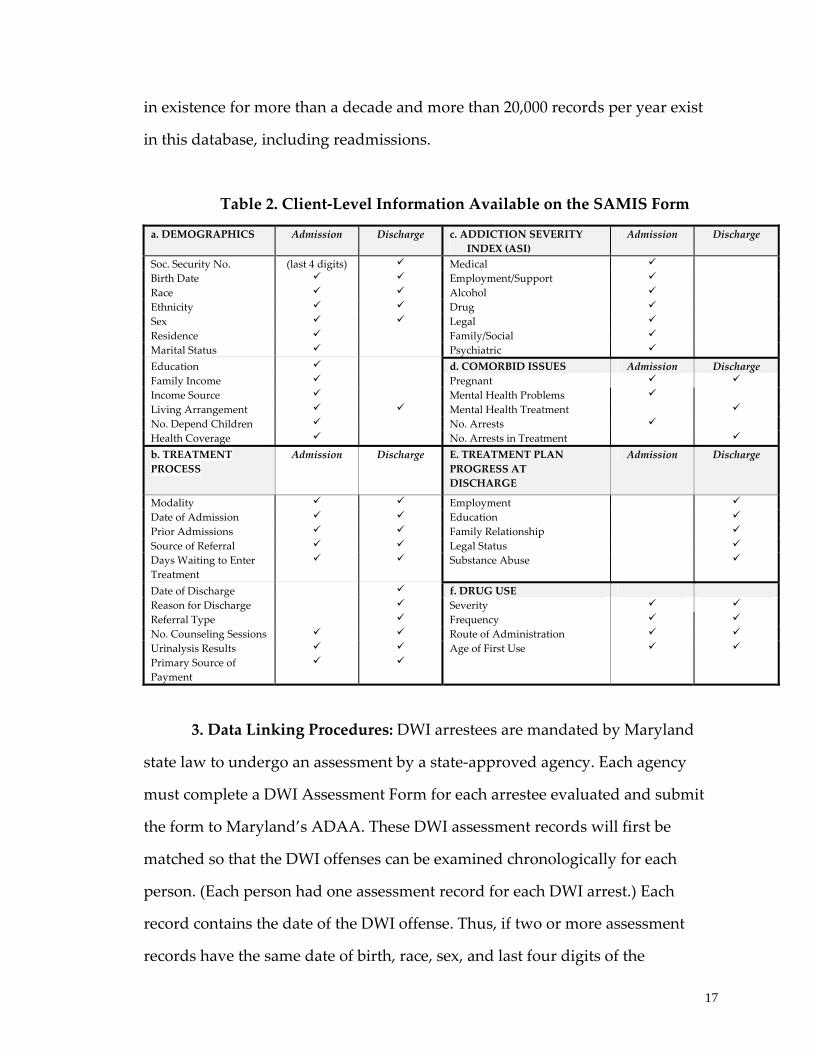
Table 2 lists all items collected on the SAMIS form. The SAMIS form
contains information collected at intake/admission to and discharge from
treatment, such as the last four digits of the social security number,
demographics, substance use patterns at admission and discharge, ASI
composite scores for adult clients, and a variety of treatment process variables.
The SAMIS was developed to permit analysis of patterns of repeated
treatment episodes and tracking of clients throughout the treatment system. The
last four digits of the client’s social security number are included, which when
combined with the date of birth, race, and sex provide a unique client
identification number. Maryland has also been using a statewide treatment
assessment instrument for adult clients since 1994. The SAMIS database has been
17
in existence for more than a decade and more than 20,000 records per year exist
in this database, including readmissions.
Table 2. Client‐Level Information Available on the SAMIS Form
a. DEMOGRAPHICS Admission Discharge c. ADDICTION SEVERITY INDEX (ASI)
Admission Discharge
Soc. Security No. (last 4 digits) Medical Birth Date Employment/Support Race Alcohol Ethnicity Drug Sex Legal Residence Family/Social Marital Status Psychiatric Education d. COMORBID ISSUES Admission Discharge Family Income Pregnant Income Source Mental Health Problems Living Arrangement Mental Health Treatment No. Depend Children No. Arrests Health Coverage No. Arrests in Treatment
b. TREATMENT PROCESS
Admission Discharge E. TREATMENT PLAN PROGRESS AT DISCHARGE
Admission Discharge
Modality Employment Date of Admission Education Prior Admissions Family Relationship Source of Referral Legal Status Days Waiting to Enter Treatment
Substance Abuse
Date of Discharge f. DRUG USE Reason for Discharge Severity Referral Type Frequency No. Counseling Sessions Route of Administration Urinalysis Results Age of First Use Primary Source of Payment
3. Data Linking Procedures: DWI arrestees are mandated by Maryland
state law to undergo an assessment by a state‐approved agency. Each agency
must complete a DWI Assessment Form for each arrestee evaluated and submit
the form to Maryland’s ADAA. These DWI assessment records will first be
matched so that the DWI offenses can be examined chronologically for each
person. (Each person had one assessment record for each DWI arrest.) Each
record contains the date of the DWI offense. Thus, if two or more assessment
records have the same date of birth, race, sex, and last four digits of the
18
offender’s social security number, the assessment records in question will be
determined to belong to the same person and the records will be linked
accordingly.
DWI assessment records were then matched to SAMIS treatment records,
as SAMIS records also contain the date of birth, race, sex, and last four digits of
the patient’s social security number. Therefore, SAMIS and DWI records with the
same date of birth, race, sex, and last four digits of the social security number
will be determined to be the same person. SAMIS treatment records that are
coincident in time and indicate the reason for treatment entry as DWI will then
be matched to DWI assessment records accordingly. Treatment admissions that
occurred prior to the index DWI offense or indicate that treatment entry was not
due to a DWI offense will necessarily be excluded from the resulting dataset.
Date of birth, race, and sex are proposed for use in the matching process
because they are unchanging characteristics of people and these variables were
available in both the DWI and treatment datasets. While the DWI assessment
dataset includes the full social security number, the treatment dataset only
includes the last four digits of the social security number. Thus, only the last four
digits are common to both datasets. However, the last four digits will be used
also for aggregating the DWI records to the person‐level because exact matches
on the full social security number may produce less accurate results. Because the
social security number is not verified when the data are collected, it sometimes
happens that one number is entered incorrectly or two adjacent numbers are
transposed.

19
Summary of Analytic Plan
Figure 1 below depicts the analytic plan for the study. Starting at the left
side of the figure, individuals who were arrested as a result of their assessment at
some time during 1995 to 2003 were classified as either “problem drinkers” or
“social drinkers.” Analyses were conducted to determine how many individuals
were assigned to each category, what factors predicted the assignment, and
whether the proportion being classified as a problem drinker has changed during
the time period studied. Next, the data were analyzed to quantify how many
problem and social drinkers subsequently entered a certified treatment program,
whether or not this proportion had changed during the time period studied, and
what factors were associated with treatment entry. The last step of the analysis
was to quantify the proportion of social and problem drinkers who were re‐
assessed at some point following their assessment, and whether those who
entered treatment had a lower likelihood of being re‐assessed.
Figure 1. Summary of Analytic Plan
It was decided that analyses on re‐assessment would be conducted on a
subset of individuals who were assessed during the time period of 1995 to 1999.
In this way, we could allow for a long enough window of opportunity for getting
DWI arrest
Social Drinker
Problem Drinker
Does Not Enter Treatment
Enters Treatment
Is not Re-assessed
Re-assessed

20
re‐assessed. Therefore, assessment records of all individuals who had an original
assessment during 1995 to 1999 were merged with all available treatment records
(from the SAMIS database). We then compared the proportion of DWI offenders
assessed as problem drinkers who did and did not enter treatment on whether or
not they were eventually re‐assessed. Merging these two separate electronic
statewide databases created a datafile containing 50,089 DWI offenders. Multiple
logistic regression models were developed to estimate the impact of treatment
entry on re‐assessment, holding constant demographic characteristics and BAC.
D. Results
1. Characteristics of DWI Offenders in Maryland
Table 3 below describes the sample of DWI offenders who were assessed
in Maryland during the time period of 1995 to 2003, inclusive. The average age of
the sample was 35 years old. As can be seen, the majority of DWI offenders are
male (81%), and the racial/ethnic distribution is fairly similar to the state
composition for that time period, with about 20% of individuals being
racial/ethnic minorities. About half the sample was single, with roughly one‐
quarter married, and another quarter divorced/separated. Individual self‐
reported annual income distribution was shifted toward the lower end of the
distribution, with more than two‐thirds of the sample having incomes lower than
$30,000. Sixty percent of assessments were conducted at a publicly funded
assessment center. More than half the sample had a time period of longer than
three months between the date of their offense and the date of their assessment.

21
Table 3. Demographic Characteristics of the Sample of DWI Offenders Assessed from 1995‐2003, inclusive (n = 78,336).
Age (µ) 35.0
% Sex (% male) 80.6
Race/Ethnicity White 78.4
African-American/Black 15.3 Hispanic 4.4
Other 1.9 Marital Status
Single 48.3 Married 26.7
Divorced/Separated 23.8 Widowed 1.5 Income
Less than $10,000 12.3 10,000-19,999 21.6 20,000-29,999 35.3 30,000-39,999 12.2 40,000-49,999 6.9 50,000-74,999 7.8
75,000+ 4.0 Assessment Center Funding
Public 60.8 Private 39.2
Days between Offense and Assessment Less than 30 days 19.0
31-60 days 12.6 61-90 days 12.0
Greater than 90 days 56.5
Figure 2 displays the distribution of the sample with regard to BAC. Almost one‐
third of individuals (29%) had a BAC of “missing,” “unknown,” or “refused;”
forty‐five percent had BAC values of greater than 0.14.

22
2. Assessment Process of DWI Offenders:
a. Results of Interviews of Assessment Center Staff
The general conclusion from data gathered from structured interviews
with 161 assessment center personnel was that what is intended to be a uniform
statewide procedure for assessment of DWI offenders lacks standardization.
Assessments vary by length, use of measures, and assessor qualifications. The
estimated time between both offense and assessment and between assessment
and treatment entry also varies greatly, from as little as a few minutes to weeks
or even months in some assessment centers. Ninety percent of the individuals
interviewed stated that the assessment is done in person, with the remaining ten
percent reporting that the assessment is conducted by phone interview. In the
vast majority of cases (85%) the assessment process was reported to last a
maximum time of more than 45 minutes, however, the assessment times were
reported to vary significantly within assessment centers. Figure 3 displays the
use of different assessment instruments within assessment centers. As the figure
shows, the most frequently used instrument is the MAST, which was used by
more than three‐quarters of assessment centers surveyed.
Figure 2. Percent Distribution of BAC Level among DWI Offenders 1995‐2003
.10-.1422%
Less than .084% .08-.10
13%
Greater than .1432%
Refused, Unknown or Missing
29%

23
About 40% of assessment centers described using a psychosocial
assessment, which was tailored for use at a particular assessment center. The use
of standardized DSM criteria to assess alcohol dependence or a clinical interview
was reported by less than 20% of assessment centers. The Addiction Severity
Index (ASI), a standardized interview that assesses the degree to which alcohol
and other drug problems are related to impairment in various domains such as
employment and family life, was used in approximately 40% of assessment
centers.
Figure 3. Assessment Instruments Used at Assessment Centers (based on 161
interviews with assessment center personnel)
Multivariate adjusted logistic regression models were developed to
examine the association between race, age, sex, income level, marital status, and
BAC and the likelihood of being assigned as a problem drinker. On average,
65.6% of DWI offenders received a problem drinker categorization, and this
figure varied significantly by county, ranging from 88% to 49% (see Figure 4).
0
10
20
30
40
50
60
70
80
% of respondents reporting the use of
various instruments
MAST
AUI
ASI
DAST
DSM
SASSI
ASA
M
C/A/G/E
BioP
sychoSocial
Driv
ing Record
Clinical In
terview

24
Figure 4. County‐level Variation in Assessing Individuals as Problem Drinkers
The results of logistic regression modeling showed that receiving a problem
drinker rather than a social drinker determination is more likely if one is male,
slightly older, less educated, divorced or separated as compared to being single
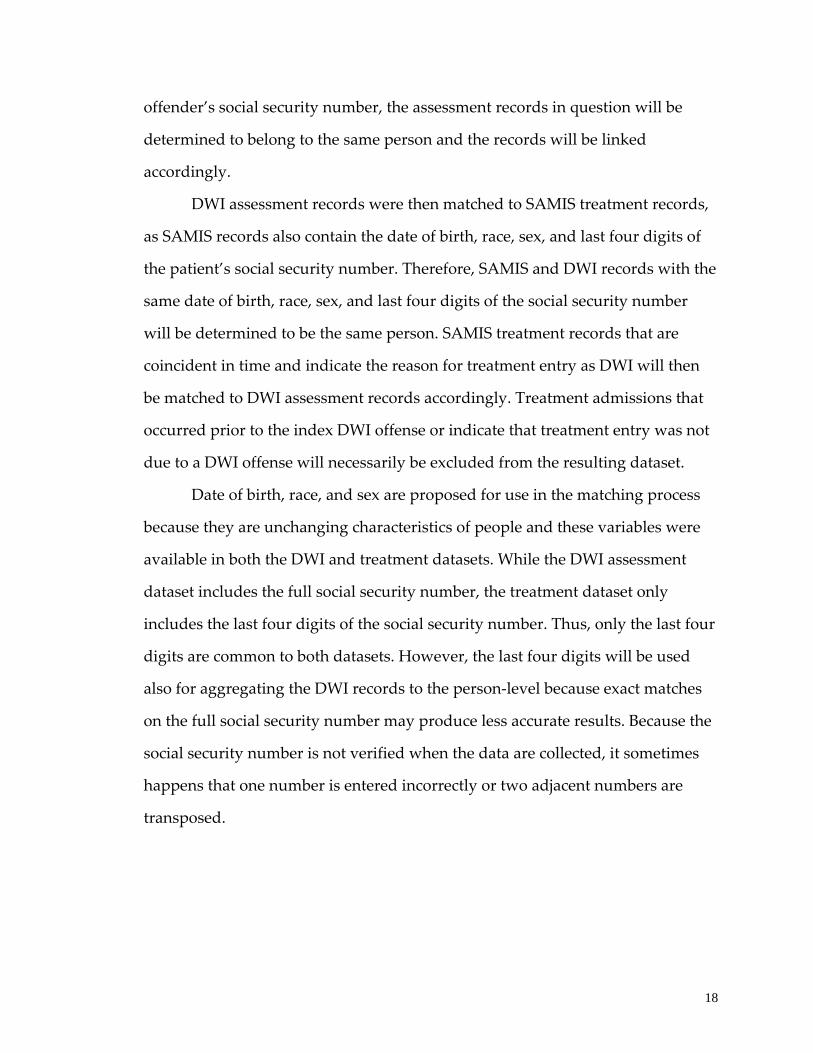
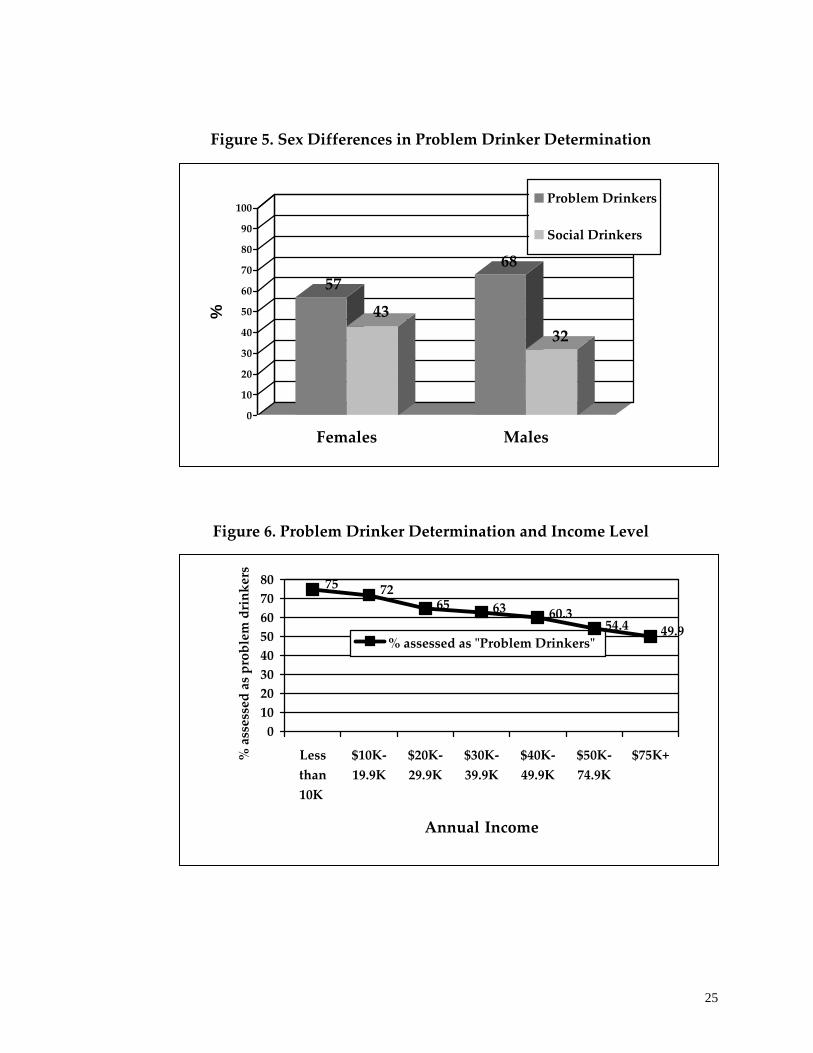
and in a lower income bracket. Figure 5 shows the differences between males
and females on the proportion assigned as problem vs. social drinkers. Among
males, 68% were assessed as problem drinkers; whereas the corresponding
percentage for females was 57%. Figure 6 shows the relationship between being
assessed as a problem drinker and self‐reported income level. Seventy‐five
percent of those making less than $10,000 a year are assessed to be problem
drinkers, while only 50% of those who make $75,000 or more are categorized as
problem drinkers.
0102030405060708090
100%
ass
esse
d as
Pro
blem
Drin
kers
A B C D E F G H I J K L M N O P Q R S T U V W X
County of Assessment Center
25
Figure 5. Sex Differences in Problem Drinker Determination
Figure 6. Problem Drinker Determination and Income Level
5743
68
32
0
10
20
30
40
50
60
70
80
90
100%
Females Males
Problem Drinkers
Social Drinkers
49.954.460.36365
7275
01020304050607080
Lessthan10K
$10K‐19.9K
$20K‐29.9K
$30K‐39.9K
$40K‐49.9K
$50K‐74.9K
$75K+
Annual Income
% assessed as problem drinkers
% assessed as ʺProblem Drinkersʺ
26
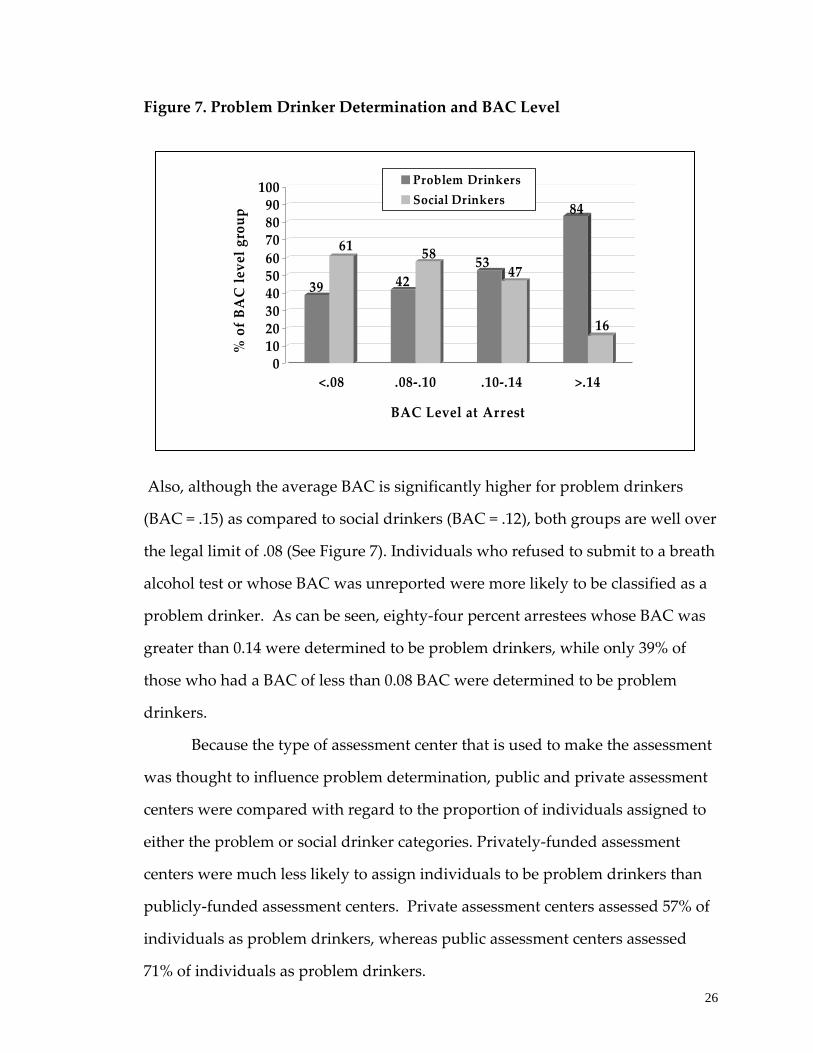
Figure 7. Problem Drinker Determination and BAC Level
Also, although the average BAC is significantly higher for problem drinkers
(BAC = .15) as compared to social drinkers (BAC = .12), both groups are well over
the legal limit of .08 (See Figure 7). Individuals who refused to submit to a breath
alcohol test or whose BAC was unreported were more likely to be classified as a
problem drinker. As can be seen, eighty‐four percent arrestees whose BAC was
greater than 0.14 were determined to be problem drinkers, while only 39% of
those who had a BAC of less than 0.08 BAC were determined to be problem
drinkers.
Because the type of assessment center that is used to make the assessment
was thought to influence problem determination, public and private assessment
centers were compared with regard to the proportion of individuals assigned to
either the problem or social drinker categories. Privately‐funded assessment
centers were much less likely to assign individuals to be problem drinkers than
publicly‐funded assessment centers. Private assessment centers assessed 57% of
individuals as problem drinkers, whereas public assessment centers assessed
71% of individuals as problem drinkers.
39
61
42
58 53 47
84
16
0102030405060708090100
% of BAC level group
<.08 .08‐.10 .10‐.14 >.14
BAC Level at Arrest
Problem DrinkersSocial Drinkers

27
Figure 8. Difference between Public and Private Assessment Centers on the
Proportion of DWI Arrestees Assessed as Problem Drinkers
Error!
3. The Process of Entering Alcohol Treatment among DWI Offenders:
Half of problem drinkers who were assigned to treatment based on their
assessment did not enter treatment up to a eight‐year window following their
DWI offense date (see Figure 9 below). Although not mandated to attend
treatment, 13% of social drinkers entered a certified treatment program at some
point following their assessment date. It is important to note that in both
instances (for problem and social drinkers) the entry of treatment might or might
not have been directly tied to the particular DWI offense for which the
assessment was conducted. There is no way of telling from the data that the
treatment received is a result of being arrested for DWI at that particular time. As
shown in Figure 10, the likelihood of treatment entry varied significantly by
county.
Social Drinkers
29%
Problem Drinkers
71%
Public Assessment Private Assessment
Social Drinkers
43%Problem Drinkers
57%

28
Figure 9. Problem Determination and Treatment Entry
Figure 10. County‐level Variation in the Proportion of Problem Drinkers
Entering Treatment
The results of logistic regression models developed to predict treatment
entry based on sociodemographic characteristics and BAC revealed few striking
differences between problem drinkers who entered treatment and those who did
not. Higher levels of income and education were modestly associated with
treatment entry. Having a higher BAC was statistically related to entering
n = 78366
DWI assessment1995-2003 Social Drinker
Problem Drinker
Does Not Enter Treatment
Enters Treatment66%n = 51617 50%
50%
87%
13%
n = 2674934%
0102030405060708090
100
% o
f Pro
blem
Drin
kers
ent
erin
g Tr
eatm
ent
A B C D E F G H I J K L M N O P Q R S T U V W X
County of Assessment Center
29
treatment for both problem and social drinkers, but the association with BAC
was greater for social drinkers.
4. DWI Re‐assessment among DWI Offenders
Figures 11 and 12, below, summarize the results of the analyses that were
conducted to quantify the proportion of individuals who were assessed at some
point during 1995 to 1999 and who were re‐assessed following their assessment,
up until 2003. This allows for a maximum window of opportunity for re‐
assessment of eight years, for those who were assessed in 1995. The results show
that among the problem drinkers eligible for re‐assessment, 19% of those who
never entered treatment were re‐assessed as compared to 7% of those individuals
who completed treatment. For social drinkers, the percentage that were re‐
assessed was also lower among those who completed treatment (4%) as
compared to those who never entered treatment (10%).
The results of multivariate logistic regression modeling revealed that any
contact with the treatment system appeared to be associated with a similar
decreased likelihood of re‐assessment. In addition to not entering treatment,
being white, male, younger, and having less education and less income were all
associated with being re‐assessed among problem drinkers. In addition, having a
longer time period between the offense and assessment date was associated with
a greater likelihood of re‐assessment. Problem drinkers who were assessed at
private centers were more likely to be re‐assessed than individuals who were
assessed at publicly funded centers (The results of the detailed logistic regression
models showing the significance of these relationships are available upon
request).

30
Figure 11. Summary of Treatment Experiences of Individuals who Received a “Problem Drinker Determination” on their DWI Assessment (Statewide)
Figure 12. Summary of Treatment Experiences of Individuals who Received a “Social Drinker Determination” on their DWI Assessment (Statewide)
As shown in Tables 3a through 3d, completers of treatment were 43% as likely to
be reassessed as compared to individuals who did not enter a treatment
“Problem”Drinkers
59%Completed Treatment
47%Entered a Treatment Program
53%Did Not Enter a
Treatment Program
15%Were Referred
27%Did Not Complete
Treatment
7%
Re-assessed
8%
9%
19%
“Social”Drinkers
58%Completed Treatment
12%Entered a
Treatment Program
88%Did Not Enter a
Treatment Program
16%Were Referred
25%Did Not Complete
Treatment
4%
Re-assessed
6%
7%
10%
31
County‐specific reports on the treatment experiences of DWI offenders
can be found in Appendix 3. These results can be helpful to the counties in their
planning process for treatment and prevention services for DWI offenders. One
must exercise extreme caution, however, in making comparisons across counties
since there are a multitude of other variables that account for the variation
among counties in Maryland. For example, each report presents the percentage
of problem drinkers that entered treatment in the county. This percentage is a
reflection of the treatment availability in the county (both in terms of the number
of programs and the number of slots that are available), the distance between
treatment facilities and clients, and a number of other factors that influence
treatment access. Counties also vary on the proportion of individuals who
complete their treatment program, which again, is determined by a wide array of
variables, such as problem severity, past treatment experiences, etc. The key
point to be made is that counties may vary significantly on these unmeasured
parameters and therefore, the results cannot and should not be used for the
purposes of ʺrankingʺ counties in their response to treating DWI offenders. All
counties can improve their process of standardizing criteria for assessment of
DWI offenders, making treatment available and accessible, and ensuring that the
treatment is effective and appropriate to the clients needs.
Limitations
Because this study used administrative data and not data collected solely
for the purposes of a research project, data quality issues are a potential
limitation of the research. The face and construct validity of the data was
maximized through an extensive data cleaning process. Moreover, extensive edit
checks are conducted on SAMIS at the state‐level and the data also undergo
federal Treatment Episode Dataset edit checks. In addition, the Maryland ADAA
has instituted a SAMIS validation process whereby on‐site reviews of program
32
records are conducted to establish the validity of information provided to
SAMIS.
Another limitation of the data linking methodology used in this study was
that an offender who was arrested in another state would not have been included
in our database.
In addition to data issues, a larger limitation inherent in all studies of DWI
offenders is the inability to generalize the information to all drinking drivers.
Perrine (1990) aptly described the drinking driver population as “the Quick, the
Caught, and the Dead” and pointed out that investigations of DWI offenders are
limited to studying only “the Caught.” Many more drinking drivers do not get
caught as compared to those who do. Past success in reducing drunk‐driving
fatalities has shown us that the prevention strategies that are designed as a result
of studying this restricted group of drinking drivers still can have a significant
impact.
Policy Implications: The results of this study have a number of policy
implications. First, for the first time, Maryland policymakers can now better
understand the process by which DWI offenders are assigned to treatment. The
way the COMAR regulations are written now leaves some room in the decision
to mandate that assessments be conducted and that all problem drinkers should
be assigned to treatment. It appears from the data that there are few differences
between social and problem drinkers. Substantial county‐level variation exists in
the proportion of individuals who are deemed to be problem drinkers. The study
observed that the assessment process lacks standardization. The first
recommendation based on this study is to employ more standardized assessment
procedures so that DWI offenders are referred to the most appropriate types of
treatment, which should seriously consider the use of a diagnostic or clinical
assessment tool.

33
Second, this study uncovered how many and what types of DWI
offenders who were deemed to be problem drinkers were escaping placement
into treatment services. Before this study was conducted, the assessment
database was kept separate from the treatment service database and, therefore, it
was not possible to obtain a clear picture of the linkage between DWI offenders
who are assessed and mandated to treatment with those who actually show up
and receive treatment. Anecdotal evidence strongly suggested that many
individuals were falling through the cracks—that is, they have not been receiving
the services that they were mandated to receive. This study confirmed this earlier
impression and found that half of problem drinkers who were assigned to a
treatment service did not enter treatment. The second recommendation from this
study is to put into place tighter monitoring systems to ensure that appropriate
treatment assignments are followed up on so that the individual receives the
services that are necessary to treat an underlying substance abuse problem. The
time gap between offense and assessment date should also be minimized, as this
study showed that a shorter time period was associated with a lower likelihood
of re‐assessment.
Third, this study describes treatment outcomes for DWI offenders who
receive treatment services. The results of this study are consistent with earlier
studies showing the benefits of treatment in terms of reducing substance use,
increasing the likelihood of employment, and reducing the chances of criminal
justice system involvement (Hubbard, 1984; Luchansky, 2000). This study
increases our understanding of the characteristics of individuals at high risk for
DWI re‐arrest and how treatment might reduce the likelihood of re‐assessment.
The literature is replete with studies demonstrating that recidivists represent a
monumental challenge to treatment providers. Most experts would agree that
sanctions and other legislative actions have been undertaken more as an effort to
34
reduce first‐time offenses than to affect the likelihood of a re‐offense (Andenas,
1988; Cavaiola, 2002; Laurell, 1991).
Maryland’s policymakers have demonstrated their commitment to
maintaining efficient and automated data collection systems for both DWI
offenses and treatment admissions as well as their strong commitment to
enhancing and expanding the quality of treatment services in Maryland. It is
anticipated that there will be continued interest in providing appropriate
treatment services to reduce the economic and social burden associated with
drunk driving in Maryland.
35
G. References/Bibliography
Anderson, T.W. (1971). The statistical analysis of time series. New York: Wiley.
Andenaes, J. (1988). The Scandinavian experience. In M.D. Laurence, J.R. Snortum, and F.E. Zimring (Eds.), Social control of the drinking driver, pp. 43‐63. Chicago: University of Chicago Press.
Argeriou, M., McCarty, D., & Blacker, E. (1985). Criminality among individuals arraigned for drinking and driving in Massachusetts. Journal of Studies on Alcohol 46: 525‐259.
Arria, A.M., O’Grady, K.E., Sanchez, L., Benner, T., Kaneko, V., Wish, E. (2002) Determination of assignment to treatment among DWI offenders using a statewide database. Poster presented at Annual Meeting of the Research Society on Alcoholism.
Ball, S.A., Jaffe, A.J., Crouse‐Artus, M.S., Rounsaville, B.J., & OʹMalley, S.S. (2000). Multidimensional subtypes and treatment outcome in first‐time DWI offenders. Addictive Behaviors, 25,167‐181.
Cavaiola, A.A., Wuth, C. (2002). Assessment and Treatment of the DWI Offender. New York: The Halworth Press.
Cavaiola, A. A., Wolf, J. M., & Lavender, N. J. (1999). Comparison of DWI offenders and non‐offenders on the MMPI‐2 and MAST. Paper presented at the 34th Annual Conference on Recent Advances o the MMPI‐2 and MMPI‐A. Huntington Beach, CA, April.
Cohen, J. (1988). Statistical Power Analysis for the Social Sciences. 2nd Edition. Hillsdale, NJ: Earlbaum.
DeYoung, D.J. (1997). An evaluation of the effectiveness of alcohol treatment, driver license actions and jail terms in reducing drunk driving recidivism in California. Addiction, 8, 989‐997.
Donovan, D.M.; Queisser, H.R.; Salzberg, P.M.; and Umlauf, R.L. (1985). Intoxicated and Bad Drivers: Subgroups within the Same Population of High‐Risk Men Drivers. Journal of Studies on Alcohol 46: 375‐82.
Donovan, D.M.; Umlauf, R.L.; and Salzberg, P.M. (1990). Bad Drivers: Identification of a Target Group for Alcohol‐Related Prevention and Early Intervention. Journal of Studies on Alcohol 51: 395‐428.
Fuller, W.A. (1976). Introduction to statistical time series. New York: Wiley.
McCleary, R., & Hay, R. (1980). Applied time series analysis for the social sciences. Beverly Hills, CA: Sage.
Gould, L.A., & Gould, K.H. (1992). First‐time and multiple‐DWI offenders: a comparison of criminal history records and BAC levels. Journal of Criminal Justice, 20, 527‐539.
Glymour, C., Scheines, R., Spirtes, P., & Kelly, K. (1987). Discovering causal structure. San Diego: Academic.

36
Greenblatt, J.C., & Bertolucci, D. (1994). Characteristics of persons who reported driving under the influence of alcohol or other drugs. Presented at the Joint Statistical Meetings, Toronto, Canada.
Greenfeld, L.A. (1998). Alcohol and crime: An analysis national data on the prevalence of alcohol involvement in crime. Bureau of Justice Statistics, Washington, DC: U.S. Department of Justice.
Hingson, R. (1993). Prevention of alcohol‐impaired driving. Alcohol Health & Research World, 17, 28‐34.
Hingson, R., Meeren T.E., Winter, M. (1998). Effect of Maine’s 0.05% legal blood alcohol level for drivers with DWI convictions. Public Health Reports 113, 440‐6.
Hubbard RL, Marsden ME, Rachal JV, Harwood HJ, Cavanaugh ER, Ginzburg HM. (1984). Drug Abuse Treatment: A National Study of Effectiveness. Chapel Hill, NC: University of North Carolina Press.
Jones, R. K. & Lacey, J. H. (1998). Final report alcohol and highway safety: problem update. Washington, DC: National Highway Traffic Safety Administration.
Jones, R.K., & Lacey, J.H. (2000). State of knowledge of alcohol‐impaired driving: Research on repeat DWI offender, DOT HS 809 027. Washington, DC: National Highway Traffic Safety Administration.
Langworthy, R., & Latessa, W.J. (1993). Treatment of chronic drunk‐drivers – the turning point project. Journal of Criminal Justice, 21, 265‐276.
Laurell, H. (1991). The impact of low BACs in legislation. Paper presented at the 36th International Institute on the Prevention of Treatment of alcoholism, Stockholm, Sweden, June 2‐7.
Luchansky B, Brown M, Longhi D, Krupski A, Stark K. (2000). “Chemical Dependency Treatment and Employment Outcomes: Results from the ‘ADATSA’ Program in Washington State.” Drug and Alcohol Dependence 60:151‐159.
Maruschak, L.M. (1999). DWI offenders under correctional supervision. Bureau of Justice Statistics, Washington, DC: U.S. Department of Justice.
McArthur, D.L., & Kraus, J.F. (1999). The specific deterrence of administrative per se laws in reducing drunk driving recidivism. American Journal of Preventive Medicine, 16 (1 Suppl), 68‐75.
McKnight, A.J., Voas, R.B. (1991). The effect of license suspension upon DWI recidivism. Alcohol, Drugs & Driving, 7, 43‐54.
Miller, B.A, Windle M. (1990) Alcoholism, problem drinking and driving while impaired In: R Wilson, R.E. Mann (eds.) Drinking and Driving (p. 68‐95). New York: Guilford Press.
Moskowitz, H., Walker, J., & Gomberg, C. (1979). Characteristics of DWIs, alcoholics Controls. In: Proceedings of the 1979 NCA Alcohol and Traffic Safety Session (pp. 9‐79). Washington, DC: National Highway Traffic Safety Administration.
37
National Highway Traffic Safety Administration (1997). Drinking and Driving in the U.S. : The National Roadside Survey, IIHS Status Report. Washington, DC: U.S. Department of Transportation.
National Highway Traffic Safety Administration (1999). Traffic safety facts, 1998: Alcohol, DOT HS 808 950. Washington, DC: U.S. Department of Transportation.
National Highway Traffic Safety Administration (2000). Driver characteristics and impairment at various BACs, DOT HS 809 075. Washington, DC: U.S. Department of Transportation.
National Highway Traffic Safety Administration (2005). Traffic safety facts, 2003: Alcohol, DOT HS 808 950. Washington, DC: U.S. Department of Transportation.
Nichols, J. L., & Ross, H. L. (1990). The effectiveness of legal sanctions in dealing with drinking drivers. Alcohol, Drugs, and Driving, 6(2), 33‐55.
Nichols, J. L., & Ross, H. L. (1989). The effectiveness of legal sanctions in dealing with drinking drivers. In Surgeon General’s workshop on drunk driving. Background papers (pp. 93‐112). Rockville, MD: Office of the Surgeon General, U.S. Department of Health and Human Services.
Nochajski, T. H., Augustino, D. K., & Wieczorek, W. F. (1997). Treatment outcome and drinking driving recidivism. Paper presented at the Research Society on Alcoholism Annual Meeting, July, San Francisco, CA.
Nochajski, T. H., Miller, B. A., Wieczorek, W. F., & Whitney, R. (1993). The effects of a drinker‐driver treatment program: Does criminal history make a difference? Criminal Justice and Behavior 20: 174‐189.
O’Grady, K.E., Arria, A.M., Sanchez, L., Benner, T., Kaneko, V., Wish, E. (2002) Predictors of DWI arrests from 1995‐2000 using a statewide database. Poster presented at the Annual Meeting of the Research Society on Alcoholism.
Ostrom, C. W. (1990). Time Series Analysis: Regression Techniques (Second Edition). Beverly Hills, CA: Sage.
Peck, R.C., Arstein‐Kerslake, G.W. et al. (1994). Psychometric and biographical correlates of drunk‐driving recidivism and treatment program compliance. Journal of Studies on Alcohol 55: 667‐678.
Perrine, M. W. (1990). Who are the drinking drivers? Alcohol Health and Research World 14: 26‐35.
Project MATCH Research Group. (1997). Matching alcoholism treatment to client heterogeneity: Project MATCH post‐treatment drinking outcomes. Journal of Studies on Alcohol. 58: 7‐29.
Ross, H. &Gonzales, P. (1988). The effect of license revocation on drunk‐driving offenders. Accident Analysis and Prevention, 20(5): 379‐391.

38
Sadler, D., Perrine, M., Peck, R.C. (1991). The long‐term traffic safety impact of a pilot alcohol abuse treatment as an alternative to license suspension. Accident Analysis and Prevention, 23, 203‐224.
Scheines, R., Spirtes, P., Glymour, C., & Meek, C. (1994). TETRAD II: Tools for causal modeling. Userʹs manual and software. Hillsdale, NJ: Erlbaum.
Simpson, H. M. (1995). Who is the persistent drinking driver? Part II: Canada and elsewhere. In Strategies for dealing with the persistent drinking driver, Transportation Research Circular 437: 21‐25.
Simpson, H.M., Mayhew D.R., Beirhess, D.J. (1996). Dealing with hard‐core drinking offenders. Ottawa Canada: Traffic Injury Research Foundation.
Spirtes, P., Glymour, C., & Scheines, R. (1993). Causation, prediction, and search. In Springer‐Verlag (Ed.), Lecture notes in statistics (p. 81). New York: Springer‐Verlag.
Veneziano, C., Veneziano, L., & Fichter, M. (1993). Psychosocial and sociodemographic characteristics of DWI offenders. Journal of Addictions & Offender Counseling, 14, 14‐24.
Voas, R.B., Williams A.F. (1986) Age differences of arrested and crash involved drinking drivers. Journal of Studies on Alcohol, 47:244‐248.
Voas, R. B. (1999). The three Rs for controlling the hard‐core drinking driver: MADD’s program for the repeat DWI offender. The Prevention Pipeline, 12(3):1‐6.
Voas, R. & DeYoung, D. J. (2001). Vehicle action: Effective policy for controlling drunk and other high‐risk drivers? Accident Analysis and Prevention.
Voas, R. B., Marques, P. R., Tippetts, A. S. & Beirness, D. J. (1999). The Alberta Interlock Program: The evaluation of a province‐wide program on DUI recidivism. Addiction, 94(12): 1857‐1867.
Wells‐Parker, E., Anderson, B.J., McMillen, D.L., & Landrum, J.W. (1989). Interactions among DUI offender characteristics and traditional intervention modalities: A long‐term recidivism follow‐up. British Journal of Addiction, 84, 381‐390.
Wells‐Parker, E., Landrum, J.W., & Topping, J.S. (1990). Matching the DWI offender to an effective intervention strategy: An emerging research agenda. In R.J. Wilson & R.E. Mann (Eds.), Drinking and Driving: Advances in Research and Prevention (pp.267‐289). New York: The Guilford Press.
Wells‐Parker, E., Bangert‐Drowns, R., McMillen, R., & Williams, M. (1995). Final results from a meta‐analysis of remedial interventions with drink/drive offenders. Addiction, 90, 907‐926.
Wieczorek, W.F., Miller, B.A., & Nochajski, T.H. (1992). The limited utility of BAC for identifying alcohol‐related problems among DWI offenders. Journal of Studies and Alcohol 53: 415‐419.

39
Wieczorek, W.F., & Miller, B.A. (1992). Preliminary typology for treatment matching of driving while‐intoxicated offenders. Journal of Consulting and Clinical Psychology, 60, 757–765.
Wieczorek, W.F., Miller, B.A. & Nochajski, T.H. (1990). Alcohol diagnoses among DWI offenders. In: The Problem Drinking Driver Project Research Note 90‐6, 1‐2.
Wiliszowski, C., Murphy, P.V., Jones, R.K., & Lacey, J.H. (1996). Determine reasons for repeat drinking and driving, DOT HS 808 401. Washington, DC: National Highway Traffic Safety Administration.
Zador, P. L. (1991). Alcohol‐related relative risk of fatal driver injuries in relation to driver age and sex. Journal of Studies on Alcohol 52: 302‐310.

40
Appendix 1. DWI Assessment Form

41
Appendix 2. Details of Steps in Data Cleaning and Number of Cases Excluded at Each Step
112,104 Records from ADAA 1995-2003 Deleted:
-1,583 Duplicate Cases -4,670 Missing/Invalid SSN -797 Missing Assessment Date
-2,269 Assessment Date before 1995 or after 2003 -17 Missing Offense Date
-2,275 Offense Date before 1995 or after 2003 -219 Missing/Invalid County/Center Code -1457 Missing Demographics -355 Missing/Invalid Problem Determination
-13,642
-3,564 “Shoppers” second assessments -3,658 “Shoppers” first assessments -7,222
-10,613 Second assessments of repeat offenders (not individuals; records)
-1381 Drug-involved drivers
-880 Non-unique ID records for matching (440 individuals)
78,366 Total number of available records for analyses for prediction of problem determination
*Note: Statistical analyses conducted on this sample will have a smaller number of cases due to missing data.
51,617 Problem drinkers 26,749 Social drinkers
50,089
Total number of available records for analyses for prediction of re-assessment (truncated sample of individuals assessed from 1995-1999) *Note: Statistical analyses conducted on this sample will have a smaller number of cases due to missing data.
33,694 Problem drinkers (1995-1999)
16,395 Social drinkers (1995-1999)

42
Appendix 3. County‐level Reports