a 1000 mwth boiler for chemical-looping combustion of...
TRANSCRIPT

Applied Energy 157 (2015) 475–487
Contents lists available at ScienceDirect
Applied Energy
journal homepage: www.elsevier .com/locate /apenergy
A 1000 MWth boiler for chemical-looping combustion of solidfuels – Discussion of design and costs
http://dx.doi.org/10.1016/j.apenergy.2015.04.0570306-2619/� 2015 The Authors. Published by Elsevier Ltd.This is an open access article under the CC BY-NC-ND license (http://creativecommons.org/licenses/by-nc-nd/4.0/).
⇑ Corresponding author.E-mail address: [email protected] (A. Lyngfelt).
Anders Lyngfelt ⇑, Bo LecknerChalmers University of Technology, 412 96 Göteborg, Sweden
h i g h l i g h t s
� Chemical-Looping Combustion (CLC) is a novel combustion technology for CO2 capture.� CLC avoids large costs and energy penalties of gas separation for CO2 capture.� A scale-up of CLC technology for solid fuels to 1000 MWth is investigated.� CLC technology is similar to CFB technology.� Estimated cost of CLC with capture relative to CFB without capture is 20 €/tonne CO2.
a r t i c l e i n f o
Article history:Received 16 December 2014Received in revised form 13 April 2015Accepted 15 April 2015Available online 5 May 2015
Keywords:Chemical-looping combustionCO2 captureCirculating fluidized bedSolid fuel
a b s t r a c t
More than 2000 h of solid-fuel CLC operation in a number of smaller pilot units clearly indicate that the con-cept works. A scale-up of the technology to 1000 MWth is investigated in terms of mass and heat balances,flows, solids inventories, boiler dimensions and the major differences between a full-scale CirculatingFluidized-Bed (CFB) boiler and a Chemical-Looping Combustion CFB (CLC–CFB). Furthermore, the addi-tional cost of CLC–CFB relative to CFB technology is analysed and found to be 20 €/tonne CO2. The largestcost is made up of compression of CO2, which is common to all capture technologies. Although the needfor oxygen to manage incomplete conversion is estimated to be only a tenth of that of oxy-fuel combustion,oxygen production is nonetheless the second largest cost. Other significant costs include oxygen-carriermaterial, increased boiler cost and steam for fluidization of the fuel reactor.
� 2015 The Authors. Published by Elsevier Ltd. This is an open access article under the CC BY-NC-NDlicense (http://creativecommons.org/licenses/by-nc-nd/4.0/).
1. Introduction
Chemical-looping combustion (CLC) has emerged as an attrac-tive option for carbon dioxide capture because CO2 is inherentlyseparated from the other flue-gas components. Ideally, no gasseparation equipment is needed and no energy is expended forgas separation. The CLC system is composed of two interconnectedfluidized bed reactors, an air and a fuel reactor [1]. Oxygen carriersin the form of metal oxide particles transfer oxygen between thetwo reactors, Fig. 1.
CLC research has mainly been focusing on gaseous fuels but inthe past few years, important work has been dedicated to adaptingthe process to solid fuels. A number of reviews are available forgreater detail [2–5]. Lewis et al. [6] were the first to study solidfuels for CLC, using copper and iron oxides. Fifty years later, a num-ber of new laboratory studies emerged employing the same oxides,
as well as manganese and nickel, involving testing in both fixedbeds [7,8] and laboratory fluidized beds [9,10]. The first operationusing solid fuels in a 10 kW unit was realized in 2006 [11] andtoday, a number of published articles address CLC pilot operationusing solid fuel, e.g. [12–21].
It is the purpose of the present paper to discuss the design of aCLC boiler for solid fuel in view of the similarities to the well-known and commercially viable circulating fluidized-bed (CFB)technology, and furthermore, to identify the technology differencesas well as the cost impact of those differences. Although techno-economic studies of the process have been performed in EUprojects like ENCAP and ECLAIR, little detail about the designsand cost estimations of solid-fuel CLC boilers has been published.
1.1. Solid-fuel chemical-looping combustion
The direct use of solid fuels in CLC could employ the CFBconcept outlined in Fig. 2, originally proposed for gaseous fuels,by adapting the fuel-reactor system to solid fuels. In Fig. 2 a

Airreactor
Fuelreactor
MexOy
MexOy-1
N2, O2 CO2, H2O
FuelAir
Fig. 1. CLC principle. MexOy is the metal oxide circulated.
air
flue gas
N2 + O2
fuel
1
3
2
CO2
4
4
1
H2O
air
flue gas
N2 + O2
fuel
1
3
2
CO2
4
4
1
H2O
Fig. 2. CFB reactor system for gas, (1) air reactor, (2) cyclone, (3) fuel reactor (4)loop seals.
char
solid fuel
direct reaction with oxygen carrier
steam gasification to syngas (H2/CO)
syngas reacts with oxygen carrier
volatiles
Fig. 3. Solid fuel reactions in CLC.
FUEL (with carbon)
Carbon (char lossto air reactor)
Incomplete
Incomplete gasconversion (need for
oxy-polishing)
Carbon (char) loss to stack
Fuelreactor
Fig. 4. Inadequate performance of the fuel reactor.
476 A. Lyngfelt, B. Leckner / Applied Energy 157 (2015) 475–487
non-circulating fuel reactor is depicted, but for a commercial-scaleunit a circulating fuel reactor would be preferred. With solid fuels,the reaction between the char remaining after the release of thevolatiles and the oxygen carrier is not direct but involves an inter-mediate gasification step, Fig. 3.
Both release of volatiles and char gasification have importantimplications for the design of the fuel reactor. Ideally, the fuel willbe completely converted to CO2 and H2O in the fuel reactor. In thecase of solid fuels, a fully oxidized gas is normally not attained,which can be remedied by adding oxygen in a post-oxidationchamber downstream of the fuel reactor, so-called ‘‘oxy-polishing’’. Fig. 4 illustrates the three likely deviations from theideal case; (i) loss of combustible gases like H2, CO and CH4 inthe gas leaving the fuel reactor; (ii) loss of char to the air reactor;and (iii) loss of char with the gas leaving the fuel reactor. Thecorresponding performance indicators are:
i. Oxygen demand, XOD, is the oxygen required to oxidizeunburnt gas leaving the fuel reactor to CO2 and H2O overthe total oxygen needed to oxidize the gases released fromthe fuel in the fuel reactor. 1-XOD is the gas conversion.The oxygen demand indicates the oxygen needed foroxy-polishing.
ii. CO2 capture, gCO2, is the fraction of gaseous carbon leavingthe fuel reactor related to the total carbon converted to gasin fuel and air reactors. Thus, 1-gCO2 represents the ratio ofthe carbon lost as CO2 from the air reactor to the total carbonin gaseous compounds leaving air and fuel reactors.
iii. Fuel conversion, gF, is used to indicate the char conversionand is defined as the ratio of carbon converted to gaseouscompounds in the fuel and air reactors to total carbon added.Consequently, 1-gF is the fraction of total carbon added thatis elutriated from the fuel reactor in the form of char.
CLC with solid fuels requires a design of the fuel reactor that dif-fers from that of the CLC with gaseous fuels, and oxygen carrierswith other properties are preferred:
� The ash, normally being part of solid fuels, reduces the lifetimeof the oxygen carrier, as ash removal inevitably results in lossesof oxygen carrier. Also, the ash might directly affect the oxygencarrier, indicating the need for a low-cost oxygen carrier.� The gasification of char is a slow process, and the fuel reactor
should be designed to provide sufficient residence time forsolids in order to prevent char particles from reaching the airreactor. CO2 produced by char burning in the air reactor is notcaptured and that should be avoided.� To achieve high conversion of the volatiles, the fuel should be
fed to the fuel reactor in a way that allows good contactbetween the bed material, i.e. the oxygen carrier, and the vola-tiles released.
An advantage of CLC operating with solid fuels is that mostoxygen carriers, including low-cost materials, are highly reactivetowards syngas. However, the syngas is released from char

Table 2Composition of coal 602 in% as received.
Moisture Ash C H N S O
4.00 8.63 72.70 4.75 1.51 1.83 6.58
A. Lyngfelt, B. Leckner / Applied Energy 157 (2015) 475–487 477
particles moving around inside the fuel reactor, in contrast to gas-eous fuels which are introduced from below. Thus, some of thesyngas, particularly that released in the upper regions of the fuelreactor, will have insufficient contact with the bed material.Therefore complete conversion of the gas is difficult to achieve inthe fuel reactor. There are several ways to reach full conversionof the gas; in this study, it is assumed that oxy-polishing is used,which means that oxygen is introduced downstream of the fuelreactor in order to oxidize remaining unconverted gases, e.g. H2,CO, CH4, H2S and NH3.
2. Operational experience
Total operational experience using solid-fuel CLC amounts tomore than 2000 h in eleven units in a size range of 0.5 kW to3 MW. With the exception of a 25 kW unit using a moving bed fuelreactor [22], they all use fluidized beds. The largest are a 3 MW unitthat has been operating with CaSO4/CaS as oxygen carrier [23]; a1 MW unit operated with ilmenite [24]; a 100 kW unit with severalpublications covering operation of various fuels and oxygen carri-ers, modelling and mass balances; and a 50 kW unit recently takeninto operation [25]. The 1 and 3 MW units have both demonstratedautothermal operation. Most of the operation in the pilots involveslow-cost iron oxide and ilmenite [2,26]. The operational experienceshows that the process works well, but that full conversion of thefuel to CO2 and H2O in the fuel reactor is normally not attained.
For example, the 100 kW pilot at Chalmers University shows agas conversion of up to 84% with pulverized coal and ilmeniteand considerably higher conversion of up to 95% for low-volatilefuels like wood char [20,27]. The latter illustrates that the conver-sion of syngas generated from char is high but that the conversionof volatiles is less efficient. Operating this unit has also shown thatthe overall gas conversion may be significantly improved by add-ing manganese ore [27]. The CO2 capture in the 100 kW unit, usingpulverized coal, was typically around 98%. Thus, partly thanks to acarbon stripper, little char was lost to the air reactor. On the otherhand, the fuel reactor experienced a large loss of char with the exit-ing gases, but as discussed in the section on performance below,this result should have little relevance for larger scale operations.
3. Tentative design of a CLC–CFB plant
A CLC power plant using solid fuel would have significant sim-ilarities to a CFB power plant, a commercially viable technology forsizes up to 600 MWe. The air reactor could be set up as a CFB boiler,with some notable differences, such as higher solids circulationand smaller gas flow as the oxygen is consumed and no combus-tion products are released. The gas flow through the fuel reactoris made up by the combustion products CO2 and H2O, typically20–25% of the total gas flow, and some extra gas added for fluidiza-tion. Because the gas flow in the fuel reactor is much smaller thanthe gas flow in the air reactor, the fuel reactor could be consider-ably smaller than the air reactor. In addition, the fuel reactor wouldhave to be adiabatic.
Table 1Lower heating value (Hi) over stoichiometric air demand (L0) for normal conditions. Coal
Fuel MJ/mn3 Fuel MJ/mn
3
Coal 101 3.83 Coal 302H 3.78Coal 102 3.80 Coal 303H 3.80Coal 201 3.82 Coal 401 3.79Coal 202 3.82 Coal 501 3.78Coal 204 3.80 Coal 502 3.82Coal 301a 3.80 Coal 601 3.78Coal 301b 3.80 Coal 602 3.77
In the EU ENCAP project, a first design of a 455 MWe CLC powerplant for solid fuel was made. A comparison to a similar fluidizedbed combustion power plant indicated a very low efficiency pen-alty, <3%, as well as a very low CO2 capture cost, 10 €/tonne ofCO2, [28]. The major additional cost was associated with the CO2
compression. However, little detail has been published to makethese results available.
Below, a tentative design will be presented to highlight the dif-ferences and similarities to conventional large-scale CFB boilers.The basis for the design proposed is 1000 MWth, correspondingto around 400 MWe. Whenever possible and reasonable the designsimilar to existing and known technology, without any pretencethat such an approach would always be optimal. Most likely, a fullyoptimized design would diverge more from the design features ofcommercial CFBs.
3.1. Fuel properties in relation to CLC
If related to the heating value, the stoichiometric air needed forcombustion is similar for different coals. Table 1 shows the ratio(Hi/L0) of the lower heating value to stoichiometric air demandfor 19 coals, the volatile contents of which vary between 5% and40%. The average of the ratio is 3.8 MJ/mn
3, and the standard devia-tion is 0.018. The solid fuels in the table are normalized at a mois-ture content of 4%. An increase in moisture content to 12% lowersthe ratio by 0.029. As shown in the table, many other gaseous andliquid hydrocarbon fuels have similar ratios, whereas the ratio isquite different for CO and H2. This ratio is important not only forthe calculation of the air needed for a given power, but also forthe calculation of the heat balance in the fuel reactor, which willbe highlighted in a following section.
Coal 602 with an Hi/L0 ratio of 3.77 MJ/mn3 is selected for the
present calculations. Its composition is given in Table 2.
3.2. Fluidizing velocities and circulation
A fundamental condition for the design is an adequate solids cir-culation between the air and fuel reactor. Too low a circulation willlead to a high temperature difference between the air and fuel reac-tor, i.e. a low temperature in the fuel reactor that will slow downthe char gasification, thus lowering fuel conversion and CO2 cap-ture. The heat balance in Section 3.5 gives the circulation5.3 tonne/s, which corresponds to 25.5 kg/m2,s. Normally, the cir-culation in large circulating fluidized beds is, if known, not pub-lished, but there are some data in the literature. According to Yueet al. [30], the circulations measured in large CFB boilers are around6–10 kg/m2,s at fluidizing velocities in the range 5–6 m/s. These
data from [29].
Fuel MJ/mn3 Fuel MJ/mn
3
Coal 701 3.76 Petrol 3.76Coal 702 3.78 Fuel oil 3.77Coal 802 3.80 Methane 3.70Coal 902 3.79 Propane 3.77Wood 3.71 CO 5.23Peat 3.59 H2 4.45Lignite 3.74 C 3.78

Table 3Estimated gas flows, reference CFB.
Air ratio 1.2Fuel moisture, % 4Hi/L0, MJ/mn
3 3.77Air flow, mn
3/s 318Flue gas flow (wet), mn
3/s 367Flue gas flow at 850 �C (wet), m3/s 1510Fluidization velocity, m/s 5.4
478 A. Lyngfelt, B. Leckner / Applied Energy 157 (2015) 475–487
numbers differ from those reported by Wu et al. [31], where the cir-culation in a 300 MWe CFB boiler operated at 5.4 m/s is 42 kg/m2,s.The circulation chosen for CLC–CFB is approximately an average ofthese two values from the literature. However, to adopt a conserva-tive approach, we assume that the values in the lower range are themost relevant and that we, compared to a reference CFB, need toincrease the circulation by a factor of four. There are several alter-natives to attain the circulation needed:
(1) The use of a separate, dedicated riser to move particles to thefuel reactor.
(2) A higher velocity, i.e. a smaller cross-section of the airreactor.
(3) A lower height air reactor.(4) Smaller particles.
The first alternative, a separate riser, is always a solution andhas the advantage of decoupling the fluidization of the air reactorand the global circulation. However, it would add some complexityand cost to the boiler system and other solutions will most likelywork as well.
In the second alternative, the relationship between gas velocityand circulation is quite complex. In order to raise the circulation bya factor of four, an increase in velocity by approximately 30% isassumed, whereas a rise circulation by a factor of two would requirean increase in velocity by 15%. These results are based on measure-ments in a 12 MWth CFB in which variations of mass circulation by1–2 orders of magnitude has been achieved by changes in gas veloc-ity, using three particle sizes [32]. Similar results were obtained in acold-flow model simulating CLC [33]. However, in the present studywe choose not to use increased velocity to reach higher circulationbecause of the risk for erosion of the heat-transfer wall materials.For the CLC design, there is good reason not to significantly deviatefrom the practice of commercial CFB boilers in this case.
An important feature of an air reactor in comparison to a CFB isthe absence of combustible gases and char that need to be wellmixed with the combustion air and gain sufficient residence timeto become fully converted. Consequently, there is no need for a cer-tain gas residence time and there is no need for, or advantage of, ahigh reactor. Moreover, as discussed below, the air reactor requiresless cooling surface than the CFB boiler. As internal panel walls orexternal fluidized heat exchangers can be used to increase heatextraction, there is no need for a high reactor to accomplish theheat transfer. Thus, the minimum height of the air reactor isinstead determined by the height of the cyclones and ducts feedingthe oxygen carrier to the fuel reactor.
The effect of the reduced height on the circulation of solids isgiven by the decay constant, describing the exponential decay insolids concentration with height. Measurements in a 12 MWth
CFB yielded the decay constant K = 0.23/(u–ut), where u is the flu-idization velocity and ut the terminal velocity, [32]. With u-ut inthe range of 4–5 m/s, the decay constant becomes around 0.05.Consequently a decrease in air-reactor height of 15 m, as proposedin the design below, doubles the circulation, assuming the datafrom the 12 MW boiler can be used. The height of the air reactormight be further reduced depending on the design and placing ofthe cyclone, loop-seal and ducts. It is concluded that a reducedair reactor height is an effective measure to increase the circulationof solids.
The fourth option by which the solids circulation may beincreased is particle size. As there is no straightforward simplerelationship between particle size and circulation, we use datafrom a 12 MWth CFB [32] indicating that a doubling of the circula-tion may be attained by lowering the particle diameter by 10%.
Furthermore, the higher density of an ilmenite oxygen carrier,3800 kg/m3, compared to a normal bed material in CFB, 2600 kg/m3,
motivates an additional lowering of size. A size reduction of 11% com-pensates for this increase in density, in the sense that it will keep theArchimedes number constant. In total, a size reduction of 20% is thenanticipated. Oxygen carrier materials normally investigated in CLCpilots, 100–200 lm, are somewhat smaller than the particle sizesused in CFBs, 150–300 lm.
In a normal CFB the circulation is also affected by a tapered bot-tom part as well as the split between primary and secondary airaddition. In the CLC–CFB case the situation is different becausethe oxygen in the air does not react with char or volatile gases butwith the bed material. To maximize the contact between air andoxygen carrier, a flat bottom bed and no secondary air would be bestin the CLC–CFB case. These two differences have opposite effects onthe circulation, and it is assumed that the net effect is small.
The terminal velocity becomes 5% lower because the viscosityof air is 7% higher at the higher temperature chosen, 1020 �C.However, the effect on circulation is minor, with an estimatedincrease of around 10%.
In conclusion, we assume that lowering the height of the airreactor in combination with some decrease in particle size is suffi-cient to increase the circulation by a factor of four.
3.3. Boiler dimensions and flows
The CFB reference is a 1000 MWth plant with the same cross-sec-tion per MW and the same height as the Lagisza 460 MWe plant;otherwise, the plant is a conventional CFB and equipped with sixcyclones. The reference plant has the following dimensions:
� Cross-section (Depth �Width): 11 � 25.5 = 280 m2, height:48 m.
Based on the Hi/L0 ratio and fuel composition, air and flue gasflows as well as the fluidizing velocity have been calculated forthe reference CFB, Table 3. The table shows the assumptions andflows calculated for the reference plant leading to a gas velocityof 5.4 m/s.
The total gas flow in the CLC–CFB plant includes extra gas forfluidization of the fuel reactor, as well as for the fluidization ofthe loop seals connecting the reactors. On the other hand, it isassumed that the air flow may be reduced by the lower air ratioas compared to a conventional CFB. As a result, the normalizedgas flow is 5% smaller in the CLC–CFB case despite the added flu-idization flow in the fuel reactor, whereas the actual volume flowof gas in the air and fuel reactors together is 7% higher becauseof the lower gas density resulting from higher temperature. Theflows for the CLC–CFB are provided in Table 4, including additionalassumptions for air ratio and the flow used to fluidize the fuel reac-tor (FR). The temperatures were chosen based on the positiveexperimental experiences at these temperatures.
Table 5 shows the dimensions and velocities assumed for thereference and CLC–CFB cases. As mentioned, the gas velocities inthe fuel and air reactors are chosen to be approximately similarto those of the reference case. Fig. 5 shows these dimensionsincluding a comparison to the reference case. The top sections ofthe two air reactors are 13 m below the top of the fuel reactor,
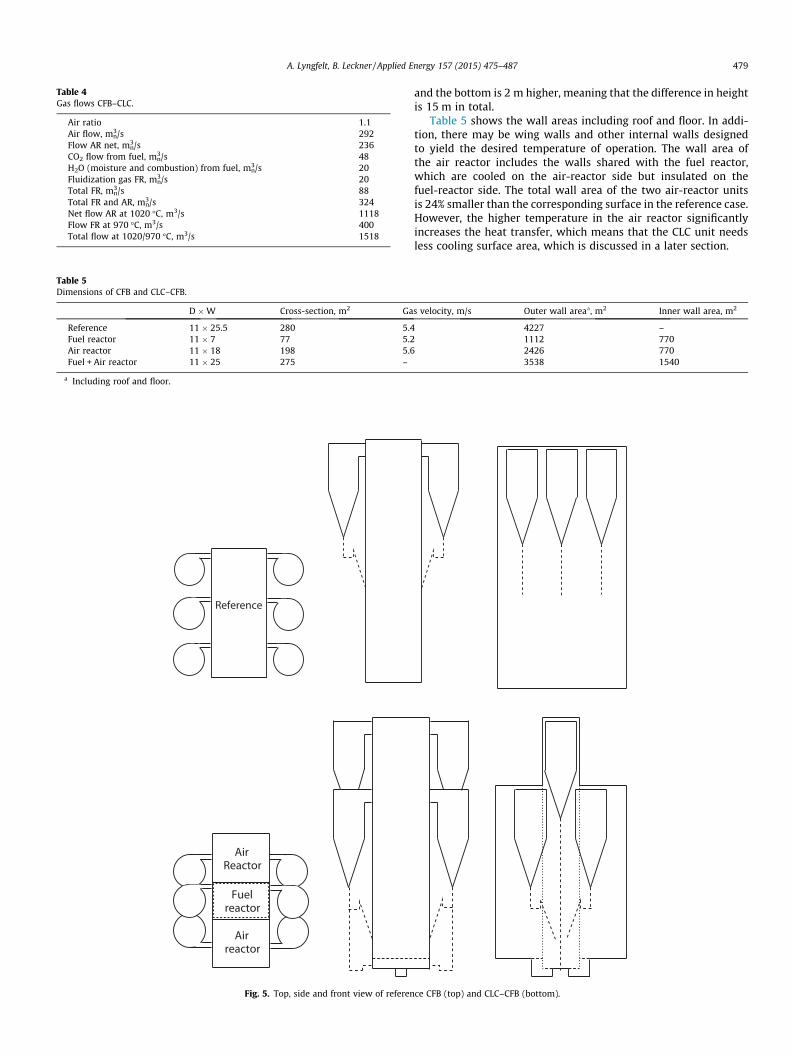
Table 4Gas flows CFB–CLC.
Air ratio 1.1Air flow, mn
3/s 292Flow AR net, mn
3/s 236CO2 flow from fuel, mn
3/s 48H2O (moisture and combustion) from fuel, mn
3/s 20Fluidization gas FR, mn
3/s 20Total FR, mn
3/s 88Total FR and AR, mn
3/s 324Net flow AR at 1020 �C, m3/s 1118Flow FR at 970 �C, m3/s 400Total flow at 1020/970 �C, m3/s 1518
Table 5Dimensions of CFB and CLC–CFB.
D �W Cross-section, m2 Ga
Reference 11 � 25.5 280 5.4Fuel reactor 11 � 7 77 5.2Air reactor 11 � 18 198 5.6Fuel + Air reactor 11 � 25 275 –
a Including roof and floor.
AirReactor
Fuelreactor
Airreactor
Reference
Fig. 5. Top, side and front view of referen
A. Lyngfelt, B. Leckner / Applied Energy 157 (2015) 475–487 479
and the bottom is 2 m higher, meaning that the difference in heightis 15 m in total.
Table 5 shows the wall areas including roof and floor. In addi-tion, there may be wing walls and other internal walls designedto yield the desired temperature of operation. The wall area ofthe air reactor includes the walls shared with the fuel reactor,which are cooled on the air-reactor side but insulated on thefuel-reactor side. The total wall area of the two air-reactor unitsis 24% smaller than the corresponding surface in the reference case.However, the higher temperature in the air reactor significantlyincreases the heat transfer, which means that the CLC unit needsless cooling surface area, which is discussed in a later section.
s velocity, m/s Outer wall areaa, m2 Inner wall area, m2
4227 –1112 7702426 7703538 1540
ce CFB (top) and CLC–CFB (bottom).
480 A. Lyngfelt, B. Leckner / Applied Energy 157 (2015) 475–487
The wall areas of the fuel reactor can be separated into internalwalls, i.e. the walls common to the air reactor, and external walls:
� Internal walls, shared with the air reactor: 770 m2.� External walls, including roof and floor: 1112 m2.
Both internal and external walls of the fuel reactor are insulatedto avoid heat losses. Likewise, the two cyclones of the fuel reactorcannot be cooled and need to be insulated. Assuming an innerdiameter of 6 m and a height of 15 m, the two cyclones comprisea total area of 450 m2. The total area of ducts leading from and intothe fuel reactor is assumed to be 635 m2, and an important part ofthis area belongs to the two tall downcomers from the cyclones ofthe fuel reactor.
3.4. Solids inventories, bed heights and pressure drops
The fuel reactor of the 100 kW Chalmers’ pilot has beenoperated with pressure drops of 14–23 kPa corresponding to250–400 kg/MWth [34]. A solids inventory of the fuel reactor of500 tonnes is assumed, i.e. 500 kg/MWth. In the case of the airreactor, calculations indicate a minimum solids inventory of50–100 kg/MWth [35]. A solids inventory of 250 tonnes in the airreactor is assumed. Table 6 shows pressure drops and thedefluidized bed heights.
3.5. Heat balance and material flows
A convenient way of evaluating the heat balance is to comparethe heat produced from the reaction of fuel and oxygen carrier for agiven amount of oxygen. The heat of reaction per mole of oxygenfor different fuels can be calculated based on the ratio of the heatof reaction to the stoichiometric air, cf. Table 1. Examples of reac-tion enthalpies for some fuels per mole of oxygen, as well as forsome oxygen carriers, are provided in Table 7. It may be observedthat the reaction enthalpies of the oxygen carriers are somewhathigher than those of coal. For ilmenite, FeTiO3, it is known thatphase separation may occur, leading to the formation of Fe2O3,which should result in a higher reaction enthalpy. A measurementof the reaction enthalpy of ilmenite after 81 h of operation yieldeda reaction enthalpy between that of iron oxide and FeTiO3 [36].This value, i.e. �468 kg/mole, means that for a thermal power of1000 MW, the heat produced in the air reactor is 1156 MW (cf.the ratio to coal in Table 7) and that the endothermic heat of reac-tion in the fuel reactor is �156 MW.
Table 6Solids inventories of air and fuel reactors.
Fuel reactor Air reactor
Inventory, tonnes 500 250Pressure drop, kPa 64 16Settled bed height, m 3.1 0.8
Table 7Heat of reaction for oxidation of oxygen carriers and fuels.
Reaction DH, kJ/mole (O2) Ratio to coal
O2 + ½CH4 ? ½CO2 + H2O �401.7 –O2 + 2CO ? 2CO2 �562.8 –O2 + 2H2 ? 2H2O �498.5 –O2 + C ? CO2 �403.3 –O2 + coal ? xCO2 + yH2O �405.1 1O2 + 4Fe3O4 ? 6Fe2O3 �479 1.182O2 + 4FeTiO3 ? 2Fe2TiO5 + 2TiO2 �445 1.098O2 + ilmenite (from [36]) �468 1.156O2 + 6MnO ? 2Mn3O4 �449 1.108
Furthermore, energy is used to heat the gas flows and the fuelentering the fuel reactor to the temperature of the fuel reactor. Itis estimated that the heating of coal needs 58 MW and the heatingof fluidizing gas needs 27 MW.
In addition, the heat loss from the external walls and ducts isassumed to be 1.0 MW and the loss through the internal walls is0.4 MW. Table 8 shows the heat balance of the fuel reactor. Totalheat lost in the fuel reactor is 242 MW. Assuming a temperaturedifference between the air and fuel reactor of 50 K and a specificheat of the ilmenite of 919.5 J/kg,K yields a required circulationflow of 5.3 tonnes/s. This value was used in the previous sectionon velocities and circulation. With the inventories given, this circu-lation flow corresponds to residence times of 95 and 47 s in thefuel and air reactors. Moreover, with a total oxygen transfer of78.5 kg/s, Dx, the mass-based conversion of the oxygen carrier,is 1.5%, a reasonable value as the oxygen transfer capacity of ilme-nite is well above this other figure.
The heat balance assumes full conversion in the fuel reactor.The effect of incomplete conversion can be estimated by compar-ing the reactions in Table 7. Incomplete conversion would not alterthe rate of fuel addition, because gas or char not converted in thefuel reactor is either converted in the air reactor or in an oxygenpolishing step downstream of the fuel reactor. Thus, the thermalpower is not affected by incomplete conversion in the fuel reactor.Table 9 shows the effect on the heat balance, given the assump-tions that 10% of the carbon added leaves the fuel reactor as char,i.e. carbon, 6% as CO, 3% as CH4 and that the hydrogen flow equalsthe CO flow. Here, the unconverted gas composition assumedwould correspond to an oxygen demand of approximately 10%.Unconverted CO and H2 will have a negative effect on the heat bal-ance, because the reaction with the oxygen carrier is exothermic.For the assumed gas composition this effect is compensated forby unconverted CH4 as this avoids the endothermic reaction withthe oxygen carrier. Unconverted char will have a similar positiveeffect on the heat balance. The overall effect in this example is asmall reduction of the heat loss in fuel reactor, i.e. from 242 MWto 228 MW. Therefore, it can be concluded that incomplete conver-sion would only have a minor effect on the heat balance of the fuelreactor.
3.6. Bed pressure drop in AR and fluidization of FR with steam and hotCO2
The pressure drop in the AR is 16 kPa, Table 6, which is assumedto cause an added pressure drop for the air fan of 10 kPa compared
Table 8Heat balance fuel reactor.
Heat, MW
Reaction �156Heating coal �58Heating fluidizing steam �27Loss external walls �1.0Loss internal walls �0.4Total �242
Table 9Effect of incomplete conversion.
Heat, MW
Carbon 13.6CO �6.0H2 �1.9CH4 8.4Sum 14.1

transport zone
dense bed
distributor
freeboardbed surface
approx. height dense region
down-comer
duct to air
reactor
fuel addition
mat
eria
l fro
m
air r
eact
or
Fig. 6a. Side view of the right-hand half of the fuel reactor showing volatilesdistributor and solids return. Arrows indicate movement of bed material.
fuel addition
fuel addition
sym
met
ry li
ne, i
.e. c
entr
e of
fuel
reac
tor
Fig. 6b. Top view of the right-hand half of the fuel reactor, showing volatilesdistributor and solids return.
A. Lyngfelt, B. Leckner / Applied Energy 157 (2015) 475–487 481
to the pressure drop of the primary air of the reference plant. Thesecondary air in the reference plant will be added through the bot-tom bed air-nozzles in the CLC–CFB case which is assumed to givean additional pressure drop of 20 kPa. With a ratio of secondary toprimary air of unity, this totally adds up to an additional compres-sion work of approximately 4.6 MWe. However, the major part ofthe electric energy enters the air reactor as sensible heat, and thisheat produces an additional 1.8 MW of electricity. Thus, the effi-ciency penalty for the added pressure drop is somewhat below0.3%.
For the assessment of the effect of the fluidization of the fuelreactor it is assumed that 1.5 bar steam is used, which is producedby bled steam taken at 2 bar. If only steam were used for fluidiza-tion of the fuel reactor, the resulting efficiency penalty would beapproximately 0.8%. It is clear that steam for fluidization is criticalto the performance and should be minimized as far as possible.
From an efficiency point of view, fluidization with recycled CO2
is preferred. CO2, however, is a poor gasification agent. A betteroption would be to recycle ‘‘hot CO2’’, i.e. flue gas withdrawnbefore condensation containing both CO2 and H2O. The efficiencypenalty for using ‘‘hot CO2’’ is smaller, estimated at below 0.2%.
In this work, 50% hot CO2 and 50% steam were chosen, whichyields a penalty of 0.5% and a steam fraction in the flue gas of39%. A notable difference between the gasification in a CLC unitand normal gasification is that the steam is not consumed becausethe hydrogen formed is rapidly re-oxidized to steam. Similarly, thehydrogen in the volatiles also forms steam which becomes avail-able for the gasification.
The above gives a total energy penalty for fluidization of the airand fuel reactors of approximately 0.8%, which is estimated to yielda CO2 avoidance cost of approximately 0.8 €/tonne CO2.
3.7. Fuel reactor connections and design
Normally, the flow of solids from the cyclones is returned abovethe bottom bed. In the case of CLC, feeding the material from thecyclone of the fuel reactor low down into the bed is motivatedby a desire to reach a high conversion of char, as one importantpurpose of the cyclone is to separate unconverted char and returnit to the fuel reactor. Furthermore, feeding fuel into this return flowwould help to introduce the fuel into the fuel reactor. A conse-quence of returning the material in the bottom bed is that thereis a high particle column in the standpipe of the downcomer fromthe cyclone. To avoid production of gas that might disturb thecyclone operation, the loop seal should be fluidized by CO2.
As noted in Table 4, the major gas flow in the fuel reactor comesfrom the oxidation of gases formed by the fuel throughdevolatilization and gasification. The remaining part of the gas flowis the gas necessary to assure that the bed is properly fluidized overthe entire cross-section. This flow is 20 mn
3/s or 23% of the total gasflow in the fuel reactor, corresponding to a fluidizing velocity ofaround 1 m/s in the lowermost part of the bed.
In order to avoid a local plume of volatiles where fuel is addedwithout having to resort to a large number of fuel entries, a devicefor distributing volatiles is used. The principle of such a ‘‘volatilesdistributor’’ is described in a patent application [37]. It is basedon the fact that a box immersed in a fluidized bed with the openingdownward would become empty, which means the bed surfacewould follow the lower edge of the box. If such a box had anyopenings, the bed surface would rise to the level of the openings.In short, the volatiles distributor can be described as an elongatedbox with the opening downward and holes on the sides. If this dis-tributor is immersed in a fluidized bed, the bed material wouldform a bed surface at the level of the holes. Above this surface,gas can flow freely and gas injected into this distributor wouldleave the distributor via the holes. The fuel should be added in such
a way that the volatiles are released in a gas volume connected tothe distributor. Furthermore, the volatiles distributor would have anumber of ‘‘arms’’ to assure a good distribution of volatiles acrossthe cross-section.
A possible lay-out of such a volatiles distributor and its place-ment at the bottom part of the fuel reactor is provided inFigs. 6a–6c. The detailed design would need to be optimized, usingexperimental data from cold-flow testing in combination withfluid-dynamic modelling, as well as cost analysis. Considering theconditions in the fuel reactor, such a construction would likelyhave a limited lifetime, making regular replacements necessary.Nevertheless, the volatiles distributor is worthwhile, consideringthe importance of good contact between the reacting gas and oxy-gen carrier to achieve high gas conversion with the aim of mini-mizing oxygen production for polishing.
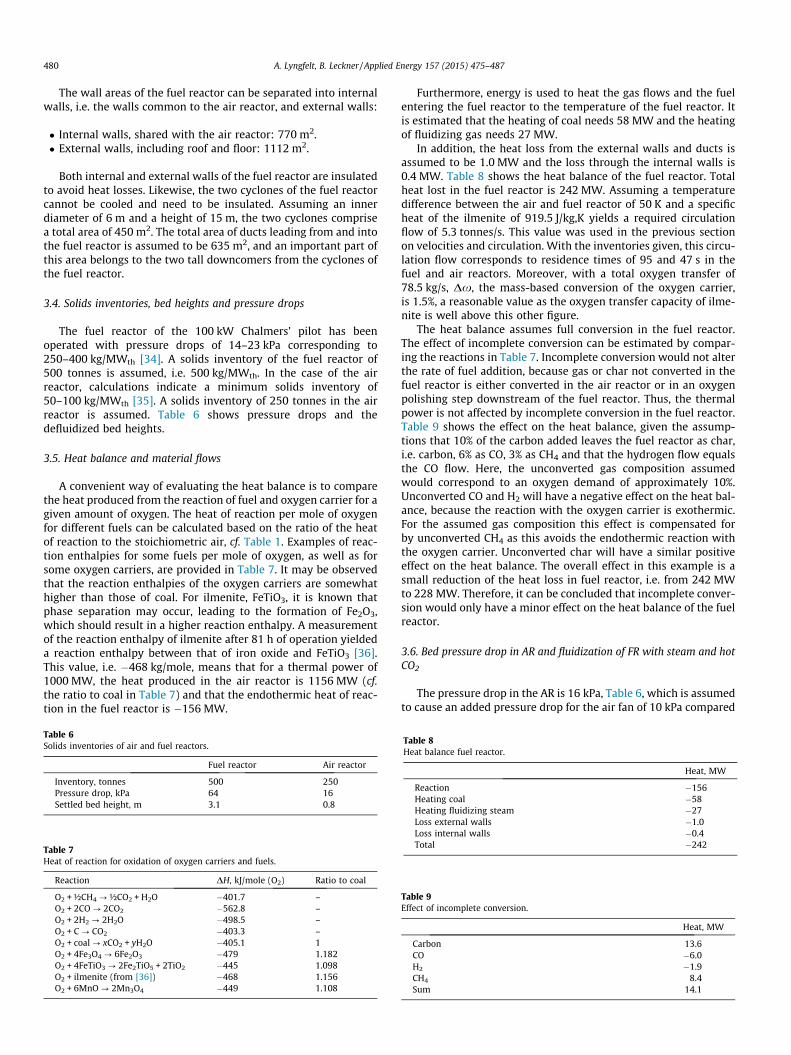
Figs. 6a and 6b shows how the material is returned from thecyclone of the fuel reactor, and how the fuel is added to the free-board on the downstream side of the loop seal. Fuel added followsthe flow of solids coming from the cyclone of the fuel-reactor. Thematerial coming from each downcomer is divided into two flows.The freeboard where the fuel is added, Figs. 6a and 6b, is extendedto form a channel which goes all along the external wall of the fuelreactor. This channel connects to the arms of the volatiles distrib-utor and could be used for additional fuel entries. Determination of
approx. height dense region
solids return solids return
Fig. 6c. Other side view showing cross-sections of the arms of the volatilesdistributor and solids return to the air reactor.
482 A. Lyngfelt, B. Leckner / Applied Energy 157 (2015) 475–487
the optimal locations and number of fuel inlets into the freeboardconnected to the distributor requires detailed studies.
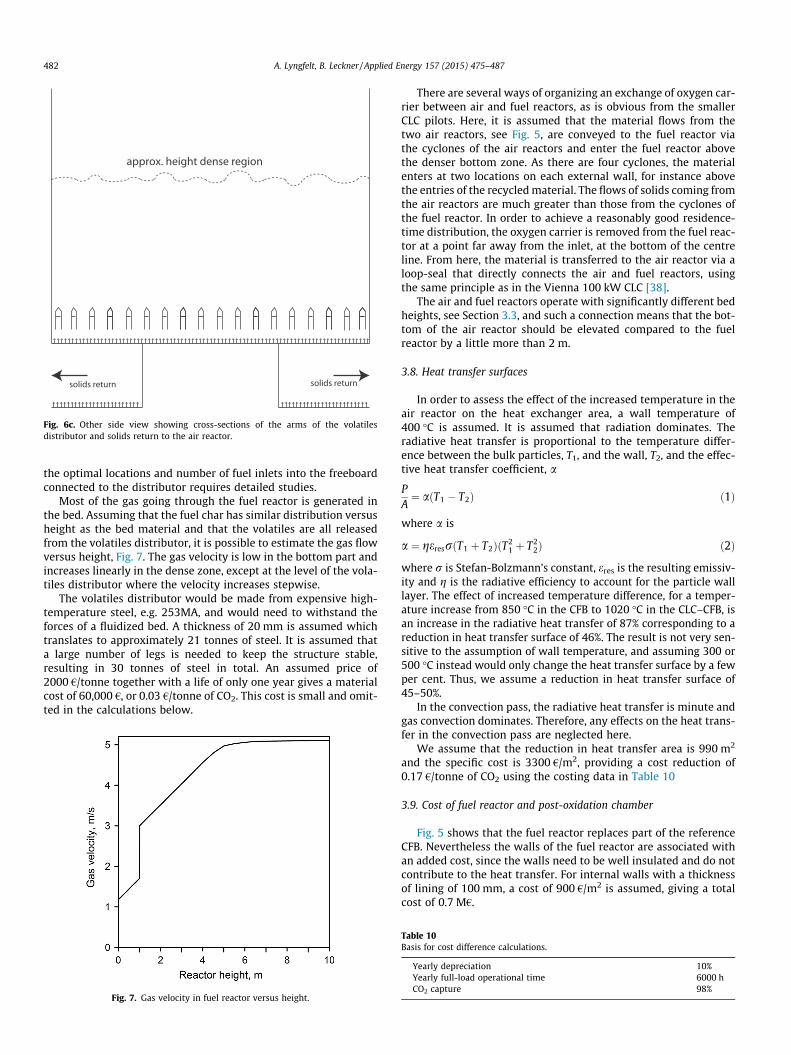
Most of the gas going through the fuel reactor is generated inthe bed. Assuming that the fuel char has similar distribution versusheight as the bed material and that the volatiles are all releasedfrom the volatiles distributor, it is possible to estimate the gas flowversus height, Fig. 7. The gas velocity is low in the bottom part andincreases linearly in the dense zone, except at the level of the vola-tiles distributor where the velocity increases stepwise.
The volatiles distributor would be made from expensive high-temperature steel, e.g. 253MA, and would need to withstand theforces of a fluidized bed. A thickness of 20 mm is assumed whichtranslates to approximately 21 tonnes of steel. It is assumed thata large number of legs is needed to keep the structure stable,resulting in 30 tonnes of steel in total. An assumed price of2000 €/tonne together with a life of only one year gives a materialcost of 60,000 €, or 0.03 €/tonne of CO2. This cost is small and omit-ted in the calculations below.
Fig. 7. Gas velocity in fuel reactor versus height.
There are several ways of organizing an exchange of oxygen car-rier between air and fuel reactors, as is obvious from the smallerCLC pilots. Here, it is assumed that the material flows from thetwo air reactors, see Fig. 5, are conveyed to the fuel reactor viathe cyclones of the air reactors and enter the fuel reactor abovethe denser bottom zone. As there are four cyclones, the materialenters at two locations on each external wall, for instance abovethe entries of the recycled material. The flows of solids coming fromthe air reactors are much greater than those from the cyclones ofthe fuel reactor. In order to achieve a reasonably good residence-time distribution, the oxygen carrier is removed from the fuel reac-tor at a point far away from the inlet, at the bottom of the centreline. From here, the material is transferred to the air reactor via aloop-seal that directly connects the air and fuel reactors, usingthe same principle as in the Vienna 100 kW CLC [38].
The air and fuel reactors operate with significantly different bedheights, see Section 3.3, and such a connection means that the bot-tom of the air reactor should be elevated compared to the fuelreactor by a little more than 2 m.
3.8. Heat transfer surfaces
In order to assess the effect of the increased temperature in theair reactor on the heat exchanger area, a wall temperature of400 �C is assumed. It is assumed that radiation dominates. Theradiative heat transfer is proportional to the temperature differ-ence between the bulk particles, T1, and the wall, T2, and the effec-tive heat transfer coefficient, a
PA¼ aðT1 � T2Þ ð1Þ
where a is
a ¼ geresrðT1 þ T2ÞðT21 þ T2
2Þ ð2Þ
where r is Stefan-Bolzmann’s constant, eres is the resulting emissiv-ity and g is the radiative efficiency to account for the particle walllayer. The effect of increased temperature difference, for a temper-ature increase from 850 �C in the CFB to 1020 �C in the CLC–CFB, isan increase in the radiative heat transfer of 87% corresponding to areduction in heat transfer surface of 46%. The result is not very sen-sitive to the assumption of wall temperature, and assuming 300 or500 �C instead would only change the heat transfer surface by a fewper cent. Thus, we assume a reduction in heat transfer surface of45–50%.
In the convection pass, the radiative heat transfer is minute andgas convection dominates. Therefore, any effects on the heat trans-fer in the convection pass are neglected here.
We assume that the reduction in heat transfer area is 990 m2
and the specific cost is 3300 €/m2, providing a cost reduction of0.17 €/tonne of CO2 using the costing data in Table 10
3.9. Cost of fuel reactor and post-oxidation chamber
Fig. 5 shows that the fuel reactor replaces part of the referenceCFB. Nevertheless the walls of the fuel reactor are associated withan added cost, since the walls need to be well insulated and do notcontribute to the heat transfer. For internal walls with a thicknessof lining of 100 mm, a cost of 900 €/m2 is assumed, giving a totalcost of 0.7 M€.
Table 10Basis for cost difference calculations.
Yearly depreciation 10%Yearly full-load operational time 6000 hCO2 capture 98%

A. Lyngfelt, B. Leckner / Applied Energy 157 (2015) 475–487 483
The oxygen for post-combustion, i.e. oxy-polishing, can beadded to the cyclone outlet pipe to take advantage of mixing thegas into the swirl. The gas then enters an adiabatic duct, assumedto have a volume of 200 m3 to be sufficient for complete combus-tion, corresponding to a residence time of 0.5 s. With a duct diam-eter of 4 m, the length of each of the two ducts from the twocyclones of the fuel reactor is 8 m. The wall area becomes250 m2. Assuming similar length of the ducts and a residence timeof one second, the diameter would increase to 5.6 m and the areawould increase by 130 m2.
The total external insulated area, including the external walls offuel reactor, ducts, cyclones, and post-oxidation chamber, becomes2447 m2. The cost of a 400 mm insulated wall is assumed to be1500 €/m2 giving a cost of 3.7 M€. The most uncertain cost is thatof the area of the post-oxidation chamber. A doubling of the resi-dence time in this chamber, however, increases the total surfaceby less than 10%.
The total added cost of insulation of the fuel reactor, ducts andpost-oxidation chamber, with the costing data of Table 10, is0.22 €/tonne of CO2.
In this cost, all walls/surfaces of the fuel reactor as well ascyclones, ducts and post-oxidation chambers are included.However, all of these surfaces are not added costs in reality, assome of these costs relate to cyclones and ducts already availablein the reference CFB. Thus, the number is conservative and impliessome overestimation.
In total, the change in boiler cost, including added insulatedwalls and reduced heat transfer surfaces, amounts to around0.05 €/tonne of CO2.
Another approach to assess costs related to the boiler is toassume relative cost changes. In this case, we make the alternateassumption that the modifications and adaptations of the boilerfor CLC give a significant overall cost increase that has not beencaptured by the estimations performed in this study, and thatthese costs correspond to a boiler cost increase of 15%.Furthermore, we assume that the investment cost of the referenceplant is 1200 €/kWe, and that the boiler island constitutes 25% ofthis cost. Using the costing data in Table 10, we find that theassumption of a 15% increase in boiler cost corresponds to a CO2
capture cost of 2.3 €/tonne of CO2.
4. Ash removal
The separation of ash and oxygen carrier in the mixed effluentsfrom the boiler is a key issue. In normal CFBs, an important part ofthe ash consists of larger particles leaving as bottom ash, althoughmost ash comes out as fly-ash. An important difference betweenthe two cases, however, is the size of the fuel used in CFBs, typi-cally 1–6 mm, while in the CLC–CFB case, the particle size needsto be much smaller. Assuming that pulverized fuel is used, the fuelparticles have a d50 of around 60 lm. Then the ash particles formedwill be even smaller, considerably smaller than the oxygen carrierparticles, and leave the process as fly-ash. Nevertheless, someregeneration of the bed material may be needed to avoid ashaccumulation.
Most fuel ash leaves the system from the fuel reactor. In partic-ular, a loss of oxygen-carrier material from the cyclones of both airand fuel reactors can be expected, not only fine particles from attri-tion, but also larger particles desirable for recovery and recycling.These particles are separated from the gas flow by filters togetherwith the ash particles. The larger gas flows from the air reactorcould be assumed to contain mainly oxygen-carrier particles thatcould be recycled. The gas flows from the fuel reactor, however,also contain fuel ash and char not burned in the post-oxidationchamber. Perhaps it would be worthwhile to separate these oxygen
carrier particles from the ash by magnetic separation to reduce theloss of oxygen carrier. Oxygen carrier materials like ilmenite, ironores and manganese ores could be expected to be sufficiently mag-netic for such separation.
It is possible that ash compounds interact with the oxygen car-rier causing slow aging. This is dependent on the ash characteris-tics and may have implications for the selection of fuel.
5. Additional costs
5.1. Fuel grinding
The CLC process uses a smaller fuel size than normal fluidized-bed combustion of coal. The coal size will be the result of an opti-mization based on the following factors:
� Larger fuel particles reduce the loss of char fines elutriated withthe exit gas and lower the oxygen needed for oxy-polishing.� Larger fuel particles reduce the power need for grinding.� Smaller fuel particles reduce the loss of char fines to the air
reactor, which improves the CO2 capture.� Smaller fuel particles result in smaller ash particles, which are
more easily elutriated giving more fly-ash and less bottomash. This fact facilitates the overall separation of ash and oxygencarrier, leading to a longer life for the oxygen carrier.
The milling of the fuel is assumed to consume 10 kWh/tonnefuel, or 1 MW, and thus reduces the efficiency by 0.1%, which cor-responds to a cost of around 0.1 €/tonne CO2. The added cost formilling equipment is uncertain but is assumed to be 0.1 €/tonneCO2, giving a total of 0.2 €/tonne CO2.
5.2. Loss of unconverted char
It is assumed that any char lost from the fuel reactor is burnedin the post-oxidation chamber. Lost char then adds to the oxygendemand.
5.3. Reduced flue gas loss
The lower air ratio for CLC is estimated to increase the overallefficiency by 0.5%, giving a negative cost of �0.5 €/tonne CO2.
6. Expected performance
6.1. Fuel conversion
The fuel conversion in the 100 kW unit is compromised by a sig-nificant loss of elutriated char leaving the system via the cyclone.However, the cyclone efficiency of the 100 kW unit is poor, proba-bly because of the significant pressure fluctuations caused by theslugging of the bed, and a full-scale cyclone operated under normalconditions could be assumed to have better separation.Furthermore, the large-scale fuel-reactor is approximately tentimes higher, which significantly increases the time for a char par-ticle to travel from the bottom to the top of the reactor. If we com-bine this with a significantly improved cyclone efficiency, theactual residence time of a char particle before it is lost from thecyclone, increases by orders of magnitude. Consequently, the lossof unconverted char is dramatically reduced in a full-scale unitas compared to the 100 kW pilot. Lastly, unconverted char mayburn in the post-oxidation chamber or be captured in filters andreturned to the fuel reactor. At this stage, it is difficult estimatethe fuel conversion in the full-scale plant, but it is assumed to be

Table 11Examples of CO2 capture costs related to oxygen carrier materials.
Ilmenite Manganese ore
SE, tonne/MWhth 0.334 0.334SI, tonne/MWth 0.75 0.75gCO2
98% 98%s, h 200 100COC, €/tonne oxygen carrier 175 225CCCOC, €/tonne CO2 2.0 5
484 A. Lyngfelt, B. Leckner / Applied Energy 157 (2015) 475–487
97% in the fuel reactor and 100% in total, i.e. all char lost burns inthe post-oxidation chamber.
An option might be to design the post-oxidation chamber as asecondary cyclone, both separating char particles and increasingtheir residence time, as well as contributing to gas mixing.
6.2. Gas conversion
The analytical model previously used for the 100 kW unit [34]yields a gas conversion of 93–94% for the 1000 MW CLC–CFBemploying the same data for ilmenite reactivity, composition ofvolatiles and factors describing the imperfect contact betweengas and solids. This is a significantly higher conversion than inthe 100 kW unit, where it is 84% at best. The improvement is partlycaused by the assumption of higher char conversion, gF = 97%, andby a slightly larger bed mass per MWth, but the most important dif-ference is the much lower dilution of the gas flow by the fluidizinggas. In the 100 kW unit, the gas is diluted with higher additionalgas flows for fluidization, as well as by the gas flows from the loopseals and the fuel feed system.
The results from the 100 kW unit were obtained with ilmeniteand bituminous coal; a significantly higher gas conversion isattained in operation with manganese ore or low-volatile fuels.
Furthermore, it is clear that the 100 kW unit operates in theslugging mode, which is a consequence of the scale: a small riserdiameter and a high bed inevitably lead to slug formation resultingin poor contact between gas and solids. In the model, the contactfactor for the volatile conversion used is 0.15, which means thatthe model assumes that only 15% of the solids are in contact withthe gas. Slugging would not occur in a full-scale unit, and, besides,the fluidization velocity would be much higher. Therefore, the gascontact is probably better and the gas conversion is furtherimproved.
6.3. Oxygen need
From the model results suggesting a gas conversion of 93–94%,we assume an oxygen demand for the gas of 7%; to this we add theneed for oxygen demand for char burn-up, yielding a total oxygendemand of 10%. This number is uncertain as there are many factorsthat may influence the oxygen need, but in view of the likelyimprovements from adding manganese ore, it is expected thatthe total oxygen demand should be in the range 5–15%.
6.4. CO2 capture
The 100 kW unit includes a carbon stripper and is able to reacha CO2 capture of 98%. The 1000 MWth unit does not have a similardedicated carbon stripper; Because the exit of the bed material atthe bottom of the bed is more than 5 m from the fuel feed location,the fuel reactor itself will work as a carbon stripper. The transportdistance will provide some time both for conversion and strippingof char particles, the latter separation mechanism caused by charfines moving upwards with the gas flow. Consequently, it isassumed that a similar CO2 capture, i.e. 98%, can be reached forthe 1000 MWth unit without an actual carbon stripper.
If further enhanced separation is needed, it is possible to extendthe connection between fuel and air reactors downwards. Thisoption would involve some minor additional costs for insulatedwalls and steam of higher pressure for the fluidization of this part.
7. Oxygen carrier cost
Because of the uncertainties in the lifetime of the oxygen carri-ers in actual operation, the selection and cost of the oxygen carrier
are very important. Clearly, low-cost natural minerals or wastematerials are advantageous. While the price of ores, metals andoxides vary from year to year, current prices are in the range200–250 €/ton for manganese ore, around 150–200 €/ton for ilme-nite and even lower for iron ore.
The cost of oxygen carrier adds to the CO2 capture cost. The costfor the oxygen carrier can be expressed as the cost per tonne of CO2
captured and is given by
CCCOC ¼COC � SI
SE � gCO2� s ð3Þ
where CCCOC is the Cost of CO2 Capture caused by the OxygenCarrier in €/tonne CO2 captured, COC is an estimated cost of oxygencarrier in €/tonne, SI is the solids inventory in ton/MWth, SE is thespecific emission of the fuel in tonne CO2/MWhth and s is the aver-age lifetime of the oxygen carrier. A pilot operation using ilmenitesuggested a life of 600–700 h [21] based on the production of fines.This lifetime estimation does not consider any interaction with ash,and a more realistic lifetime is probably 100–300 h. With ilmeniteand assuming a lifetime of 200 h, the cost is 2 €/tonne CO2,Table 11. Consequently, a lifetime of 100–300 h yields a cost rangeof 1.3–4 €/tonne CO2.
For manganese ore, a shorter lifetime based on present limitedexperiences is assumed, leading to a higher estimated cost formanganese ore of around 5 €/tonne CO2.
8. Compression and oxygen production
The compression of carbon dioxide involves costs for equip-ment and operation as well as a significant energy penalty ofaround 3%. The energy penalty is defined as the reduction in per-centage units of the overall efficiency of a power plant, for instancefrom 43% to 40%. Such a compression is needed for all CO2 captureprocesses, and the cost and energy penalty for compression is nor-mally estimated to be much lower than that of the actual capture,i.e. attaining a stream of CO2 ready for compression. A cost of10 €/tonne of CO2 is assumed for compression, including the costsof the energy penalty and gas treatment.
The boiler costs differ from that of a conventional boiler despitethe many similarities to the reference CFB case. While the air reac-tor is very similar to a CFB, the major difference is the added cost ofthe adiabatic fuel reactor and its post-oxidation chamber.However, an estimation of these added costs indicates that thechange in cost is minor, cf. Section 3.9.
In view of the many similarities to oxyfuel combustion, we canmake a comparison to this process. It is assumed that oxyfuel com-bustion has a total cost of 50 €/tonne of CO2, which involves CO2
compression, 10 €/tonne, and air separation, 40 €/tonne.Downstream treatment, e.g. SO2 and NOx removal and CO2 purifi-cation is included in the compression cost. The added costs forthe downstream treatment are assumed to be moderate becauseconventional SO2/NOx removal can be avoided and the removalof SO2/NOx in a much smaller gas stream and at a higher concen-tration can be expected to be less costly. Compression and air

A. Lyngfelt, B. Leckner / Applied Energy 157 (2015) 475–487 485
separation both have significant energy penalties, which meansthat these costs include larger power plant investment and operat-ing costs, such as fuel, per unit of electricity produced.
In the CLC–CFB case, it was estimated that the amount of oxy-gen needed for oxy-polishing is 5–15% of the total oxygen require-ment. The specific cost of air separation is higher because ofsmaller flows. Using the assumption above for oxyfuel but assum-ing that the air separation cost is proportional to the amount ofoxygen raised by a power of 0.8 to express the scale effect, a costof air separation of 4–9 €/tonne is obtained, i.e. a reduction by77–90% compared to oxyfuel.
Downstream treatment involves removal of SO2, NOx, argon,fuel-N2, excess oxygen and air from ingress. CLC–CFB differs fromthe oxyfuel case in some respects. Firstly, the argon to be separatedis an order of magnitude smaller, as much less oxygen is used forthe oxy-polishing. Secondly, the gas flow from an oxyfuel boiler,before CO2 recycling, is much larger than the flow from the fuelreactor. This might make it easier to avoid air ingress. Presently,it is not clear whether CLC–CFB yields more or less NOx as com-pared to oxy-fuel combustion. On the whole, however, it is likelythat the costs of CO2 purification are similar or somewhat loweras compared to oxy-fuel.
9. Total costs
The total estimated added costs and energy penalties for a CFB–CLC are provided in Table 12.
In summary, it is clear that the main costs are CO2 compressionincluding gas treatment and oxygen production for the oxy-polish-ing. Both of these costs are also being investigated in connectionwith other CO2 capture technologies, oxyfuel combustion in partic-ular. The focus in this study is on the costs directly related to chem-ical-looping, as it was not the purpose to investigate the costs ofcompression and oxygen production, and therefore they are onlyassumed. Nevertheless, these two costs are the main part of thetotal costs. The analysis is transparent and allows for correctionsof the costs presented and any numbers can be improved as moredetailed and accurate information becomes available.
The cost relations between oxygen carrier and oxy-polishing arehelpful in the selection of oxygen carrier materials, as they can beused to estimate whether a more reactive and more expensive oxy-gen carrier might result in lower costs.
10. Discussion
10.1. The high bed in the fuel reactor
The bed in the fuel reactor is much higher than what is normalpractice in CFB boilers. However, above a certain amount, the bedinventory in tall reactors is not decisive for the overall behaviour ofthe solids. With respect to solids inventory Hu et al. [39] haveshown that in tall risers, in their case 38 and 54 m, the particle flow
Table 12Estimated added costs for CFB–CLC.
Type of cost Estimation,€/tonne CO2
Range,€/tonne CO2
Efficiencypenalty, %
CO2 compression 10 10 3Oxy-polishing 6.5 4–9 0.5Boiler cost 1 0.1–2.3 –Oxygen carrier 2 1.3–4 –Steam and hot CO2 fluidization 0.8 0.8 0.8Coal grinding 0.2 0.2 0.1Lower air ratio �0.5 �0.5 �0.5
Total 20 15.9–25.8 3.9
saturates if the solids inventory is high enough, which is definitelyfulfilled in the present case and does not change with additionalinventory. Even though the local behaviour of the flow, particularlyin the lower part of the reactor, is affected by the solids inventory,the overall performance including the resulting solids flow is notaffected, provided that the bed is not starved. A criterion for a(non-slugging) reactor not to be starved is that a bottom bedremains, while the fluidization velocity is above the transportvelocity, which is the case in all risers concerned here. Of course,as has been pointed out above, circulation of solids is influencedby fluidization velocity and particle properties.
10.2. A clean air-reactor gas
There will be a small loss of char from the fuel reactor to the airreactor, which is converted to CO2 in the air reactor. Furthermore,nitrogen and sulphur present in this char form minute amounts ofSO2 and NO. Only a small amount of fuel ash is expected to reachthe air reactor. Consequently, the gas in the air reactor will be com-paratively clean, with concentrations of combustible productsbeing almost two orders of magnitude lower than in conventionalflue gas. This situation is in contrast to a CFB boiler having not onlymuch higher concentrations of CO2, H2O, SO2 and NOx compounds,but also local releases of volatiles containing reducing and reactivegaseous compounds like H2 and H2S. The absence of such com-pounds and the low concentration of water vapour could be anadvantage for the corrosion resistance of the heat exchangersurfaces.
10.3. Control of solids circulation
It is crucial that the plant is designed to make the needed circu-lation possible. But it is also necessary to have some option to con-trol the global circulation: a CLC power plant must not be builtwithout any option to control global circulation as this is a keyparameter for reaching the desired operating conditions. Too lowa circulation would lower the temperature of the fuel reactor andtoo high a circulation will compromise the desired residence timeof the solids in the fuel reactor, thus lowering carbon capture.Therefore, some options to control circulation are brieflymentioned:
� The main option in normal operation is to control the particlesize. As noted above, the circulation is sensitive to particle size.However, the control of particle size involves the streams ofsolids entering and exiting the system, and can be expected torespond slowly to corrective measures. Options for controllingthe circulation should also involve measures with more imme-diate response.� One way to rapidly increase circulation would be to raise the
gas velocity in the air reactor by the addition of recycled oxy-gen-depleted air in the form of secondary air.� Another possibility is to design the unit with some excess circu-
lation, but without sending the full flow to the fuel reactor. Thiscan be done by diverting a part of the circulation flow back tothe air reactor using controllable loop-seals with double exits[40].
10.4. Part load operation
The possibility to operate a power plant at partial load is impor-tant and expected to become even more important with increasingproduction of power from wind and solar energy. As this will inevi-tably become a key issue in the design of future power plants, itwill be briefly discussed here.

486 A. Lyngfelt, B. Leckner / Applied Energy 157 (2015) 475–487
In chemical-looping combustion it is impossible to significantlyreduce the gas velocity in the air reactor, because that would stopthe solids circulation. However, there are two ways to vary theload, either through a separate system for solids circulation, whichis independent of the air flow to the air reactor, or by partitioningof the air reactor.
In the design proposed, there are two air reactors, opening upthe possibility of switching between a load of 100% and 50%. Oneair reactor can be defluidized while the other is operated normally.The consequence for the fuel reactor is a lowered gas velocity and adoubled solids residence time. In general, longer gas and solids res-idence time is beneficial for the conversion of gas and char.However, the reduction in gas velocity would significantly reducethe solids circulation passing through the cyclone of the fuel reac-tor, which might lead to difficulties with the flow in the down-comer and loop seal, particularly if the fraction of char fines wereto become dominant.
One option would be to inject recycled ‘‘hot CO2’’ . Assuming a
temperature of 235 �C, and an addition large enough to give thesame velocity as at full load, the heat balance of the fuel reactorwould be significantly altered. This change in heat balance meansthat the global circulation needs to be increased by 53%, or that thetemperature difference between the air and fuel reactor increasesfrom 50 to 77 �C. The best alternative would probably be a combi-nation of (i) having lower velocity but adding sufficient hot CO2 togive adequate operation, (ii) some increase in the global circula-tion, (iii) accepting a somewhat lower fuel reactor temperature.With respect to (ii) there are some options for circulation controlas discussed in the previous section.
10.5. Risks in upscaling
The greatest barrier to the development of CLC–CFB technologyis that it does not make sense in the small or intermediate scale.Also, with the climate issue becoming more pressing, it is impor-tant to move quickly towards a larger scale, possibly by an inter-mediate step of 30–100 MWth. Consequently, the gradualincrease in boiler size typical of the development of CFB technologyover the past 30 years would need to be made in larger steps dur-ing the development of CLC–CFB technology, which evidentlyinvolves risks. However, the similarities and experiences of CFBtechnology is an advantage in the development of the CLC–CFBtechnology. Technology risks and possible mitigations are sum-marised below.
� Inadequate performance of the oxygen carrier. A number oflow-cost oxygen-carriers can be to used, including ilmenites,manganese ores and iron ores. For these materials, there is alarge market with many possible suppliers. Operation in smallerpilots indicates that these materials are sufficiently reactive.However, aging of materials might be an issue with the conse-quence of higher oxygen carrier costs.� Inadequate solids circulation. If operational measures like
reduced particle size are not sufficient or possible, it might benecessary to add dedicated circulation risers. These risers wouldbe adiabatic with cyclones leading the solids to the fuel reactor.They would be small in comparison to the fuel reactor and, con-sequently, the added cost should be moderate.� Difficulties with a high solids inventory in the fuel reactor. The
high bed proposed in this study is clearly beyond the presenttechnical experience. A worst-case scenario is that the forma-tion of large bubbles results in poor gas–solids contact and largepressure fluctuations that produce technical difficulties. A con-sequence might be that the solids inventory needs to bereduced, which would mean lower gas conversion and solidsresidence time, i.e. higher loss of char to air reactor. Lower gas
conversion means higher costs for oxygen production. A higherloss of char to air reactor can be addressed by the milling of fuelto finer sizes and by extending the height of the loop seal lead-ing material from the fuel reactor to the air reactor in order toincrease the residence time. A likely consequence of loweringthe solids inventory in the fuel reactor is that the floor of theair reactor has to be lowered as the bed levels of the reactorsare coupled via the lower loop seal.� Difficulties with the volatiles distributor. The material cost of
this device is low, so modifications should also be moderatein cost. However, this technology has not been tested and theworst-case scenario, although unlikely, is that it would beimpossible to make it work. Consequently, bottom bed feedingof fuel distributed over a number of inlets would be needed toavoid excessive local concentration of the volatiles.Nevertheless, not having a volatiles distributor would lowerthe contact between gas and solids, which lowers gas conver-sion, resulting in higher costs for oxygen production. A goodidea is to test the device first in a conventional boiler.� Elutriation of char. Elutriation of char higher than expected
would again increase the need for oxygen and may also leadto a loss of unburnt char if the conversion in the post-oxidationchamber is incomplete.� Local agglomeration of bed particles. The CLC reactors operate
at higher temperature than in the reference case, which couldlead to risks of agglomeration depending on the sinteringpropensity of the fuel ash. Possible actions include change offuel, higher exchange rate of bed material, change of oxygencarrier and lowered bed temperature. The bed temperature ofthe fuel reactor can be lowered by decreasing the circulation.Depending on the temperature decrease this will affect chargasification and to some extent the gas conversion. The conse-quence would be higher costs for oxygen production, and low-ering the very high rate of CO2 capture expected for thisprocess.� Mal-distribution over parallel cyclones. Studies of identical par-
allel cyclones indicate that mal-distribution over cyclonesappears with gas streams of high solids loading, whereas distri-bution becomes stable with more dilute streams, [41]. Evenwith the higher loading needed for increased circulation, it islikely that the system is below the level where significantmal-distributions appear. The risk of mal-distribution can beavoided by splitting the air reactors in two by a wall. Thus therewould be one air reactor for each air reactor cyclone. Such asolution could also be of interest to raise the options for partload operation.
The major risks identified involve modifications of moderatecost and/or reduced performance. There seems to be no ‘‘killers’’,and the only consequences would be somewhat increased costsfor a technology expected to have uniquely low costs in compar-ison to other CO2 capture technologies.
11. Conclusions
The design of a CLC–CFB plant is discussed with focus on the dif-ferences compared to CFB technology and what these differencesmean with respect to costs. In addition to CO2 compression, whichis inevitable and common to all CO2 capture technologies, impor-tant costs include air separation for oxy-polishing, oxygen carrierand fluidization of the fuel reactor. The cost for air separation couldbe low if gas conversion were high, and the cost of the oxygen car-rier could be low if the life were high. The total CO2 cost for captureis estimated to be 20 €/tonne CO2 avoided and within the range of16–26 €/tonne.

A. Lyngfelt, B. Leckner / Applied Energy 157 (2015) 475–487 487
The cost analysis is based on tangible differences between CLC–CFB and CFB technologies, which makes the analysis transparent.Should new and better information become available the analysiscan be easily updated, consequently providing a platform for fur-ther techno-economic analysis of this process.
Acknowledgements
The research leading to these results received funding from theEuropean Research Council under the Seventh FrameworkProgramme ERC Grant Agreement n� 291235 of the EuropeanUnion.
References
[1] Lyngfelt A, Leckner B, Mattisson T. A fluidized-bed combustion process withinherent CO2 separation; application of chemical-looping combustion. ChemEng Sci 2001;56(10):3101–13.
[2] Lyngfelt A. Oxygen carriers for chemical-looping combustion – 4000 h ofoperational experience. Oil Gas Sci Technol – Revue d’IFP Energies nouvelles2011;66(2):161–72.
[3] Adánez J, Abad A, García-Labiano F, Gayán P, de Diego L. Progress in chemical-looping combustion and reforming technologies. Progress Energy Combust Sci2012;38(2):215–82.
[4] Lyngfelt A. Chemical-looping combustion of solid fuels – status ofdevelopment. Appl Energy 2014;113:1869–73.
[5] Lyngfelt A. Chemical looping combustion. In: Scala F, editor. Fluidized-bedtechnologies for near-zero emission combustion and gasification. WoodheadPublishing Limited; 2013. p. 895–930.
[6] Lewis W, Gilliland E, Sweeney M. Gasification of carbon. Chemical EngineeringProgress 1951;47(5):251–6.
[7] Dennis JS, Scott SA, Hayhurst AN. In situ gasification of coal using steam withchemical looping: a technique for isolating CO2 from burning a solid fuel. JEnergy Instit 2006;79(3):187–90.
[8] Cao Y, Casenas B, Pan WP. Investigation of chemical looping combustion bysolid fuels. 2. Redox reaction kinetics and product characterization with coal,biomass, and solid waste as solid fuels and CuO as an oxygen carrier. EnergyFuels 2006;20(5):1845–54.
[9] Leion H, Mattisson T, Lyngfelt A. The use of petroleum coke as fuel in chemical-looping combustion. Fuel 2007;86(12–13):1947–58.
[10] Leion H, Mattisson T, Lyngfelt A. Solid fuels in chemical-looping combustion.Int J Greenhouse Gas Control 2008;2(2):180–93.
[11] Berguerand N, Lyngfelt A. Design and operation of a 10 kWth chemical-loopingcombustor for solid fuels – testing with South African coal. Fuel2008;87(12):2713–26.
[12] Berguerand N, Lyngfelt A. The use of petroleum coke as fuel in a 10 kWth
chemical-looping combustor. Int J Greenhouse Gas Control 2008;2(2):169–79.[13] Shen L, Wu J, Xiao J. Experiments on chemical looping combustion of coal with
a NiO based oxygen carrier. Combust Flame 2009;156(3):721–8.[14] Cuadrat A, Abad A, García-Labiano F, Gayán P, de Diego LF, Adánez J. The use of
ilmenite as oxygen-carrier in a 500 Wth chemical-looping coal combustionunit. Int J Greenhouse Gas Control 2011;5(6):1630–42.
[15] Wu J, Shen L, Hao J, Gu H. Chemical looping combustion of coal in a 1 kWth
reactor. In: 1st International conference on chemical looping. Lyon; 2010.[16] Linderholm C, Lyngfelt A, Cuadrat A, Jerndal E. Chemical-looping combustion
of solid fuels – operation in 10 kW unit with two fuels, above-bed and in-bedfuel feed and two oxygen carriers, manganese ore and ilmenite. Fuel2012;102:808–22.
[17] Sozinho T, Pelletant W, Gauthier T, Stainton H. Main results of the 10 kW coalpilot plant operation. In: 2nd Int. conf. on chemical looping. Darmstadt; 2012.
[18] Thon A, Kramp M, Hartge EU, Heinrich S, Werther J. Operational experiencewith a system of coupled fluidized beds for chemical looping combustion ofsolid fuels using ilmenite as oxygen carrier. Appl Energy 2014;118:309–17.
[19] Tong A, Bayham S, Kathe M, Zeng L, Luo S, Fan L-S. Iron-based syngas chemicallooping process and coal-direct chemical looping process development at Ohio
State University. In: 2nd International conference on chemical looping.Darmstadt; 2012.
[20] Markström P, Linderholm C, Lyngfelt A. Chemical-looping combustion of solidfuels – design and operation of a 100 kW unit with bituminous coal. Int JGreenhouse Gas Control 2013;15:150–62.
[21] Linderholm C, Knutsson P, Schmitz M, Markström P, Lyngfelt A. Materialbalances of carbon, sulfur, nitrogen and ilmenite in a 100 kW CLC reactorsystem. Int J Greenhouse Gas Control 2014;27:188–202.
[22] Bayham S, Kim H, Wang D, Tong A, Zeng L, McGiveron O, et al. Iron-based coaldirect chemical looping combustion process: 200-h continuous operation of a25-kWth subpilot unit. Energy Fuels 2013;27:1347–56.
[23] Abdulally I, Beal C, Andrus H, Epple B, Lyngfelt A, White B. Alstom’s chemicallooping technology, program update. In: 11th Annual conference on carboncapture utilization & sequestration. Pittsburgh (Pennsylvania); 2014.
[24] Ströhle J, Orth M, Epple B. Chemical looping combustion of hard coal in a1 MWth Pilot Plant Using Ilmenite as Oxygen Carrier, Applied Energy, 2015,submitted for publication.
[25] Pérez-Vega R, Abad A, Gayán P, de Diego LF, García-Labiano F, Adánez J. Designand operation of a 50 kWth chemical looping combustion (CLC) pilot plant withsolid fuel, Applied Energy, 2015, submitted for publication.
[26] Lyngfelt A, Mattisson T. Oxygen carriers for chemical-looping combustion. In:Fennell P, Anthony EJ, editors. Calcium and chemical looping technology forpower generation and carbon dioxide (CO2) capture. Woodhead Publishing;2014. Chapter 11.
[27] Linderholm C, Adánez J, Béal C, Epple B, Penthor S, Larring Y, Lyngfelt A.Chemical-looping coal combustion – results from the ACCLAIM project. In: 3rdInternational conference on chemical looping. Gothenburg; 2014.
[28] Ekström C, Schwendig F, Biede O, Franco F, Haupt G, de Koeijer G, et al. Techno-economic evaluations and benchmarking of pre-combustion CO2 capture andoxy-fuel processes developed in the European ENCAP project. Energy Procedia2009;1:4233–40.
[29] Rose JW, Cooper JR. Technical data on fuel, 7th edition. Edinburgh: The BritishNational Committee, World Energy Conference; 1977.
[30] Yue G, Lu J, Zhang H, Yang H, Zhang J, Liu Q, Jaud P. Design theory of circulatingfluized bed boilers. In: 18th International conference on fluidized bedcombustion. Toronto (Canada); 2005.
[31] Wu H, Zhang M, Sun Y, Lu Q, Na Y. Research on the heat transfer model ofplaten heating surface of 300 MW circulating fluidized bed boilers. PowderTechnol 2012;226:83–90.
[32] Johnsson F, Leckner B. Vertical distribution of solids in a CFB-furnace. In: 13thInt. conf. fluid. bed comb. Orlando; 1995, p. 671–9.
[33] Johansson E, Lyngfelt A, Mattisson T, Johnsson F. A circulating fluidized bedcombustor system with inherent CO2 separation – application of chemicallooping combustion. In: 7th Int. conf. on circulating fluidized beds. NiagaraFalls (Ontario); 2002.
[34] Markström P, Linderholm C, Lyngfelt A. Analytical model of gas conversion in a100 kW chemical-looping combustor for solid fuels – comparison withoperational results. Chem Eng Sci 2013;96:131–41.
[35] Abad A, Adánez J, Cuadrat A, García-Labiano F, Gayán P, de Diego LF. Kinetics ofredox reactions of ilmenite for chemical-looping combustion. Chem Eng Sci2011;66(4):689–702.
[36] Hallberg P, Leion H, Lyngfelt A. A method for determination of reactionenthalpy of oxygen carriers for chemical looping combustion – application toilmenite. Thermochim Acta 2011;524:62–7.
[37] Lyngfelt A, Pallarés D, Linderholm C, Rydén M, Mattisson T. Fördelare av gaser ifluidiserad bädd (‘‘Distributor of volatile gasis in the bottom part of a fluidizedbed’’), Swedish patent application No. 1400085-5. 2014.
[38] Kolbitsch P, Bolhàr-Nordenkampf J, Pröll T, Hofbauer H. Operating experiencewith chemical looping combustion in a 120 kW dual circulating fluidized bed(DCFB) unit. Int J Greenhouse Gas Control 2010;4(2):180–5.
[39] Hu N, Yang HR, Zhang H, Zhang RQ, Cao JN, Liu Q, Yue GX. Experimental studyon gas-solid flow characteristics in a CFB riser of 54 m in height. In: 20th Int.Conf. on FBC. Xian (China); 2010.
[40] Basu P, Chandel M, Butler J, Dutta A. An investigation into the operation of thetwin-exit loop-seal of a circulating fluidized bed boiler in a thermal powerplant and its design implication. J Energy Resour Technol 2009;131(4).041401/1-8.
[41] Masnadi M, Grace JR, Elyasi S, Bi X. Distribution of multi-phase gas–solid flowacross identical parallel cyclones: modeling and experimental study. SeparatPurificat Technol 2010;72(1):48–55.