9mfy2017 performance review - icici bank · savings ape 46.68 50.31 7.8% 34.16 42.84 25.4%...
TRANSCRIPT
9MFY2017 performance review
January 24, 2017

Opportunity
Industry overview
Agenda
Company strategy and performance
2

Opportunity
Industry overview
Agenda
Company strategy and performance
3

Strategy: Market leadership + Profitable growth
Leverage market opportunity for saving products through
Delivery of superior customer value through better products,
customer service, fund performance and claims management
Focus on key local markets through customized regional strategy
Multi prong product/ channel approach to tap protection opportunity- Retail
through online and offline mode, Mortgage linked and Group term
Segmented
approach to tap
market
opportunity-
Savings &
Protection
Expand our protection business
Improve customer retention
Maintain market-leading cost efficiency
Focus on
increasing
value of new
business
Focus on deepening existing bancassurance relationships and seeking
alliances with new banks
Focus on increasing scale of our agency distribution channel
Using data analytics capability to grow direct to customers
Establish relationship with new non bank partners with focus on quality
Strengthen
multi channel
architecture
and explore
non-traditional
channels
Leverage
technology for
profitable
growth
Digitalizing sales and service processes
Increasing digital marketing and sales
4

New business
5
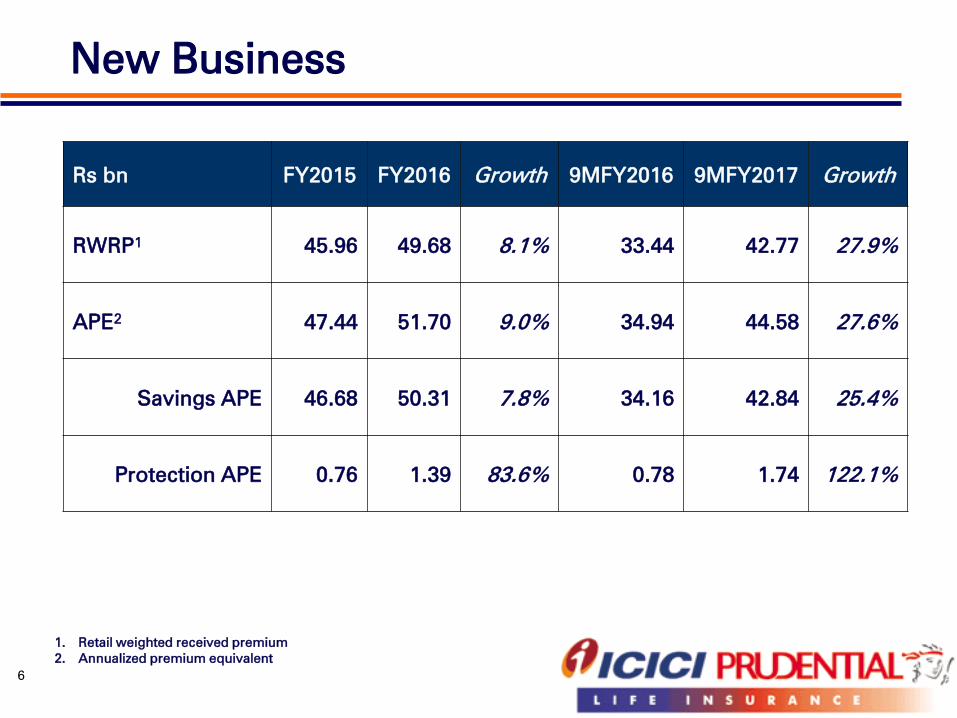
New Business
6
Rs bn FY2015 FY2016 Growth 9MFY2016 9MFY2017 Growth
RWRP1
45.96 49.68 8.1% 33.44 42.77 27.9%
APE2
47.44 51.70 9.0% 34.94 44.58 27.6%
Savings APE 46.68 50.31 7.8% 34.16 42.84 25.4%
Protection APE 0.76 1.39 83.6% 0.78 1.74 122.1%
1. Retail weighted received premium
2. Annualized premium equivalent

Premium summary
Components may not add up to the totals due to rounding off 7
81.00
95.71
119.95
34.32
48.21
53.57
8.97
9.14
18.13
124.29
153.07
191.64
0
50
100
150
200
FY2014 FY2015 FY2016
Rs b
n
Retail renewal premium Retail new business premium Group premium
77.42
92.69
35.66
47.41 14.70
7.64 127.79
147.75
0
50
100
150
200
9MFY2016 9MFY2017
Rs b
n

Market share1
1. Retail weighted received premium (RWRP) basis
Source: IRDAI, Life insurance council
7.2%
11.3% 11.3%
18.9%
23.0%21.9%
0%
5%
10%
15%
20%
25%
30%
FY2014 FY2015 FY2016
8
12.1%13.0%
23.5%24.5%
0%
5%
10%
15%
20%
25%
30%
9MFY2016 9MFY2017
Within total industry Within private sector

Consistent leadership in private sector1
Market Share FY2012 FY2013 FY2014 FY2015 FY2016 9MFY2017
LIC 63.5% 62.0% 62.0% 51.0% 48.5% 47.0%
ICICI Prudential 5.9% 7.0% 7.2% 11.3% 11.3% 13.0%
SBI Life 4.4% 5.1% 6.2% 7.7% 9.7% 11.3%
HDFC Life 5.7% 6.7% 5.2% 7.3% 7.6% 6.2%
Max Life 3.1% 3.2% 3.9% 4.8% 4.8% 4.8%
PNB Met Life 1.0% 1.2% 1.3% 1.7% 2.1% 1.9%
Bajaj Allianz 2.7% 2.6% 2.2% 1.9% 1.6% 1.9%
9
1. Retail weighted received premium (RWRP) basis
Source: IRDAI, Life insurance council
Market leaders in private market since FY2002
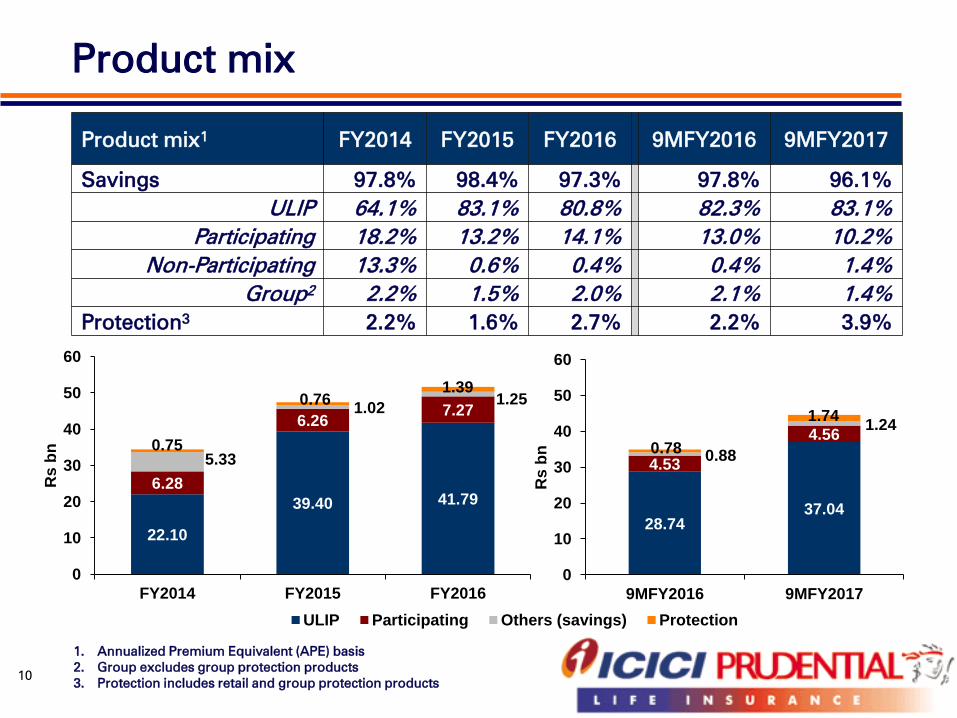
Product mix
1. Annualized Premium Equivalent (APE) basis
2. Group excludes group protection products
3. Protection includes retail and group protection products10
Product mix1
FY2014 FY2015 FY2016 9MFY2016 9MFY2017
Savings 97.8% 98.4% 97.3% 97.8% 96.1%
ULIP 64.1% 83.1% 80.8% 82.3% 83.1%
Participating 18.2% 13.2% 14.1% 13.0% 10.2%
Non-Participating 13.3% 0.6% 0.4% 0.4% 1.4%
Group2 2.2% 1.5% 2.0% 2.1% 1.4%
Protection3
2.2% 1.6% 2.7% 2.2% 3.9%
22.10
39.40 41.796.28
6.267.27
5.33
1.021.25
0.75
0.761.39
0
10
20
30
40
50
60
FY2014 FY2015 FY2016
Rs b
n
ULIP Participating Others (savings) Protection
28.7437.04
4.53
4.56
0.88
1.24
0.78
1.74
0
10
20
30
40
50
60
9MFY2016 9MFY2017
Rs b
n

New business sum assured
11
506.09
666.67
979.40
422.57
528.68
566.85
928.65
1,195.35
1,546.25
0
500
1,000
1,500
2,000
2,500
FY2014 FY2015 FY2016
Rs b
n
Retail Group
587.71
1082.18
440.56
971.99
1,028.27
2,054.17
0
500
1,000
1,500
2,000
2,500
9MFY2016 9MFY2017
Rs b
n

Channel mix
1. Annualized Premium Equivalent (APE) basis
Graphs are on Retail APE basis
Channel Mix1
FY2014 FY2015 FY2016 9MFY2016 9MFY2017
Bancassurance 53.2% 58.4% 57.3% 60.3% 57.7%
Agency 28.2% 24.4% 23.8% 21.6% 23.0%
Direct 6.3% 8.6% 9.8% 9.2% 11.9%
Corporate agents and brokers 9.9% 7.0% 7.0% 6.7% 5.6%
Group 2.5% 1.6% 2.1% 2.2% 1.9%
12
18.33
27.7029.64
9.71
11.5812.31
2.16
4.06
5.04
3.39
3.32
3.61
0
10
20
30
40
50
60
FY2014 FY2015 FY2016
Rs b
n
Bancassurance Agency Direct Corporate Agent and Broker
21.07
25.70
7.54
10.243.20
5.30
2.36
2.51
0
10
20
30
40
50
60
9MFY2016 9MFY2017
Rs b
n

Quality parameters
13

Persistency1
Month FY2014 FY2015 FY2016 9MFY2016 8MFY2017
13th
month 71.5% 79.0% 82.4% 80.9% 83.4%
25th
month 68.4% 65.9% 71.2% 69.2% 72.9%
37th
month 57.3% 64.3% 61.6% 62.3% 64.3%
49th
month 20.3% 54.4% 62.2% 71.6%2
60.6%2
61st
month 12.7% 14.5% 46.0% 28.2% 65.1%
1. As per IRDA circular dated January 23, 2014
2. Excluding Single premium 49th
month persistency for 8MFY2017 is 59.4%
as compared to 58.7% for 9MFY201614

Cost efficiency
1. Expense ratio: All insurance expenses (excl. commission) / (Total premium – 90% of single premium)
2. Commission ratio: Commission / (Total premium –
90% of single premium)
3. Cost / (Total premium – 90% of single premium)
4. Cost / Average assets under management during the period
FY2014 FY2015 FY2016 9MFY2016 9MFY2017
Expense ratio (excl. commission)1
13.6% 11.6% 11.0% 12.5% 12.2%
Commission ratio2
5.2% 3.8% 3.5% 3.5% 3.7%
Cost/TWRP3
18.8% 15.4% 14.5% 16.0% 15.9%
Cost / Average AUM4
2.9% 2.5% 2.5% 2.4% 2.7%
15
16.31 16.9719.25
6.27 5.53
6.20
22.59 22.50
25.45
0
10
20
30
FY2014 FY2015 FY2016
Rs b
n
Non-Commission Commission
14.36
16.81
4.03
5.0818.39
21.90
0
10
20
30
9MFY2016 9MFY2017
Rs b
n

Maximiser
(Equity Fund)
Balancer
(Balanced fund)
Protector
(Debt fund)
Preserver
(Liquid fund)
Superior fund performance across cycles*
* As on December 31, 2016
16
94.9% of debt investments in AAA rated and government bonds
7.5%
8.5%
12.9%
9.7% 10.1%
11.1%
4.2%
12.8%
7.6%
8.6%
14.6%
11.4%
10.0%
12.5%
4.2%
15.9%
1Y 5Y 1Y 5Y 1Y 5Y 1Y 5Y
Benchmark Fund

17
Assets under management
Amongst the largest fund managers in India
Linked Mix (%)
72.474.8 74.6 46.347.4 48.0
Rs bn Rs bn
Components may not add up to the totals due to rounding off
71.7 44.6
423.71
520.97 558.35
382.26
480.86 481.04
0
200
400
600
800
1,000
1,200
FY2014 FY2015 FY2016
Debt Equity
1,001.83
1,039.39
47.0
805.97
603.10
747.78
752.96
202.86
254.06 286.44
0
200
400
600
800
1,000
1,200
FY2014 FY2015 FY2016
Linked Non-Linked
805.97
1,001.83
1,039.39
73.3
Equity Mix (%)
17
745.18
815.12
272.13
320.99
1,017.31
1,136.11
9MFY2016 9MFY2017
538.84
629.26
478.47
506.86
1,017.31
1,136.11
9MFY2016 9MFY2017

Profitability
18

Value of New Business1
1. Indian Embedded Value basis on actual cost
2. Based on management forecast of cost for FY2017
3. As per IRDA circular dated January 23, 2014
Rs bn FY2015 FY2016 9MFY2017
APE 47.44 51.70 44.58
Savings APE 46.68 50.31 42.84
Protection APE 0.76 1.39 1.74
Value of New Business (VNB) 2.701
4.121
4.212
VNB Margin 5.7%1
8.0%1
9.4%2
Indian Embedded Value 138.22 139.39 -
Growth in Protection APE of 122.1%
Improvement in 13th month persistency3
from 80.9% in 9MFY2016 to
83.4% in 8MFY2017
Cost/TWRP ratio of 15.9% in 9MFY2017 compared to 16.0% in
9MFY2016
19

Profit After Tax
20
Sustained and strong profitability
Well positioned to capitalize on growth opportunity
15.6716.34 16.50
0
3
6
9
12
15
18
FY2014 FY2015 FY2016
Rs b
n
372
Solvency
Ratio (%)
Profit after tax (Rs bn)
337 320 320 294
12.47 12.74
0
3
6
9
12
15
18
9MFY2016 9MFY2017
Rs b
n

Summary
1. Sum assured as a % of GDP
2. IRDAI Retail Weighted Received Premium (RWRP)
3. Return on equity: Profit as a factor of average net worth
Low penetration1 vs mature economies and even lower density
One of the fastest growing large economy in the world with strong growth drivers
India: High growth
potential1
#1 in India on RWRP2
basis for every year since FY2002
Significant market share gain on RWRP basis since FY2012
Consistent
Leadership Across
Cycles
2
Customer focused product suite; Delivering superior value through product design and
fund performance
Low grievance ratio and best in class claims settlement ratio
Customer Centric
Approach Across
Value Chain3
Access to network of ICICI bank (#1 Indian private bank ) and Standard Chartered Bank
Continue to invest in agency channel, adding quality agents and improving productivity
Strong focus on technology and digitization to reduce dependence on physical presence
Multi Channel
Distribution backed
by advanced digital
processes
4
Very low regulatory or interest rate risk with over 80% of APE contribution from ULIP
products; Over 90% of debt investments in AAA rated and government bonds
Strong focus on renewals (high persistency ratios)
Robust &
Sustainable
Business Model
RoE3
of more than 30% from FY2012 to FY2016; Self funded business – no capital calls
since FY 2009; cumulative dividend pay-out of Rs 45.83 bn
With strong solvency of 294% and less capital requirement due to product mix, well
positioned to take advantage of growth
Delivering
Consistent Returns
to Shareholders5
6
21
Opportunity
Industry overview
Agenda
Company strategy and performance
22

Large and Growing Population Base1
Driving GDP Growth 3
High Share of Working Population2
Rising Affluence1
Indian economy
poised to head
towards sustained
growth fuelled by
favourable
demographics,
rising affluence
Growth rate of
total premium
written by the
insurance industry
has outpaced the
GDP growth rate
over the period of
FY2002-FY2016
1. Source: Economist Intelligence Unit, CRISIL Research
2. Source: UN population division 2015 release
3. Source: World bank database
Favourable demography to drive macro growth
GDP per Capita
CAGR (2007-2017)
50 54127 143
208258
322
13111376
S K
orea
S A
fric
a
Jap
an
Ru
ssia
Brazil
In
do
ne
sia
US
A
In
dia
Ch
ina
2015 Population (mn)
0.6% 0.7%1.2% 1.3%
2.2%
6.2%
7.4%
11.9%
Ru
ssia
Jap
an
Brazil
So
uth
K
orea
US
A
In
dia
In
do
ne
sia
Ch
ina
23
585
739
2015 2030
Population of age 25-60 years (in mn)
4.9%
9.8%
8.5%
6.6%
5.1%
6.9%7.2%
7.6%
7.0%
7.6%7.8%
1.9%
4.3%
-1.7%
3.1%
2.4%2.4%2.7%2.7%
2.3%2.7%2.9%
FY02FY08FY10FY12FY13FY14FY15FY16FY17FY18FY20
India World

Share of Insurance in Savings Expected to RiseShare of insurance in household savings
1. Source: CSO, RBI
*Company estimate
14.4%
26.2%
21.1%17.0%
15.4%19.6%
18.3%
FY2002 FY2010 FY2012 FY2013 FY2014 FY2015 FY2016
Distribution of financial assets1
Provident / Pension Fund / Claims on Govt
Shares / Debentures / MFS
Life Insurance Fund
Currency & Deposits
24
2.98
8.56
14.23 15.00 14.98 14.19 15.34*2.47
7.75
6.43 7.34 8.63 9.61
10.65
45%48%
31%33%
37%
40%41%
0%
20%
40%
60%
0
20
40
60
FY2002 FY2010 FY2012 FY2013 FY2014 FY2015 FY 2016
Rs tn
Financial savings
Physical savings
Financial savings as a % of Household Savings
Household Savings1
Part of physical savings shifting to financial savings
Insurance share of financial saving 18.3% compared to peak of
26.2% in FY2010
Improved product proposition of life insurance savings products

270%260%
226%
166%
149%
106%96%
60%
0%
100%
200%
300%
400%
US
Jap
an
Sin
gap
ore
Ko
rea
Mala
ysia
Ge
rm
an
y
Th
ailan
d
Ind
ia
Sum assured as % of GDP1
Protection opportunity
1. Source: McKinsey analysis 2015 and internal estimate
2. Protection coverage gap: Ratio of protection lacking/protection needed
3. Swiss Re, Economic Research and Consulting 2015
25
Sum assured as % of GDP low compared to other countries
Protection gap for India US $ 8.56 trillion
8.56
6.58
5.30
1.090.79 0.77
0.52 0.40
0
2
4
6
8
10
In
dia
Jap
an
S. K
ore
a
Au
stralia
In
do
nesia
Th
ailan
d
Mala
ysia
Sin
gap
ore
US
D t
n
Protection Gap3
92 56 85 33 73 78 73 56
Protection coverage gap2,3 (%)
Opportunity
Industry overview
Agenda
Company strategy and performance
26
Total premium (Rs bn)
Penetration (as a % to
GDP)
New business premium1
(Rs bn)
FY2016
441
3,669
FY2002
116
501
2.1%
21.5%
23.2%
Source: IRDAI, CSO, Life insurance council
* Company estimate
Evolution of life insurance industry in India
Assets under
management (Rs bn)
25,2942,304 24.0%
1. Retail weighted premium
2. Individual and Group in-force sum assured
FY2010
550
2,655
12,899
-3.6%
5.5%
11.9%
2.8%
In-force sum assured2
(Rs bn)
11,812* 37,505 90,75215.5% 15.9%
2.1% 4.1% 2.7%
In-force sum assured (as
% to GDP)
50.1% 57.9% 66.8%
Life insurance industry predominantly savings oriented
27
1. Retail weighted new business premium
Source : IRDAI, Life insurance council
Growth FY2013 FY2014 FY2015 FY2016 9MFY2017
Private 1.9% -3.4% 15.9% 13.6% 22.7%
LIC -4.1% -3.4% -26.3% 2.9% 16.6%
Industry -1.9% -3.4% -10.3% 8.1% 19.8%
New business1
28
38.0%38.0%
49.0% 51.5%
53.0%
0%
10%
20%
30%
40%
50%
60%
0
100
200
300
400
FY2013 FY2014 FY2015 FY2016 9MFY2017
Rs b
n
LIC Private Private market share

Channel mix1
1. Individual new business premium basis
Source: IRDAI, Public disclosures
Given a well developed banking sector, bancassurance has
become largest channel for private players
Industry Private players
29
78%71% 68% 71%
16%21% 24% 21%
6% 8% 8% 8%
FY2014 FY2015 FY2016 H1FY2017
Agency Bancassurance Others
40%36%
32% 32%
44%47% 52% 50%
16% 17% 16% 18%
FY2014 FY2015 FY2016 H1FY2017

Product mix1
1. New business premium basis
Source: IRDAI, Life insurance council
Strong value proposition of ULIPs
Transparent and low charges
Lower discontinuance charges upto year 5 and zero surrender penalty
after 5 years
Choice of asset allocation to match risk appetite of different customer
Industry Private players
30
93% 88% 87% 89%
7% 12% 13% 11%
FY2014 FY2015 FY2016 Q1FY2017
Traditional ULIP
71%62%
57% 59%
29%38%
43% 41%
FY2014 FY2015 FY2016 Q1FY2017
Safe harbor
Except for the historical information contained herein, statements in this release
which contain words or phrases such as 'will', 'would', ‘indicating’, ‘expected to’
etc., and similar expressions or variations of such expressions may constitute
'forward-looking statements'. These forward-looking statements involve a number
of risks, uncertainties and other factors that could cause actual results to differ
materially from those suggested by the forward-looking statements. These risks
and uncertainties include, but are not limited to our ability to successfully
implement our strategy, our growth and expansion in business, the impact of any
acquisitions, technological implementation and changes, the actual growth in
demand for insurance products and services, investment income, cash flow
projections, our exposure to market risks, policies and actions of regulatory
authorities; impact of competition; experience with regard to mortality and
morbidity trends, lapse rates and policy renewal rates; the impact of changes in
capital , solvency or accounting standards , tax and other legislations and
regulations in the jurisdictions as well as other risks detailed in the reports filed by
ICICI Bank Limited, our holding company, with the United States Securities and
Exchange Commission. ICICI Prudential Life Insurance undertakes no obligation to
update forward-looking statements to reflect events or circumstances after the date
thereof.
31

Thank you
32