9m2017 interim results fubon financial holdings interim results ... financial numbers in this report...
TRANSCRIPT

2017.11.29
9M2017 Interim Results
Fubon Financial Holdings
2
Disclaimer
This meeting may contain forward-looking statements with respect to the financial
condition, results of operations and business of the company. These forward-looking
statements represent the company’s expectations or beliefs concerning future events
and involve known and unknown risks and uncertainty that could cause actual
results, performance or events to differ materially from those expressed. Certain
statements, such as those that include the words “potential”, “estimated”, and similar
expressions or variations on such expressions may be considered “forward-looking
statements”. Financial numbers in this report may include preliminary unaudited
numbers or management accounts.
3
Performance review by subsidiary
• Fubon Life
• Fubon Securities
Performance highlights of Fubon Financial Holdings
• Fubon Insurance
Agenda
• Taipei Fubon Bank
• Fubon Bank (China)
• Fubon Bank (China)
4
Fubon Financial Holdings: Operation highlights
Taipei Fubon Bank
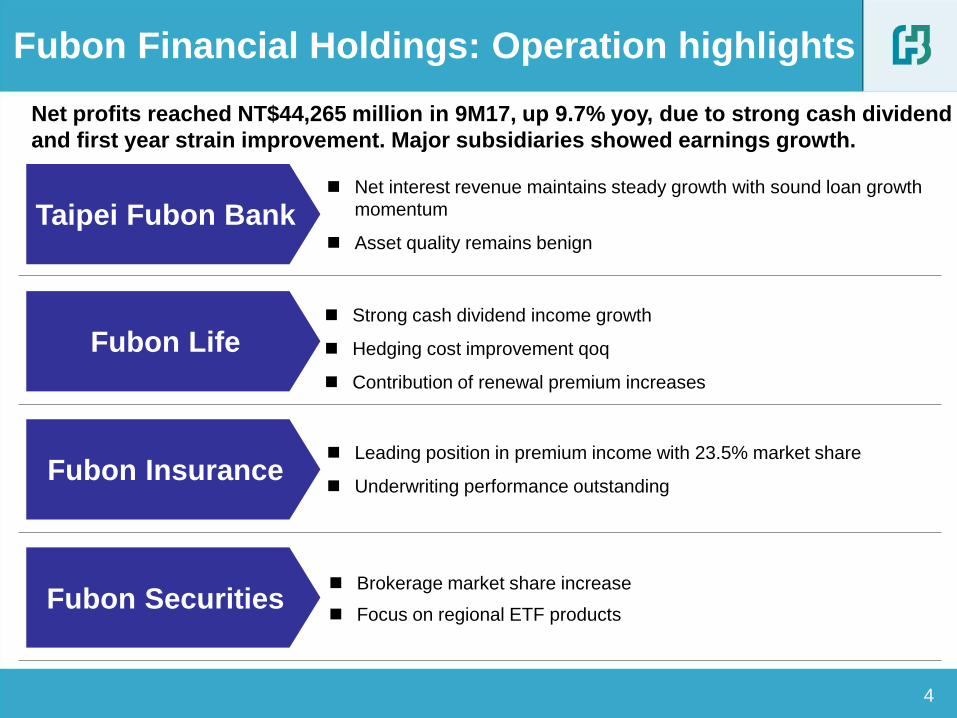
Brokerage market share increase
Focus on regional ETF products
Fubon Life
Fubon Insurance
Fubon Securities
Net profits reached NT$44,265 million in 9M17, up 9.7% yoy, due to strong cash dividend
and first year strain improvement. Major subsidiaries showed earnings growth.
Strong cash dividend income growth
Hedging cost improvement qoq
Contribution of renewal premium increases
Net interest revenue maintains steady growth with sound loan growth
momentum
Asset quality remains benign
Leading position in premium income with 23.5% market share
Underwriting performance outstanding
5
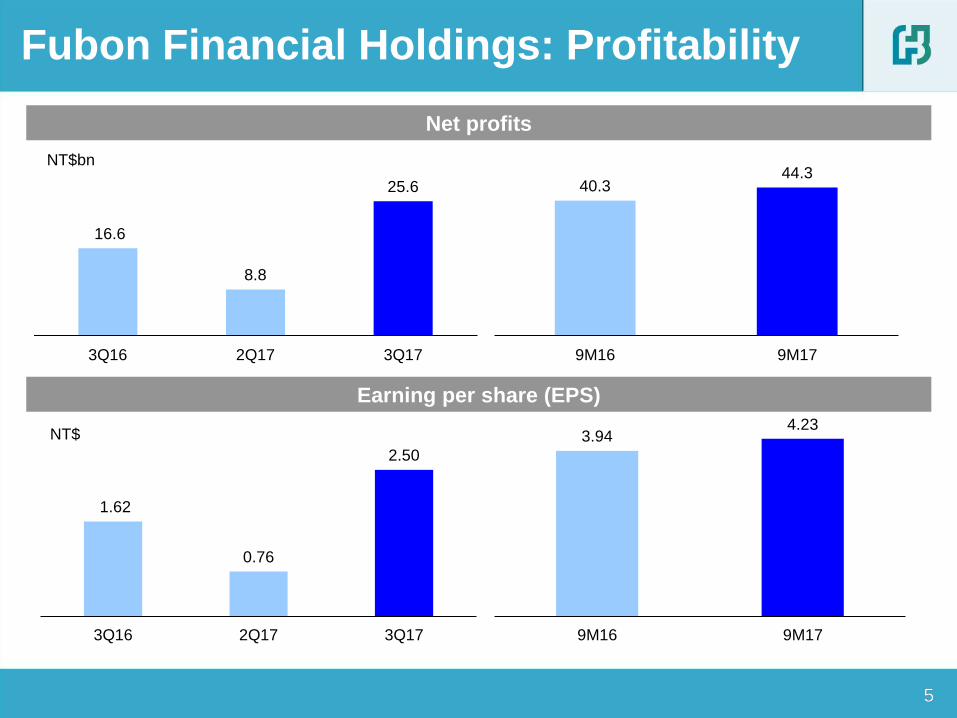
Net profits
Earning per share (EPS)
NT$
NT$bn
5
Fubon Financial Holdings: Profitability
16.6
8.8
25.6
3Q16 2Q17 3Q17
40.3 44.3
9M16 9M17
1.62
0.76
2.50
3Q16 2Q17 3Q17
3.94 4.23
9M16 9M17

6
Fubon Financial Holdings: Net profits from major subsidiaries
Net profits from major subsidiaries Profit contribution from major subsidiaries
NT$bn NT$bn
Note: Profit contribution are based on the summation of six major
subsidiaries
40.3
23.5
12.1
2.5 1.6 1.9 1.1
44.3
27.3
13.5
2.9 1.7 1.9 0.4
FubonFHC
FubonLife
TaipeiFubonBank
FubonP&C
FubonSecurities
FubonBank (HK)
FubonBank
(China)
9M16 9M17
Taipei Fubon Bank, 13.5 ,
28.3%
Fubon Life, 27.3 , 57.1%
Fubon P&C, 2.9 , 6.1%
Fubon Securities, 1.7 , 3.6%
Fubon Bank (HK), 1.9 ,
4.1% Fubon Bank (China), 0.4 ,
0.8%
Note: Net profits of Fubon Bank(China) is not included in net profits of
Taipei Fubon Bank
7 7
Total assets
Equity attributable to parent company
NT$bn
NT$bn
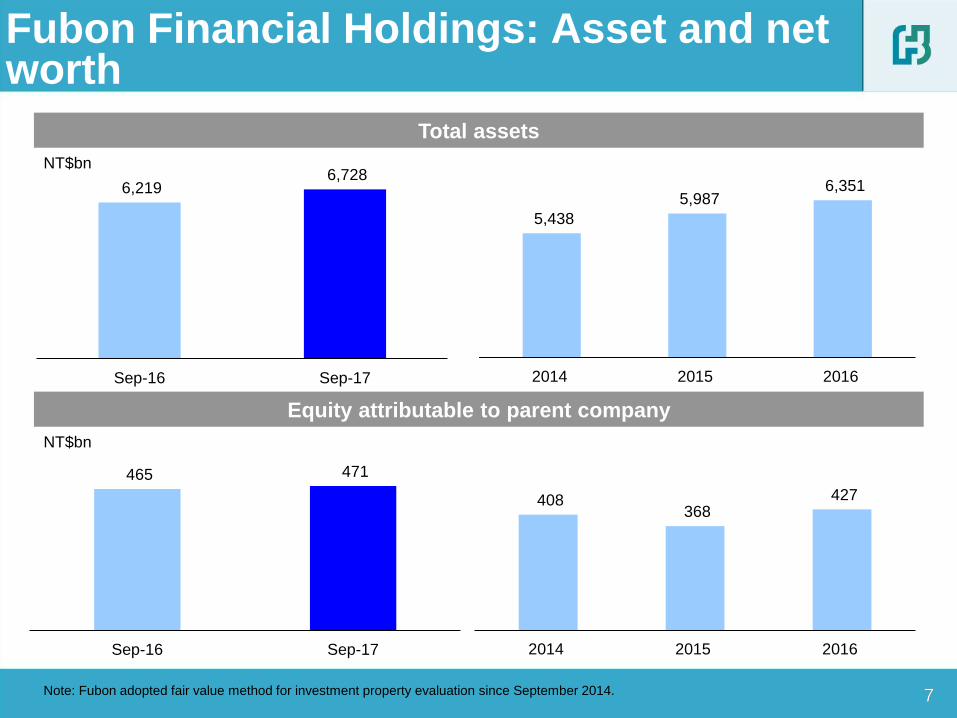
Fubon Financial Holdings: Asset and net worth
Note: Fubon adopted fair value method for investment property evaluation since September 2014.
5,438
5,987 6,351
2014 2015 2016
408 368
427
2014 2015 2016
6,219 6,728
Sep-16 Sep-17
465 471
Sep-16 Sep-17
8
ROA
ROE
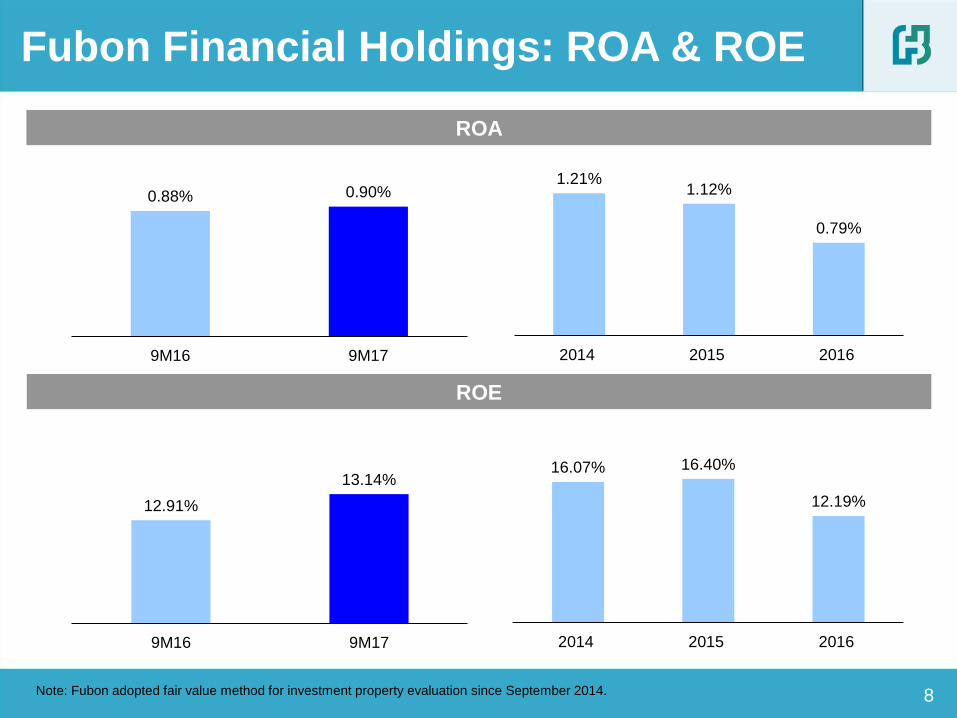
Fubon Financial Holdings: ROA & ROE
Note: Fubon adopted fair value method for investment property evaluation since September 2014.
1.21% 1.12%
0.79%
2014 2015 2016
0.88% 0.90%
9M16 9M17
16.07% 16.40%
12.19%
2014 2015 2016
12.91%
13.14%
9M16 9M17
9
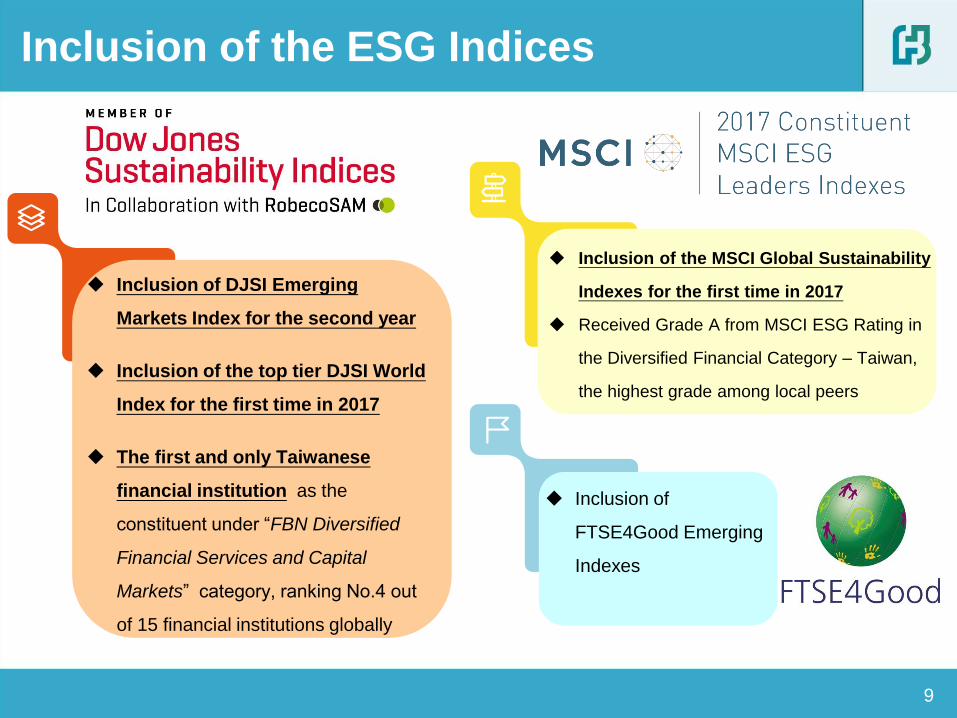
Inclusion of the ESG Indices
Inclusion of the MSCI Global Sustainability
Indexes for the first time in 2017
Received Grade A from MSCI ESG Rating in
the Diversified Financial Category – Taiwan,
the highest grade among local peers
Inclusion of DJSI Emerging
Markets Index for the second year
Inclusion of the top tier DJSI World
Index for the first time in 2017
The first and only Taiwanese
financial institution as the
constituent under “FBN Diversified
Financial Services and Capital
Markets” category, ranking No.4 out
of 15 financial institutions globally
Inclusion of
FTSE4Good Emerging
Indexes
10
Performance review by subsidiary
• Fubon Life
• Fubon Securities
Performance highlights of Fubon Financial Holdings
• Fubon Insurance
Agenda
• Taipei Fubon Bank
• Fubon Bank (China)
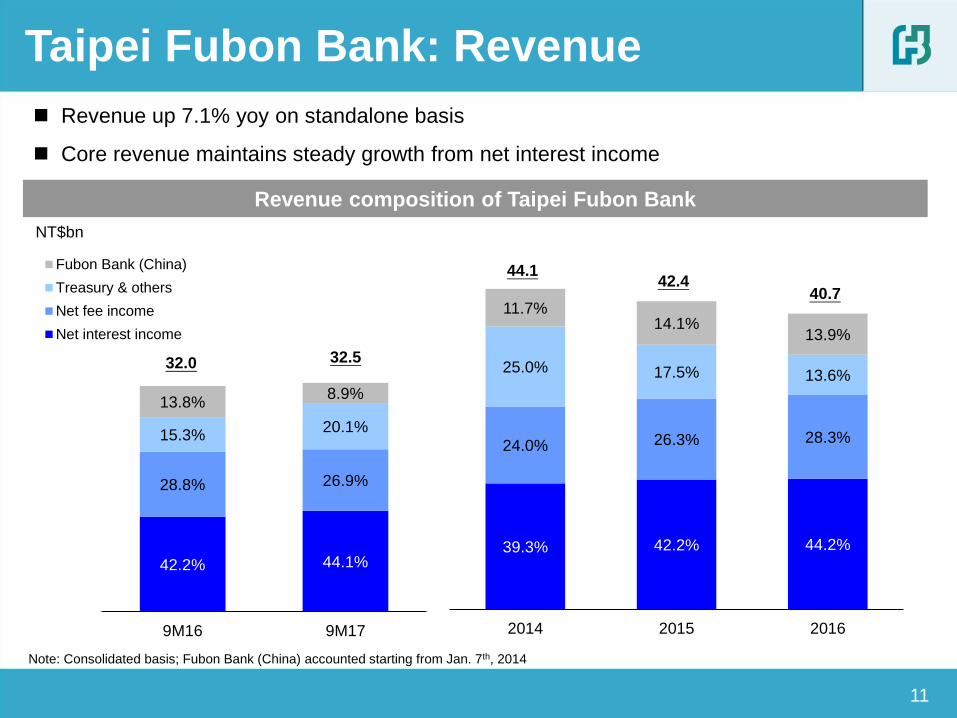
42.2% 44.1%
28.8% 26.9%
15.3% 20.1%
13.8% 8.9%
9M16 9M17
Fubon Bank (China)
Treasury & others
Net fee income
Net interest income
39.3% 42.2% 44.2%
24.0% 26.3% 28.3%
25.0% 17.5% 13.6%
11.7% 14.1%
13.9%
2014 2015 2016
11
Taipei Fubon Bank: Revenue
Revenue composition of Taipei Fubon Bank
NT$bn
Revenue up 7.1% yoy on standalone basis
Core revenue maintains steady growth from net interest income
44.1
Note: Consolidated basis; Fubon Bank (China) accounted starting from Jan. 7th, 2014
42.4 40.7
32.0 32.5
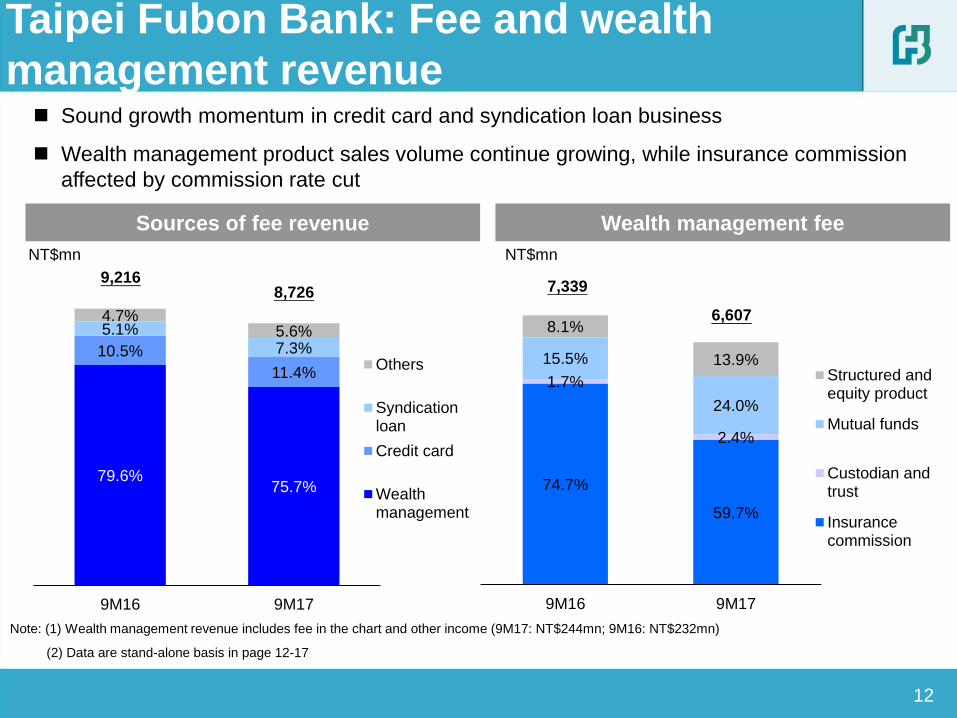
74.7%
59.7%
1.7%
2.4%
15.5%
24.0%
8.1%
13.9%
9M16 9M17
Structured andequity product
Mutual funds
Custodian andtrust
Insurancecommission
12
Taipei Fubon Bank: Fee and wealth
management revenue
Sources of fee revenue Wealth management fee
NT$mn NT$mn
Note: (1) Wealth management revenue includes fee in the chart and other income (9M17: NT$244mn; 9M16: NT$232mn)
(2) Data are stand-alone basis in page 12-17
9,216 7,339
Sound growth momentum in credit card and syndication loan business
Wealth management product sales volume continue growing, while insurance commission
affected by commission rate cut
8,726
6,607
79.6% 75.7%
10.5%
11.4%
5.1%
7.3%
4.7% 5.6%
9M16 9M17
Others
Syndicationloan
Credit card
Wealthmanagement

5.6% 4.0% 4.2%
48.3% 47.4% 46.1%
41.6% 43.9% 44.9%
4.0% 4.3% 4.4% 0.6% 0.5% 0.5%
3Q16 2Q17 3Q17
Credit cardrevolving
Other consumerloans
Mortgage loan
Corporate loan
Government loan
Loans by type
13
Taipei Fubon Bank: Loan composition
NT$bn
Mortgages and consumer loans growth outperformed industry
Note: Ending balance
1,156.8 1,131.6 1,151.0 QoQ 0.5% YoY 2.2%
QoQ -2.1% YoY -12.0%
QoQ 2.1% YoY 11.4%
QoQ 2.8% YoY 10.3%
QoQ -2.2% YoY -2.4%
QoQ 6.1% YoY -22.8%
14
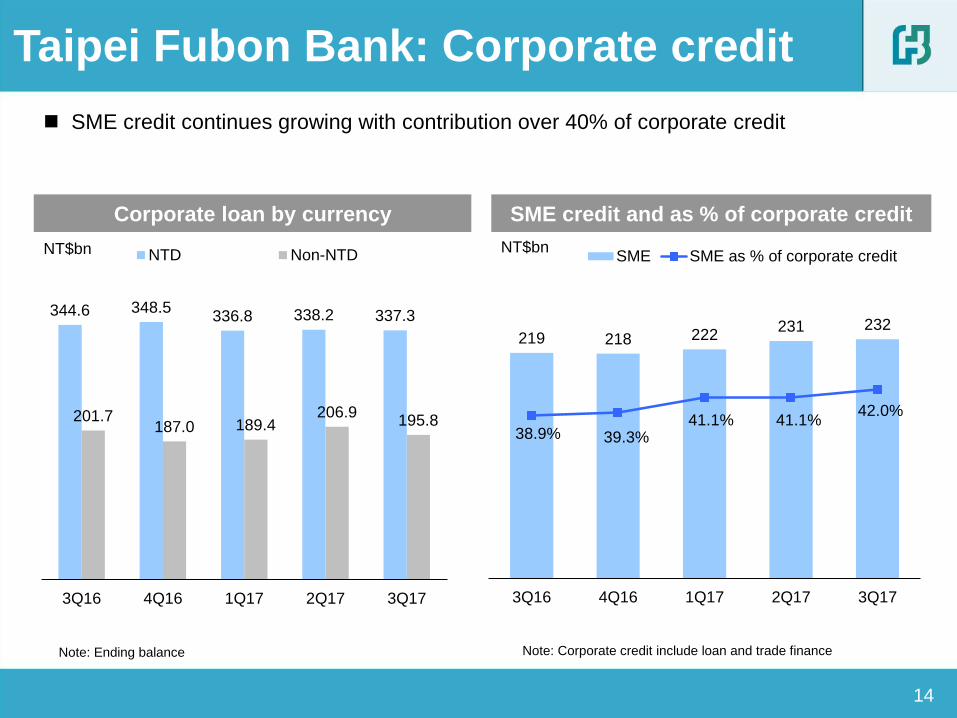
Taipei Fubon Bank: Corporate credit
Corporate loan by currency SME credit and as % of corporate credit
NT$bn
SME credit continues growing with contribution over 40% of corporate credit
NT$bn
Note: Corporate credit include loan and trade finance Note: Ending balance
344.6 348.5 336.8 338.2 337.3
201.7 187.0 189.4
206.9 195.8
3Q16 4Q16 1Q17 2Q17 3Q17
NTD Non-NTD
219 218 222 231 232
38.9% 39.3% 41.1% 41.1%
42.0%
3Q16 4Q16 1Q17 2Q17 3Q17
SME SME as % of corporate credit
15
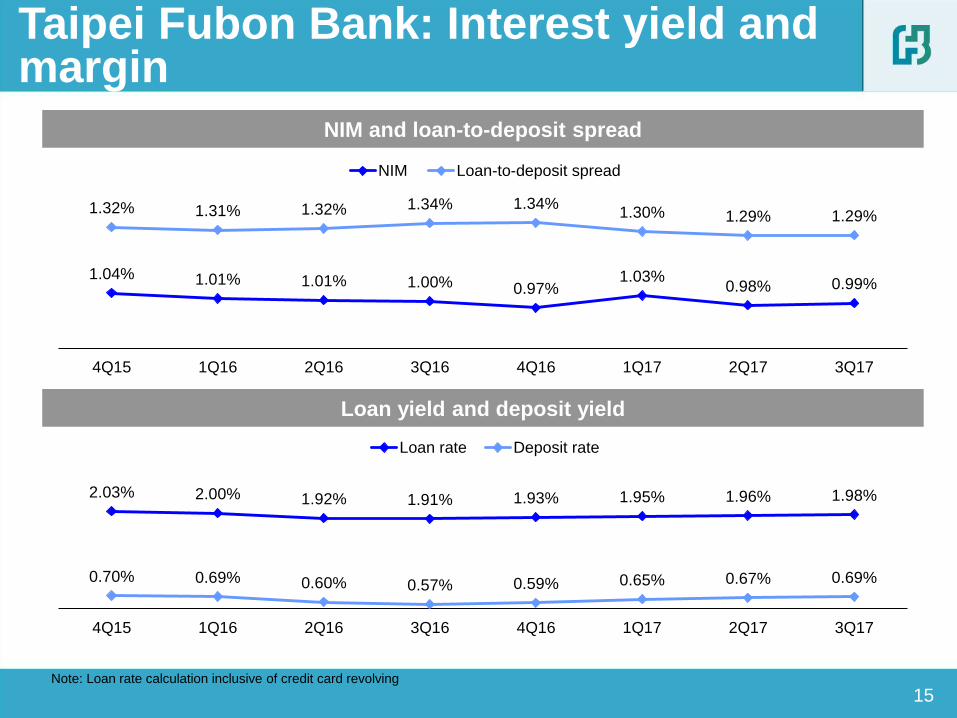
Taipei Fubon Bank: Interest yield and margin
NIM and loan-to-deposit spread
Loan yield and deposit yield
Note: Loan rate calculation inclusive of credit card revolving
2.03% 2.00% 1.92% 1.91% 1.93% 1.95% 1.96% 1.98%
0.70% 0.69% 0.60% 0.57% 0.59% 0.65% 0.67% 0.69%
4Q15 1Q16 2Q16 3Q16 4Q16 1Q17 2Q17 3Q17
Loan rate Deposit rate
1.04% 1.01% 1.01% 1.00% 0.97% 1.03%
0.98% 0.99%
1.32% 1.31% 1.32% 1.34% 1.34% 1.30% 1.29% 1.29%
4Q15 1Q16 2Q16 3Q16 4Q16 1Q17 2Q17 3Q17
NIM Loan-to-deposit spread
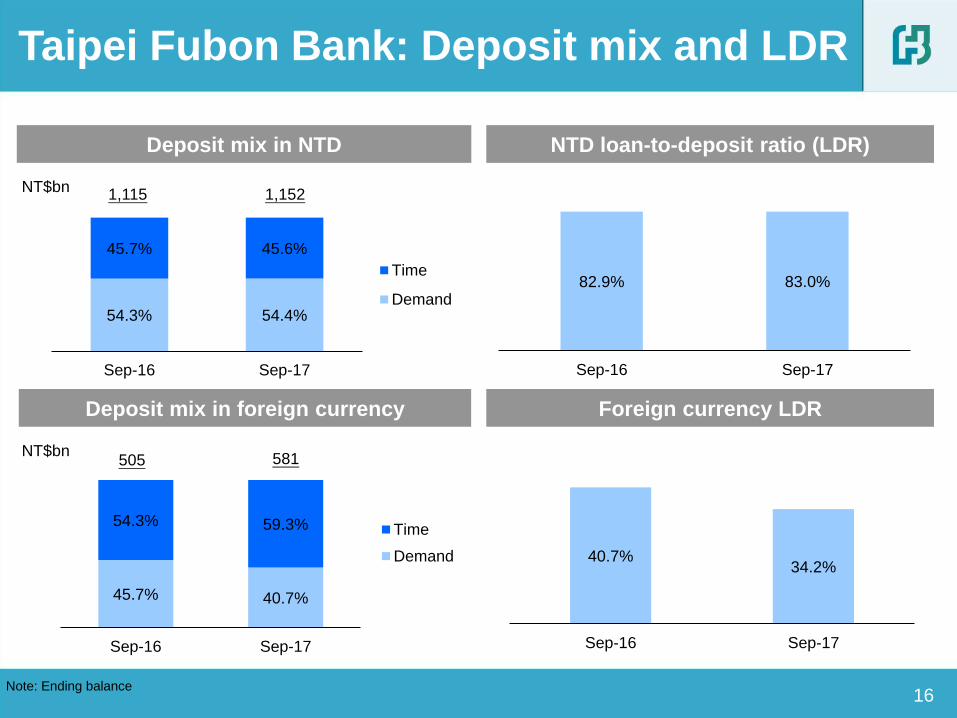
45.7% 40.7%
54.3% 59.3%
Sep-16 Sep-17
Time
Demand
54.3% 54.4%
45.7% 45.6%
Sep-16 Sep-17
Time
Demand
16
Taipei Fubon Bank: Deposit mix and LDR
NTD loan-to-deposit ratio (LDR) Deposit mix in NTD
Deposit mix in foreign currency
NT$bn
NT$bn
Foreign currency LDR
1,115 1,152
505 581
Note: Ending balance
82.9% 83.0%
Sep-16 Sep-17
40.7% 34.2%
Sep-16 Sep-17
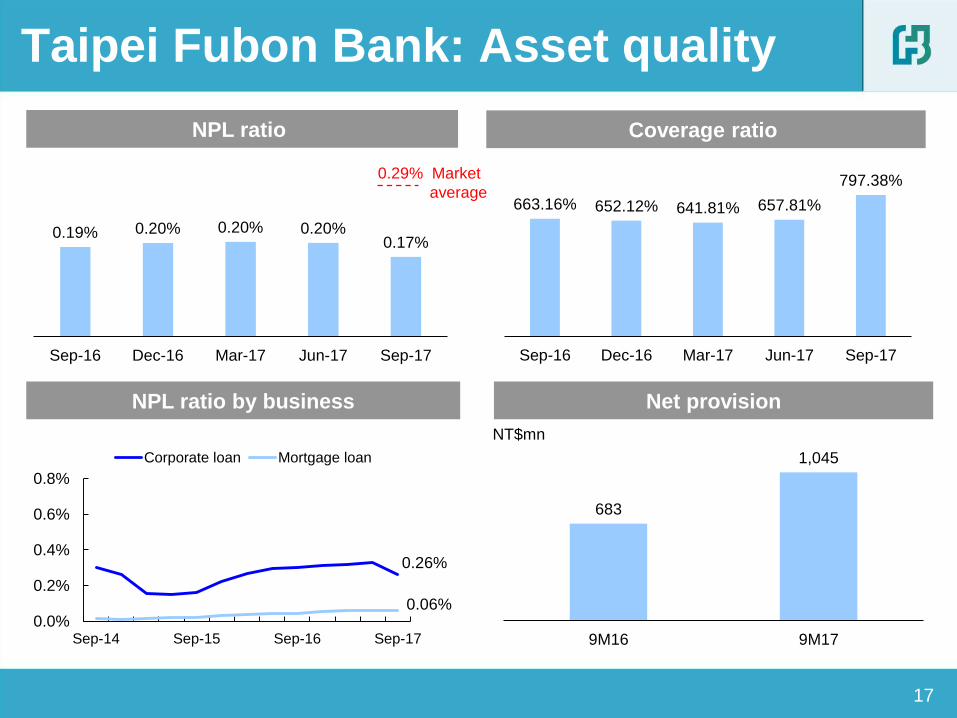
0.19% 0.20% 0.20% 0.20% 0.17%
Sep-16 Dec-16 Mar-17 Jun-17 Sep-17
17
Taipei Fubon Bank: Asset quality
NPL ratio
NPL ratio by business Net provision
Coverage ratio
NT$mn
0.29% Market
average
0.26%
0.06% 0.0%
0.2%
0.4%
0.6%
0.8%
Sep-14 Sep-15 Sep-16 Sep-17
Corporate loan Mortgage loan
683
1,045
9M16 9M17
663.16% 652.12% 641.81% 657.81%
797.38%
Sep-16 Dec-16 Mar-17 Jun-17 Sep-17
18
Performance review by subsidiary
• Fubon Life
• Fubon Securities
Performance highlights of Fubon Financial Holdings
• Fubon Insurance
Agenda
• Taipei Fubon Bank
• Fubon Bank (China)
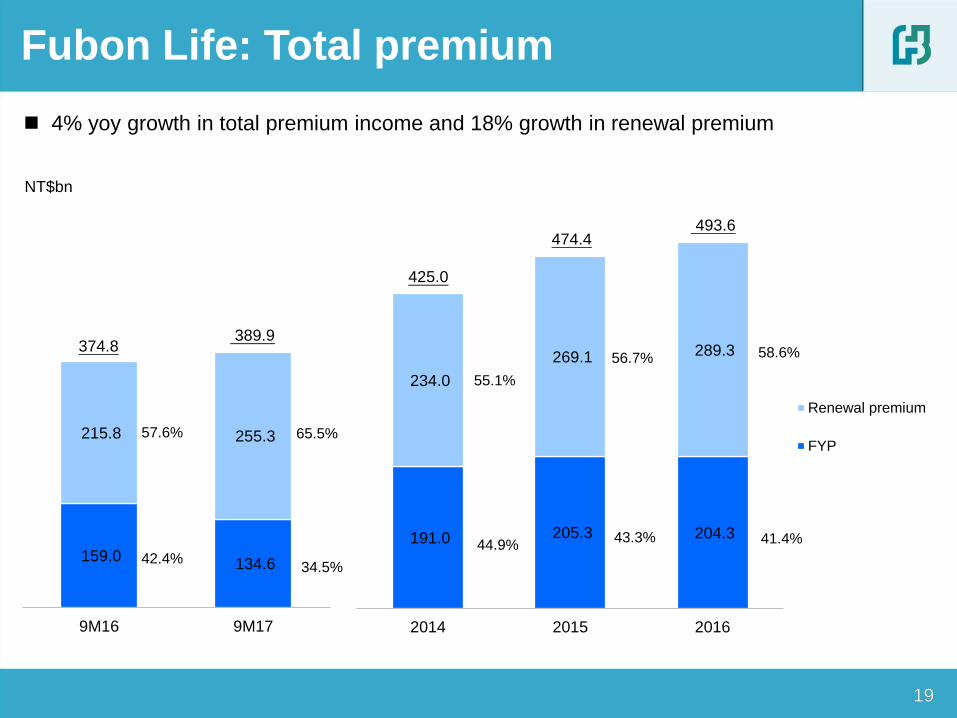
191.0 205.3 204.3
234.0
269.1 289.3
2014 2015 2016
Renewal premium
FYP
4% yoy growth in total premium income and 18% growth in renewal premium
19 19
NT$bn
Fubon Life: Total premium
425.0
474.4 493.6
58.6%
41.4%
56.7%
43.3%
55.1%
44.9% 159.0
134.6
215.8 255.3
9M16 9M17
374.8 389.9
65.5%
34.5%
57.6%
42.4%
FYP composition
20
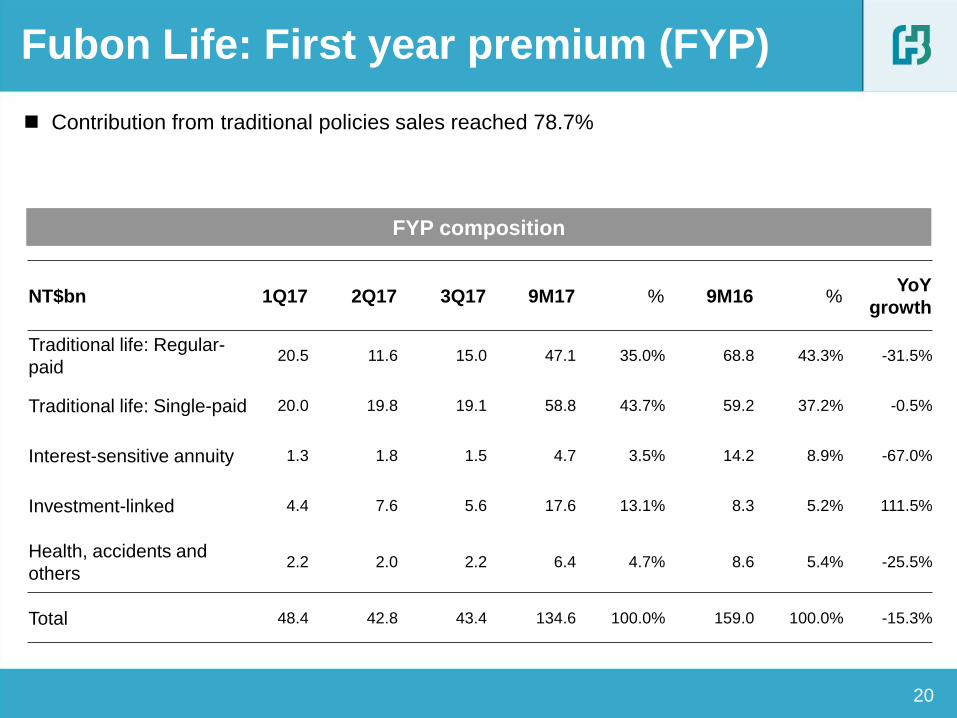
Fubon Life: First year premium (FYP)
Contribution from traditional policies sales reached 78.7%
NT$bn 1Q17 2Q17 3Q17 9M17 % 9M16 % YoY
growth
Traditional life: Regular-
paid 20.5 11.6 15.0 47.1 35.0% 68.8 43.3% -31.5%
Traditional life: Single-paid 20.0 19.8 19.1 58.8 43.7% 59.2 37.2% -0.5%
Interest-sensitive annuity 1.3 1.8 1.5 4.7 3.5% 14.2 8.9% -67.0%
Investment-linked 4.4 7.6 5.6 17.6 13.1% 8.3 5.2% 111.5%
Health, accidents and
others 2.2 2.0 2.2 6.4 4.7% 8.6 5.4% -25.5%
Total 48.4 42.8 43.4 134.6 100.0% 159.0 100.0% -15.3%

10.6% 14.0% 1.7% 1.0%
1.1% 4.0%
7.3% 13.1%
79.3%
67.9%
9M16 9M17
Traditional life:Regular-paid
Traditional life:Single-paid
Investment-linked
Interest-sensitiveannuity
Health, accidentsand others
NT$bn
FYPE reached NT$45.0 billion in 9M17,
with higher contribution from tied agents
VNB/FYPE ratio improved due to stable
contributions from protection oriented
policies
21
Fubon Life: Value of new business (VNB)
& First year premium equivalent (FYPE)
FYPE/
FYP
NT$bn
81.2
45.0
51.0% 33.4%
VNB
FYPE
Note: 9M17 VNB is based on 2016 EV actuarial assumptions
FYPE by channel
VNB/FYP 23.5% 16.9%
46.0% 50.6% VNB/FYPE
35.6% 41.8%
32.5% 22.4%
20.4% 21.8%
11.5% 14.0%
9M16 9M17
Other
Bancassurance: throughTaipei Fubon bank
Bancassurance: throughexternal banks
Tied agents
37.3
22.8
9M16 9M17
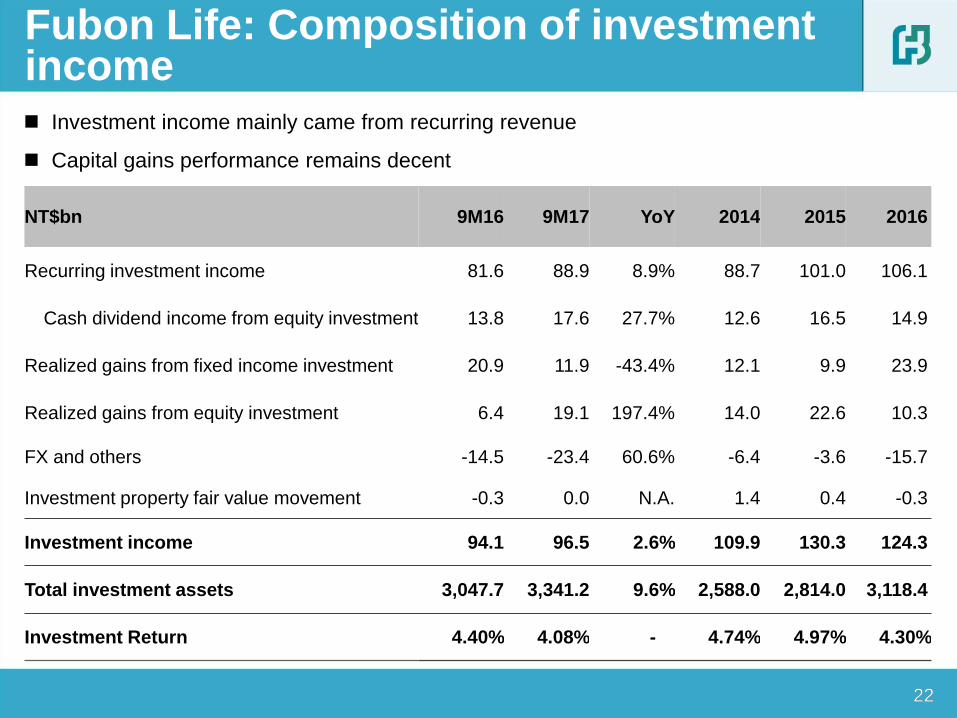
NT$bn 9M16 9M17 YoY 2014 2015 2016
Recurring investment income 81.6 88.9 8.9% 88.7 101.0 106.1
Cash dividend income from equity investment 13.8 17.6 27.7% 12.6 16.5 14.9
Realized gains from fixed income investment 20.9 11.9 -43.4% 12.1 9.9 23.9
Realized gains from equity investment 6.4 19.1 197.4% 14.0 22.6 10.3
FX and others -14.5 -23.4 60.6% -6.4 -3.6 -15.7
Investment property fair value movement -0.3 0.0 N.A. 1.4 0.4 -0.3
Investment income 94.1 96.5 2.6% 109.9 130.3 124.3
Total investment assets 3,047.7 3,341.2 9.6% 2,588.0 2,814.0 3,118.4
Investment Return 4.40% 4.08% - 4.74% 4.97% 4.30%
22 22
Investment income mainly came from recurring revenue
Capital gains performance remains decent
Fubon Life: Composition of investment income

23 23
Steady growth of investment assets
Investment portfolio repositioned in response to market volatility
Fubon Life: Investment portfolio
Note: *Including OTC-listed international bond, the international bonds investment reached 15.7% of total investment assets as of 2017/09/30
2016/9/30 2017/06/30 2017/09/30
NT$bn
Deposit and cash equivalent 189.7 6.2% 124.4 3.8% 133.0 4.0%
Domestic fixed income 502.8 16.5% 431.8 13.2% 430.8 12.9%
Overseas fixed income* 1,556.4 51.1% 1,745.5 53.5% 1,789.7 53.6%
Domestic equity 259.6 8.5% 364.9 11.2% 377.4 11.3%
Overseas equity 174.9 5.8% 210.2 6.4% 218.6 6.5%
Mortgage loans 98.8 3.2% 118.9 3.6% 122.7 3.7%
Policy loans 57.4 1.9% 59.8 1.8% 61.0 1.8%
Real estate 208.1 6.8% 207.8 6.4% 208.0 6.2%
Total Investments 3,047.7 100.0% 3,263.3 100.0% 3,341.2 100.0%
Domestic 1,252.0 41.1% 1,234.4 37.8% 1,262.0 37.8%
Overseas* 1,795.7 58.9% 2,028.9 62.2% 2,079.2 62.2%
24
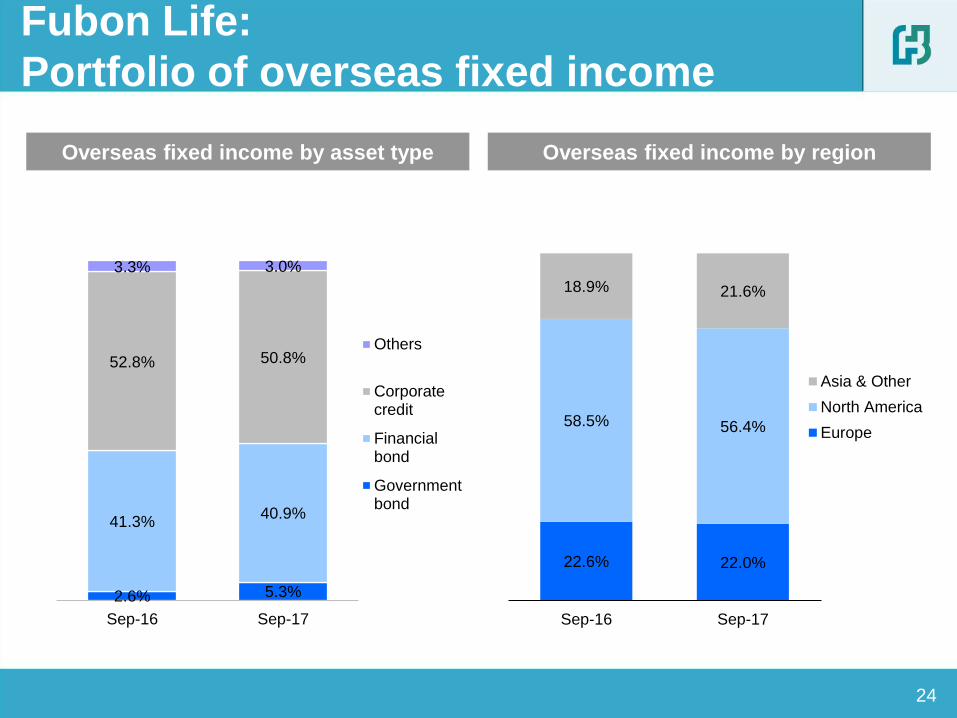
Fubon Life:
Portfolio of overseas fixed income
Overseas fixed income by region Overseas fixed income by asset type
2.6% 5.3%
41.3% 40.9%
52.8% 50.8%
3.3% 3.0%
Sep-16 Sep-17
Others
Corporatecredit
Financialbond
Governmentbond
22.6% 22.0%
58.5% 56.4%
18.9% 21.6%
Sep-16 Sep-17
Asia & Other
North America
Europe
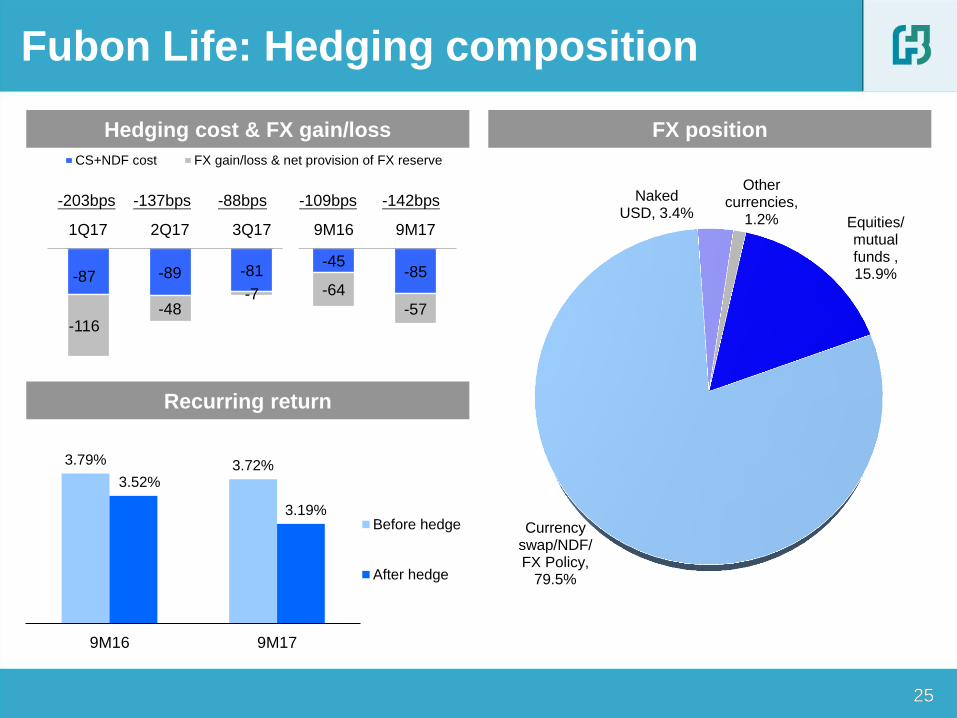
-87 -89 -81 -45
-85
-116 -48
-7 -64
-57
1Q17 2Q17 3Q17 9M16 9M17
CS+NDF cost FX gain/loss & net provision of FX reserve
25 25
Hedging cost & FX gain/loss FX position
Recurring return
Fubon Life: Hedging composition
-203bps -109bps
Currency swap/NDF/FX Policy,
79.5%
Naked USD, 3.4%
Other currencies,
1.2% Equities/ mutual funds , 15.9%
3.79% 3.72% 3.52%
3.19%
9M16 9M17
Before hedge
After hedge
-137bps -88bps -142bps
26 26
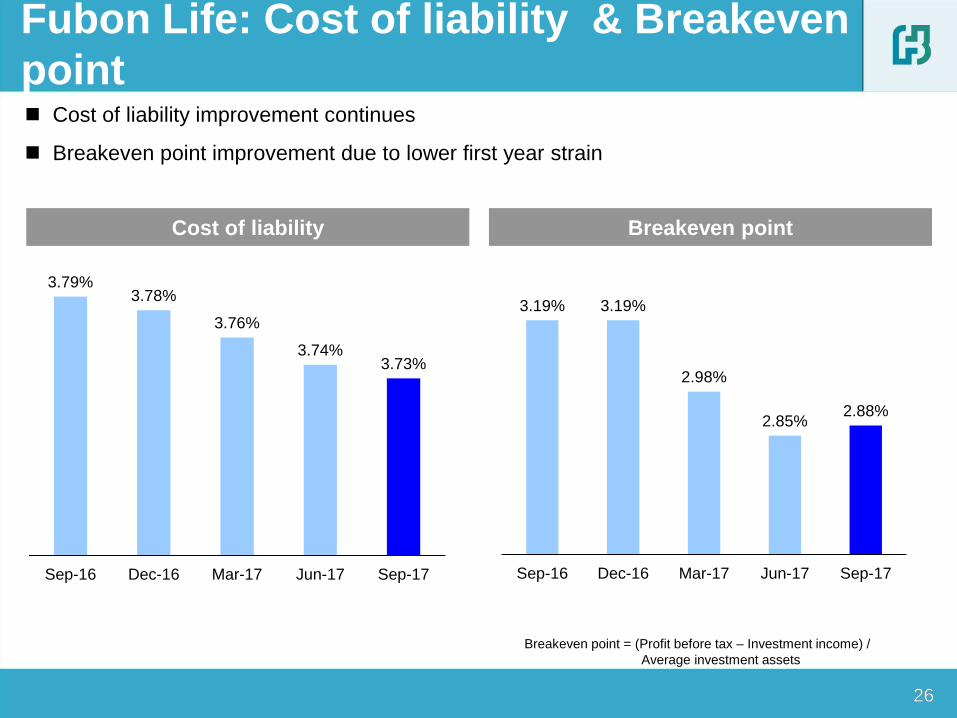
Fubon Life: Cost of liability & Breakeven
point Cost of liability improvement continues
Breakeven point improvement due to lower first year strain
Breakeven point = (Profit before tax – Investment income) /
Average investment assets
Cost of liability Breakeven point
3.79% 3.78%
3.76%
3.74% 3.73%
Sep-16 Dec-16 Mar-17 Jun-17 Sep-17
3.19% 3.19%
2.98%
2.85% 2.88%
Sep-16 Dec-16 Mar-17 Jun-17 Sep-17
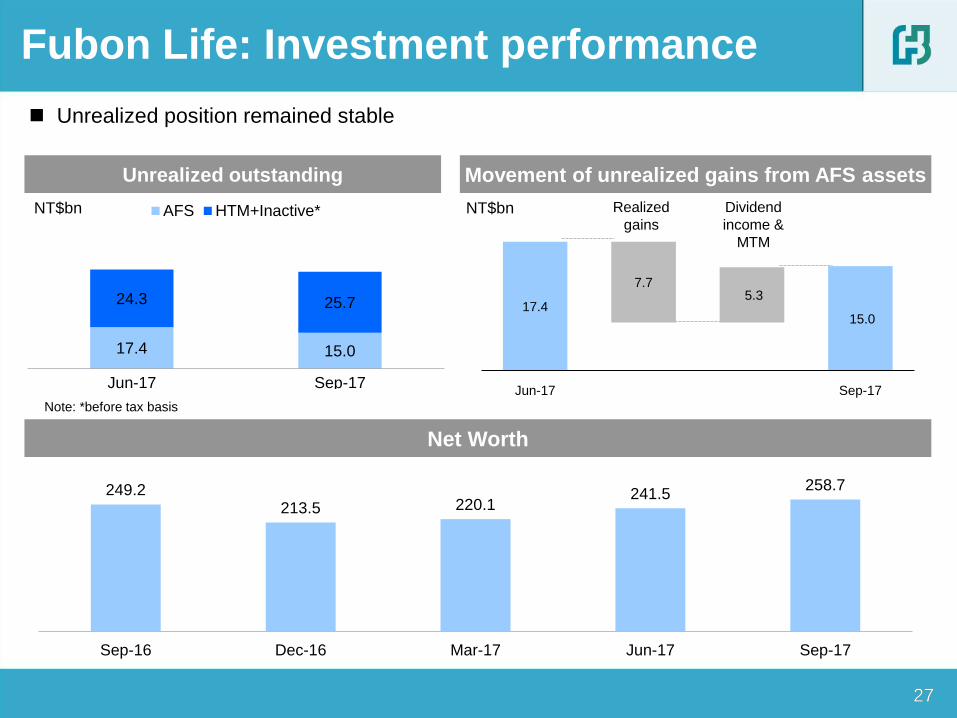
17.4 15.0
7.7 5.3
Jun-17 Sep-17
27 27
Net Worth
Unrealized outstanding
Fubon Life: Investment performance
Unrealized position remained stable
NT$bn NT$bn Realized
gains
Dividend
income &
MTM
Movement of unrealized gains from AFS assets
Note: *before tax basis
249.2 213.5 220.1
241.5 258.7
Sep-16 Dec-16 Mar-17 Jun-17 Sep-17
17.4 15.0
24.3 25.7
Jun-17 Sep-17
AFS HTM+Inactive*

28
Performance review by subsidiary
• Fubon Life
• Fubon Securities
Performance highlights of Fubon Financial Holdings
• Fubon Insurance
Agenda
• Taipei Fubon Bank
• Fubon Bank (China)
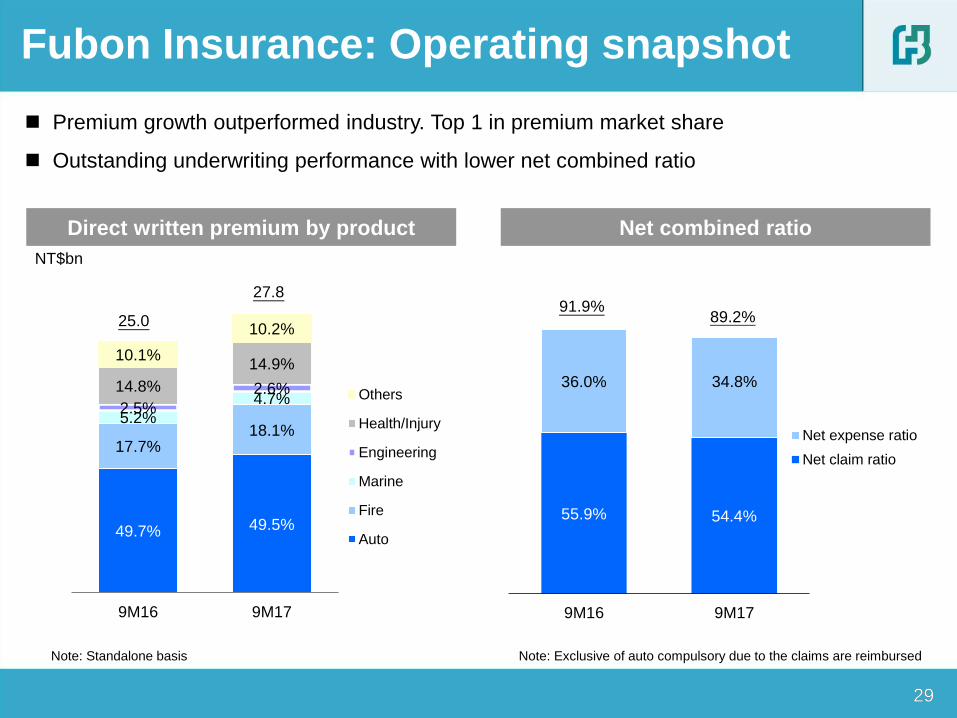
55.9% 54.4%
36.0% 34.8%
9M16 9M17
Net expense ratio
Net claim ratio
29
Net combined ratio
29
NT$bn
Premium growth outperformed industry. Top 1 in premium market share
Outstanding underwriting performance with lower net combined ratio
Note: Standalone basis Note: Exclusive of auto compulsory due to the claims are reimbursed
Fubon Insurance: Operating snapshot
Direct written premium by product
25.0
27.8
89.2% 91.9%
49.7% 49.5%
17.7% 18.1%
5.2%
4.7% 2.5%
2.6% 14.8%
14.9% 10.1%
10.2%
9M16 9M17
Others
Health/Injury
Engineering
Marine
Fire
Auto
30
Performance review by subsidiary
• Fubon Life
• Fubon Securities
Performance highlights of Fubon Financial Holdings
• Fubon Insurance
Agenda
• Taipei Fubon Bank
• Fubon Bank (China)
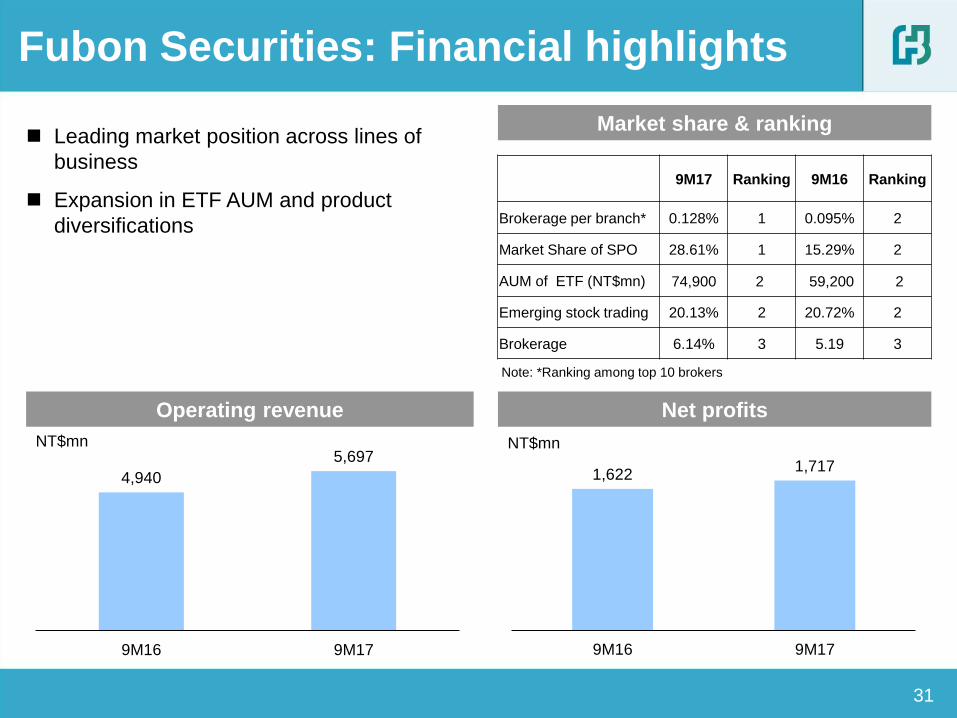
1,622 1,717
9M16 9M17
4,940
5,697
9M16 9M17
31
Fubon Securities: Financial highlights
Market share & ranking
Operating revenue
NT$mn
Leading market position across lines of
business
Expansion in ETF AUM and product
diversifications
Net profits
NT$mn
Note: *Ranking among top 10 brokers
9M17 Ranking 9M16 Ranking
Brokerage per branch* 0.128% 1 0.095% 2
Market Share of SPO 28.61% 1 15.29% 2
AUM of ETF (NT$mn) 74,900 2 59,200 2
Emerging stock trading 20.13% 2 20.72% 2
Brokerage 6.14% 3 5.19 3
32
Performance review by subsidiary
• Fubon Life
• Fubon Securities
Performance highlights of Fubon Financial Holdings
• Fubon Insurance
Agenda
• Taipei Fubon Bank
• Fubon Bank (China)
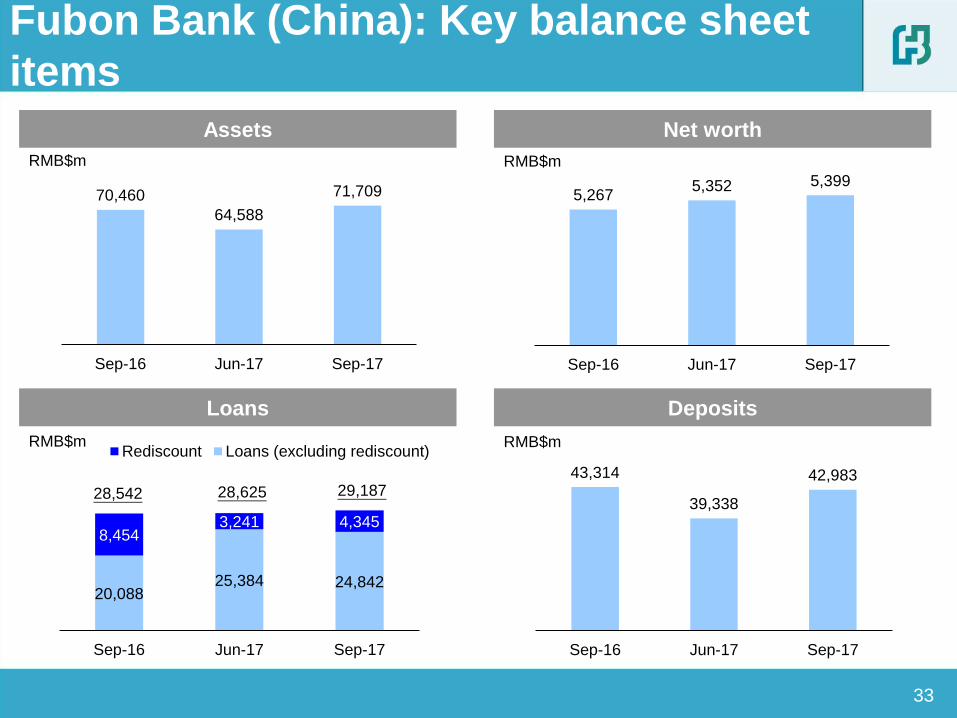
20,088 25,384 24,842
8,454 3,241 4,345
Sep-16 Jun-17 Sep-17
Rediscount Loans (excluding rediscount)
33
Fubon Bank (China): Key balance sheet
items
Assets Net worth
Deposits Loans
RMB$m
28,542
RMB$m RMB$m
RMB$m
28,625 29,187
70,460
64,588
71,709
Sep-16 Jun-17 Sep-17
5,267 5,352 5,399
Sep-16 Jun-17 Sep-17
43,314
39,338
42,983
Sep-16 Jun-17 Sep-17

34
Fubon Bank (China): Financial highlight
ROAA & ROAE
NIM Net Profits
NPL ratio & Coverage ratio
RMB$m
Note: ROAA and ROAE are annualized basis
71
41
53
3Q16 2Q17 3Q17
1.36%
1.46% 1.44%
3Q16 2Q17 3Q17
0.41% 0.25% 0.31%
5.47%
3.05% 3.95%
3Q16 2Q17 3Q17
ROAE ROAA
1.92% 1.59% 1.48%
161.8% 161.1% 169.3%
Sep-16 Jun-17 Sep-17
NPL Coverage ratio

Thank you
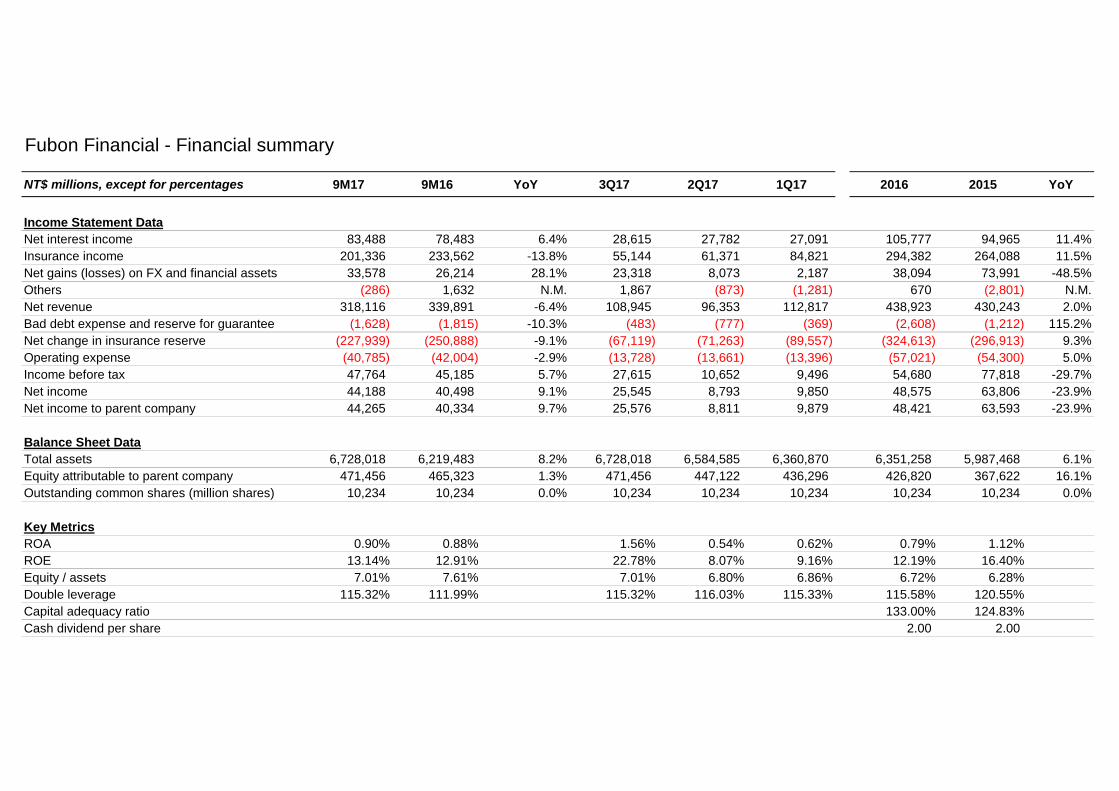
Fubon Financial - Financial summary
NT$ millions, except for percentages 9M17 9M16 YoY 3Q17 2Q17 1Q17 2016 2015 YoY
Income Statement DataNet interest income 83,488 78,483 6.4% 28,615 27,782 27,091 105,777 94,965 11.4%Insurance income 201,336 233,562 -13.8% 55,144 61,371 84,821 294,382 264,088 11.5%Net gains (losses) on FX and financial assets 33,578 26,214 28.1% 23,318 8,073 2,187 38,094 73,991 -48.5%Others (286) 1,632 N.M. 1,867 (873) (1,281) 670 (2,801) N.M.Net revenue 318,116 339,891 -6.4% 108,945 96,353 112,817 438,923 430,243 2.0%Bad debt expense and reserve for guarantee (1,628) (1,815) -10.3% (483) (777) (369) (2,608) (1,212) 115.2%Net change in insurance reserve (227,939) (250,888) -9.1% (67,119) (71,263) (89,557) (324,613) (296,913) 9.3%Operating expense (40,785) (42,004) -2.9% (13,728) (13,661) (13,396) (57,021) (54,300) 5.0%Income before tax 47,764 45,185 5.7% 27,615 10,652 9,496 54,680 77,818 -29.7%Net income 44,188 40,498 9.1% 25,545 8,793 9,850 48,575 63,806 -23.9%Net income to parent company 44,265 40,334 9.7% 25,576 8,811 9,879 48,421 63,593 -23.9%
Balance Sheet DataTotal assets 6,728,018 6,219,483 8.2% 6,728,018 6,584,585 6,360,870 6,351,258 5,987,468 6.1%Equity attributable to parent company 471,456 465,323 1.3% 471,456 447,122 436,296 426,820 367,622 16.1%Outstanding common shares (million shares) 10,234 10,234 0.0% 10,234 10,234 10,234 10,234 10,234 0.0%
Key MetricsROA 0.90% 0.88% 1.56% 0.54% 0.62% 0.79% 1.12%ROE 13.14% 12.91% 22.78% 8.07% 9.16% 12.19% 16.40%Equity / assets 7.01% 7.61% 7.01% 6.80% 6.86% 6.72% 6.28%Double leverage 115.32% 111.99% 115.32% 116.03% 115.33% 115.58% 120.55%Capital adequacy ratio 133.00% 124.83%Cash dividend per share 2.00 2.00
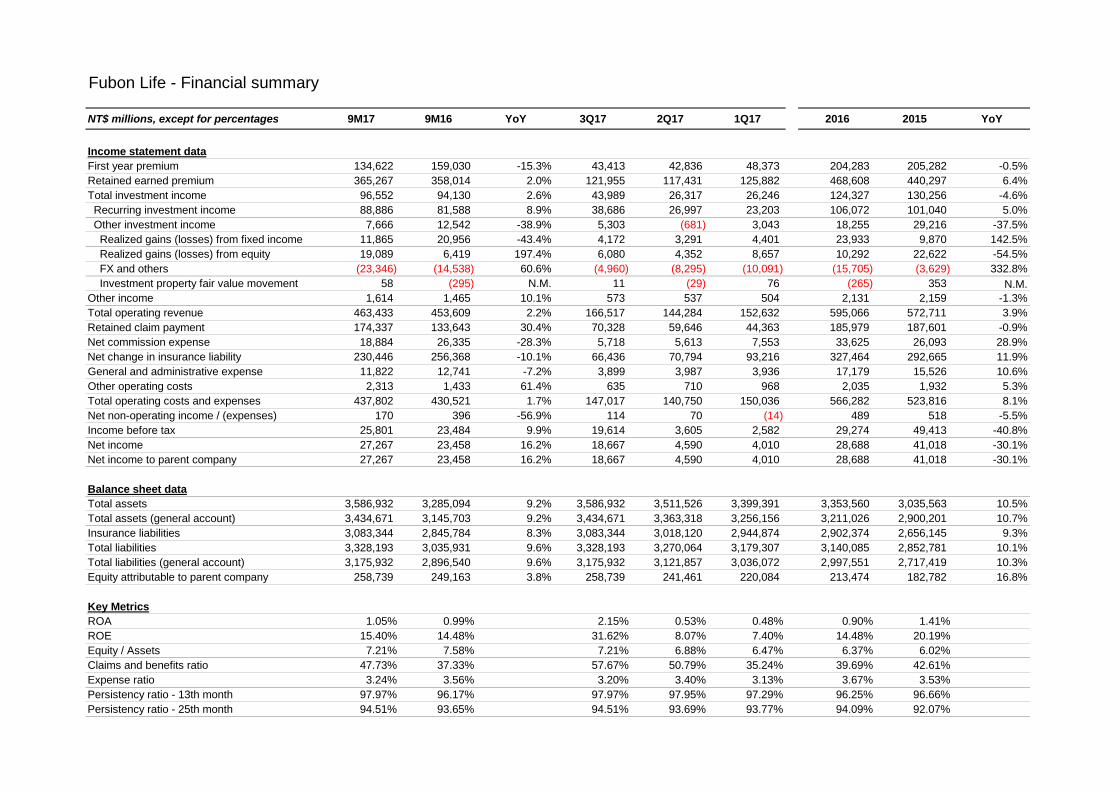
Fubon Life - Financial summary
NT$ millions, except for percentages 9M17 9M16 YoY 3Q17 2Q17 1Q17 2016 2015 YoY
Income statement dataFirst year premium 134,622 159,030 -15.3% 43,413 42,836 48,373 204,283 205,282 -0.5%Retained earned premium 365,267 358,014 2.0% 121,955 117,431 125,882 468,608 440,297 6.4%Total investment income 96,552 94,130 2.6% 43,989 26,317 26,246 124,327 130,256 -4.6% Recurring investment income 88,886 81,588 8.9% 38,686 26,997 23,203 106,072 101,040 5.0% Other investment income 7,666 12,542 -38.9% 5,303 (681) 3,043 18,255 29,216 -37.5% Realized gains (losses) from fixed income 11,865 20,956 -43.4% 4,172 3,291 4,401 23,933 9,870 142.5% Realized gains (losses) from equity 19,089 6,419 197.4% 6,080 4,352 8,657 10,292 22,622 -54.5% FX and others (23,346) (14,538) 60.6% (4,960) (8,295) (10,091) (15,705) (3,629) 332.8% Investment property fair value movement 58 (295) N.M. 11 (29) 76 (265) 353 N.M.Other income 1,614 1,465 10.1% 573 537 504 2,131 2,159 -1.3%Total operating revenue 463,433 453,609 2.2% 166,517 144,284 152,632 595,066 572,711 3.9%Retained claim payment 174,337 133,643 30.4% 70,328 59,646 44,363 185,979 187,601 -0.9%Net commission expense 18,884 26,335 -28.3% 5,718 5,613 7,553 33,625 26,093 28.9%Net change in insurance liability 230,446 256,368 -10.1% 66,436 70,794 93,216 327,464 292,665 11.9%General and administrative expense 11,822 12,741 -7.2% 3,899 3,987 3,936 17,179 15,526 10.6%Other operating costs 2,313 1,433 61.4% 635 710 968 2,035 1,932 5.3%Total operating costs and expenses 437,802 430,521 1.7% 147,017 140,750 150,036 566,282 523,816 8.1%Net non-operating income / (expenses) 170 396 -56.9% 114 70 (14) 489 518 -5.5%Income before tax 25,801 23,484 9.9% 19,614 3,605 2,582 29,274 49,413 -40.8%Net income 27,267 23,458 16.2% 18,667 4,590 4,010 28,688 41,018 -30.1%Net income to parent company 27,267 23,458 16.2% 18,667 4,590 4,010 28,688 41,018 -30.1%
Balance sheet dataTotal assets 3,586,932 3,285,094 9.2% 3,586,932 3,511,526 3,399,391 3,353,560 3,035,563 10.5%Total assets (general account) 3,434,671 3,145,703 9.2% 3,434,671 3,363,318 3,256,156 3,211,026 2,900,201 10.7%Insurance liabilities 3,083,344 2,845,784 8.3% 3,083,344 3,018,120 2,944,874 2,902,374 2,656,145 9.3%Total liabilities 3,328,193 3,035,931 9.6% 3,328,193 3,270,064 3,179,307 3,140,085 2,852,781 10.1%Total liabilities (general account) 3,175,932 2,896,540 9.6% 3,175,932 3,121,857 3,036,072 2,997,551 2,717,419 10.3%Equity attributable to parent company 258,739 249,163 3.8% 258,739 241,461 220,084 213,474 182,782 16.8%
Key MetricsROA 1.05% 0.99% 2.15% 0.53% 0.48% 0.90% 1.41%ROE 15.40% 14.48% 31.62% 8.07% 7.40% 14.48% 20.19%Equity / Assets 7.21% 7.58% 7.21% 6.88% 6.47% 6.37% 6.02%Claims and benefits ratio 47.73% 37.33% 57.67% 50.79% 35.24% 39.69% 42.61%Expense ratio 3.24% 3.56% 3.20% 3.40% 3.13% 3.67% 3.53%Persistency ratio - 13th month 97.97% 96.17% 97.97% 97.95% 97.29% 96.25% 96.66%Persistency ratio - 25th month 94.51% 93.65% 94.51% 93.69% 93.77% 94.09% 92.07%
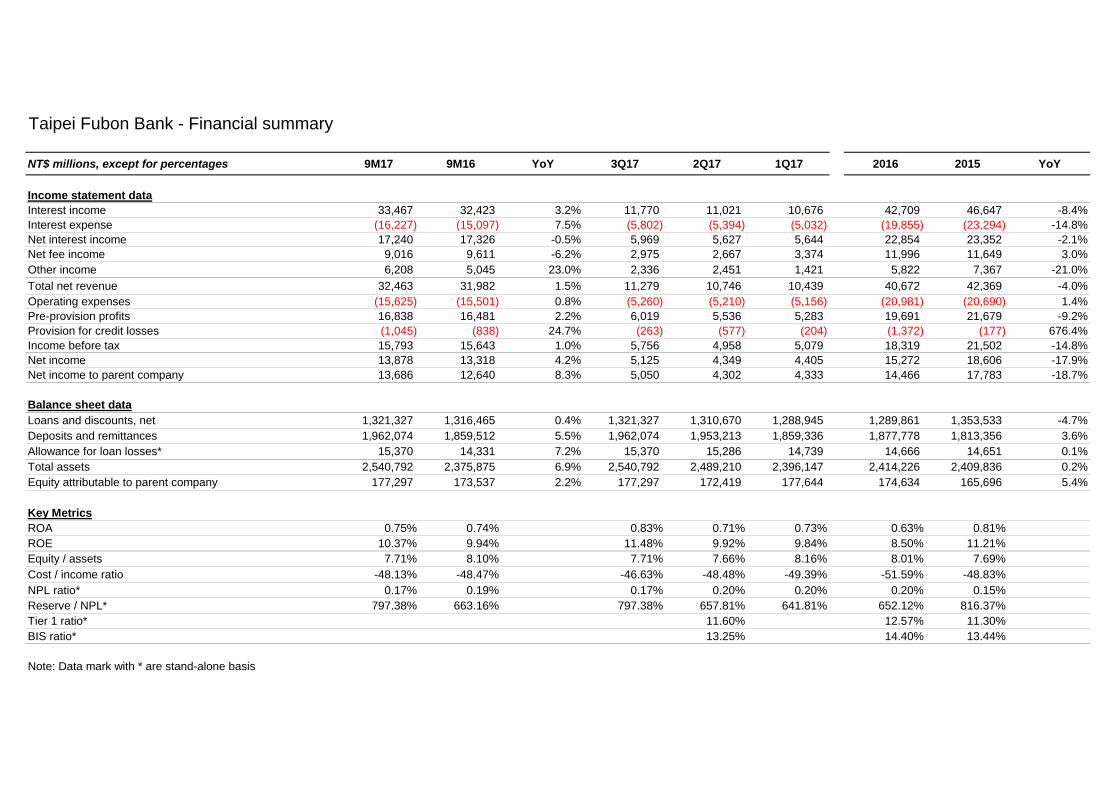
Taipei Fubon Bank - Financial summary
NT$ millions, except for percentages 9M17 9M16 YoY 3Q17 2Q17 1Q17 2016 2015 YoY
Income statement dataInterest income 33,467 32,423 3.2% 11,770 11,021 10,676 42,709 46,647 -8.4%Interest expense (16,227) (15,097) 7.5% (5,802) (5,394) (5,032) (19,855) (23,294) -14.8%Net interest income 17,240 17,326 -0.5% 5,969 5,627 5,644 22,854 23,352 -2.1%Net fee income 9,016 9,611 -6.2% 2,975 2,667 3,374 11,996 11,649 3.0%Other income 6,208 5,045 23.0% 2,336 2,451 1,421 5,822 7,367 -21.0%Total net revenue 32,463 31,982 1.5% 11,279 10,746 10,439 40,672 42,369 -4.0%Operating expenses (15,625) (15,501) 0.8% (5,260) (5,210) (5,156) (20,981) (20,690) 1.4%Pre-provision profits 16,838 16,481 2.2% 6,019 5,536 5,283 19,691 21,679 -9.2%Provision for credit losses (1,045) (838) 24.7% (263) (577) (204) (1,372) (177) 676.4%Income before tax 15,793 15,643 1.0% 5,756 4,958 5,079 18,319 21,502 -14.8%Net income 13,878 13,318 4.2% 5,125 4,349 4,405 15,272 18,606 -17.9%Net income to parent company 13,686 12,640 8.3% 5,050 4,302 4,333 14,466 17,783 -18.7%
Balance sheet dataLoans and discounts, net 1,321,327 1,316,465 0.4% 1,321,327 1,310,670 1,288,945 1,289,861 1,353,533 -4.7%Deposits and remittances 1,962,074 1,859,512 5.5% 1,962,074 1,953,213 1,859,336 1,877,778 1,813,356 3.6%Allowance for loan losses* 15,370 14,331 7.2% 15,370 15,286 14,739 14,666 14,651 0.1%Total assets 2,540,792 2,375,875 6.9% 2,540,792 2,489,210 2,396,147 2,414,226 2,409,836 0.2%Equity attributable to parent company 177,297 173,537 2.2% 177,297 172,419 177,644 174,634 165,696 5.4%
Key MetricsROA 0.75% 0.74% 0.83% 0.71% 0.73% 0.63% 0.81%ROE 10.37% 9.94% 11.48% 9.92% 9.84% 8.50% 11.21%Equity / assets 7.71% 8.10% 7.71% 7.66% 8.16% 8.01% 7.69%Cost / income ratio -48.13% -48.47% -46.63% -48.48% -49.39% -51.59% -48.83%NPL ratio* 0.17% 0.19% 0.17% 0.20% 0.20% 0.20% 0.15%Reserve / NPL* 797.38% 663.16% 797.38% 657.81% 641.81% 652.12% 816.37%Tier 1 ratio* 11.60% 12.57% 11.30%BIS ratio* 13.25% 14.40% 13.44%
Note: Data mark with * are stand-alone basis

Fubon Insurance - Financial summary
NT$ millions, except for percentages 9M17 9M16 YoY 3Q17 2Q17 1Q17 2016 2015 YoY
Income statement dataDirect written premiums 31,395 28,788 10.3% 9,738 11,116 10,541 38,172 35,016 9.0%Retention of earned premiums 24,251 21,968 10.4% 8,361 8,006 7,884 29,577 27,139 9.0%Net income from investment 2,364 2,188 8.0% 872 1,080 412 2,754 2,811 -2.0%Other operating revenue 996 1,066 -6.6% 274 364 358 1,440 1,295 11.2%Retained insurance payments 12,954 11,890 9.0% 4,560 4,119 4,275 16,216 14,250 13.8%Net change in liability reserve 616 441 39.7% 174 325 117 363 656 -44.6%Commission and operating expenses 10,739 10,194 5.3% 3,592 3,604 3,543 13,769 12,772 7.8%Non-Operating Income (153) (94) 63.4% (61) (49) (43) (158) (96) 65.4%Income before tax 3,149 2,603 21.0% 1,120 1,353 676 3,266 3,472 -5.9%Net income 2,684 2,127 26.2% 928 1,209 547 2,672 2,839 -5.9%Net income to parent company 2,902 2,467 17.6% 1,011 1,257 634 3,119 3,213 -2.9%
Balance sheet dataTotal assets 99,127 99,597 -0.5% 99,127 99,400 98,532 98,470 89,213 10.4%Investment assets 67,543 65,653 2.9% 67,543 65,839 65,083 64,900 64,689 0.3%Policy reserve 53,237 54,404 -2.1% 53,237 54,902 53,981 54,310 47,470 14.4%Equity attributable to parent company 30,436 30,646 -0.7% 30,436 29,614 30,556 29,531 28,677 3.0%
Key MetricsROA 3.62% 3.00% 3.75% 4.89% 2.22% 2.85% 3.29%ROE 12.91% 11.09% 13.49% 17.00% 8.44% 10.72% 11.41%Total investment return 4.76% 4.48% 5.27% 6.61% 2.53% 4.25% 4.50%Solvency margin (NWP/equity) 109.64% 100.19% 106.50% 114.51% 110.58% 104.51% 97.95%Retention ratio 75.10% 74.17% 78.01% 72.04% 75.60% 75.36% 75.30%
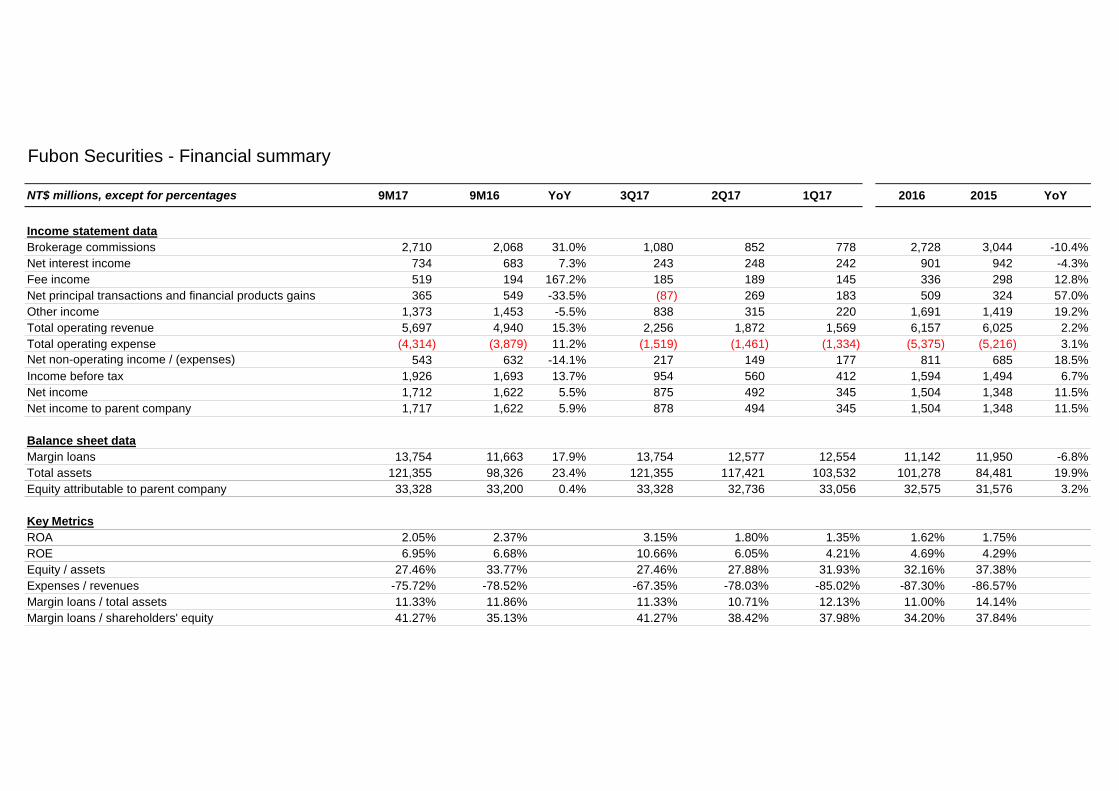
Fubon Securities - Financial summary
NT$ millions, except for percentages 9M17 9M16 YoY 3Q17 2Q17 1Q17 2016 2015 YoY
Income statement dataBrokerage commissions 2,710 2,068 31.0% 1,080 852 778 2,728 3,044 -10.4%Net interest income 734 683 7.3% 243 248 242 901 942 -4.3%Fee income 519 194 167.2% 185 189 145 336 298 12.8%Net principal transactions and financial products gains 365 549 -33.5% (87) 269 183 509 324 57.0%Other income 1,373 1,453 -5.5% 838 315 220 1,691 1,419 19.2%Total operating revenue 5,697 4,940 15.3% 2,256 1,872 1,569 6,157 6,025 2.2%Total operating expense (4,314) (3,879) 11.2% (1,519) (1,461) (1,334) (5,375) (5,216) 3.1%Net non-operating income / (expenses) 543 632 -14.1% 217 149 177 811 685 18.5%Income before tax 1,926 1,693 13.7% 954 560 412 1,594 1,494 6.7%Net income 1,712 1,622 5.5% 875 492 345 1,504 1,348 11.5%Net income to parent company 1,717 1,622 5.9% 878 494 345 1,504 1,348 11.5%
Balance sheet dataMargin loans 13,754 11,663 17.9% 13,754 12,577 12,554 11,142 11,950 -6.8%Total assets 121,355 98,326 23.4% 121,355 117,421 103,532 101,278 84,481 19.9%Equity attributable to parent company 33,328 33,200 0.4% 33,328 32,736 33,056 32,575 31,576 3.2%
Key MetricsROA 2.05% 2.37% 3.15% 1.80% 1.35% 1.62% 1.75%ROE 6.95% 6.68% 10.66% 6.05% 4.21% 4.69% 4.29%Equity / assets 27.46% 33.77% 27.46% 27.88% 31.93% 32.16% 37.38%Expenses / revenues -75.72% -78.52% -67.35% -78.03% -85.02% -87.30% -86.57%Margin loans / total assets 11.33% 11.86% 11.33% 10.71% 12.13% 11.00% 14.14%Margin loans / shareholders' equity 41.27% 35.13% 41.27% 38.42% 37.98% 34.20% 37.84%
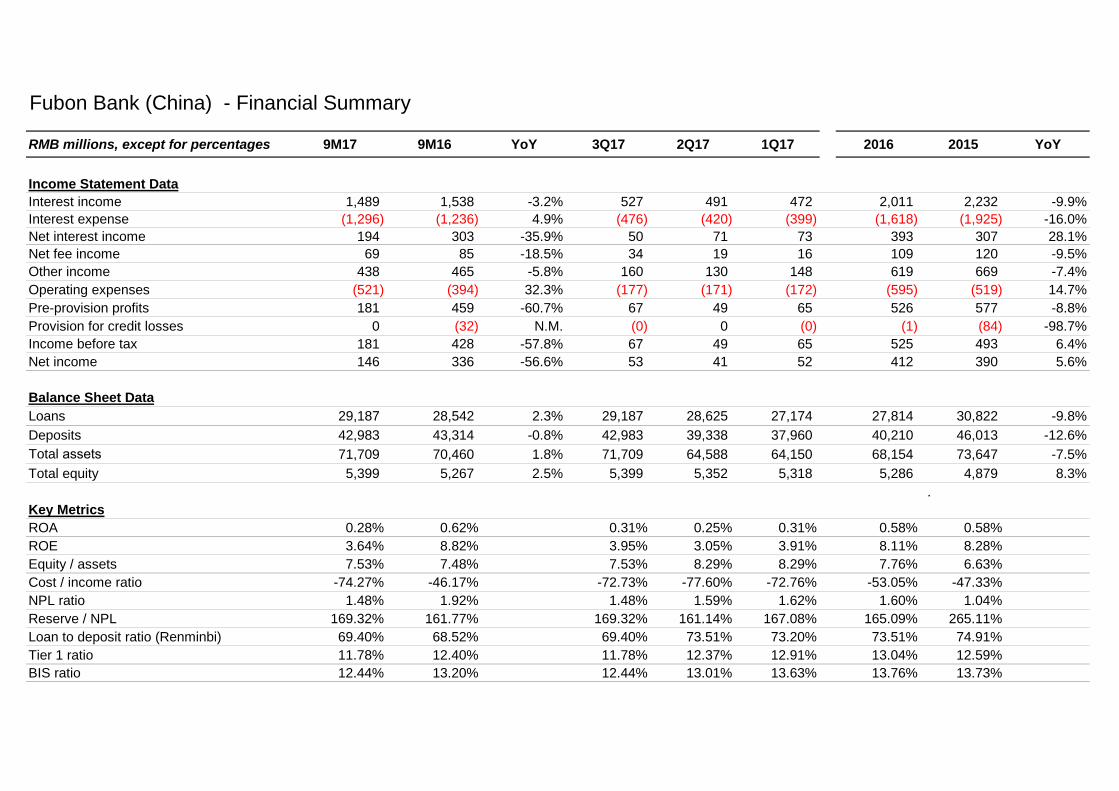
Fubon Bank (China) - Financial Summary
RMB millions, except for percentages 9M17 9M16 YoY 3Q17 2Q17 1Q17 2016 2015 YoY
Income Statement DataInterest income 1,489 1,538 -3.2% 527 491 472 2,011 2,232 -9.9%Interest expense (1,296) (1,236) 4.9% (476) (420) (399) (1,618) (1,925) -16.0%Net interest income 194 303 -35.9% 50 71 73 393 307 28.1%Net fee income 69 85 -18.5% 34 19 16 109 120 -9.5%Other income 438 465 -5.8% 160 130 148 619 669 -7.4%Operating expenses (521) (394) 32.3% (177) (171) (172) (595) (519) 14.7%Pre-provision profits 181 459 -60.7% 67 49 65 526 577 -8.8%Provision for credit losses 0 (32) N.M. (0) 0 (0) (1) (84) -98.7%Income before tax 181 428 -57.8% 67 49 65 525 493 6.4%Net income 146 336 -56.6% 53 41 52 412 390 5.6%
Balance Sheet DataLoans 29,187 28,542 2.3% 29,187 28,625 27,174 27,814 30,822 -9.8%Deposits 42,983 43,314 -0.8% 42,983 39,338 37,960 40,210 46,013 -12.6%
71,709 70,460 1.8% 71,709 64,588 64,150 68,154 73,647 -7.5%Total equity 5,399 5,267 2.5% 5,399 5,352 5,318 5,286 4,879 8.3%
.Key MetricsROA 0.28% 0.62% 0.31% 0.25% 0.31% 0.58% 0.58%ROE 3.64% 8.82% 3.95% 3.05% 3.91% 8.11% 8.28%Equity / assets 7.53% 7.48% 7.53% 8.29% 8.29% 7.76% 6.63%Cost / income ratio -74.27% -46.17% -72.73% -77.60% -72.76% -53.05% -47.33%NPL ratio 1.48% 1.92% 1.48% 1.59% 1.62% 1.60% 1.04%Reserve / NPL 169.32% 161.77% 169.32% 161.14% 167.08% 165.09% 265.11%Loan to deposit ratio (Renminbi) 69.40% 68.52% 69.40% 73.51% 73.20% 73.51% 74.91%Tier 1 ratio 11.78% 12.40% 11.78% 12.37% 12.91% 13.04% 12.59%BIS ratio 12.44% 13.20% 12.44% 13.01% 13.63% 13.76% 13.73%
Total assets