9783642342424-c1
DESCRIPTION
dTRANSCRIPT

Chapter 1Contact Angle and Wetting Properties
Yuehua Yuan and T. Randall Lee
Abstract This chapter highlights a variety of techniques that are commonly used tomeasure contact angles, including the conventional telescope-goniometer method,the Wilhelmy balance method, and the more recently developed drop-shape analysismethods. The various applications and limitations of these techniques are described.Notably, studies of ultrasmall droplets on solid surfaces allow wetting theories to betested down to the nanometer scale, bringing new insight to contact angle phenom-ena and wetting behavior.
1.1 Introduction
The topic of wetting has received tremendous interest from both fundamental andapplied points of view. It plays an important role in many industrial processes, suchas oil recovery, lubrication, liquid coating, printing, and spray quenching [1–6]. Inrecent years, there has been an increasing interest in the study of superhydrophobicsurfaces, due to their potential applications in, for example, self-cleaning, nanoflu-idics, and electrowetting [7–12]. Wettability studies usually involve the measure-ment of contact angles as the primary data, which indicates the degree of wettingwhen a solid and liquid interact. Small contact angles (� 90°) correspond to highwettability, while large contact angles (� 90°) correspond to low wettability.
This chapter will begin with an introduction of the fundamental science behindwetting and contact angle phenomena, followed by a comprehensive descriptionof the various techniques used to measure contact angles, as well as their appli-cations and limitations in terms of the geometric forms of solid samples. Most ofthe techniques can be classified into two main groups: the direct optical methodand the indirect force method. Calculations based on measured contact angle val-ues yield an important parameter—the solid surface tension, which quantifies the
Y. Yuan · T.R. Lee (B)Department of Chemistry, University of Houston, 4800 Calhoun Road, Houston, TX 77204-5003,USAe-mail: [email protected]
Y. Yuane-mail: [email protected]
G. Bracco, B. Holst (eds.), Surface Science Techniques,Springer Series in Surface Sciences 51, DOI 10.1007/978-3-642-34243-1_1,© Springer-Verlag Berlin Heidelberg 2013
3

4 Y. Yuan and T.R. Lee
Fig. 1.1 Illustration of contact angles formed by sessile liquid drops on a smooth homogeneoussolid surface
wetting characteristics of a solid material. The criteria of calculating solid surfacetension based on experimental contact angle values will be discussed. Finally, themost up-to-date contact angle measurement techniques will be presented and dis-cussed.
1.2 Theoretical Background
1.2.1 Surface Tension and Contact Angle—Young’s Equation
Consider a liquid drop resting on a flat, horizontal solid surface (Fig. 1.1). The con-tact angle is defined as the angle formed by the intersection of the liquid-solid in-terface and the liquid-vapor interface (geometrically acquired by applying a tangentline from the contact point along the liquid-vapor interface in the droplet profile).The interface where solid, liquid, and vapor co-exist is referred to as the “three-phase contact line”. Figure 1.1 shows that a small contact angle is observed whenthe liquid spreads on the surface, while a large contact angle is observed when theliquid beads on the surface. More specifically, a contact angle less than 90° indi-cates that wetting of the surface is favorable, and the fluid will spread over a largearea on the surface; while contact angles greater than 90° generally means that wet-ting of the surface is unfavorable so the fluid will minimize its contact with thesurface and form a compact liquid droplet. For example, complete wetting occurswhen the contact angle is 0°, as the droplet turns into a flat puddle. For superhy-drophobic surfaces, water contact angles are usually greater than 150°, showingalmost no contact between the liquid drop and the surface, which can rationalizethe “lotus effect” [13]. Furthermore, contact angles are not limited to the liquid-vapor interface on a solid; they are also applicable to the liquid-liquid interface on asolid.
Ideally, the shape of a liquid droplet is determined by the surface tension ofthe liquid. In a pure liquid, each molecule in the bulk is pulled equally in everydirection by neighboring liquid molecules, resulting in a net force of zero. How-ever, the molecules exposed at the surface do not have neighboring molecules inall directions to provide a balanced net force. Instead, they are pulled inward bythe neighboring molecules (Fig. 1.2), creating an internal pressure. As a result,the liquid voluntarily contracts its surface area to maintain the lowest surface free

1 Contact Angle and Wetting Properties 5
Fig. 1.2 Surface tension iscaused by the unbalancedforces of liquid molecules atthe surface
energy. From everyday life, we know that small droplets and bubbles are spheri-cal, which gives the minimum surface area for a fixed volume. This intermolecu-lar force to contract the surface is called the surface tension, and it is responsiblefor the shape of liquid droplets. In practice, external forces such as gravity deformthe droplet; consequently, the contact angle is determined by a combination of sur-face tension and external forces (usually gravity). Theoretically, the contact angleis expected to be characteristic for a given solid-liquid system in a specific environ-ment [14].
As first described by Thomas Young [15] in 1805, the contact angle of a liquiddrop on an ideal solid surface is defined by the mechanical equilibrium of the dropunder the action of three interfacial tensions (Fig. 1.1):
γlv cos θY = γsv − γsl (1.1)
where γlv , γsv , and γsl represent the liquid-vapor, solid-vapor, and solid-liquid in-terfacial tensions, respectively, and θY is the contact angle. (1.1) is usually referredto as Young’s equation, and θY is Young’s contact angle.
1.2.2 Contact Angle Hysteresis
From Young’s equation applied to a specific liquid-solid system, three thermody-namic parameters γlv , γsv , and γsl determine a single and unique contact angle θY .In practice, however, there exist many metastable states of a droplet on a solid, andthe observed contact angles are usually not equal to θY . The phenomenon of wettingis more than just a static state. The liquid moves to expose its fresh surface and towet the fresh surface of the solid in turn. The measurement of a single static con-tact angle to characterize wetting behavior is no longer adequate. If the three-phasecontact line is in actual motion, the contact angle produced is called a “dynamic”contact angle. In particular, the contact angles formed by expanding and contractingthe liquid are referred to as the advancing contact angle θa and the receding contactangle θr , respectively (Fig. 1.3). These angles fall within a range, with the advanc-ing angles approaching a maximum value, and the receding angles approaching aminimum value. Dynamic contact angles can be measured at various rates of speed.At a low speed, it should be close or equal to a properly measured static contactangle. The difference between the advancing angle and the receding angle is calledthe hysteresis (H ):
H = θa − θr (1.2)

6 Y. Yuan and T.R. Lee
Fig. 1.3 Illustration ofadvancing and recedingcontact angles
The significance of contact angle hysteresis has been extensively investigated[16–20], and the general conclusion is that it arises from surface roughness and/orheterogeneity. For surfaces that are not homogeneous, there exist domains thatpresent barriers to the motion of the contact line. For example, hydrophobic do-mains will pin the motion of the water front as it advances, causing an increase inthe observed contact angle; the same domains will hold back the contracting motionof the water front when the water recedes, thus leading to a decrease in the observedcontact angle. In cases that surface roughness plays the role of generating hystere-sis, the actual microscopic variations of slope on the surface create barriers that pinthe motion of the contact line and alter the macroscopic contact angles. Interpretingsuch contact angle data in terms of Young’s equation can be misleading because theequation fails to consider surface topography.
Due to the complexity of contact angle phenomena, the experimentally observedcontact angle might or might not be equal to Young’s contact angle θY [21, 22].However, on ideal solid surfaces, there is no contact angle hysteresis, and the ex-perimentally observed contact angle is Young’s contact angle θY . On smooth butchemically heterogeneous solid surfaces, the experimentally observed contact anglemight not be equal to θY . Nevertheless, the experimental advancing contact angleθa might be expected to be a good approximation of θY [21, 22], while the ex-perimental receding angle θr is usually found to have less reproducibility due toliquid sorption or solid swelling [23]. On rough solid surfaces, there is usually nocorrelation between θa and θY . All contact angles on rough surfaces are largelymeaningless in terms of Young’s equation [21, 22]. The thermodynamic equilib-rium contact angles on rough and heterogeneous surfaces are called Wenzel [24] andCassie-Baxter angles [25], respectively. They are not equivalent to Young’s contactangle.
There are as yet no general guidelines regarding how smooth a solid surfacemust be for surface roughness not to have an obvious impact on the contact angle.It is therefore recommended that the solid surface should be prepared as smoothas possible, and as inert to the liquids of interest as possible. Several techniquesfor the preparation of smooth homogeneous solid surfaces have been developed;these include: heat pressing [26], solvent casting [27, 28], self-assembled monolay-ers [29, 30], dip coating [31, 32], vapor deposition [33, 34], and surface polishing[35, 36].

1 Contact Angle and Wetting Properties 7
Fig. 1.4 A ramé-hart contactangle telescope-goniometer
1.3 Experimental Setup and Method
1.3.1 Direct Measurement by Telescope-Goniometer
The most widely used technique of contact angle measurement is a direct mea-surement of the tangent angle at the three-phase contact point on a sessile dropprofile. Bigelow et al. [37] set up a simple and convenient instrument, which theyreferred to as a “telescope-goniometer” to measure contact angles of various liquidson polished surfaces. Later, the first commercial contact angle goniometer, designedby W.A. Zisman, was manufactured by ramé-hart instrument company in the early1960s (Fig. 1.4).
The equipment consists of a horizontal stage to mount a solid or liquid sample,a micrometer pipette to form a liquid drop, an illumination source, and a telescopeequipped with a protractor eyepiece. The measurement was achieved by simplyaligning the tangent of the sessile drop profile at the contact point with the sur-face and reading the protractor through the eyepiece. Over the years, modificationsof the equipment have been made to improve the accuracy and precision. A cam-era can be integrated to take photographs of the drop profile so as to measure thecontact angle at leisure [38]. The use of relatively high magnifications enables adetailed examination of the intersection profile [39]. A motor-driven syringe can beused to control the rate of liquid addition and removal to study advancing, receding,or dynamic contact angles [40].
This direct optical method is advantageous because of its simplicity and the factthat only small amounts of liquid (a few microliters) and small surface substrates(a few square millimeters) are required. On the other hand, there is a relativelyhigher risk/impact of impurities due to the small size of the liquid and substrate.As for accuracy and reproducibility, the measurement relies on the consistency ofthe operator in the assignment of the tangent line, which can lead to significant er-ror and inconsistency between multiple users. It is necessary to establish generalguidelines for operators to follow. It is suggested that the telescope be tilted downslightly (1 to 2°) off the horizon so that the near edge of the sample stage (out of

8 Y. Yuan and T.R. Lee
focus) is out of the line of sight, and a portion of the profile reflected by the sub-strate surface is brought into focus, which prevents forming a fuzzy liquid-substratecontact line in the profile. A background light is always used to assist observation,while a specific light source is selected to avoid undesired heating of the liquid orsubstrate.
To establish an advancing contact angle, it is best to slowly grow the sessile dropto a diameter of approximately 5 mm using a micrometer syringe with a narrow-gauge stainless steel or Teflon needle. The needle must remain in the liquid dropduring measurement to avoid undesired vibration. The needle diameter should beas small as possible so it does not distort the drop profile shape. Because, the dropmight be unsymmetrical, it is advisable that contact angles be measured on bothsides of the liquid drop profile, and to use the averaged result. For a relatively largesubstrate, contact angles should be measured at multiple points to give an averagevalue that is representative of the entire surface.
The direct goniometer method suffers from another serious limitation becausesmall contact angles (below 20°) cannot be accurately measured due to the uncer-tainty of assigning a tangent line when the droplet profile is almost flat. Also, theimaging device only focuses on the largest meridian section of the sessile drop,which means the profile image reflects only the contact angle at the point in whichthe meridian plane intersects the three-phase line. In addition,the dependence ofthe contact angle on the drop size causes a systematic problem [41, 42]. Surfaceheterogeneity or roughness could well cause variations of the contact point alongthe three-phase contact line. Despite all of these issues, the goniometer methodis considered to be the most convenient method if high accuracy is not required[43]. It is generally recognized that the direct measurement of sessile drop contactangles with a telescope-goniometer can yield an accuracy of approximately ±2°[43, 44].
Ideally, contact angle measurements should be made inside an enclosed cham-ber to exclude airborne contamination and establish an equilibrium vapor pressureof the liquid tested, which is especially preferable when the test liquid is volatile.It has been observed that evaporation can cause the liquid front to retract, and thata retreating or an intermediate contact angle is recorded unintentionally. However,the inherent inaccuracy of the direct measurement technique and the use of liq-uids with high boiling points make the enclosed chamber unnecessary in manycases.
The measurement of the contact angle hysteresis has been recommended as ameans to assess the quality of the substrate surface. A “tilted plate” method (also re-ferred to as the “inclined plate” method) was introduced by McDougall and Ockrent[45] (this is not to be confused with the “tilting plate” method in Sect. 1.3.3), whomodified the sessile drop method and obtained both advancing and receding contactangles by tilting the solid surface until the drop just begins to move. The contactangles obtained at the lowest point θmax and the highest point θmin are consideredas the advancing and receding contact angles, respectively (Fig. 1.5). This methodwas used by Extrand and Kumagai [46, 47] to study the contact angle hysteresis ofliquids on a variety of polymer surfaces, including silicon wafers and elastomeric

1 Contact Angle and Wetting Properties 9
Fig. 1.5 Illustration of the“tilted plate” method, whereθmax and θmin are assumed tobe θa and θr , respectivelywhen the drop just starts tomove
surfaces. However, this particular association between the advancing/receding an-gles and the maximum/minimum contact angles must be used with caution becausesometimes they can be quite different [48, 49].
In the early history of contact angle measurement, a platinum wire was used byZisman and his co-workers [50] to form sessile liquid drops on solid surfaces. A fineplatinum wire (about 8 cm long and 0.05–0.10 mm in diameter) was first cleanedby heating to red in a Bunsen burner, then dipped into the liquid and gently flickedto form a pendant drop hanging from the tip of the wire. The drop was then slowlybrought into contact with the solid surface, and it flowed off the wire, forming asessile drop. Although a reproducibility of ±2° was claimed [26], there are concernsabout the kinetic energy associated with the flowing droplet and the deformation thatoccurs when removing the platinum wire, which might lead to metastable contactangles.
Phillips and Riddiford [51], as well as McIntyre [52] have analyzed sessile dropprofile photographs with a “tangentometer”, which consists a mirror mounted at thebaseline of the droplet. The mirror is positioned normal to the photograph at thedrop tip, and is rotated until the curve of the drop shape forms a smooth, continuouscurve with its reflection image in the mirror. Thus, the straight edge becomes thetangent line, and contact angle value is indicated by the protractor that is attachedto the mirror. However, this technique still suffers inaccuracy due to the inherentsubjectivity of tangentometers [53]. Fisher [54] has acquired a series of contactangle data less than 30° by applying the mass of the drop and the radius of thecontact area into a semi-empirical formula that calculates the contact angle value.Langmuir and Schaeffer [55] used the specular reflection from a drop surface tomeasure the contact angle. Here, a light source above the three-phase contact lineis rotated around the sessile drop, until to the height that small changes make thereflected light from the drop disappear or appear abruptly. The degree of rotationindicates the contact angle. This method was later refined by Fort and Patterson[56, 57] and has been used with both sessile drops and menisci on flat plates orinside tubes, with an accuracy of ±1°.
In the preceding sections, we have focused on techniques that involve measur-ing a sessile liquid drop on flat solid surfaces, which is the most common systemfor contact angle measurements. The following sections describe other systems andmethods, including measurements of contact angles on solid samples that have dif-ferent geometric forms (e.g., plates, fibers, and powders).

10 Y. Yuan and T.R. Lee
Fig. 1.6 Illustration of thetilting plate method
1.3.2 Captive Bubble Method
Instead of forming a liquid sessile drop above the solid sample, an air bubble canbe formed beneath the solid sample, which is immersed in the testing liquid. Thecontact angle formed by the air bubble in liquid can also be directly measured. Thetechnique was introduced by Taggart et al. [58], and is now widely referred to as the“captive bubble method”. Typically, a small amount of air (about 0.05 ml) is injectedinto the liquid of interest to form an air bubble underneath the solid surface. Similarto the sessile drop method, the needle should remain in the bubble so as not todisturb the balance of the advancing angle and also to keep the bubble from driftingover the solid surface in case the plate is not perfectly horizontal. The captive bubblemethod has the advantage of ensuring that the surface is in contact with a saturatedatmosphere. It also minimizes the contamination of the solid-vapor interface fromsources such as airborne oil droplets. Furthermore, it is much easier to monitor thetemperature of the liquid in the captive bubble method than with sessile drops, whichmakes it possible to study the temperature-dependence of contact angles. On cleansmooth polymeric surfaces, good agreement has been observed between sessile dropand captive bubble contact angles [59]. However, due to the nature of the method,the captive bubble method requires far more liquid than the sessile drop method. Itcan also be problematic when the solid swells after immersion into the liquid, or afilm on the solid is dissolved by the liquid.
1.3.3 Tilting Plate Method
The tilting plate method developed by Adam and Jessop [60] was once favored dueto its simplicity and relatively lesser dependence on the operator’s subjectivity. Inthis method, a solid plate with one end gripped above the liquid is rotated toward theliquid surface until the end of the plate is immersed in the liquid, forming a menis-cus on both sides of the plate. The plate is then tilted slowly until the meniscusbecomes horizontal on one side of the plate (Fig. 1.6). The angle between the plateand the horizontal is then the contact angle of interest. An error of ±5° was reported,which was attributed to liquid contamination. The disturbance of the liquid by the

1 Contact Angle and Wetting Properties 11
Fig. 1.7 Illustration of theWilhelmy balance method
rotating solid plate and the requirement of considerable skills remain the major dif-ficulties in the measurement. Fowkes and Harkins [61] improved the accuracy of themethod by using glass barriers to clean the surface and a film balance to detect thepresence of impurities on the liquid surface. They also used a microscope with aneyepiece to ensure the edge of the solid-liquid intersection lay on the axis of rota-tion. This method has also been used to measure small contact angles (less than 10°)[62]. Smedley and Coles [63] employed a scanning laser beam with the tilting platetechnique to study the moving contact line, with the intention of making accuratemeasurements of the contact angle. The technique demonstrates high accuracy andpotential to determine the velocity-dependence of dynamic contact angles automat-ically. Bezuglyi et al. [64] substantially enhanced the precision and reproducibilityof the tilting plate technique by applying a high sensitivity thermocapillary (TC)response to the static curvature of the liquid meniscus.
1.3.4 Wilhelmy Balance Method
The Wilhelmy balance method [65] is a widely used technique that indirectly mea-sures contact angle on a solid sample. When a thin, smooth, vertical plate is broughtin contact with a liquid, the change in its weight is detected by a balance. The de-tected force change on the balance is a combination of buoyancy and the force ofwetting (the force of gravity remains the same). The wetting force f is defined as(Fig. 1.7):
f = γlvp cos θ (1.3)
where γlv is the liquid surface tension, p is the perimeter of contact line (i.e., thesame as the perimeter of solid sample’s cross-section) and θ is the contact angle.Consequently, the total detected force change F on the balance is:
F = γlvp cos θ − V Δρg (1.4)
where V is the volume of the displaced liquid, Δρ is the difference in density be-tween the liquid and air (or a second liquid), and g is the acceleration of gravity.

12 Y. Yuan and T.R. Lee
Fig. 1.8 A submersion cycle for the Wilhelmy balance measurement: (1) The sample approachesthe liquid, and the force/length is zero. (2) The sample is in contact with the liquid surface, forminga contact angle θ < 90°; the liquid rises up, causing a positive wetting force. (3) The sample isimmersed further, and the increase of buoyancy causes a decrease in the force detected on thebalance; the force is measured for the advancing angle. (4) The sample is pulled out of the liquidafter having reached the desired depth; the force is measured for the receding angle
Thus, as long as the liquid surface tension and the solid perimeter are known, thecontact angle value can be readily calculated. In rare cases, when the contact an-gle is zero and the perimeter is known, the measured force is related directly to theliquid surface tension. A technique developed by Princen [66] enables obtaining azero contact angle in order to measure liquid surface tension by Wilhelmy balancemethod.
As the solid sample is pushed into or pulled out of the liquid, an advancing orreceding contact angle can be established, respectively. The entire process will ap-pear as illustrated in Fig. 1.8. The Wilhelmy balance technique is an indirect forcemethod. It has several advantages over conventional optical methods. First, the taskof measuring an angle is reduced to the measurements of weight and length, whichcan be performed with high accuracy and without subjectivity. Second, the mea-sured force at any given depth of immersion is already an averaged value. Althoughthis feature does not help determine the heterogeneity, it does automatically give amore accurate contact angle value that reflects the property of the entire sample. Inaddition, the graph produced by this technique (Fig. 1.8) is useful for studying dy-namic contact angles and contact angle hysteresis at different wetting speeds. Thesmoothness of the curve indicates the heterogeneity of the solid sample. It is evenpossible to study absorption or surface reorientation by repeating the submersioncircle. However, the method also suffers from several drawbacks. The solid sam-ple must be produced with a uniform cross section in the submersion direction.Rods, plates, and fibers with known perimeters are ideal samples, but it is some-times difficult to measure the perimeter and the wetted length precisely. Other thanregular geometries, the sample must have the same composition and topographyat all sides, which might be difficult to meet, particularly if one wants to inves-tigate films or anisotropic systems. Also, a sufficient quantity of liquid must beused, which might cause the solid sample to swell and/or absorb vapor unintention-ally.

1 Contact Angle and Wetting Properties 13
1.3.5 Capillary Rise at a Vertical Plate
When a liquid comes in contact with a vertical and infinitely wide plate, it will risedue to the capillary effect. The height of capillary rise h can be determined by theintegration of the Laplace equation [67]:
sin θ = 1 − Δρgh2
2γlv
(1.5)
where Δρ is the difference in density between liquid and vapor, g is the accelera-tion due to gravity, and γlv is the liquid surface tension. Plates that are about 2 cmwide satisfy the theoretical requirement of being “infinitely” wide. The Wilhelmybalance method can be modified to measure the capillary rise h, in order to deter-mine the contact angle θ [68, 69]. Dynamic contact angles are achieved by movingthe plate up or down. This method has been widely used, and has proved to be par-ticularly suitable for measuring the temperature-dependence of contact angles [70].The method has been automated by Budziak and Neumann [71], and Kwok et al.[72]. For a specially prepared surface that forms a straight meniscus line, an accu-racy of ±0.1° can be obtained. This technique also inherited most of the advantagesand disadvantages of Wilhelmy balance method. In addition, (1.4) and (1.5) can becombined through the relation sin2 θ + cos2 θ = 1, making it possible to determineboth contact angle and liquid surface tension at the same time [73–75].
1.3.6 Individual Fiber
The direct measurement of contact angles on fibers has been attempted by Schwartzand co-workers [76, 77]. They suspended an individual fiber horizontally in the fieldof a microscope, and used a goniometer eyepiece to measure the contact angles ofdrops deposited on the fiber. Rotating the fiber along its longitudinal axis yielded ap-proximate advancing and receding contact angles accordingly. Bascom and Romans[78] improved this method by placing a small platinum ring to hold the liquid drop,and passed a glass filament vertically through the center of the drop. Both advancingand receding contact angles were measured with a microscope as the filament waspulled through the stationary drop. Roe [79] has computed the equilibrium shapesof drops resting on fibers having different diameters. It was shown that the apparentcontact angle can become misleading if the drop diameter is much larger than thatof the fiber. Due to the small dimensions, large uncertainties exist because the dropcurvature and the weight of the drop distort the profile where the fiber and liquidintersect. The equilibrium meniscus near a floating fiber on a liquid can also be usedto calculate the contact angle [80–82]. The reflection method developed by Fort andPatterson has also been used to measure contact angles on fibers [56]. However, inpractice, the relatively small depth of immersion can make it difficult to obtain goodaccuracy.

14 Y. Yuan and T.R. Lee
Fig. 1.9 Illustration of acapillary tube immersed in aliquid
The above mentioned Wilhelmy balance method is probably the most reliabletechnique for measuring contact angles on individual fibers of known diameter. Theprecise value of the fiber diameter can be determined by using a liquid of knownsurface tension to wet the fiber completely (i.e., zero contact angle). Given thatcos θ = 1, the perimeter p of the fiber can be calculated from (1.4). Similar to thesolid plate used in Wilhelmy balance method, a continuous immersion circle of thefiber in the liquid can also be used to test the homogeneity of the fiber surface.
1.3.7 Capillary Tube
In circumstances when both the inside and outside surfaces of the capillary tubeare made of the exact same material, the Wilhelmy balance method can be used tomeasure the contact angle. The perimeter p of the capillary tube should be the sumof the inner and outer perimeters. In general, the Wilhelmy balance method can beapplied to a wide range of plates, rods, wires, tubes, and capillaries.
For a vertical capillary with a sufficiently narrow circular cross section, themeniscus might be considered as spherical, and the capillary rise, h, is given by(Fig. 1.9):
h = 2γlv cos θ
Δρgr(1.6)
where r is the capillary radius, g is the acceleration constant of gravity, and Δρ isthe difference in density between the liquid and vapor. The contact angle can becalculated using the values of experimentally measured h and r . If r is too small,it can be calculated from the length of the capillary occupied by a known massof mercury. This relationship between contact angle, capillary height, and radiusis known as the Jurin rule, named after James Jurin, who studied this effect in1718. For relatively wide and transparent tubes, the above-mentioned Langmuir-Schaeffer reflection technique might also be used to directly measure the contactangle [83].

1 Contact Angle and Wetting Properties 15
1.3.8 Capillary Penetration Method for Powders and Granules
The wetting behavior of powders and granules also involves contact angle phenom-ena, but it is complicated by the presence of a porous architecture. Although alter-native methods have been employed to characterize porous architectures, contactangle remains the primary tool.
Direct measurement of contact angles on an individual powder or granule isalmost impossible by conventional methods. Instead, the powders or granules arecompressed into a flat cake, to which liquid drops are applied, and contact anglesare measured [84–89]. However, due to the inherent porous architecture of com-pressed powder cakes, “spontaneous” liquid penetration might occur if the actualcontact angle between the liquid and the solid is lower than 90°. Moreover, the ac-tual rate of penetration might vary largely depending on the actual wettability andthe porous structure. It might occur slowly enough that reproducible results can beobtained through direct measurement; or it might happen rapidly and give unstableresults. Microscopic examination shows that the surfaces of compressed powdersare porous, and it has been demonstrated thermodynamically that the contact angleon a porous surface is higher than on a smooth surface with the same composition[90]. The data can also be influenced by surface roughness [91, 92], particle swelling[55], and tablet porosity [61, 93]. Furthermore, during sample preparation, the top-most powder particles are likely to undergo plastic deformation by the compression,which might give different results than the uncompressed powders [61]. In addition,if the powder is slightly soluble in the measuring liquid, drops of solution saturatedwith the powder are used instead of the pure liquid [94].
The capillary penetration method was developed by Washburn [95], who mon-itored the rate at which a liquid penetrates into a compressed powder cake. Themeasurement was achieved by recording the depth of the liquid front intrusion asa function of time. The contact angle can then be deduced according to Washburntheory:
l2 = rtγlv cos θ
2η(1.7)
where l is the depth of liquid intrusion, γlv is the liquid surface tension, θ is thecontact angle, η is the liquid viscosity, t is the time required for penetration, andr represents the pore radius. Numerous qualitative measurements have been per-formed, and the method has been developed theoretically [96–98].
Static measurements were originally proposed by Bartell and co-workers [99–101], whose theory has been significantly extended by White [102]. The wetting liq-uid penetrates upward vertically through a compressed powder cake, until it reachesa height at which the capillary pressure balances the weight of the liquid in the col-umn. This method involves measuring the pressure necessary to balance the Laplacepressure, which drives liquid into a capillary bed:
ΔP = 2γlv cos θ
r(1.8)

16 Y. Yuan and T.R. Lee
where ΔP is the pressure difference, γlv is the liquid surface tension, θ is the contactangle, and r is the pore radius.
Both Washburn’s and Bartell’s methods suffer from the common drawback thatthe effective pore radius r is not constant from point to point in the powder bed.White [102] defined the effective capillary radius reff in the following way:
reff = 2(1 − φ)
φρA(1.9)
where φ is the volume fraction of solid in the packed bed, ρ is the density of the solidmaterial, and A is the specific surface area per gram of solid. Combining (1.8) and(1.9) yields the Laplace-White equation, which is a strict thermodynamic expressionfor ΔP in porous media:
ΔP = γlv cos θφAρ
1 − φ(1.10)
For clean and chemically treated smooth glass beads, a broad agreement betweenWhite’s theory and experimental data has been obtained [103]. However, it can berather problematic to determine reff directly due to the uncertainty in measuring thespecific wetted area of the particles.
Diggins and co-workers [104, 105] used a second liquid that fully wet the pow-der, and compared its wetting behavior with the liquid of interest. Cyclohexane, witha low surface tension of 25.5 mN/m, is the most commonly used reference liquid.Prestidge and Ralston [106] reported that the success of the method relies on thecorrect choice of the reference liquid.
Kwok and Neumann [107] stated that, although the contact angles obtained onpowder surfaces are usually not identical to Young’s contact angles, the actual mea-sured angles, along with the surface tension of the specific contacting liquid, deter-mine the Laplace pressure ΔP , which indicates the capillary penetration. In otherwords, it is the actual contact angle that determines the wetting behavior of thissystem.
Alternatively, the so-called h–ε method proposed by Kossen and Heertjes [108,109] can be used to obtain contact angles on compressed powders. This methodis based on the assumption that the powder consists of identical spheres. After thepowder is compressed into a cake, it is saturated with the probe liquid, and a dropis placed on the surface. The contact angle is calculated from the height of the drop,the cake porosity, and the density and surface tension of the liquid.
Subrahmanyam and co-workers [110] compared the contact angles of quartz bythe capillary penetration method and the captive bubble method. These studies foundthat the capillary penetration method gave results that showed a better correlationwith floatability than the captive bubble method.
1.3.9 Capillary Bridge Method
Restagno et al. [111, 112] developed a high-precision contact angle measuring tech-nique, which they referred to as the “capillary bridge method”. In their experiment,
1 Contact Angle and Wetting Properties 17
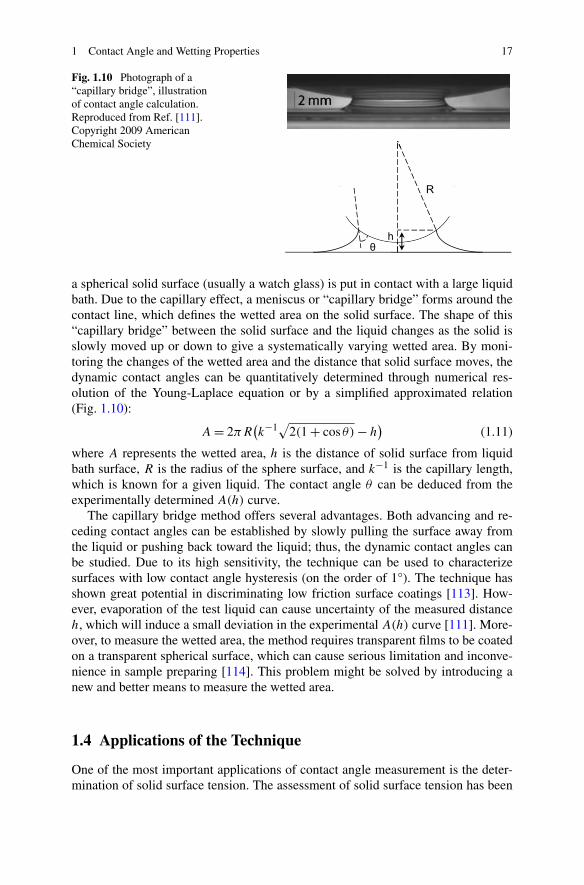
Fig. 1.10 Photograph of a“capillary bridge”, illustrationof contact angle calculation.Reproduced from Ref. [111].Copyright 2009 AmericanChemical Society
a spherical solid surface (usually a watch glass) is put in contact with a large liquidbath. Due to the capillary effect, a meniscus or “capillary bridge” forms around thecontact line, which defines the wetted area on the solid surface. The shape of this“capillary bridge” between the solid surface and the liquid changes as the solid isslowly moved up or down to give a systematically varying wetted area. By moni-toring the changes of the wetted area and the distance that solid surface moves, thedynamic contact angles can be quantitatively determined through numerical res-olution of the Young-Laplace equation or by a simplified approximated relation(Fig. 1.10):
A = 2πR(k−1
√2(1 + cos θ) − h
)(1.11)
where A represents the wetted area, h is the distance of solid surface from liquidbath surface, R is the radius of the sphere surface, and k−1 is the capillary length,which is known for a given liquid. The contact angle θ can be deduced from theexperimentally determined A(h) curve.
The capillary bridge method offers several advantages. Both advancing and re-ceding contact angles can be established by slowly pulling the surface away fromthe liquid or pushing back toward the liquid; thus, the dynamic contact angles canbe studied. Due to its high sensitivity, the technique can be used to characterizesurfaces with low contact angle hysteresis (on the order of 1°). The technique hasshown great potential in discriminating low friction surface coatings [113]. How-ever, evaporation of the test liquid can cause uncertainty of the measured distanceh, which will induce a small deviation in the experimental A(h) curve [111]. More-over, to measure the wetted area, the method requires transparent films to be coatedon a transparent spherical surface, which can cause serious limitation and inconve-nience in sample preparing [114]. This problem might be solved by introducing anew and better means to measure the wetted area.
1.4 Applications of the Technique
One of the most important applications of contact angle measurement is the deter-mination of solid surface tension. The assessment of solid surface tension has been

18 Y. Yuan and T.R. Lee
of much fundamental and practical interest for decades [115–120]. However, solidsurface tension cannot be directly measured since most existing techniques for sur-face tension measurement rely on surface deformation, which is difficult in the caseof a solid. Several indirect methods have been developed for the assessment of solidsurface tension [121], among which contact angle measurement is considered to bethe simplest.
Young’s equation (1.1) reveals the correlation between contact angle and inter-facial tensions. It suggests that the observation of the equilibrium contact angle ofliquid on solid might be a starting point for investigating the solid surface tension.However, there are only two measurable quantities in Young’s equation: the contactangle θ and the liquid surface tension γlv . To determine γsv and γsl , an additionalrelation between these quantities must be established.
The pioneering work of interpreting contact angles in terms of solid surface ten-sion was carried out by Zisman and co-workers [122], who conducted numerousstudies about contact angles of high-energy liquids on low-energy solid surfaces.They found out that for a given solid, the measured contact angles do not vary ran-domly upon change of the testing liquid. Instead, the change of cos θ versus liquidsurface tension γlv falls into a linear trend for a homologous series of liquids such asalkanes on Teflon. In addition, extrapolation of the linear curve to where cos θ = 1gives an important parameter, the critical surface tension γc. Theoretically, a liquidwith a surface tension equal or less than γc would wet the solid surface completely(θ = 0°).
Subsequent to Zisman’s work, two main groups of thoughts have developed:the surface tension components theory and the equation of state theory. Numerousmethods of determining solid surface tension have been developed following theseconsiderations. For example, Neumann and co-workers [123] measured the contactangles of a large number of liquids on solid surfaces, from which they acquired asmooth curve by plotting γlv versus γlv cos θ . The curve moves in a regular waywhen γsv is changed, indicating γlv cos θ is dependent on γlv and γsv , which givesthe equation of state:
γlv cos θ = f (γlv, γsv) (1.12)
Combining (1.12) with Young’s equation (1.1), we have:
γsl = γsv − f (γlv, γsv) = f ′(γlv, γsv) (1.13)
As mentioned previously in Sect. 1.2.2, many experimentally accessible contactangles are not equal to Young’s contact angle, and are therefore meaningless interms of interpreting surface tension through Young’s equation. Kwok and Neumann[121] developed experimental procedures and general criteria for measuring andinterpreting meaningful contact angles in terms of Young’s equation (1.1). Theirwork emphasizes that obtaining meaningful contact angles for the determinationof solid surface tension depends heavily on how contact angles are measured andwhether or not widely made assumptions have been violated. The assumptions are[121] (directly from the original text):

1 Contact Angle and Wetting Properties 19
1. All approaches rely on the validity and applicability of Young’s equation forsurface energetic from experimental contact angles.
2. Pure liquids are always used; surfactant solutions or mixtures of liquids shouldnot be used, since they would introduce complications due to preferential adsorp-tion.
3. The values of γlv , γsv , and γsl are assumed to be constant during the experiment,e.g. there should be no physical/chemical reactions between the solid and theliquid.
4. The surface tensions of the test liquids should be higher than the anticipated solidsurface tension.
5. The values of γsv in going from liquid to liquid are also assumed to be constant,e.g. independent of the liquids used.
In summary, the solid surfaces are required to be rigid, smooth, homogeneous,and inert to the testing liquids. Advancing angles should be used instead of recedingangles, so as to minimize the possible swelling and physical/chemical effects. Kwokand Neumann [121] also pointed out that many results from the literature, such asnon-rigid gels [124] and non-smooth biological surfaces [125], are open to questiondue to violations of the assumptions.
1.5 Recent Developments of the Technique
1.5.1 Drop Shape Analysis
Numerous methods have been developed to determine the liquid surface tension andcontact angle from the shape of a sessile drop, pendant drop, or captive bubble. Ide-ally, the shape of a liquid drop depends on the combined effects of interfacial andgravitational forces. Surface tension tends to minimize the surface area by makingthe drop spherical, while gravity deforms the drop in two ways: (1) by elongating apendant drop and/or (2) flattening a sessile drop. This balance between surface ten-sion and external forces (such as gravity) is reflected mathematically in the Laplaceequation of capillarity, which offers the possibility of determining surface tensionby analyzing the drop shape.
During the early years of contact angle measurement, the θ/2 method was oncewidely used to analyze the profile of a sessile drop. In this analysis, the liquid dropis assumed to be part of a sphere. Geometrically, the contact angle can be calculatedby measuring the drop diameter and the height of the apex (Fig. 1.11):
θ
2= tan−1
(h
d
)(1.14)
This method yields reasonable results when the liquid drop is extremely small.However, the spherical shape assumption cannot be applied if the drop shape is largeenough to be affected by gravity.

20 Y. Yuan and T.R. Lee
Fig. 1.11 Demonstration ofthe θ/2 method accordingto (1.14)
Bashforth and Adams [126] were the first to use the Laplace equation to analyzethe shape of droplet profiles. They manually generated a collection of sessile dropprofiles according to different values of surface tension and the radius of curvature atthe drop apex. Consequently, the task of determining surface tension became sim-ple interpolation from their tables. Their tremendous contribution led to boomingdevelopment in the area. Blaisdell [127], as well as Tawde and Parvatikar [128] ex-tended the Bashforth and Adams tables. Fordham [129] and Mills [130] generatedequivalent tables for pendant drops. Ever since digital computers became popular,drop shape analysis has been greatly improved, and many new methods have beendeveloped [131–141].
1.5.2 Axisymmetric Drop Shape Analysis (ADSA)
During the past three decades, significant improvements were made in hardwaredesign and computational technology, which has led to considerable developmentof drop shape analysis for surface science. The axisymmetric drop shape analy-sis (ADSA) method that was developed by Rotenberg et al. [142], improved bySpelt et al. [143], Cheng at al. [144], Río [145], and Kalantarian et al. [146] isbelieved to be one of the most accurate techniques for high precision contact an-gle measurement. With a reproducibility of ±0.2°, the ADSA method has beenshown to improve the accuracy of contact angle measurement by essentially an or-der of magnitude, compared to the reproducibility of ±2° by direct tangent mea-surements.
The basic principle of the ADSA method is to find the best theoretical profilethat matches the drop profile extracted from an experimental image, from whichthe surface tension, contact angle, drop volume, and surface area can be computed.There are two main assumptions in the ADSA method: (1) the experimental drop isLaplacian and axisymmetric, and (2) gravity is the only external force. Surface ten-sion is used as an adjustable parameter, and the algorithm searches for the specificvalue of surface tension that produces the best theoretical profile that fits the exper-imental drop profile. The first generation of the axisymmetric drop shape analysis-profile (ADSA-P) method was developed by Rotenberg et al. [142]. In this method,an objective function is defined as the sum of the squares of the normal distancesbetween experimental profile points and corresponding theoretical profile points.The matching is achieved by minimizing the objective. It should be noted that ex-tracting drop interface coordinates was performed manually in the first generation

1 Contact Angle and Wetting Properties 21
ADSA. Cheng et al. [144] improved the first generation ADSA-P method by imple-menting a computer-based edge operator, Sobel [147], to extract the drop interfaceprofiles automatically. Optical distortion correction techniques were also incorpo-rated into the ADSA-P program to achieve better accuracy. The first generationADSA-P method was found to give accurate results except for large and flat sessiledrops, where the program failed due to the flatness of the apex.
Rio and Neumann [145] developed the second-generation ADSA-P method byintegrating more efficient algorithms. They also used the curvature at the apex in-stead of the radius of curvature at the apex as a parameter, so as to overcome theapex limitation in the first generation ADSA-P. The vertical location of the solidsurface was determined to pixel resolution from the digitized drop image.
Another branch of the ADSA method—the axisymmetric drop shape analysis-diameter (ADSA-D)—was developed to measure extremely low contact angles (lessthan 20°) or contact angles on non-ideal surfaces [148, 149]. Quite different fromthe ADSA-P method, the ADSA-D program analyzes a top view image of the dropand measures the contact diameter. Once the contact diameter, liquid surface ten-sion, and volume of the drop are known, the contact angle can be determined fromnumerical integration of the Laplace equation of capillarity. It has been claimed thatthe contact angle results obtained by the ADSA-D and ADSA-P methods closelyagree, varying no more than ±0.4°, for which ADSA-D gives a higher precision forlow contact angles [148, 149]. However, Rodriguez-Valverde and co-workers [150]reported that quantification of the effects of surface roughness in contact angle mea-surements is unwieldy and controversial. They asserted that the equilibrium contactangle cannot be measured due to the existence of metastable states and a strongdependence on drop size.
A new drop shape analysis method called theoretical image fitting analysis(TIFA) was introduced by Cabezas et al. [151, 152]. The main difference betweenTIFA and ADSA is that TIFA fits the whole two-dimensional theoretical projec-tion to the experimental image, instead of ADSA fitting only a one-dimensionaltheoretical profile curve to the experimental image. TIFA operates without us-ing edge detection algorithms. Further, it employs an error function that mea-sures pixel-by-pixel differences between the theoretical and experimental images,which are then minimized so as to fit theoretical image to the experimental im-age.
Both ADSA and TIFA suffer from a common limitation: the necessity of usingthe apex of the drop as part of the drop image analysis. For this reason, the mostwidely used system of a liquid drop with the needle immersed at the apex cannot beapplied. Instead, drops must be formed from below the solid surface through a hole.This complication has led to the development of new versions of both methods:the TIFA-AI (theoretical image fitting analysis for axisymmetric interfaces) method[153] developed by Cabezas et al., and the ADSA-NA (axisymmetric drop shapeanalysis-no apex) method developed by Kalantarian et al. [146]. With TIFA-AI,the geometry of the interface at a reference level different from the apex is usedto solve the Laplace equation. The radius of the profile and its inclination at thereference level are defined as two additional optimization parameters. ADSA-NA

22 Y. Yuan and T.R. Lee
is also able to analyze the shape of axisymmetric interfaces without using apexcoordinates. A recent study shows that the contact angle data obtained using thesetwo new methods agree within ±0.1° [146].
1.5.3 Contact Angle Measurement of Ultrasmall Droplets
Wetting phenomena have been extensively investigated and well understood at themacroscale (millimeters); while the wetting behavior at the micro- or nanoscale(micro- or nanometers) has yet to be thoroughly studied, and many issues remainunresolved. The study of ultrasmall droplets on solid surfaces allows wetting theo-ries to be tested down to the nanoscale, where the wetting behavior is significantlyinfluenced by line tension and liquid evaporation (both are usually negligible inmacroscale studies). These studies have relevance to many industrial applications,such as friction in microelectromechanical systems (MEMS) devices [154], flotationin mineral recovery [155], and wastewater treatment [156].
At the micro- or nanoscale, it is possible to take advantage of the fact that theinfluence of gravity is negligible compared to the influence of surface tension; con-sequently, the droplet can be approximated as part of a sphere [157]. There are, how-ever, complications due to the small size. As the drop becomes smaller, the effectof the line tension at the three-phase contact line becomes larger compared to theeffect of surface tension [158, 159]. For micro- or even nanometer-sized droplets,the line tension can significantly affect the measured contact angle [160]. Thus, atmicro- and nanoscales, the classical Young’s equation must be modified, which isusually done by adding a second term to take the line tension effect into account[159–161]:
cos θ∞ = γsv − γsl
γlv
(1.15)
cos θR = cos θ∞ − σγlv
R(1.16)
In these equations, θ is the contact angle, and the subscripts, R and ∞ indicate theradius of the droplet. The quantity γ is the surface tension, σ is the line tension ofthe three-phase system, and R is the radius of the drop at the surface. The subscriptss, l, and v indicate the solid, liquid, and vapor phases, respectively.
Another problem associated with small droplets is the effect of evaporation,which is especially problematic when working with atomic force microscopy(AFM), because AFM requires at least 15–30 min to produce a stable image. Pick-nett and Bexon [162] studied the changes of droplet profile during evaporation. Theyfound that there exist two stages: a first “constant contact area” phase dominatesuntil the contact angle decreases to certain value, at which point a second “con-stant contact angle” phase dominates thereafter. This model has been supported bySoolaman and Yu [163], who reported that the evaporation of water microdropletsprogresses from the pinning stage (decreasing contact angle, constant contact area)

1 Contact Angle and Wetting Properties 23
Fig. 1.12 Interference method for measuring microscale contact angles. (a) Interference fringes inwater droplets on ethanol-cleaned glass (image size 129 × 115 µm2); the contact angles indicatedfor the droplets. (b) Intensity profile along the dotted line in (a) and inset that shows a magnificationof the droplet analyzed (image size 44 × 38 µm2). (c) Drop profile with circular curve fitted to thedata from the dashed line in (a). Reproduced from Ref. [174]. Copyright 2007 Elsevier Science
to the shrinking stage (constant contact angle, decreasing contact area). Therefore,the evaporation effect must be taken into consideration when interpreting micro-and nanodroplets profiles.
Several methods for measuring the contact angles of ultrasmall droplets havebeen reported thanks to the availability of advanced imaging techniques such as in-terference microscopy, confocal microscopy, environmental scanning electron mi-croscopy (ESEM), and AFM to establish the droplet profiles [164–171]. Interferencemicroscopy method utilizes the fringe patterns formed by the interfering beams re-flected from the solid-liquid and the liquid-vapor interfaces to calculate the contactangle value. It is best suited for droplets with low contact angles (less than 30°),in which case individual interference fringes are readily resolved. Jameson and DelCerro [172] used this technique for cases in which the underlying phase is transpar-ent. Fischer and Ovryn [173] improved the technique by developing a geometrical-optics-based model to interpret the optical path length through a thick refractivespecimen.
Confocal microscopy, on the other hand, is best suited for droplets with highercontact angles (30–90°) since such droplets have greater heights, thus allowing thecollection of a larger number of image slices from which the drop profile can bereconstructed. Sundberg et al. [174] recently used a combination of interferencemicroscopy and confocal fluorescence microscopy to study the contact angles ofmicrometer-sized nucleated water droplets (Fig. 1.12). The method was designedfor measuring both low (< 30°) and high (30–90°) contact angles. For droplets dis-playing low contact angles, the profiles can be reconstructed from the interferencepatterns, whereas for contact angles too high to allow resolution of interferencefringes, a low concentration of fluorescent dye was mixed with water to allow the

24 Y. Yuan and T.R. Lee
recording and analysis of 3D image stacks. The results were compared with con-tact angles of macroscopic (millimeter scale) droplets, and a dependence of contactangle on droplet sizes was found. At small radii (below 10 µm), the contact anglesobtained are larger than the macroscopic contact angles, indicating a positive linetension effect. When the radii of the droplets are more than 10 µm, the averagecontact angles on microscopic droplets are largely the same as their macroscopiccounterparts. In general, interference and confocal methods can measure dropletswith diameters of about 10 to 100 µm. New techniques with higher resolution areneeded for nanoscale measurements.
A number of methods have been developed to deposit micro- and nanoscale liq-uid droplets on surfaces. The simplest way is to use an air sprayer [175], which gen-erates ultrasmall droplets by mixing macroscale droplets with a jet of compressedair. Commercially available atomizers are able to spray ultrafine droplets with a widerange of sizes. Hong et al. [176] used micropipettes with submicron orifices to createsubmicron-sized droplets. Jayasinghe and Edirisinghe [177] used electrospraying togenerate charged liquid droplets with diameters less than 1 µm. Similar methodshave also been used by Paine et al. [178] and by Adhikari and Fernando [179].Fine-emulsions and nano-emulsions formed by two immiscible phases can generatesignificantly smaller droplets (between 100 and 1000 nm) [180]. Zhang and Ducker[181] successfully observed ultrasmall interfacial oil nanodroplets of decane (height2–50 nm) formed at the solid/liquid interface by direct adsorption from an emulsion.A syringe pump has also been used to create microdroplets [182]. However, with allof the aforementioned methods, control over the size of the droplet presents a chal-lenging problem.
To address this problem, Meister et al. developed a nanoscale dispensing(NADIS) technique by modifying a commercially available silicon nitride (Si3N4)AFM probe tip and using it to transfer liquid from the tip to the surface by directcontact [183, 184]. Here, the size of the deposited droplet is controlled by the aper-ture width of the hollow AFM tip. The NADIS technique is able to create dropletswith controlled sizes to measure the contact angle at micro- or nanoscales [185].Jung and Bhushan [186] have used the NADIS technique to deposit micro- andnanodroplets of a glycerol/water mixture on different surfaces, followed by mea-suring the contact diameter, thickness, and volume of the droplet with an AFM todetermine the contact angles. Fang et al. [187] have shown that tips with an aper-ture diameter of 35 nm were able to deposit nanodroplets of glycerol-based liquidswith diameters down to 70 nm and to form regular arrays on silica surfaces withdifferent hydrophilicities. Importantly, fine control of the droplet volume is alsopossible.
As mentioned previously, the capillary penetration technique based on Wash-burn’s theory is the most frequently used technique for determining contact angleof particles. However, there exists an inherent limitation—it only gives an averagedcontact angle value and thus cannot describe the wetting behavior of individual pow-ders. In recent years, AFM has been used to study the contact angle of individualparticles by measuring the interaction forces between a spherical colloidal particleand a bubble in aqueous solution [188–192]. The contact region of the AFM force
1 Contact Angle and Wetting Properties 25
curve is used to establish the position of zero force, which gives the depth of theparticle penetration into the bubble. The data can then be used to calculate the con-tact angle. In this way, the intrinsic hydrophobic properties of an individual particlecan be revealed. It is also worth mentioning that soft surfaces can sometimes deformduring AFM force measurements [193–195]. Furthermore, Nguyen and co-workers[196] observed that the contact angle measured by AFM changes with the speedof the piezoelectric translator, showing that the measurements were generally dy-namic. However, it cannot be decided whether or not the measured contact angle ona single particle indicates the hydrophobicity of the solid particle surface, since theposition of the three-phase contact area relative to the particle is unknown. In thecase of pinning of the three-phase contact, the determined contact angle does not en-tirely characterize the hydrophobic properties of the particle surface. Notably, workby Jung and Bhushan [186] using the AFM-based NADIS technique to measure thecontact diameter, thickness, and droplet volume gave contact angle values that werelower than those of corresponding macrodroplets.
Checco et al. [197] measured the contact angles of micro- and nanoscale alkanedroplets on a model substrate using non-contact AFM. They connected an enclosedchamber to the AFM head in order to mitigate evaporation. The large range ofdroplet sizes accessible allowed them to determine the contact line curvature depen-dence of the contact angles. The contact angle values were found to decrease whenthe droplet size decreased from macroscopic scales. Furthermore, they found thatthe modified Young’s equation fails to describe correctly the experimental data at asufficiently large range of droplet sizes, and used surface heterogeneity to explainthis shortcoming, which was further supported by numerical simulations. More re-cently, Checco et al. produced a nanoscale wettability pattern on a surface consistingof hydrophilic COOH-terminated and hydrophobic CH3-terminated lines (Fig. 1.13)[198]. The use of an evaporation-condensation chamber allows control of both thetemperature and the vapor concentration. By measuring the contact angle of ethanolnano-channels formed on the surface, they found that ethanol selectively wettedthe hydrophilic lines with an apparent contact angle at the stripe’s boundary of12° ± 1°, a value significantly lower than that measured macroscopically for anethanol droplet on the same surface (30° ± 1°).
Dupres et al. also used AFM to study the local wetting of human hair [199].For nonvolatile liquids, small droplets were directly deposited on the solid by usinga microsyringe; volatile liquids were deposited in a condensation chamber. Mostof the liquids tested have a higher surface tension γlv than the critical surface ten-sion γc; consequently, partial wetting is expected. However no spreading or dropnucleation was observed. Interestingly, more polar liquids such as water and glyc-erol failed to wet any region of the cuticle, although water seemed to penetrate intothe bulk of the hair fiber. Hydrocarbon liquids preferentially wetted the more polarcuticle edges. In a more recent report, Dupres and co-workers studied the changes inwettability of the cuticle when different covalently and non-covalently bound fattyacids present at the cuticle surface were selectively extracted [200].
Wang and co-workers [201, 202] used AFM to image sprayed water mi-crodroplets on polished metal surfaces. They found large differences between

26 Y. Yuan and T.R. Lee
Fig. 1.13 Condensation of ethanol onto COOH nanostripes for ΔT equal to: (a) 10 °C, (b) 0.5 °C,and (c) −15 °C (lateral scale 100 nm). (d) Cross-sectional profiles corresponding to (a) (solidline), (b) (dotted line), and (c) (dashed line). Reproduced from Ref. [198]. Copyright 2006 ElsevierScience
macroscale and microscale wettability, even on the same surface. While the con-tact angles of macroscale water droplets were found to be larger than those of mi-croscale water droplets, the scatter in the values of the microscale contact angleswas larger than those of the macroscale contact angles. Accordingly, the shapes ofthe droplets could not be maintained when the droplets become too small. The in-fluence of organic contaminants might contribute to this phenomenon. Organic con-taminants in general increase surface hydrophobicity, and their distribution might benon-uniform at the micro- and nanoscale. When droplets are obtained by conden-sation, there should be areas with little or no organic contamination, where waterpreferentially condensed, leading to reduced nanoscale contact angles. This ratio-nalization is consistent with the previously mentioned results by Checco et al. [197],who also suggested the possibility that small surface heterogeneities were responsi-ble for the observed decrease in contact angle when the droplet size was decreasedfrom 2 mm to 200 nm. ESEM has also been used as an imaging tool in the studiesof microwetting. Stelmashenko et al. [203] performed fundamental studies on theimaging of water droplets nucleated onto different standard surfaces. Lau et al. [204]used ESEM to verify their creation of a stable, superhydrophobic surface using thenanoscale roughness inherent in a vertically aligned carbon nanotube forest togetherwith a thin, conformal hydrophobic poly(tetrafluoroethylene) (PTFE) coating on thesurface of the nanotubes. Spherical water microdroplets formed by condensing va-por onto the surface can be suspended on top of the nanotube forest. The resultsconfirmed that the superhydrophobic characteristic is retained at the microscale. Ina related superhydrophobicity study, Cheng and Rodak [205] reported that lotusleaves lost their superhydrophobic character (“lotus effect”) when microscale waterdroplets were condensed on the leaf.

1 Contact Angle and Wetting Properties 27
Fig. 1.14 ESEM images of static, advancing, and receding contact angles of microscopic dropletsof water on flat and patterned Si surfaces. Reproduced from Ref. [206]. Copyright 2008 The RoyalMicroscopical Society
Recently, Jung and Bhushan [206] reported an ESEM study of the dynamic wet-ting of superhydrophobic surfaces. Static contact angles were measured once a dy-namic equilibrium between condensation and evaporation was achieved. Advancingcontact angles were obtained by cooling the substrate so as to increase the con-densation and grow the drop size. Conversely, receding angles were achieved byheating the substrate. Thus, the hysteresis was measured, which showed no obviousdifference compared to macroscopic droplets. The researchers found, however, thatthe hysteresis depended on the geometric characteristics of the patterned surface(Fig. 1.14).
ESEM has specific advantages for characterizing micro- and nanofibers, as fibershave two dimensions at the micro/nanoscale and one dimension at the macroscale.Conventionally, the Wilhelmy balance technique was used to evaluate the wettingproperties of fibers. A major limitation of this technique lies in the difficulty ofprecise measurement of the fiber perimeters, especially in the case of micro- andnanofibers. The use of ESEM can provide additional information at the sub-single-fiber level (Fig. 1.15) [207, 209].
Wettability studies at the micro- and nanoscale have paved the way for the de-velopment of wetting patterns. For example, it is possible to deposit droplets ontosurfaces to which a chemical or topographical micro- or nanoscale pattern is im-posed [208–216]. Wetting patterns, especially those obtained by patterning organicmolecules, are currently of great interest in the area of molecular-scale devices[217, 218]. Figure 1.16 shows work done by Seemann et al. [216], who created

28 Y. Yuan and T.R. Lee
Fig. 1.15 ESEM images of water microdroplets on polypropylene (PP) fibers: (a) untreated;(b) oxygen-plasma treated for 30 s; (c) oxygen-plasma treated for 60 s. Reproduced fromRef. [209]. Copyright 2004 Elsevier Science
grooves with rectangular cross sections in Si by photolithographic methods withdepths between 100 and 900 nm, and widths between 400 nm and 3 mm. Thesestudies introduced a global morphology diagram of clustering droplet geometriesthat depends on the aspect ratio of the groove geometry and the contact angle ofthe substrate. To sum up, these studies on wetting patterns have revealed the oc-currence of morphological wetting and dewetting transitions, which has promisingapplications in electrowetting, microfluidics, and nanodevice development.
1.6 Summary
In this report, the basic and advanced techniques used to characterize the wettabil-ity of materials at the macro-, micro-, and nanoscale have been described. As theimportance of wettability in both fundamental and applied fields has long been rec-ognized, innovative techniques for measuring the wettability of surfaces, powders,and fibers continue to emerge. Nevertheless, there are still many open questionsregarding wetting mechanisms and for manipulating the wetting behavior at themicro- and nanoscales. AFM and ESEM are currently the most relevant techniquesfor imaging ultrasmall droplets on surfaces. AFM provides high resolution at thenanometer scale, but is limited by long measurement times. For example, measure-ments by AFM routinely require 15–30 min to acquire a stable image, which can bea great disadvantage because some nanodroplets evaporate in seconds. ESEM, onthe other hand, collects images rapidly (in seconds), which circumvents evaporative

1 Contact Angle and Wetting Properties 29
Fig. 1.16 AFM images of liquid structures in grooves with rectangular cross section. Reproducedfrom Ref. [216]. Copyright 2005 National Academy of Science, USA
problems and allows the collection of dynamic contact angles. However, the reso-lution of ESEM is only at the micrometer scale. The use of a field emission gun(FEG) in ESEM is expected to diminish beam effects and enhance the resolutionto the nanometer range. As for AFM, there are current developments in both theelectronic and the data acquisition systems, as well as in the design of AFM probesoptimized for high-speed scanning (especially small cantilevers) [219]. Hopefully,we will witness these significant advances applied to future wettability studies andpractices.
Acknowledgements We acknowledge generous financial support from the National ScienceFoundation (DMR-0906727), the Robert A. Welch Foundation (Grant No. E-1320), and the TexasCenter for Superconductivity at the University of Houston.
References
1. K.N. Prabhu, P. Fernandes, G. Kumar, Mater. Des. 2, 297 (2009)2. X. Zhao, M.J. Blunta, J.J. Yao, Pet. Sci. Technol. Eng. 71, 169 (2010)3. Y.Q. Wang, H.F. Yang, Q.G. Hang, L. Fang, S.R. Ge, Adv. Mater. Res. 154–155, 1019 (2010)4. M. Sakai, T. Yanagisawa, A. Nakajima, Y. Kameshima, K. Okada, Langmuir 25, 13 (2009)5. Y. Son, C. Kim, D.H. Yang, D.J. Ahn, Langmuir 24, 2900 (2008)6. J. Perelaer, C.E. Hendriks, A.W.M. de Laat, U.S. Schubert, Nanotechnology 20, 165303
(2009)7. H. Yang, P. Jiang, Langmuir 26, 12598 (2010)8. B. Bhushan, Y.C. Jung, K. Koch, Langmuir 25, 3240 (2009)
30 Y. Yuan and T.R. Lee
9. M. Rauscher, S. Dietrich, Annu. Rev. Mater. Sci. 38, 143 (2008)10. K. Fei, C.P. Chiu, C.W. Hong, Microfluid. Nanofluid. 4, 321 (2008)11. Z. Keshavarz-Motamed, L. Kadem, A. Dolatabadi, Microfluid. Nanofluid. 8, 47 (2010)12. Y.S. Nanayakkara, S. Perera, S. Bindiganavale, E. Wanigasekara, H. Moon, D.W. Armstrong,
Anal. Chem. 82, 3146 (2010)13. A. Lafuma, D. Quere, Nat. Mater. 2, 457 (2003)14. J.H. Snoeijer, B. Andreotti, Phys. Fluids 20, 057101 (2008)15. T. Young, Philos. Trans. R. Soc. Lond. 95, 65 (1805)16. R.E. Johnson Jr., R.H.J. Dettre, Phys. Chem. 68, 1744 (1964)17. L.W. Schwartz, S. Garoff, Langmuir 1, 219 (1985)18. J.F. Joanny, P.G.J. de Gennes, Chem. Phys. 81, 552 (1984)19. J.W. Krumpfer, T.J. McCarthy, Faraday Discuss. 146, 103 (2010)20. L. Gao, T.J. McCarthy, Langmuir 22, 6234 (2006)21. A.W. Neumann, Adv. Colloid Interface Sci. 4, 105 (1974)22. D. Li, A.W. Neumann, in Applied Surface Thermodynamics, ed. by J.K. Spelt, A.W. Neu-
mann (Dekker, New York, 1996), p. 10923. R.V. Sedev, J.G. Petrov, A.W. Neumann, J. Colloid Interface Sci. 180, 36 (1996)24. R.N. Wenzel, Ind. Eng. Chem. 28, 988 (1936)25. S. Baxer, A.B.D.J. Cassie, Tex. Inst. 36, 67 (1945)26. J.K. Spelt, D.R. Absolom, A.W. Neumann, Langmuir 2, 620 (1986)27. B.B. Davidson, G.J. Lei, Polym. Sci. 9, 569 (1971)28. T.R. Krishman, I. Abraham, E.I. Vargha-Butler, Int. J. Pharm. 80, 277 (1992)29. C.D. Bain, E.B. Troughton, Y. Tao, J. Eval, G.M. Whitesides, R.O. Nuzzo, J. Am. Chem.
Soc. 111, 321 (1989)30. C.D. Bain, G.M. Whitesides, Angew. Chem. Int. Ed. 28, 506 (1989)31. E.F. Hare, E.G. Shafrin, W.A.J. Zisman, Phys. Chem. 58, 236 (1953)32. C.J. Budziak, E.I. Vargha-Butler, A.W.J. Neumann, Appl. Polym. Sci. 42, 1991 (1959)33. A. Dilks, B. Kay, Macromol. 14, 855 (1981)34. H.J. Yasuda, Polym. Sci. 16, 199 (1981)35. E.I. Vargha-Butler, M. Kashi, H.A. Hamza, A.W. Neumann, Coal Prep. 3, 53 (1986)36. H.J. Busseher, A.W.J. van Pelt, H.P. De Jong, J. Arends, J. Colloid Interface Sci. 95, 23
(1983)37. W.C. Bigelow, D.L. Pickett, W.A.J. Zisman, Coll. Sci. 1, 513 (1946)38. J. Leja, G.W. Poling, On the interpretation of contact angle, in Proceedings of the 5th Mineral
Processing Congress (IMM, London, 1960), p. 32539. R.W. Smithwich, J. Colloid Interface Sci. 123, 482 (1988)40. D.Y. Kwok, R. Lin, M. Mui, A.W. Neumann, Colloids Surf. A 116, 63 (1996)41. S. Brandon, N. Haimovich, E. Yeger, A. Marmur, J. Colloid Interface Sci. 263, 237 (2003)42. P. Letellier, A. Mayaffre, M. Turmine, J. Colloid Interface Sci. 314, 604 (2007)43. A.W. Neumann, R.J. Good, in Surface and Colloid Science: Experimental Methods, vol. 11,
ed. by R.J. Good, R.R. Stromberg (Plenum Publishing, New York, 1979), p. 3144. R.J. Hunter, Foundations of Colloid Science, 2nd edn. (Clarendon Press, Oxford, 2001)45. G. MacDougall, C. Ockrent, Proc. R. Soc. 180A, 151 (1942)46. C.W. Extrand, Y. Kumagai, J. Colloid Interface Sci. 184, 191 (1996)47. C.W. Extrand, Y. Kumagai, J. Colloid Interface Sci. 191, 378 (1997)48. E. Pierce, F.J. Carmona, A. Amirfazli, Colloids Surf. A 323, 73 (2008)49. B. Krasovitski, A. Marmur, Langmuir 21, 3881 (2005)50. W.A. Zisman, Adv. Chem. Ser. 87, 1 (1968)51. M.C. Phillips, A.C. Riddiford, J. Colloid Interface Sci. 41, 77 (1972)52. D.E. McIntyre, A study of dynamic wettability on a hydrophobic surface, Ph.D. Thesis, The
Institute of Paper Chemistry, Appleton, WI, 196953. W.J. Fenrick, Rev. Sci. Instrum. 35, 1616 (1964)54. L.R. Fisher, J. Colloid Interface Sci. 72, 200 (1979)55. I. Langmuir, V.J. Schaeffer, J. Am. Chem. Soc. 59, 2400 (1937)

1 Contact Angle and Wetting Properties 31
56. T. Fort, H.T. Patterson, J. Colloid Interface Sci. 29, 185 (1967)57. K.A. Johnson, D.O. Shah, J. Colloid Interface Sci. 107, 1 (1985)58. A.F. Taggart, T.C. Taylor, C.R. Ince, Trans. Am. Inst. Min. Metall. Pet. Eng. 87, 285 (1930)59. W. Zhang, M. Wahlgren, B. Sivik, Desalination 72, 263 (1989)60. N.K. Adam, G.J. Jessop, Chem. Soc. 127, 1863 (1925)61. F.M. Fowkes, W.D. Harkins, J. Am. Chem. Soc. 62, 337 (1940)62. A.L. Spreece, C.P. Rutkowski, G.L. Gaines Jr., Rev. Sci. Instrum. 28, 636 (1957)63. G.T. Smedley, D.E. Coles, J. Colloid Interface Sci. 286, 310 (2005)64. B.A. Bezuglyi, O.A. Tarasov, A.A. Fedorets, Colloid J. 63, 668 (2001)65. L.A. Wilhelmy, Ann. Phys. 119, 117 (1863)66. H.M. Princen, J. Colloid Interface Sci. 30, 69 (1969)67. J.C. Cain, D.W. Francis, R.D. Venter, A.W. Neumann, J. Colloid Interface Sci. 94, 123
(1983)68. M. Shimokawa, T. Takamura, J. Electroanal. Chem. Interfacial Electrochem. 41, 359 (1973)69. A.W. Neumann, Z. Phys. Chem. 41, 339 (1964)70. C.J. Budziak, E.I. Vargha-Butler, A.W. Neumann, J. Appl. Polym. Sci. 42, 1959 (1991)71. C.J. Budziak, A.W. Neumann, Colloids Surf. 43, 279 (1990)72. D.Y. Kwok, C.J. Budziak, A.W. Neumann, J. Colloid Interface Sci. 173, 143 (1995)73. D.D. Jordan, J.E. Lane, Austral. J. Chem. 17, 7 (1964)74. A.W. Neumann, W. Tanner, Tenside 4, 220 (1967)75. J. Kloubek, A.W. Neumann, Tenside 6, 4 (1969)76. A.M. Schwartz, F.W. Minor, J. Colloid Sci. 14, 572 (1959)77. A.M. Schwartz, C.A. Rader, Congr. Surface Activity Brussels 2, 383 (1964)78. W.D. Bascom, J.B. Romans, Ind. Eng. Chem. Prod. Res. Dev. 7, 172 (1968)79. R.J. Roe, J. Colloid Interface Sci. 50, 70 (1975)80. H.M. Princen, in Surface and Colloid Science, vol. 2, ed. by E. Matijevic (Wiley, New York,
1969), p. 181. A.V. Rapacchietta, A.W. Neumann, S.N. Omenyi, J. Colloid Interface Sci. 59, 541 (1977)82. A.V. Rapacchietta, A.W. Neumann, J. Colloid Interface Sci. 59, 555 (1977)83. R.J. Good, J.K. Pascheck, in Wetting, Spreading and Adhesion, ed. by F. Paddy (Academic
Press, New York, 1978), p. 14784. G. Zografi, S.S. Tam, J. Pharm. Sci. 65, 1145 (1976)85. C.F. Lerk, M. Lagas, J.P. Boelstra, P. Broersma, J. Pharm. Sci. 66, 1480 (1977)86. W.C. Liao, J.L. Zatz, J. Pharm. Sci. 68, 488 (1979)87. V. Steiner, G. Adam, Cell Biophys. 6, 279 (1984)88. E.I. Vargha-Butler, S.J. Sveinsson, Z. Policova, Colloids Surf. 58, 271 (1991)89. A.W. Neumann, D. Renzow, H. Reumuth, I.E. Richter, Colloid Polym. Sci. 55, 49 (1991)90. R. Shuttleworth, G.L.J. Bailey, Discuss. Faraday Soc. 3, 16 (1948)91. G. Buckton, J.M. Newton, Powder Technol. 46, 201 (1986)92. D.T. Hansford, D.J.W. Grant, J.M. Newton, Powder Technol. 26, 119 (1980)93. G. Buckton, J.M. Newton, J. Pharm Pharmacol. 37, 605 (1985)94. A. Stamm, D. Gissinger, C. Boymond, Drug Dev. Ind. Pharm. 10, 381 (1984)95. E.W. Washburn, Phys. Rev. 17, 374 (1921)96. S. Levine, J. Lowndes, E.J. Watson, G. Neale, J. Colloid Interface Sci. 73, 136 (1980)97. R.J. Good, N.J. Lin, J. Colloid Interface Sci. 54, 52 (1976)98. L.R. Fisher, P.D. Lark, J. Colloid Interface Sci. 69, 486 (1979)99. F.E. Bartell, H.J. Osterhof, Ind. Eng. Chem. 19, 1277 (1927)
100. F.E. Bartell, C.E. Whitney, J. Phys. Chem. 36, 3115 (1932)101. F.E. Bartell, C.W. Walton, J. Phys. Chem. 38, 503 (1934)102. L.R. White, J. Colloid Interface Sci. 90, 536 (1982)103. D. Dunstan, L.R. White, J. Colloid Interface Sci. 111, 60 (1986)104. D. Diggins, J. Ralston, Coal Prep. 13, 1 (1993)105. D. Diggins, L.G.J. Fokkink, J. Ralston, Colloids Surf. 44, 299 (1990)106. C.A. Prestidge, J. Ralston, J. Colloid Interface Sci. 172, 302 (1995)

32 Y. Yuan and T.R. Lee
107. D.Y. Kwok, A.W. Neumann, in Surface Characterization Methods: Principles, Techniquesand Applications, ed. by A.J. Milling (Marcel Dekker, New York, 1999), p. 37
108. N.W.F. Kossen, P.M. Heertjes, Chem. Eng. Sci. 20, 593 (1965)109. P.M. Heertjes, N.W.F. Kossen, Powder Technol. 1, 33 (1967)110. T.V. Subrahmanyam, M.B.M. Monte, A. Middea, E. Valdiviezo, F.F. Lins, Miner. Eng. 12,
1347 (1999)111. F. Restagno, C. Poulard, C. Cohen, L. Vagharchakian, L. Léger, Langmuir 25, 11188 (2009)112. L. Vagharchakian, F. Restagno, L. Léger, J. Phys. Chem. B 113, 3769 (2009)113. C. Cohen, F. Restagno, C. Poulard, L. Léger, Langmuir 26, 15345 (2010)114. R. Rioboo, M. Voué, H. Adão, J. Conti, A. Vaillant, D. Seveno, J. De Coninck, Langmuir 26,
4873 (2010)115. R.E. Johnson Jr., R.H. Dettre, in Surface and Colloid Science, vol. 2, ed. by E. Matijevic
(Wiley-Interscience, Weinheim, 1969), p. 85116. A.W. Neumann, in Wetting, Spreading and Adhesion, ed. by J.F. Padday (Academic Press,
London, 1978), p. 3117. A.W. Neumann, R.J. Good, Surface and Colloid Science, vol. 11, ed. by R.J. Good, R.R.
Stromberg (Plenum Press, New York, 1979), p. 31118. A. Marmur, Soft Matter 2, 12 (2006)119. A. Marmur, Annu. Rev. Mater. Res. 39, 473 (2009)120. A. Marmur, in Contact Angle, Wettability, and Adhesion, vol. 6, ed. by K.L. Mittal (Brill,
Leiden, 2009), p. 3121. D.Y. Kwok, A.W. Neumann, in Contact Angle, Wettability and Adhesion, vol. 3, ed. by K.L.
Mittal (VSP International Science, Boston, 2003), p. 117122. W.A. Zisman, in Contact Angle, Wettability and Adhesion: Advances in Chemistry Series,
vol. 43, ed. by R.F. Gould (ACS, Washington, 1964), p. 1123. A.W. Neumann, R.J. Good, C.J. Hope, M. Sejpal, J. Colloid Interface Sci. 49, 291 (1974)124. C.J. van Oss, L. Ju, M.K. Chaudhury, R.J. Good, J. Colloid Interface Sci. 128, 313 (1989)125. C.J. van Oss, R.J. Good, J. Macromol. Sci. A 26, 1183 (1989)126. F. Bashforth, J.C. Adams, An Attempt to Test the Theory of Capillary Action (Cambridge,
London, 1892)127. B.E. Blaisdell, J. Math. Phys. 19, 186 (1940)128. N.R. Tawde, K.G. Parvatikar, Indian J. Phys. 32, 174 (1958)129. S. Fordham, Proc. R. Soc. Lond. 194A, 1 (1948)130. O.S. Mills, Br. J. Appl. Phys. 4, 24 (1953)131. S. Hartland, R.W. Hartley, Axisymmetric Fluid-Liquid Interfaces (Elsevier, Amsterdam,
1976)132. J.D. Malcolm, H.M. Paynter, J. Colloid Interface Sci. 82, 269 (1981)133. C. Maze, G. Burnet, Surf. Sci. 13, 451 (1969)134. C. Maze, G. Burnet, Surf. Sci. 24, 335 (1971)135. C. Huh, R.L. Reed, J. Colloid Interface Sci. 91, 472 (1983)136. J.F. Boyce, S. Schürch, Y. Rotenberg, A.W. Neumann, Colloids Surf. 9, 307 (1984)137. S.H. Anastasiadis, J.K. Chen, A.P. Koberstein, A.P. Siegel, J.E. Sohn, J.A. Emerson, J. Col-
loid Interface Sci. 119, 55 (1986)138. R.V. Hoggs, An Introduction to Robust Estimation (Academic Press, New York, 1979)139. P. Cheng, Automation of axisymmetric drop shape analysis using digital image processing,
Ph.D. Thesis, University of Toronto, Toronto, 1990140. O.I. del Río, On the generalization of axisymmetric drop shape analysis, M.S. Thesis, Uni-
versity of Toronto, Toronto, 1993141. L.R. Fisher, J.N. Israelachvili, J. Colloid Interface Sci. 80, 528 (1981)142. Y. Rotenberg, L. Boruvka, A.W. Neumann, J. Colloid Interface Sci. 93, 169 (1983)143. J.K. Spelt, Y. Rotenberg, D.R. Absolom, A.W. Neumann, Colloids Surf. 24, 127 (1987)144. P. Cheng, D. Li, L. Boruvka, Y. Rotenberg, A.W. Neumann, Colloids Surf. 43, 151 (1990)145. O.I. del Río, A.W. Neumann, J. Colloid Interface Sci. 196, 136 (1997)146. A. Kalantarian, R. David, A.W. Neumann, Langmuir 25, 14146 (2009)

1 Contact Angle and Wetting Properties 33
147. R.O. Duda, P.E. Hart, Pattern Classification and Scene Analysis (Wiley, New York, 1973)148. F.K. Skinner, Y. Rotenberg, A.W. Neumann, J. Colloid Interface Sci. 130, 25 (1989)149. E. Moy, P. Cheng, Z. Policova, S. Treppo, D. Kwok, D.R. Mack, P.M. Sherman, A.W. Neu-
mann, Colloids Surf. 58, 215 (1991)150. M.A. Rodríguez-Valverde, M.A. Cabrerizo-Vílchez, P. Rosales-López, A. Pàez-Dueñas, R.
Hidalgo-Àlvarez, Colloids Surf. 206, 485 (2002)151. M.G. Cabezas, A. Bateni, J.M. Montanero, A.W. Neumann, Appl. Surf. Sci. 238, 480 (2004)152. M.G. Cabezas, A. Bateni, J.M. Montanero, A.W. Neumann, Colloids Surf. 255, 193 (2005)153. M.G. Cabezas, A. Bateni, J.M. Montanero, A.W. Neumann, Langmuir 22, 10053 (2006)154. B. Bhushan, Handbook of Nanotechnology, 2nd edn. (Springer, Heidelberg, 2007)155. E. Abkhoshka, M. Korb, B. Rezaic, Expert Syst. Appl. 37, 5201 (2010)156. K.A. Matis, E.N. Peleka, Sep. Sci. Technol. 45, 2465 (2010)157. J. Chatterjee, J. Colloid Interface Sci. 259, 139 (2003)158. A. Marmur, J. Colloid Interface Sci. 186, 462 (1997)159. D.Q. Li, Colloids Surf. A 116, 1 (1996)160. R. David, A.W. Neumann, in Applied Surface Thermodynamics, vol. 151, ed. by A.W. Neu-
mann, R. David, Y. Zuo (Taylor & Francis, Boca Raton, 2011), p. 701161. B.A. Pethica, J. Colloid Interface Sci. 62, 567 (1977)162. H.Z. Yu, D.M. Soolaman, A.W. Rowe, J.T. Banks, Chem. Phys. Chem. 5, 1035 (2004)163. D.M. Soolaman, H.Z. Yu, J. Phys. Chem. B 109, 17967 (2005)164. J.P.S. Farinha, M.A. Winnik, K.G. Hahn, Langmuir 16, 3391 (2000)165. K.W. Stockelhuber, B. Radoev, H.J. Schulze, Colloids Surf. A 156, 323 (1999)166. A. Dussaud, M. Vignes-Adler, Langmuir 13, 581 (1997)167. F. Rieutord, M.J. Salmeron, Phys. Chem. B 102, 3941 (1998)168. L. Kao R, D.R. Wasan, A.D. Nikolov, D.A. Edwards, Colloids Surf. 34, 389 (1989)169. E. Grimoldi, S. Zanini, R.A. Siliprandi, C. Riccardi, Eur. Phys. J. D 54, 165 (2009)170. Z. Tao, B. Bhushan, J. Phys. D: Appl. Phys. 39, 3858 (2006)171. Y.-F. Gao, Y. Yang, D.-Y. Sun, Chin. Phys. Lett. 28, 036102 (2011)172. G.J. Jameson, M.C.G. Del Cerro, J. Chem. Soc. Faraday Trans. I 72, 833 (1976)173. D.G. Fisher, B. Ovryn, Opt. Lett. 25, 478 (1979)174. M. Sundberg, A. Månsson, S. Tågerud, J. Colloid Interface Sci. 313, 454 (2007)175. T. Pompe, S. Herminghaus, Phys. Rev. Lett. 85, 1930 (2000)176. M. Hong, K.H. Kim, J. Bae, W. Jhe, Appl. Phys. Lett. 77, 2604 (2000)177. S.N. Jayasinghe, M.J. Edirisinghe, J. Aerosol. Sci. 33, 1379 (2002)178. M.D. Paine, M.S. Alexander, K.L. Smith, M. Wang, J.P.W. Stark, J. Aerosol. Sci. 38, 315
(2007)179. S. Adhikari, S. Fernando, Trans. ASABE 49, 1269 (2006)180. T.G. Mason, J.N. Wilking, K. Meleson, C.B. Chang, S.M. Graves, J. Phys. Condens. Matter
18, R635 (2006)181. X.H. Zhang, W. Ducker, Langmuir 24, 110 (2008)182. Y. Tan, V. Cristini, A.P. Lee, Sens. Actuators B, Chem. 114, 350 (2006)183. A. Meister, S. Jeney, M. Liley, T. Akiyama, U. Staufer, N.F. de Rooij, H. Heinzelmann,
Microelectron. Eng. 67–68, 644 (2003)184. A. Meister, M. Liley, J. Brugger, R. Pugin, H. Heinzelmann, Appl. Phys. Lett. 85, 6260
(2004)185. A. Meister, J. Polesel-Maris, P. Niedermann, J. Przybylska, P. Studer, M. Gabi, P. Behr, T.
Zambelli, M. Liley, J. Vörös, H. Heinzelmann, Microelectron. Eng. 86, 1481 (2009)186. Y.C. Jung, B.J. Bhushan, Vac. Sci. Technol. A 26, 777 (2008)187. A. Fang, E. Dujardin, T. Ondarçuhu, Nano Lett. 6, 2368 (2006)188. M. Preuss, H.-J. Butt, Langmuir 14, 3164 (1998)189. S. Ecke, M. Preuss, H.-J. Butt, J. Adhes. Sci. Technol. 13, 1181 (1999)190. M. Preuss, H.-J. Butt, Int. J. Miner. Process. 56, 99 (1999)191. J. Ralston, D. Fornasiero, R. Hayes, Int. J. Miner. Process. 56, 133 (1999)192. D. Johnson, N. Hilal, K. Waters, K. Hadler, J. Cilliers, Langmuir 25, 4880 (2009)

34 Y. Yuan and T.R. Lee
193. H.-J. Butt, A. Doppenschmidt, G. Huttl, E. Muller, O.I. Vinogradova, J. Chem. Phys. 113,1194 (2000)
194. H.K. Christenson, Langmuir 12, 1404 (1996)195. J.L. Parker, P.J. Attard, Phys. Chem. 96, 398 (1992)196. A.V. Nguyen, J. Nalaskowski, J.D. Miller, J. Colloid Interface Sci. 262, 303 (2003)197. A. Checco, P. Guenoun, J. Daillant, Phys. Rev. Lett. 91, 186101 (2003)198. A. Checco, Y. Cai, O. Gang, B.M. Ocko, Ultramicroscopy 106, 703 (2006)199. V. Dupres, T. Camesano, D. Langevin, A. Checco, P. Guenoun, J. Colloid Interface Sci. 269,
329 (2004)200. V. Dupres, D. Langevin, P. Guenoun, A. Checco, G. Luengo, F. Leroy, J. Colloid Interface
Sci. 306, 34 (2007)201. R. Wang, L. Cong, M. Kido, Appl. Surf. Sci. 191, 74 (2002)202. R. Wang, M. Takeda, M. Kido, Mater. Lett. 54, 140 (2002)203. N.A. Stelmashenko, J.P. Craven, A.M. Donald, E.M. Terentjev, B.L. Thiel, J. Microsc. 204,
172 (2001)204. K.K.S. Lau, J. Bico, K.B.K. Teo, M. Chhowalla, G.A.J. Amaratunga, W.I. Milne, G.H.
McKinley, K.K. Gleason, Nano Lett. 3, 1701 (2003)205. Y.T. Cheng, D.E. Rodak, Appl. Phys. Lett. 86, 144101 (2005)206. Y.C. Jung, B.J. Bhushan, Microsc. 229, 127 (2008)207. Q.F. Wei, R.R. Mather, A.F. Fotheringham, R.D. Yang, Tex. Res. J. 73, 557 (2003)208. D. Aronov, M. Molotskii, G. Rosenman, Appl. Phys. Lett. 90, 104104 (2007)209. Q.F. Wei, Mater. Charact. 52, 231 (2004)210. D. Aronov, M. Molotskii, G. Rosenman, Phys. Rev. B, Condens. Matter 76, 035437 (2007)211. M. Morita, T. Koga, H. Otsuka, A. Takahara, Langmuir 21, 911 (2005)212. J. Léopolds, P. Damman, Nat. Mater. 5, 957 (2006)213. A. Checco, O. Gang, B.M. Ocko, Phys. Rev. Lett. 96, 056104 (2006)214. K. Khare, S. Herminghaus, J.-C. Baret, B.M. Law, M. Brinkmann, R. Seemann, Langmuir
23, 12997 (2007)215. K. Fukuzawa, T. Deguchi, J. Kawamura, Y. Mitsuya, T. Muramatsu, H. Zhang, Appl. Phys.
Lett. 87, 203108 (2005)216. R. Seemann, M. Brinkmann, E.J. Kramer, F.F. Lange, R. Lipowsky, Proc. Natl. Acad. Sci.
USA 102, 1848 (2005)217. L. Valentini, F. Mengoni, J.M. Kenny, A. Marrocchi, A. Taticchi, Small 3, 1200 (2007)218. C. Joachim, J.K. Gimzewski, A. Aviram, Nature 408, 541 (2000)219. A. Méndez-Vilas, A.B. Jódar-Reyes, M.L. González-Martín, Small 5, 1366 (2009)

http://www.springer.com/978-3-642-34242-4