9.7 advantages and disadvantages of fifo
TRANSCRIPT

9.7
ADVANTAGES AND
DISADVANTAGES OF FIFO

© Michael Allison, Trinity Grammar School. Author’s permission required for external use
Remember that FIFO is just an assumption
– it’s probably not r ight in every instance
E.g. i f 3 units were sold today , there’s very
l i t t le chance they were actually three
$200 units
It could have been any of the 3 units
depending on how they were stored, which
staf f member it was that took it etc.
We just assume it was the f irst 3 units
that came in
Stock room for storing inventory
$200
$200
$200
$200
$200
Mar 1st
$210
$210
$210
Mar 9th
$220
$220
$220
$220
$220
$220
$220
Mar 16th
So if FIFO is not always right, why is it used
then?
9.7 ADVANTAGES AND DISADVANTAGES
OF FIFO

© Michael Allison, Trinity Grammar School. Author’s permission required for external use
Advantages of FIFO:
It saves time and money sent calculating the exact cost of every sale
It simplifies the process of identifying the cost of sale so the owner and the firm
can worry about other matters to keep the firm in business
The cost of sales balances out as all stock is sold – the FIFO cost will match the
actual cost eventually anyway
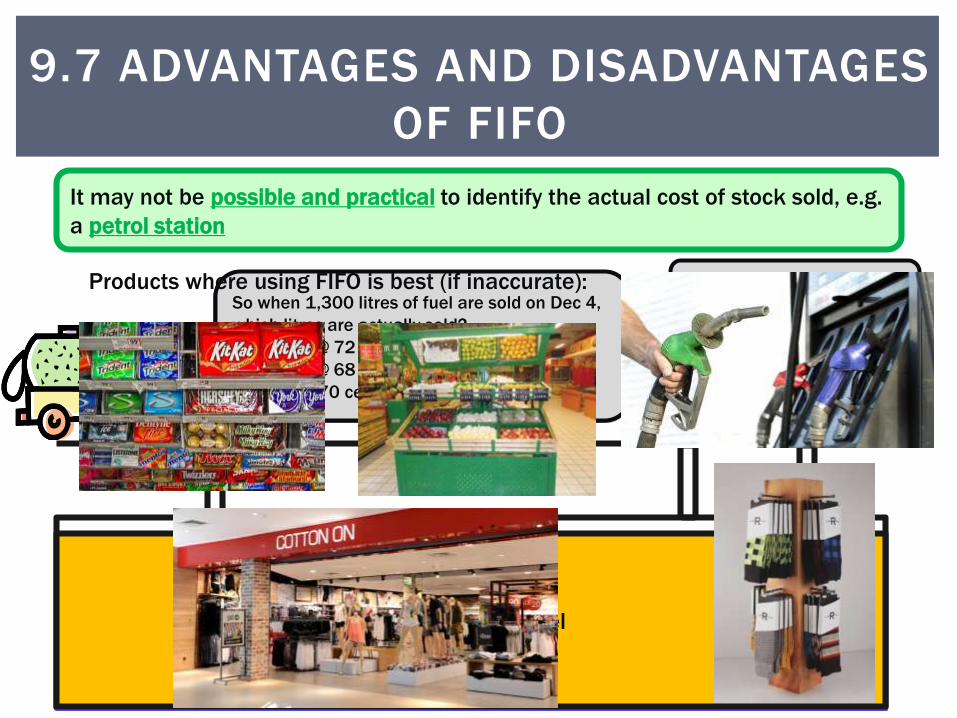
It may not be possible and practical to identify the actual cost of stock sold, e.g.
a petrol station
FIFO will increase Net Profit in the short-term during times of rising stock prices
9.7 ADVANTAGES AND DISADVANTAGES
OF FIFO
© Michael Allison, Trinity Grammar School. Author’s permission required for external use
Dec 1: tanker delivers
1,000 litres of fuel
costing 72 cents per
litre
Dec 2: tanker delivers
1,000 litres of fuel
costing 68 cents per
litre
1,000 litres @ 72 cents
1,000 litres @ 68 cents
Dec 3: tanker delivers
600 litres of fuel costing
70 cents per litre
600 litres @ 70 cents
But in reality, each delivery of fuel does not sit
on top of each the next as it is a liquid. The fuel
mixes together and creates one pool.
2,600 litres of fuel
So when 1,300 litres of fuel are sold on Dec 4,
which litres are actually sold?
• 1,000 @ 72 cents?
• 1,000 @ 68 cents?
• 600 @ 70 cents?
Who knows? It’s too hard to
tell. So just apply FIFO
It may not be possible and practical to identify the actual cost of stock sold, e.g.
a petrol station
9.7 ADVANTAGES AND DISADVANTAGES
OF FIFO
Products where using FIFO is best (if inaccurate):

© Michael Allison, Trinity Grammar School. Author’s permission required for external use
FIFO will increase Net Profit in the short-term during times of rising stock prices
$10
$10
$10
$20
$20
$20
Business A
Uses FIFO
Stock sells for $30 per unit
$10
$10
$10
$20
$20
$20
Business B
Uses LIFO
Units
SoldSales Cost Profit
1 30 10 20
2 60 20 40
3 90 30 60
4 120 50 70
5 150 70 80
6 180 90 90
Units
SoldSales Cost Profit
1 30 20 10
2 60 40 20
3 90 60 30
4 120 70 50
5 150 80 70
6 180 90 90
Units
SoldSales Cost Profit
1 30 10 20
2 60 20 40
3 90 30 60
4 120 50 70
5 150 70 80
6 180 90 90
$10 Units
SoldSales Cost Profit
1 30 10 20
2 60 20 40
3 90 30 60
4 120 50 70
5 150 70 80
6 180 90 90
Units
SoldSales Cost Profit
1 30 10 20
2 60 20 40
3 90 30 60
4 120 50 70
5 150 70 80
6 180 90 90
Units
SoldSales Cost Profit
1 30 20 10
2 60 40 20
3 90 60 30
4 120 70 50
5 150 80 70
6 180 90 90
Units
SoldSales Cost Profit
1 30 20 10
2 60 40 20
3 90 60 30
4 120 70 50
5 150 80 70
6 180 90 90$20
Units
SoldSales Cost Profit
1 30 20 10
2 60 40 20
3 90 60 30
4 120 70 50
5 150 80 70
6 180 90 90
Units
SoldSales Cost Profit
1 30 10 20
2 60 20 40
3 90 30 60
4 120 50 70
5 150 70 80
6 180 90 90
Units
SoldSales Cost Profit
1 30 10 20
2 60 20 40
3 90 30 60
4 120 50 70
5 150 70 80
6 180 90 90
$10
$10 Units
SoldSales Cost Profit
1 30 10 20
2 60 20 40
3 90 30 60
4 120 50 70
5 150 70 80
6 180 90 90
Units
SoldSales Cost Profit
1 30 20 10
2 60 40 20
3 90 60 30
4 120 70 50
5 150 80 70
6 180 90 90
Units
SoldSales Cost Profit
1 30 20 10
2 60 40 20
3 90 60 30
4 120 70 50
5 150 80 70
6 180 90 90
$20
$20
Units
SoldSales Cost Profit
1 30 20 10
2 60 40 20
3 90 60 30
4 120 70 50
5 150 80 70
6 180 90 90
Units
SoldSales Cost Profit
1 30 10 20
2 60 20 40
3 90 30 60
4 120 50 70
5 150 70 80
6 180 90 90
Units
SoldSales Cost Profit
1 30 10 20
2 60 20 40
3 90 30 60
4 120 50 70
5 150 70 80
6 180 90 90
$10
$10
$10
Units
SoldSales Cost Profit
1 30 10 20
2 60 20 40
3 90 30 60
4 120 50 70
5 150 70 80
6 180 90 90
Units
SoldSales Cost Profit
1 30 20 10
2 60 40 20
3 90 60 30
4 120 70 50
5 150 80 70
6 180 90 90
Units
SoldSales Cost Profit
1 30 20 10
2 60 40 20
3 90 60 30
4 120 70 50
5 150 80 70
6 180 90 90
$20
$20
$20
Units
SoldSales Cost Profit
1 30 20 10
2 60 40 20
3 90 60 30
4 120 70 50
5 150 80 70
6 180 90 90
Units
SoldSales Cost Profit
1 30 10 20
2 60 20 40
3 90 30 60
4 120 50 70
5 150 70 80
6 180 90 90
Units
SoldSales Cost Profit
1 30 10 20
2 60 20 40
3 90 30 60
4 120 50 70
5 150 70 80
6 180 90 90
$10
$10
$10
$20
Units
SoldSales Cost Profit
1 30 10 20
2 60 20 40
3 90 30 60
4 120 50 70
5 150 70 80
6 180 90 90
Units
SoldSales Cost Profit
1 30 20 10
2 60 40 20
3 90 60 30
4 120 70 50
5 150 80 70
6 180 90 90
Units
SoldSales Cost Profit
1 30 20 10
2 60 40 20
3 90 60 30
4 120 70 50
5 150 80 70
6 180 90 90
$10
$20
$20
$20
Units
SoldSales Cost Profit
1 30 20 10
2 60 40 20
3 90 60 30
4 120 70 50
5 150 80 70
6 180 90 90
Units
SoldSales Cost Profit
1 30 10 20
2 60 20 40
3 90 30 60
4 120 50 70
5 150 70 80
6 180 90 90
Units
SoldSales Cost Profit
1 30 10 20
2 60 20 40
3 90 30 60
4 120 50 70
5 150 70 80
6 180 90 90
$10
$10
$10
$20
$20
Units
SoldSales Cost Profit
1 30 10 20
2 60 20 40
3 90 30 60
4 120 50 70
5 150 70 80
6 180 90 90
Units
SoldSales Cost Profit
1 30 20 10
2 60 40 20
3 90 60 30
4 120 70 50
5 150 80 70
6 180 90 90
Units
SoldSales Cost Profit
1 30 20 10
2 60 40 20
3 90 60 30
4 120 70 50
5 150 80 70
6 180 90 90
$10
$10
$20
$20
$20
Units
SoldSales Cost Profit
1 30 20 10
2 60 40 20
3 90 60 30
4 120 70 50
5 150 80 70
6 180 90 90
Units
SoldSales Cost Profit
1 30 10 20
2 60 20 40
3 90 30 60
4 120 50 70
5 150 70 80
6 180 90 90
Units
SoldSales Cost Profit
1 30 10 20
2 60 20 40
3 90 30 60
4 120 50 70
5 150 70 80
6 180 90 90
$10
$10
$10
$20
$20
$20
Units
SoldSales Cost Profit
1 30 10 20
2 60 20 40
3 90 30 60
4 120 50 70
5 150 70 80
6 180 90 90
Units
SoldSales Cost Profit
1 30 20 10
2 60 40 20
3 90 60 30
4 120 70 50
5 150 80 70
6 180 90 90
Units
SoldSales Cost Profit
1 30 20 10
2 60 40 20
3 90 60 30
4 120 70 50
5 150 80 70
6 180 90 90
$10
$10
$10
$20
$20
$20
Units
SoldSales Cost Profit
1 30 20 10
2 60 40 20
3 90 60 30
4 120 70 50
5 150 80 70
6 180 90 90
9.7 ADVANTAGES AND DISADVANTAGES
OF FIFO

© Michael Allison, Trinity Grammar School. Author’s permission required for external use
20
40
60
70
80
90
10
20
30
50
70
90
1 Unit 2 Units 3 Units 4 Units 5 Units 6 Units
Net Profit Made
Business A (FIFO) Business B (LIFO)Units
SoldSales Cost Profit
1 30 10 20
2 60 20 40
3 90 30 60
4 120 50 70
5 150 70 80
6 180 90 90
Units
SoldSales Cost Profit
1 30 20 10
2 60 40 20
3 90 60 30
4 120 70 50
5 150 80 70
6 180 90 90
Business A
Business B
Units
SoldSales Cost Profit
1 30 10 20
2 60 20 40
3 90 30 60
4 120 50 70
5 150 70 80
6 180 90 90
Units
SoldSales Cost Profit
1 30 20 10
2 60 40 20
3 90 60 30
4 120 70 50
5 150 80 70
6 180 90 90
Units
SoldSales Cost Profit
1 30 10 20
2 60 20 40
3 90 30 60
4 120 50 70
5 150 70 80
6 180 90 90
Units
SoldSales Cost Profit
1 30 20 10
2 60 40 20
3 90 60 30
4 120 70 50
5 150 80 70
6 180 90 90
Units
SoldSales Cost Profit
1 30 10 20
2 60 20 40
3 90 30 60
4 120 50 70
5 150 70 80
6 180 90 90
Units
SoldSales Cost Profit
1 30 20 10
2 60 40 20
3 90 60 30
4 120 70 50
5 150 80 70
6 180 90 90
Units
SoldSales Cost Profit
1 30 10 20
2 60 20 40
3 90 30 60
4 120 50 70
5 150 70 80
6 180 90 90
Units
SoldSales Cost Profit
1 30 20 10
2 60 40 20
3 90 60 30
4 120 70 50
5 150 80 70
6 180 90 90
Units
SoldSales Cost Profit
1 30 10 20
2 60 20 40
3 90 30 60
4 120 50 70
5 150 70 80
6 180 90 90
Units
SoldSales Cost Profit
1 30 20 10
2 60 40 20
3 90 60 30
4 120 70 50
5 150 80 70
6 180 90 90
Units
SoldSales Cost Profit
1 30 10 20
2 60 20 40
3 90 30 60
4 120 50 70
5 150 70 80
6 180 90 90
Units
SoldSales Cost Profit
1 30 20 10
2 60 40 20
3 90 60 30
4 120 70 50
5 150 80 70
6 180 90 90
9.7 ADVANTAGES AND DISADVANTAGES
OF FIFO

© Michael Allison, Trinity Grammar School. Author’s permission required for external use
Business A
Uses FIFO
Business B
Uses LIFO
$10
$10
$10
$20
$20
$20
Units
SoldSales Cost Profit
1 30 10 20
2 60 20 40
3 90 30 60
4 120 50 70
5 150 70 80
6 180 90 90
$10
$10
$10
$20
$20
$20
Units
SoldSales Cost Profit
1 30 20 10
2 60 40 20
3 90 60 30
4 120 70 50
5 150 80 70
6 180 90 90
FIFO increases Net Profit in the short-term in times of rising prices because:
A f i rm adopt ing F IFO wi l l se l l the c heaper s tock f i r s t – has a cost o f sa les
This resul ts in a h igher Net Profi t
But in the end, once ALL stock is so ld , then Net Profi t w i l l be the same
Units
SoldSales Cost Profit
1 30 10 20
2 60 20 40
3 90 30 60
4 120 50 70
5 150 70 80
6 180 90 90
Units
SoldSales Cost Profit
1 30 20 10
2 60 40 20
3 90 60 30
4 120 70 50
5 150 80 70
6 180 90 90
Units
SoldSales Cost Profit
1 30 10 20
2 60 20 40
3 90 30 60
4 120 50 70
5 150 70 80
6 180 90 90
Units
SoldSales Cost Profit
1 30 20 10
2 60 40 20
3 90 60 30
4 120 70 50
5 150 80 70
6 180 90 90
Units
SoldSales Cost Profit
1 30 10 20
2 60 20 40
3 90 30 60
4 120 50 70
5 150 70 80
6 180 90 90
Units
SoldSales Cost Profit
1 30 20 10
2 60 40 20
3 90 60 30
4 120 70 50
5 150 80 70
6 180 90 90
$10
$10
$10
$20
$20
$10
$10
$20
$20
$20
9.7 ADVANTAGES AND DISADVANTAGES
OF FIFO

© Michael Allison, Trinity Grammar School. Author’s permission required for external use
Disadvantages of FIFO:
Inaccurate for each transaction – the actual cost of each transaction is not identified,
instead an assumption is made that FIFO
Inflexible in times of changing prices – if the firm buys in bulk to get a discount, under
FIFO the benefit from this will not flow through to profit until the older units are sold
Limits management decision-making – what if the firm doesn’t actually want to sell the
oldest stock today, FIFO still assumes it does
FIFO will decrease Net Profit in the short-term during times of falling stock
prices
9.7 ADVANTAGES AND DISADVANTAGES
OF FIFO

© Michael Allison, Trinity Grammar School. Author’s permission required for external use
FIFO will decrease Net Profit in the short-term during times of falling stock
prices
Business A
Uses FIFO
Stock sells for $30 per unit
Business B
Uses LIFO
$20
$20
$20
$10
$10
$10
Units
SoldSales Cost Profit
1 30 20 10
2 60 40 20
3 90 60 30
4 120 70 50
5 150 80 70
6 180 90 90
$20
$20
$20
$10
$10
$10
Units
SoldSales Cost Profit
1 30 10 20
2 60 20 40
3 90 30 60
4 120 50 70
5 150 70 80
6 180 90 90
Units
SoldSales Cost Profit
1 30 20 10
2 60 40 20
3 90 60 30
4 120 70 50
5 150 80 70
6 180 90 90
Units
SoldSales Cost Profit
1 30 20 10
2 60 40 20
3 90 60 30
4 120 70 50
5 150 80 70
6 180 90 90
$20 Units
SoldSales Cost Profit
1 30 20 10
2 60 40 20
3 90 60 30
4 120 70 50
5 150 80 70
6 180 90 90
Units
SoldSales Cost Profit
1 30 10 20
2 60 20 40
3 90 30 60
4 120 50 70
5 150 70 80
6 180 90 90
Units
SoldSales Cost Profit
1 30 10 20
2 60 20 40
3 90 30 60
4 120 50 70
5 150 70 80
6 180 90 90$10
Units
SoldSales Cost Profit
1 30 10 20
2 60 20 40
3 90 30 60
4 120 50 70
5 150 70 80
6 180 90 90
Units
SoldSales Cost Profit
1 30 20 10
2 60 40 20
3 90 60 30
4 120 70 50
5 150 80 70
6 180 90 90
Units
SoldSales Cost Profit
1 30 20 10
2 60 40 20
3 90 60 30
4 120 70 50
5 150 80 70
6 180 90 90
$20
$20
Units
SoldSales Cost Profit
1 30 20 10
2 60 40 20
3 90 60 30
4 120 70 50
5 150 80 70
6 180 90 90
Units
SoldSales Cost Profit
1 30 10 20
2 60 20 40
3 90 30 60
4 120 50 70
5 150 70 80
6 180 90 90
Units
SoldSales Cost Profit
1 30 10 20
2 60 20 40
3 90 30 60
4 120 50 70
5 150 70 80
6 180 90 90
$10
$10
Units
SoldSales Cost Profit
1 30 10 20
2 60 20 40
3 90 30 60
4 120 50 70
5 150 70 80
6 180 90 90
Units
SoldSales Cost Profit
1 30 20 10
2 60 40 20
3 90 60 30
4 120 70 50
5 150 80 70
6 180 90 90
Units
SoldSales Cost Profit
1 30 20 10
2 60 40 20
3 90 60 30
4 120 70 50
5 150 80 70
6 180 90 90
$20
$20
$20
Units
SoldSales Cost Profit
1 30 20 10
2 60 40 20
3 90 60 30
4 120 70 50
5 150 80 70
6 180 90 90
Units
SoldSales Cost Profit
1 30 10 20
2 60 20 40
3 90 30 60
4 120 50 70
5 150 70 80
6 180 90 90
Units
SoldSales Cost Profit
1 30 10 20
2 60 20 40
3 90 30 60
4 120 50 70
5 150 70 80
6 180 90 90
$10
$10
$10
Units
SoldSales Cost Profit
1 30 10 20
2 60 20 40
3 90 30 60
4 120 50 70
5 150 70 80
6 180 90 90
Units
SoldSales Cost Profit
1 30 20 10
2 60 40 20
3 90 60 30
4 120 70 50
5 150 80 70
6 180 90 90
Units
SoldSales Cost Profit
1 30 20 10
2 60 40 20
3 90 60 30
4 120 70 50
5 150 80 70
6 180 90 90
$20
$20
$20
$10
Units
SoldSales Cost Profit
1 30 20 10
2 60 40 20
3 90 60 30
4 120 70 50
5 150 80 70
6 180 90 90
Units
SoldSales Cost Profit
1 30 10 20
2 60 20 40
3 90 30 60
4 120 50 70
5 150 70 80
6 180 90 90
Units
SoldSales Cost Profit
1 30 10 20
2 60 20 40
3 90 30 60
4 120 50 70
5 150 70 80
6 180 90 90
$20
$10
$10
$10
Units
SoldSales Cost Profit
1 30 10 20
2 60 20 40
3 90 30 60
4 120 50 70
5 150 70 80
6 180 90 90
Units
SoldSales Cost Profit
1 30 20 10
2 60 40 20
3 90 60 30
4 120 70 50
5 150 80 70
6 180 90 90
Units
SoldSales Cost Profit
1 30 20 10
2 60 40 20
3 90 60 30
4 120 70 50
5 150 80 70
6 180 90 90
$20
$20
$20
$10
$10
Units
SoldSales Cost Profit
1 30 20 10
2 60 40 20
3 90 60 30
4 120 70 50
5 150 80 70
6 180 90 90
Units
SoldSales Cost Profit
1 30 10 20
2 60 20 40
3 90 30 60
4 120 50 70
5 150 70 80
6 180 90 90
Units
SoldSales Cost Profit
1 30 10 20
2 60 20 40
3 90 30 60
4 120 50 70
5 150 70 80
6 180 90 90
$20
$20
$10
$10
$10
Units
SoldSales Cost Profit
1 30 10 20
2 60 20 40
3 90 30 60
4 120 50 70
5 150 70 80
6 180 90 90
Units
SoldSales Cost Profit
1 30 20 10
2 60 40 20
3 90 60 30
4 120 70 50
5 150 80 70
6 180 90 90
Units
SoldSales Cost Profit
1 30 20 10
2 60 40 20
3 90 60 30
4 120 70 50
5 150 80 70
6 180 90 90
$20
$20
$20
$10
$10
$10
Units
SoldSales Cost Profit
1 30 20 10
2 60 40 20
3 90 60 30
4 120 70 50
5 150 80 70
6 180 90 90
Units
SoldSales Cost Profit
1 30 10 20
2 60 20 40
3 90 30 60
4 120 50 70
5 150 70 80
6 180 90 90
Units
SoldSales Cost Profit
1 30 10 20
2 60 20 40
3 90 30 60
4 120 50 70
5 150 70 80
6 180 90 90
$20
$20
$20
$10
$10
$10
Units
SoldSales Cost Profit
1 30 10 20
2 60 20 40
3 90 30 60
4 120 50 70
5 150 70 80
6 180 90 90
9.7 ADVANTAGES AND DISADVANTAGES
OF FIFO

© Michael Allison, Trinity Grammar School. Author’s permission required for external use
10
20
30
50
70
90
20
40
60
70
80
90
1 Unit 2 Units 3 Units 4 Units 5 Units 6 Units
Net Profit Made
Business A (FIFO) Business B (LIFO)Units
SoldSales Cost Profit
1 30 20 10
2 60 40 20
3 90 60 30
4 120 70 50
5 150 80 70
6 180 90 90
Units
SoldSales Cost Profit
1 30 10 20
2 60 20 40
3 90 30 60
4 120 50 70
5 150 70 80
6 180 90 90
Business A
Business B
Units
SoldSales Cost Profit
1 30 20 10
2 60 40 20
3 90 60 30
4 120 70 50
5 150 80 70
6 180 90 90
Units
SoldSales Cost Profit
1 30 10 20
2 60 20 40
3 90 30 60
4 120 50 70
5 150 70 80
6 180 90 90
Units
SoldSales Cost Profit
1 30 20 10
2 60 40 20
3 90 60 30
4 120 70 50
5 150 80 70
6 180 90 90
Units
SoldSales Cost Profit
1 30 10 20
2 60 20 40
3 90 30 60
4 120 50 70
5 150 70 80
6 180 90 90
Units
SoldSales Cost Profit
1 30 20 10
2 60 40 20
3 90 60 30
4 120 70 50
5 150 80 70
6 180 90 90
Units
SoldSales Cost Profit
1 30 10 20
2 60 20 40
3 90 30 60
4 120 50 70
5 150 70 80
6 180 90 90
Units
SoldSales Cost Profit
1 30 20 10
2 60 40 20
3 90 60 30
4 120 70 50
5 150 80 70
6 180 90 90
Units
SoldSales Cost Profit
1 30 10 20
2 60 20 40
3 90 30 60
4 120 50 70
5 150 70 80
6 180 90 90
Units
SoldSales Cost Profit
1 30 20 10
2 60 40 20
3 90 60 30
4 120 70 50
5 150 80 70
6 180 90 90
Units
SoldSales Cost Profit
1 30 10 20
2 60 20 40
3 90 30 60
4 120 50 70
5 150 70 80
6 180 90 90
Units
SoldSales Cost Profit
1 30 20 10
2 60 40 20
3 90 60 30
4 120 70 50
5 150 80 70
6 180 90 90
Units
SoldSales Cost Profit
1 30 10 20
2 60 20 40
3 90 30 60
4 120 50 70
5 150 70 80
6 180 90 90
9.7 ADVANTAGES AND DISADVANTAGES
OF FIFO

© Michael Allison, Trinity Grammar School. Author’s permission required for external use
FIFO decreases Net Profit in the short-term in times of falling prices because:
A f i rm adopt ing F IFO wi l l se l l the more expensive s tock f i r st – has a cost o f sa les
This resul ts in a lower Net Profi t
But in the end, once ALL stock is so ld , then Net Profi t w i l l be the same
Business A
Uses FIFO
$20
$20
$20
$10
$10
$10
Units
SoldSales Cost Profit
1 30 20 10
2 60 40 20
3 90 60 30
4 120 70 50
5 150 80 70
6 180 90 90
Business B
Uses LIFO
$20
$20
$10
Units
SoldSales Cost Profit
1 30 10 20
2 60 20 40
3 90 30 60
4 120 50 70
5 150 70 80
6 180 90 90
$20
$20
$20
$20
$10
$10
$10
Units
SoldSales Cost Profit
1 30 20 10
2 60 40 20
3 90 60 30
4 120 70 50
5 150 80 70
6 180 90 90
Units
SoldSales Cost Profit
1 30 10 20
2 60 20 40
3 90 30 60
4 120 50 70
5 150 70 80
6 180 90 90
Units
SoldSales Cost Profit
1 30 20 10
2 60 40 20
3 90 60 30
4 120 70 50
5 150 80 70
6 180 90 90
Units
SoldSales Cost Profit
1 30 10 20
2 60 20 40
3 90 30 60
4 120 50 70
5 150 70 80
6 180 90 90
Units
SoldSales Cost Profit
1 30 20 10
2 60 40 20
3 90 60 30
4 120 70 50
5 150 80 70
6 180 90 90
Units
SoldSales Cost Profit
1 30 10 20
2 60 20 40
3 90 30 60
4 120 50 70
5 150 70 80
6 180 90 90
$20
$20
$20
$10
$10
$20
$20
$10
$10
$10
9.7 ADVANTAGES AND DISADVANTAGES
OF FIFO

© Michael Allison, Trinity Grammar School. Author’s permission required for external use
TASK
In-class Homework
Ex9.12 (c) X