95% confidence intervals 12-1 asset classmean standard deviation lower bound upper bound...
TRANSCRIPT

95% Confidence Intervals
12-1
Asset class MeanStandard Deviation
Lower Bound
Upper Bound
SP500 12.10% 20.20% -27.49% 51.69%
Small Cap 16.90% 32.30% -46.41% 80.21%20 yr Corp Bonds 6.30% 8.40% -10.16% 22.76%
20 yr T-Bonds 5.90% 9.80% -13.31% 25.11%
10 yr T-Bond 5.40% 5.70% -5.77% 16.57%
1 mo T-Bills 3.50% 3.10% -2.58% 9.58%

Probabilities of Negative and Positive Returns
12-2
Asset class MeanStandard Deviation
z (for 0% return) Prob(Z<0) Prob(Z>0)
SP500 12.10% 20.20% -0.599 27.46% 72.54%
Small Cap 16.90% 32.30% -0.523 30.04% 69.96%20 yr Corp Bonds 6.30% 8.40% -0.750 22.66% 77.34%20 yr T-Bonds 5.90% 9.80% -0.602 27.36% 72.64%
10 yr T-Bond 5.40% 5.70% -0.947 17.17% 82.83%
1 mo T-Bills 3.50% 3.10% -1.129 12.94% 87.06%

Risk Premiums
•The “extra” return earned for taking on risk
•Treasury bills are considered to be “risk-free” (more on this later)…
•The risk premium is the return over and above the risk-free rate
12-3

Table 12.3: Average Annual Returns and Risk Premiums
Investment Average Return
Risk Premium
Large Stocks 12.1% 8.6%
Small Stocks 16.9% 13.4%
Long-term Corporate Bonds
6.3% 2.8%
Long-term Government Bonds
5.9% 2.4%
U.S. Treasury Bills
3.5% 0.0%12-4

Arithmetic vs. Geometric Average
•Arithmetic average – return earned in an average period over multiple periods
•Geometric average – average compound return per period over multiple periods
•The geometric average will be less than the arithmetic average unless all the returns are equal
12-5

•What is the arithmetic and geometric average for the following returns?Year 1 5%Year 2 -3%Year 3 12%Arithmetic average = (5 + (–3) + 12)/3 = 4.67%
Geometric average = [(1+.05)*(1-.03)*(1+.12)]1/3 – 1 = .0449 = 4.49%
12-6
Arithmetic vs. Geometric Average

Arithmetic vs. Geometric Average•Approximation of Geometric Average
GAR = AAR – s2/2.Annual Returns, 1926-2010
Year SP500 20 year Tbonds Tbills CPI
Arithmetic Average 11.76% 5.75% 3.76% 3.08%Variance 4.15% 0.95% 0.10% 0.17%
Standard Deviation 20.37% 9.73% 3.14% 4.18%Geometric Average 9.63% 5.27% 3.67% 2.96%Geometric Average
Approximation 9.69% 5.28% 3.71% 2.99%

(Informationally) Efficient Capital Markets
•Definition: Capital markets are “informationally efficient” if market prices of securities fully incorporate and reflect all “relevant” information at any given point of time.
•If this is true, then securities are “fairly” priced and it is not likely that you are able to earn “abnormal” or “excess” returns (i.e., returns over and above the “fair” return).
12-8
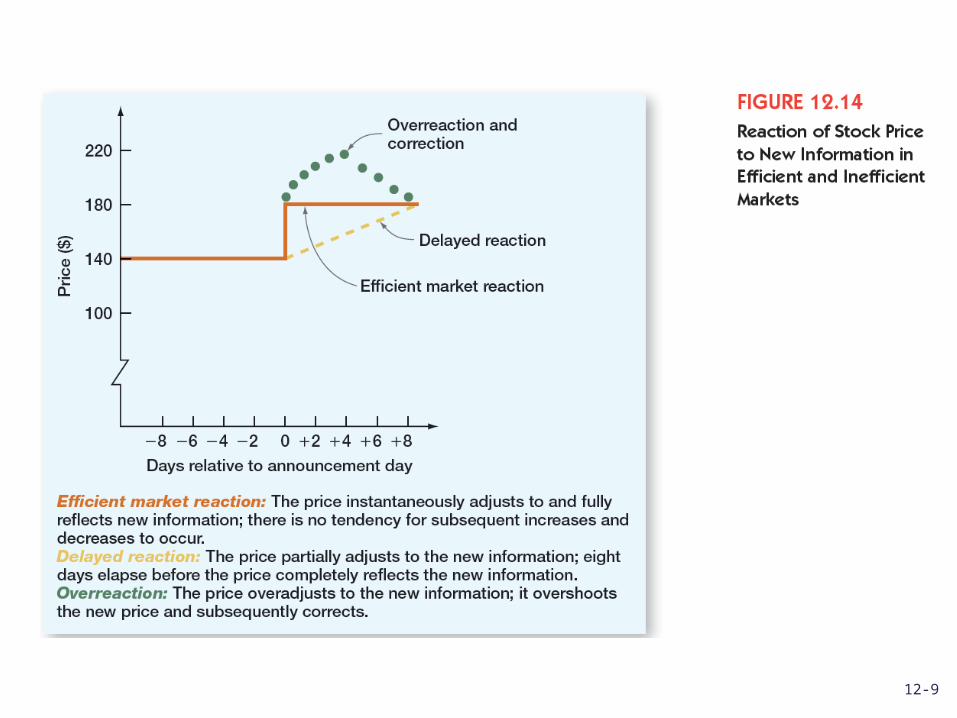
12-9

Implications of Efficient Markets
•Efficient markets do not mean that you can’t make money!
•They do mean that, on average, you will earn a return that is appropriate for the risk undertaken and there is not a bias in prices that can be exploited to earn excess returns
•Market efficiency ensures that market prices are reliable indicators for capital allocation in the economy – they enable firms to identify what the most highly valued uses of capital are.
12-10