9. correlational research - university of...
TRANSCRIPT

One Observation can Have Many Interpretations
9. Correlational Research
1
“Young Woman/Old Lady Illusion”

• Understand differences between observational and experimental research
• Be able to interpret scatterplots
• Understand how correlational work can provide predictions through regression analysis
• Understand the difficulties of interpreting correlations and methods for dealing with each of these.
• Know the purpose of several advanced correlational techniques.
Goals
2

Observational Research(“scientific study” ≠ “experiment”)
• In chapter 5-8, we looked extensivelyat experimental research:
• ≥ 1 variables manipulated• ≥ 1 variables measured• Other variables controlled
• Now, in chapters 9-11, we will look at observational research:
• 0 variables manipulated• ≥ 2 variables measured• Little or no attempt to hold other
variables constant
3

• No IVs, DVs, or EVs (just ≥2 measured vars.)∴ Usually no attempts at control or avoid confounds*
• No groups or levels (just one group)∴ No random assignment, matching or counterbalancing*
• Greater concerns over representative samples • Greater emphasis on individual differences, as
opposed to lumping people into groups.
Observational Research: Differences from Experiments
4
* Therefore cannot establish causality, and interpretation of results is more difficult

• Can study things that cannot practically be studied experimentally: Gender, culture, etc.
• Can study things that cannot ethically be experimented on: Brain damage, trauma, etc.
• Can look at massively multivariate situations more easily than experimental work.
• Allows accurate predictions of one variable from an other (or several others).
Observational Research: Pros
5

• What causes depression? Many variables are involved. Let’s say there are 12 relevant causal variables.
• Examining how 12 IVs interact to affect depression in a factorial experiment would require a design with at least 212 (=4096) cells! Not feasible.
• But it is relatively easy to observe/measure 12 variables in each subject: 12 questions on a questionnaire can be all that’s necessary (in principle).
• Can then look at how all of these measured variables relate to one another and to measures of depression.
Massively Multivariate Questions
6

• For centuries, people predicted tides, not knowing what caused them, only knowing they were related to lunar phases and sun positions
• Similarly, we need not know if variable A causes variable B to change in order to use A to predict B
• But caution is warranted. Without a deeper understanding of causes, one can get surprised!
Predicting Without Understanding Causes
Brouscon's Almanach of 1546: Tidal diagrams "according to the age of the Moon".
7

• Example: Negative correlation was observed between HRT (hormone replacement therapy) and CHD (coronary heart disease).
• From this, it was predicted that giving women HRT would reduce CHD.
• In fact the opposite is true!
• Turns out SES acts as a “third variable” here (more on that later)
Predicting Without Understanding Causes
8

Archival Research: e.g., look through crime records and police deployment records to see if there is a relationship between number of police on patrol and street crime.
Survey Research: e.g., send out a questionnaire to people in the community asking them about their income and their level of life satisfaction to see if there is a relationship between income and happiness.
Laboratory Research: e.g., bring married couples into a lab and measure how often they express certain emotions during a conversation, then see how this relates to how long their marriage lasts. (Question: How does this differ from an experiment?)
Some Data-gathering Methods in Observational Research
9

Correlational Research
• One form of observational research
• Observe ≥2 variables to see if there are correlations between them
• Cannot establish causality
10

Discussion / Questions
• How does observational research differ from experimental research?
• Is a quasi-experimental design observational or experimental? What about PxE designs?
11

Correlational Research
• What makes an observational study correlational is not the data-gathering method, but rather the way the data are to be analyzed
• Data gathered by any observational method (survey, archival, case study, program evaluation, etc.) may be examined for correlations
12

Correlational Research
• Typical outputs of correlational analysis:
• Scatterplot
• Regression line
• Correlation coefficient (r)
• Coefficient of determination (r2)
• We won’t look at how to produce any of these, but we will look at how to interpret them
13

• Most common way to look at correlational data
• One variable on x axis and the other on y. Which is which is mostly arbitrary.
• Each point represents the two scores of a single individual as a point on the graph. Thus, one is looking at the raw data (a good thing!).
Scatterplots
14
!"
#!"
$!"
%!"
&!"
'!!"
$" &" '#" '%" #!"
!"#$%&'($)*&+,-../&
0")1*(2&'($)*&+,3./&
y = 4.0376x + 14.761R² = 0.71332
• A systematic relationship between two variables.
• Positive Correlation: As one variable goes up, so does the other.
• Negative Correlation: As one variable goes up, the other goes down.
• Non-linear Relationship: Relationship between variables is complex, but orderly.
What’s a Correlation?
15

• A value representing the strength (from 0 to 1) and direction (+ or – ) of the relationship between two variables:! +1.00 = perfect positive correlation! 0.00 = no relationship! –1.00 = perfect negative correlation
• Correlation coefficients are the most common descriptive and inferential statistics for measuring correlation. Examples:
• Pearson’s r for interval / ratio data• Spearman’s rho is for ordinal data• Many many others exist (point-biserial, Kendall’s tau, Phi
coefficient...).
What’s a Correlation Coefficient?
16

r2: Coefficient of Determination
• CoD = correlation coefficient squared
• The %age of variability in X accounted for by YExample: If correlation coefficient = 0.5, " then CoD = 0.5 x 0.5 = (0.5)2 = .25" That is, 25% of variability in X is accounted for by Y
• A measure of the fit of the regression line
• An index of how accurate predictions based on the regression formula will be.r2 = 0 : No predictive powerr2 = 1 : Perfect predictive power
17

Regression Line
• Usually, we fit the data in a correlational analysis with a regression line, aka line of best fit
• This is analogous to the mean, except it’s in two dimensions instead of one
• It takes the form of a geometric line, y = ax + b, where a is the slope and b is the intercept (constants)
• Entering x into the equation yields the predicted y value
• Again, r2 tells us how accuracy this prediction will be on average
18

• From these data, we can predict that someone with a score of 16 on the midterm will get 4.0376 × 16 + 14.761 = 79.24% as their final grade
• r2 = .71, so prediction should be quite accurate
Prediction from Regression Line
!"
#!"
$!"
%!"
&!"
'!!"
$" &" '#" '%" #!"!"#$%&'($)*&+,-../&
0")1*(2&'($)*&+,3./&
y = 4.0376x + 14.761R² = 0.71332
19
r

!"
#"
$%"
$&"
%'"
(''''''" ()'''''" !''''''" !)'''''" )''''''" ))'''''"
!"#$%&'
()&*#%(
+$,#%-$(.,'/%&(
!"
#!"
$!"
%!"
&!"
'!!"
$" &" '#" '%" #!"
!"#$%&'($)*&+,-../&
0")1*(2&'($)*&+,3./&
y = -2E-06x + 21.045R² = 0.05114 y = 4.0376x + 14.761
R² = 0.71332
!"
#"
$"
%"
&"
'!"
!" #" $" %" &"
!"#$%&"'()*&+$,'-*$+./'01234'
(%56'78'(788""'$9*$':*,'
y = 0.0709x + 5.0249R² = 0.00271
!"
#"
$!"
$#"
%!"
%#"
!" %!" &!" '!" (!" $!!"
!"#$%&'()#*&+,#&-,,.&
/01"2&3#"4,&
y = -0.3163x + 33.149R² = 0.8904
20
21

...give a better view of the details of the data
...uncover non-linear relationships in the data that the most common summary stats may not pick up.
...uncover unusual groups of data points that may point to problems with sample selection, or lead to new research ideas.
...uncover inhomogeneity of variance that violates assumptions of Pearson’s r and Spearman’s rho
Scatterplots Can...
22
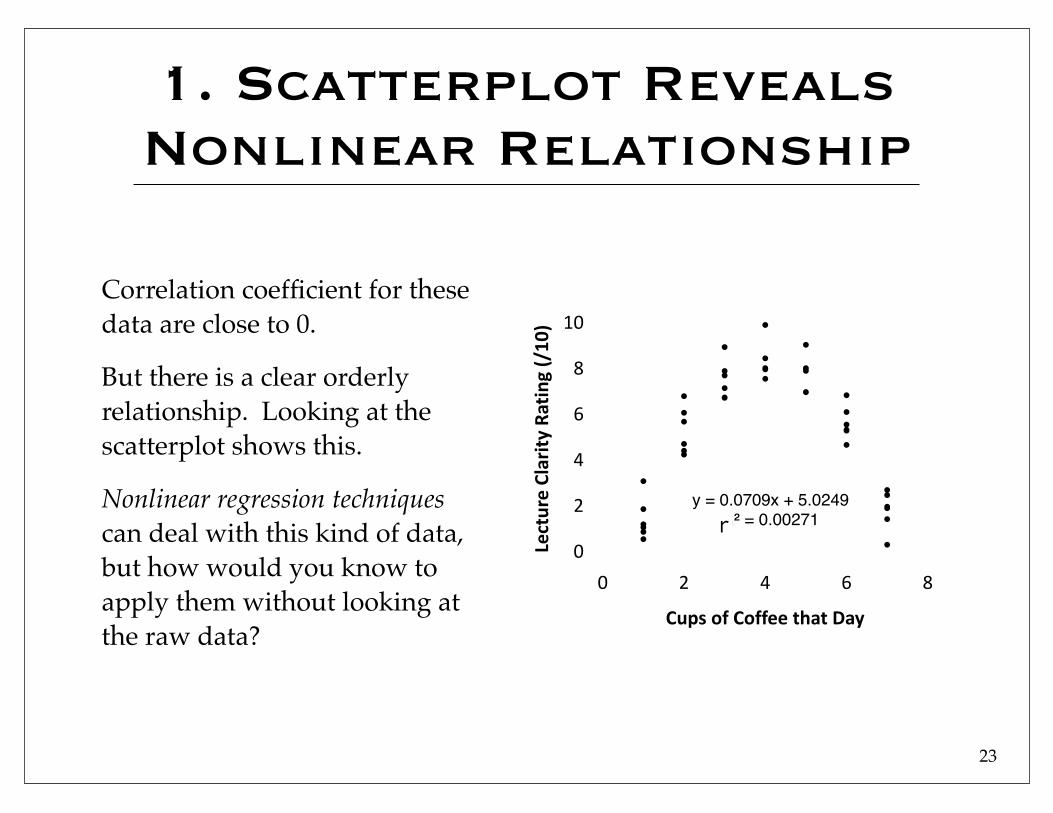
Correlation coefficient for these data are close to 0.
But there is a clear orderly relationship. Looking at the scatterplot shows this.
Nonlinear regression techniques can deal with this kind of data, but how would you know to apply them without looking at the raw data?
1. Scatterplot Reveals Nonlinear Relationship
!"
#"
$"
%"
&"
'!"
!" #" $" %" &"
!"#$%&"'()*&+$,'-*$+./'01234'
(%56'78'(788""'$9*$':*,'
y = 0.0709x + 5.0249R² = 0.00271
23
r

1. Scatterplot Reveals Nonlinear Relationship
24
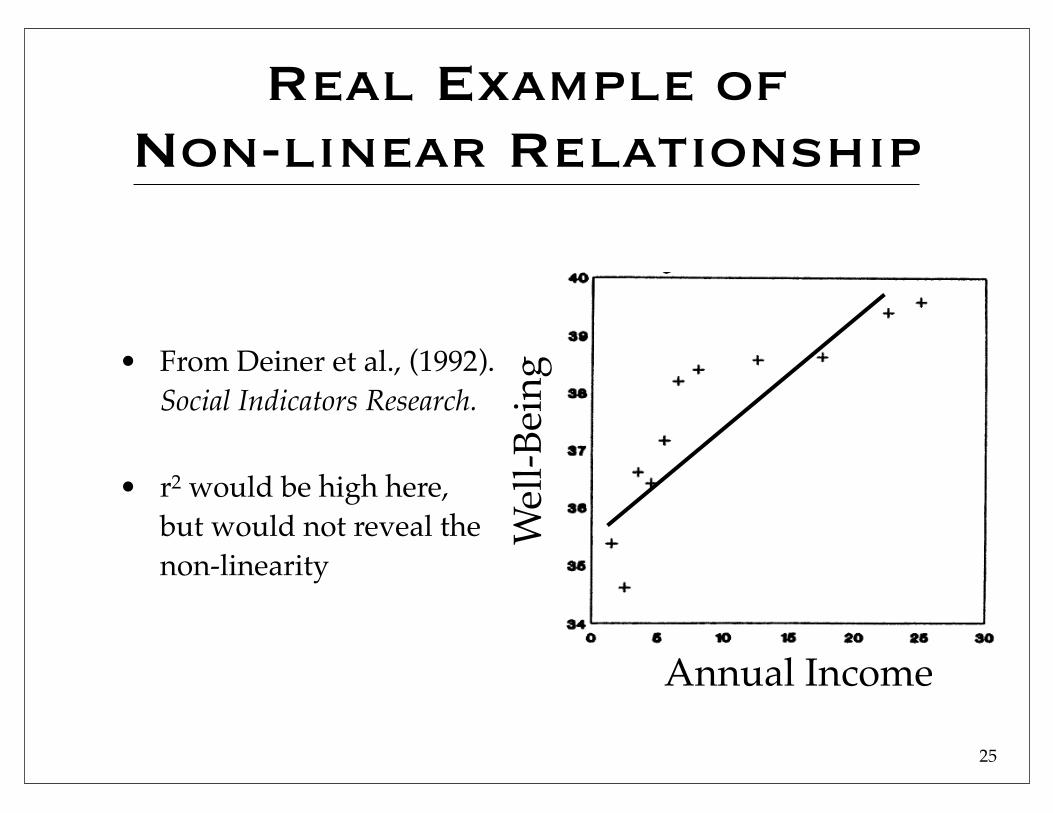
Real Example of Non-linear Relationship
Wel
l-Bei
ng
Annual Income
• From Deiner et al., (1992). Social Indicators Research.
• r2 would be high here, but would not reveal the non-linearity
25

r2 would be large for these data.
But it wouldn’t reveal outliers. They will drag the regression line towards them, making it less valid for most of the data points
Outliers can be interesting: Who are they? Why is their behaviour so different from most?
2. Revealing Individual data
Gra
de
Study Hours
Gra
de
Party Hours0 10 20 3040
60
80
100
0 10 20 3040
60
80
100
26

Many inferential statistics assume that data have homoskedasticity. That is, that variability is about the same for low, medium and high scores. Here we see that this is not the case.
3. Scatterplot Reveals Violation of Assumption of Inferential Test
0 10 20 3040
60
80
100
120
Gra
deStudy Hours
27
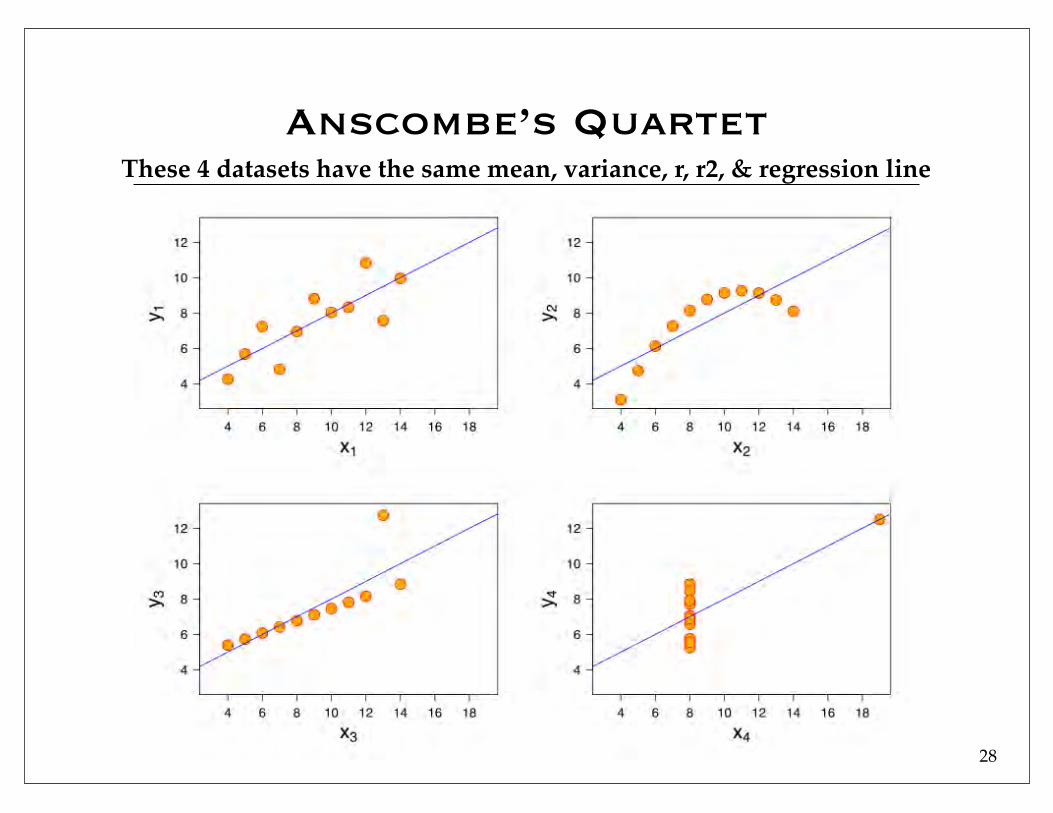
Anscombe’s QuartetThese 4 datasets have the same mean, variance, r, r2, & regression line
28

Discussion / Questions
• The regression line for IQ predicting grades is y = 50 + .25x. What is the predicted grade for an IQ of 120?
• The correlation coefficient linking IQ and grades is .7. What is the coefficient of determination? What does that suggest about this link?
29

(and their, sometimes partial, solutions)
Problems Of Interpretation
30

1. Directionality cannot be established
2. Third variables may account for relationship
3. Non-linear relationships will not show up using linear correlation coefficients.
4. Range restriction may hide relationship between X and Y.
Problems Interpreting Correlations
31

• Evidence suggests that smoking marijuana correlates with psychosis
• Does smoking MJ cause psychosis or vice versa?
• Simple correlation can’t tell you which (if either) of these is true.
1. The Directionality Problem
32

• Partial solution to directionality problem
• Logic: In order for X to cause Y, X must precede Y in time.
• Therefore, measure both X and Y at two times, getting XT1, XT2, YT1, and YT2.
• Then calculate all of the 6 correlations between these four variables.
Cross-lagged Panel Correlation Design
33

Example Results: MJ Causes Psychosis
Psychosis, Time 2Psychosis, Time1
MJ Smoking, Time1 MJ Smoking, Time2.37
.49
-.02
.42 .33.32
34

Example Results: Psychosis Causes MJ
Psychosis, Time 2Psychosis, Time1
MJ Smoking, Time1 MJ Smoking, Time2.40
.37
.42
.03 .34.29
35

M.W. Watkins et al. / Intelligence 35 (2007) 59–6836

2. The 3rd Variable Problem
• A study shows a positive correlation between ice-cream sales and street crime.
• Does that indicate that ice-cream causes crime?
• What other explanations can you think of?
37

• Correlation ≠ Causation• One Reason: A 3rd variable (Z) may be
causing simultaneous variations in the two that correlate (X and Y)
3rd Variable Problem
38

• Statistical technique. Calculates the correlation between X and Y while partialing out the effects of other vars
• If correlation between X&Y stays same with plausible 3rd variables partialed out, confidence in causal link grows
• Otherwise, 3rd variable explanation can’t be ruled out
Partial Correlation
39

One can do a partial correlation to check for the influence of any number of 3rd variables:
40

• Correlation coefficients only measure linear relationships between variables.
• But most relationships are non-linear
• Advanced statistical techniques, collectively called non-linear trend analysis or non-linear regression exist for dealing with such cases.
• Examine data via scatterplot for signs of such relationships
3. Non-linear Relationship
41

• Examining a limited range of scores will reduce r
• While this low r will be valid for the narrow range of data examined, one must be careful not to extrapolate outside that narrow range
• Generally, it is good to look at a broad range of scores
4. Range Restriction
42

Range Restriction: Example
100
110
120
130
140
150
160
170
180
130 140 150 160 170
Mother’s IQ43

Range Restriction: Example
44

• Directionality cannot be established. Use Cross-lagged Panel Correlation designs to partly solve this.
• Third variables may account for relationship. Use Partial Correlation techniques to partly solve this.
• Non-linear relationships will not show up using linear correlation stats. Examine raw data via scatterplot and use non-linear regression analysis.
• Range restriction may hide relationship between X and Y. Test a broad range of X and Y values.
Interpreting Correlations: Problems & Solutions
45

46

Discussion / Questions
• A study shows a negative correlation between the amount of golf played by people in a region and crime in that region. • What’s a likely explanation for this? • How might we investigate further?
47

Correlational Research With
Multiple Variables
48

Correlational Research: Data Gathering Methods
• Archival• Survey• Laboratory
49

• Correlational research we’ve looked at has been mainly bivariate.
• Most correlational research IRL involves 3+ measured variables.
• Recall: An advantage of observational / correlational work is that it can look at many variables at once
Correlational Research With Multiple Variables
50

• Research often examines multiple predictor variables to see if/how they correlate with a criterion (=predicted) variable
• Example fictional study might use archival and survey methods in combination:
• Archival: Examine various national governments’ records regarding the following predictor variables: Life Expectancy! Per-capita income! Years of education
• Survey: Ask citizens of those countries a series of questions to get an overall Life Satisfaction Rating (the criterion variable)
Archival & Survey Research
51

Correlational Laboratory Research
• Data gathered in similar manner to experiments. Difference: No variables are manipulated
• Unlike quasi-experimental designs, variables are not divided into discrete categories, but are treated as continuous (where appropriate).
• Often examines many more variables than an experiment
• Example: Bring individuals who self-report some kind of mood disorder to live in a controlled lab setting for a week, and have observers rate several characteristics of their behaviour over that time.
52

• Correlational studies with multiple variables involve very similar methodologies to those with just two variables.
• The main difference is in how the data is analyzed. There are many options. Some examples:
• Multiple regression
• Canonical Correlation
• Latent Variable analysis
Correlational Research With Multiple Variables
53
• If you measure 3+ variables, you can declare one of them the “predicted” variable and the others the “predictor” variables.
• More predictor variables (usually) means better predictions.
• For instance, you might get better prediction of psych graduates’ job income by measuring 5 variables instead of 1.
Multiple Regression
54
Employers value......critical thinking ability
...data analysis skills
...the ability to search databases for relevant information
...general scientific literacy
...the ability to write clearly and concisely
This class will help you improve all of these skills
55

• Let’s say your 5 predictors are:a." Ability to write clearly and conciselyb." Bibliographic database search skillsc." Critical Thinkingd." Data Analysis skillse." Expertise in research design
• Multiple regression procedure might yield the following regression line (yes, just like regular regression):! Y = 2a + 1b + 0.5c + 2d + 1e + 1
• Assuming all the predictors are measured on the same scale (or are standardized to z-scores), the coefficients indicate the relative contributions of each one.
Multiple Regression
56

• As with “regular” regression, multiple regression yields a measure of fit of the regression line to the data, symbolized as R2 (note capitalization)
• R2, just like r2, ranges from 0 (no predictive power) to 1 (perfect predictive power).
Multiple R2
57

• Let’s say your scores on the 5 predictors are:a." 1 " Ability to write clearly and conciselyb." 1.5 "Bibliographic database search skillsc." 2 " Critical Thinkingd." 0 " Data Analysis skillse." 1 " Expertise in research design
• Your predicted income would be! Y = 2(1) + 1(1.5) + 0.5(2) + 2(0) + 1(1) + 1! Y = 2 + 1.5 + 1 + 0 + 1 + 1! Y = 6.5 (hopefully starting salary in 10k$)
Multiple Regression
58

• When you’ve measured 4+ variables, you can declare one group of them to be the predictor variables and the rest to be the predicted variables.
• For example, you might compare 3 police deployment variables with 4 crime variables.
• Police deployment variables: foot patrols car patrols community relations
• Street crime variables: assaults vandalism theft solicitation
Canonical Correlation
59

• CC will tell you to what degree each of the variables in the “police deployment” pack predicts each of the variables in the “street crime” pack. This would be in the form of numbers called “weights”.
• For instance, you might find that the number of foot patrols was strongly linked to all the crime variables (large weights), but especially assaults (very large weight), while the number of community relations exercises might be more related to vandalism and solicitation.
• CC can also be used to find “latent variables”, in a way similar to PCA and FA (on which more presently)
Canonical Correlation
60

• If you measure 4+ variables, you can see how they all correlate with one another, and if they can be “clumped” into fewer variables. Note that there are no predictor or predicted variables here.
• Latent variable analysis essentially tells you if your X variables can be boiled down to a smaller number of underlying variables.
Latent Variable Analysis
61

• There are many different forms of latent variable analysis:
• Canonical correlation
• Factor analysis
• Principle components analysis
• Path analysis
• More generally, structural equation modelling
Latent Variable Analysis
62

For instance, you might measure 6 different variables related to mood disorders:- Social situation avoidance (SSA) - Jitteriness (JIT)- Paranoid thoughts (PTh)- Suicidal thoughts (STh)- Listlessness (LST)- Self-criticism (S-C)- Sleeplessness (SLP)
Latent Variable Analysis
63

Latent Variable Analysis
SSA Jitter Para Suic List S-crit Sleep
SSA +.49 +.60 -0.09 -0.05 +.02 +.38
Jitter +.65 +.01 -0.07 +.08 +.40
Para +.09 -0.02 -0.04 +.37
Suic +.52 +.71 +.41
List +.66 +.44
S-crit +.33
Sleep
64

• What this example suggests is there are 3 “clumps” of variables underlying the 7 variables we measured.
• What could we call these clumps (AKA, latent variables)?
• What is the significance of the fact that sleep disturbance seems to correlate with all of the other variables?
Latent Variable Analysis
65

Discussion / Questions
• Is your mind blown yet?• How much money do you expect to
make when you get out of here?• Is that really the point, though?
66