9-1 prepared by coby harmon university of california, santa barbara intermediat e accounting...
TRANSCRIPT
9-1
Prepared by Prepared by Coby Harmon Coby Harmon
University of California, Santa BarbaraUniversity of California, Santa Barbara
IntermediatIntermediate e
AccountingAccounting
IntermediatIntermediate e
AccountingAccounting
Prepared by Prepared by Coby Harmon Coby Harmon
University of California, Santa BarbaraUniversity of California, Santa BarbaraWestmont CollegeWestmont College
INTERMEDIATE
ACCOUNTINGF I F T E E N T H E D I T I O N
Prepared byCoby Harmon
University of California, Santa BarbaraWestmont College
kiesoweygandtwarfield
team for success
9-2
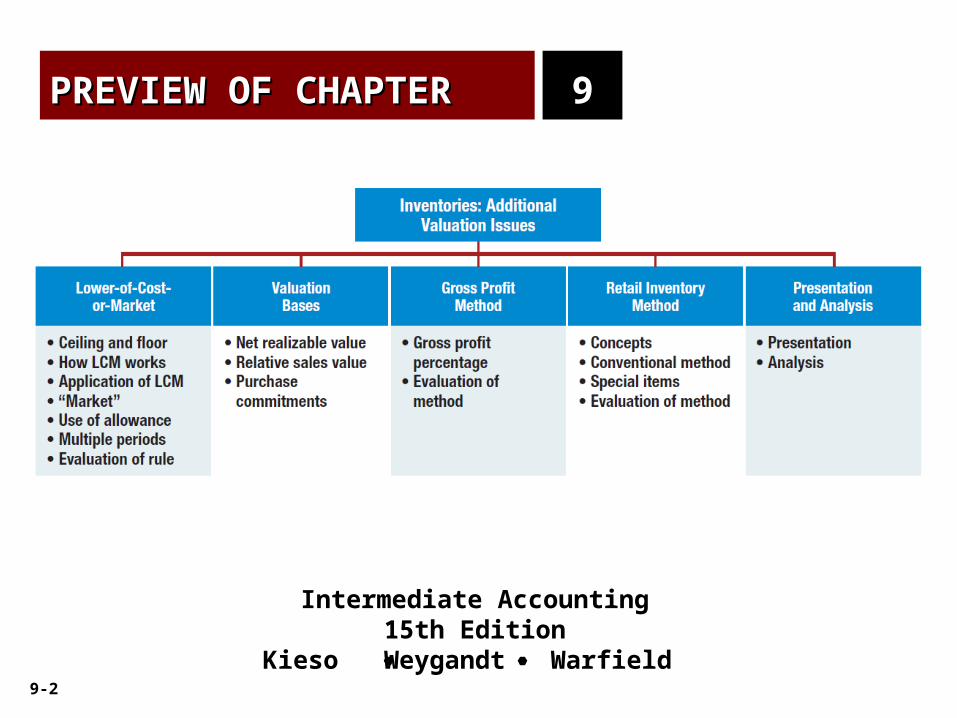
PREVIEW OF CHAPTERPREVIEW OF CHAPTER
Intermediate Accounting15th Edition
Kieso Weygandt Warfield
99
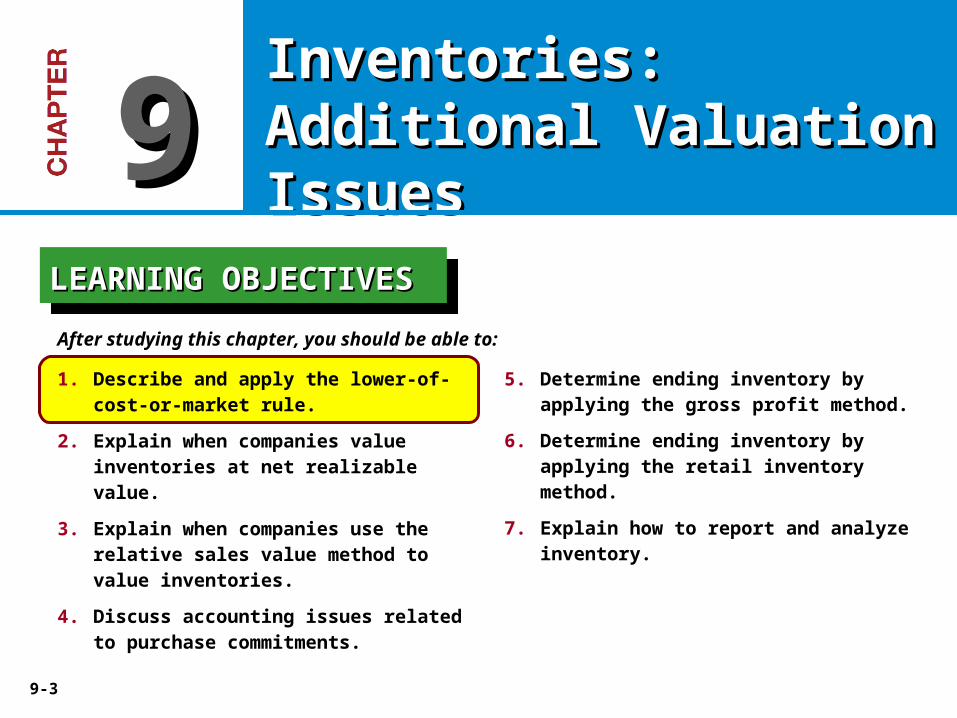
9-3
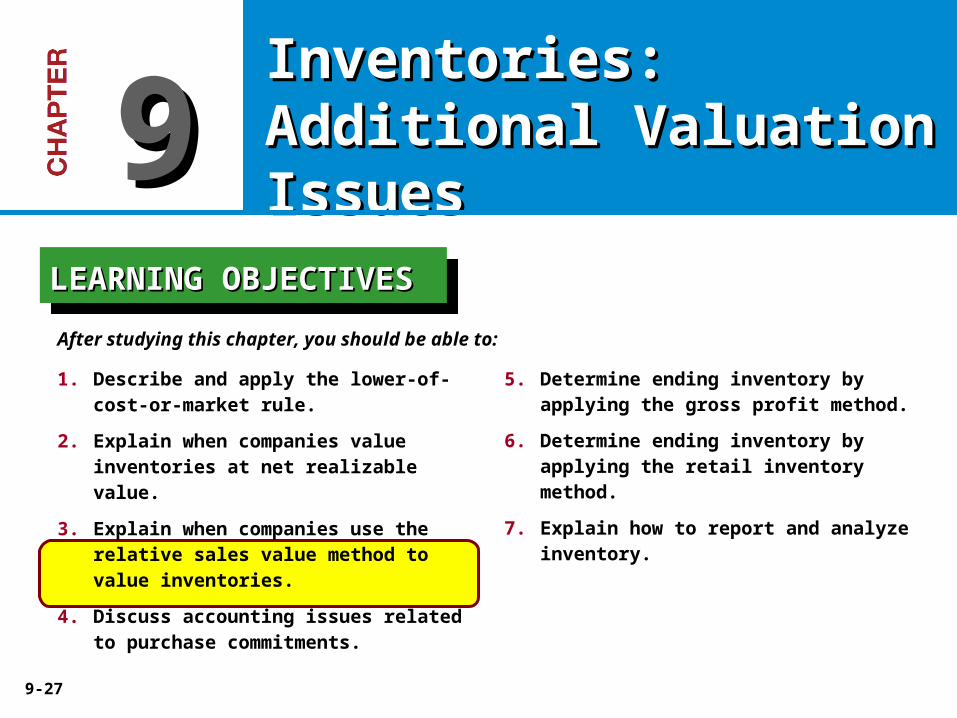
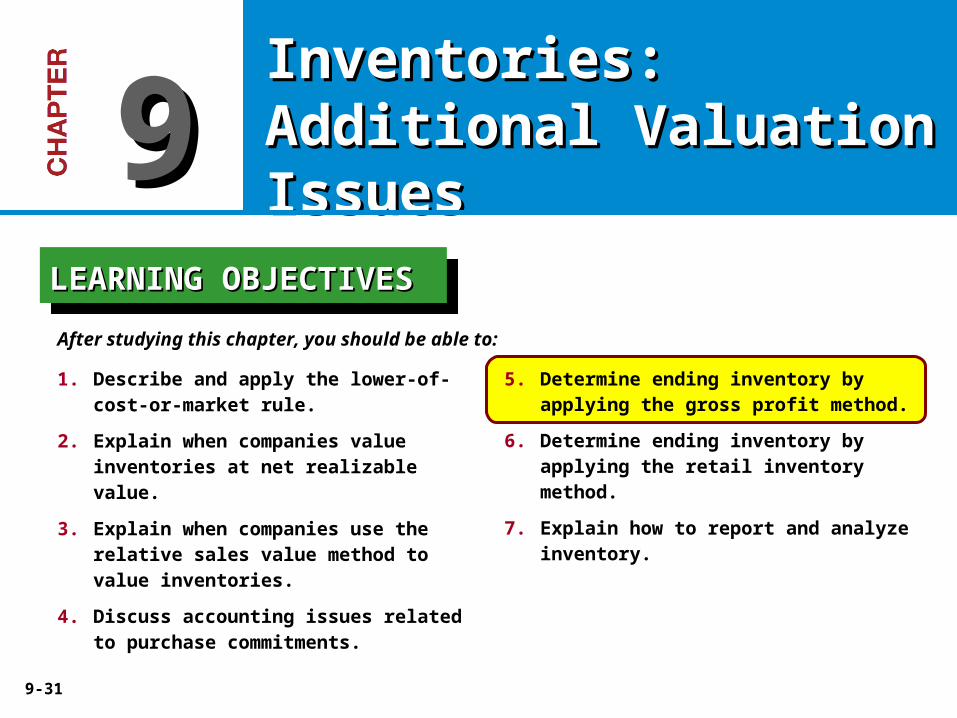
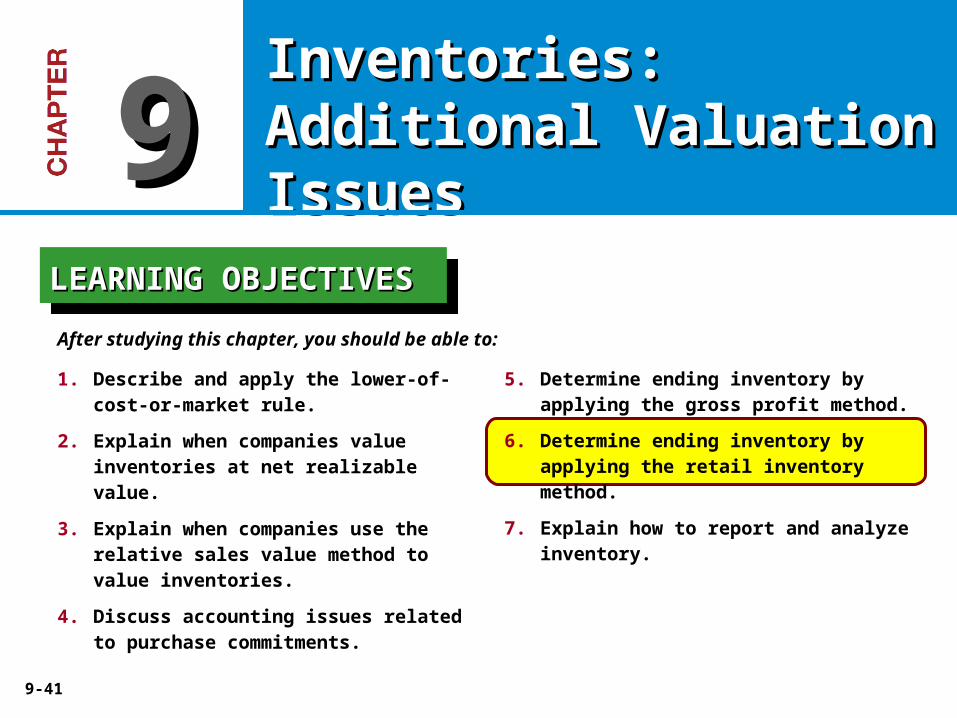
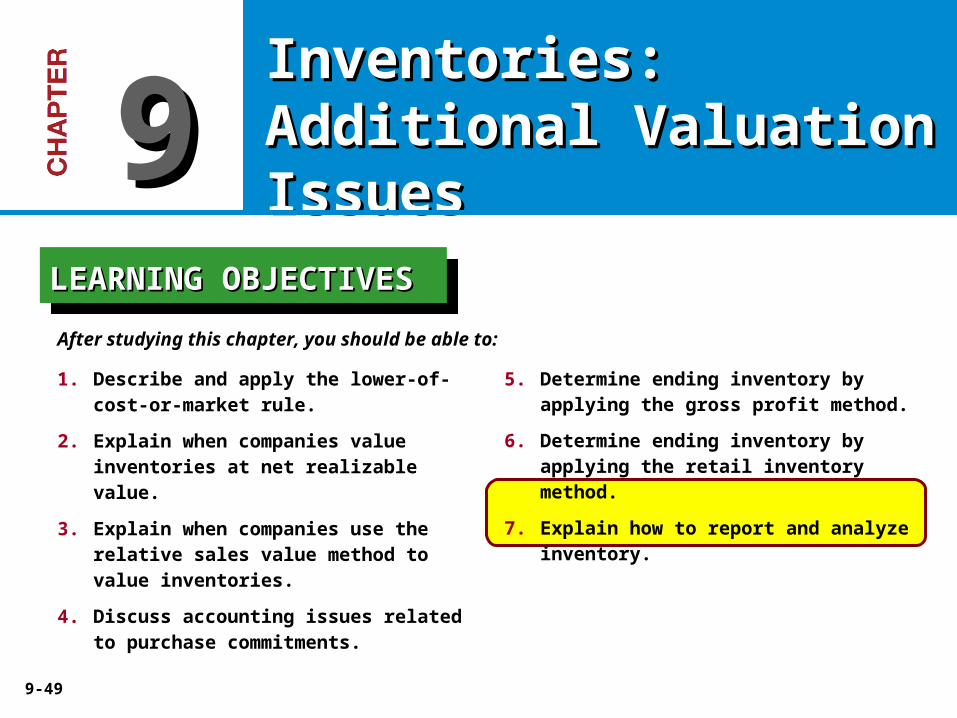
5. Determine ending inventory by applying the gross profit method.
6. Determine ending inventory by applying the retail inventory method.
7. Explain how to report and analyze inventory.
After studying this chapter, you should be able to:
Inventories: Additional Inventories: Additional Valuation IssuesValuation Issues99
LEARNING OBJECTIVESLEARNING OBJECTIVESLEARNING OBJECTIVESLEARNING OBJECTIVES
1. Describe and apply the lower-of-cost-or-market rule.
2. Explain when companies value inventories at net realizable value.
3. Explain when companies use the relative sales value method to value inventories.
4. Discuss accounting issues related to purchase commitments.
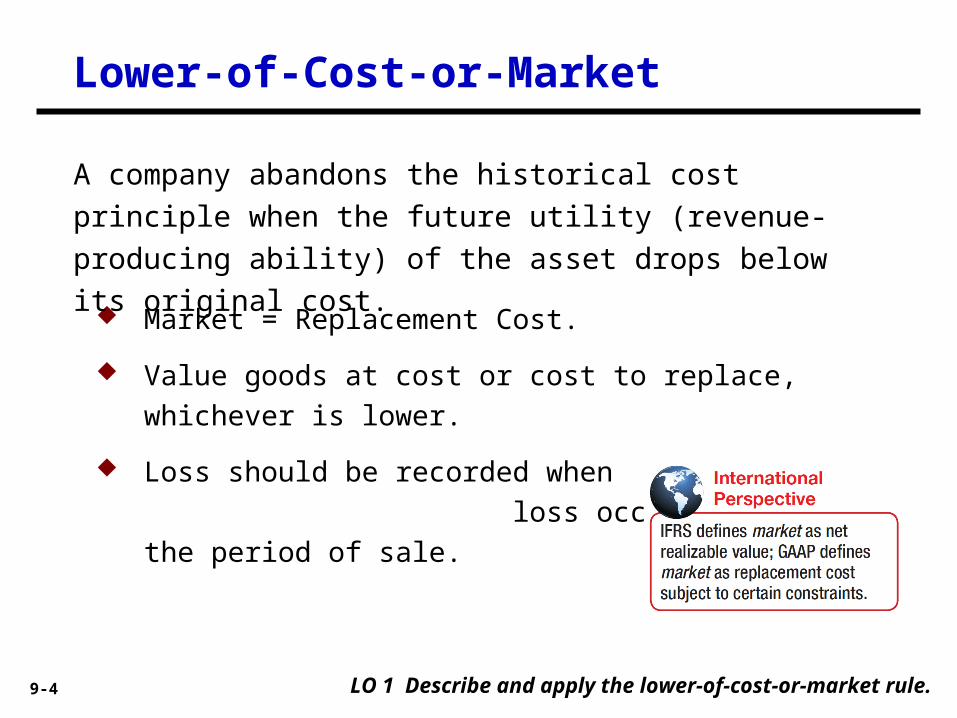
9-4
Market = Replacement Cost.
Value goods at cost or cost to replace, whichever is
lower.
Loss should be recorded when
loss occurs, not in the period of sale.
A company abandons the historical cost principle when the
future utility (revenue-producing ability) of the asset drops
below its original cost.
LO 1 Describe and apply the lower-of-cost-or-market rule.
Lower-of-Cost-or-Market
9-5 LO 1
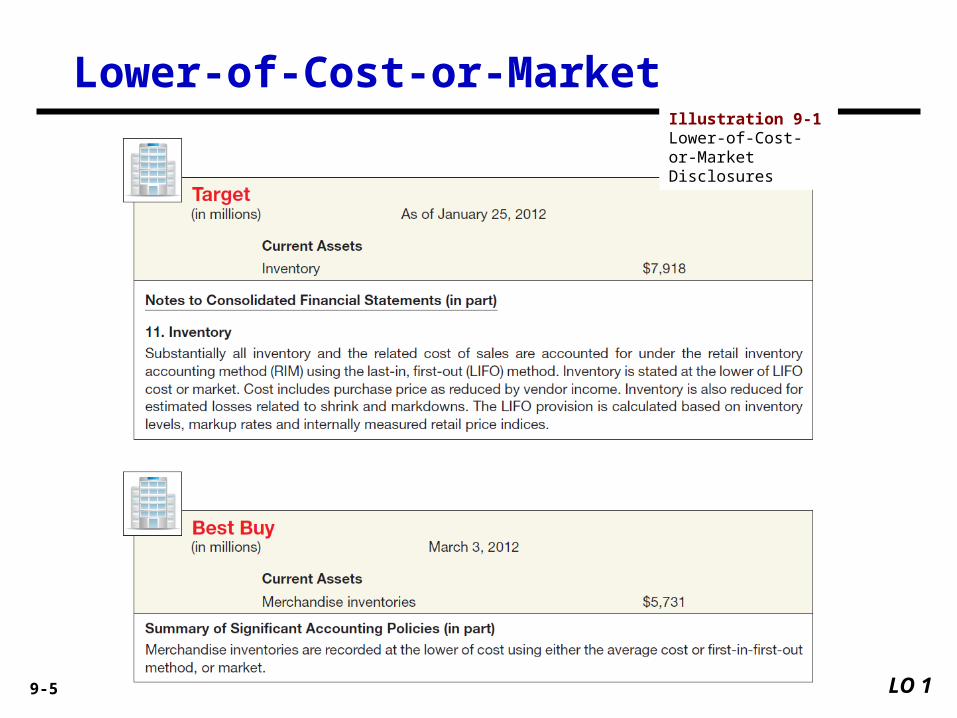
Lower-of-Cost-or-MarketIllustration 9-1 Lower-of-Cost-or-Market Disclosures
9-6
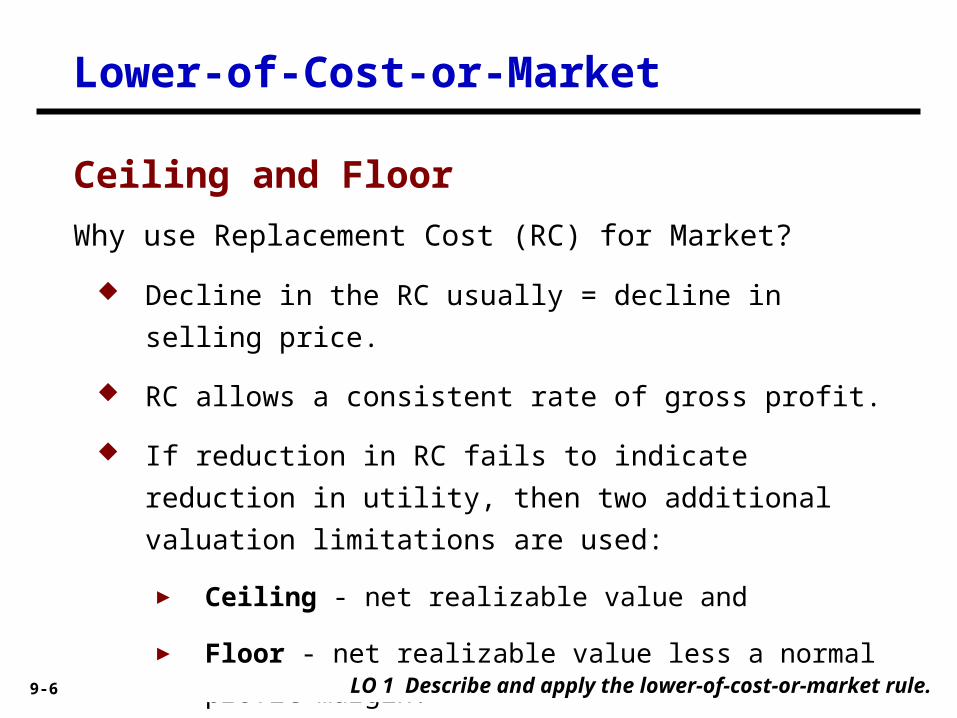
Decline in the RC usually = decline in selling price.
RC allows a consistent rate of gross profit.
If reduction in RC fails to indicate reduction in utility, then
two additional valuation limitations are used:
► Ceiling - net realizable value and
► Floor - net realizable value less a normal profit margin.
Why use Replacement Cost (RC) for Market?
LO 1 Describe and apply the lower-of-cost-or-market rule.
Ceiling and Floor
Lower-of-Cost-or-Market

9-7
Net realizable value (NRV) is the is the estimated selling
price in the ordinary course of business, less reasonably
predictable costs of completion and disposal (often referred
to as net selling price).Illustration 9-2
LO 1 Describe and apply the lower-of-cost-or-market rule.
Lower-of-Cost-or-Market
9-8
NotNot<<
CostCost MarketMarket
Ceiling = NRVCeiling = NRV
ReplacementCost
ReplacementCost
Floor =NRV less Normal
Profit Margin
Floor =NRV less Normal
Profit MarginGAAPLCM
GAAPLCM
What is the rationale for the
Ceiling and Floor limitations?
LO 1 Describe and apply the lower-of-cost-or-market rule.
NotNot>>
Illustration 9-3
Lower-of-Cost-or-Market

9-9
Ceiling – prevents overstatement of the value of obsolete,
damaged, or shopworn inventories.
Floor – deters understatement of inventory and
overstatement of the loss in the current period.
LO 1 Describe and apply the lower-of-cost-or-market rule.
Lower-of-Cost-or-Market
What is the rationale for the Ceiling and Floor limitations?
9-10 LO 1 Describe and apply the lower-of-cost-or-market rule.
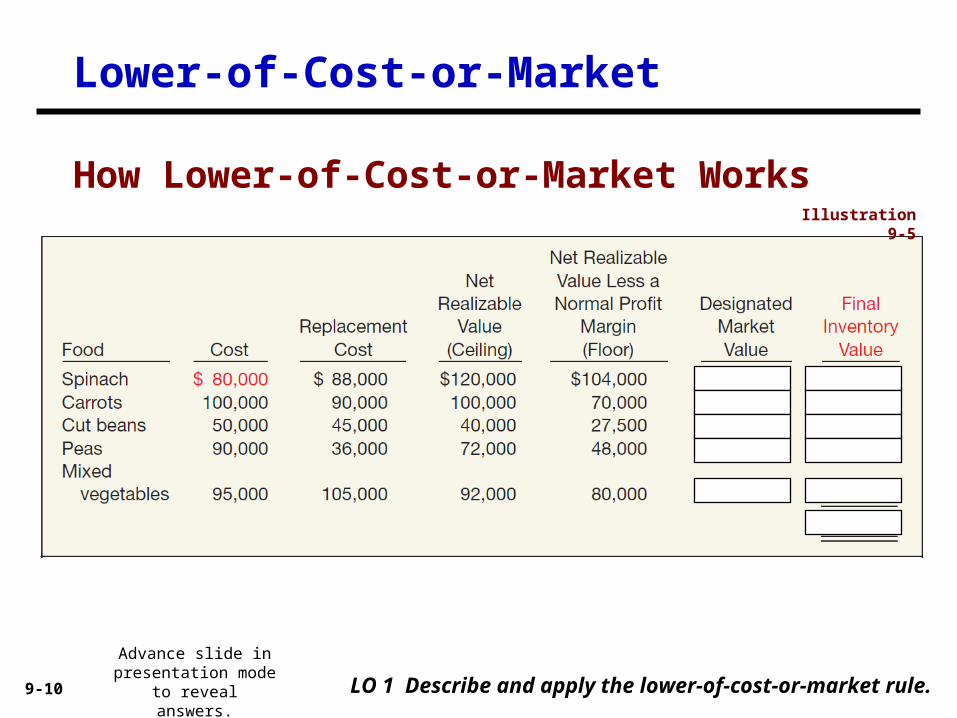
How Lower-of-Cost-or-Market WorksIllustration 9-5
Lower-of-Cost-or-Market
Advance slide in presentation mode to
reveal answers.

9-11 LO 1 Describe and apply the lower-of-cost-or-market rule.
Methods of Applying Lower-of-Cost-or-MarketIllustration 9-6
Lower-of-Cost-or-Market
Advance slide in presentation mode to
reveal answers.
9-12 LO 1 Describe and apply the lower-of-cost-or-market rule.
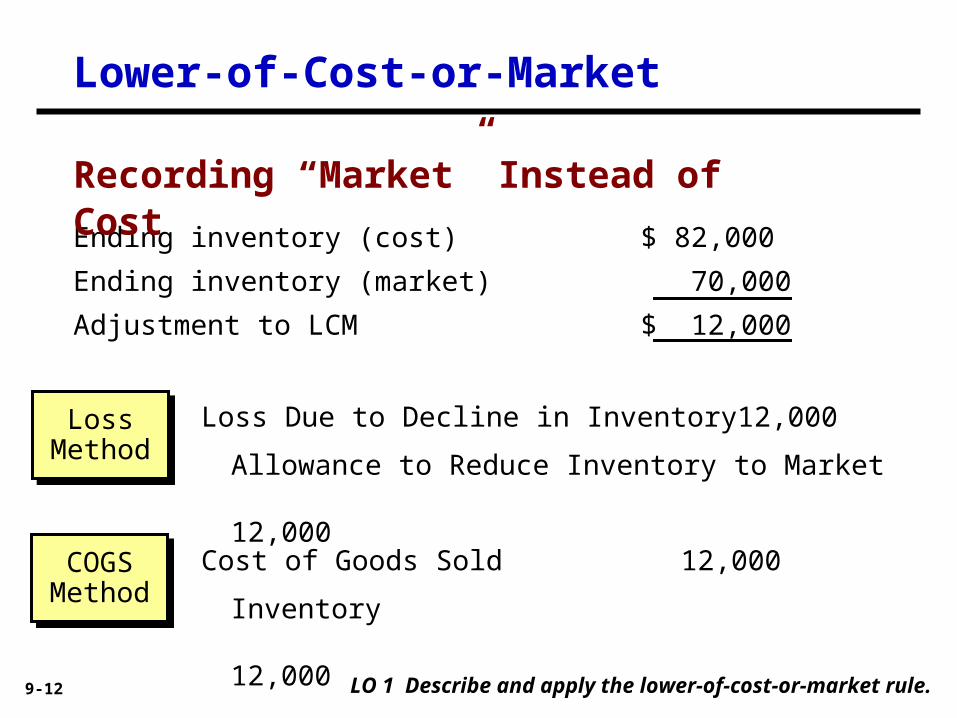
Ending inventory (cost) $ 82,000
Ending inventory (market) 70,000
Adjustment to LCM $ 12,000
Allowance to Reduce Inventory to Market
12,000
Loss Due to Decline in Inventory 12,000
Inventory
12,000
Cost of Goods Sold 12,000
Loss MethodLoss
Method
COGSMethodCOGSMethod
Recording “Market” Instead of Cost
Lower-of-Cost-or-Market

9-13
Loss COGS
Method Method
Current assets:
Cash 100,000$ 100,000$
Accounts receivable 350,000 350,000
Inventory 770,000 (758,000)
Less: allowance to market (12,000)
Prepaids 20,000 20,000
Total current assets 1,175,000 1,175,000
LO 1 Describe and apply the lower-of-cost-or-market rule.
Balance Sheet
Lower-of-Cost-or-Market
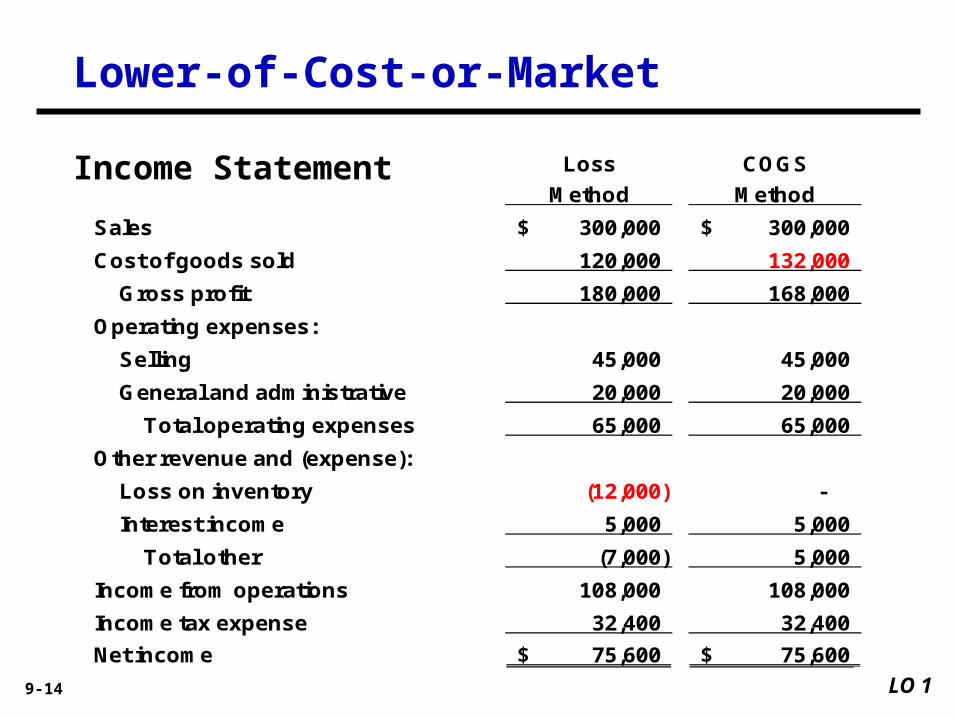
9-14
Loss COGS
Method Method
Sales 300,000$ 300,000$
Cost of goods sold 120,000 132,000
Gross profit 180,000 168,000
Operating expenses:
Selling 45,000 45,000
General and administrative 20,000 20,000
Total operating expenses 65,000 65,000
Other revenue and (expense):
Loss on inventory (12,000) -
Interest income 5,000 5,000
Total other (7,000) 5,000
Income from operations 108,000 108,000
Income tax expense 32,400 32,400
Net income 75,600$ 75,600$
LO 1
Income Statement
Lower-of-Cost-or-Market
9-15
Illustration: Remmers Company manufactures desks. The company attempts to obtain a 20% gross margin on selling price. At December 31, 2014, the following finished desks appear in the company’s inventory.
The 2014 catalog was in effect through November 2014, and the 2015 catalog is effective as of December 1, 2015.
Instructions: At what amount should each of the four desks appear in the company’s December 31, 2015, inventory, assuming that the company has adopted a lower-of-FIFO-cost-or-market approach for valuation of inventories on an individual-item basis?
Lower-of-Cost-or-Market
LO 1

9-16
NotNot<<
Cost = 470Cost = 470 Market = 450Market = 450
Ceiling = 450(500 – 50)(500 – 50)
Ceiling = 450(500 – 50)(500 – 50)
ReplacementCost = 460
ReplacementCost = 460
Floor = 350(450-(500 x 20%))(450-(500 x 20%))
Floor = 350(450-(500 x 20%))(450-(500 x 20%))
LCM = 450LCM = 450
NotNot>>
Finished Desks A
Inventory cost 470$
Est. cost to manufacture 460
Commissions and disposal costs 50
Catalog selling price 500
Lower-of-Cost-or-Market
LO 1

9-17
NotNot<<
Cost = 450Cost = 450 Market = 430Market = 430
Ceiling = 480(540 – 60)(540 – 60)
Ceiling = 480(540 – 60)(540 – 60)
ReplacementCost = 430
ReplacementCost = 430
Floor = 372(480-(540 x 20%))(480-(540 x 20%))
Floor = 372(480-(540 x 20%))(480-(540 x 20%))
LCM = 430LCM = 430
NotNot>>
Finished Desks B
Inventory cost 450$
Est. cost to manufacture 430
Commissions and disposal costs 60
Catalog selling price 540
Lower-of-Cost-or-Market
LO 1
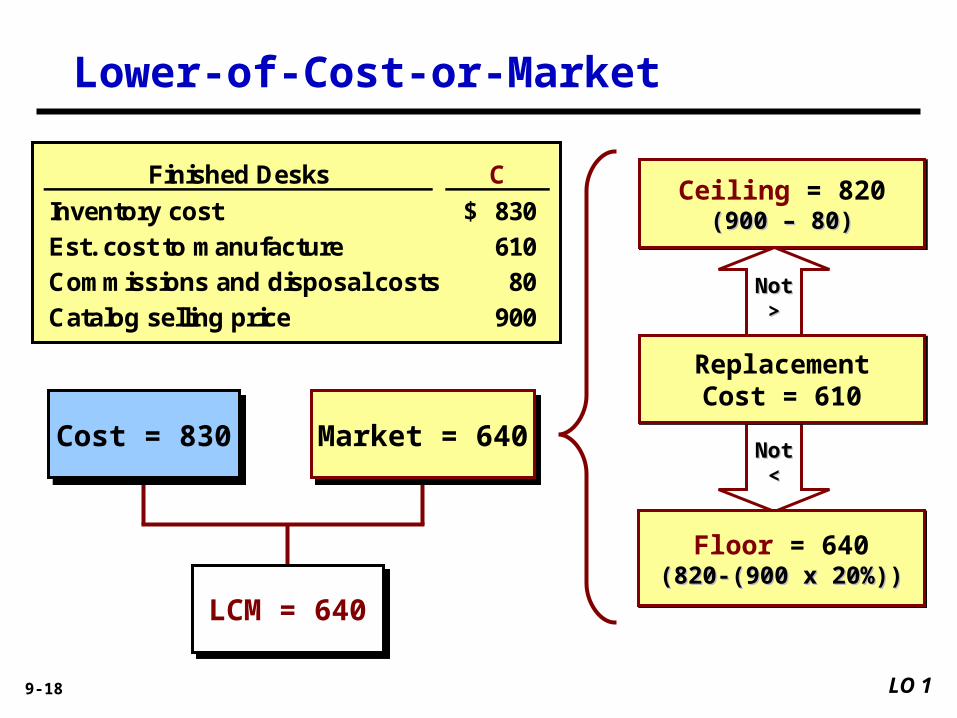
9-18
NotNot<<
Cost = 830Cost = 830 Market = 640Market = 640
Ceiling = 820(900 – 80)(900 – 80)
Ceiling = 820(900 – 80)(900 – 80)
ReplacementCost = 610
ReplacementCost = 610
Floor = 640(820-(900 x 20%))(820-(900 x 20%))
Floor = 640(820-(900 x 20%))(820-(900 x 20%))
LCM = 640LCM = 640
NotNot>>
Finished Desks C
Inventory cost 830$
Est. cost to manufacture 610
Commissions and disposal costs 80
Catalog selling price 900
Lower-of-Cost-or-Market
LO 1
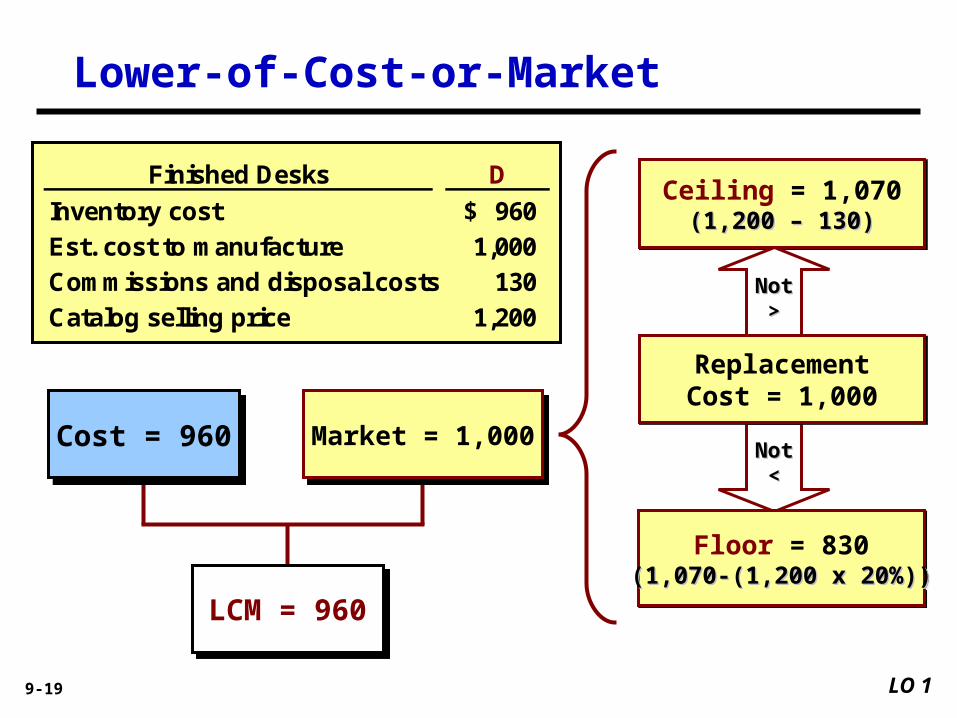
9-19
NotNot<<
Cost = 960Cost = 960 Market = 1,000Market = 1,000
Ceiling = 1,070(1,200 – 130)(1,200 – 130)
Ceiling = 1,070(1,200 – 130)(1,200 – 130)
ReplacementCost = 1,000ReplacementCost = 1,000
Floor = 830(1,070-(1,200 x 20%))(1,070-(1,200 x 20%))
Floor = 830(1,070-(1,200 x 20%))(1,070-(1,200 x 20%))
LCM = 960LCM = 960
NotNot>>
Finished Desks D
Inventory cost 960$
Est. cost to manufacture 1,000
Commissions and disposal costs 130
Catalog selling price 1,200
Lower-of-Cost-or-Market
LO 1

9-20 LO 1 Describe and apply the lower-of-cost-or-market rule.
Use of an Allowance—Multiple Periods
In general, accountants leave the allowance account on the
books. They merely adjust the balance at the next year-end to
agree with the discrepancy between cost and the lower-of-cost-
or-market at that balance sheet date.Illustration 9-10
Lower-of-Cost-or-Market

9-21
Expense recorded when loss in utility occurs. Profit on sale recognized at the point of sale.
Inventory valued at cost in one year and at market in the next year.
Net income in year of loss is lower. Net income in subsequent period may be higher than normal if expected reductions in sales price do not materialize.
LCM uses a “normal profit” in determining inventory values, which is a subjective measure.
Some Deficiencies:
LO 1 Describe and apply the lower-of-cost-or-market rule.
Evaluation of Lower-of-Cost-or-Market Rule
Lower-of-Cost-or-Market
9-22
5. Determine ending inventory by applying the gross profit method.
6. Determine ending inventory by applying the retail inventory method.
7. Explain how to report and analyze inventory.
After studying this chapter, you should be able to:
Inventories: Additional Inventories: Additional Valuation IssuesValuation Issues99
LEARNING OBJECTIVESLEARNING OBJECTIVESLEARNING OBJECTIVESLEARNING OBJECTIVES
1. Describe and apply the lower-of-cost-or-market rule.
2. Explain when companies value inventories at net realizable value.
3. Explain when companies use the relative sales value method to value inventories.
4. Discuss accounting issues related to purchase commitments.
9-23
(1) a controlled market with a quoted price applicable to all
quantities, and
(2) no significant costs of disposal
or
(3) too difficult to obtain cost figures.
Permitted by GAAP under the following conditions:
Valuation Bases
Valuation at Net Realizable Value
LO 2 Explain when companies value inventories at net realizable value.

9-24
5. Determine ending inventory by applying the gross profit method.
6. Determine ending inventory by applying the retail inventory method.
7. Explain how to report and analyze inventory.
After studying this chapter, you should be able to:
Inventories: Additional Inventories: Additional Valuation IssuesValuation Issues99
LEARNING OBJECTIVESLEARNING OBJECTIVESLEARNING OBJECTIVESLEARNING OBJECTIVES
1. Describe and apply the lower-of-cost-or-market rule.
2. Explain when companies value inventories at net realizable value.
3. Explain when companies use the relative sales value method to value inventories.
4. Discuss accounting issues related to purchase commitments.
9-25
Used when buying varying units in a single lump-sum purchase.
Valuation Bases
Valuation Using Relative Sales Value
Illustration: Woodland Developers purchases land for $1 million
that it will subdivide into 400 lots. These lots are of different sizes
and shapes but can be roughly sorted into three groups graded A,
B, and C. As Woodland sells the lots, it apportions the purchase
cost of $1 million among the lots sold and the lots remaining on
hand. Calculate the cost of lots sold and gross profit.
LO 3 Explain when companies use the relative sales value method to value inventories.

9-26
Valuation Bases
LO 3 Explain when companies use the relative sales value method to value inventories.
Illustration 9-11Allocation of Costs, Using Relative Sales Value
Illustration 9-12Determination of Gross Profit, Using Relative Sales Value
9-27
5. Determine ending inventory by applying the gross profit method.
6. Determine ending inventory by applying the retail inventory method.
7. Explain how to report and analyze inventory.
After studying this chapter, you should be able to:
Inventories: Additional Inventories: Additional Valuation IssuesValuation Issues99
LEARNING OBJECTIVESLEARNING OBJECTIVESLEARNING OBJECTIVESLEARNING OBJECTIVES
1. Describe and apply the lower-of-cost-or-market rule.
2. Explain when companies value inventories at net realizable value.
3. Explain when companies use the relative sales value method to value inventories.
4. Discuss accounting issues related to purchase commitments.
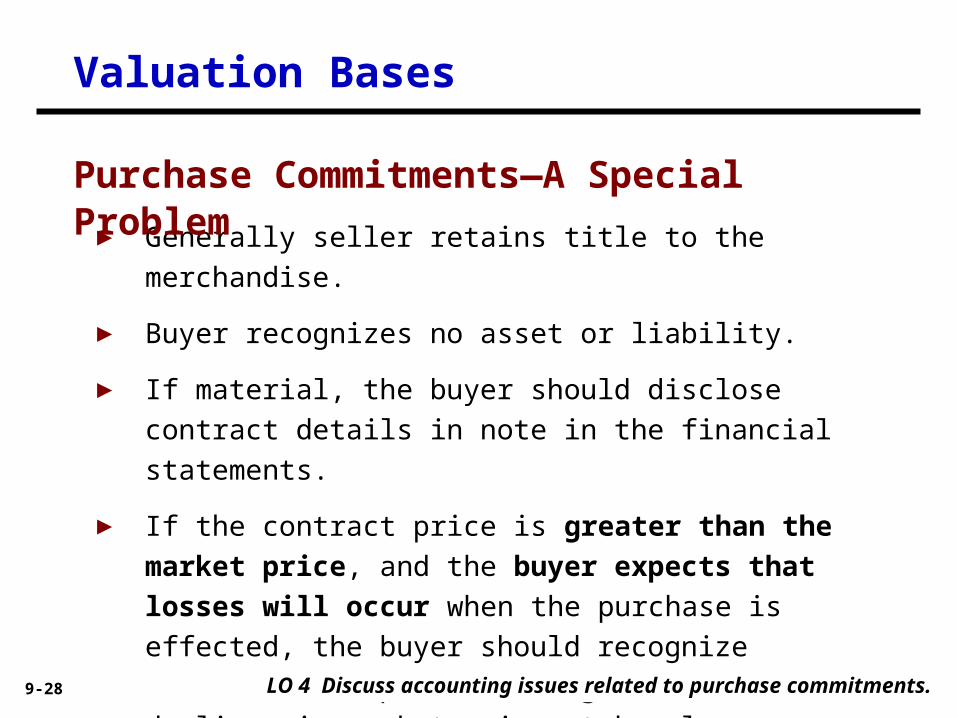
9-28
► Generally seller retains title to the merchandise.
► Buyer recognizes no asset or liability.
► If material, the buyer should disclose contract details in
note in the financial statements.
► If the contract price is greater than the market price,
and the buyer expects that losses will occur when the
purchase is effected, the buyer should recognize losses
in the period during which such declines in market prices
take place.
Valuation Bases
LO 4 Discuss accounting issues related to purchase commitments.
Purchase Commitments—A Special Problem
9-29
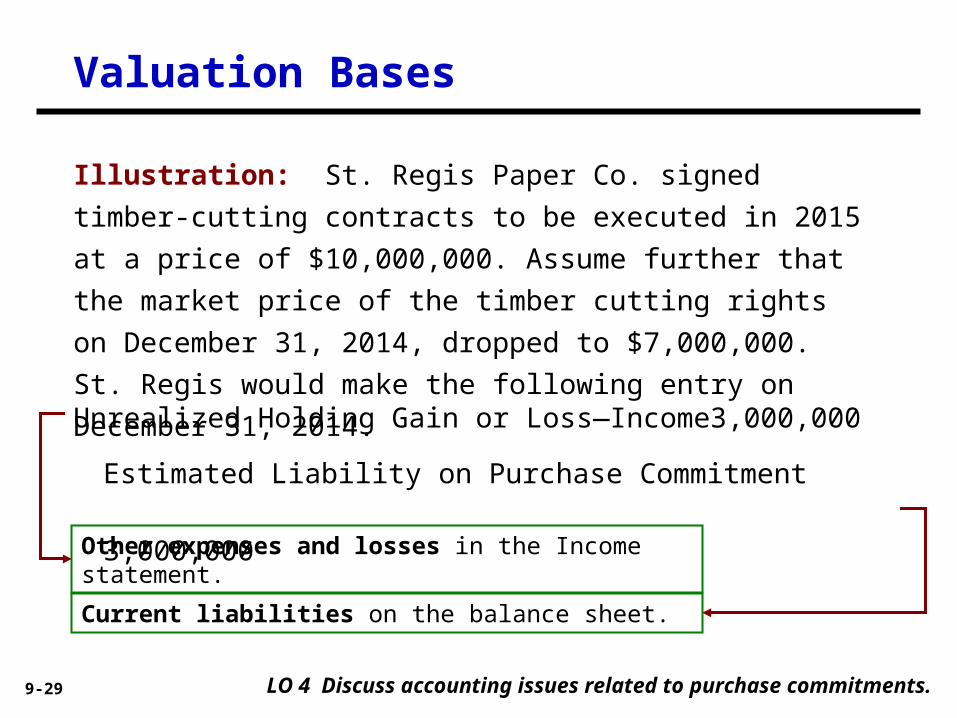
Valuation Bases
LO 4 Discuss accounting issues related to purchase commitments.
Illustration: St. Regis Paper Co. signed timber-cutting contracts
to be executed in 2015 at a price of $10,000,000. Assume
further that the market price of the timber cutting rights on
December 31, 2014, dropped to $7,000,000. St. Regis would
make the following entry on December 31, 2014.
Unrealized Holding Gain or Loss—Income 3,000,000
Estimated Liability on Purchase Commitment
3,000,000Other expenses and losses in the Income statement.
Current liabilities on the balance sheet.
9-30
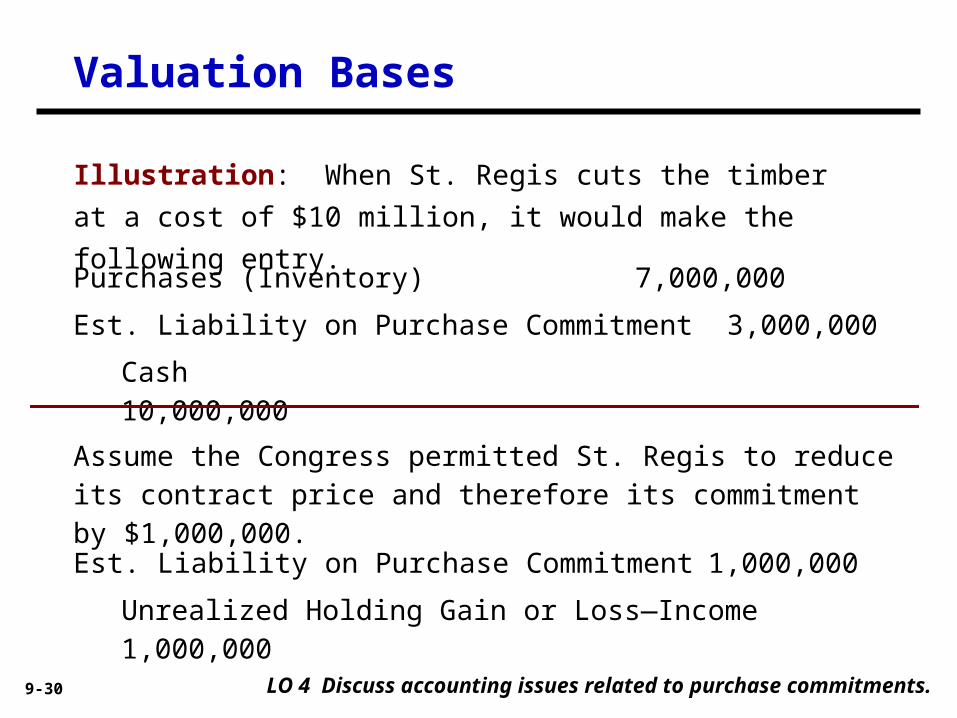
Valuation Bases
LO 4 Discuss accounting issues related to purchase commitments.
Purchases (Inventory) 7,000,000
Est. Liability on Purchase Commitment 3,000,000
Cash 10,000,000
Assume the Congress permitted St. Regis to reduce its contract price and therefore its commitment by $1,000,000.
Est. Liability on Purchase Commitment 1,000,000
Unrealized Holding Gain or Loss—Income 1,000,000
Illustration: When St. Regis cuts the timber at a cost of $10
million, it would make the following entry.
9-31
5. Determine ending inventory by applying the gross profit method.
6. Determine ending inventory by applying the retail inventory method.
7. Explain how to report and analyze inventory.
After studying this chapter, you should be able to:
Inventories: Additional Inventories: Additional Valuation IssuesValuation Issues99
LEARNING OBJECTIVESLEARNING OBJECTIVESLEARNING OBJECTIVESLEARNING OBJECTIVES
1. Describe and apply the lower-of-cost-or-market rule.
2. Explain when companies value inventories at net realizable value.
3. Explain when companies use the relative sales value method to value inventories.
4. Discuss accounting issues related to purchase commitments.

9-32 LO 5 Determine ending inventory by applying the gross profit method.
Substitute Measure to Approximate Inventory
1. Beginning inventory plus purchases equal total goods to be
accounted for.
2. Goods not sold must be on hand.
3. The sales, reduced to cost, deducted from the sum of the
opening inventory plus purchases, equal ending inventory.
Gross Profit Method of Estimating Inventory
9-33
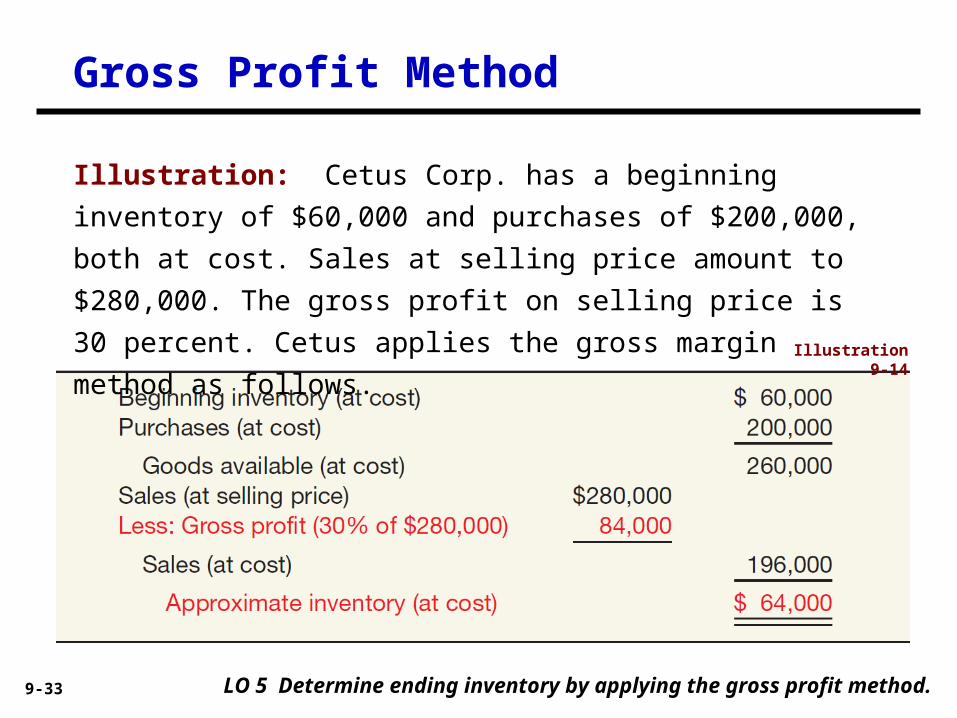
Gross Profit Method
LO 5 Determine ending inventory by applying the gross profit method.
Illustration: Cetus Corp. has a beginning inventory of $60,000
and purchases of $200,000, both at cost. Sales at selling price
amount to $280,000. The gross profit on selling price is 30
percent. Cetus applies the gross margin method as follows.
Illustration 9-14

9-34
Gross Profit Method
LO 5 Determine ending inventory by applying the gross profit method.
Illustration: In Illustration 9-14, the gross profit was a given. But
how did Cetus derive that figure? To see how to compute a gross
profit percentage, assume that an article cost $15 and sells for
$20, a gross profit of $5.
Illustration 9-15
Computation of Gross Profit Percentage

9-35
Gross Profit Method
LO 5
Illustration 9-16 Formulas Relating to Gross Profit
Illustration 9-17Application of Gross Profit Formulas
9-36
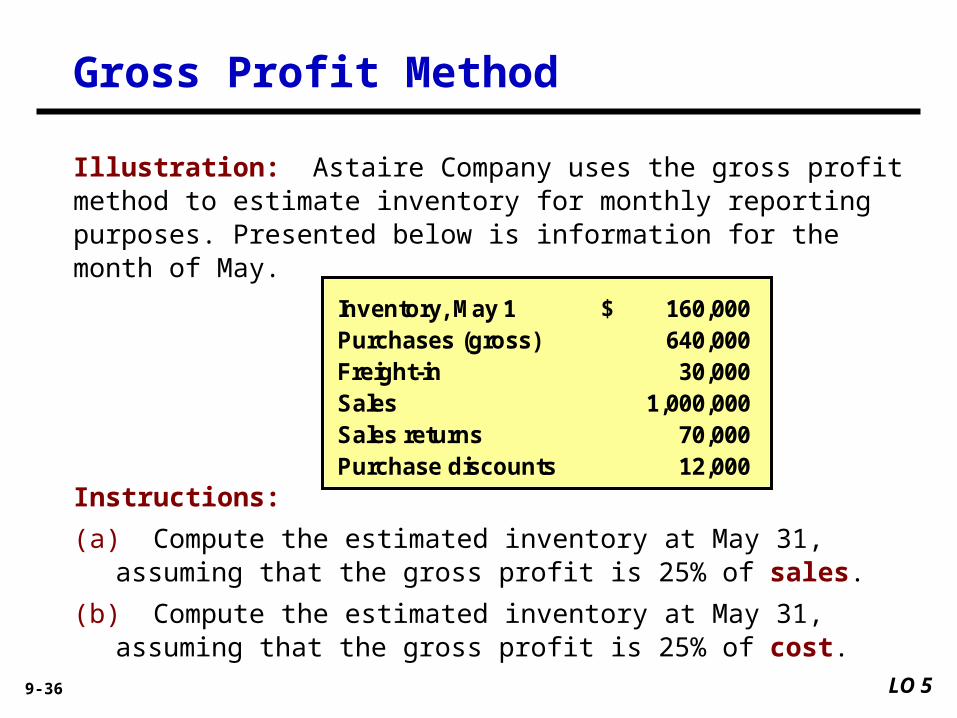
Illustration: Astaire Company uses the gross profit method to estimate inventory for monthly reporting purposes. Presented below is information for the month of May.
Instructions:
(a) Compute the estimated inventory at May 31, assuming that the gross profit is 25% of sales.
(b) Compute the estimated inventory at May 31, assuming that the gross profit is 25% of cost.
Inventory, May 1 160,000$ Purchases (gross) 640,000 Freight-in 30,000 Sales 1,000,000 Sales returns 70,000 Purchase discounts 12,000
Gross Profit Method
LO 5
9-37
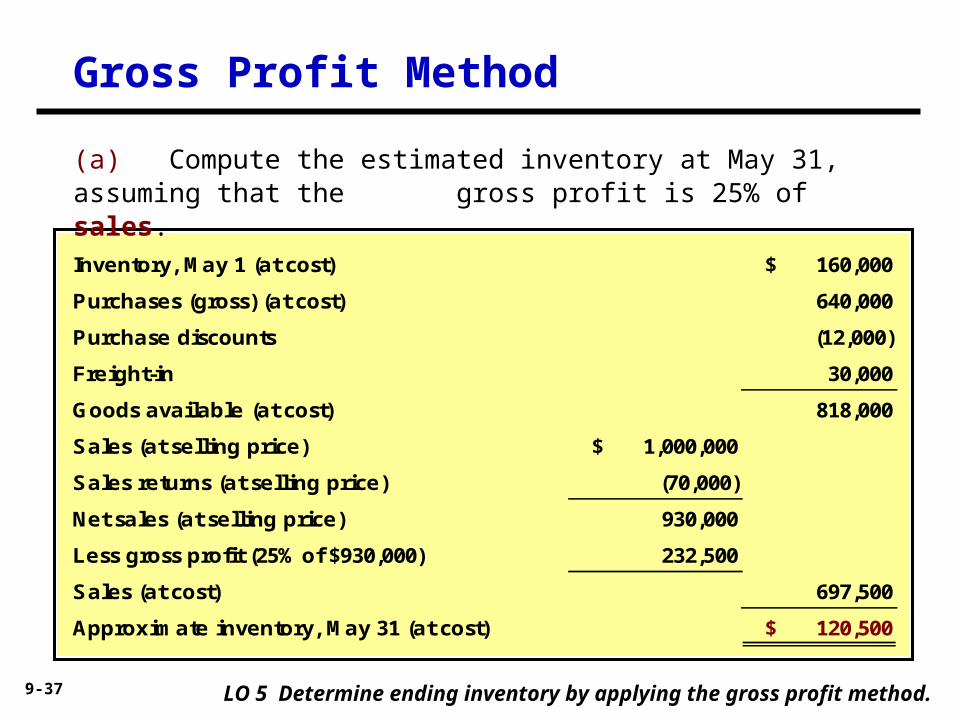
Inventory, May 1 (at cost) $ 160,000
Purchases (gross) (at cost) 640,000
Purchase discounts (12,000)
Freight-in 30,000
Goods available (at cost) 818,000
Sales (at selling price) $ 1,000,000
Sales returns (at selling price) (70,000)
Net sales (at selling price) 930,000
Less gross profit (25% of $930,000) 232,500
Sales (at cost) 697,500
Approximate inventory, May 31 (at cost) $ 120,500
(a) Compute the estimated inventory at May 31, assuming that the gross profit is 25% of sales.
Gross Profit Method
LO 5 Determine ending inventory by applying the gross profit method.
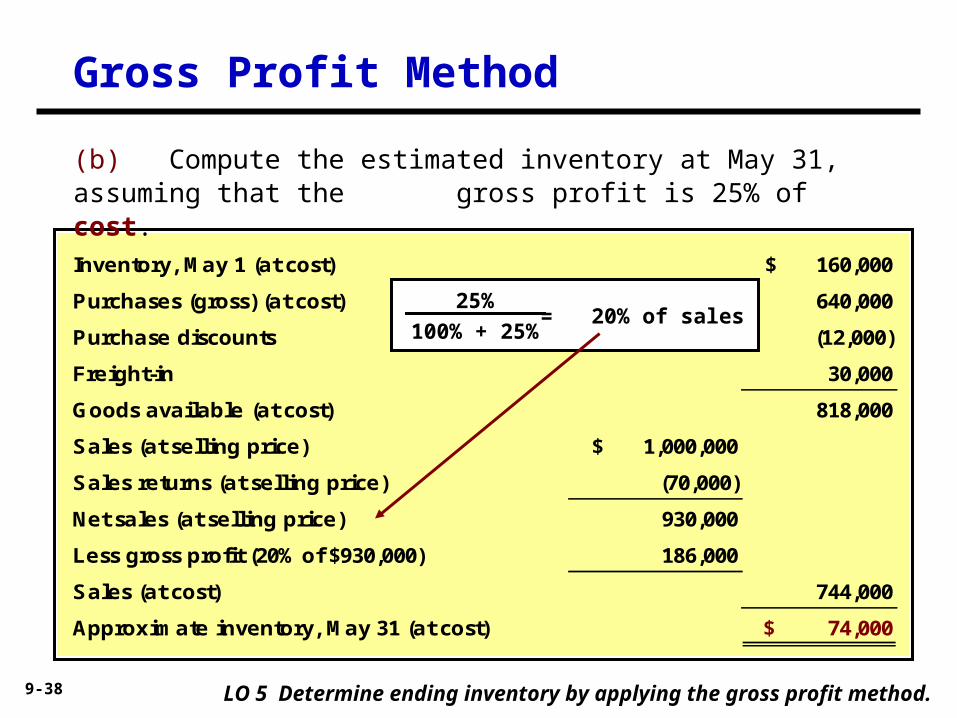
9-38
Inventory, May 1 (at cost) $ 160,000
Purchases (gross) (at cost) 640,000
Purchase discounts (12,000)
Freight-in 30,000
Goods available (at cost) 818,000
Sales (at selling price) $ 1,000,000
Sales returns (at selling price) (70,000)
Net sales (at selling price) 930,000
Less gross profit (20% of $930,000) 186,000
Sales (at cost) 744,000
Approximate inventory, May 31 (at cost) $ 74,000
Gross Profit Method
LO 5 Determine ending inventory by applying the gross profit method.
25%
100% + 25%= 20% of sales
(b) Compute the estimated inventory at May 31, assuming that the gross profit is 25% of cost.
9-39
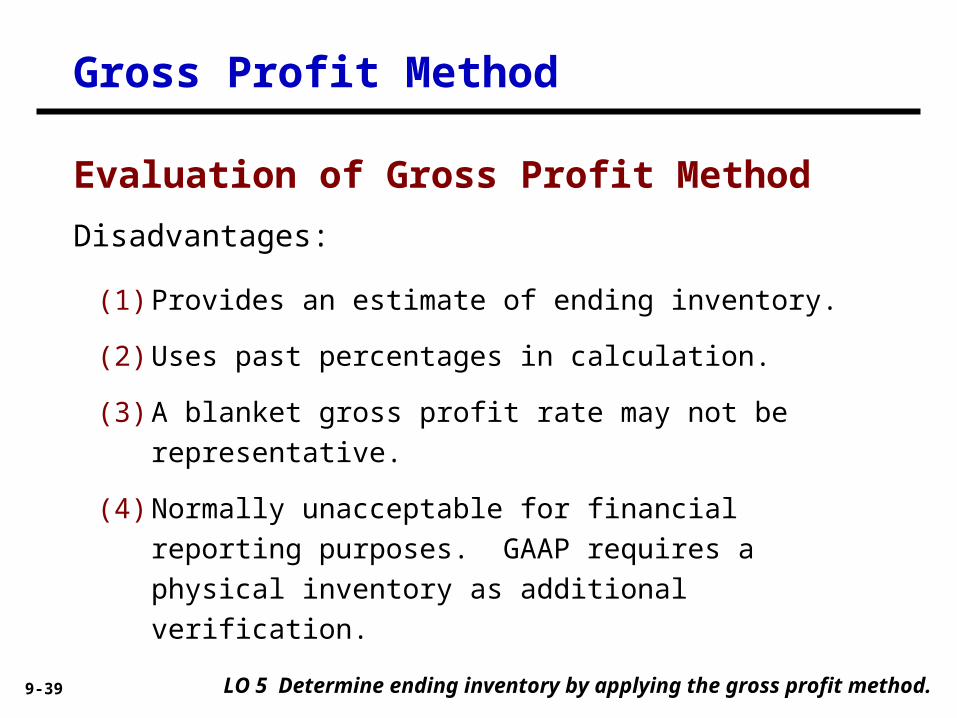
Disadvantages:
Gross Profit Method
LO 5 Determine ending inventory by applying the gross profit method.
(1) Provides an estimate of ending inventory.
(2) Uses past percentages in calculation.
(3) A blanket gross profit rate may not be representative.
(4) Normally unacceptable for financial reporting purposes.
GAAP requires a physical inventory as additional
verification.
Evaluation of Gross Profit Method
9-40
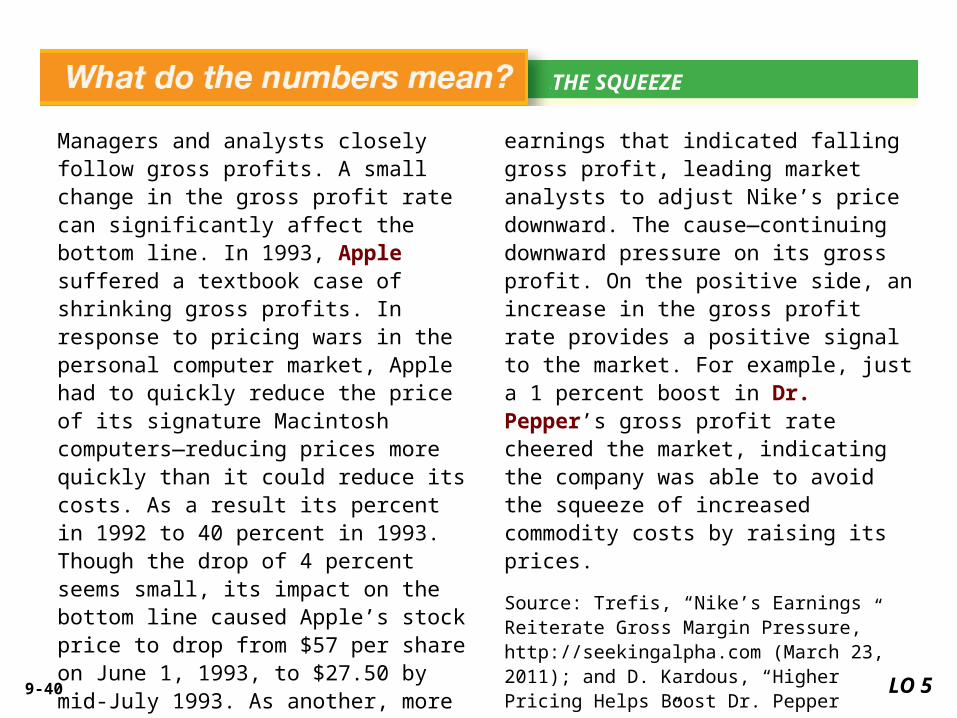
Managers and analysts closely follow gross profits. A small change in the gross profit rate can significantly affect the bottom line. In 1993, Apple suffered a textbook case of shrinking gross profits. In response to pricing wars in the personal computer market, Apple had to quickly reduce the price of its signature Macintosh computers—reducing prices more quickly than it could reduce its costs. As a result its percent in 1992 to 40 percent in 1993. Though the drop of 4 percent seems small, its impact on the bottom line caused Apple’s stock price to drop from $57 per share on June 1, 1993, to $27.50 by mid-July 1993. As another, more recent example, Nike—the largest global manufacturer of athletic footwear—in a recent quarter reported
WHAT’S YOUR PRINCIPLETHE SQUEEZE
earnings that indicated falling gross profit, leading market analysts to adjust Nike’s price downward. The cause—continuing downward pressure on its gross profit. On the positive side, an increase in the gross profit rate provides a positive signal to the market. For example, just a 1 percent boost in Dr. Pepper’s gross profit rate cheered the market, indicating the company was able to avoid the squeeze of increased commodity costs by raising its prices.
Source: Trefis, “Nike’s Earnings Reiterate Gross Margin Pressure,” http://seekingalpha.com (March 23, 2011); and D. Kardous, “Higher Pricing Helps Boost Dr. Pepper Snapple’s Net,” Wall Street Journal Online (June 5, 2008).
LO 5
9-41
5. Determine ending inventory by applying the gross profit method.
6. Determine ending inventory by applying the retail inventory method.
7. Explain how to report and analyze inventory.
After studying this chapter, you should be able to:
Inventories: Additional Inventories: Additional Valuation IssuesValuation Issues99
LEARNING OBJECTIVESLEARNING OBJECTIVESLEARNING OBJECTIVESLEARNING OBJECTIVES
1. Describe and apply the lower-of-cost-or-market rule.
2. Explain when companies value inventories at net realizable value.
3. Explain when companies use the relative sales value method to value inventories.
4. Discuss accounting issues related to purchase commitments.
9-42
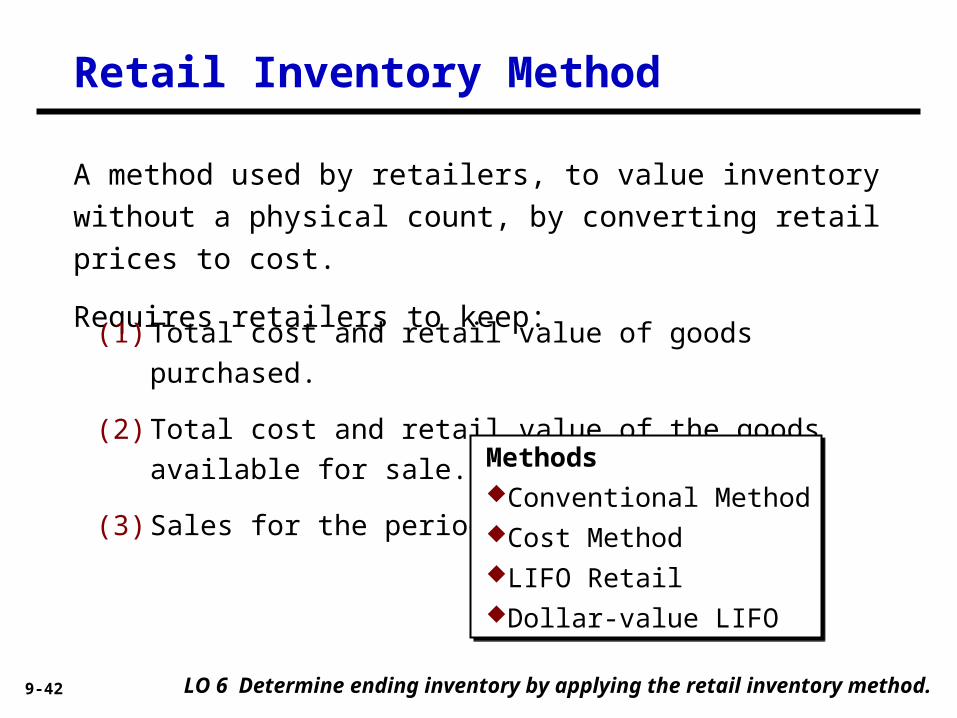
Retail Inventory Method
LO 6 Determine ending inventory by applying the retail inventory method.
A method used by retailers, to value inventory without a
physical count, by converting retail prices to cost.
Requires retailers to keep:
(1) Total cost and retail value of goods purchased.
(2) Total cost and retail value of the goods available for sale.
(3) Sales for the period. MethodsConventional MethodCost MethodLIFO RetailDollar-value LIFO
MethodsConventional MethodCost MethodLIFO RetailDollar-value LIFO
9-43
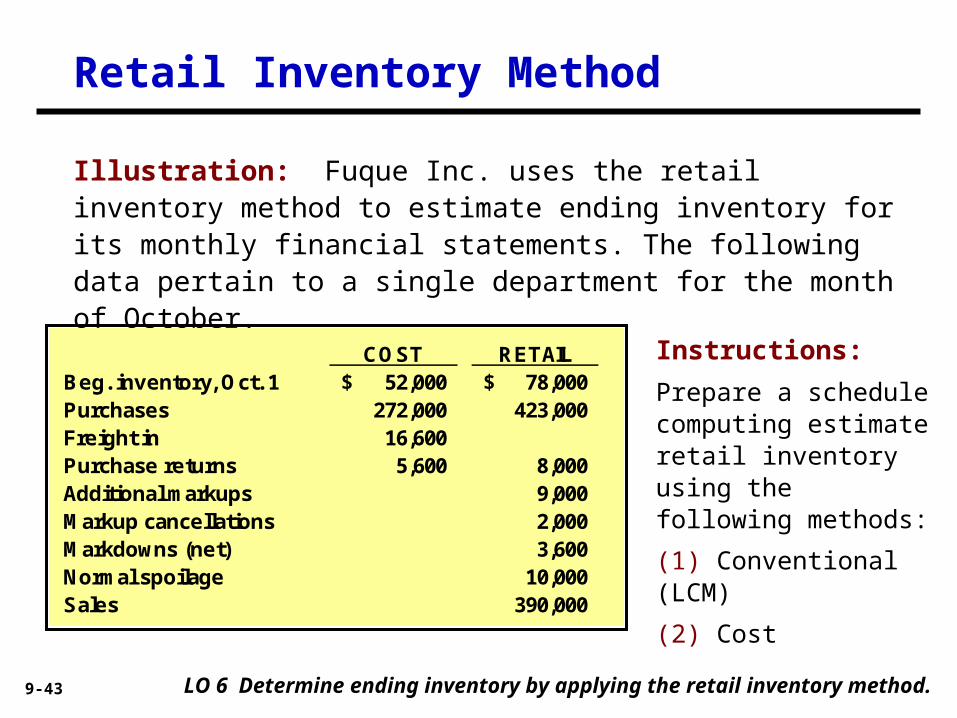
Illustration: Fuque Inc. uses the retail inventory method to estimate ending inventory for its monthly financial statements. The following data pertain to a single department for the month of October.
Retail Inventory Method
COST RETAILBeg. inventory, Oct. 1 52,000$ 78,000$ Purchases 272,000 423,000 Freight in 16,600 Purchase returns 5,600 8,000 Additional markups 9,000 Markup cancellations 2,000 Markdowns (net) 3,600 Normal spoilage 10,000 Sales 390,000
Instructions:
Prepare a schedule computing estimate retail inventory using the following methods:
(1) Conventional (LCM)
(2) Cost
LO 6 Determine ending inventory by applying the retail inventory method.
9-44
Retail Inventory Method
LO 6 Determine ending inventory by applying the retail inventory method.
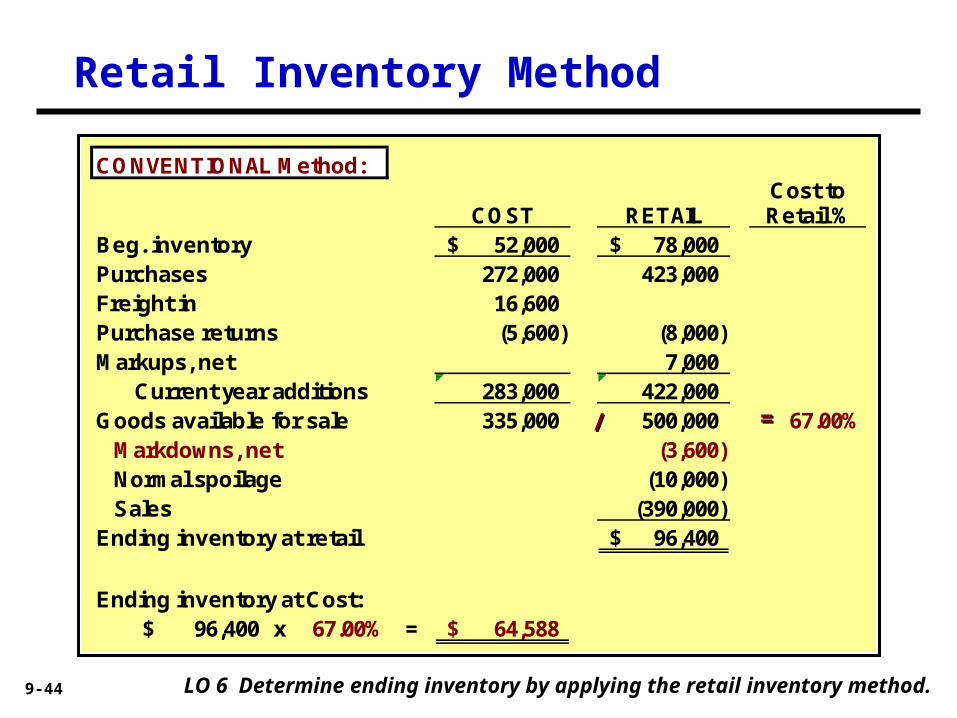
CONVENTIONAL Method:Cost to
COST RETAIL Retail %Beg. inventory 52,000$ 78,000$ Purchases 272,000 423,000 Freight in 16,600 Purchase returns (5,600) (8,000) Markups, net 7,000
Current year additions 283,000 422,000 Goods available for sale 335,000 500,000 67.00% Markdowns, net (3,600)
Normal spoilage (10,000) Sales (390,000) Ending inventory at retail 96,400$
Ending inventory at Cost:96,400$ x 67.00% = 64,588$
==//
9-45
Retail Inventory Method
LO 6 Determine ending inventory by applying the retail inventory method.
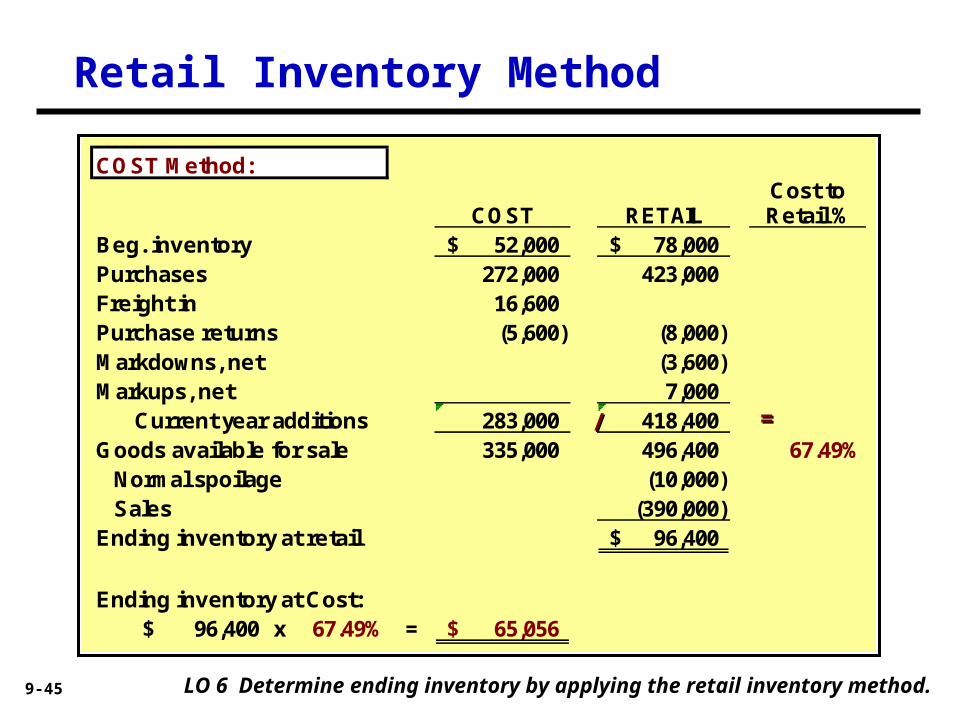
COST Method:Cost to
COST RETAIL Retail %Beg. inventory 52,000$ 78,000$ Purchases 272,000 423,000 Freight in 16,600 Purchase returns (5,600) (8,000) Markdowns, net (3,600) Markups, net 7,000
Current year additions 283,000 418,400 Goods available for sale 335,000 496,400 67.49%
Normal spoilage (10,000) Sales (390,000) Ending inventory at retail 96,400$
Ending inventory at Cost:96,400$ x 67.49% = 65,056$
==//
9-46
Retail Inventory Method
LO 6 Determine ending inventory by applying the retail inventory method.
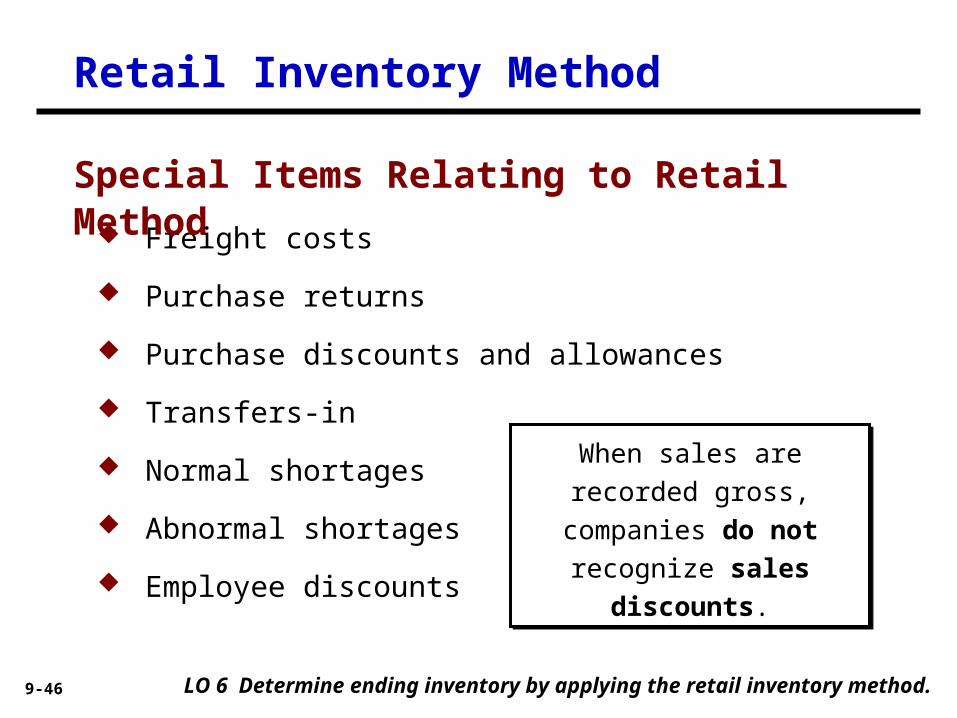
Freight costs
Purchase returns
Purchase discounts and allowances
Transfers-in
Normal shortages
Abnormal shortages
Employee discounts
Special Items Relating to Retail Method
When sales are recorded
gross, companies do not
recognize sales discounts.
When sales are recorded
gross, companies do not
recognize sales discounts.

9-47
Special Items
Retail Inventory Method
LO 6
Illustration 9-23
9-48
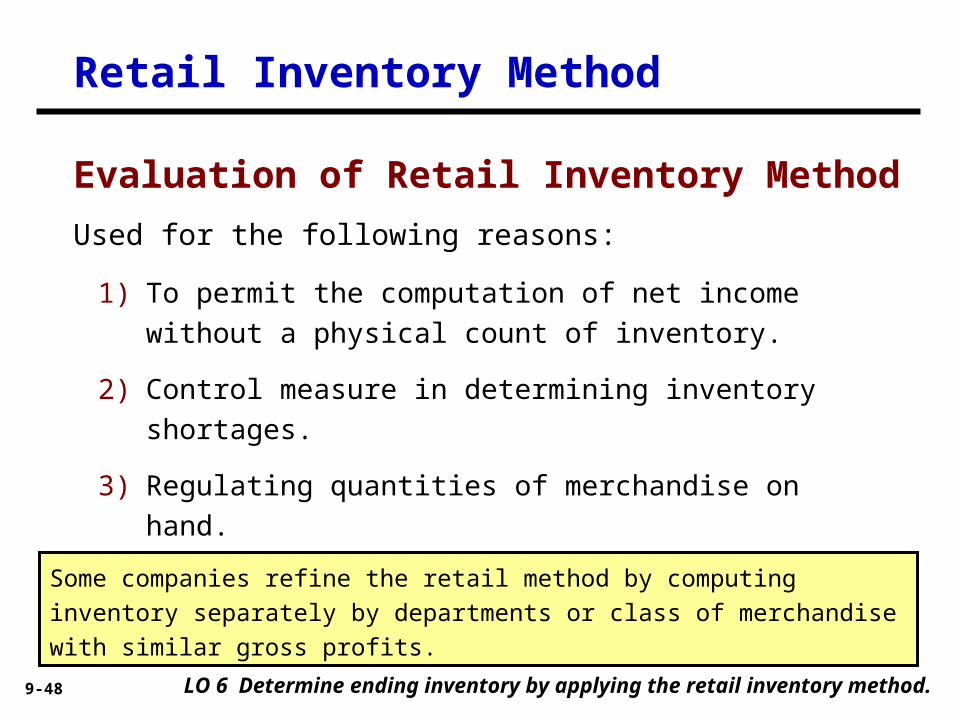
Used for the following reasons:
1) To permit the computation of net income without a physical
count of inventory.
2) Control measure in determining inventory shortages.
3) Regulating quantities of merchandise on hand.
4) Insurance information.
Retail Inventory Method
LO 6 Determine ending inventory by applying the retail inventory method.
Some companies refine the retail method by computing inventory separately by
departments or class of merchandise with similar gross profits.
Evaluation of Retail Inventory Method
9-49
5. Determine ending inventory by applying the gross profit method.
6. Determine ending inventory by applying the retail inventory method.
7. Explain how to report and analyze inventory.
After studying this chapter, you should be able to:
Inventories: Additional Inventories: Additional Valuation IssuesValuation Issues99
LEARNING OBJECTIVESLEARNING OBJECTIVESLEARNING OBJECTIVESLEARNING OBJECTIVES
1. Describe and apply the lower-of-cost-or-market rule.
2. Explain when companies value inventories at net realizable value.
3. Explain when companies use the relative sales value method to value inventories.
4. Discuss accounting issues related to purchase commitments.
9-50
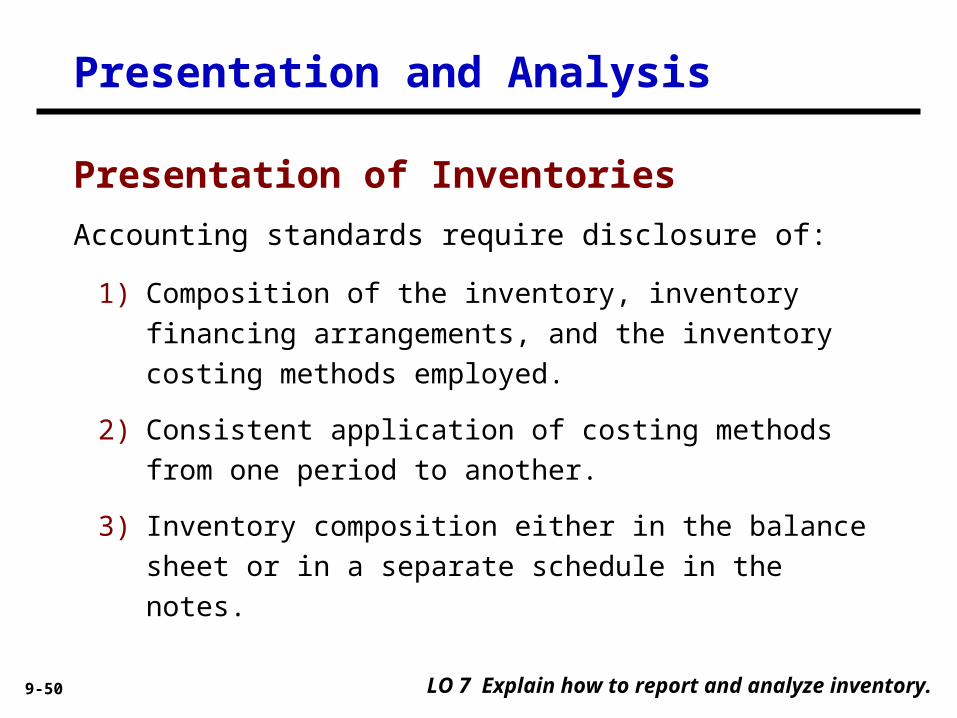
Accounting standards require disclosure of:
Presentation and Analysis
LO 7 Explain how to report and analyze inventory.
Presentation of Inventories
1) Composition of the inventory, inventory financing
arrangements, and the inventory costing methods
employed.
2) Consistent application of costing methods from one period
to another.
3) Inventory composition either in the balance sheet or in a
separate schedule in the notes.

9-51
Presentation and Analysis
LO 7 Explain how to report and analyze inventory.
Presentation of Inventories
4) Significant or unusual financing arrangements relating to
inventories.
5) Inventories pledged as collateral for a loan in the current
assets section rather than as an offset to the liability.
6) Basis on which it states inventory amounts (lower of-cost-
or-market) and the method used in determining cost
(LIFO, FIFO, average cost, etc.).
Accounting standards require disclosure of:
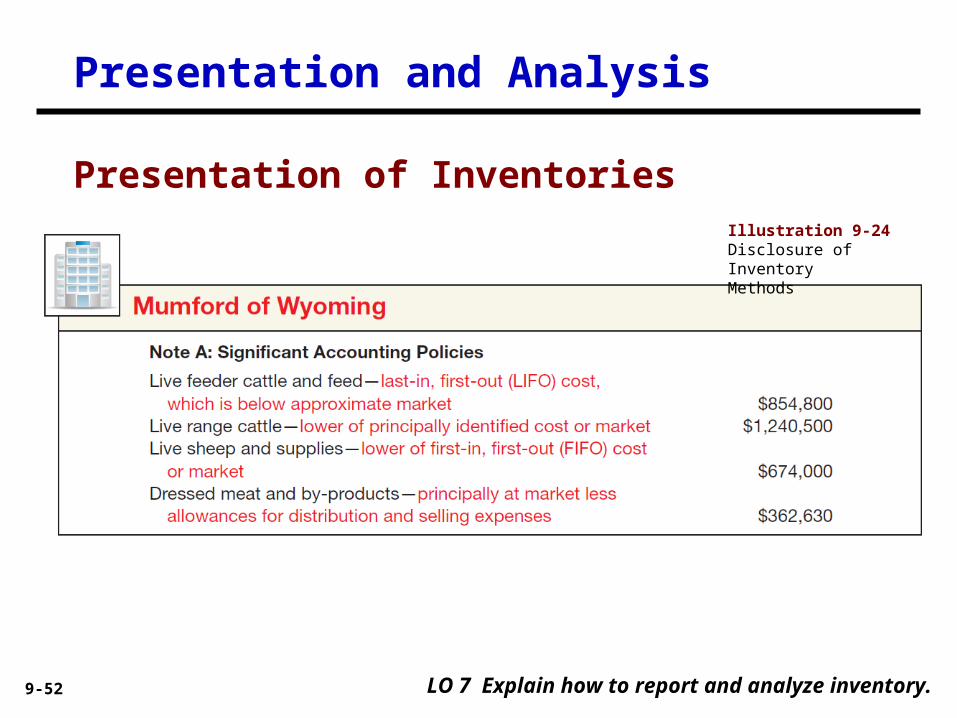
9-52
Presentation and Analysis
LO 7 Explain how to report and analyze inventory.
Presentation of InventoriesIllustration 9-24Disclosure of InventoryMethods
9-53 LO 7
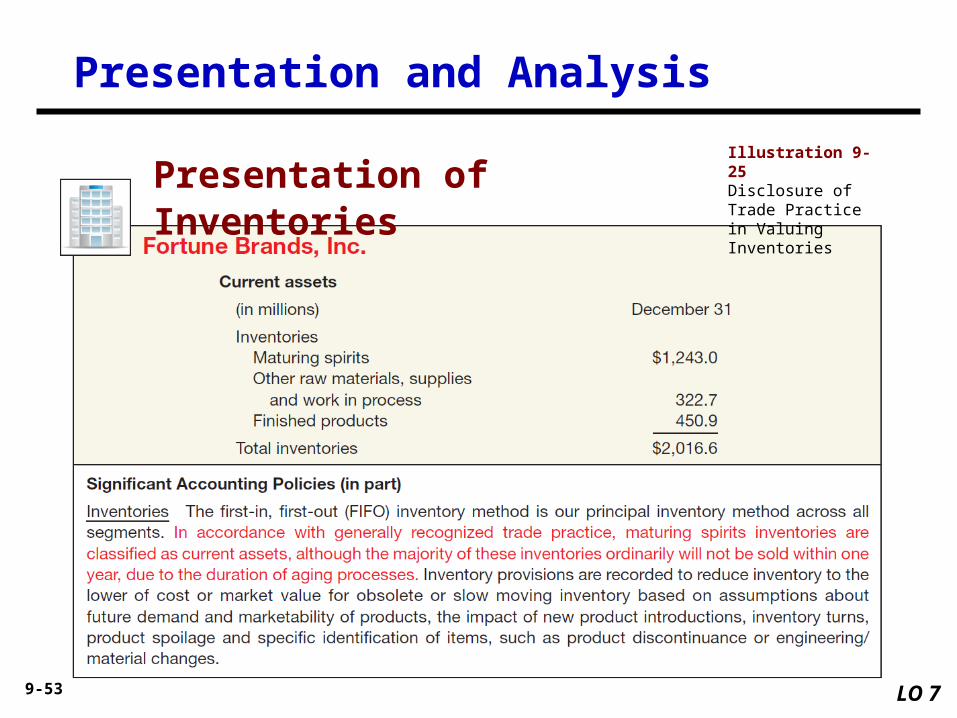
Presentation and Analysis
Illustration 9-25Disclosure of Trade Practice in Valuing Inventories
Presentation of Inventories
9-54
Presentation and Analysis
LO 7 Explain how to report and analyze inventory.
Common ratios used in the management and evaluation of
inventory levels are inventory turnover and average days
to sell the inventory.
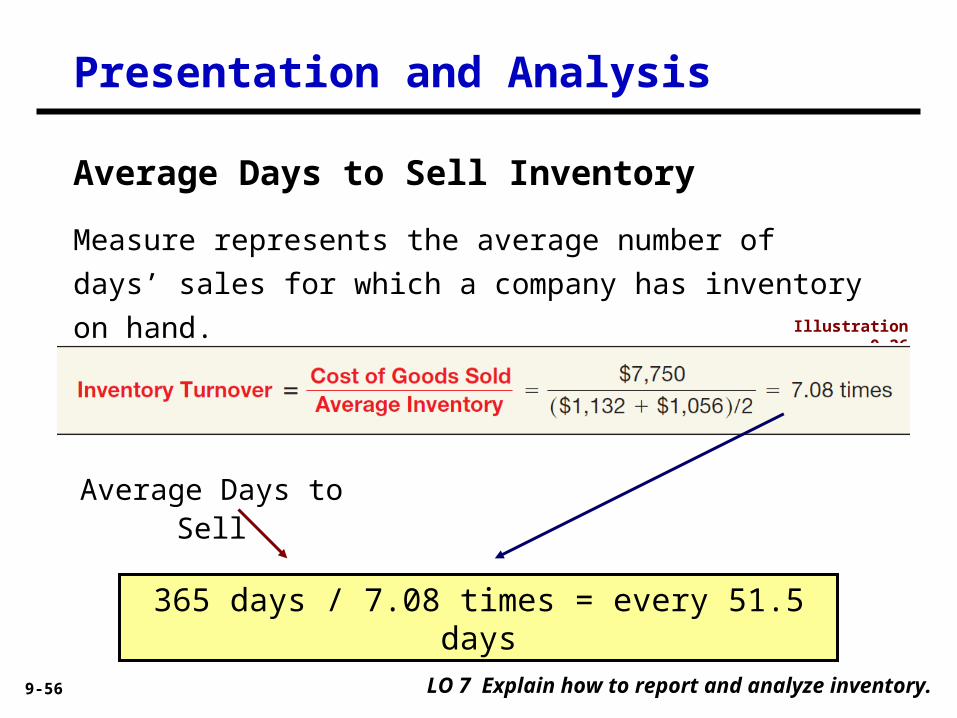
Analysis of Inventories
9-55
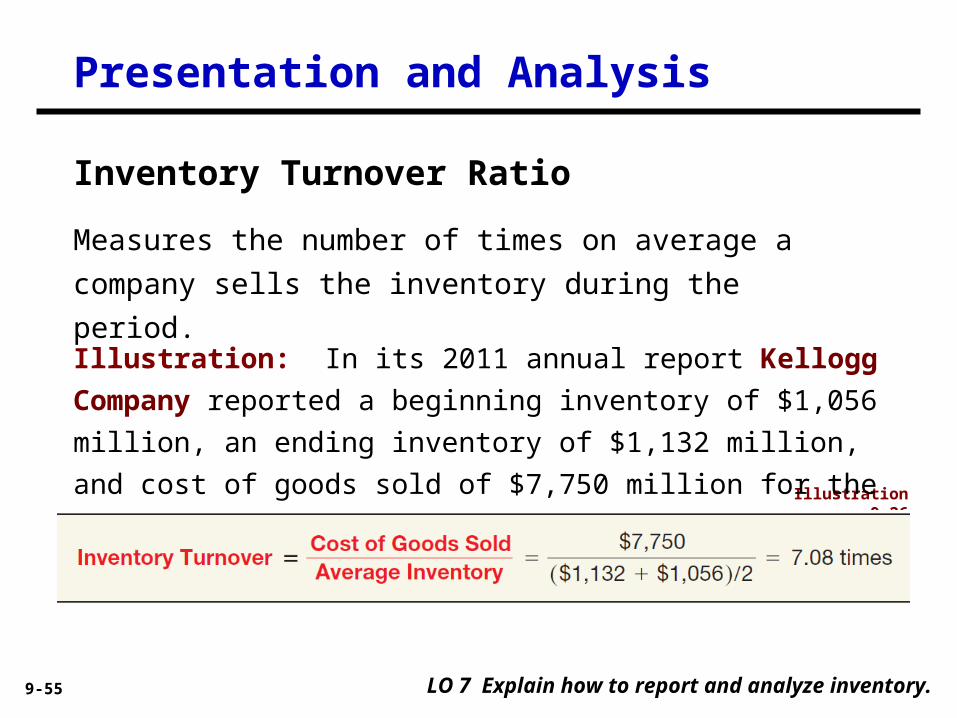
Measures the number of times on average a company sells
the inventory during the period.
Presentation and Analysis
LO 7 Explain how to report and analyze inventory.
Inventory Turnover Ratio
Illustration 9-26
Illustration: In its 2011 annual report Kellogg Company reported
a beginning inventory of $1,056 million, an ending inventory of
$1,132 million, and cost of goods sold of $7,750 million for the
year.
9-56
Illustration 9-26
Measure represents the average number of days’ sales for
which a company has inventory on hand.
Presentation and Analysis
LO 7 Explain how to report and analyze inventory.
Average Days to Sell Inventory
365 days / 7.08 times = every 51.5 days
Average Days to Sell
9-57 LO 8 Determine ending inventory by applying the LIFO retail methods.
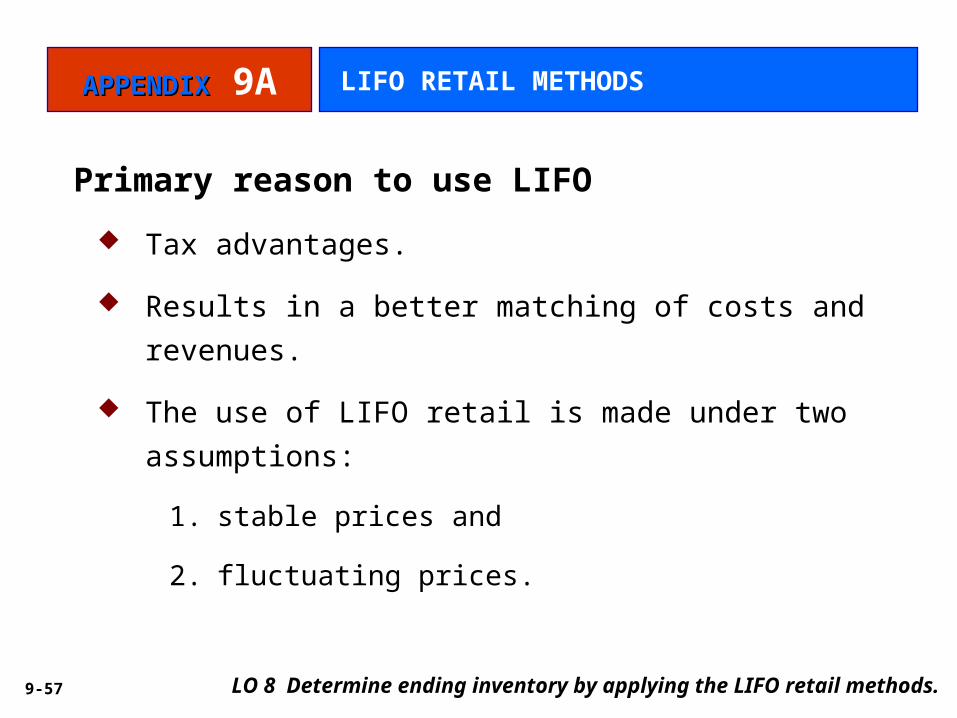
Primary reason to use LIFO
Tax advantages.
Results in a better matching of costs and revenues.
The use of LIFO retail is made under two assumptions:
1. stable prices and
2. fluctuating prices.
APPENDIXAPPENDIX 9A LIFO RETAIL METHODS
9-58 LO 8 Determine ending inventory by applying the LIFO retail methods.
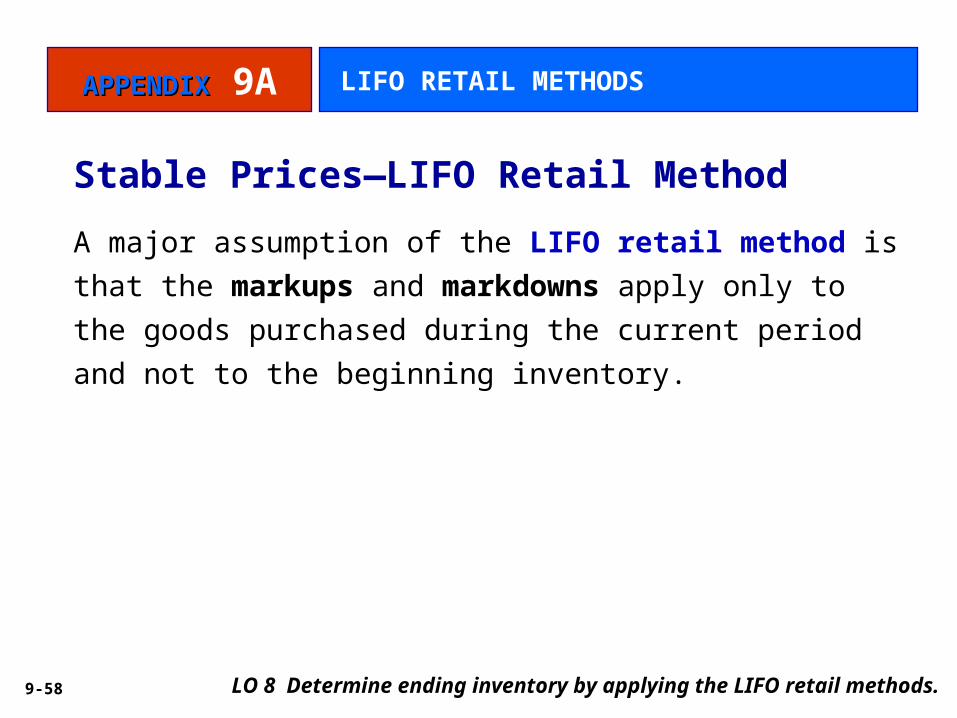
Stable Prices—LIFO Retail Method
A major assumption of the LIFO retail method is that the
markups and markdowns apply only to the goods purchased
during the current period and not to the beginning inventory.
APPENDIXAPPENDIX 9A LIFO RETAIL METHODS

9-59
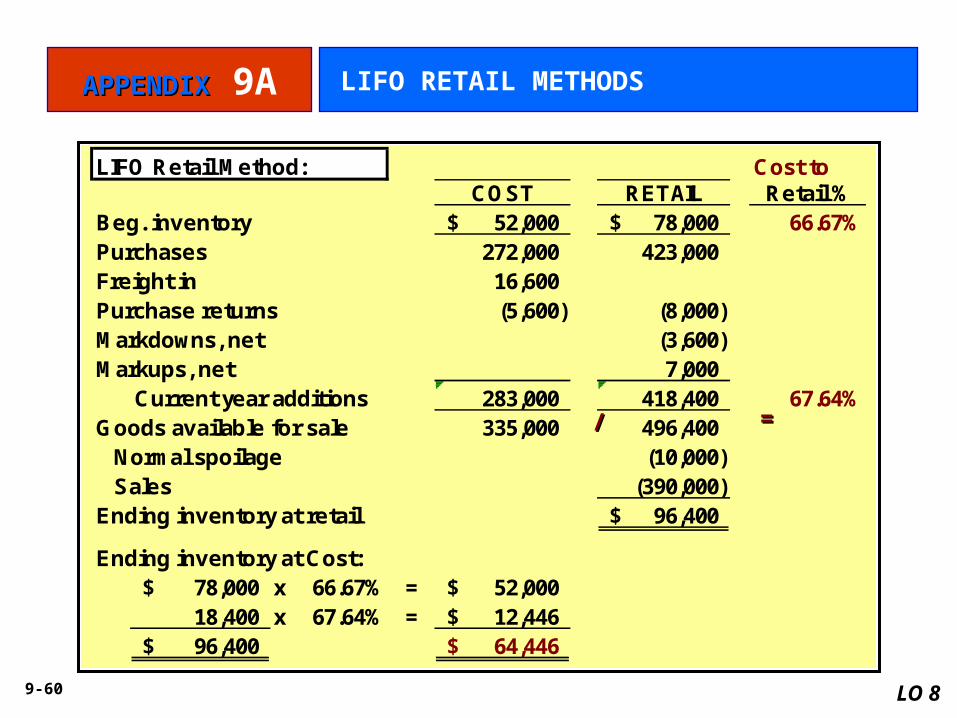
Illustration: Fuque Inc. uses the retail inventory method to estimate ending inventory for its monthly financial statements. The following data pertain to a single department for the month of October.
COST RETAILBeg. inventory, Oct. 1 52,000$ 78,000$ Purchases 272,000 423,000 Freight in 16,600 Purchase returns 5,600 8,000 Additional markups 9,000 Markup cancellations 2,000 Markdowns (net) 3,600 Normal spoilage 10,000 Sales 390,000
Instructions:
Prepare a schedule computing estimate retail inventory using the LIFO Retail method.
LO 8 Determine ending inventory by applying the LIFO retail methods.
APPENDIXAPPENDIX 9A LIFO RETAIL METHODS
9-60
LIFO Retail Method: Cost toCOST RETAIL Retail %
Beg. inventory 52,000$ 78,000$ 66.67%Purchases 272,000 423,000 Freight in 16,600 Purchase returns (5,600) (8,000) Markdowns, net (3,600) Markups, net 7,000
Current year additions 283,000 418,400 67.64%Goods available for sale 335,000 496,400
Normal spoilage (10,000) Sales (390,000) Ending inventory at retail 96,400$
Ending inventory at Cost:78,000$ x 66.67% = 52,000$ 18,400 x 67.64% = 12,446$ 96,400$ 64,446$
==//
LO 8
APPENDIXAPPENDIX 9A LIFO RETAIL METHODS
9-61 LO 8 Determine ending inventory by applying the LIFO retail methods.
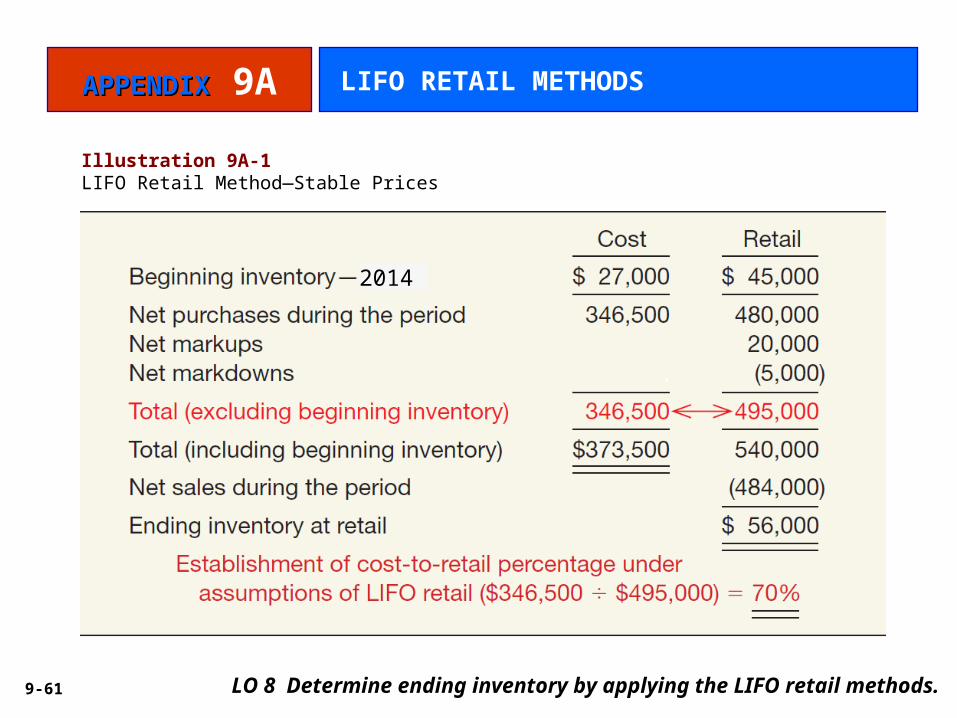
Illustration 9A-1LIFO Retail Method—Stable Prices
APPENDIXAPPENDIX 9A LIFO RETAIL METHODS
2014
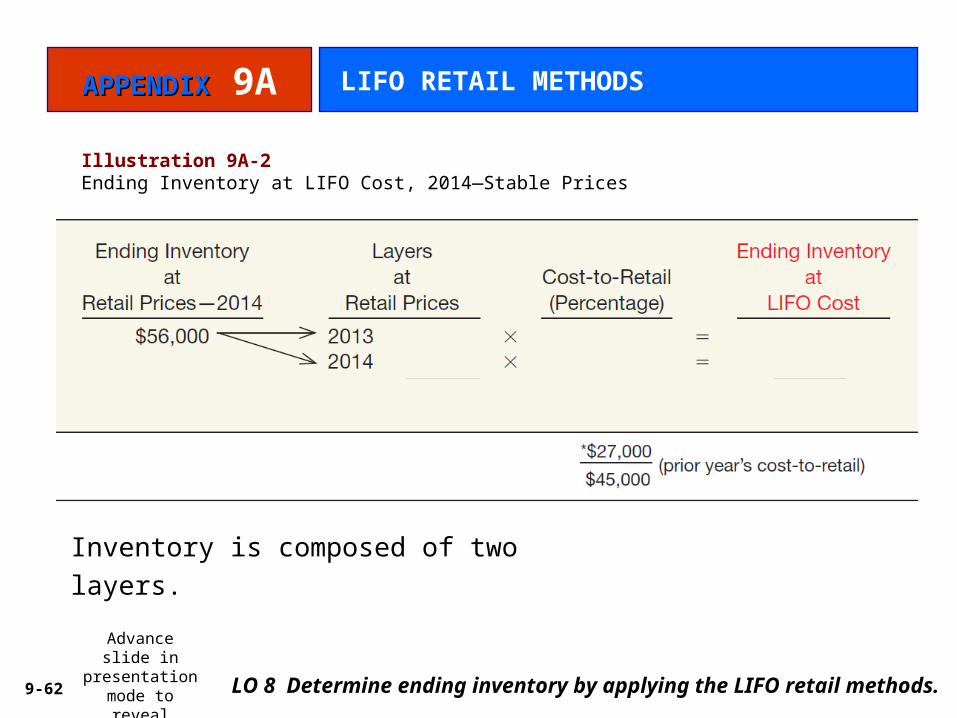
9-62 LO 8 Determine ending inventory by applying the LIFO retail methods.
Illustration 9A-2Ending Inventory at LIFO Cost, 2014—Stable Prices
Inventory is composed of two layers.
APPENDIXAPPENDIX 9A LIFO RETAIL METHODS
Advance slide in presentation mode to reveal
answers.
9-63 LO 8 Determine ending inventory by applying the LIFO retail methods.
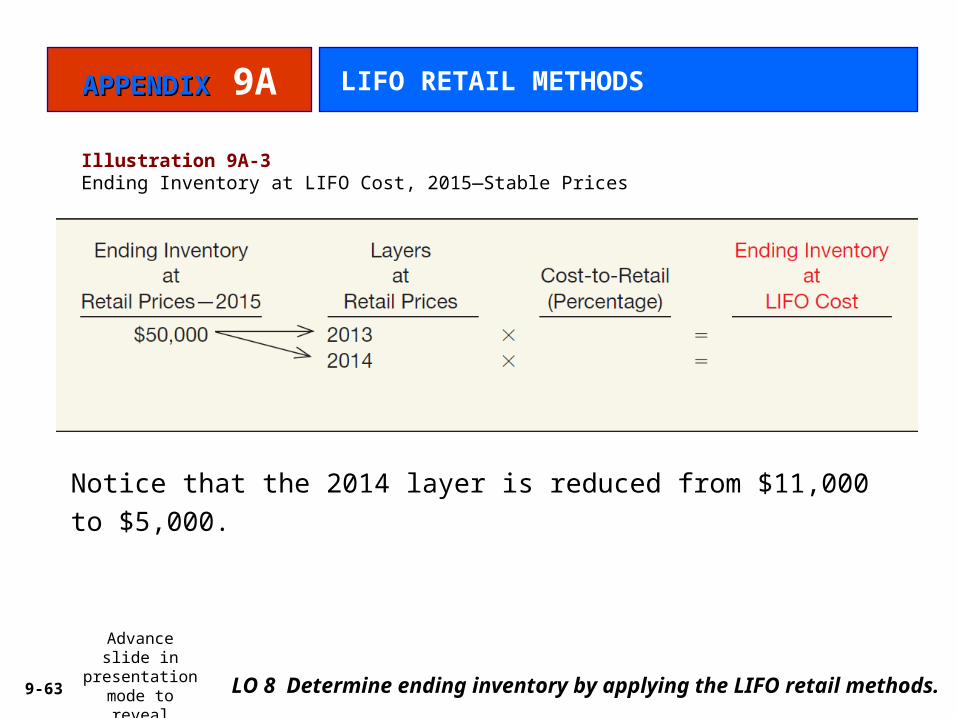
Illustration 9A-3Ending Inventory at LIFO Cost, 2015—Stable Prices
APPENDIXAPPENDIX 9A LIFO RETAIL METHODS
Notice that the 2014 layer is reduced from $11,000 to $5,000.
Advance slide in presentation mode to reveal
answers.
9-64 LO 8 Determine ending inventory by applying the LIFO retail methods.
Fluctuating Prices—Dollar-Value LIFO Retail
If the price level does change, the company must eliminate the
price change so as to measure the real increase in inventory,
not the dollar increase.
APPENDIXAPPENDIX 9A LIFO RETAIL METHODS
9-65 LO 8 Determine ending inventory by applying the LIFO retail methods.
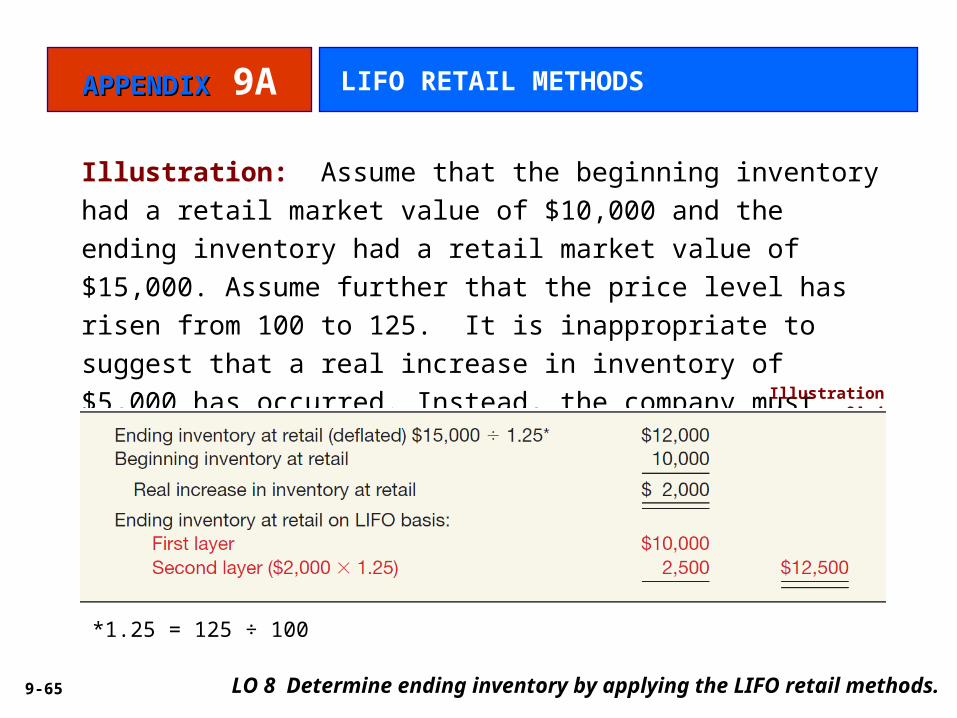
Illustration: Assume that the beginning inventory had a retail
market value of $10,000 and the ending inventory had a retail
market value of $15,000. Assume further that the price level has
risen from 100 to 125. It is inappropriate to suggest that a real
increase in inventory of $5,000 has occurred. Instead, the company
must deflate the ending inventory at retail.Illustration 9A-4
APPENDIXAPPENDIX 9A LIFO RETAIL METHODS
*1.25 = 125 ÷ 100
9-66
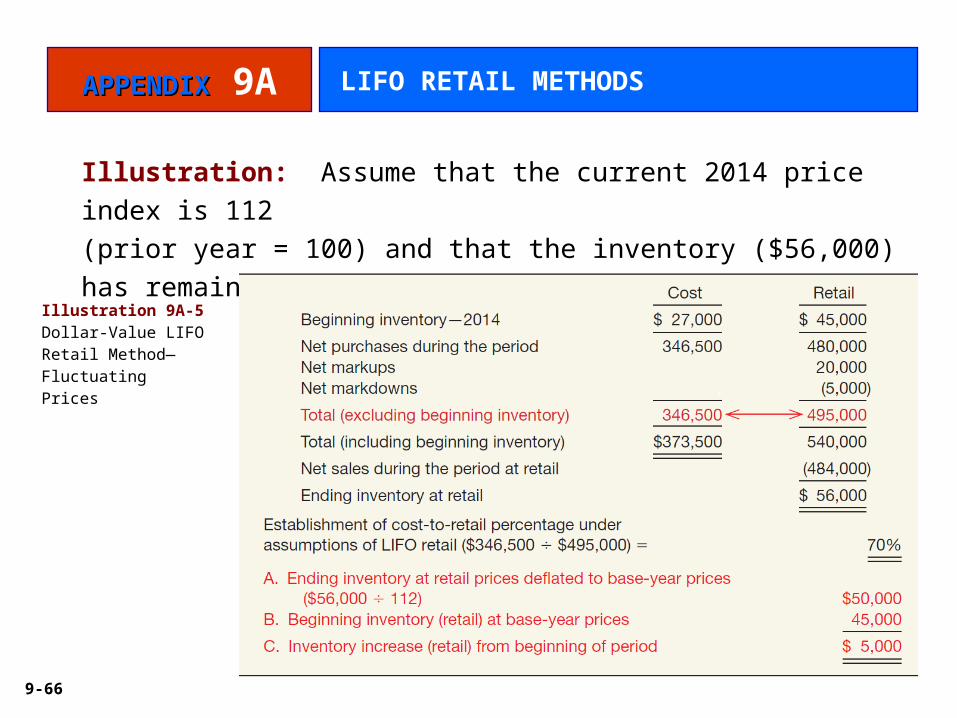
Illustration: Assume that the current 2014 price index is 112
(prior year = 100) and that the inventory ($56,000) has remained
unchanged.
Illustration 9A-5Dollar-Value LIFO Retail Method—FluctuatingPrices
APPENDIXAPPENDIX 9A LIFO RETAIL METHODS
9-67 LO 8 Determine ending inventory by applying the LIFO retail methods.
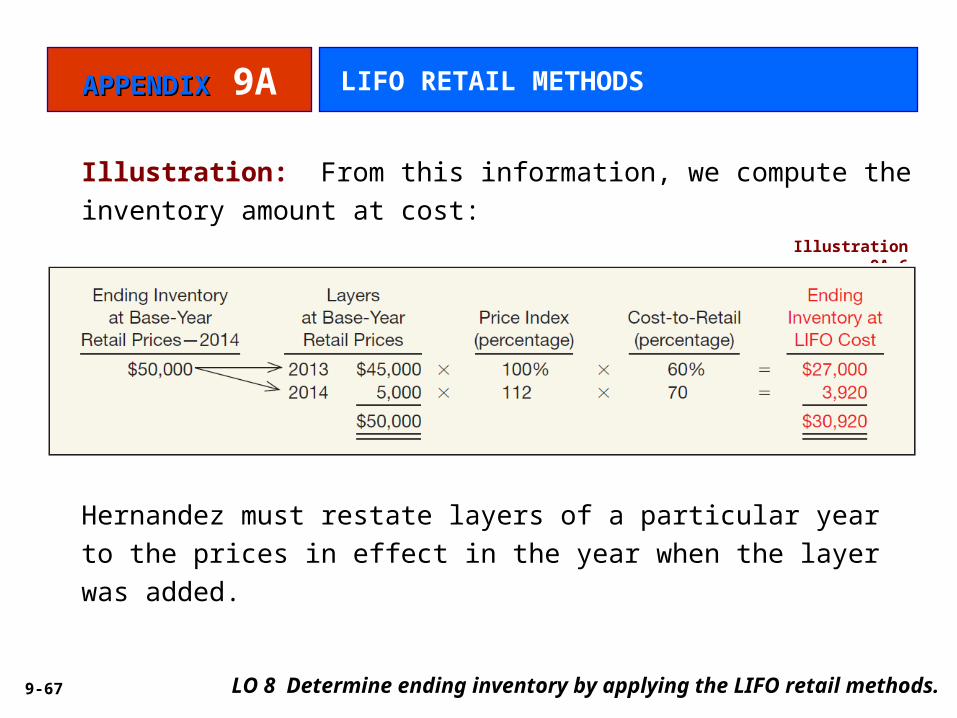
Illustration: From this information, we compute the inventory amount
at cost:Illustration 9A-6
Hernandez must restate layers of a particular year to the prices in
effect in the year when the layer was added.
APPENDIXAPPENDIX 9A LIFO RETAIL METHODS
9-68 LO 8 Determine ending inventory by applying the LIFO retail methods.
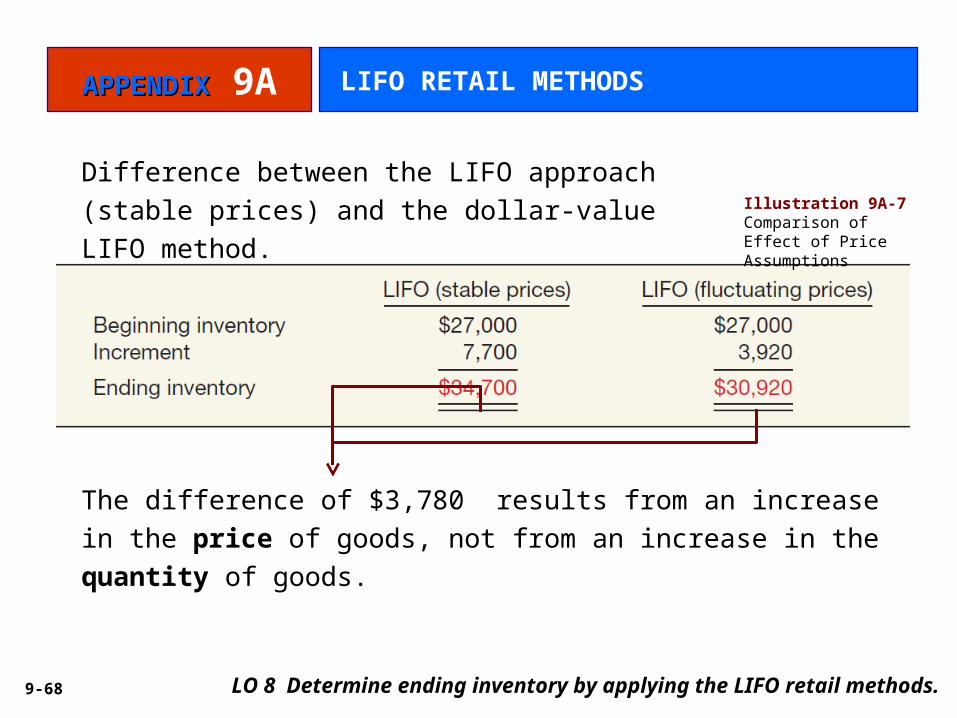
Illustration 9A-7 Comparison of Effect of Price Assumptions
Difference between the LIFO approach (stable
prices) and the dollar-value LIFO method.
APPENDIXAPPENDIX 9A LIFO RETAIL METHODS
The difference of $3,780 results from an increase in the price of
goods, not from an increase in the quantity of goods.

9-69 LO 8
Illustration: Using the data from the previous example, assume that
the retail value of the 2015 ending inventory at current prices is
$64,800, the 2015 price index is 120 percent of base-year, and the
cost-to-retail percentage is 75 percent. Compute the ending inventory
at LIFO cost.Illustration 9A-8
Subsequent Adjustments under Dollar-Value LIFO Retail
APPENDIXAPPENDIX 9A LIFO RETAIL METHODS

9-70
Illustration: Conversely assume that in 2015 the ending inventory in
base-year prices is $48,000. Compute the ending inventory at LIFO
cost.Illustration 9A-9
Subsequent Adjustments under Dollar-Value LIFO Retail
APPENDIXAPPENDIX 9A LIFO RETAIL METHODS
LO 8 Determine ending inventory by applying the LIFO retail methods.
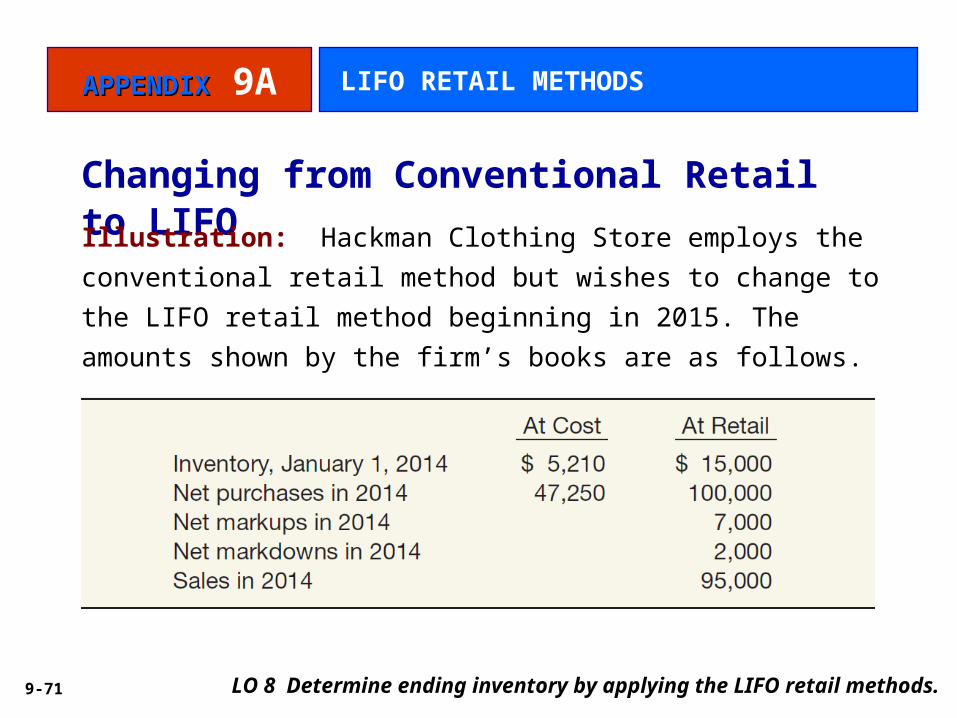
9-71 LO 8 Determine ending inventory by applying the LIFO retail methods.
Changing from Conventional Retail to LIFO
Illustration: Hackman Clothing Store employs the conventional
retail method but wishes to change to the LIFO retail method
beginning in 2015. The amounts shown by the firm’s books are as
follows.
APPENDIXAPPENDIX 9A LIFO RETAIL METHODS
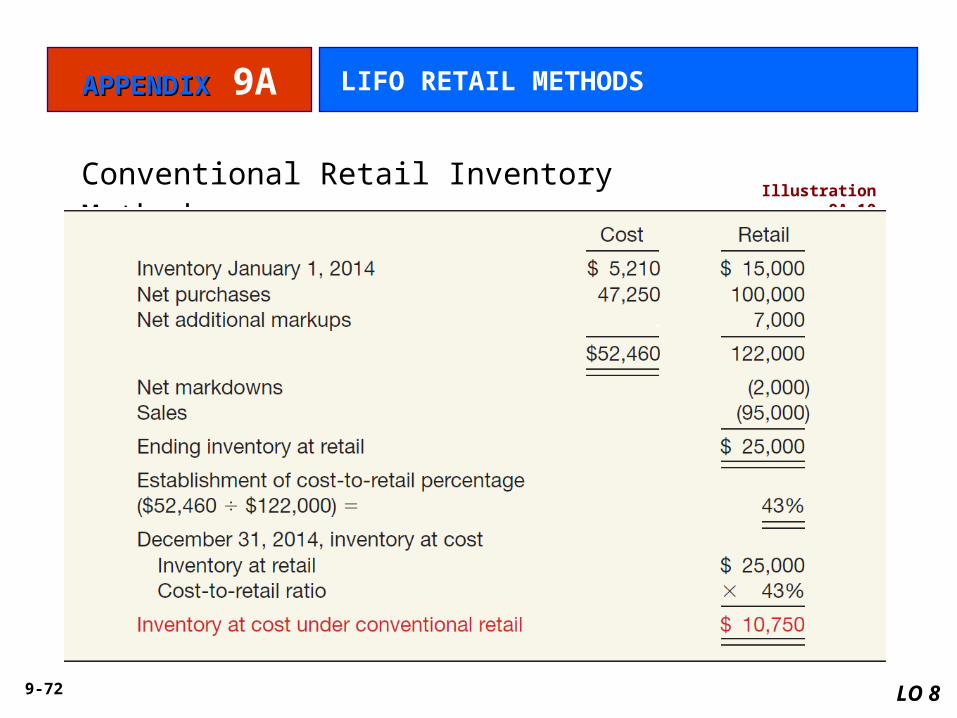
9-72
Conventional Retail Inventory MethodIllustration 9A-10
APPENDIXAPPENDIX 9A LIFO RETAIL METHODS
LO 8
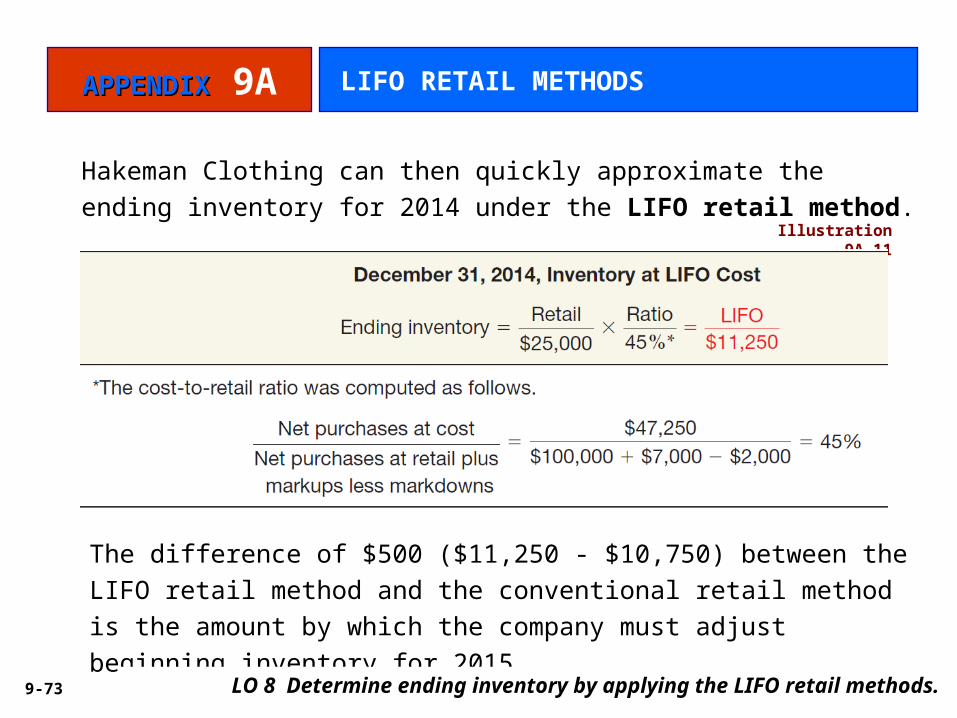
9-73
Illustration 9A-11
Hakeman Clothing can then quickly approximate the ending inventory for
2014 under the LIFO retail method.
The difference of $500 ($11,250 - $10,750) between the LIFO retail
method and the conventional retail method is the amount by which the
company must adjust beginning inventory for 2015.
LO 8 Determine ending inventory by applying the LIFO retail methods.
APPENDIXAPPENDIX 9A LIFO RETAIL METHODS
9-74LO 9 Compare the accounting procedures related to
valuation of inventories under GAAP and IFRS.
RELEVANT FACTS - Similarities
IFRS and GAAP account for inventory acquisitions at historical cost and evaluate inventory for lower-of-cost-or-market subsequent to acquisition.
Who owns the goods—goods in transit, consigned goods, special sales agreements—as well as the costs to include in inventory are essentially accounted for the same under IFRS and GAAP.
9-75
RELEVANT FACTS - Differences
The requirements for accounting for and reporting inventories are more principles-based under IFRS. That is, GAAP provides more detailed guidelines in inventory accounting.
A major difference between IFRS and GAAP relates to the LIFO cost flow assumption. GAAP permits the use of LIFO for inventory valuation. IFRS prohibits its use. FIFO and average-cost are the only two acceptable cost flow assumptions permitted under IFRS. Both sets of standards permit specific identification where appropriate.
In the lower-of-cost-or-market test for inventory valuation, IFRS defines market as net realizable value. GAAP, on the other hand, defines market as replacement cost subject to the constraints of net realizable value (the ceiling) and net realizable value less a normal markup (the floor). IFRS does not use a ceiling or a floor to determine market.
LO 9
9-76
RELEVANT FACTS - Differences
Under GAAP, if inventory is written down under the lower-of-cost-or-market valuation, the new basis is now considered its cost. As a result, the inventory may not be written back up to its original cost in a subsequent period. Under IFRS, the write-down may be reversed in a subsequent period up to the amount of the previous write-down. Both the write-down and any subsequent reversal should be reported on the income statement.
IFRS requires both biological assets and agricultural produce at the point of harvest to be reported at net realizable value. GAAP does not require companies to account for all biological assets in the same way. Furthermore, these assets generally are not reported at net realizable value. Disclosure requirements also differ between the two sets of standards.
LO 9
9-77
ON THE HORIZON
One issue that will be difficult to resolve relates to the use of the LIFO cost flow
assumption. As indicated, IFRS specifically prohibits its use. Conversely, the
LIFO cost flow assumption is widely used in the United States because of its
favorable tax advantages. In addition, many argue that LIFO from a financial
reporting point of view provides a better matching of current costs against
revenue and therefore enables companies to compute a more realistic income.
LO 9 Compare the accounting procedures related to valuation of inventories under GAAP and IFRS.
9-78
All of the following are key similarities between GAAP and IFRS with
respect to accounting for inventories except:
a. costs to include in inventories are similar.
b. LIFO cost flow assumption where appropriate is used by both
sets of standards.
c. fair value valuation of inventories is prohibited by both sets of
standards.
d. guidelines on ownership of goods are similar.
IFRS SELF-TEST QUESTION
LO 9 Compare the accounting procedures related to valuation of inventories under GAAP and IFRS.
9-79
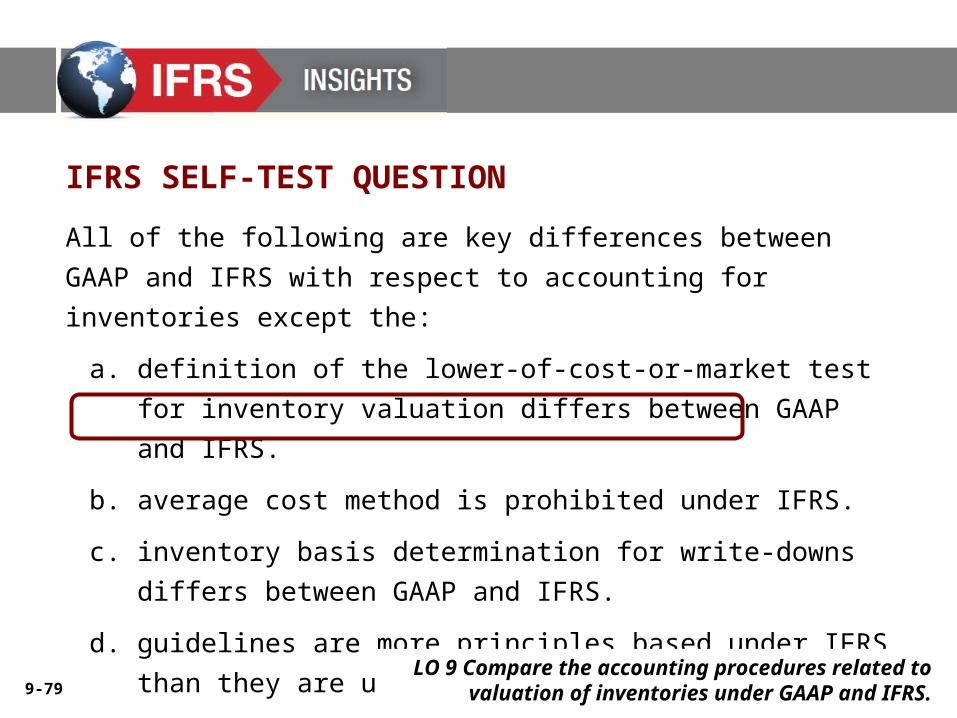
All of the following are key differences between GAAP and IFRS with
respect to accounting for inventories except the:
a. definition of the lower-of-cost-or-market test for inventory
valuation differs between GAAP and IFRS.
b. average cost method is prohibited under IFRS.
c. inventory basis determination for write-downs differs between
GAAP and IFRS.
d. guidelines are more principles based under IFRS than they are
under GAAP.
IFRS SELF-TEST QUESTION
LO 9 Compare the accounting procedures related to valuation of inventories under GAAP and IFRS.
9-80
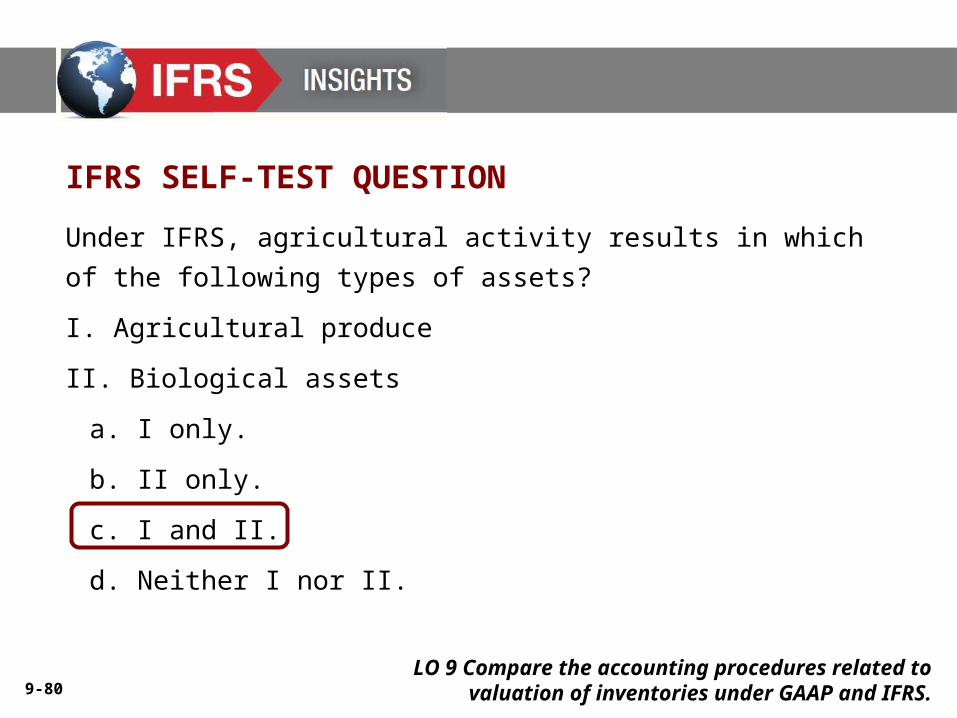
Under IFRS, agricultural activity results in which of the following types
of assets?
I. Agricultural produce
II. Biological assets
a. I only.
b. II only.
c. I and II.
d. Neither I nor II.
IFRS SELF-TEST QUESTION
LO 9 Compare the accounting procedures related to valuation of inventories under GAAP and IFRS.
9-81
Copyright © 2013 John Wiley & Sons, Inc. All rights reserved.
Reproduction or translation of this work beyond that permitted in
Section 117 of the 1976 United States Copyright Act without the
express written permission of the copyright owner is unlawful.
Request for further information should be addressed to the
Permissions Department, John Wiley & Sons, Inc. The purchaser
may make back-up copies for his/her own use only and not for
distribution or resale. The Publisher assumes no responsibility for
errors, omissions, or damages, caused by the use of these
programs or from the use of the information contained herein.
Copyright