8.2 possible detection of insects in an urban …
TRANSCRIPT
1
POSSIBLE DETECTION OF INSECTS IN AN URBAN ENVIRONMENT BY A FREQUENCY MODULATED-CONTINUOUS WAVE RADAR
Frank W. Gallagher III1*, James F. Bowers1, Eric J. Laufenberg1, Edward P. Argenta Jr.1, Donald P.
Storwold1, and Scott A. McLaughlin2
1West Desert Test Center, U.S. Army Dugway Proving Ground, Dugway, UT 2Applied Technologies, Inc., Longmont, CO
1. Introduction
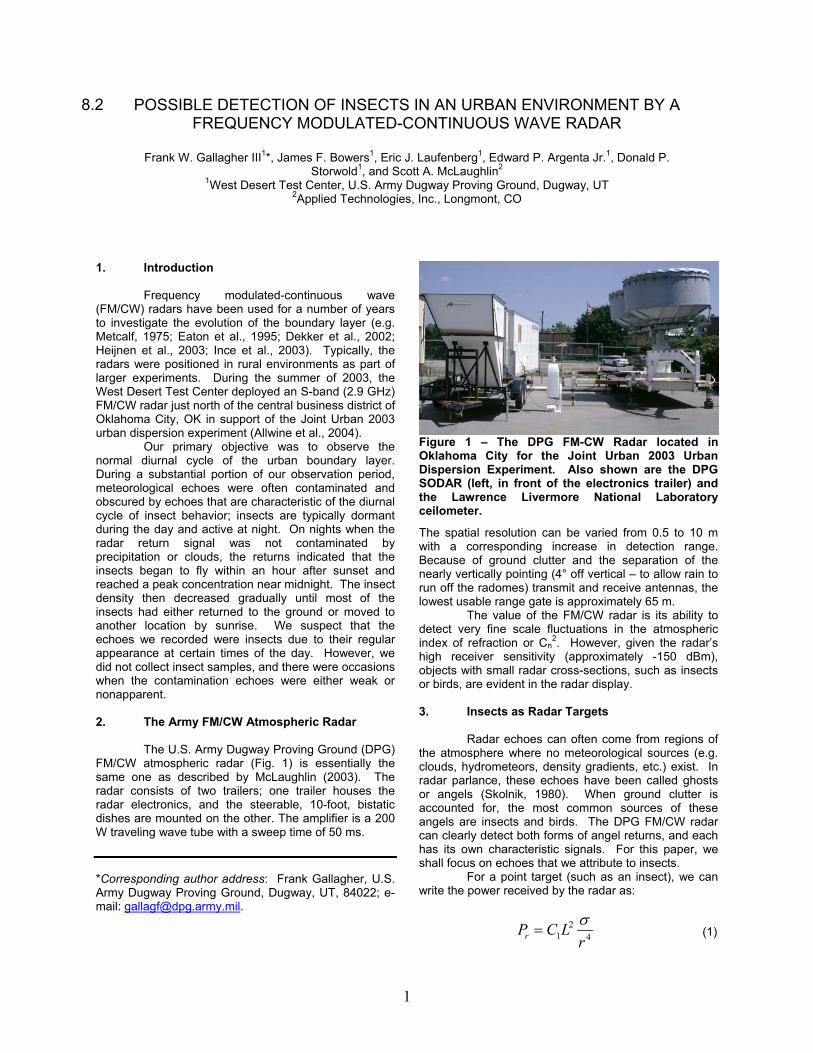
Frequency modulated-continuous wave (FM/CW) radars have been used for a number of years to investigate the evolution of the boundary layer (e.g. Metcalf, 1975; Eaton et al., 1995; Dekker et al., 2002; Heijnen et al., 2003; Ince et al., 2003). Typically, the radars were positioned in rural environments as part of larger experiments. During the summer of 2003, the West Desert Test Center deployed an S-band (2.9 GHz) FM/CW radar just north of the central business district of Oklahoma City, OK in support of the Joint Urban 2003 urban dispersion experiment (Allwine et al., 2004). Our primary objective was to observe the normal diurnal cycle of the urban boundary layer. During a substantial portion of our observation period, meteorological echoes were often contaminated and obscured by echoes that are characteristic of the diurnal cycle of insect behavior; insects are typically dormant during the day and active at night. On nights when the radar return signal was not contaminated by precipitation or clouds, the returns indicated that the insects began to fly within an hour after sunset and reached a peak concentration near midnight. The insect density then decreased gradually until most of the insects had either returned to the ground or moved to another location by sunrise. We suspect that the echoes we recorded were insects due to their regular appearance at certain times of the day. However, we did not collect insect samples, and there were occasions when the contamination echoes were either weak or nonapparent. 2. The Army FM/CW Atmospheric Radar The U.S. Army Dugway Proving Ground (DPG) FM/CW atmospheric radar (Fig. 1) is essentially the same one as described by McLaughlin (2003). The radar consists of two trailers; one trailer houses the radar electronics, and the steerable, 10-foot, bistatic dishes are mounted on the other. The amplifier is a 200 W traveling wave tube with a sweep time of 50 ms.
*Corresponding author address: Frank Gallagher, U.S. Army Dugway Proving Ground, Dugway, UT, 84022; e-mail: [email protected].
Figure 1 – The DPG FM-CW Radar located in Oklahoma City for the Joint Urban 2003 Urban Dispersion Experiment. Also shown are the DPG SODAR (left, in front of the electronics trailer) and the Lawrence Livermore National Laboratory ceilometer.
The spatial resolution can be varied from 0.5 to 10 m with a corresponding increase in detection range. Because of ground clutter and the separation of the nearly vertically pointing (4° off vertical – to allow rain to run off the radomes) transmit and receive antennas, the lowest usable range gate is approximately 65 m. The value of the FM/CW radar is its ability to detect very fine scale fluctuations in the atmospheric index of refraction or Cn
2. However, given the radar’s high receiver sensitivity (approximately -150 dBm), objects with small radar cross-sections, such as insects or birds, are evident in the radar display. 3. Insects as Radar Targets Radar echoes can often come from regions of the atmosphere where no meteorological sources (e.g. clouds, hydrometeors, density gradients, etc.) exist. In radar parlance, these echoes have been called ghosts or angels (Skolnik, 1980). When ground clutter is accounted for, the most common sources of these angels are insects and birds. The DPG FM/CW radar can clearly detect both forms of angel returns, and each has its own characteristic signals. For this paper, we shall focus on echoes that we attribute to insects. For a point target (such as an insect), we can write the power received by the radar as:
(1)
8.2
21 4rP C Lrσ
=

where C1 is a constant characteristic of the radar, L is attenuation over the radar-target path, σ is the effective radar cross-section of the target, and r is the range to the target (Sauvageot, 1992). The received power is directly proportional to the radar cross-section of the target if all other variables are constant. Radar cross-sections (S-band) can range from 2 x 10⁻³ cm2 for a cabbage looper moth to 0.1 cm2 for an adult field cricket (Skolnik, 1980), all of which can be detected by the radar. Furthermore, the concentration of insects can vary from as low as one insect m-3 to over 104 insects m-3 (Skolnik, 1980). Obviously, the higher target concentrations will result in larger echo signals. We have observed that the concentration of insects in the lowest 1 km of the atmosphere can be so high that any meteorological signal is obscured. For a distributed target (such as precipitation or turbulence), we can write the average power received by the radar as:
(2)
where C2 is a constant characteristic of the radar, L and r are as described previously, and η is the radar reflectivity for a distributed target (Sauvageot, 1992). While not fully calibrated for Cn
2, the FM/CW radar uses a form of the radar equation for meteorological targets (Eq. 2) to process the returned signal. This means that the data are range corrected for distributed targets, r2, and not for point targets, r4. Because the radar is designed to process distributed targets, point target returns are actually much stronger than depicted in the imagery. To properly calibrate the radar for Cn
2, well-determined values of linear quantities such as hardware and system gain (C1 and C2) would need to be incorporated into the calculation. 4. Examples of Insects as Detected by the
DPG FM/CW Radar Over central Oklahoma during the summer, there are four typical classes of objects that can cause point-target radar echo returns: insects, birds, bats, and anthropogenic objects (Alistair Drake, personal communication). Birds and bats typically appear as much stronger returns than insects and often remain in the beam for several scans, often appearing as “streaks” rather than point targets in the radar imagery. Some birds fly quickly through the beam and may appear as strong point-target echoes. Man-made objects, such as aircraft, tend to have such large radar cross-sections that their echo signals overwhelm and saturate the radar’s receiver when the object is in the radar’s field of view. These strong return signals often mask any meteorological phenomena during that scan period. Fortunately, man-made objects tend to move quickly out of the radar beam, and the interference quickly subsides.
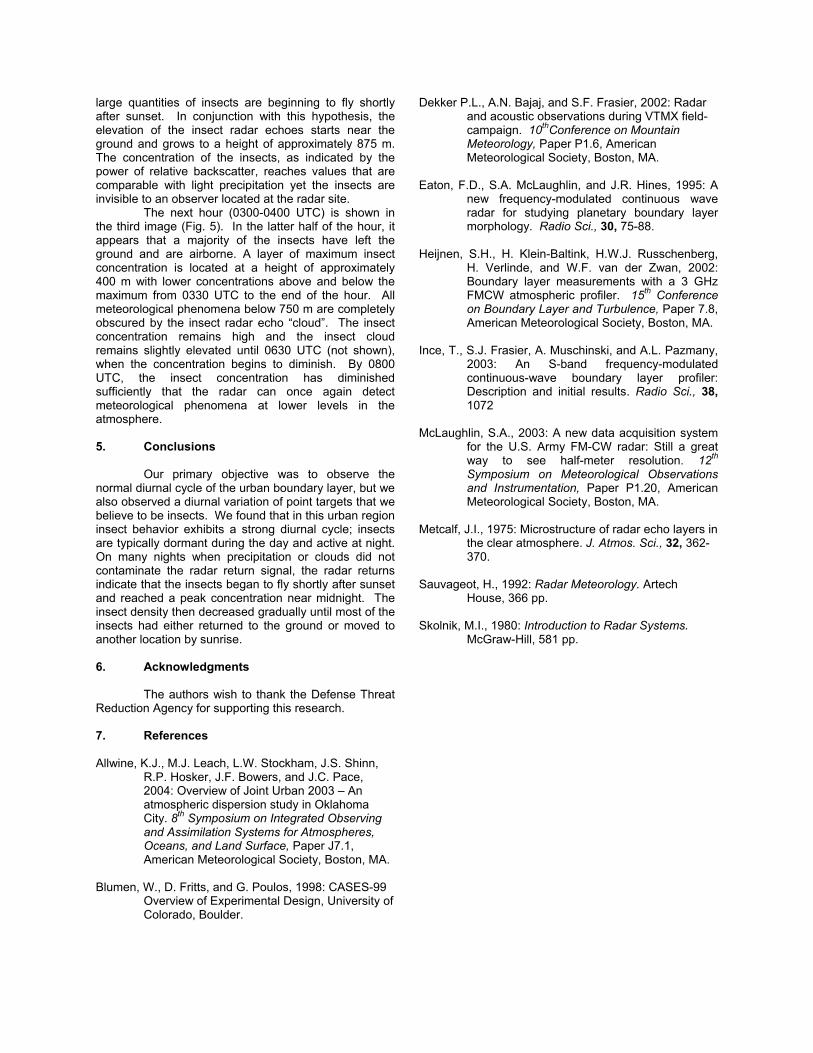
Insects tend to appear as pure point targets in radar echo returns. Because insects often move with the wind, they remain in the radar beam for only a single scan if the wind speed is sufficiently high. Also, insects are so small that visual confirmation of their type from the ground is generally impossible. Although we did not collect insects during the observation period, we believe that the pattern of echo behavior strongly suggests insects as the cause of the radar returns. Nocturnally migrating insects generally take-off at dusk and reach their ceiling within approximately a half hour to one hour after sunset (Alistair Drake, personal communication). Other experimenters, using a different FM/CW radar, have seen similar echo patterns and attributed them to insects (Blumen et al., 1998), although the returns were not as prominent as those shown here. 4.1 Typical Daytime Point Target Insect Returns Figure 2 shows a typical summer, clear sky, daytime image from the DPG FM/CW radar as it was operating in Oklahoma City, OK during the Joint Urban 2003 dispersion experiment. The image shows the relative backscatter power for a 1-hour period (2200 – 2300 UTC) on 5 July 2003. The top of the convective boundary layer (CBL) is clearly evident, as indicated by the strong, undulating return signal at altitudes varying from approximately 1000 to 1800 m. Up to three additional atmospheric layers are apparent above the top of the CBL. In this image, the insects appear as the many point-target returns at altitudes below the top of the CBL. As this example is late in the afternoon, the atmosphere within the CBL is well mixed and the concentration of point-target returns is fairly uniform with height. The returns above the CBL are most likely birds because they show a more linear, streak-like structure. 4.2 Insect Returns Near Sunset Figures 3-5 show three 1-hour images from the DPG FM/CW radar just prior to and following sunset (0149 UTC). The first image (Fig. 3) shows measurements recorded from 0100 to 0200 UTC on 6 July 2003. The demise of the convective boundary layer is apparent as the intensity of the return signal is much lower, indicating that turbulence, or Cn
2, at the top of the boundary layer has decreased. After 0145 UTC, the layer of enhanced Cn
2 that marked the top of the CBL has disappeared. The insect concentration appears to remain low and fairly uniform during this 1-hour period. The second image (Fig. 4) shows measurements recorded from 0200 to 0300 UTC on 6 July 2003. The CBL is gone and only elevated (~1750 m AGL) layers of enhanced Cn
2 are still detectable. For the first 10 minutes of this hour, the concentration of insects below approximately 1000 m remains fairly constant with about the same concentration as the previous hour. However, at approximately 0215 UTC (26 minutes after sunset), the point targets increase in density at lower altitudes, and they rise in height as time progresses. We believe it likely that, in this example,
22 2rP C Lrη
=
large quantities of insects are beginning to fly shortly after sunset. In conjunction with this hypothesis, the elevation of the insect radar echoes starts near the ground and grows to a height of approximately 875 m. The concentration of the insects, as indicated by the power of relative backscatter, reaches values that are comparable with light precipitation yet the insects are invisible to an observer located at the radar site. The next hour (0300-0400 UTC) is shown in the third image (Fig. 5). In the latter half of the hour, it appears that a majority of the insects have left the ground and are airborne. A layer of maximum insect concentration is located at a height of approximately 400 m with lower concentrations above and below the maximum from 0330 UTC to the end of the hour. All meteorological phenomena below 750 m are completely obscured by the insect radar echo “cloud”. The insect concentration remains high and the insect cloud remains slightly elevated until 0630 UTC (not shown), when the concentration begins to diminish. By 0800 UTC, the insect concentration has diminished sufficiently that the radar can once again detect meteorological phenomena at lower levels in the atmosphere. 5. Conclusions Our primary objective was to observe the normal diurnal cycle of the urban boundary layer, but we also observed a diurnal variation of point targets that we believe to be insects. We found that in this urban region insect behavior exhibits a strong diurnal cycle; insects are typically dormant during the day and active at night. On many nights when precipitation or clouds did not contaminate the radar return signal, the radar returns indicate that the insects began to fly shortly after sunset and reached a peak concentration near midnight. The insect density then decreased gradually until most of the insects had either returned to the ground or moved to another location by sunrise. 6. Acknowledgments The authors wish to thank the Defense Threat Reduction Agency for supporting this research. 7. References Allwine, K.J., M.J. Leach, L.W. Stockham, J.S. Shinn,
R.P. Hosker, J.F. Bowers, and J.C. Pace, 2004: Overview of Joint Urban 2003 – An atmospheric dispersion study in Oklahoma City. 8th Symposium on Integrated Observing and Assimilation Systems for Atmospheres, Oceans, and Land Surface, Paper J7.1, American Meteorological Society, Boston, MA.
Blumen, W., D. Fritts, and G. Poulos, 1998: CASES-99
Overview of Experimental Design, University of Colorado, Boulder.
Dekker P.L., A.N. Bajaj, and S.F. Frasier, 2002: Radar and acoustic observations during VTMX field-campaign. 10thConference on Mountain Meteorology, Paper P1.6, American Meteorological Society, Boston, MA.
Eaton, F.D., S.A. McLaughlin, and J.R. Hines, 1995: A
new frequency-modulated continuous wave radar for studying planetary boundary layer morphology. Radio Sci., 30, 75-88.
Heijnen, S.H., H. Klein-Baltink, H.W.J. Russchenberg,
H. Verlinde, and W.F. van der Zwan, 2002: Boundary layer measurements with a 3 GHz FMCW atmospheric profiler. 15th Conference on Boundary Layer and Turbulence, Paper 7.8, American Meteorological Society, Boston, MA.
Ince, T., S.J. Frasier, A. Muschinski, and A.L. Pazmany,
2003: An S-band frequency-modulated continuous-wave boundary layer profiler: Description and initial results. Radio Sci., 38, 1072
McLaughlin, S.A., 2003: A new data acquisition system
for the U.S. Army FM-CW radar: Still a great way to see half-meter resolution. 12th Symposium on Meteorological Observations and Instrumentation, Paper P1.20, American Meteorological Society, Boston, MA.
Metcalf, J.I., 1975: Microstructure of radar echo layers in
the clear atmosphere. J. Atmos. Sci., 32, 362-370.
Sauvageot, H., 1992: Radar Meteorology. Artech
House, 366 pp. Skolnik, M.I., 1980: Introduction to Radar Systems.
McGraw-Hill, 581 pp.
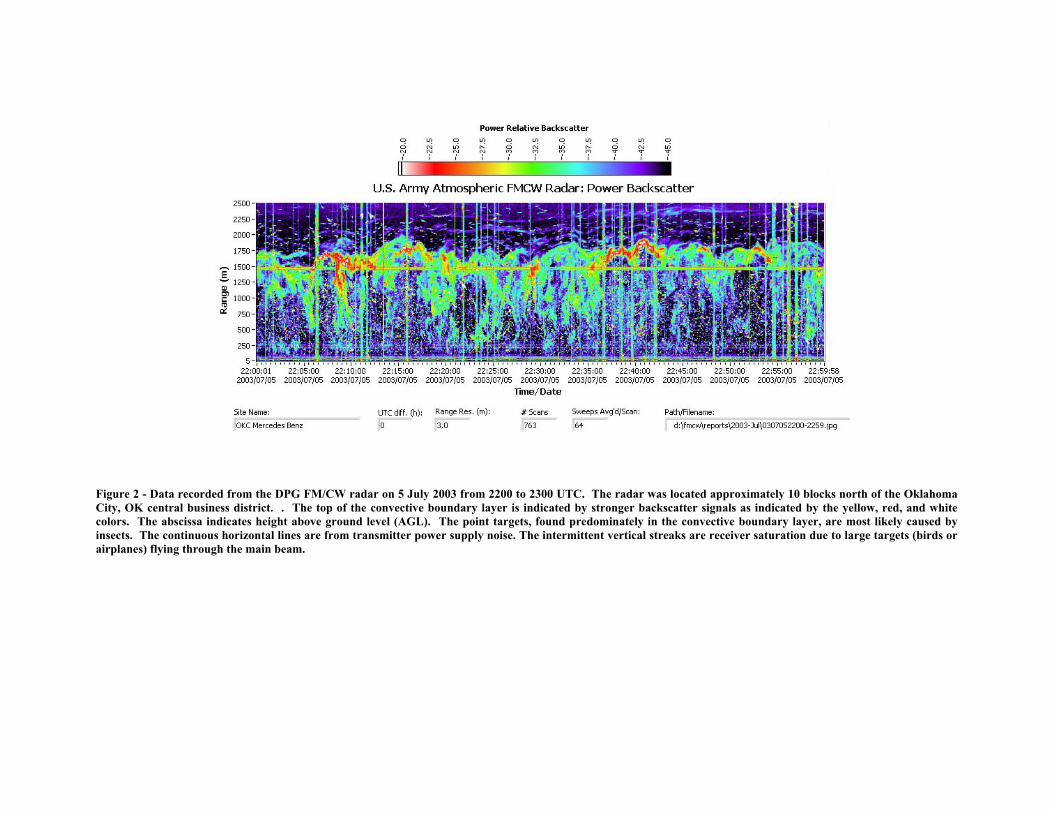
Figure 2 - Data recorded from the DPG FM/CW radar on 5 July 2003 from 2200 to 2300 UTC. The radar was located approximately 10 blocks north of the Oklahoma City, OK central business district. . The top of the convective boundary layer is indicated by stronger backscatter signals as indicated by the yellow, red, and white colors. The abscissa indicates height above ground level (AGL). The point targets, found predominately in the convective boundary layer, are most likely caused by insects. The continuous horizontal lines are from transmitter power supply noise. The intermittent vertical streaks are receiver saturation due to large targets (birds or airplanes) flying through the main beam.
Figure 3 - Data recorded from the DPG FM/CW radar on 6 July 2003 from 0100 to 0200 UTC. The demise of the convective boundary layer can be seen by the dramatic decrease in Cn
2 after 0120 UTC. The point targets, most likely caused by insects, remain located at altitudes below the height of the top of the daytime convective boundary layer. The radar was located approximately ten blocks north of the Oklahoma City, OK central business district. The continuous horizontal lines are from transmitter power supply noise. The intermittent vertical streaks are receiver saturation due to large targets (birds or airplanes) flying through the main beam.
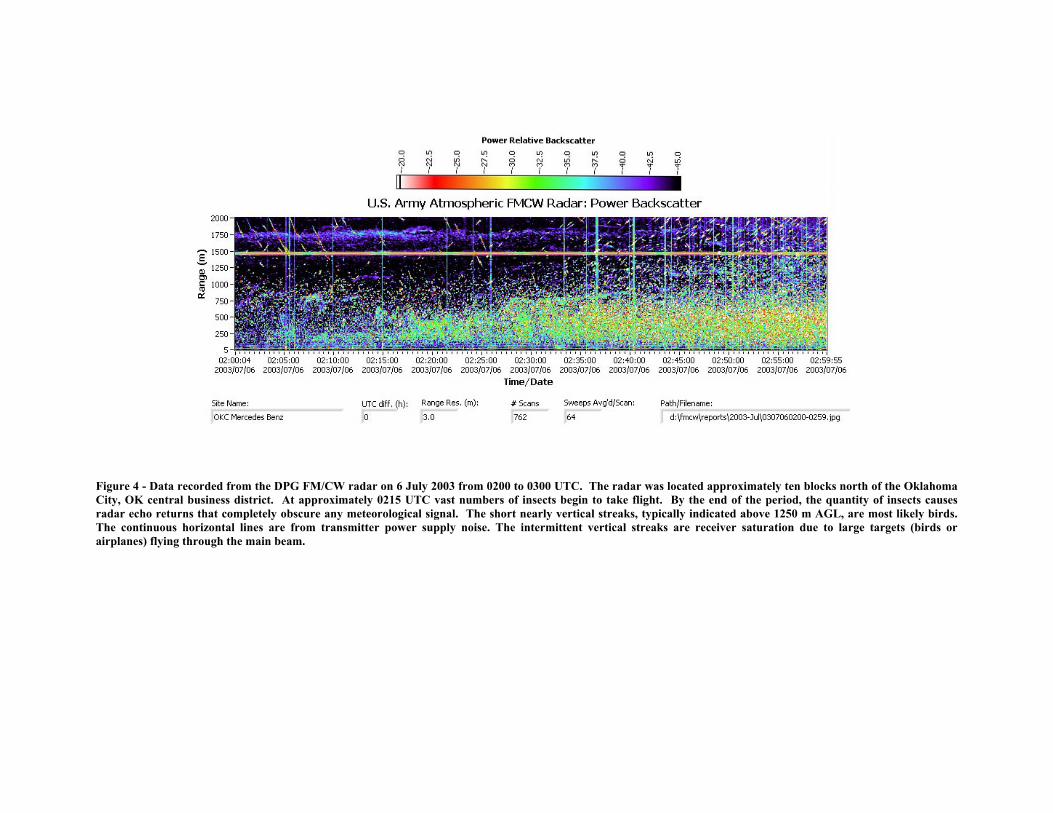
Figure 4 - Data recorded from the DPG FM/CW radar on 6 July 2003 from 0200 to 0300 UTC. The radar was located approximately ten blocks north of the Oklahoma City, OK central business district. At approximately 0215 UTC vast numbers of insects begin to take flight. By the end of the period, the quantity of insects causes radar echo returns that completely obscure any meteorological signal. The short nearly vertical streaks, typically indicated above 1250 m AGL, are most likely birds. The continuous horizontal lines are from transmitter power supply noise. The intermittent vertical streaks are receiver saturation due to large targets (birds or airplanes) flying through the main beam.

Figure 5 - Data recorded from the DPG FM/CW radar on 6 July 2003 from 0300 to 0400 UTC. The radar was located approximately ten blocks north of the Oklahoma City, OK central business district. The large quantity of insects obscures all meteorological signals below 1 km AGL. By 0335 UTC a region of weaker echoes appears between the insect density maximum (approximately 500 m AGL) and the ground indicating that the majority of the insects have taken flight. Some residual layers of enhanced Cn
2 can be detected above (~1250 m AGL) the insect level. The continuous horizontal lines are from transmitter power supply noise. The intermittent vertical streaks are receiver saturation due to large targets (birds or airplanes) flying through the main beam.