802.11ac wireless throughput testing and validation guide · 802.11ac wireless throughput testing...
TRANSCRIPT

802.11ac wireless throughput testing andvalidation guide Contents
IntroductionPrerequisitesRequirementsComponents UsedUnderstandMeasureVerify and validateTroubleshoot
Introduction
This document will describe the way of testing the wireless throughput of an access point focusingon 802.11ac and what throughput to expect in given conditions.
Prerequisites
Requirements
This document assumes an already functioning setup with 802.11ac access points (APs) givingclient connectivity already
Components Used
The information in this document is focused on 802.11ac technology and speeds.
Cisco APs with Wave1 technology:
3700 series
2700 series
1700 series
1570 series
Cisco APs with Wave2 technology:
4800 series
3800 series
2800 series
1850 series
1830 series
1560 series
1540 series
Understand
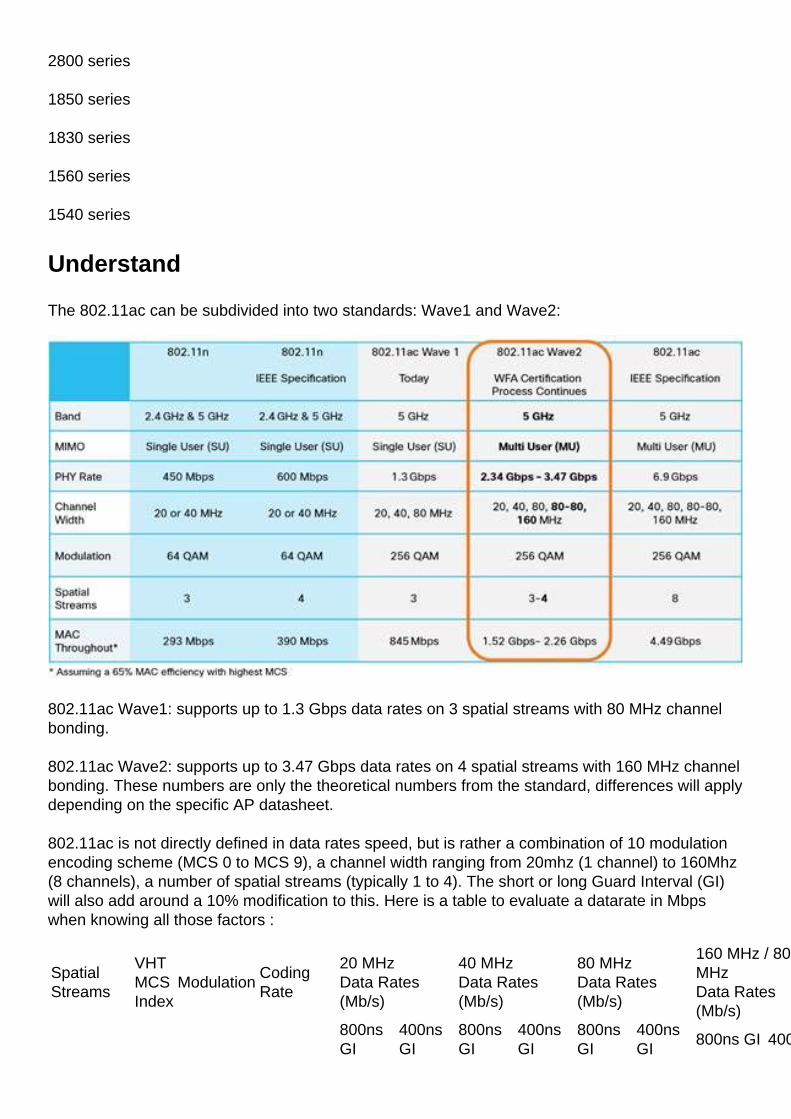
The 802.11ac can be subdivided into two standards: Wave1 and Wave2:
802.11ac Wave1: supports up to 1.3 Gbps data rates on 3 spatial streams with 80 MHz channelbonding.
802.11ac Wave2: supports up to 3.47 Gbps data rates on 4 spatial streams with 160 MHz channelbonding. These numbers are only the theoretical numbers from the standard, differences will applydepending on the specific AP datasheet.
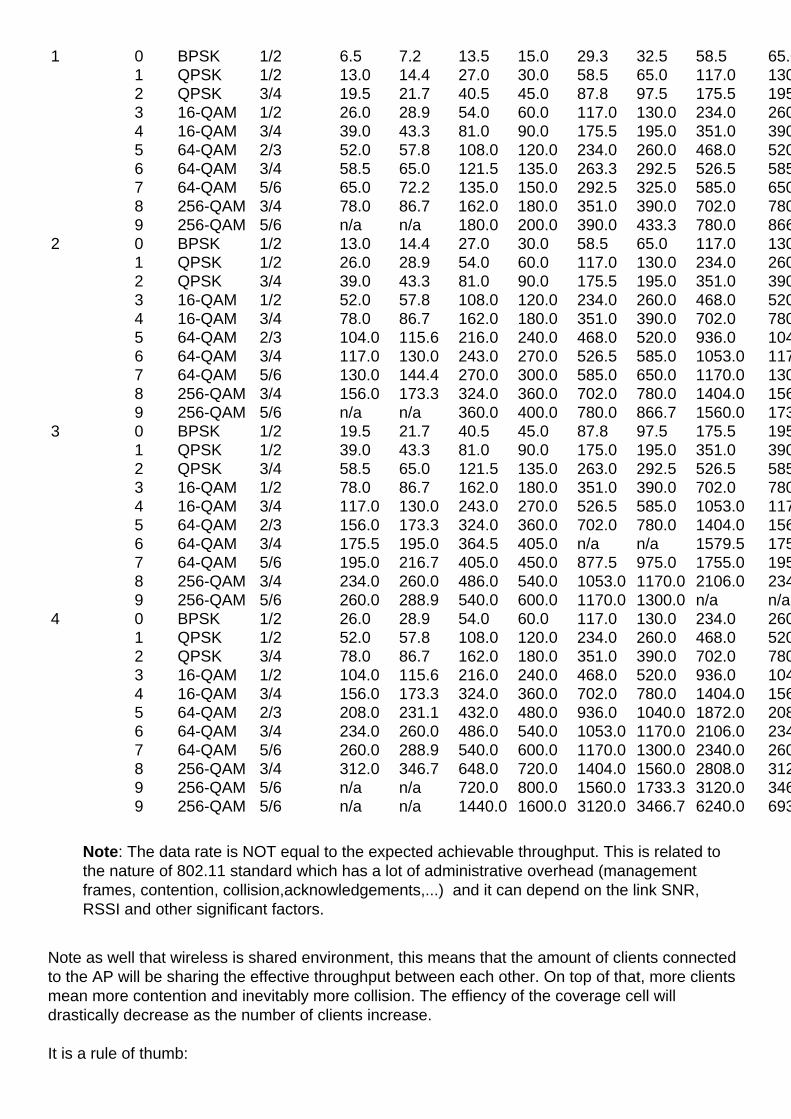
802.11ac is not directly defined in data rates speed, but is rather a combination of 10 modulationencoding scheme (MCS 0 to MCS 9), a channel width ranging from 20mhz (1 channel) to 160Mhz(8 channels), a number of spatial streams (typically 1 to 4). The short or long Guard Interval (GI)will also add around a 10% modification to this. Here is a table to evaluate a datarate in Mbpswhen knowing all those factors :
SpatialStreams
VHTMCSIndex
ModulationCodingRate
20 MHzData Rates(Mb/s)
40 MHzData Rates(Mb/s)
80 MHzData Rates(Mb/s)
160 MHz / 80+80MHzData Rates(Mb/s)
800nsGI
400nsGI
800nsGI
400nsGI
800nsGI
400nsGI
800ns GI 400ns GI
1 0 BPSK 1/2 6.5 7.2 13.5 15.0 29.3 32.5 58.5 65.0 1 QPSK 1/2 13.0 14.4 27.0 30.0 58.5 65.0 117.0 130.0 2 QPSK 3/4 19.5 21.7 40.5 45.0 87.8 97.5 175.5 195.0 3 16-QAM 1/2 26.0 28.9 54.0 60.0 117.0 130.0 234.0 260.0 4 16-QAM 3/4 39.0 43.3 81.0 90.0 175.5 195.0 351.0 390.0 5 64-QAM 2/3 52.0 57.8 108.0 120.0 234.0 260.0 468.0 520.0 6 64-QAM 3/4 58.5 65.0 121.5 135.0 263.3 292.5 526.5 585.0 7 64-QAM 5/6 65.0 72.2 135.0 150.0 292.5 325.0 585.0 650.0 8 256-QAM 3/4 78.0 86.7 162.0 180.0 351.0 390.0 702.0 780.0 9 256-QAM 5/6 n/a n/a 180.0 200.0 390.0 433.3 780.0 866.72 0 BPSK 1/2 13.0 14.4 27.0 30.0 58.5 65.0 117.0 130.0 1 QPSK 1/2 26.0 28.9 54.0 60.0 117.0 130.0 234.0 260.0 2 QPSK 3/4 39.0 43.3 81.0 90.0 175.5 195.0 351.0 390.0 3 16-QAM 1/2 52.0 57.8 108.0 120.0 234.0 260.0 468.0 520.0 4 16-QAM 3/4 78.0 86.7 162.0 180.0 351.0 390.0 702.0 780.0 5 64-QAM 2/3 104.0 115.6 216.0 240.0 468.0 520.0 936.0 1040.0 6 64-QAM 3/4 117.0 130.0 243.0 270.0 526.5 585.0 1053.0 1170.0 7 64-QAM 5/6 130.0 144.4 270.0 300.0 585.0 650.0 1170.0 1300.0 8 256-QAM 3/4 156.0 173.3 324.0 360.0 702.0 780.0 1404.0 1560.0 9 256-QAM 5/6 n/a n/a 360.0 400.0 780.0 866.7 1560.0 1733.03 0 BPSK 1/2 19.5 21.7 40.5 45.0 87.8 97.5 175.5 195.0 1 QPSK 1/2 39.0 43.3 81.0 90.0 175.0 195.0 351.0 390.0 2 QPSK 3/4 58.5 65.0 121.5 135.0 263.0 292.5 526.5 585.0 3 16-QAM 1/2 78.0 86.7 162.0 180.0 351.0 390.0 702.0 780.0 4 16-QAM 3/4 117.0 130.0 243.0 270.0 526.5 585.0 1053.0 1170.0 5 64-QAM 2/3 156.0 173.3 324.0 360.0 702.0 780.0 1404.0 1560.0 6 64-QAM 3/4 175.5 195.0 364.5 405.0 n/a n/a 1579.5 1755.0 7 64-QAM 5/6 195.0 216.7 405.0 450.0 877.5 975.0 1755.0 1950.0 8 256-QAM 3/4 234.0 260.0 486.0 540.0 1053.0 1170.0 2106.0 2340.0 9 256-QAM 5/6 260.0 288.9 540.0 600.0 1170.0 1300.0 n/a n/a4 0 BPSK 1/2 26.0 28.9 54.0 60.0 117.0 130.0 234.0 260.0 1 QPSK 1/2 52.0 57.8 108.0 120.0 234.0 260.0 468.0 520.0 2 QPSK 3/4 78.0 86.7 162.0 180.0 351.0 390.0 702.0 780.0 3 16-QAM 1/2 104.0 115.6 216.0 240.0 468.0 520.0 936.0 1040.0 4 16-QAM 3/4 156.0 173.3 324.0 360.0 702.0 780.0 1404.0 1560.0 5 64-QAM 2/3 208.0 231.1 432.0 480.0 936.0 1040.0 1872.0 2080.0 6 64-QAM 3/4 234.0 260.0 486.0 540.0 1053.0 1170.0 2106.0 2340.0 7 64-QAM 5/6 260.0 288.9 540.0 600.0 1170.0 1300.0 2340.0 2600.0 8 256-QAM 3/4 312.0 346.7 648.0 720.0 1404.0 1560.0 2808.0 3120.0 9 256-QAM 5/6 n/a n/a 720.0 800.0 1560.0 1733.3 3120.0 3466.7 9 256-QAM 5/6 n/a n/a 1440.0 1600.0 3120.0 3466.7 6240.0 6933.3
Note: The data rate is NOT equal to the expected achievable throughput. This is related tothe nature of 802.11 standard which has a lot of administrative overhead (managementframes, contention, collision,acknowledgements,...) and it can depend on the link SNR,RSSI and other significant factors.
Note as well that wireless is shared environment, this means that the amount of clients connectedto the AP will be sharing the effective throughput between each other. On top of that, more clientsmean more contention and inevitably more collision. The effiency of the coverage cell willdrastically decrease as the number of clients increase.
It is a rule of thumb:
Expected throughput = Data Rate x 0.65
In our case:
780 x 0.65 = 507
507 Mbps of throughput is what we may expect in good conditions in a lab with a single client.
Measure
Generally speaking, we can have two scenarios when we do a throughput test:
APs are in Flexconnect local switching●
APs are in local mode or Flexconnect central switching●
We will take those scenarios one by one:
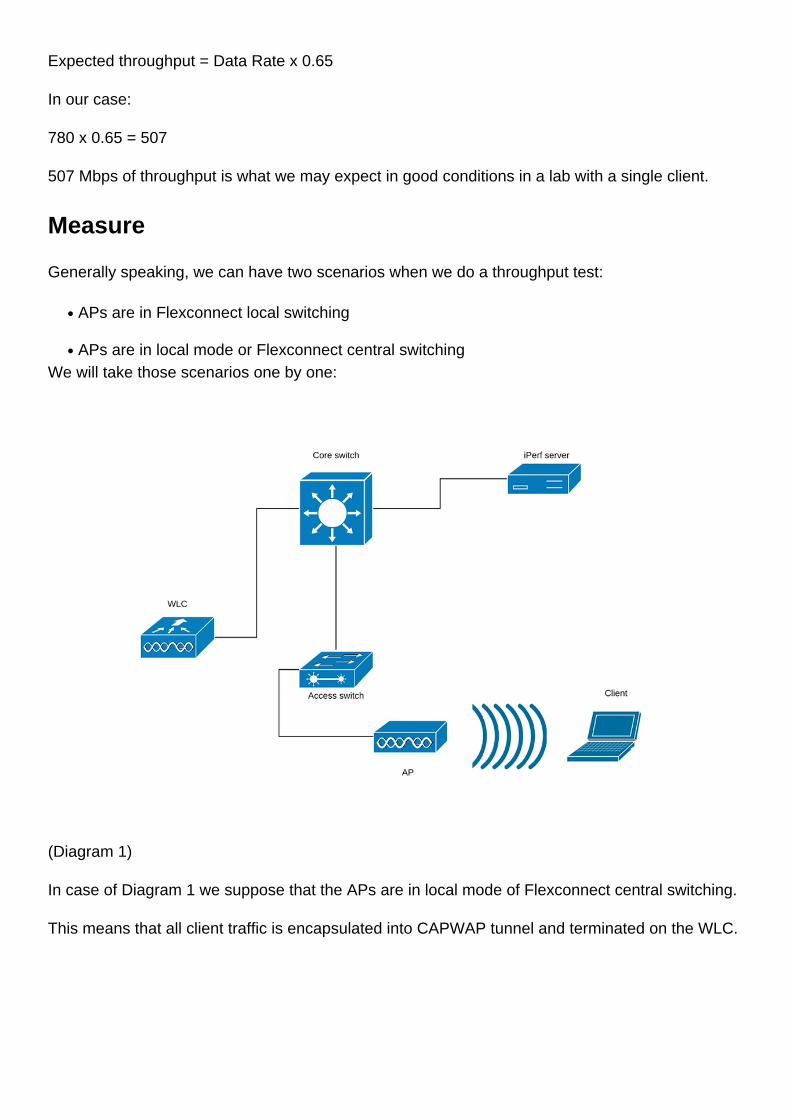
(Diagram 1)
In case of Diagram 1 we suppose that the APs are in local mode of Flexconnect central switching.
This means that all client traffic is encapsulated into CAPWAP tunnel and terminated on the WLC.

(Diagram 2)
The red line in the Diagram 2 shows the traffic flow from the wireless client.
The iPerf server should be as close as possible to the traffic termination point, ideally plugged inthe same switch as the WLC itself and use the same VLAN.
In case of Flexconnect local switching, the client traffic is terminated on the AP itself, andconsidering that the iPerf server should be set up as close to the termination point of wirelessclient traffic, you should plug in the iPerf server to the same switch and same VLAN where AP isplugged. In our case this is access switch (Diagram 3).
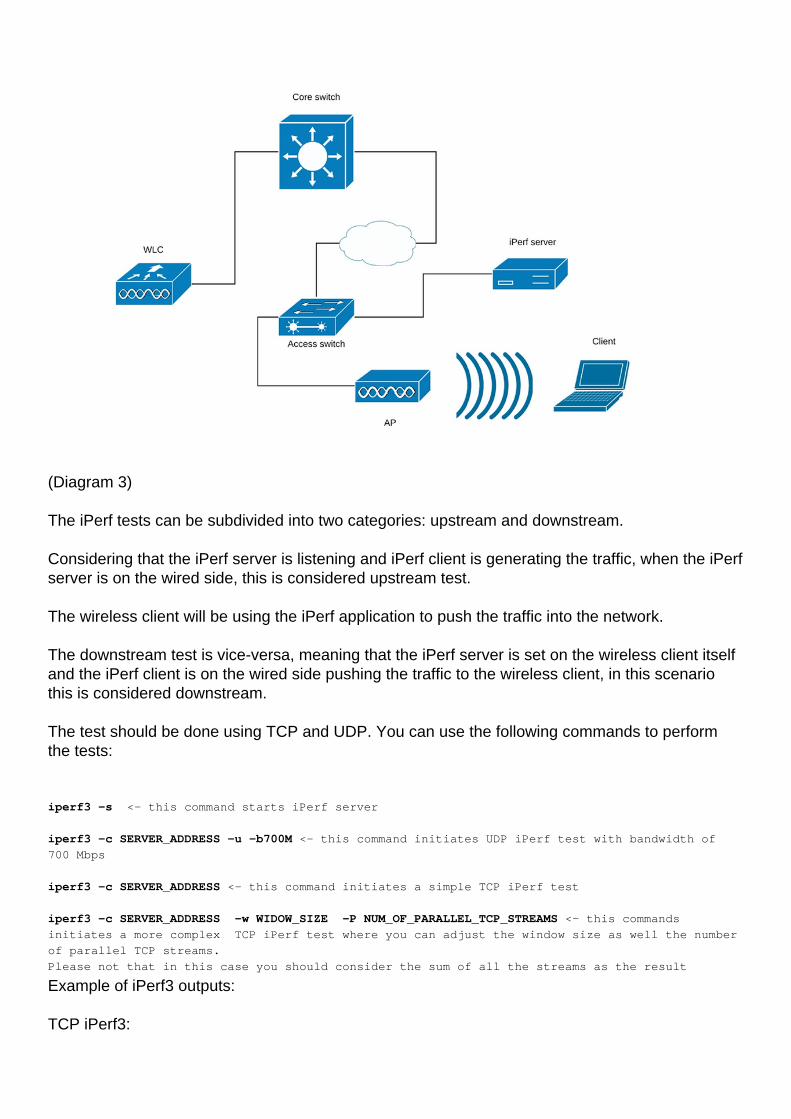
(Diagram 3)
The iPerf tests can be subdivided into two categories: upstream and downstream.
Considering that the iPerf server is listening and iPerf client is generating the traffic, when the iPerfserver is on the wired side, this is considered upstream test.
The wireless client will be using the iPerf application to push the traffic into the network.
The downstream test is vice-versa, meaning that the iPerf server is set on the wireless client itselfand the iPerf client is on the wired side pushing the traffic to the wireless client, in this scenariothis is considered downstream.
The test should be done using TCP and UDP. You can use the following commands to performthe tests:
iperf3 -s <- this command starts iPerf server
iperf3 -c SERVER_ADDRESS -u -b700M <- this command initiates UDP iPerf test with bandwidth of
700 Mbps
iperf3 -c SERVER_ADDRESS <- this command initiates a simple TCP iPerf test
iperf3 -c SERVER_ADDRESS -w WIDOW_SIZE -P NUM_OF_PARALLEL_TCP_STREAMS <- this commands
initiates a more complex TCP iPerf test where you can adjust the window size as well the number
of parallel TCP streams.
Please not that in this case you should consider the sum of all the streams as the result
Example of iPerf3 outputs:
TCP iPerf3:

iperf3 -s <- this command starts iPerf server
iperf3 -c SERVER_ADDRESS -u -b700M <- this command initiates UDP iPerf test with bandwidth of
700 Mbps
iperf3 -c SERVER_ADDRESS <- this command initiates a simple TCP iPerf test
iperf3 -c SERVER_ADDRESS -w WIDOW_SIZE -P NUM_OF_PARALLEL_TCP_STREAMS <- this commands
initiates a more complex TCP iPerf test where you can adjust the window size as well the number
of parallel TCP streams.
Please not that in this case you should consider the sum of all the streams as the result
UDP iPerf3:
Sometime iPerf does misbehave and does not give the average bandwidth in the end of the UDPtest.
It is still possible to sum up the Bandwidth for each second and then devide it by number ofseconds:
iperf3 -s <- this command starts iPerf server
iperf3 -c SERVER_ADDRESS -u -b700M <- this command initiates UDP iPerf test with bandwidth of
700 Mbps
iperf3 -c SERVER_ADDRESS <- this command initiates a simple TCP iPerf test
iperf3 -c SERVER_ADDRESS -w WIDOW_SIZE -P NUM_OF_PARALLEL_TCP_STREAMS <- this commands
initiates a more complex TCP iPerf test where you can adjust the window size as well the number
of parallel TCP streams.
Please not that in this case you should consider the sum of all the streams as the result
Note: It is expected that the iPerf results will be slightly better on the Flexconnect localsiwtching compared to the central switching scenario.This is caused by the fact that client traffic is encapsulated into CAPWAP, which adds moreoverhead to the traffic and in general the WLC acts as a bottleneck as it is the aggregationpoint for all wireless clients traffic.As well, it is expected that the UDP iPerf test will give better results in a clean environmentas it is the most efficient transfer method when the connection is reliable. TCP however,might win in case of heavy fragmentation (when TCP Adjust MSS is used) or unreliableconnection
.
Verify and validate

In order to check at which data rate the client is connected you need to issue following commandin WLC CLI:
(Cisco Controller) >show client detail 94:65:2d:d4:8c:d6
Client MAC Address............................... 94:65:2d:d4:8c:d6
Client Username ................................. N/A
AP MAC Address................................... 00:81:c4:fb:a8:20
AP Name.......................................... AIR-AP3802I-E-K9
AP radio slot Id................................. 1
Client State..................................... Associated
Client User Group................................
Client NAC OOB State............................. Access
Wireless LAN Id.................................. 2
Wireless LAN Network Name (SSID)................. speed-test-WLAN-avitosin
Wireless LAN Profile Name........................ speed-test
Hotspot (802.11u)................................ Not Supported
BSSID............................................ 00:81:c4:fb:a8:2e
Connected For ................................... 91 secs
Channel.......................................... 52
IP Address....................................... 192.168.240.33
Gateway Address.................................. 192.168.240.1
Netmask.......................................... 255.255.255.0
Association Id................................... 1
Authentication Algorithm......................... Open System
Reason Code...................................... 1
Status Code...................................... 0
--More-- or (q)uit
Session Timeout.................................. 1800
Client CCX version............................... No CCX support
QoS Level........................................ Silver
Avg data Rate.................................... 0
Burst data Rate.................................. 0
Avg Real time data Rate.......................... 0
Burst Real Time data Rate........................ 0
802.1P Priority Tag.............................. disabled
CTS Security Group Tag........................... Not Applicable
KTS CAC Capability............................... No
Qos Map Capability............................... No
WMM Support...................................... Enabled
APSD ACs....................................... BK BE VI VO
Current Rate..................................... m9 ss2
Supported Rates.................................. 12.0,18.0,24.0,36.0,48.0,
............................................. 54.0
Mobility State................................... Local
Mobility Move Count.............................. 0
Security Policy Completed........................ Yes
Policy Manager State............................. RUN
Audit Session ID................................. 0a3027a4000000105a9cd9ad
AAA Role Type.................................... none
Local Policy Applied............................. none
--More-- or (q)uit
IPv4 ACL Name.................................... none
FlexConnect ACL Applied Status................... Unavailable
IPv4 ACL Applied Status.......................... Unavailable
IPv6 ACL Name.................................... none
IPv6 ACL Applied Status.......................... Unavailable
Layer2 ACL Name.................................. none
Layer2 ACL Applied Status........................ Unavailable
mDNS Status...................................... Disabled
mDNS Profile Name................................ none
No. of mDNS Services Advertised.................. 0
Policy Type...................................... N/A
Encryption Cipher................................ None
Protected Management Frame ...................... No
Management Frame Protection...................... No
EAP Type......................................... Unknown
Interface........................................ vlan240
VLAN............................................. 240
Quarantine VLAN.................................. 0
Access VLAN...................................... 240
Local Bridging VLAN.............................. 240
Client Capabilities:
CF Pollable................................ Not implemented
CF Poll Request............................ Not implemented
--More-- or (q)uit
Short Preamble............................. Not implemented
PBCC....................................... Not implemented
Channel Agility............................ Not implemented
Listen Interval............................ 1
Fast BSS Transition........................ Not implemented
11v BSS Transition......................... Implemented
Client Wifi Direct Capabilities:
WFD capable................................ No
Manged WFD capable......................... No
Cross Connection Capable................... No
Support Concurrent Operation............... No
Fast BSS Transition Details:
Client Statistics:
Number of Bytes Received................... 183844
Number of Bytes Sent....................... 119182
Total Number of Bytes Sent................. 119182
Total Number of Bytes Recv................. 183844
Number of Bytes Sent (last 90s)............ 119182
Number of Bytes Recv (last 90s)............ 183844
Number of Packets Received................. 2536
Number of Packets Sent..................... 249
Number of Interim-Update Sent.............. 0
Number of EAP Id Request Msg Timeouts...... 0
--More-- or (q)uit
Number of EAP Id Request Msg Failures...... 0
Number of EAP Request Msg Timeouts......... 0
Number of EAP Request Msg Failures......... 0
Number of EAP Key Msg Timeouts............. 0
Number of EAP Key Msg Failures............. 0
Number of Data Retries..................... 0
Number of RTS Retries...................... 0
Number of Duplicate Received Packets....... 0
Number of Decrypt Failed Packets........... 0
Number of Mic Failured Packets............. 0
Number of Mic Missing Packets.............. 0
Number of RA Packets Dropped............... 0
Number of Policy Errors.................... 0
Radio Signal Strength Indicator............ -25 dBm
Signal to Noise Ratio...................... 67 dB
Client Rate Limiting Statistics:
Number of Data Packets Received............ 0
Number of Data Rx Packets Dropped.......... 0
Number of Data Bytes Received.............. 0
Number of Data Rx Bytes Dropped............ 0
Number of Realtime Packets Received........ 0
Number of Realtime Rx Packets Dropped...... 0
Number of Realtime Bytes Received.......... 0
--More-- or (q)uit
Number of Realtime Rx Bytes Dropped........ 0
Number of Data Packets Sent................ 0
Number of Data Tx Packets Dropped.......... 0
Number of Data Bytes Sent.................. 0
Number of Data Tx Bytes Dropped............ 0
Number of Realtime Packets Sent............ 0
Number of Realtime Tx Packets Dropped...... 0
Number of Realtime Bytes Sent.............. 0
Number of Realtime Tx Bytes Dropped........ 0
Nearby AP Statistics:
DNS Server details:
DNS server IP ............................. 10.48.39.33
DNS server IP ............................. 0.0.0.0
Assisted Roaming Prediction List details:
Client Dhcp Required: False
Allowed (URL)IP Addresses
-------------------------
AVC Profile Name: ............................... none
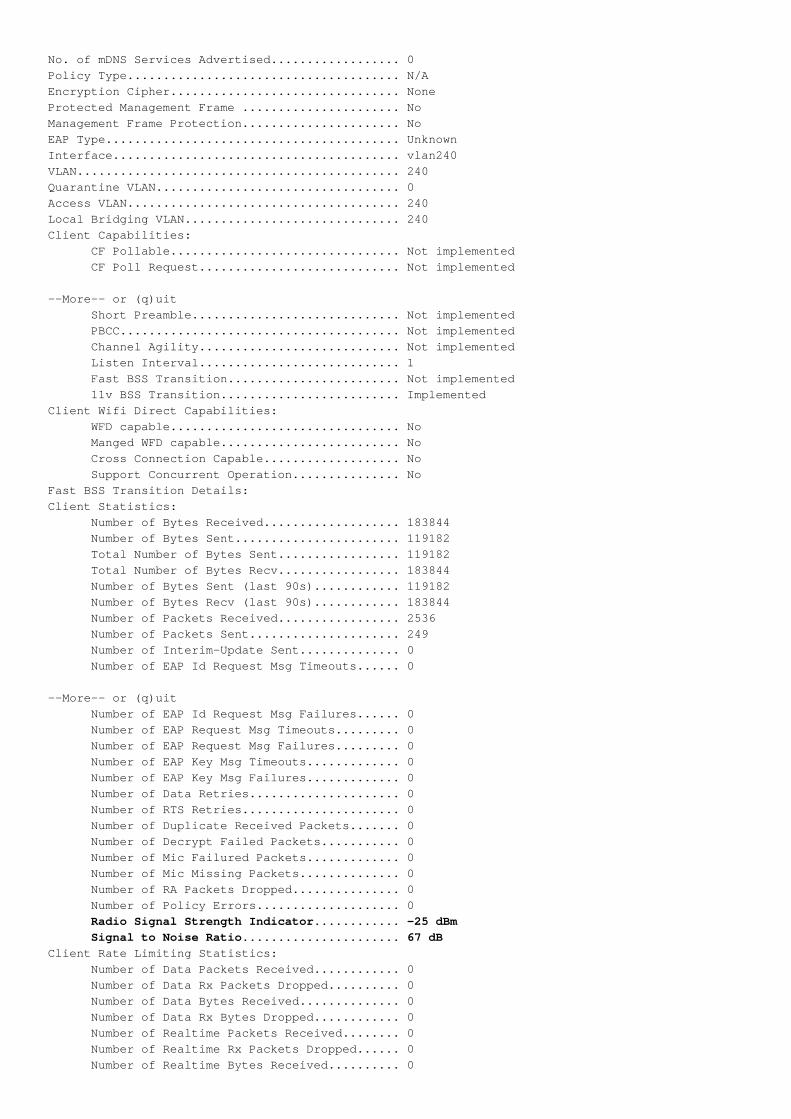
You can see the this particular client is connected on the following rate:
Current Rate..................................... m9 ss2
Which means that the client is using the MCS 9 (m9) index on 2 spatial streams (ss2)
From the "show client detail <MAC>" command, it is not possible to see if the client is connectedon 20/40/80 MHz channel bonding.
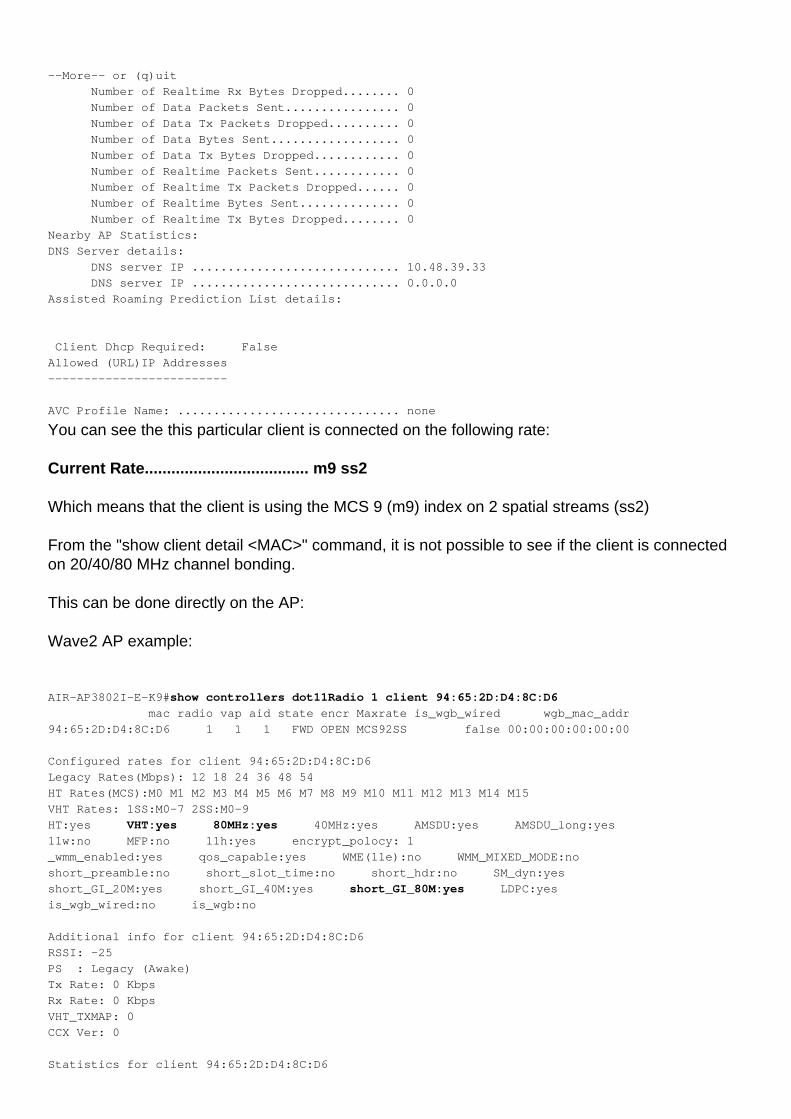
This can be done directly on the AP:
Wave2 AP example:
AIR-AP3802I-E-K9#show controllers dot11Radio 1 client 94:65:2D:D4:8C:D6
mac radio vap aid state encr Maxrate is_wgb_wired wgb_mac_addr
94:65:2D:D4:8C:D6 1 1 1 FWD OPEN MCS92SS false 00:00:00:00:00:00
Configured rates for client 94:65:2D:D4:8C:D6
Legacy Rates(Mbps): 12 18 24 36 48 54
HT Rates(MCS):M0 M1 M2 M3 M4 M5 M6 M7 M8 M9 M10 M11 M12 M13 M14 M15
VHT Rates: 1SS:M0-7 2SS:M0-9
HT:yes VHT:yes 80MHz:yes 40MHz:yes AMSDU:yes AMSDU_long:yes
11w:no MFP:no 11h:yes encrypt_polocy: 1
_wmm_enabled:yes qos_capable:yes WME(11e):no WMM_MIXED_MODE:no
short_preamble:no short_slot_time:no short_hdr:no SM_dyn:yes
short_GI_20M:yes short_GI_40M:yes short_GI_80M:yes LDPC:yes
is_wgb_wired:no is_wgb:no
Additional info for client 94:65:2D:D4:8C:D6
RSSI: -25
PS : Legacy (Awake)
Tx Rate: 0 Kbps
Rx Rate: 0 Kbps
VHT_TXMAP: 0
CCX Ver: 0
Statistics for client 94:65:2D:D4:8C:D6
mac intf TxData TxMgmt TxUC TxBytes TxFail TxDcrd RxData RxMgmt RxBytes RxErr
TxRt RxRt idle_counter stats_ago expiration
94:65:2D:D4:8C:D6 apr1v1 254 0 254 121390 0 0 2568 0 185511 0
585000 866700 300 2.492000 1640
Per TID packet statistics for client 94:65:2D:D4:8C:D6
Priority Rx Pkts Tx Pkts Rx(last 5 s) Tx (last 5 s) QID Tx Drops Tx Cur Qlimit
0 1424 146 17 3 136 0 0 4096
1 0 0 0 0 137 0 0 4096
2 0 0 0 0 138 0 0 4096
3 34 26 0 0 139 0 0 4096
4 0 0 0 0 140 0 0 4096
5 0 0 0 0 141 0 0 4096
6 0 0 0 0 142 0 0 4096
7 0 0 0 0 143 0 0 4096
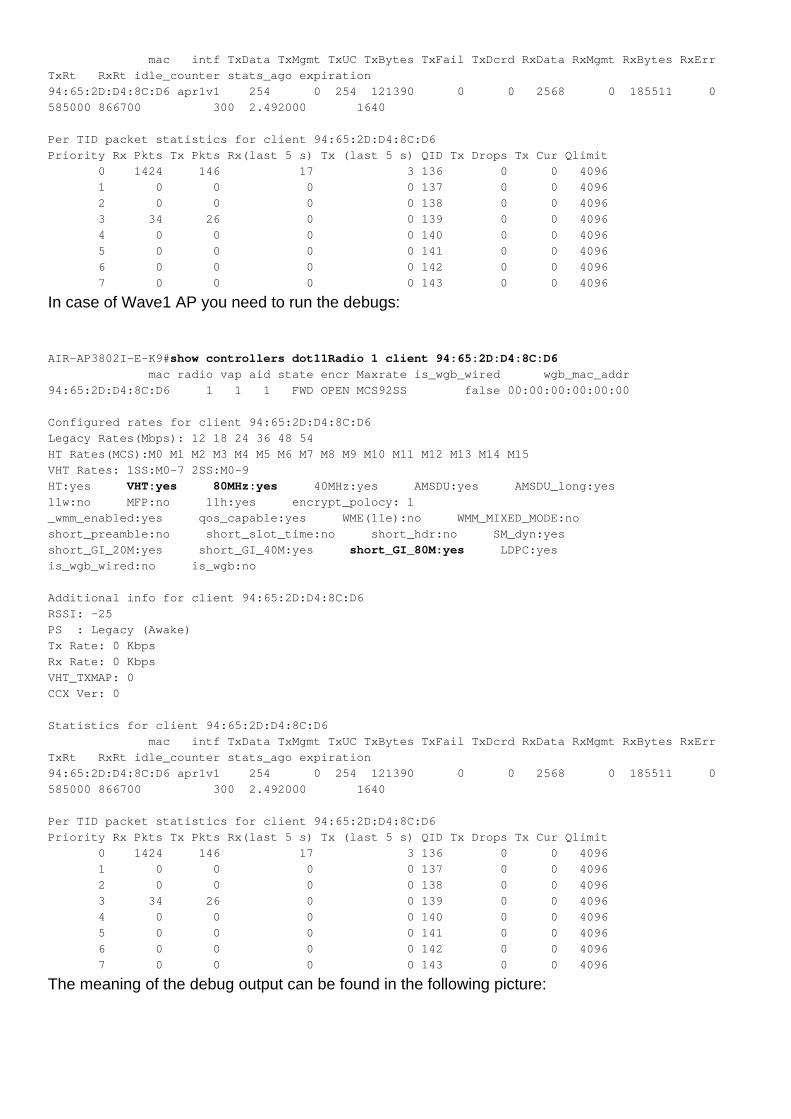
In case of Wave1 AP you need to run the debugs:
AIR-AP3802I-E-K9#show controllers dot11Radio 1 client 94:65:2D:D4:8C:D6
mac radio vap aid state encr Maxrate is_wgb_wired wgb_mac_addr
94:65:2D:D4:8C:D6 1 1 1 FWD OPEN MCS92SS false 00:00:00:00:00:00
Configured rates for client 94:65:2D:D4:8C:D6
Legacy Rates(Mbps): 12 18 24 36 48 54
HT Rates(MCS):M0 M1 M2 M3 M4 M5 M6 M7 M8 M9 M10 M11 M12 M13 M14 M15
VHT Rates: 1SS:M0-7 2SS:M0-9
HT:yes VHT:yes 80MHz:yes 40MHz:yes AMSDU:yes AMSDU_long:yes
11w:no MFP:no 11h:yes encrypt_polocy: 1
_wmm_enabled:yes qos_capable:yes WME(11e):no WMM_MIXED_MODE:no
short_preamble:no short_slot_time:no short_hdr:no SM_dyn:yes
short_GI_20M:yes short_GI_40M:yes short_GI_80M:yes LDPC:yes
is_wgb_wired:no is_wgb:no
Additional info for client 94:65:2D:D4:8C:D6
RSSI: -25
PS : Legacy (Awake)
Tx Rate: 0 Kbps
Rx Rate: 0 Kbps
VHT_TXMAP: 0
CCX Ver: 0
Statistics for client 94:65:2D:D4:8C:D6
mac intf TxData TxMgmt TxUC TxBytes TxFail TxDcrd RxData RxMgmt RxBytes RxErr
TxRt RxRt idle_counter stats_ago expiration
94:65:2D:D4:8C:D6 apr1v1 254 0 254 121390 0 0 2568 0 185511 0
585000 866700 300 2.492000 1640
Per TID packet statistics for client 94:65:2D:D4:8C:D6
Priority Rx Pkts Tx Pkts Rx(last 5 s) Tx (last 5 s) QID Tx Drops Tx Cur Qlimit
0 1424 146 17 3 136 0 0 4096
1 0 0 0 0 137 0 0 4096
2 0 0 0 0 138 0 0 4096
3 34 26 0 0 139 0 0 4096
4 0 0 0 0 140 0 0 4096
5 0 0 0 0 141 0 0 4096
6 0 0 0 0 142 0 0 4096
7 0 0 0 0 143 0 0 4096
The meaning of the debug output can be found in the following picture:
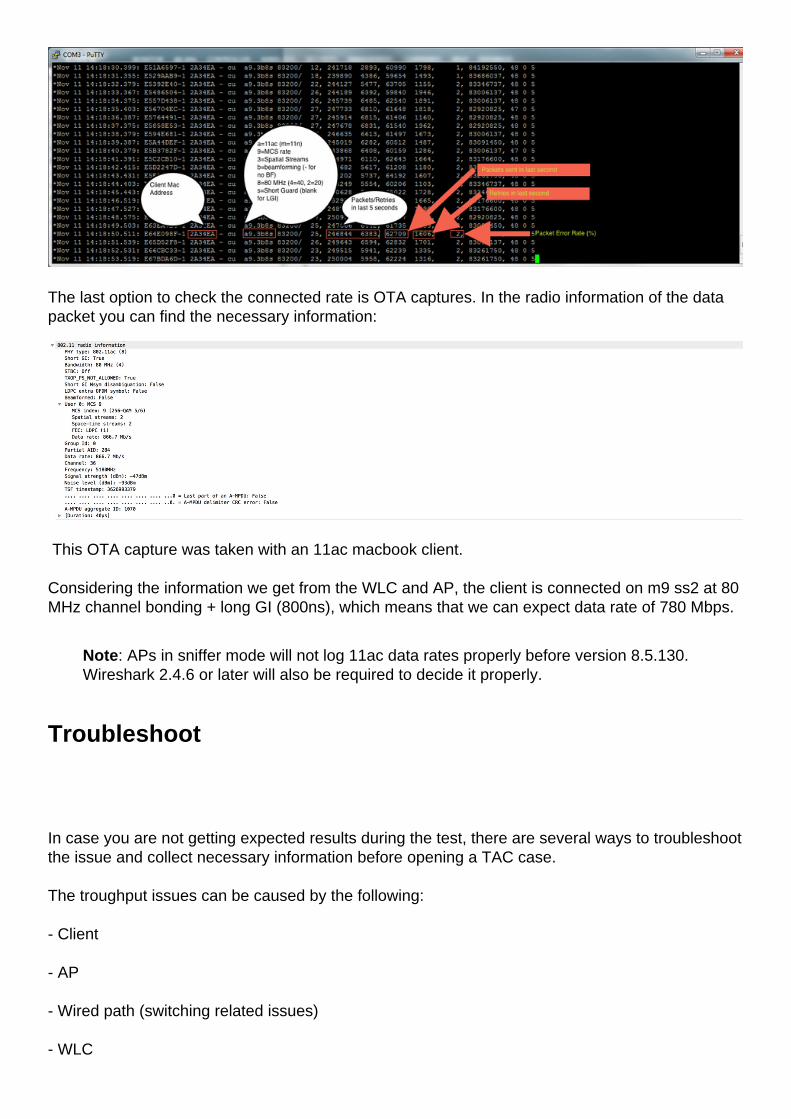
The last option to check the connected rate is OTA captures. In the radio information of the datapacket you can find the necessary information:
This OTA capture was taken with an 11ac macbook client.
Considering the information we get from the WLC and AP, the client is connected on m9 ss2 at 80MHz channel bonding + long GI (800ns), which means that we can expect data rate of 780 Mbps.
Note: APs in sniffer mode will not log 11ac data rates properly before version 8.5.130.Wireshark 2.4.6 or later will also be required to decide it properly.
Troubleshoot
In case you are not getting expected results during the test, there are several ways to troubleshootthe issue and collect necessary information before opening a TAC case.
The troughput issues can be caused by the following:
- Client
- AP
- Wired path (switching related issues)
- WLC
Client troubleshooting
First step will be updating the drivers on the wireless client devices to the latest version●
Second step will be doing the iPerf test with clients that have a different wireless adapter tosee if you get the same results
●
AP troubleshooting
There might be scenarios when the AP is dropping traffic, or certain frames or otherwisemisbehaving.
In order to get more insight about this, there are needed Over The Air (OTA) captures + spansession on the AP switchport (span should be done on the switch where the AP is connected)
The OTA captures and SPAN should be done during the test, using open SSID in order to be ableto see the traffic passed to the AP and the traffic AP is passing towards the client and vice a versa.
There are several known bugs for this behavior:
CSCvg07438 : AP3800: Low throughput due to packet drops in AP in both fragmented and non-fragmented packets
CSCva58429 : Cisco 1532i AP: low throughput (FlexConnect Local switching + EoGRE)
Wired path troubleshooting
There might be some problems on the switch itself, you need to check the amount of drops on theinterfaces and if those increase during the tests.
Try using another port on the switch to connect the AP or WLC.
Another option is to plug in a client to the same switch (where the client termination point[AP/WLC] is connected to) and put it to the same VLAN, then run the tests wired to wired on thesame VLAN to see if there are any issues in the wired path.
WLC troubleshooting
It can be that the WLC is dropping the traffic (when APs are in local mode) from the client.
You can put the AP in Flexconnect mode and the WLAN into local switching, then run the tests.
If you see that there are significant differences in the throughput in local mode (central switching)compared to Flexconnect local switching and there is no problem on the switch connected toWLC, then most probably the WLC is dropping the traffic.
To troubleshoot this follow the action plan:
- SPAN captures on the WLC switchport (should be done on the switch)
- SPAN captures on the AP port
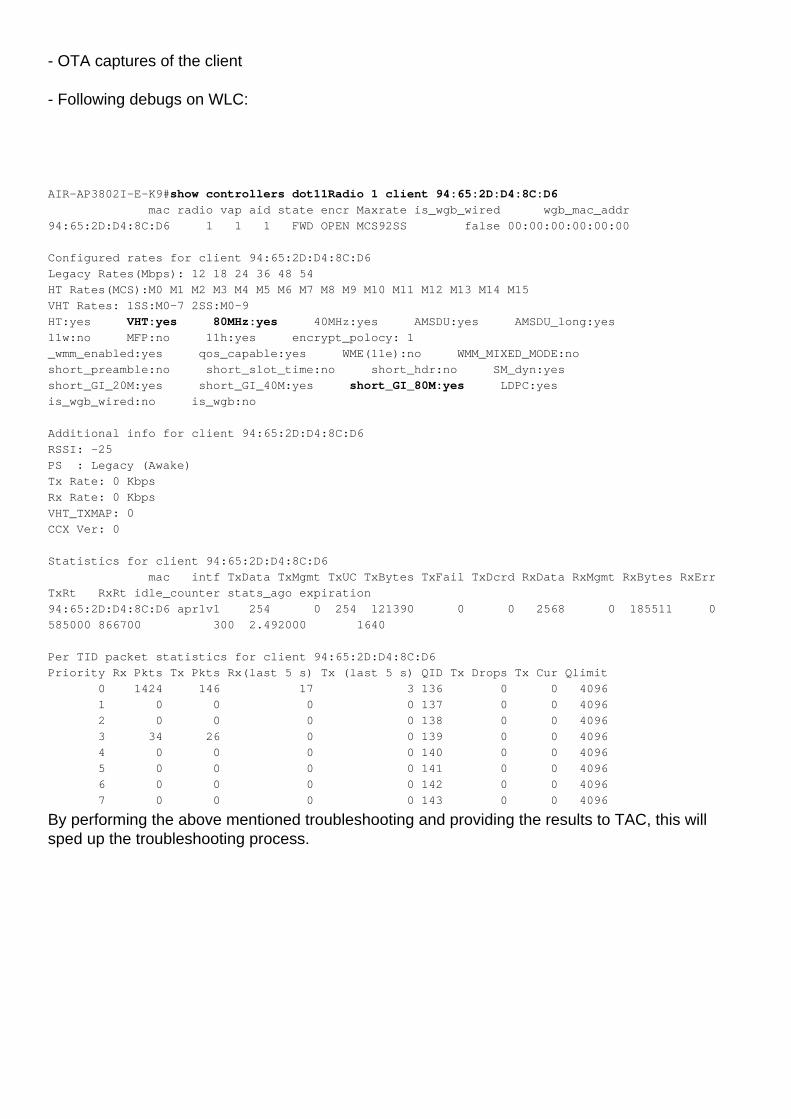
- OTA captures of the client
- Following debugs on WLC:
AIR-AP3802I-E-K9#show controllers dot11Radio 1 client 94:65:2D:D4:8C:D6
mac radio vap aid state encr Maxrate is_wgb_wired wgb_mac_addr
94:65:2D:D4:8C:D6 1 1 1 FWD OPEN MCS92SS false 00:00:00:00:00:00
Configured rates for client 94:65:2D:D4:8C:D6
Legacy Rates(Mbps): 12 18 24 36 48 54
HT Rates(MCS):M0 M1 M2 M3 M4 M5 M6 M7 M8 M9 M10 M11 M12 M13 M14 M15
VHT Rates: 1SS:M0-7 2SS:M0-9
HT:yes VHT:yes 80MHz:yes 40MHz:yes AMSDU:yes AMSDU_long:yes
11w:no MFP:no 11h:yes encrypt_polocy: 1
_wmm_enabled:yes qos_capable:yes WME(11e):no WMM_MIXED_MODE:no
short_preamble:no short_slot_time:no short_hdr:no SM_dyn:yes
short_GI_20M:yes short_GI_40M:yes short_GI_80M:yes LDPC:yes
is_wgb_wired:no is_wgb:no
Additional info for client 94:65:2D:D4:8C:D6
RSSI: -25
PS : Legacy (Awake)
Tx Rate: 0 Kbps
Rx Rate: 0 Kbps
VHT_TXMAP: 0
CCX Ver: 0
Statistics for client 94:65:2D:D4:8C:D6
mac intf TxData TxMgmt TxUC TxBytes TxFail TxDcrd RxData RxMgmt RxBytes RxErr
TxRt RxRt idle_counter stats_ago expiration
94:65:2D:D4:8C:D6 apr1v1 254 0 254 121390 0 0 2568 0 185511 0
585000 866700 300 2.492000 1640
Per TID packet statistics for client 94:65:2D:D4:8C:D6
Priority Rx Pkts Tx Pkts Rx(last 5 s) Tx (last 5 s) QID Tx Drops Tx Cur Qlimit
0 1424 146 17 3 136 0 0 4096
1 0 0 0 0 137 0 0 4096
2 0 0 0 0 138 0 0 4096
3 34 26 0 0 139 0 0 4096
4 0 0 0 0 140 0 0 4096
5 0 0 0 0 141 0 0 4096
6 0 0 0 0 142 0 0 4096
7 0 0 0 0 143 0 0 4096
By performing the above mentioned troubleshooting and providing the results to TAC, this willsped up the troubleshooting process.