8:00 a.m.sharepoint.careersourcesfl.com/sites/web/lists/south florida... · carlos 8. chi, joe 9....
TRANSCRIPT
South Florida Workforce Investment Board is an equal opportunity employer/program. Auxiliary aids and services are available upon request to individuals with disabilities. "Members of the public shall be given a reasonable opportunity to be heard on a specific agenda item, but must register with the agenda clerk prior to being heard."
SOUTH FLORIDA WORKFORCE INVESTMENT BOARD PERFORMANCE COUNCIL
Thursday, December 17, 2015 8:00 A.M.
Miami Dade College North Campus
Building #3 - Conference Center, 2nd floor 11380 NW 27th Avenue Miami, FL 33167-3495
AGENDA
1. Call to Order and Introductions
2. Approval of Workforce Systems Improvement Committee Meeting Minutes
A. June 18, 2015B. August 20, 2015C. October 15, 2015
3. Information – Refugee Employment and Training Program Performance Overview
4. Information – Refugee Employment and Training Program Balanced Scorecard Update 5. Information – Workforce Services Balanced Scorecard and Job Placements Update 6. Information – Workforce Services Regional Performance Overview 7. Information – Youth Partner’s and Regional Performance 8. Information – Consumer Report Card Update 9. Information – September and October Performance Incentives of $300 to Each of the Top Two
(2) Workforce Services Professionals in the Region

PERFORMANCE COUNCIL AGENDA ITEM NUMBER: 2A DATE: December 17, 2015, 8:00AM AGENDA ITEM SUBJECT: MEETING MINUTES June 17, 2015 at 8:00am Doubletree Miami Airport Hotel - Convention Center 11380 NW 27th Avenue Miami, FL
Agenda items are displayed in the order they were discussed. 1. Call to Order and Introductions
COMMITTEE MEMBERS IN ATTENDANCE
OTHER ATTENDEES
1. Gaber, Cynthia, Chairwoman 2. Clayton, Lovey 3. Fils-Aime, Daniel 4. Rod, Denis 5. Huston, Albert 6. Manrique, Carlos
COMMITTEE MEMBERS NOT IN ATTENDANCE
7. Arboleda, Carlos 8. Chi, Joe 9. Diggs, Bill 10. DuBois, Victoria 11. Garza, Maria 12. Jordan, Comm. Barbara 13. Regueiro, Maria
SFW STAFF Graham, Tomara Hernandez, Juan
Acedo. Maleidy – Youth Co-Op, Inc. Castillo, Alicia – Adults Mankind Organization (AMO) Codoni, Mayelin – Community Coalition Inc. Farinas, Irene – Adult Mankind Organization, Inc. Gavira, Beatriz – SER Jobs for Progress, Inc. Mitchell, Carlena – Miami- Dade County Public Schools Porro, W. – City of Miami Rodriguez, Maria – Youth Co-Op, Inc. Somellian, Ana – Adults Mankind Organization

Performance Council Meeting - Minutes June 17, 2015 Page 2
Chairwoman Maria Garza called the meeting to order at 8:17am and asked all those present introduced themselves. She thanked Vice-Chairwoman Cynthia Gaber for leading the Council meeting held in April. Dr. Rod commended Youth Co-Op, Inc. Executive Director, Maria Rodriguez for the quality services provided by staff at the career centers her entity manages. Ms. Rodriguez thanked him for his recognition. Chairwoman Garza also thanked him for his comments and encouraged all to visit the centers at their leisure to see the various services being provided by this region. Chairwoman Garza later thanked and recognized former Workforce Services Improvement Committee Chairman, Daniel Fils-Aime for his many years of leadership. Chairwoman Garza noted into record that a quorum had not been achieved.
3. Information- Refugee Employment and Training (RET) Program Performance Overview Chairwoman Garza introduced the item. Mr. Hernandez presented and read into record the following RET program contractors performance stats for the period of October 1, 2014 to May 31, 2015: A total of 5,051 refugee job seekers were assisted into employment compared to a 4,637 from the same previous Program Year (PY) period. 14,692 refugee job seekers have been enrolled in the RET program; 2,784 refugees placed in employment are still working after 90 days of hire; 2,124 refugees placed in employment are still working after 180 days of hire; and 2,171 refugees placed in employment are also receiving health benefits through their employer.
No further questions or discussions.
[Albert Huston arrived]
4. Information– Refugee Employment and Training Program Balanced Scorecard Update Mr. Hernandez presented the item and read into record the refugee employment and training program balanced scorecard summary report, which showed that five (5) of the nine (8) contractors met or exceeded the 65 percent of the PY 2014-15 performance measures. He went on to review with the Committee the RET Services Contractors Performance Summary that was attached to the item. Mr. Hernandez furthermore advised the Council that staff met with representatives of UNIDAD and a follow-up meeting is scheduled to take place sometime this week. No further questions or concerns.
5. Information– Workforce Services Balanced Scorecard and Job Placements Update Mr. Hernandez presented, read the item into record and noted that eight (8) of the 14 workforce
service locations are meeting the required 65 percent requirement. He additionally noted that Transition Offender Services was the only contractor that met or exceeded YTD maximum Job Placements Standard.
No further questions or discussions.
6. Information – Workforce Services Regional Performance Overview
Mr. Hernandez presented the item and read into record the following stats:

Performance Council Meeting - Minutes June 17, 2015 Page 3
For Program Year (PY) 2014-2015 (July 1, 2014 – April 30, 2015), the Workforce Services Contractors assisted the placement of 41,800 job seekers into employment compared to 35,117 for the same period last Program Year.
Wagner-Peyser (WP) Program: - WP Entered Employment Rate (EER) is at 51%
which resulted in this region ranking fourth place out of the 24 Regional Workforce Boards in the State.
Veterans Program: - EER is slightly over 60.9%, resulting in fifth place ranking in
this category out of the 24 Regional Workforce Boards in the State.
Career Advancement Program (CAP) / Welfare Transition (WT) Program: the Performance statistics for the Workforce Services Contractors revealed region' is at 42.6% which resulted in thirteenth place ranking out of the 24 Regional Workforce Board in the State.
CAP/WT - EER is at 37.3% ranking fourth place out of the 24 Regional Workforce Board in the State.
Mr. Hernandez advised the Council that a two-day technical assistance workshop had been held for all staff. He additionally advised that this region had the largest increase in employment compared to other regions throughout the state of Florida. Chairwoman Garza commended staff for their great work.
No further questions or discussions.
7. Information – Youth Partners & Regional Performance Update Mr. Hernandez introduced the item and read into record the following stats:
364 of 368 in-school and out-of-school younger youth participants excited the program with positive outcomes.
2,184 of 2,442 in-school and out-of-school youth attained an increase in their skill attainment performance measure.
275 of 277 in-school youth exited the program with a positive outcome 274 of 275 out-of-school youth exited the program with a positive outcome
Mr. Hernandez additionally noted into record that Adults Mankind Organization, Inc. (AMO) and
Cuban American National Council (CNC) did not meet the youth skill attainment performance measures for both in-school or out-of-school youth programs. However, they would be placed on a Performance Improvement Plan monitored by SFWIB Youth Programs staff. Furthermore, for the period of July 1, 2014 to September 30, 2014, UNIDAD of Miami Beach performance measure for in-school youth program showed zero (0) percent.
[Mr. Carlos Manrique arrived; quorum achieved] Chairwoman Garza questioned the zero (0) percent. SFWIB Youth Programs Manager, Tomara
Graham explained that the information provided consists of only one quarter, of which UNIDAD of Miami Beach did not meet any of its performances during that period.

Performance Council Meeting - Minutes June 17, 2015 Page 4
Both Mr. Huston and Mr. Clayton questioned as to why the contracted period consisted of only one quarter. Ms. Graham advised the Council that she would further research this information and provide more details to the Council at a later date.
Chairwoman Garza inquired about performance goals (standards) and Ms. Graham responded 100%.
Mr. Clayton inquired about the time period for the other youth contractors. Ms. Graham reviewed with the Council the WIA Youth Partner’s Performance report for the period of July 1, 2014 to May 31, 2014. She additionally advised that a more detailed single quarter report for each provider would be presented to the Council at a later date.
Chairwoman Garza inquired the low performances for AMO and CNC. Ms. Graham referenced the
WIA Youth Partner’s Performance report showing AMO at 83.44% for in-school and 84.38% for out-of-school; with regards to CNC, the report showing 84.23% for in-school and 80.24% for out-of-school where the required standard is 85%.
8. Information- Consumer Report Card Update
Mr. Hernandez read the item into record and reviewed with the Council the Consumer Report Card report for the period of 7/1/2014 to 6/30/2015. Mr. Manrique referenced a recent article published by the Herald related to local training provider placement rates. He’d inquired about the process for determining each provider’s placements. He asked whether if training providers are responsible to report the current rates. Mr. Hernandez responded, yes, and then explained it is the Career Center staff to validate the information being provided. Mr. Manrique asked whether the process consists of “spot checks” by career center staff. Mr. Hernandez responded that the process consists of 100% validation and then he provided further details.
2. Approval of June 19, 2014, August 21, 2014, October 30, 2014, December 18, 2014 and February 19, 2015 WSI Committee Meeting Minutes and April 30, 2015 Performance Council Meeting minutes.
Dr. Denis Rod moved the approval of June 19, 2014, August 21, 2014, October 30, 2014, December
18, 2014 and February 19, 2015 WSI Committee Meeting Minutes, as well as April 30, 2015 Performance Council Meeting Minutes. Motion Seconded by Mr. Lovey Clayton; Motion Passed Unanimously
7. Recommendation as to Approval to Renew Existing Workforce Services Contracts for Program
Year 2015-16 Chairwoman Garza introduced the item and Mr. Hernandez further presented staff’s recommendation for the Council’s approval to authorize staff to renew the existing Workforce Services contracts for Program Year (PY) 2015-16. Mr. Carlos Manrique moved the approval to renew existing workforce services contracts. Motion seconded by Mr. Albert Huston; Further Discussion(s): Mr. Manrique asked which contracts are being recommended for renewal. Mr. Hernandez responded that all are being recommended. Mr. Manrique inquired about the threshold and Mr. Hernandez responded 65%. Mr. Manrique further questioned staff’s recommendation that contracts be renewed when a few did not meet the required threshold. He later inquired about Performance Improvement Plan similar to Youth Programs Contracts for those that did not meet the threshold. Mr. Hernandez responded that the process already exist as they have met with the individual providers that scored

Performance Council - Minutes June 17, 2015 Page 5
below threshold. Mr. Hernandez additionally explained some of the low performances were due to unforeseen circumstances and he gave some examples. Mr. Manrique commented there should be consistency across the board with regards to performance enforcement. Chairwoman Garza concurred and stated especially when providers were a few points shy of achieving the required threshold for Youth Program performances. Mr. Manrique amended his original motion that this item be brought back in six months with updates. Motion Passed As Amended with Unanimous Consent
Meeting adjourned at 8:43am.

PERFORMANCE COUNCIL AGENDA ITEM NUMBER: 2B DATE: December 17, 2015, 8:00AM AGENDA ITEM SUBJECT: MEETING MINUTES August 20, 2015 at 8:00am Doubletree Miami Airport Hotel - Mart/Airport Hotel and Exhibition Center 11380 NW 27th Avenue Miami, FL
COMMITTEE MEMBERS IN ATTENDANCE
OTHER ATTENDEES
1. Garza, Maria, Chairwoman 2. Gaber, Cynthia, Vice -
Chairwoman 3. Fils-Aime, Daniel 4. Rod, Denis
COMMITTEE MEMBERS NOT IN ATTENDANCE
5. Arboleda, Carlos 6. Chi, Joe 7. Clayton, Lovey 8. Diggs, Bill 9. DuBois, Victoria 10. Huston, Albert 11. Jordan, Comm. Barbara 12. Manrique, Carlos 13. Regueiro, Maria
SFW STAFF Beasley, Rick Hernandez, Juan Gonzalez, Frances
Barroso, Lupe – Cuban National Council, Inc. Castillo, Alicia – Adults Mankind Organization (AMO) Farinas, Irene – Adult Mankind Organization, Inc. Gavira, Beatriz – SER Jobs for Progress, Inc. Jiminez, Raisa – Cuban National Council, Inc. Joseph, Vanessa – Human Community Services Kos, Claudia – Youth Co-Op, Inc.
Mitchell, Carlena – Miami- Dade County Public Schools Rodriguez, Maria – Youth Co-Op, Inc. Somellian, Ana – Adults Mankind Organization Stanley – Human Community Services Velez, Paulina - Youth Co-Op, Inc.

Performance Council Meeting - Minutes August 20, 2015 Page 2
Agenda items are displayed in the order they were discussed.
1. Call to Order and Introductions Chairwoman Maria Garza called the meeting to order at 8:29am and asked all those present introduced themselves. She noted into record that a quorum had not been achieved.
3. Information- Refugee Employment and Training (RET) Program Performance Overview Chairwoman Garza introduced the item. Mr. Hernandez presented and read into record the following RET program contractors’ performance stats for the period of October 1, 2014 to June 30, 2015: A total of 5,691 refugee job seekers were assisted into employment compared to a 5,222 from the same prior Program Year (PY). 16,725 refugee job seekers have been enrolled in the RET program; 3,258 refugees placed in employment are still working after 90 days of hire; 2,370 refugees placed in employment are still working after 180 days of hire; and 2,439 refugees placed in employment are also receiving health benefits through their employer.
No further questions or discussions.
4. Information– Refugee Employment and Training Program Balanced Scorecard Update
Chairwoman Garza introduced the item. Mr. Hernandez further presented the item and read into record the refugee employment and training program balanced scorecard summary report, which showed that five (5) of the nine (8) contractors met or exceeded the 65 percent of the PY 2014-15 performance measures. He additionally reviewed with the Council the RET Services Contractors’ Performance Summary and noted into record the following five contractors that met or exceeded performance:
Adults Mankind Organization, Inc.; Arbor E&T, LLC; Cuban National Council, Inc.; Miami Beach Latin Chamber of Commerce, Inc.; and Youth Co-Op, Inc.
Mr. Fils-Aime inquired about UNIDAD of Miami Beach, Inc. performance. Mr. Hernandez explained the entity is currently on notice due to lack of meeting the minimum performance and staff will provide an updated Plan of Corrective Action (POCA) report to the Council at a later date.
5. Information– Workforce Services Balanced Scorecard and Job Placements Update Mr. Hernandez presented, read the item into record and noted that only one (1) of the 14 workforce
service locations met the required 65 percent performance standard. Ms. Garza commented that the contractors are performing really well considering the fact this report
only reflects one month reporting period. Mr. Hernandez concurred adding this shows improvement from prior years for the same reporting period.
No further questions or discussions.
Performance Council Meeting - Minutes August 20, 2015 Page 3
6. Information – Workforce Services Regional Performance Overview
Chairwoman Garza introduced the item. Mr. Hernandez further presented and read into record the following data: For Program Year (PY) 2014-2015 (July 1, 2014 – June 30, 2015), the Workforce Services Contractors assisted the placement of 50,739 job seekers into employment compared to 43,095 for the same period last Program Year.
Wagner-Peyser (WP) Program: - WP Entered Employment Rate (EER) is at 59.5%
which resulted in 4th place ranking fourth place out of the 24 Regional Workforce Boards in the State.
Veterans Program: - EER is at 62.2%, resulting in 4th place ranking in this category out of the 24 Regional Workforce Boards in the State.
Career Advancement Program (CAP) / Welfare Transition (WT) Program: the Performance statistics for the Workforce Services Contractors revealed region' is at 42.5% which resulted in 13th place ranking out of the 24 Regional Workforce Board in the State.
CAP/WT - EER is at 37.6% ranking 4th place out of the 24 Regional Workforce Board in the State.
He additionally reviewed with the Council DEO Monthly Management Report for the period of July 1, 2014 through June 30, 2015 (Year-to-Date).
Chairwoman Garza commended this region for its current performance rankings. She went on to inquire about retention and average wages. Mr. Hernandez responded that prior program year reporting showed an average wage of close to $10.00 an hour. Mr. Fils-Aime also commended staff.
Dr. Rod inquired about region 4. He also commended this region’s overall performance ranking and shared his concerns regarding career centers that are positively impacting this region’s performances but are not being recognized in the monthly management reports. Mr. Hernandez further explained again this is a one month reporting period. Chairwoman Garza asked whether staff could provide quarterly reports to capture more results. Mr. Hernandez explained this could be possible. However, he noted staff reviews performances on a daily basis. Chairwoman Garza requested staff to continue report monthly reports.
7. Information – Youth Partners & Regional Performance Update Mr. Hernandez introduced the item and read into record the following stats:
426 of 440 in-school and out-of-school younger youth participants excited the program with positive outcomes.
2,369 of 2,668 in-school and out-of-school youth attained an increase in their skill attainment performance measure.
310 of 323 in-school youth exited the program with a positive outcome 264 of 265 out-of-school youth exited the program with a positive outcome

Performance Council Meeting - Minutes August 20, 2015 Page 4
Mr. Hernandez responded to the Council regarding a prior concern. Mr. Hernandez later responded to a prior discussion related to “Zero Data” Mr. Fils-Aime inquired
about continued services to clients and Mr. Hernandez further explained. 8. Information- Consumer Report Card Update
Mr. Hernandez presented and read the item into record. No further questions or discussions.
9. Information- Individual Training Account (ITA) Performance Report Program Year 2013-2014 Mr. Hernandez presented and read the item into record. He reviewed with the Council the Training Programs Recommended for Removal report. Executive Director Rick Beasley also briefly discussed the purpose of the report. No further questions or discussions.
10. Recommendation as to Approval of May and June Performance Incentive of $300 to Each of the Top Two (2) Workforce Services Professionals in the Region Mr. Hernandez presented the item and announced the following top two Workforce Professionals: May 2015 Top Performers 1. John Ramos from North Miami Beach Career Center 2. Nathalie Colimon from Perrine Career Center
June 2015 2015 Top Performers 1. Fabiola Caraballo from Little Havana Career Center 2. Eugenio Reyes from Hialeah Downtown Career Center
Dr. Rod congratulated all of the top performers, especially Fabiola Caraballo who he has witnessed the great services she provides at the Little Havana Career center. Chairwoman Garza also congratulated all and thanked them for going above and beyond the call of duty. She thanked staff for implementing such incentive. Deferred Item (s):
2. Approval of June 17, 2015 Performance Council Meeting Minutes
Meeting adjourned at 8:43am.

PERFORMANCE COUNCIL AGENDA ITEM NUMBER: 2C DATE: December 17, 2015, 8:00AM AGENDA ITEM SUBJECT: MEETING MINUTES October 15, 2015 at 8:00am Doubletree Miami Airport Hotel - Convention Center 11380 NW 27th Avenue Miami, FL
Agenda items are displayed in the order they were discussed.
1. Call to Order and Introductions
COMMITTEE MEMBERS IN ATTENDANCE
OTHER ATTENDEES
1. Gaber, Cynthia, Vice - Chairwoman
2. Clayton, Lovey 3. Fils-Aime, Daniel 4. Huston, Albert 5. Manrique, Carlos 6. Rod, Denis
COMMITTEE MEMBERS NOT IN ATTENDANCE
7. Arboleda, Carlos 8. Chi, Joe 9. Diggs, Bill 10. Garza, Maria, Chairwoman 11. Jordan, Comm. Barbara 12. Regueiro, Maria
SFW STAFF Hernandez, Juan
Barroso, Lupe – Cuban National Council, Inc. Castillo, Alicia – Adults Mankind Organization (AMO) Farinas, Irene – Adult Mankind Organization, Inc. Gavira, Beatriz – SER Jobs for Progress, Inc. Jiminez, Raisa – Cuban National Council, Inc. Kos, Claudia – Youth Co-Op, Inc.
Mitchell, Carlena – Miami- Dade County Public Schools Rodriguez, Maria – Youth Co-Op, Inc. Somellian, Ana – Adults Mankind Organization Stanley – Human Community Services Velez, Paulina - Youth Co-Op, Inc.
Performance Council Meeting - Minutes October 15, 2015 Page 2
Vice Chairwoman Cynthia Gaber called the meeting to order at 8:19am and asked all those present introduced themselves. She advised all that anyone requesting to speak must first complete a request to speak form and noted into record that a quorum had not been achieved.
3. Information- Refugee Employment and Training (RET) Program Performance Overview Vice-Chairwoman Gaber introduced the item. Mr. Hernandez presented and read into record the following RET program contractors’ performance stats for the period of October 1, 2014 to August 31, 2015: A total of 9,774 refugee job seekers were assisted into employment compared to a 6,439 for the same prior Program Year (PY). 21,390 refugee job seekers have been enrolled in the RET program; 4,043 refugees placed in employment are still working after 90 days of hire; 2,994 refugees placed in employment are still working after 180 days of hire; and 3,112 refugees placed in employment are also receiving health benefits through their employer.
No further questions or discussions.
4. Information– Refugee Employment and Training Program Balanced Scorecard Update
Chairwoman Gaber introduced the item. Mr. Hernandez further presented the item and read into record the refugee employment and training program balanced scorecard summary report, which showed that seven (7) of the eight (8) contractors met or exceeded the 65 percent of the PY 2014-15 performance measures. No further questions or discussions.
5. Information– Workforce Services Balanced Scorecard and Job Placements Update Mr. Hernandez presented, read the item into record and noted that only five (5) of the 14 workforce
service locations met the required 65 percent performance standard. Additionally,
Eleven (11) of the fourteen (14) Workforce Services Contractors have met or exceeded their minimum YTD Job Placements standards.
Eight (8) of the fourteen (14) Workforce Services Contractors have met or exceeded their maximum YTD Job Placements standards.
Mr. Manrique inquired about the amount of centers that did not meet performances for the above period. Mr. Hernandez explained the current report shows an increase compared to prior reporting period.
Mr. Manrique inquired about the number of performance measures per centers. Mr. Hernandez
explained that all except one are required to meet the same amount of measures.

Performance Council Meeting - Minutes October 15, 2015 Page 3
6. Information – Workforce Services Regional Performance Overview Chairwoman Garza introduced the item. Mr. Hernandez further presented and read into record the following data: For Program Year (PY) 2014-2015 (July 1, 2014 – August 31, 2015), the Workforce Services Contractors achieved the following:
8,236 job seekers were placed into jobs that exited the system compared to 7,252 for the same period last PY, a 13.6 percent increase compared to the same period last PY.
Wagner-Peyser (WP) Program: - WP Entered Employment Rate (EER) is at 71.6%
which resulted in 4th place ranking fourth place out of the 24 Regional Workforce Boards in the State.
Veterans Program: - EER is at 68%, resulting in 3rd place ranking in this category out of the 24 Regional Workforce Boards in the State.
Career Advancement Program (CAP) / Welfare Transition (WT) Program: the
Performance statistics for the Workforce Services Contractors revealed region' is at 41.8% which resulted in 10th place ranking out of the 24 Regional Workforce Board in the State.
CAP/WT - EER is at 36.6% ranking 9th place out of the 24 Regional Workforce Board in the State.
He additionally reviewed with the Council DEO’s Monthly Management Report for the period of July 1, 2014 through June 30, 2015 (Year-to-Date).
Mr. Fils-Aime inquired about performance measures and ranking processes due to the fact some regions are larger than others. Mr. Hernandez further explained that regions are not being ranked by the sizes.
7. Information – Youth Partners & Regional Performance Update Vice –Chairwoman Cynthia Gaber introduced the item. Mr. Hernandez further discussed and read into record the following draft information:
159 of 191 in-school and out-of-school younger youth participants exited the program with positive outcomes.
361 of 391 in-school and out-of-school youth attained an increase in their skill attainment performance measure.
84 of 863 in-school youth exited the program with a positive outcome 75 of 105 out-of-school youth exited the program with a positive outcome
Mr. Huston asked whether the above data includes those that attended the Aviation Program. Mr.
Hernandez responded staff will further research and provided details at a later date. No further questions or discussions. 8. Information- Consumer Report Card Update

Performance Council Meeting - Minutes October 15, 2015 Page 4
Vice Chairwoman Cynthia Gaber introduced the item. Mr. Hernandez further discussed and read the item into record. No further questions or discussions.
9. Information- July and August Performance Incentives of $300 to Each of the Top Two (2) Workforce Services Professionals in the Region
Mr. Hernandez presented the item and announced the following top two Workforce Professionals: July 2015 Top Performers 1. Rosario Del Puerto from North Miami Beach Career Center 2. Fabiola Caraballo from Little Havana Career Center
August 2015 2015 Top Performers 1. Fabiola Caraballo from Little Havana Career Center 2. Rosario Del Puerto from North Miami Beach Career Center
Dr. Rod once again commended Fabiola Caraballo for the great services she provides. He additionally commended the agency. He briefly shared that this is what drew him to be a member of the Board. Both he and Mr. Fils-Aime suggested recognizing top performing centers as well. Mr. Clayton recommended board members receive a list of all the centers and center director’s names. Mr. Hernandez responded that the list is available on CareerSource South Florida’s website. Mr. Clayton requested the list be provided to the members by staff. Dr. Rod recommended board members be invited to award presentations held at the individual centers. Mr. Huston requested coffee be provided to members of the Board at every meeting.
Request to Speak (Public Hearing):
Youth Co-Op, Inc. Executive Director Maria Rodriguez requested to speak regarding her concerns of the current balance Scorecard report. Mr. Hernandez explained the scorecard is currently in draft due to some discrepancies. However, Ms. Rodriguez stated that draft report should not have been published. Mr. Huston shared his concern regarding inaccuracies of the scorecard and recommended staff meet with the centers to correct the discrepancies. Mr. Clayton shared his comment as well. Mr. Hernandez explained Deferred Item (s):
2. Approval of August 20, 2015 Performance Council Meeting Minutes
There being no further business to come before the Council, the meeting adjourned at 8:43am.
SFWIB PERFORMANCE COUNCIL DATE: 12/17/2015 AGENDA ITEM NUMBER: 3 AGENDA ITEM SUBJECT: REFUGEE EMPLOYMENT AND TRAINING PROGRAM PERFORMANCE OVERVIEW AGENDA ITEM TYPE: INFORMATIONAL RECOMMENDATION: N/A STRATEGIC GOAL: STRONG, TIMELY REPORTING STANDARDS STRATEGIC PROJECT: Set Standards on Performance Measures Reporting BACKGROUND: For Program Year (PY) 2015-16, the Refugee Employment and Training (RET) Program Contractors, from October 1, 2015 through November 30, 2015 assisted in placing into employment a total of 923 refugee job seekers compared to 738 for the same period last program year; which is a 25 percent increase. For the RET Program, the Year-to-Date (YTD) performance statistics reveal the following: 16,823 refugee job seekers enrolled in the RET Program; 536 refugees are still working after 90 days of hire; 529 refugees are still working after 180 days of hire; and 418 refugees are receiving health benefits through the employer. Overall, the statistics above show the region’s improvement compared to the same period last PY. The region’s RET Program Contractors and SFWIB staff continue to work diligently through the efforts of the Performance Improvement Team (PIT) to enhance the quality of services offered to refugee job seekers and improve the overall performance. FUNDING: N/A PERFORMANCE: N/A NO ATTACHMENT
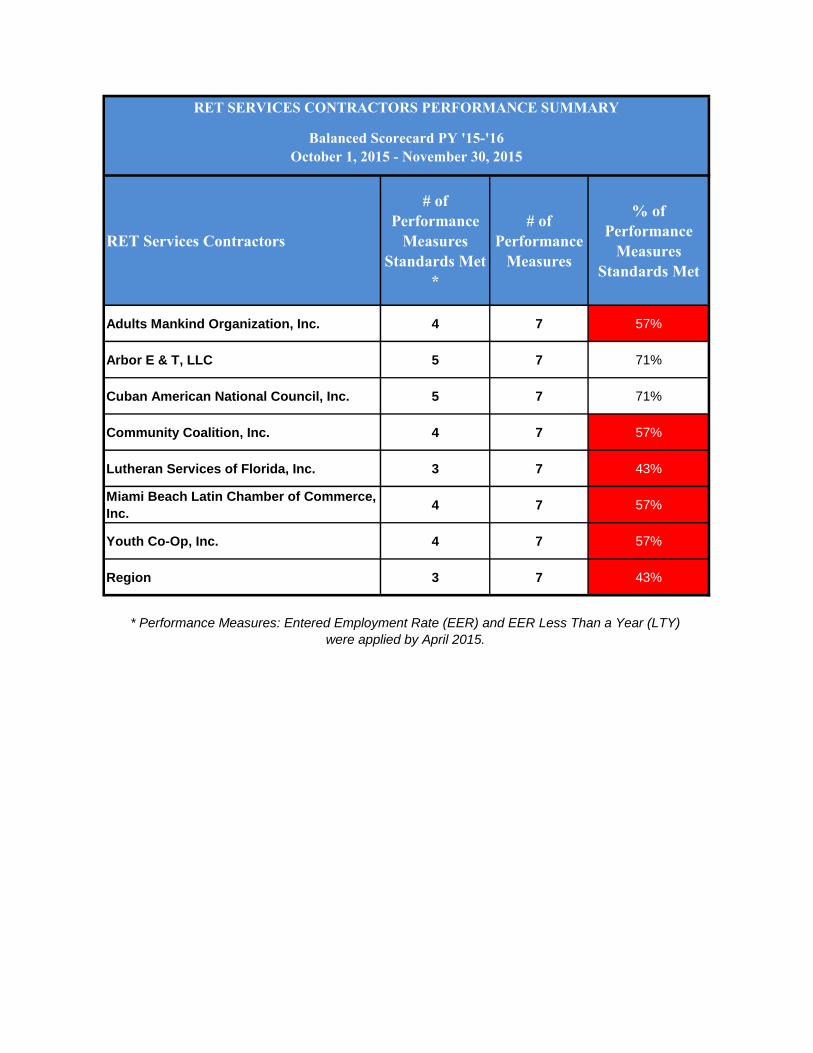
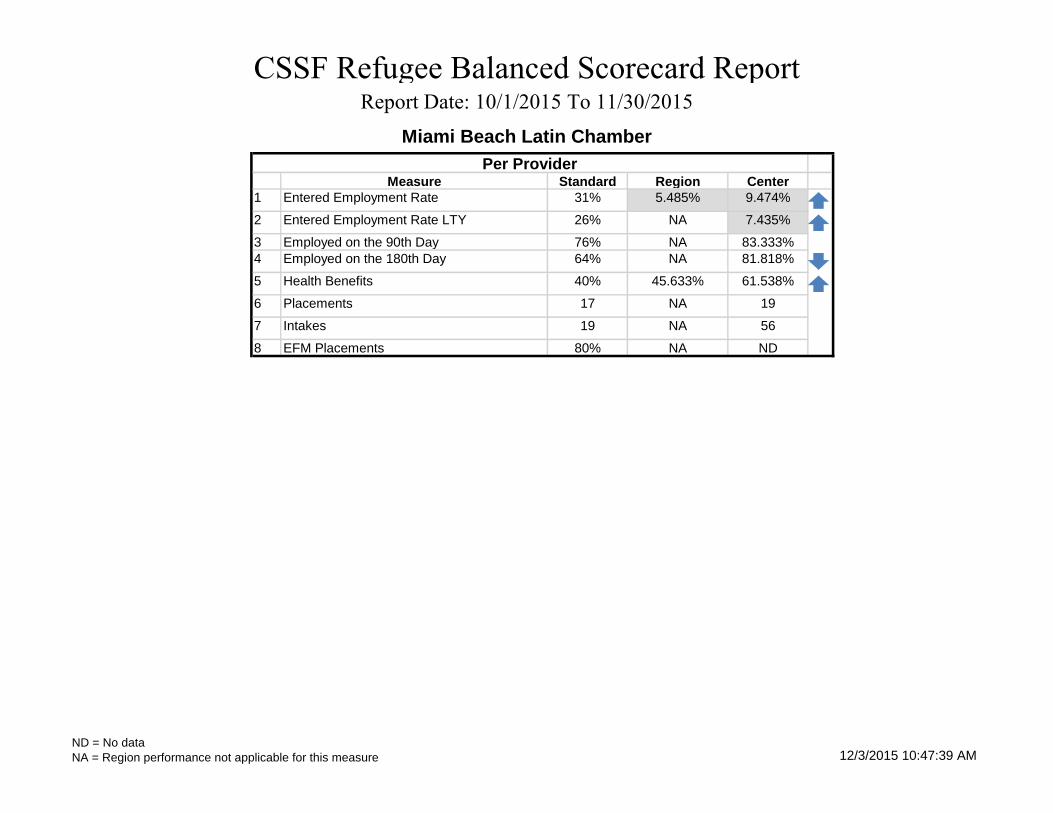
SFWIB PERFORMANCE COUNCIL DATE: 12/17/2015 AGENDA ITEM NUMBER: 4 AGENDA ITEM SUBJECT: REFUGEE EMPLOYMENT AND TRAINING PROGRAM BALANCED SCORECARD UPDATE AGENDA ITEM TYPE: INFORMATIONAL RECOMMENDATION: N/A STRATEGIC GOAL: STRONG, TIMELY REPORTING STANDARDS STRATEGIC PROJECT: Set Standards on Performance Measures Reporting BACKGROUND: The Refugee Employment and Training (RET) Balanced Scorecard measures the performance of RET Service Contractors and is attached for the Program Year 2015-16 from October 1, 2015 through November 30, 2015. The RET Services Contractors Performance Summary for the same period is attached. The summary shows that two (2) of seven (7) Contractors are meeting or exceeding 65 percent of the PY 2015-16 performance measures. FUNDING: N/A PERFORMANCE: N/A ATTACHMENT
RET Services Contractors
# of Performance
Measures Standards Met
*
# of Performance
Measures
% of Performance
Measures Standards Met
Adults Mankind Organization, Inc. 4 7 57%
Arbor E & T, LLC 5 7 71%
Cuban American National Council, Inc. 5 7 71%
Community Coalition, Inc. 4 7 57%
Lutheran Services of Florida, Inc. 3 7 43%
Miami Beach Latin Chamber of Commerce,
Inc.4 7 57%
Youth Co-Op, Inc. 4 7 57%
Region 3 7 43%
RET SERVICES CONTRACTORS PERFORMANCE SUMMARY
* Performance Measures: Entered Employment Rate (EER) and EER Less Than a Year (LTY)
were applied by April 2015.
Balanced Scorecard PY '15-'16October 1, 2015 - November 30, 2015

Measure Standard Region
1 Entered Employment Rate 31% 5.485%
2 Entered Employment Rate LTY 26% 4.597%
3 Employed on the 90th Day 74% 52.477%
4 Employed on the 180th Day 62% 64.932%
5 Health Benefits 40% 45.633%
6 Placements (M) 530 514
7 Intakes (M) 607 952
8 EFM Placements 80% 58.333%
CSSF Refugee Balanced Scorecard ReportReport Date: 10/1/2015 To 11/30/2015
Regional
Regional
ND = No data
NA = Region performance not applicable for this measure 12/3/2015 10:47:39 AM
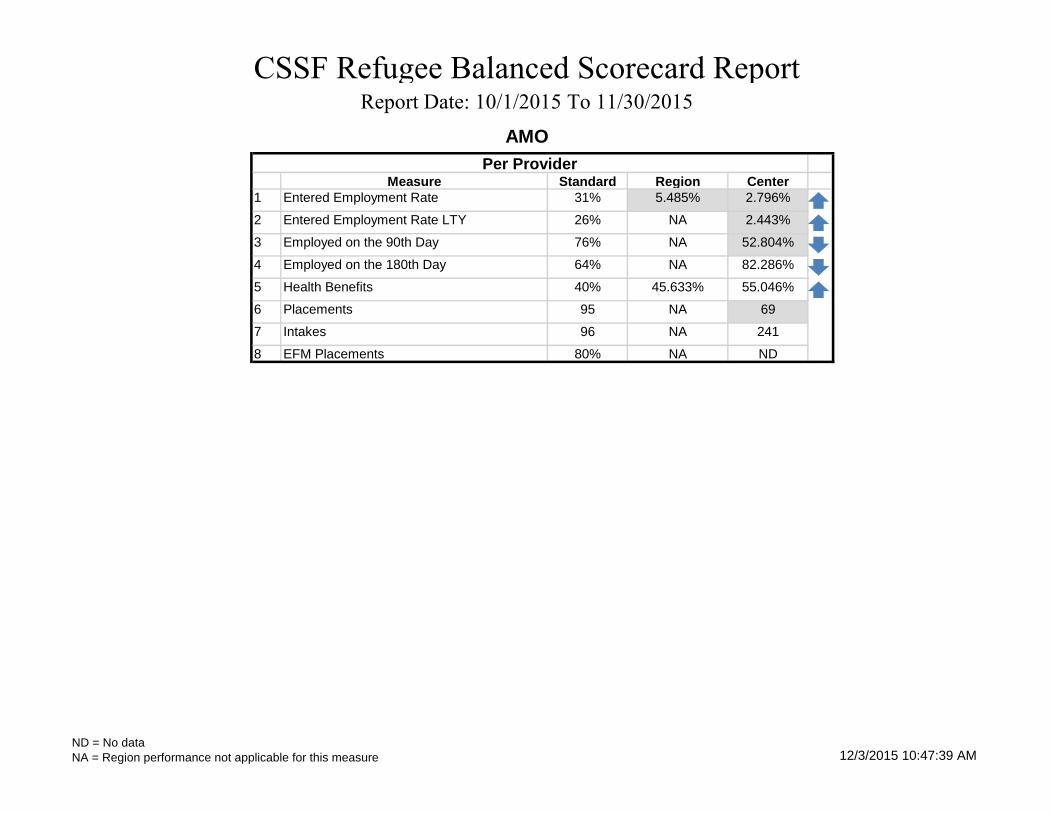
Measure Standard Region Center
1 Entered Employment Rate 31% 5.485% 2.796%
2 Entered Employment Rate LTY 26% NA 2.443%
3 Employed on the 90th Day 76% NA 52.804%
4 Employed on the 180th Day 64% NA 82.286%
5 Health Benefits 40% 45.633% 55.046%
6 Placements 95 NA 69
7 Intakes 96 NA 241
8 EFM Placements 80% NA ND
CSSF Refugee Balanced Scorecard ReportReport Date: 10/1/2015 To 11/30/2015
AMO
Per Provider
ND = No data
NA = Region performance not applicable for this measure 12/3/2015 10:47:39 AM

Measure Standard Region Center
1 Entered Employment Rate 31% 5.485% 14.183%
2 Entered Employment Rate LTY 26% NA 13.291%
3 Employed on the 90th Day 76% NA 72.289%
4 Employed on the 180th Day 64% NA 78.261%
5 Health Benefits 40% 45.633% 41.88%
6 Placements 47 NA 70
7 Intakes 34 NA 107
8 EFM Placements 80% NA 58.333%
CSSF Refugee Balanced Scorecard ReportReport Date: 10/1/2015 To 11/30/2015
Arbor E&T, LLC
Per Provider
ND = No data
NA = Region performance not applicable for this measure 12/3/2015 10:47:39 AM

Measure Standard Region Center
1 Entered Employment Rate 31% 5.485% 7.257%
2 Entered Employment Rate LTY 26% NA 6.398%
3 Employed on the 90th Day 76% NA 74.286%
4 Employed on the 180th Day 64% NA 82.143%
5 Health Benefits 40% 45.633% 41.964%
6 Placements 46 NA 81
7 Intakes 60 NA 155
8 EFM Placements 80% NA ND
CSSF Refugee Balanced Scorecard ReportReport Date: 10/1/2015 To 11/30/2015
CANC
Per Provider
ND = No data
NA = Region performance not applicable for this measure 12/3/2015 10:47:39 AM

Measure Standard Region Center
1 Entered Employment Rate 31% 5.485% 2.084%
2 Entered Employment Rate LTY 26% NA 1.214%
3 Employed on the 90th Day 76% NA 31.507%
4 Employed on the 180th Day 64% NA 44.262%
5 Health Benefits 40% 45.633% 56.14%
6 Placements 41 NA 52
7 Intakes 28 NA 53
8 EFM Placements 80% NA ND
CSSF Refugee Balanced Scorecard ReportReport Date: 10/1/2015 To 11/30/2015
Community Coalition
Per Provider
ND = No data
NA = Region performance not applicable for this measure 12/3/2015 10:47:39 AM
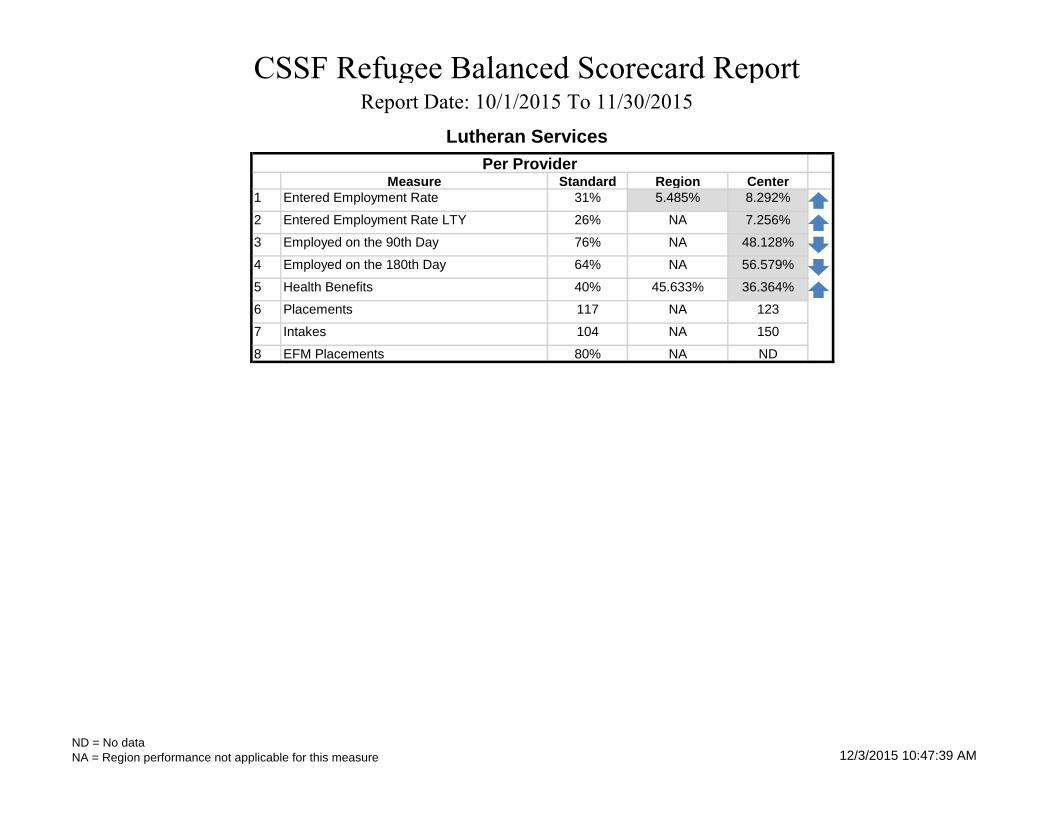
Measure Standard Region Center
1 Entered Employment Rate 31% 5.485% 8.292%
2 Entered Employment Rate LTY 26% NA 7.256%
3 Employed on the 90th Day 76% NA 48.128%
4 Employed on the 180th Day 64% NA 56.579%
5 Health Benefits 40% 45.633% 36.364%
6 Placements 117 NA 123
7 Intakes 104 NA 150
8 EFM Placements 80% NA ND
CSSF Refugee Balanced Scorecard ReportReport Date: 10/1/2015 To 11/30/2015
Lutheran Services
Per Provider
ND = No data
NA = Region performance not applicable for this measure 12/3/2015 10:47:39 AM
Measure Standard Region Center
1 Entered Employment Rate 31% 5.485% 9.474%
2 Entered Employment Rate LTY 26% NA 7.435%
3 Employed on the 90th Day 76% NA 83.333%
4 Employed on the 180th Day 64% NA 81.818%
5 Health Benefits 40% 45.633% 61.538%
6 Placements 17 NA 19
7 Intakes 19 NA 56
8 EFM Placements 80% NA ND
CSSF Refugee Balanced Scorecard ReportReport Date: 10/1/2015 To 11/30/2015
Miami Beach Latin Chamber
Per Provider
ND = No data
NA = Region performance not applicable for this measure 12/3/2015 10:47:39 AM

Measure Standard Region Center
1 Entered Employment Rate 31% 5.485% 5.808%
2 Entered Employment Rate LTY 26% NA 4.748%
3 Employed on the 90th Day 76% NA 48.256%
4 Employed on the 180th Day 64% NA 58.824%
5 Health Benefits 40% 45.633% 48.252%
6 Placements 167 NA 100
7 Intakes 157 NA 190
8 EFM Placements 80% NA ND
CSSF Refugee Balanced Scorecard ReportReport Date: 10/1/2015 To 11/30/2015
Youth Co-Op
Per Provider
ND = No data
NA = Region performance not applicable for this measure 12/3/2015 10:47:39 AM

SFWIB PERFORMANCE COUNCIL DATE: 12/17/2015 AGENDA ITEM NUMBER: 5 AGENDA ITEM SUBJECT: WORKFORCE SERVICES BALANCED SCORECARD AND JOB PLACEMENTS UPDATE AGENDA ITEM TYPE: INFORMATIONAL RECOMMENDATION: N/A STRATEGIC GOAL: PREMIER NATIONAL PROVIDER OF EMPLOYMENT STRATEGIC PROJECT: Set Standards on Performance Measures Reporting BACKGROUND: The region’s Balanced Scorecard measures the performance of Service Partners and is attached for the period of October 1, 2015 through November 30, 2015. A performance summary of the Workforce Services Contractors for the same period is attached. The PY 2015-16 Balanced Scorecard summary indicates that ten (10) of the fourteen (14) Workforce Services locations are meeting the required 65 percent of the measures. The region’s Balanced Scorecard Job Placements Year-to-Date (YTD) summary report attached for the period of July 1, 2015 through November 30, 2015 shows that the Region had a total of 26,917 Job Placements, which is 117.8 percent of the minimum standard and 100.1 percent of the maximum standard. Twelve (12) of the fourteen (14) Workforce Services contracts have met or exceeded their minimum YTD Job
Placements standard Six (6) of the fourteen (14) Workforce Services contracts have met or exceeded their maximum YTD Job
Placements standard FUNDING: N/A PERFORMANCE: N/A ATTACHMENT

Workforce Services
Contractors
Workforce Services Locations
# of Performance
Measures Standards Met
# of Performance
Measures
% of Performance
Measures Standards Met
Hialeah Downtown Career
Center10 18 55.6%
Carol City Career Center 12 18 66.7%
Miami Beach Career
Center13 18 72.2%
Opa-Locka Career Center 11 18 61.1%
City of MiamiCity of Miami Career
Center13 18 72.2%
Ser Jobs for
Progress, Inc.
North Miami Beach Career
Center13 18 72.2%
Transition, Inc. Transition **
Offender Service Center 7 16 43.8%
Florida Keys
Career Center11 18 61.1%
Homestead Career Center 13 18 72.2%
Little Havana Career
Center13 18 72.2%
Northside Career Center 13 18 72.2%
Perrine Career Center 15 18 83.3%
South Miami Career
Center13 18 72.2%
West Dade Career Center 12 18 66.7%
Region All 14 18 77.8%
* Draft** Transition Inc. doesn't have 2 CAP and 1 SNAP for a total of 16 performance measures.Carol City, Opa-Locka, and Miami Beach - New Contractor as of August 2015
WORKFORCE SERVICES CONTRACTORS PERFORMANCE SUMMARYBalanced Scorecard PY '15-'16 (July 1, 2015 through September 30, 2015) *
A Contractor must meet or exceed 65% of the Balanced Scorecard Performance Measures
Arbor E & T, LLC
Youth Co-Op, Inc.
ND = No Data
Copyright © 2012 South Florida Workforce Investment Board - All Rights Reserved. Last Run Date: 12/2/2015 8:22:09 AM

Measure Standard Region Center
1 Level of Services for Special Groups 6.871% 100.00% 8.712%
2 Training Completion Rate 70% 97.561% 80.00%
3 Training Completion Placement Rate 70% 80.00% 75.00%
4 Training Related Placements 70% 87.50% 100.00%
5 Job Openings Index 346 10,864 850
6 WP Entered Employment Rate 55% 68.885% 80.293%
7 WIA Adult & Dislocated Worker EER 93% 99.873% 100.00%
8 CAP Entered Employment Rate 38% 40.531% 36.019%
9 CAP Participation Rate 55% 43.485% 34.211%
10 Short-Term Veterans EER 51% 60.354% 70.968%
11 SNAP EER 30% 23.958% 8.333%
12 Number of Training Enrollments 70 682 49
13 Employment (Obtained and Direct) 2,325 26,917 2,255
14 Employment Average Wage $13.87 $10.26 $10.94
15 Employers Served 695 10,247 1,030
16 Employer Services (Level 1) 338 6,256 688
17 Cost Per Placement $595.31 $344.45 $262.88
18 Net Economic Benefit $27,494.27 $21,002.00 $22,497.31
19 Return on the Investment $46.94 $61.05 $85.58
Number of Performance Measures Met 12
Number of Performance Measures 18
Percent of Performance Measures Met 66.7%
CSSF Balanced Scorecard Report
Report Date: 7/1/2015 To 11/30/2015
Arbor E&T, LLC
Carol City center
Performance
Economic Impact
ND = No Data
Copyright © 2012 South Florida Workforce Investment Board - All Rights Reserved. Last Run Date: 12/2/2015 8:22:09 AM

Measure Standard Region Center
1 Level of Services for Special Groups 6.39% 100.00% 6.60%
2 Training Completion Rate 70% 97.561% ND
3 Training Completion Placement Rate 70% 80.00% ND
4 Training Related Placements 70% 87.50% ND
5 Job Openings Index 366 10,864 1,915
6 WP Entered Employment Rate 55% 68.885% 58.912%
7 WIA Adult & Dislocated Worker EER 93% 99.873% 100.00%
8 CAP Entered Employment Rate 38% 40.531% 39.007%
9 CAP Participation Rate 55% 43.485% 53.652%
10 Short-Term Veterans EER 51% 60.354% 76.923%
11 SNAP EER 30% 23.958% ND
12 Number of Training Enrollments 70 682 47
13 Employment (Obtained and Direct) 2,165 26,917 2,073
14 Employment Average Wage $13.87 $10.26 $10.13
15 Employers Served 737 10,247 860
16 Employer Services (Level 1) 358 6,256 605
17 Cost Per Placement $606.47 $344.45 $282.49
18 Net Economic Benefit $27,493.47 $21,002.00 $20,787.91
19 Return on the Investment $46.87 $61.05 $73.59
Number of Performance Measures Met 10
Number of Performance Measures 18
Percent of Performance Measures Met 55.6%
CSSF Balanced Scorecard Report
Report Date: 7/1/2015 To 11/30/2015
Arbor E&T, LLC
Hialeah Downtown center
Performance
Economic Impact
ND = No Data
Copyright © 2012 South Florida Workforce Investment Board - All Rights Reserved. Last Run Date: 12/2/2015 8:22:09 AM

Measure Standard Region Center
1 Level of Services for Special Groups 3.346% 100.00% 7.92%
2 Training Completion Rate 70% 97.561% 100.00%
3 Training Completion Placement Rate 70% 80.00% 75.00%
4 Training Related Placements 70% 87.50% 0.00%
5 Job Openings Index 241 10,864 578
6 WP Entered Employment Rate 55% 68.885% 81.019%
7 WIA Adult & Dislocated Worker EER 93% 99.873% 100.00%
8 CAP Entered Employment Rate 38% 40.531% 40.385%
9 CAP Participation Rate 55% 43.485% 27.368%
10 Short-Term Veterans EER 51% 60.354% 51.724%
11 SNAP EER 30% 23.958% ND
12 Number of Training Enrollments 40 682 8
13 Employment (Obtained and Direct) 560 26,917 846
14 Employment Average Wage $13.87 $10.26 $12.23
15 Employers Served 485 10,247 574
16 Employer Services (Level 1) 235 6,256 434
17 Cost Per Placement $613.34 $344.45 $337.52
18 Net Economic Benefit $27,486.82 $21,002.00 $25,104.00
19 Return on the Investment $46.34 $61.05 $74.38
Number of Performance Measures Met 13
Number of Performance Measures 18
Percent of Performance Measures Met 72.2%
CSSF Balanced Scorecard Report
Report Date: 7/1/2015 To 11/30/2015
Arbor E&T, LLC
Miami Beach center
Performance
Economic Impact
ND = No Data
Copyright © 2012 South Florida Workforce Investment Board - All Rights Reserved. Last Run Date: 12/2/2015 8:22:09 AM

Measure Standard Region Center
1 Level of Services for Special Groups 2.688% 100.00% 2.572%
2 Training Completion Rate 70% 97.561% 100.00%
3 Training Completion Placement Rate 70% 80.00% 0.00%
4 Training Related Placements 70% 87.50% 0.00%
5 Job Openings Index 189 10,864 338
6 WP Entered Employment Rate 55% 68.885% 58.454%
7 WIA Adult & Dislocated Worker EER 93% 99.873% 100.00%
8 CAP Entered Employment Rate 38% 40.531% 42.857%
9 CAP Participation Rate 55% 43.485% 14.286%
10 Short-Term Veterans EER 51% 60.354% 24.242%
11 SNAP EER 30% 23.958% 66.667%
12 Number of Training Enrollments 25 682 10
13 Employment (Obtained and Direct) 395 26,917 439
14 Employment Average Wage $13.87 $10.26 $10.03
15 Employers Served 380 10,247 526
16 Employer Services (Level 1) 185 6,256 488
17 Cost Per Placement $597.00 $344.45 $402.25
18 Net Economic Benefit $27,493.27 $21,002.00 $20,454.74
19 Return on the Investment $46.86 $61.05 $50.85
Number of Performance Measures Met 11
Number of Performance Measures 18
Percent of Performance Measures Met 61.1%
CSSF Balanced Scorecard Report
Report Date: 7/1/2015 To 11/30/2015
Arbor E&T, LLC
Opa Locka center
Performance
Economic Impact
ND = No Data
Copyright © 2012 South Florida Workforce Investment Board - All Rights Reserved. Last Run Date: 12/2/2015 8:22:09 AM

Measure Standard Region Center
1 Level of Services for Special Groups 7.343% 100.00% 7.886%
2 Training Completion Rate 70% 97.561% 100.00%
3 Training Completion Placement Rate 70% 80.00% 100.00%
4 Training Related Placements 70% 87.50% 100.00%
5 Job Openings Index 289 10,864 417
6 WP Entered Employment Rate 55% 68.885% 74.183%
7 WIA Adult & Dislocated Worker EER 93% 99.873% 100.00%
8 CAP Entered Employment Rate 38% 40.531% 40.526%
9 CAP Participation Rate 55% 43.485% 28.977%
10 Short-Term Veterans EER 51% 60.354% 72.727%
11 SNAP EER 30% 23.958% 23.188%
12 Number of Training Enrollments 85 682 190
13 Employment (Obtained and Direct) 2,485 26,917 1,756
14 Employment Average Wage $13.87 $10.26 $10.49
15 Employers Served 580 10,247 888
16 Employer Services (Level 1) 282 6,256 747
17 Cost Per Placement $611.85 $344.45 $490.60
18 Net Economic Benefit $27,498.01 $21,002.00 $21,335.26
19 Return on the Investment $47.25 $61.05 $43.49
Number of Performance Measures Met 13
Number of Performance Measures 18
Percent of Performance Measures Met 72.2%
CSSF Balanced Scorecard Report
Report Date: 7/1/2015 To 11/30/2015
City of Miami
City of Miami center
Performance
Economic Impact
ND = No Data
Copyright © 2012 South Florida Workforce Investment Board - All Rights Reserved. Last Run Date: 12/2/2015 8:22:09 AM

Measure Standard Region Center
1 Level of Services for Special Groups 8.241% 100.00% 8.754%
2 Training Completion Rate 70% 97.561% 100.00%
3 Training Completion Placement Rate 70% 80.00% 100.00%
4 Training Related Placements 70% 87.50% 100.00%
5 Job Openings Index 422 10,864 934
6 WP Entered Employment Rate 55% 68.885% 87.406%
7 WIA Adult & Dislocated Worker EER 93% 99.873% 100.00%
8 CAP Entered Employment Rate 38% 40.531% 22.807%
9 CAP Participation Rate 55% 43.485% 43.765%
10 Short-Term Veterans EER 51% 60.354% 80.328%
11 SNAP EER 30% 23.958% ND
12 Number of Training Enrollments 85 682 33
13 Employment (Obtained and Direct) 2,790 26,917 3,922
14 Employment Average Wage $13.87 $10.26 $12.01
15 Employers Served 848 10,247 1,073
16 Employer Services (Level 1) 412 6,256 711
17 Cost Per Placement $597.25 $344.45 $247.83
18 Net Economic Benefit $27,496.00 $21,002.00 $24,724.03
19 Return on the Investment $47.08 $61.05 $99.76
Number of Performance Measures Met 13
Number of Performance Measures 18
Percent of Performance Measures Met 72.2%
CSSF Balanced Scorecard Report
Report Date: 7/1/2015 To 11/30/2015
SER-Jobs For Progress, Inc.
North Miami Beach center
Performance
Economic Impact
ND = No Data
Copyright © 2012 South Florida Workforce Investment Board - All Rights Reserved. Last Run Date: 12/2/2015 8:22:09 AM
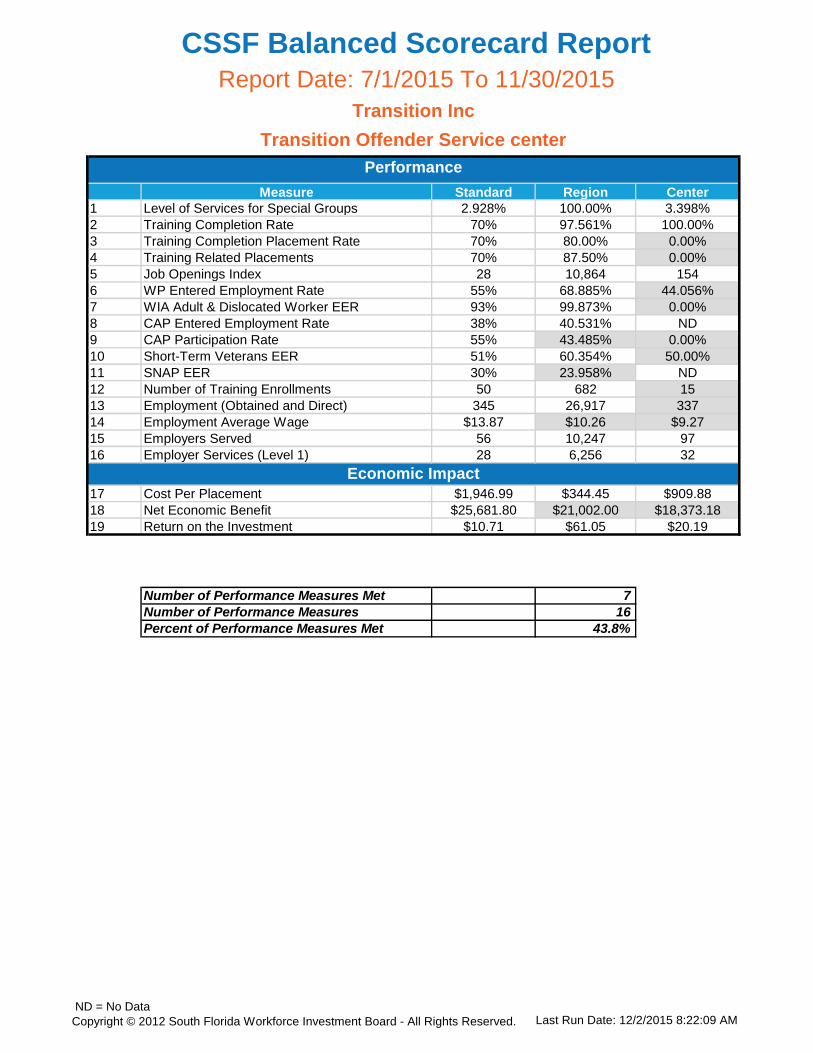
Measure Standard Region Center
1 Level of Services for Special Groups 2.928% 100.00% 3.398%
2 Training Completion Rate 70% 97.561% 100.00%
3 Training Completion Placement Rate 70% 80.00% 0.00%
4 Training Related Placements 70% 87.50% 0.00%
5 Job Openings Index 28 10,864 154
6 WP Entered Employment Rate 55% 68.885% 44.056%
7 WIA Adult & Dislocated Worker EER 93% 99.873% 0.00%
8 CAP Entered Employment Rate 38% 40.531% ND
9 CAP Participation Rate 55% 43.485% 0.00%
10 Short-Term Veterans EER 51% 60.354% 50.00%
11 SNAP EER 30% 23.958% ND
12 Number of Training Enrollments 50 682 15
13 Employment (Obtained and Direct) 345 26,917 337
14 Employment Average Wage $13.87 $10.26 $9.27
15 Employers Served 56 10,247 97
16 Employer Services (Level 1) 28 6,256 32
17 Cost Per Placement $1,946.99 $344.45 $909.88
18 Net Economic Benefit $25,681.80 $21,002.00 $18,373.18
19 Return on the Investment $10.71 $61.05 $20.19
Number of Performance Measures Met 7
Number of Performance Measures 16
Percent of Performance Measures Met 43.8%
CSSF Balanced Scorecard Report
Report Date: 7/1/2015 To 11/30/2015
Transition Inc
Transition Offender Service center
Performance
Economic Impact
ND = No Data
Copyright © 2012 South Florida Workforce Investment Board - All Rights Reserved. Last Run Date: 12/2/2015 8:22:09 AM
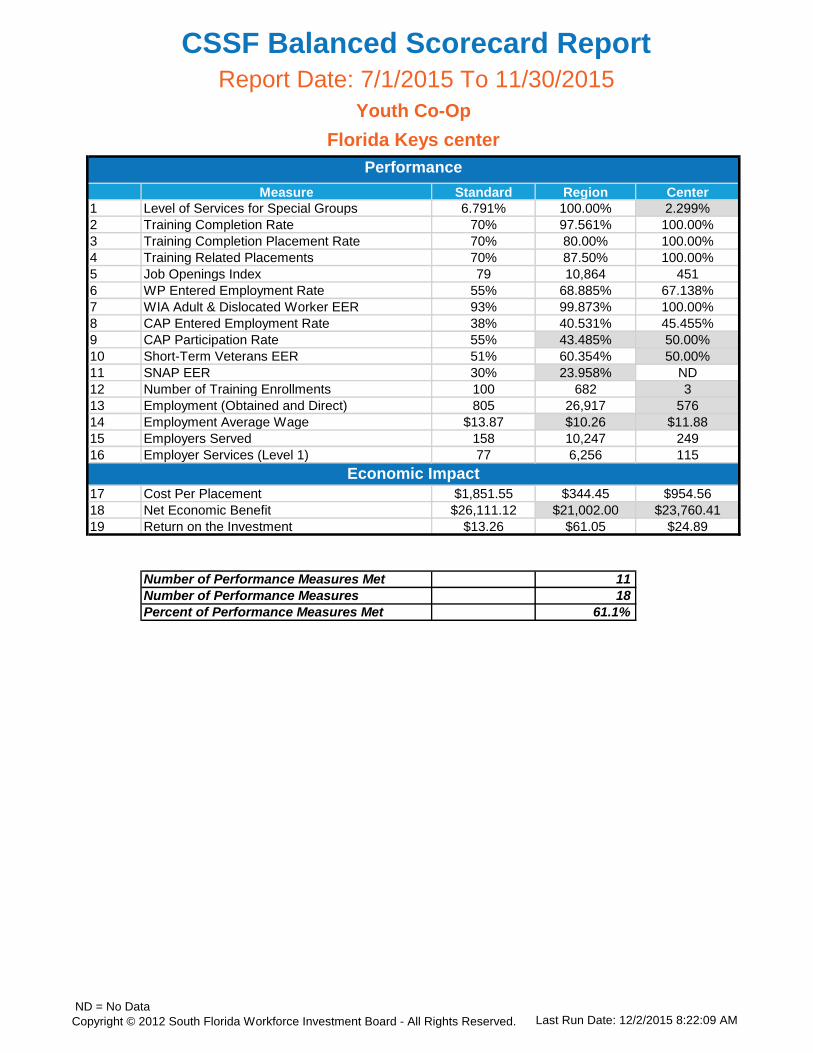
Measure Standard Region Center
1 Level of Services for Special Groups 6.791% 100.00% 2.299%
2 Training Completion Rate 70% 97.561% 100.00%
3 Training Completion Placement Rate 70% 80.00% 100.00%
4 Training Related Placements 70% 87.50% 100.00%
5 Job Openings Index 79 10,864 451
6 WP Entered Employment Rate 55% 68.885% 67.138%
7 WIA Adult & Dislocated Worker EER 93% 99.873% 100.00%
8 CAP Entered Employment Rate 38% 40.531% 45.455%
9 CAP Participation Rate 55% 43.485% 50.00%
10 Short-Term Veterans EER 51% 60.354% 50.00%
11 SNAP EER 30% 23.958% ND
12 Number of Training Enrollments 100 682 3
13 Employment (Obtained and Direct) 805 26,917 576
14 Employment Average Wage $13.87 $10.26 $11.88
15 Employers Served 158 10,247 249
16 Employer Services (Level 1) 77 6,256 115
17 Cost Per Placement $1,851.55 $344.45 $954.56
18 Net Economic Benefit $26,111.12 $21,002.00 $23,760.41
19 Return on the Investment $13.26 $61.05 $24.89
Number of Performance Measures Met 11
Number of Performance Measures 18
Percent of Performance Measures Met 61.1%
CSSF Balanced Scorecard Report
Report Date: 7/1/2015 To 11/30/2015
Youth Co-Op
Florida Keys center
Performance
Economic Impact
ND = No Data
Copyright © 2012 South Florida Workforce Investment Board - All Rights Reserved. Last Run Date: 12/2/2015 8:22:09 AM

Measure Standard Region Center
1 Level of Services for Special Groups 6.426% 100.00% 6.608%
2 Training Completion Rate 70% 97.561% 100.00%
3 Training Completion Placement Rate 70% 80.00% 100.00%
4 Training Related Placements 70% 87.50% 100.00%
5 Job Openings Index 274 10,864 874
6 WP Entered Employment Rate 55% 68.885% 79.473%
7 WIA Adult & Dislocated Worker EER 93% 99.873% 100.00%
8 CAP Entered Employment Rate 38% 40.531% 55.357%
9 CAP Participation Rate 55% 43.485% 62.994%
10 Short-Term Veterans EER 51% 60.354% 68.571%
11 SNAP EER 30% 23.958% 25.00%
12 Number of Training Enrollments 70 682 66
13 Employment (Obtained and Direct) 2,175 26,917 1,909
14 Employment Average Wage $13.87 $10.26 $8.57
15 Employers Served 551 10,247 559
16 Employer Services (Level 1) 268 6,256 374
17 Cost Per Placement $603.30 $344.45 $447.58
18 Net Economic Benefit $27,493.38 $21,002.00 $17,370.11
19 Return on the Investment $46.87 $61.05 $38.81
Number of Performance Measures Met 13
Number of Performance Measures 18
Percent of Performance Measures Met 72.2%
CSSF Balanced Scorecard Report
Report Date: 7/1/2015 To 11/30/2015
Youth Co-Op
Homestead center
Performance
Economic Impact
ND = No Data
Copyright © 2012 South Florida Workforce Investment Board - All Rights Reserved. Last Run Date: 12/2/2015 8:22:09 AM
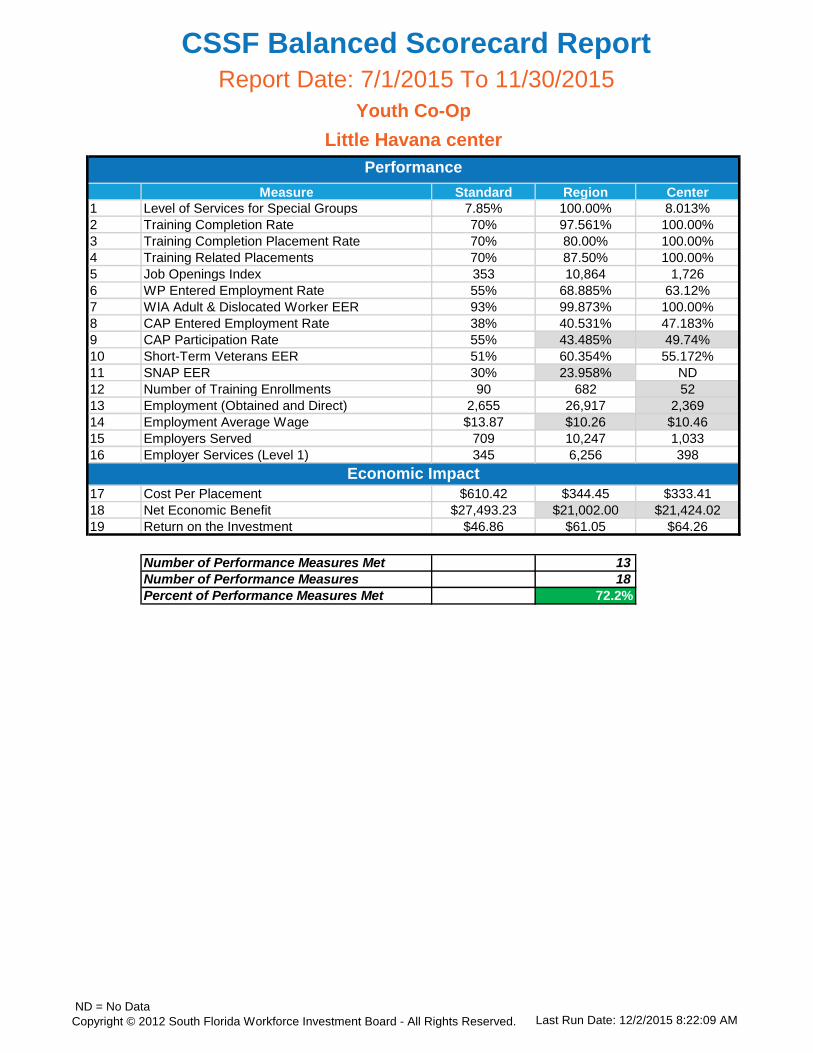
Measure Standard Region Center
1 Level of Services for Special Groups 7.85% 100.00% 8.013%
2 Training Completion Rate 70% 97.561% 100.00%
3 Training Completion Placement Rate 70% 80.00% 100.00%
4 Training Related Placements 70% 87.50% 100.00%
5 Job Openings Index 353 10,864 1,726
6 WP Entered Employment Rate 55% 68.885% 63.12%
7 WIA Adult & Dislocated Worker EER 93% 99.873% 100.00%
8 CAP Entered Employment Rate 38% 40.531% 47.183%
9 CAP Participation Rate 55% 43.485% 49.74%
10 Short-Term Veterans EER 51% 60.354% 55.172%
11 SNAP EER 30% 23.958% ND
12 Number of Training Enrollments 90 682 52
13 Employment (Obtained and Direct) 2,655 26,917 2,369
14 Employment Average Wage $13.87 $10.26 $10.46
15 Employers Served 709 10,247 1,033
16 Employer Services (Level 1) 345 6,256 398
17 Cost Per Placement $610.42 $344.45 $333.41
18 Net Economic Benefit $27,493.23 $21,002.00 $21,424.02
19 Return on the Investment $46.86 $61.05 $64.26
Number of Performance Measures Met 13
Number of Performance Measures 18
Percent of Performance Measures Met 72.2%
CSSF Balanced Scorecard Report
Report Date: 7/1/2015 To 11/30/2015
Youth Co-Op
Little Havana center
Performance
Economic Impact
ND = No Data
Copyright © 2012 South Florida Workforce Investment Board - All Rights Reserved. Last Run Date: 12/2/2015 8:22:09 AM
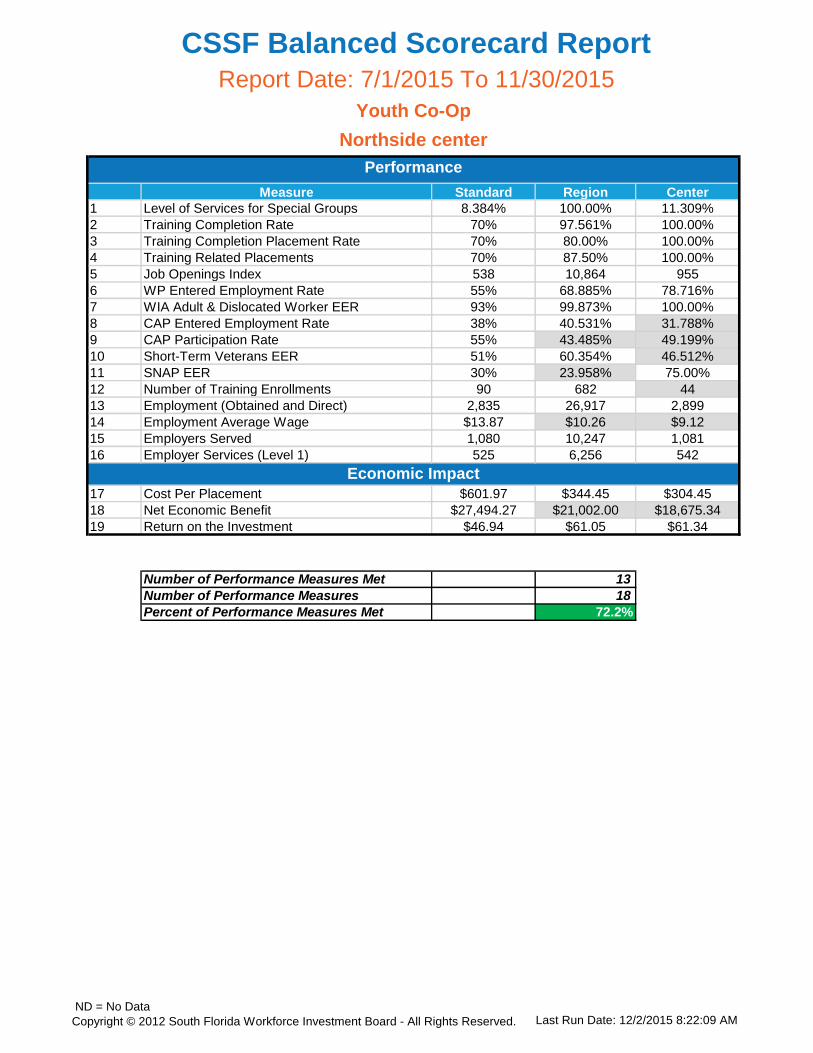
Measure Standard Region Center
1 Level of Services for Special Groups 8.384% 100.00% 11.309%
2 Training Completion Rate 70% 97.561% 100.00%
3 Training Completion Placement Rate 70% 80.00% 100.00%
4 Training Related Placements 70% 87.50% 100.00%
5 Job Openings Index 538 10,864 955
6 WP Entered Employment Rate 55% 68.885% 78.716%
7 WIA Adult & Dislocated Worker EER 93% 99.873% 100.00%
8 CAP Entered Employment Rate 38% 40.531% 31.788%
9 CAP Participation Rate 55% 43.485% 49.199%
10 Short-Term Veterans EER 51% 60.354% 46.512%
11 SNAP EER 30% 23.958% 75.00%
12 Number of Training Enrollments 90 682 44
13 Employment (Obtained and Direct) 2,835 26,917 2,899
14 Employment Average Wage $13.87 $10.26 $9.12
15 Employers Served 1,080 10,247 1,081
16 Employer Services (Level 1) 525 6,256 542
17 Cost Per Placement $601.97 $344.45 $304.45
18 Net Economic Benefit $27,494.27 $21,002.00 $18,675.34
19 Return on the Investment $46.94 $61.05 $61.34
Number of Performance Measures Met 13
Number of Performance Measures 18
Percent of Performance Measures Met 72.2%
CSSF Balanced Scorecard Report
Report Date: 7/1/2015 To 11/30/2015
Youth Co-Op
Northside center
Performance
Economic Impact
ND = No Data
Copyright © 2012 South Florida Workforce Investment Board - All Rights Reserved. Last Run Date: 12/2/2015 8:22:09 AM
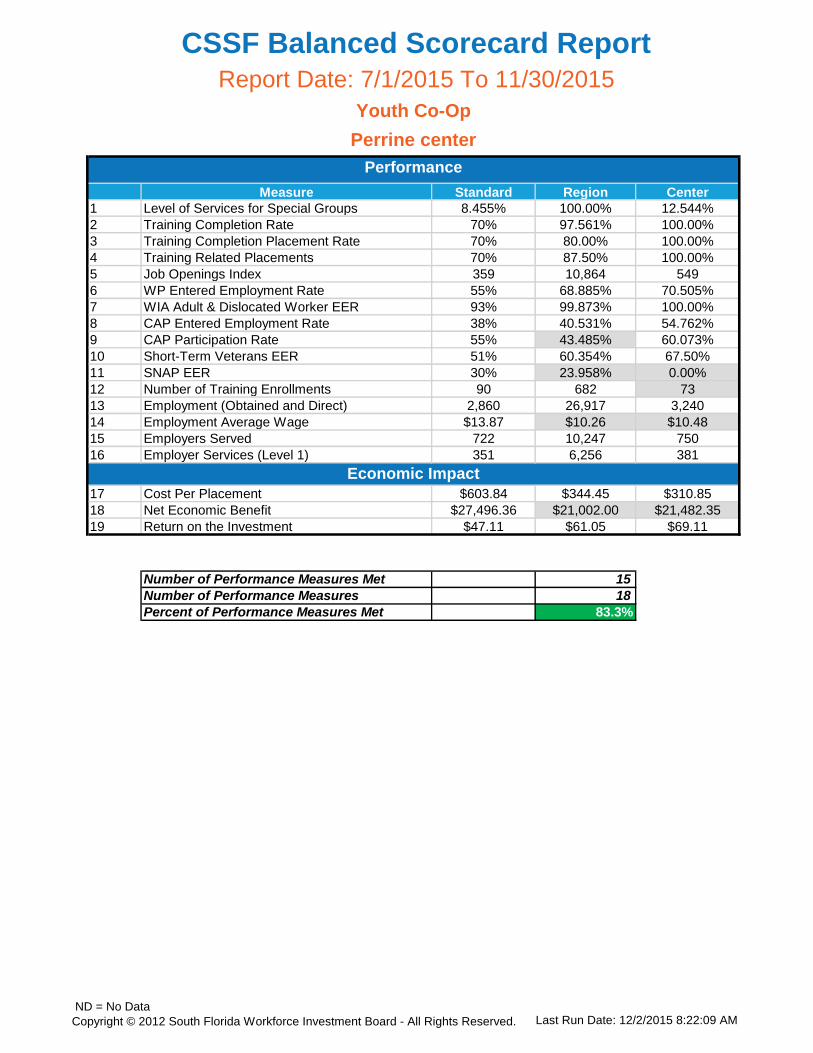
Measure Standard Region Center
1 Level of Services for Special Groups 8.455% 100.00% 12.544%
2 Training Completion Rate 70% 97.561% 100.00%
3 Training Completion Placement Rate 70% 80.00% 100.00%
4 Training Related Placements 70% 87.50% 100.00%
5 Job Openings Index 359 10,864 549
6 WP Entered Employment Rate 55% 68.885% 70.505%
7 WIA Adult & Dislocated Worker EER 93% 99.873% 100.00%
8 CAP Entered Employment Rate 38% 40.531% 54.762%
9 CAP Participation Rate 55% 43.485% 60.073%
10 Short-Term Veterans EER 51% 60.354% 67.50%
11 SNAP EER 30% 23.958% 0.00%
12 Number of Training Enrollments 90 682 73
13 Employment (Obtained and Direct) 2,860 26,917 3,240
14 Employment Average Wage $13.87 $10.26 $10.48
15 Employers Served 722 10,247 750
16 Employer Services (Level 1) 351 6,256 381
17 Cost Per Placement $603.84 $344.45 $310.85
18 Net Economic Benefit $27,496.36 $21,002.00 $21,482.35
19 Return on the Investment $47.11 $61.05 $69.11
Number of Performance Measures Met 15
Number of Performance Measures 18
Percent of Performance Measures Met 83.3%
CSSF Balanced Scorecard Report
Report Date: 7/1/2015 To 11/30/2015
Youth Co-Op
Perrine center
Performance
Economic Impact
ND = No Data
Copyright © 2012 South Florida Workforce Investment Board - All Rights Reserved. Last Run Date: 12/2/2015 8:22:09 AM
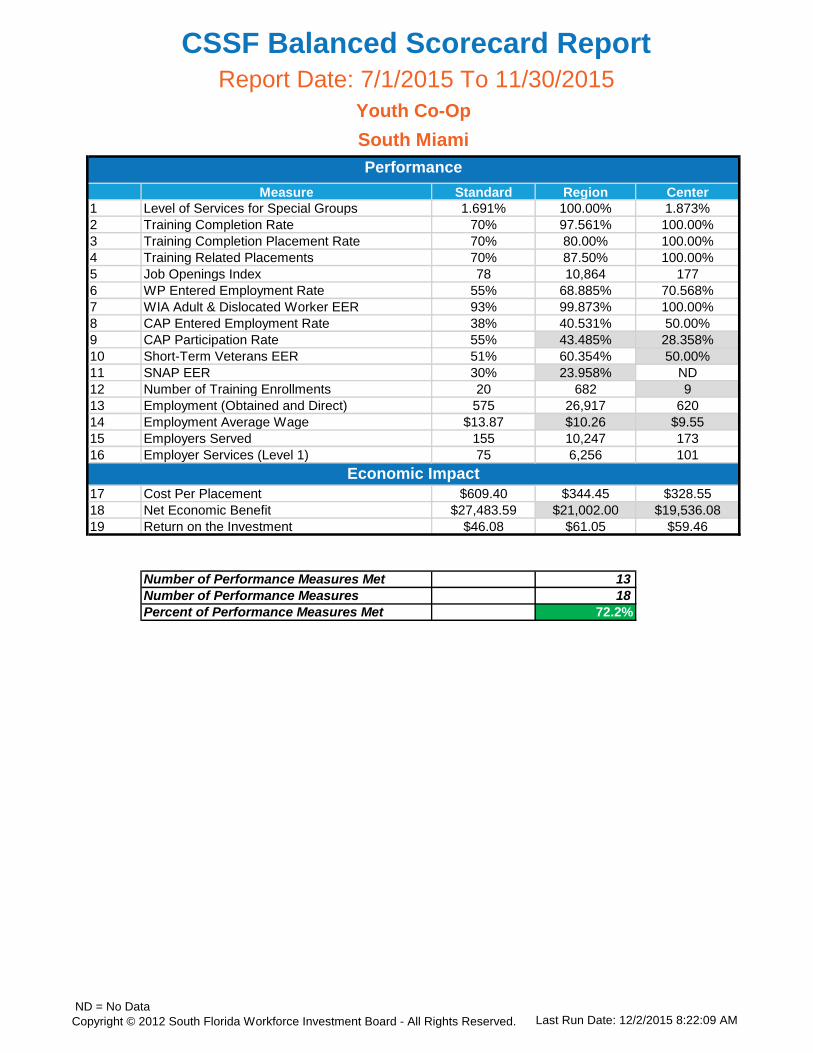
Measure Standard Region Center
1 Level of Services for Special Groups 1.691% 100.00% 1.873%
2 Training Completion Rate 70% 97.561% 100.00%
3 Training Completion Placement Rate 70% 80.00% 100.00%
4 Training Related Placements 70% 87.50% 100.00%
5 Job Openings Index 78 10,864 177
6 WP Entered Employment Rate 55% 68.885% 70.568%
7 WIA Adult & Dislocated Worker EER 93% 99.873% 100.00%
8 CAP Entered Employment Rate 38% 40.531% 50.00%
9 CAP Participation Rate 55% 43.485% 28.358%
10 Short-Term Veterans EER 51% 60.354% 50.00%
11 SNAP EER 30% 23.958% ND
12 Number of Training Enrollments 20 682 9
13 Employment (Obtained and Direct) 575 26,917 620
14 Employment Average Wage $13.87 $10.26 $9.55
15 Employers Served 155 10,247 173
16 Employer Services (Level 1) 75 6,256 101
17 Cost Per Placement $609.40 $344.45 $328.55
18 Net Economic Benefit $27,483.59 $21,002.00 $19,536.08
19 Return on the Investment $46.08 $61.05 $59.46
Number of Performance Measures Met 13
Number of Performance Measures 18
Percent of Performance Measures Met 72.2%
CSSF Balanced Scorecard Report
Report Date: 7/1/2015 To 11/30/2015
Youth Co-Op
South Miami
Performance
Economic Impact
ND = No Data
Copyright © 2012 South Florida Workforce Investment Board - All Rights Reserved. Last Run Date: 12/2/2015 8:22:09 AM

Measure Standard Region Center
1 Level of Services for Special Groups 11.543% 100.00% 11.334%
2 Training Completion Rate 70% 97.561% 100.00%
3 Training Completion Placement Rate 70% 80.00% 100.00%
4 Training Related Placements 70% 87.50% 66.667%
5 Job Openings Index 480 10,864 946
6 WP Entered Employment Rate 55% 68.885% 66.377%
7 WIA Adult & Dislocated Worker EER 93% 99.873% 100.00%
8 CAP Entered Employment Rate 38% 40.531% 52.113%
9 CAP Participation Rate 55% 43.485% 56.627%
10 Short-Term Veterans EER 51% 60.354% 57.303%
11 SNAP EER 30% 23.958% 0.00%
12 Number of Training Enrollments 125 682 83
13 Employment (Obtained and Direct) 3,905 26,917 3,676
14 Employment Average Wage $13.87 $10.26 $10.45
15 Employers Served 964 10,247 1,354
16 Employer Services (Level 1) 468 6,256 640
17 Cost Per Placement $606.72 $344.45 $329.05
18 Net Economic Benefit $27,493.71 $21,002.00 $21,406.74
19 Return on the Investment $46.89 $61.05 $65.06
Number of Performance Measures Met 12
Number of Performance Measures 18
Percent of Performance Measures Met 66.7%
CSSF Balanced Scorecard Report
Report Date: 7/1/2015 To 11/30/2015
Youth Co-Op
West Dade center
Performance
Economic Impact
ND = No Data
Copyright © 2012 South Florida Workforce Investment Board - All Rights Reserved. Last Run Date: 12/2/2015 8:22:09 AM

SFWIB PERFORMANCE COUNCIL
DATE: 12/17/2015
AGENDA ITEM NUMBER: 6
AGENDA ITEM SUBJECT: WORKFORCE SERVICES REGIONAL PERFORMANCE OVERVIEW
AGENDA ITEM TYPE: INFORMATIONAL
RECOMMENDATION: N/A
STRATEGIC GOAL: PREMIER NATIONAL PROVIDER OF EMPLOYMENT
STRATEGIC PROJECT: Set Standards on Performance Measures Reporting
BACKGROUND:
For Program Year (PY) 2014-2015, the performance statistics attached covering the period of July 1, 2015 through October 31, 2015 on the Florida's Department of Economic Opportunity (DEO) Monthly Management Report (MMR) for the 24 Regional Workforce Boards in the State reveal the following performance for the Region:
17,872 job seekers were placed into jobs that exited the system compared to 15,280 for the same period lastPY. This is a 15.6 percent increase compared to the same period last PY.
The Wagner-Peyser Entered Employment Rate (EER) is at 68.1 percent and is ranked 4th. The Veterans Program EER is at 68.6 percent and is ranked 2nd. The Career Advancement Program (CAP) / Welfare Transition (WT) Program All Family Participation Rate
is at 43.5 percent and is ranked 9th. The CAP / WT Program EER is at 38 percent and is ranked 7th.
The Monthly Job Placement Report which is developed by the Florida's DEO and CareerSource Florida demonstrates that for Program Year 2015-2016 from July to October, CareerSource South Florida (CSSF) placed 26,819 job seekers into jobs compared to 25,608 for the same period last PY 2014-2015. This is a 4.7 percent increase. CSSF makes up 17.9 percent of the State's total number placements.
The region’s Workforce Services Contractors and SFWIB staff work diligently through the efforts of the various Performance Improvement Teams (PIT) to continue enhancing the quality of the Workforce Services delivery system and improving performance.
FUNDING: N/A
PERFORMANCE: N/A NO ATTACHMENT

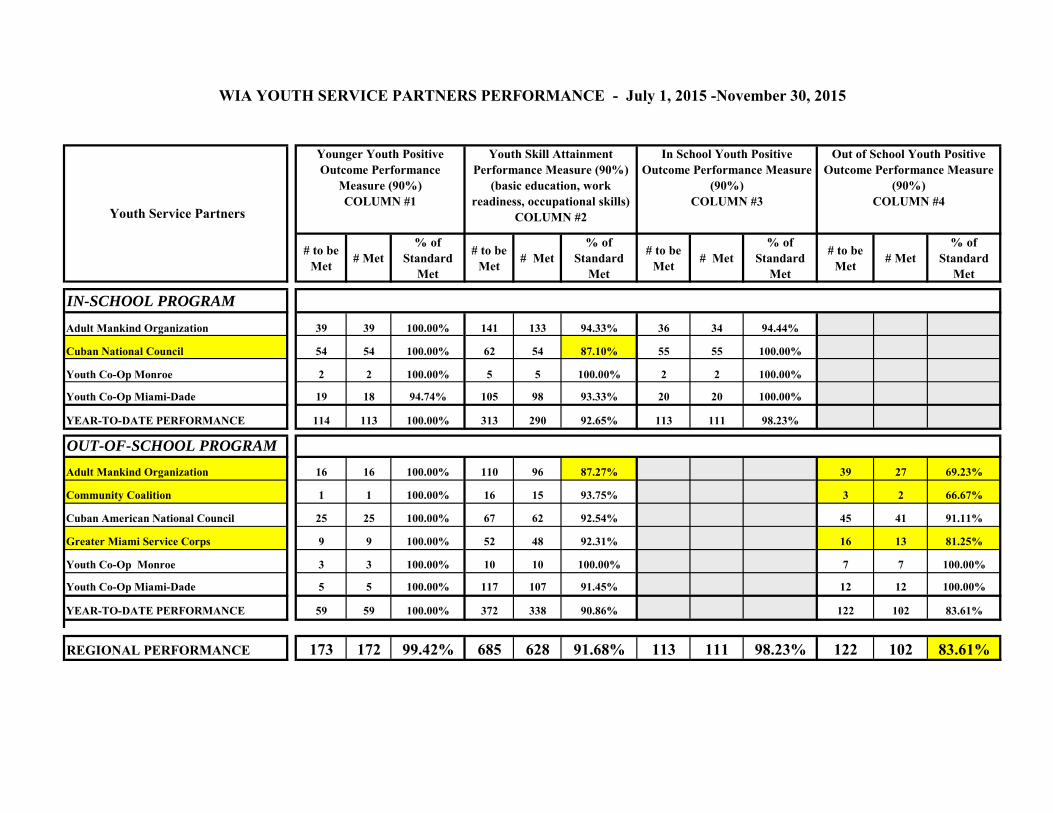
SFWIB PERFORMANCE COUNCIL DATE: 12/17/2015 AGENDA ITEM NUMBER: 7 AGENDA ITEM SUBJECT: YOUTH PARTNERS AND REGION PERFORMANCE AGENDA ITEM TYPE: INFORMATIONAL RECOMMENDATION: N/A STRATEGIC GOAL: STRONG, TIMELY REPORTING STANDARDS STRATEGIC PROJECT: Set Standards on Performance Measures Reporting BACKGROUND: Performance measures for the Youth Partners and Region covering a five month reporting period, July 1, 2015 through December 3, 2015, as represented on the State's Monthly Management Report (MMR) are as follows: 172 of 173 In-School and Out of School Younger Youth (Column #1) exited the program with positive
outcomes (obtain a credential/ diploma, post-secondary education, advanced training/qualified apprenticeships, military, or employment). The Region’s Younger Youth Positive Outcome Performance Measures is 99.42%
628 of 685 In-School and Out of School Younger Youth (column#2) attained an increase in their skill
attainment performance measure (basic skills, work readiness skills, and occupational skills). The Region’s skill attainment performance measure is 91.68%
111 of 113 In-School Youth (column#3) exited the program with a positive outcome (obtain a credential/
diploma, post-secondary education, advanced training/ qualified apprenticeships, military, or employment). The Region’s in school youth positive outcome performance measure is 98.23%
102 of 122 Out-School Youth (column #4) exited the program with a positive outcome (obtain a
credential/diploma, post-secondary education, advanced training/ qualified apprenticeships, military, or employment). The Region’s Out of School youth positive outcome performance measure Is 83.61%
FUNDING: N/A PERFORMANCE: N/A ATTACHMENT
# to be Met # Met
% of Standard
Met
# to be Met # Met
% of Standard
Met
# to be Met # Met
% of Standard
Met
# to be Met # Met
% of Standard
Met
IN-SCHOOL PROGRAM
Adult Mankind Organization 39 39 100.00% 141 133 94.33% 36 34 94.44%
Cuban National Council 54 54 100.00% 62 54 87.10% 55 55 100.00%
Youth Co-Op Monroe 2 2 100.00% 5 5 100.00% 2 2 100.00%
Youth Co-Op Miami-Dade 19 18 94.74% 105 98 93.33% 20 20 100.00%
YEAR-TO-DATE PERFORMANCE 114 113 100.00% 313 290 92.65% 113 111 98.23%
OUT-OF-SCHOOL PROGRAM
Adult Mankind Organization 16 16 100.00% 110 96 87.27% 39 27 69.23%
Community Coalition 1 1 100.00% 16 15 93.75% 3 2 66.67%
Cuban American National Council 25 25 100.00% 67 62 92.54% 45 41 91.11%
Greater Miami Service Corps 9 9 100.00% 52 48 92.31% 16 13 81.25%
Youth Co-Op Monroe 3 3 100.00% 10 10 100.00% 7 7 100.00%
Youth Co-Op Miami-Dade 5 5 100.00% 117 107 91.45% 12 12 100.00%
YEAR-TO-DATE PERFORMANCE 59 59 100.00% 372 338 90.86% 122 102 83.61%
REGIONAL PERFORMANCE 173 172 99.42% 685 628 91.68% 113 111 98.23% 122 102 83.61%
WIA YOUTH SERVICE PARTNERS PERFORMANCE - July 1, 2015 -November 30, 2015
Youth Service Partners
Younger Youth Positive Outcome Performance
Measure (90%) COLUMN #1
Youth Skill Attainment Performance Measure (90%)
(basic education, work readiness, occupational skills)
COLUMN #2
In School Youth Positive Outcome Performance Measure
(90%) COLUMN #3
Out of School Youth Positive Outcome Performance Measure
(90%) COLUMN #4

SFWIB PERFORMANCE COUNCIL DATE: 12/17/2015 AGENDA ITEM NUMBER: 8 AGENDA ITEM SUBJECT: CONSUMER REPORT CARD UPDATE AGENDA ITEM TYPE: INFORMATIONAL RECOMMENDATION: N/A STRATEGIC GOAL: STRONG, TIMELY REPORTING STANDARDS STRATEGIC PROJECT: Monitor of Training Vendor Performance BACKGROUND: The SFWIB ITA Policy requires the monitoring of the performance of SFWIB approved Training Vendors. Accordingly, staff developed and implemented the Consumer Report Card Tool. The tool is an online report that updates ITA performance on a daily basis. The goal of the tool is to function as an “ITA Consumer Report Card,” enabling the consumer (participant) as well as the Career Advisor the ability to check on the success of individual programs and to evaluate the economic benefit per placement by program. The attached PY15-16 Consumer Report Card table, dated November 30, 2015, indicates that the South Florida Workforce Investment Board generated $1,086,753.92 of wages into the South Florida regional economy. For every dollar spent on training, SFWIB obtained a return of $4.04. Ninety-eight percent of training services participants completed classroom training. Of those completing training, 78 percent have obtained employment with an average wage of $20.37. Eighty-seven percent of the participants were placed in a training-related occupation. The net economic benefit per placement is $33,961.06.
FUNDING: N/A PERFORMANCE: N/A ATTACHMENT

Avg. Cost Per
Participant
Total
Completion
Expenditures
Total
Expenditure Per
Placement
Average
Wage
Average
Economic
Benefit
American Advanced Technicians Institute 1 1 1 100.00 % 1 100.00 % $ 3,030.50 $ 3,030.50 $ 3,030.50 $ 12.00 $ 24,960.00 $ 21,929.50 $ 7.24
Dade Medical College - Miami Campus 1 1 1 100.00 % - 0.00 % $ 10,000.00 $ 10,000.00 $ 10,000.00 $ 10.00 $ 20,800.00 $ 10,800.00 $ 1.08
Florida International University (RDB1003) 1 1 - 0.00 % - 0.00 % $ 5,592.95 $ 5,592.95 - - - - -
Metropolitan Trucking and Technical Institute 7 7 - 0.00 % - 0.00 % $ 1,809.15 $ 12,664.08 - - - - -
Miami-Dade College 3 2 1 50.00 % 1 100.00 % $ 3,195.91 $ 6,391.83 $ 6,391.83 $ 14.00 $ 29,120.00 $ 22,728.17 $ 3.56
New Horizons 16 16 16 100.00 % 14 87.50 % $ 8,750.00 $ 140,000.00 $ 8,750.00 $ 21.58 $ 44,887.70 $ 36,137.70 $ 4.13
Sullivan & Cogliano Training Centers,Inc. Kendall 7 7 7 100.00 % 7 100.00 % $ 7,945.00 $ 55,615.00 $ 7,945.00 $ 23.59 $ 49,067.20 $ 41,122.20 $ 5.18
The Academy -- Miami Campus 4 4 4 100.00 % 3 75.00 % $ 8,774.38 $ 35,097.50 $ 8,774.38 $ 18.98 $ 39,478.40 $ 30,704.03 $ 3.50
The CDL School, Inc. 2 2 2 100.00 % 2 100.00 % $ 1,875.00 $ 3,750.00 $ 1,875.00 $ 14.68 $ 30,534.40 $ 28,659.40 $ 15.29
42 41 32 78.05 % 28 87.50 % $ 6,555.66 $ 268,782.11 $ 8,399.44 $ 20.37 $ 42,360.50 $ 33,961.06 $ 4.04
Value Added
per
Placement
Consumer Report Card07/01/2015 - 06/30/2016
Training AgentTotal
Outcome
Number of
Completions
Number of
Placements
% of
Placements
# of Training
Related
Placements
Training Expenditures Economic Benefit% of Total
Training
Related
Placements
Net
Economic
Benefit Per
Placement
Page 1 of 1 CareerSource South Florida is an equal opportunity employer / program. Auxiliary aids & services are available upon request to individuals with disabilities. Printed on: 11/30/2015 @ 4:18 PM
SFWIB PERFORMANCE COUNCIL DATE: 10/15/2015 AGENDA ITEM NUMBER: 9 AGENDA ITEM SUBJECT: SEPTEMBER AND OCTOBER PERFORMANCE INCENTIVE FOR STAFF AGENDA ITEM TYPE: INFORMATIONAL RECOMMENDATION: N/A STRATEGIC GOAL: PREMIER NATIONAL PROVIDER OF EMPLOYMENT STRATEGIC PROJECT: Alignment of Performance Measures with SFWIB Plan BACKGROUND: SFWIB workforce system’s values under the new performance based contracts have thrived to be purpose-driven, business-driven and continuous improvement with the need to focus on the dual goals of quality service and outcomes. SFWIB staff recognized and will provide a performance incentive of $300 to the top two (2) Workforce Services Professionals as shown below for the months of September and October based on a composite score of the following Performance Measures and Quality Assurance data for each respective month of Program Year 2015‐2016: Direct Job Placements (DJP), Referral to Placement Ratio, Average Wage of DJP’s, and Economic Benefit Back to the Community in Wages, and the number of job orders generated. September 2015 Top Two Workforce Professionals 1. Paonessae, Estelle (Homestead Career Center) DJP = 105 Referral to Placement Ratio = 57.14% Average Wage of DJP's= $8.05 Projected Total Annual Economic Benefit Back to the Community in Wages = $1,758,120 job Orders Generated = 13 2. Caraballo, Fabiola (Little Havana Career Center) DJP = 31 Referral to Placement Ratio = 41.25% Average Wage of DJP's = $10.91 Projected Total Annual Economic Benefit Back to the Community in Wages = $703,476 job Orders Generated = 0
October 2015 Top Two Workforce Professionals 1. Saucedo, Marisol (Homestead Career Center) DJP = 97 Referral to Placement Ratio = 65.71% Average Wage of DJP's= $8.06 Projected Total Annual Economic Benefit Back to the Community in Wages = $1,626,185 job Orders Generated = 8 2. Ortega, Yaima (West Dade Career Center) DJP = 77 Referral to Placement Ratio = 16.92% Average Wage of DJP's = $13.05 Projected Total Annual Economic Benefit Back to the Community in Wages = $2,090,088 job Orders Generated = 0 FUNDING: N/A PERFORMANCE: N/A NO ATTACHMENT