80 tools - iicarepiica.iica.int/docs/b1013i/b1013i.pdf · 4 participatory appraisal: natural...
TRANSCRIPT

Frans Geilfus
Agricultural Engineer, with
a PhD in Geography from
the University of Louvaine
(Belgium). Dr. Geilfus
specializes in sustainable
agriculture, agroforestry,
participatory technology
development, and natural
resource planning.
This book is a “toolbox” for
rural-development stakeholders
and professionals – extension
workers, advocates, community
leaders, researchers – who wish
to improve and systematize
community participation in
projects and initiatives. It is
intended for those who have
realized, through their own
experiences, that participation
is an essential prerequisite for
sustainable development. While
this “toolbox” should serve as a
source of inspiration for their
work, it should never be viewed
as a book of “recipes”.
80 TOOLSLS
FOR PARTICIPATORY
DEVELOPMENT
80
TO
OLS
FO
R P
AR
TIC
IPAT
OR
Y D
EVEL
OP
MEN
T
“Participatory exercises carried out in the Vueltas, Chalatenango Community.(Facilitator: CORDES Foundation)”

80 TOOLS FOR PARTICIPATORY DEVELOPMENT
Appraisal, Planning,Follow-up and Evaluation
Frans Geilfus
© Inter-American Institute for Cooperation on Agriculture (IICA). 2008
IICA encourages the fair use of this document. Proper citation is requested.
This publication is also available in electronic (PDF) format from IICA’s Web site at http://www.iica.int.
Editorial coordination: Byron Miranda AbaunzaMechanical editing: Byron Miranda AbaunzaLayout: Karla CruzIllustrated by: Julio Batres and Mario BarrientosPrinted: IICA Headquarters
Geilfus, Frans 80 tools for participatory development: appraisal, planning, follow-up and evaluation / Frans Geilfus. -- San Jose, C.R.: IICA, 2008.208 p. ; 24 cm.
ISBN13: 978-92-9039-910-0Published also in Spanish
1. Social development 2. Rural planning I. IICA II. Title
AGRIS DEWEY E14 303.4
San Jose, Costa Rica 2008

Foreword
The transformational power of voluntary association for collective action is formidable, if harnessed properly. Experience has shown that most successful partnerships are built upon participatory processes and democratic procedures.
Thus, one of the great challenges facing us today is the search for methodologies and tools that facilitate collective action and solutions, through participatory processes and teamwork – in short, the implementation of methodologies based on full stakeholder participation, in a manner which recognizes and transforms the existing environment.
Few publications over the past few years have offered a collection of instruments as simple and user-friendly – a toolbox that can be consulted for specific needs – as “80 Tools for Participatory Development”. The chief merits of this book, and of the effort invested in its development, lie in its familiar tools, its design (layout, illustrations), its simple, precise, and direct language, and its effective illustrations.
The book has been through six printings; 15,000 copies have been distributed and sold; four editions have been published by the Regional IICA-Holland “Hillsides” Project, with partial funding from GTZ and the PROCHALATE/FIDA/EU/EIS project; two editions have been published by the Mexican Secretariat for Agriculture and Rural Development. All of this attests to the book’s popularity. The seventh edition you now hold in your hands, as well as its CD-ROM version and the online version made available by the IICA sustainable development network, are intended to facilitate access to this important document.
The Inter-American Institute for Cooperation on Agriculture (IICA) is pleased to present this important work. We look forward to your feedback, and reiterate our hope that this material will be of use, not for exact replication, but rather as a tool to be adapted to your own reality and experience.
Byron Miranda Abaunza, Ph.D. Regional Specialist on Sustainable Rural
Development for Central America


TABLE OF CONTENTS
1. Introduction
1.1 What is participation? . . . . . . . . . . . . . . . . . . . . . . . . . . . . . . . . . . . . . . . . 11.2 Main characteristics of participatory methods in project
appraisal, planning, and follow-up . . . . . . . . . . . . . . . . . . . . . . . . . . . . . . 41.3 Principles of dialogue . . . . . . . . . . . . . . . . . . . . . . . . . . . . . . . . . . . . . . . . 51.4 A new professional approach: the development facilitator . . . . . . . . . . . 71.5 Types of participatory tools . . . . . . . . . . . . . . . . . . . . . . . . . . . . . . . . . . 121.6 Participatory tools in the development process. . . . . . . . . . . . . . . . . . . . 131.7 How do we select the right tools? . . . . . . . . . . . . . . . . . . . . . . . . . . . . . . 141.8 Example of a full participatory process . . . . . . . . . . . . . . . . . . . . . . . . . 191.9 Basic visualization principles . . . . . . . . . . . . . . . . . . . . . . . . . . . . . . . . . 201.10 Common mistakes in participatory workshops. . . . . . . . . . . . . . . . . . . . 21
2 Generally applicable dialogue, observation, and group-dynamic techniques
2.1 Semi-structured dialogue . . . . . . . . . . . . . . . . . . . . . . . . . . . . . . . . . . . . 252.2 Dialogue with key respondents . . . . . . . . . . . . . . . . . . . . . . . . . . . . . . . . 282.3 Dialogue with household members. . . . . . . . . . . . . . . . . . . . . . . . . . . . . 292.4 Dialogue with focus groups . . . . . . . . . . . . . . . . . . . . . . . . . . . . . . . . . . 302.5 Establishment of working groups (“focus groups”) . . . . . . . . . . . . . . . . 312.6 Brainstorming session . . . . . . . . . . . . . . . . . . . . . . . . . . . . . . . . . . . . . . . 332.7 Participatory observation . . . . . . . . . . . . . . . . . . . . . . . . . . . . . . . . . . . . 34
3 Participatory appraisal: general community issues – social issues
3.1 Group profile . . . . . . . . . . . . . . . . . . . . . . . . . . . . . . . . . . . . . . . . . . . . . . 373.2 Livelihoods . . . . . . . . . . . . . . . . . . . . . . . . . . . . . . . . . . . . . . . . . . . . . . . 393.3 Organizational/institutional analysis: Venn diagram . . . . . . . . . . . . . . . 413.4 Social map. . . . . . . . . . . . . . . . . . . . . . . . . . . . . . . . . . . . . . . . . . . . . . . . 433.5 Income classification (key-respondent method) . . . . . . . . . . . . . . . . . . . 453.6 Income classification (group method). . . . . . . . . . . . . . . . . . . . . . . . . . . 483.7 Map of services and opportunities . . . . . . . . . . . . . . . . . . . . . . . . . . . . . 513.8 Timeline . . . . . . . . . . . . . . . . . . . . . . . . . . . . . . . . . . . . . . . . . . . . . . . . . 533.9 Trend lines . . . . . . . . . . . . . . . . . . . . . . . . . . . . . . . . . . . . . . . . . . . . . . . 553.10 Community history chart . . . . . . . . . . . . . . . . . . . . . . . . . . . . . . . . . . . . 573.11 Seasonal analysis . . . . . . . . . . . . . . . . . . . . . . . . . . . . . . . . . . . . . . . . . . 59

4 Participatory appraisal: natural resource management
4.1 Natural resource and land use map . . . . . . . . . . . . . . . . . . . . . . . . . . . . . 634.2 Transect walk and diagramming . . . . . . . . . . . . . . . . . . . . . . . . . . . . . . 654.3 Watershed diagramming . . . . . . . . . . . . . . . . . . . . . . . . . . . . . . . . . . . . . 674.4 Historical diagramming and mapping of natural resources . . . . . . . . . . 69 4.5 Resource evaluation matrix . . . . . . . . . . . . . . . . . . . . . . . . . . . . . . . . . . 714.6 Map of access to natural resources . . . . . . . . . . . . . . . . . . . . . . . . . . . . 734.7 Decision-making analysis matrix . . . . . . . . . . . . . . . . . . . . . . . . . . . . . 754.8 Conflict-analysis matrix . . . . . . . . . . . . . . . . . . . . . . . . . . . . . . . . . . . . . 774.9 Local soil classification. . . . . . . . . . . . . . . . . . . . . . . . . . . . . . . . . . . . . . 794.10 Local tree use (agroforestry inventory). . . . . . . . . . . . . . . . . . . . . . . . . . 814.11 Resource-use problem census (based on transect) . . . . . . . . . . . . . . . . . 83
5 Participatory appraisal: production systems
5.1 Preliminary farm classification (based on access to resources) . . . . . . . 875.2 Farm classification (based on recommendation domains as
perceived by farmers) . . . . . . . . . . . . . . . . . . . . . . . . . . . . . . . . . . . . . . . 895.3 Farm mapping . . . . . . . . . . . . . . . . . . . . . . . . . . . . . . . . . . . . . . . . . . . . . 915.4 Systemic farm model . . . . . . . . . . . . . . . . . . . . . . . . . . . . . . . . . . . . . . . 935.5 Transect walk and plot diagramming . . . . . . . . . . . . . . . . . . . . . . . . . . . 955.6 Description of management practices . . . . . . . . . . . . . . . . . . . . . . . . . . . 975.7 Farm problem census (based on farm map and systemic model) . . . . . . 995.8 Seasonal crop calendars . . . . . . . . . . . . . . . . . . . . . . . . . . . . . . . . . . . . 1015.9 Flowchart of activities. . . . . . . . . . . . . . . . . . . . . . . . . . . . . . . . . . . . . . 1035.10 Crop budget (based on flowcharts of activities) . . . . . . . . . . . . . . . . . . 1055.11 Historical graphing of production system. . . . . . . . . . . . . . . . . . . . . . . 1075.12 Crop / seasonal activity problem census (based on flowcharts
of activities) . . . . . . . . . . . . . . . . . . . . . . . . . . . . . . . . . . . . . . . . . . . . . 1095.13 Crop biographies . . . . . . . . . . . . . . . . . . . . . . . . . . . . . . . . . . . . . . . . . . 1115.14 Agronomic preference matrix . . . . . . . . . . . . . . . . . . . . . . . . . . . . . . . . 1135.15 Ex ante agronomic evaluation matrix . . . . . . . . . . . . . . . . . . . . . . . . . 115
6 Participatory appraisal: animal production
6.1 Livestock inventory. . . . . . . . . . . . . . . . . . . . . . . . . . . . . . . . . . . . . . . . 1196.2 Seasonal animal production calendars . . . . . . . . . . . . . . . . . . . . . . . . . 1216.3 Forage map . . . . . . . . . . . . . . . . . . . . . . . . . . . . . . . . . . . . . . . . . . . . . . 1236.4 “Cow interview” . . . . . . . . . . . . . . . . . . . . . . . . . . . . . . . . . . . . . . . . . 1256.5 Assessment of veterinary problems . . . . . . . . . . . . . . . . . . . . . . . . . . . 127

7 Participatory appraisal: gender issues
7.1 Gender-based farm map . . . . . . . . . . . . . . . . . . . . . . . . . . . . . . . . . . . . 1317.2 Use of time . . . . . . . . . . . . . . . . . . . . . . . . . . . . . . . . . . . . . . . . . . . . . . 1337.3 Gender-based seasonal calendar . . . . . . . . . . . . . . . . . . . . . . . . . . . . . . 1357.4 Mobility map . . . . . . . . . . . . . . . . . . . . . . . . . . . . . . . . . . . . . . . . . . . . 1377.5 Benefit analysis . . . . . . . . . . . . . . . . . . . . . . . . . . . . . . . . . . . . . . . . . . 139
8 Participatory appraisal: communication and extension
8.1 Map of exchanges . . . . . . . . . . . . . . . . . . . . . . . . . . . . . . . . . . . . . . . . . 1438.2 Communication/exchange problem census (based on the map
of exchanges) . . . . . . . . . . . . . . . . . . . . . . . . . . . . . . . . . . . . . . . . . . . . 1458.3 Extension/technical assistance priority matrix . . . . . . . . . . . . . . . . . . . 147
9 Analysis of problems and solutions
9.1 Problem tree: cause-and-effect diagram . . . . . . . . . . . . . . . . . . . . . . . . 1519.2 Problem priority matrix. . . . . . . . . . . . . . . . . . . . . . . . . . . . . . . . . . . . . 1539.3 Identification of local or imported solutions . . . . . . . . . . . . . . . . . . . . . 1559.4 Self-assessment and field analysis of local solutions . . . . . . . . . . . . . . 1579.5 Solution evaluation matrix . . . . . . . . . . . . . . . . . . . . . . . . . . . . . . . . . . 1599.6 SWOT Analysis. . . . . . . . . . . . . . . . . . . . . . . . . . . . . . . . . . . . . . . . . . . 1619.7 Option selection: single option . . . . . . . . . . . . . . . . . . . . . . . . . . . . . . . 1639.8 Option selection: multiple options . . . . . . . . . . . . . . . . . . . . . . . . . . . . 1659.9 Visualized questionnaire . . . . . . . . . . . . . . . . . . . . . . . . . . . . . . . . . . . . 1679.10 Analysis of pros and cons: “yes sir, no sir” exercise . . . . . . . . . . . . . . 1699.11 Impact assessment. . . . . . . . . . . . . . . . . . . . . . . . . . . . . . . . . . . . . . . . . 171
10 Planning
10.1 Community planning map. . . . . . . . . . . . . . . . . . . . . . . . . . . . . . . . . . . 17510.2 Farm Planning Map. . . . . . . . . . . . . . . . . . . . . . . . . . . . . . . . . . . . . . . . 17710.3 Farm Plan . . . . . . . . . . . . . . . . . . . . . . . . . . . . . . . . . . . . . . . . . . . . . . . 17910.4 Objectives matrix (logical framework) . . . . . . . . . . . . . . . . . . . . . . . . . 18110.5 Matrix of needs and available resources . . . . . . . . . . . . . . . . . . . . . . . . 18310.6 Action plan matrix . . . . . . . . . . . . . . . . . . . . . . . . . . . . . . . . . . . . . . . . 18510.7 Responsibility matrix . . . . . . . . . . . . . . . . . . . . . . . . . . . . . . . . . . . . . . 187

11 Participatory follow-up and evaluation
11.1 Follow-up and evaluation planning matrix . . . . . . . . . . . . . . . . . . . . . . 19111.2 Follow-up indicator matrix . . . . . . . . . . . . . . . . . . . . . . . . . . . . . . . . . . 19311.3 Participatory follow-up forms (task completion) . . . . . . . . . . . . . . . . . 19511.4 Participatory follow-up forms (quantitative indicators) . . . . . . . . . . . . 19711.5 Participatory follow-up forms (qualitative indicators) . . . . . . . . . . . . . 19911.6 Impact assessment indicator matrix . . . . . . . . . . . . . . . . . . . . . . . . . . . 201
Bibliography . . . . . . . . . . . . . . . . . . . . . . . . . . . . . . . . . . . . . . . . . . . . . . . . . . . 203
1INTRODUCTION
1. INTRODUCTION
This introductory chapter offers a few general guidelines on the practice of participation – the various definitions of the term, the general characteristics of the participatory methods described in this book, and the areas where new working approaches are needed to encourage true dialogue with the community. This book is not a step-by-step manual on the implementation of participatory methodology. That would not be the right approach, since participation entails constant adaptation. What we do offer is a “toolbox” full of ideas and principles that can be used as a guide. This introductory section includes topics intended to encourage reflection.
1.1 WHAT IS PARTICIPATION?
Much has been said about participation in a project and community-development context.
This is so because, as is well known, most development projects either fail or fall far short of their initial goals, due to a lack of real involvement on the part of those for whom the project was intended in the first place (the “beneficiaries”). In addition, many professionals still view development as a simple, linear process which consists of moving in a straight line from situation “A” to situation “B”. To them, participation may be “a waste of time”.
Participation may, of course, be defined in many different ways. What some call participation may be viewed by others as nothing more than manipulation or exploitation of people’s passivity.
The fact of the matter is that participation is not a fixed state of affairs; it is a process through which people become involved, to a lesser or a greater degree, in development processes. Accordingly, this book provides what we call a “participation ladder” (see figure), which explains how a community can gradually transform itself from an almost completely passive spectator (beneficiary) into the driver of its own process (an agent of self-development).
What truly determines the level of participation in this ladder is the degree of decision-making power accorded to the community. This is true both of relationships between community members and the development agency and those within community organizations and institutional local actors.

2 INTRODUCTION
We can try to climb the participation ladder step by step. Our success in doing so depends on the following factors, among others: the degree of organization of the community itself, the flexibility of the institution involved (and its donors), and the availability of all stakeholders – starting with the professionals or development agents, who must change some of their attitudes and methods.
Before reading this book, we suggest you do a short self-evaluation exercise. Let’s see how involved men, women, and children in the field really are in the day-to-day work of development. The stages of a project can be used as a guide:
Stage How involved are people? Who has the final word?
1. Appraisal
2. Problem assessment
3. Selection of options
4. Project planning
5. Implementation
6. Follow-up and evaluation
The results of this exercise can tell us where we need to encourage greater participation and envolvement. This book provides simple tools that can be very useful for that purpose. It should be noted, however, that results depend on the objective, the situation, the participants, and the ability to properly employ these tools.

3INTRODUCTION
Passivity: people participate when they are told; they have no influence on decisions or project implementation.
Information providers: people participate by filling out survey questionnaires; they have no say in the use given to survey data.
Consultative participation: people are consulted by external actors who listen to their opinions; however, they have no say in the decisions made as a result of these sessions.
Incentive-based participation: people participate mainly by supplying labor or other resources (land for pilot projects, for example), in exchange for certain incentives (material or social goods, or training). While the project requires their involvement, they have no direct role in decision-making.
Functional participation: people participate by forming working groups to meet preestablished project objectives. They have no role in project design, but they are taken into account during the follow-up and adjustment process.
Interactive participation: organized local gro ups participate in project design, implementation, and evaluation. This involves systematic and structured teaching/learning processes, as well as a progressive transition toward local control and management.
Self-development: organized local groups take the initiative, without waiting for external input. External parties assume an advisory role, acting as partners.
Passivity
Informationproviders
Incentive-basedparticipation
Functionalparticipation
Interactiveparticipation
Self-development
Consultativeparticipation
The Participation Ladder

4 INTRODUCTION
1.2 MAIN CHARACTERISTICS OF PARTICIPATORY METHODS IN PROJECT APPRAISAL, PLANNING, AND FOLLOW-UP
The tools described here should be viewed as an aid for developing a concrete participatory approach to the development process. They are a “box” of options that share the following common characteristics:
* They are intended for group use.* They are best suited to an interdisciplinary approach (one which allows for
different technical perspectives, bringing researchers, extension workers, planners, and members of the community together).
* They are designed for direct use in the field with communities and farmers.* They encourage learning with and from people, focusing on local knowledge,
practices, and experiences.* Properly employed, these methods foster swift, progressive, and iterative
(incremental) learning.* The data they provide covers the full spectrum of conditions in the field, from a
qualitative and/or quantitative perspective. They are more than simple averages obtained from statistical surveys.
* Most of the tools provide qualitative information, but many can also be used to obtain reliable, verifiable quantitative data.
* They allow for and require “triangulation” of sources – that is, the use of several sources of information, several methods, and several participants to verify results.
While these methods do not eliminate the need to revise available data before entering the field, or the need for more rigorous studies, they do provide a more accurate and precise assessment of where such studies are needed.
The advantages of these tools, from the perspective of communities and development agencies, can be summarized as follows:
Community participation and empowerment:
* The tools provide an understanding of the complex problems people face.* The local community can analyze results and make decisions for itself, on the
basis of information it has itself produced.* People can be mobilized and organized around issues they themselves consider to
be relevant to their own development.* The community can identify and take ownership of the process through which
problems are identified, analyzed, and solved.* The tools can play a decisive role in building self-esteem, by systematizing and
reassessing local experience and knowledge.

5INTRODUCTION
Adjustment and strengthening of the service role of institutions:
* Stronger, more positive interaction takes place between the community and professionals throughout the participatory process, from appraisal to evaluation.
* Problems are identified and prioritized, and consensus-based decisions are made quickly and efficiently.
* Institutions can use these methods to adapt their services to the actual needs of people and gradually transfer responsibilities.
* The systematic use of participatory tools is a highly effective means of providing ongoing training for professionals and institutions, since it continually improves their understanding of the problems facing the community, as well as their own personal potential.
1.3 PRINCIPLES OF DIALOGUE
Participatory tools are designed for use by professionals, development agents or facilitators and advocates working directly with communities, most of which include many illiterate people. They also allow their users to benefit from local experience. Participatory methods employ visualization and oral communication techniques.
These tools are based on dialogue, which must abide by a basic principle: all participants should be viewed as sources of information and decision-making inputs, in order to analyze problems and help craft solutions through development measures. Everyone, rich or poor, with or without formal education, with or without power, deserves the same level of respect, and should be given the same opportunity to voice their opinion.
The role of the facilitator is to allow different views to be expressed and shared by all, in order to help build consensus when decisions must be made.
Remember that the quality of a facilitator’s work is critical to success.
PROFILE OF A GOOD FACILITATOR
• Faith in people and their abilities• The ability to create an atmosphere of trust• Patience and listening skills• Awareness of his or her own limitations; willingness to learn• Self-confidence without arrogance• Respect for the opinions of others, without imposing his or her own views• Creativity• Flexibility; the ability to adapt methods to situations without clinging to rigid agendas• Sensitivity to the mood and sensibilities of participants• Drawing and writing skills• A talent for synthesis and analysis
6 INTRODUCTION
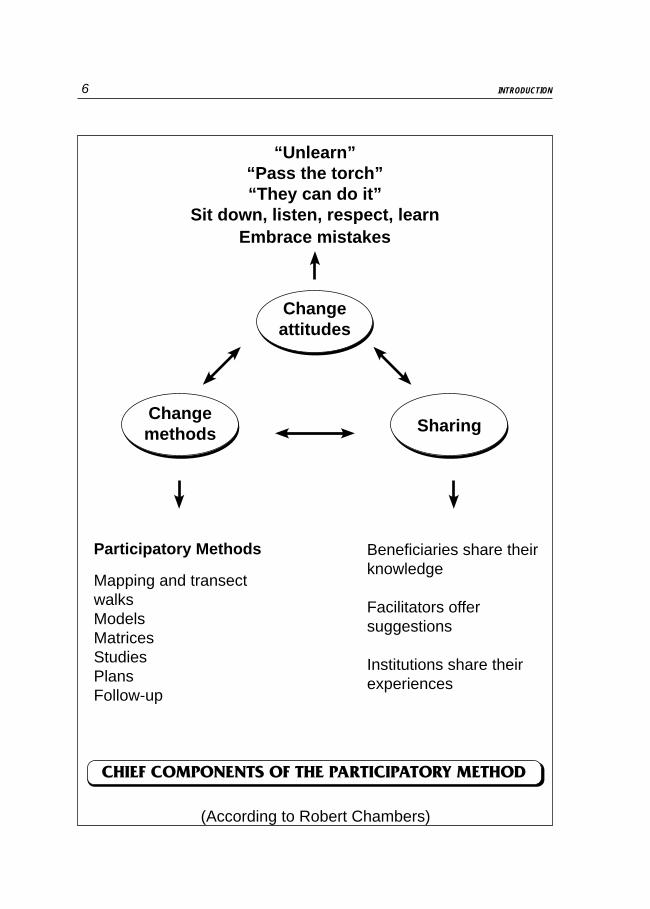
“Unlearn”“Pass the torch”“They can do it”
Sit down, listen, respect, learnEmbrace mistakes
Participatory Methods
Mapping and transect walksModelsMatricesStudiesPlansFollow-up
Beneficiaries share their knowledge
Facilitators offer suggestions
Institutions share their experiences
CHIEF COMPONENTS OF THE PARTICIPATORY METHOD
(According to Robert Chambers)
Changeattitudes
Changemethods Sharing
7INTRODUCTION
1.4 A NEW PROFESSIONAL APPROACH: THE DEVELOPMENT FACILITATOR
Participation should definitely not be limited to a few consultation and planning sessions. In order for the process to be a success, a dynamic must be created in which the professional or advocate/facilitator and the members of the community take on a different role.
The current, traditional relationship, which adheres to the “top-down” approach to development, is characterized by research methods that “extract” information from people without their conscious involvement (often through formal questionnaires), without any consideration for them. These data are then used to make decisions in which the community usually has no involvement. Institutions and professionals have trouble communicating with communities, mainly due to the lack of a common language, which creates mistrust. Many institutions are hampered by “jealousy”, which prevents them from sharing information and ideas to better serve their clients. Sharing with communities is even more difficult, since information often fails to reach them, or does so in a form which is neither accessible nor comprehensible.
The transition to the role of facilitator involves three issues which are inextricably linked: the use of appropriate methods, a change of attitude, and the exchange of information between all stakeholders.
Professionals who wish to become development facilitators must undertake all three of these fundamental changes. It is a very difficult task, particularly if the institutional environment is unfavorable. Nevertheless, more and more examples of substantial change in the practice of development institutions are appearing each day. These changes begin with successful efforts by earnest, dedicated professionals, who have demonstrated the potential of this “new professionalism” in their daily activities.
Following is a list of examples of the kind of changes that are needed to overcome the “top-down”, “vertical or elitist” approach. This new professionalism is that of the “development facilitator” – a professional who no longer teaches and tells people what to do, but rather shares experiences, helps others attain their full potential, advises them on what they themselves consider to be their needs, and helps them identify and negotiate the best solutions.
Hi! I’m John. Who are
you…?
The Engineer!
8 INTRODUCTION

9INTRODUCTION
“Elitist professionals” “Development facilitators”
• Believe only their knowledge is worthy and “scientific”.
• Respect all knowledge for its own sake.
• Believe themselves to be superior and different from others.
• Treat farmers with respect.
• Believe they have all the answers, and others have nothing relevant to contribute.
• Try to learn from farmers, as well as from their colleagues (openness of spirit).
• Are authoritarian in style, telling others what to do; feel threatened when others participate.
• Strive to encourage cooperation (democratic attitude).
• Have no regard for the way of life, experiences, or values of rural people. Pontificate on everything – even subjects of which they have no knowledge.
• Work alongside farmers, respectfully supporting them; provide their own input when necessary, or when asked to do so.
• Only venture into the field when they have no choice; prefer the company of their “peers”.
• Enjoy being in the field where the actual work takes place; enjoy the company of farmers.
• Are “development tourists” who never reach the poorest and most isolated; recoil at the idea of walking or getting their shoes dirty.
• Eschew the bias of “window-dressing” projects; try to reach all areas and people, including the poorest and most isolated.
• Only think in terms of preestablished objectives; have no sense of commitment to the people involved; are content to “pad” their achievements with reports intended to pacify their superiors and funding agencies.
• Understand that development is a process; focus on the impact of their work and the qualitative progress it makes possible.
CHANGES OF ATTITUDE

10 INTRODUCTION
“Elitist professionals” “Development facilitators”
• Feel superior and do not try to hide it. • Feel they have much to learn; are not invested in questions of status, prestige, and experience.
• Display an attitude that says “They should learn from me.”
• Are convinced that learning is a two-way process.
• Do not request or facilitate input from others; are afraid to betray their ignorance by asking obvious questions.
• Learn from rural people with interest and enthusiasm; recognize and respect their knowledge.
• Make value judgments, unaware of the prejudices underlying their terms (modern/traditional, advanced/backward, hard-working/lazy, etc.).
• Adapt their knowledge and values; avoid judging others, and seek to understand them.
• Wound sensibilities and fail to establish trust.
• Are sensitive to the mood of others (boredom, anxiety, anger, etc.); take others into account and try to create something of interest to them.
• Act as if they are the only ones to whom respect is owed; display an intimidating attitude.
• Respect the customs and rules of courtesy of rural people; make everyone feel important.
• Have no interest in, or regard for, the involvement of others.
• Create an atmosphere of trust in which everyone can speak freely. Understand that everyone has something to say; include those who speak less – particularly women.
• Monopolize discussions; use closed or “leading” questions; interrupt others.
• Pay close attention and allow information to flow; never interrupt others.
• Extract information without thanking their sources or clarifying how it will be used; do not return data.
• Credit all participants for their contributions; clearly explain the use to which information will be put.
• Remain at a distance, interacting with others from a position of power; make promises rather than commitments.
• Are always willing to be held accountable and request approval from others.
SHARING
11INTRODUCTION
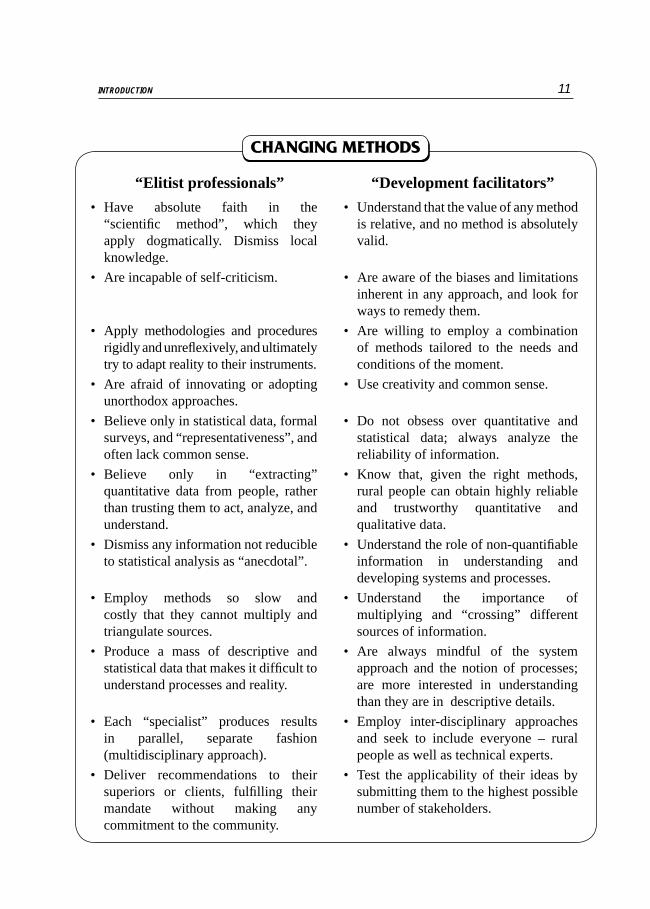
“Elitist professionals” “Development facilitators”
• Have absolute faith in the “scientific method”, which they apply dogmatically. Dismiss local knowledge.
• Understand that the value of any method is relative, and no method is absolutely valid.
• Are incapable of self-criticism. • Are aware of the biases and limitations inherent in any approach, and look for ways to remedy them.
• Apply methodologies and procedures rigidly and unreflexively, and ultimately try to adapt reality to their instruments.
• Are willing to employ a combination of methods tailored to the needs and conditions of the moment.
• Are afraid of innovating or adopting unorthodox approaches.
• Use creativity and common sense.
• Believe only in statistical data, formal surveys, and “representativeness”, and often lack common sense.
• Do not obsess over quantitative and statistical data; always analyze the reliability of information.
• Believe only in “extracting” quantitative data from people, rather than trusting them to act, analyze, and understand.
• Know that, given the right methods, rural people can obtain highly reliable and trustworthy quantitative and qualitative data.
• Dismiss any information not reducible to statistical analysis as “anecdotal”.
• Understand the role of non-quantifiableinformation in understanding and developing systems and processes.
• Employ methods so slow and costly that they cannot multiply and triangulate sources.
• Understand the importance of multiplying and “crossing” different sources of information.
• Produce a mass of descriptive and statistical data that makes it difficult to understand processes and reality.
• Are always mindful of the system approach and the notion of processes; are more interested in understanding than they are in descriptive details.
• Each “specialist” produces results in parallel, separate fashion (multidisciplinary approach).
• Employ inter-disciplinary approaches and seek to include everyone – rural people as well as technical experts.
• Deliver recommendations to their superiors or clients, fulfilling their mandate without making any commitment to the community.
• Test the applicability of their ideas by submitting them to the highest possible number of stakeholders.
CHANGING METHODS

12 INTRODUCTION
1.5 TYPES OF PARTICIPATORY TOOLS
The tools in this book should be viewed as supplementary to one another; no one tool is adequate, in and of itself, to ensure participation. They should be combined according to the needs and realities of each community and development institution.
Participatory tools can be divided into four main categories:
• Group dynamics • Visualization techniques• Interviewing and oral communication techniques• Field observation techniques
Group dynamics are essential to working with groups of people and ensuring their effective participation. They are applicable to all the group tools described in this book. Given the abundance of literature on the subject, they need not be described in detail here; we will simply list some basic guidelines.
Almost all of the tools described in this book rely on visualization techniques, which employ visual illustrations to ensure the inclusion of people with varying academic backgrounds and types of education, making it easier to systematize knowledge and achieve consensus.
The visualization techniques described in this book can be divided into several categories:
- Matrices are tables in which information and ideas are organized logically, in order to compare different views (classification and prioritization matrices) or rank them in order of importance (planning matrices, among others). Their applications are virtually endless. This book lists numerous examples which can be applied during the appraisal, assessment, planning, and follow-up stages.
- Maps and charts are simplified representations of reality. They can be put to many different uses during the appraisal and analysis stages, and often serve as the starting point of development processes.
- Flowcharts are diagrams which illustrate the relationships that exist between different elements (symbolized by arrows); they may include cause-and-effect relationships, sequences of events, etc.
- Timelines show the presence, absence, or intensity of certain phenomena over time.

13INTRODUCTION
Unlike traditional methods, participatory interviewing and oral communication techniques do not focus on statistics, but rather on ensuring that information is triangulated from points of view that represent different members of the community (selection of key respondents, focus groups). They also seek to determine peoples’ views regarding their problems (semi-structured interviews). These techniques can be applied at any point during the process, and are therefore described separately. It should be noted, however, that they can be used in an integrated manner.
- Field observation techniques are designed to gather information in the field,from a group perspective. Visualization techniques are used to analyze the data obtained.
1.6 PARTICIPATORY TOOLS IN THE DEVELOPMENT PROCESS
Participatory tools may be used during every phase of a development process or project:
- During the appraisal phase, where they are particularly useful for determining, with the project’s beneficiaries, what problems people face and how they will be addressed;
- During the problem-assessment and solution phase – in other words, during the project planning stage – they can be used to ensure that everyone has access to the process;
- During the implementation phase, including the follow-up stage and the adjustment assessments which may be required at that time;
- During the evaluation phase.
The appraisal phase has traditionally been viewed as a series of initial studies, which result in volumes of reports that are used as reference points for the project. These reports are not open to the project’s “beneficiaries”, and often become irrelevant, in terms of implementation, after a certain amount of time. The participatory method approaches the initial appraisal stage as an awareness-raising and mobilization tool in and of itself; it is a part of the project’s actions, and cannot be separated from them. Thus, it creates higher expectations than a traditional appraisal. Participatory appraisal is also an iterative process; rather than ending where implementation begins, it continues to take shape and adjust throughout entire process, in response to people’s needs and those of the project. Appraisals can be either broad or thematic (focused on a single issue).

14 INTRODUCTION
Any participatory exercise – be it at the appraisal, planning, follow-up, or evaluation stage – must follow certain basic methodological steps if it is to be designed correctly. Following is a list of suggested logical steps.
Define the objectives of the exercise (Why are we doing it?)
Specify the area and participating group (Who are we working with?)
Review existing information (What do we know about the subject?)
Select a team of facilitators (Who is going to work with the participants?)
Prepare a list of expected outputs (What are our expectations?)
Select the tools to be used (How are we going to do it?)
Set dates and assign responsibilities (When? Who does what?)
The process of preparing such an exercise must, of course, be participatory. The community and all of the institutions involved must be included.
The selection of facilitators is key to the success of participatory exercises. Ideally, facilitation teams should be small (hopefully no more than two or three people, and there should never be more professionals on the team than members of the community). Their members should have some degree of experience and inclination toward dialogue. The team should include at least two well-known member of the community, and both sexes should be represented whenever gender issues are involved. People with different specialties should be included if a broad appraisal is to be performed. No team member should have a personal stake in the exercise, nor should any political or financial relationships be involved, in order to avoid biasing the exercise.
1.7 HOW DO WE SELECT THE RIGHT TOOLS?
A “toolbox” differs from a “methodology” in that it does not involve a rigid plan which must be followed step by step. Tools are selected based on a number of criteria:
• What is the focus of this institution or project?
• What stage of the process is the project currently in?
• Which aspects need to be evaluated?

15INTRODUCTION
• What is the extent of the community’s organization or mobilization around the project?
• Who are the participants, and how are they going to come together?
• Can all of the participants read and write?
Tools can be classified in three main categories:
• Participatory appraisal tools (identifying problems and causes)- General interviewing and oral communication tools- General characteristics of the community- Characteristics of the production system- Natural resource management- Gender issues- Extension and communication issues
• Tools to analyze and identify possible solutions
• Tools to plan actions
• Follow-up and evaluation tools
The flowchart below explains how the proper tools might be selected, according to the current needs and level of progress of the project at hand. If the project has yet to be determined, the participatory process can be implemented in its entirety, beginning with the initial appraisal stages. If it is already underway, the questions listed in the flowchart must be answered, in order to determine which tools may be of use. It should be remembered that participatory processes are iterative; the fact that an appraisal has already taken place does not mean it is not useful to reexamine some of the issues using participatory tools. Such tools can help to adjust activities at any stage in the process.

16 INTRODUCTION
NEW METHODS
FLOWCHART OF PARTICIPATORY TOOLS IN THE PROJECT DESIGN, IMPLEMENTATION, AND EVALUATION CYCLE
Are we familiar with the basic dialogue and group-dynamic methods?
Semi-structured dialogueDialogue with key respondentsDialogue with household membersDialogue with household membersEstablishment of focus groups Brainstorming sessionsParticipatory observation
NO YES
Has the target population been identified?
Group profileLivelihoodsOrganizational/institutional analysis (Venn diagram)Social and household income mapIncome classification
NO YES
Have the main characteristics of the (rural-urban) production and subsistence system been identified?
Social thematic mapsService and opportunity mapsTimelineTrend lineCommunity history chartSeasonal analysis
NO YES
Phase Participatory tools

17INTRODUCTION
Have the natural resource management issues been identified?
Natural resource and land use mapTransect walk and diagrammingWatershed diagrammingHistorical diagramming and mappingHistorical transect and mappingResource evaluation matrixMap of access to natural resourcesDecision-making analysis matrixConflict-analysis matrixLocal soil classificationLocal tree use (agroforestry inventory)Resource use problem census (based on transect)
NO YES
Have the agricultural production system issues been identified?
Farm classification (based on access to resources or recommendation domains as perceived by farmers)Farm mappingSystemic farm modelTransect walk and plot diagrammingDescription of management practicesFarm problem census (based on map and model)Seasonal crop calendarsCrop biographiesFlowchart of activitiesCrop budgetsHistorical graphing of production systemCrop / seasonal activity problem census Crop biographyAgronomic preference matrixEx ante agronomic evaluation matrix
NO YES

18 INTRODUCTION
Have the animal production system issues been identified?
Livestock inventorySeasonal animal production calendarsForage mapCow interviewAssessment of veterinary problems
NO YES
Have the gender issues been identified?
Gender-based farm mapUse of timeGender-based seasonal calendar Mobility mapBenefit analysis
NO YES
Have the extension and technical assistance services issues been identified?
Map of exchangesCommunication/exchange problem censusExtension/technical assistance priority matrix
NO YES
Have actions been planned?
Community planning mapFarm planning mapFarm planObjectives matrix (logical framework)Matrix of needs and available resourcesAction plan matrixResponsibility matrix
NO YES
Have problems and possible solutions been analyzed and prioritized?
Problem tree: cause-and-effect diagramIdentification of local or imported solutionsSelf-assessment and field analysis of local solutionsSolution evaluation matrixSWOT analysisOption selection: single optionOption selection: multiple optionsVisualized questionnaireAnalysis of pros and cons: “yes sir, no sir” exerciseImpact assessment
NO YES
19INTRODUCTION
Have follow-up and evaluation indicators and mechanisms been established?
Follow-up and evaluation indicator matrixFollow-up indicator matrixParticipatory follow-up form (task completion)Participatory follow-up forms (quantitative indicators)Participatory follow-up forms (quantitative indicators)Impact assessment indicator matrix
NO YES
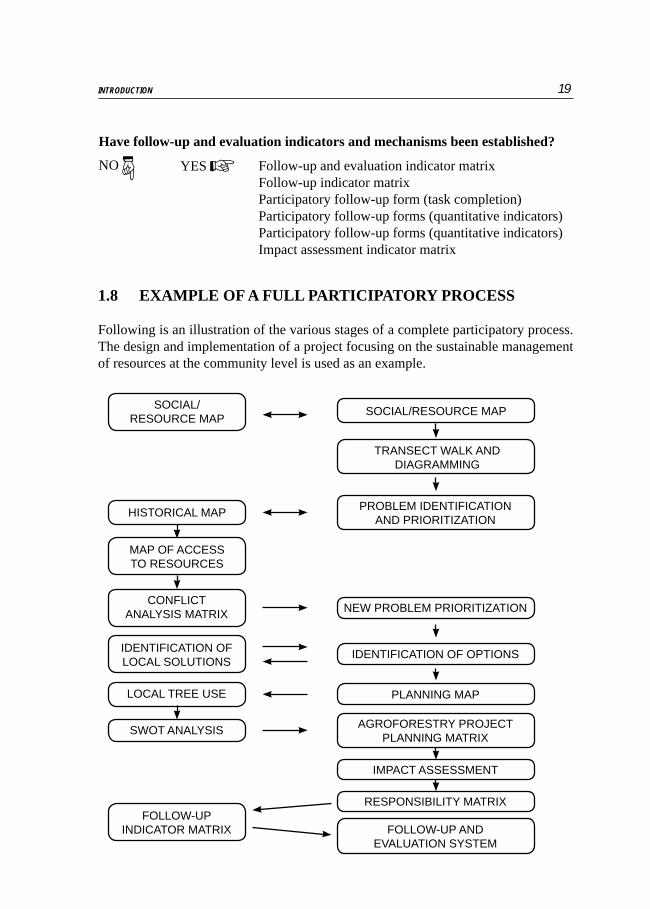
1.8 EXAMPLE OF A FULL PARTICIPATORY PROCESS
Following is an illustration of the various stages of a complete participatory process. The design and implementation of a project focusing on the sustainable management of resources at the community level is used as an example.
SOCIAL/RESOURCE MAP
TRANSECT WALK AND DIAGRAMMING
PROBLEM IDENTIFICATION AND PRIORITIZATION
FOLLOW-UP AND EVALUATION SYSTEM
NEW PROBLEM PRIORITIZATION
IMPACT ASSESSMENT
RESPONSIBILITY MATRIX
SOCIAL/RESOURCE MAP
HISTORICAL MAP
MAP OF ACCESS TO RESOURCES
CONFLICT ANALYSIS MATRIX
FOLLOW-UP INDICATOR MATRIX
AGROFORESTRY PROJECT PLANNING MATRIX
SWOT ANALYSIS
IDENTIFICATION OF OPTIONSIDENTIFICATION OF LOCAL SOLUTIONS
PLANNING MAPLOCAL TREE USE
20 INTRODUCTION
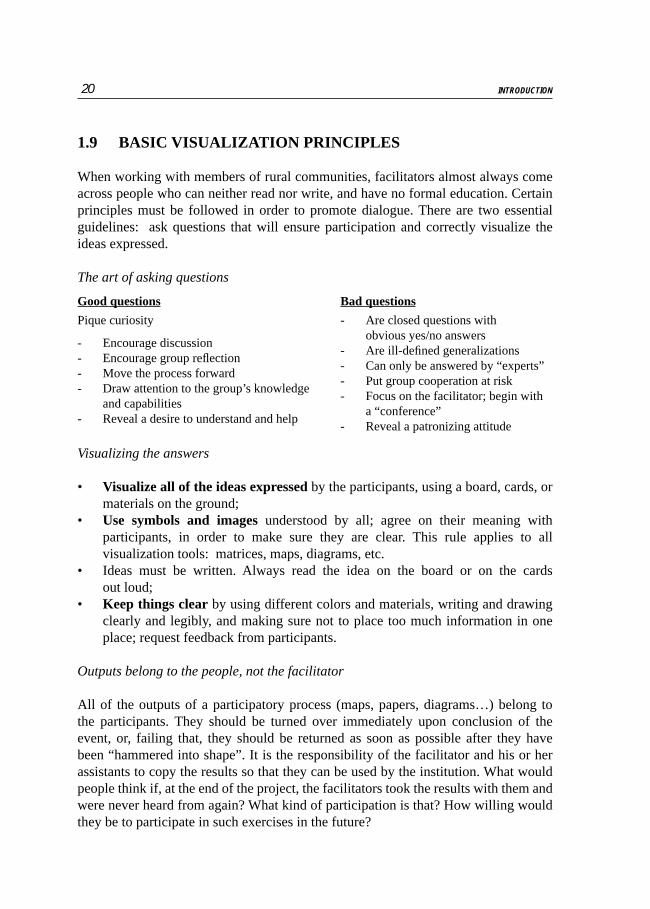
1.9 BASIC VISUALIZATION PRINCIPLES
When working with members of rural communities, facilitators almost always come across people who can neither read nor write, and have no formal education. Certain principles must be followed in order to promote dialogue. There are two essential guidelines: ask questions that will ensure participation and correctly visualize the ideas expressed.
The art of asking questions
Good questions
Pique curiosity
- Encourage discussion- Encourage group reflection- Move the process forward- Draw attention to the group’s knowledge
and capabilities- Reveal a desire to understand and help
Bad questions
- Are closed questions with obvious yes/no answers
- Are ill-defined generalizations- Can only be answered by “experts”- Put group cooperation at risk- Focus on the facilitator; begin with
a “conference”- Reveal a patronizing attitude
Visualizing the answers
• Visualize all of the ideas expressed by the participants, using a board, cards, or materials on the ground;
• Use symbols and images understood by all; agree on their meaning with participants, in order to make sure they are clear. This rule applies to all visualization tools: matrices, maps, diagrams, etc.
• Ideas must be written. Always read the idea on the board or on the cards out loud;
• Keep things clear by using different colors and materials, writing and drawing clearly and legibly, and making sure not to place too much information in one place; request feedback from participants.
Outputs belong to the people, not the facilitator
All of the outputs of a participatory process (maps, papers, diagrams…) belong to the participants. They should be turned over immediately upon conclusion of the event, or, failing that, they should be returned as soon as possible after they have been “hammered into shape”. It is the responsibility of the facilitator and his or her assistants to copy the results so that they can be used by the institution. What would people think if, at the end of the project, the facilitators took the results with them and were never heard from again? What kind of participation is that? How willing would they be to participate in such exercises in the future?

21INTRODUCTION
1.10 COMMON MISTAKES IN PARTICIPATORY WORKSHOPS
Participatory processes are not an end in themselves; they must serve the development objectives being pursued. Following is a list of some of the most common mistakes that can reduce the positive impact of such workshops:
• Improvisation – the process is not properly planned and explained to people, and therefore “falls short”. Methods should be selected with a clear objective in mind.
• Shallowness – few data are collected, and methods are not checked against one another to study and “triangulate” sources.
• Hastiness – hasty conclusions are drawn, and unclear or unexplained concepts are not properly addressed.
• Exclusion – certain members of the community – usually the most marginalized – are left out of the process.
• Imposition – at some point during the process, the proper role of the facilitator is forgotten, and ideas are imposed; there is no more listening and learning.
• Manipulation – the participatory process is carried out only to satisfy the needs of professionals, or of certain community leaders who manipulate the process to exalt “their” proposals.
• Lack of commitment – confusion arises if the participatory process is not the result of a clear initial commitment to people, in terms of objectives, expected results, and the turning over of project outputs to the community.
• Disappointment – a participatory process awakens expectations in people. If the project is not followed up as expected, information will have been “extracted” once again, without any gain for the community, and the credibility of the method itself will be compromised.
Following is a list of questions designed to determine “how things are going”.
How is the process coming along?
1. Is there a better, more reliable way to do what we’re doing?2. Is the information we’re producing truly useful? Does it meet our objectives?3. Are people participating enough? Could we involve more people?4. Have we gathered enough different viewpoints on the subject?5. Are we “triangulating” several methods and sources before reaching conclusions?6. Are we adapting along the way and learning new things?7. Are we taking advantage of the full potential of participatory tools?8. Are we spending enough time with people?9. Are we packaging information in a manner that is useful and understandable?10. Are there biases in our results? If so, did they arise from the participants or from the facilitators?11. Are we evaluating the exercise alongside the participants?12. Do people clearly understand how the exercise is to be followed up?

22 INTRODUCTION
Traditional appraisal
Participatory appraisal
Can you find 7 differences between each picture? What mistakes are being made by the facilitator performing the traditional appraisal?
1. The professional’s physical posture is not suited to dialogue. 2. The professional’s vehicle is indicative of social prestige. 3. The written questionnaire reduces the chance of dialogue. 4. The woman and children are excluded. 5. There is no visualization of issues. 6. There is no group work. 7. All of the initiative rests with the professional.

23
2
GENERALLY APPLICABLE DIALOGUE, OBSERVATION,
AND GROUP-DYNAMIC TECHNIQUES


25GENERALLY APPLICABLE DIALOGUE, OBSERVATION, AND GROUP-DYNAMIC TECHNIQUES
2.1 Semi-structured dialogue
Exercise objective: To collect general or specific information by talking to individuals (key respondents), families (representative families), or focus groups. Semi-structured dialogue seeks to avoid some of the negative effects of formal questionnaires, such as closed issues (which leave no room for other topics), lack of dialogue, and failure to connect with people’s perceptions. Its applications are many – general social studies, specific studies, case studies, verification of data from other sources, etc.
A dialogue differs from an interview in that it seeks an exchange. Consequently, preestablished topics serve only as a general guide (interview guide).
Time required: This varies in each case.
Materials: A small notebook and pencil, if notes are to be taken.
Methodology:
Step 1: Develop an interview guide (10-15 topics at most for key respondents, 6-7 for groups) which clearly summarizes the basic issues to be researched. These topics (not questions) are to be used as a guide; interviewers should memorize them, not so they can recite them mechanically, but in order to remember the topics to be covered (if possible, they should write them down). The drafting of this guide should be a team effort involving all fieldsurveyors, community representatives, and supporting professionals.
The following steps should be followed when drafting the interview guide:
• determine what the learning needs and objectives are (what do we want to know?);
• draw up a list of issues to be addressed in order to meet these needs;• discuss the problems surrounding each issue;• divide issues into sub-topics if necessary;• discuss who the target of the exercise is, in order to select the topics;• discuss and select the most appropriate method for receiving adequate information
on each topic.
The interview guide is not a rigid manual. It should be constantly revised and adapted, depending on the results of the interviews. Interviewers should not follow the guide mechanically; rather, they should allow dialogue to flow freely, addressing any new topic that may emerge, without losing sight of the objective.

26 GENERALLY APPLICABLE DIALOGUE, OBSERVATION, AND GROUP-DYNAMIC TECHNIQUES
Step 2: Establish a selection process for the people and/or groups to be interviewed.
Selection is very important. In order to avoid bias wherever possible, the following guide may be useful:
Most common biases in the selection of survey respondents:
• access bias – limiting interviews to the most easily accessible individuals (e.g., those living close to the highway);
• hierarchical bias – speaking only to leaders and those who hold positions of power within the community;
• gender bias – settling for the non-participation of women;• diversity bias – failing to take into account the various different groups that exist
within the community, to make sure they are represented;• seasonal bias – at certain times of the year, certain categories of people are
unavailable (migrant workers,…);• working hours bias – many people in the community are unavailable during a
professional’s working days and working hours;• project bias – limiting interviews to people who are already involved with the
project and the institution.
Step 3: Interviews.
Interview guidelines for facilitators:
• Put people at ease; minimize personal distance; do not appear too official, and do not show displeasure or contempt at certain answers;
• Stay focused on what people are saying; look them in the face; do not show fatigue or boredom;
• Do not interrupt or abruptly change the subject;• Do not use the guide dogmatically; use interesting new topics as they come along;
follow subjects through to their final conclusion;• Use only open, clear questions (not leading or yes/no questions) – preferably
ones which start with “What…”, “Why…”, “How…”, “When…”, “Who…”, “Where…”;
• Encourage people to elaborate, using questions such as “What do you mean by that?”, “Tell me more about this..”, etc.;
• Do not ask overly difficult or threatening questions.

27GENERALLY APPLICABLE DIALOGUE, OBSERVATION, AND GROUP-DYNAMIC TECHNIQUES
Step 4: Analyze results.
Notes may or may not be taken during the interview, depending on each situation; if there are two interviewers, one of them may take notes. In order to keep things spontaneous, it is best if notes are committed to paper immediately following the interview. It is important to go over results at the end of the session.
Guidelines for evaluating answers:
• Does the interviewee have direct experience with the issue being discussed? Can he or she credibly address the topic?
• Does the interviewee take time to think before answering, or are his/her answers simply what he/she believes we want to hear?
• Is it possible that the interviewee may not be telling the truth? Are there people present who may influence his or her answers?
• Classify answers as follows: 1. Facts 2. Opinions 3. Rumors
Step 5: The information obtained must be compared with other sources – other interviews and the results of other exercises on the same subject. This is known as triangulation.
1. Introduction• Introduce interviewers and
institution• Why we’re here• Explain methodology
2. General information• Family size, number of people
working on farm• Date of arrival in community• Sources of income• Farm ownership status and size
3. Identification of production systems• System components
4. Characterization of agricultural sub-system• Main crops• Production and marketing problems
• Labor• Income, gender issues• Compare with situation a few
years ago
5. Characterization of animal production sub-system• Main types of production• Production and marketing
problems• Labor• Income, gender issues• Compare with situation a few
years ago
6. Additional comments
7. Conclusion• What we’re going to do next• Thanks
Sample interview guide

28 GENERALLY APPLICABLE DIALOGUE, OBSERVATION, AND GROUP-DYNAMIC TECHNIQUES
2.2 Dialogue with key respondents
Exercise objective: While this is not a participatory method per se, it may be indispensable when preparing group exercises with the community, before intervention, and when completing other exercises or verifying certain data. Discussing the community with well-informed people is a way of rapidly obtaining relevant information to guide the project. Proper selection of respondents is essential to ensuring the veracity of information.
Some of its applications:• To understand the basic reasons underlying a certain type of behavior;• When hypotheses or proposals need to be tested quickly to determine whether
they match reality and people’s needs;• To obtain a general overview of the community’s socio-economic situation and
production conditions;• To evaluate the feasibility of practical suggestions.
Time required: This varies in each case; no more than 2 consecutive hours with any one person.
Materials: See semi-structured dialogue.
Methodology:
Step 1: Develop an interview guide (10-15 topics max.), using the semi-structured dialogue methodology.
Step 2: Select key respondents. They must represent different categories (social, gender...,) within the target population. The results of exercises such as the social map or the income classification can be used to make sure this is so. They should also be selected based on the dialogue subject; respondents should represent every category involved in the issue being studied (in the case of natural resources management, for example, all of the stakeholders involved in that issue – men, women, farmers, ranchers, businesspeople, etc. – should be included).
Step 3: Introduction: the objective of the interview must be clearly explained to every respondent before requesting his or her consent. The purpose of the interview should be explained, as should the reason the respondent was selected; the institution responsible should be identified, the use given to the data should be disclosed, and the actions expected should be specified.Transparency is important, since respondents will be talking with other members of the community, and confusion and erroneous expectations should be avoided.
Step 4: Interview – see semi-structured dialogue.
Step 5: The information obtained must be compared with other sources – other interviews and the results of other exercises on the same subject.

29GENERALLY APPLICABLE DIALOGUE, OBSERVATION, AND GROUP-DYNAMIC TECHNIQUES
2.3 Dialogue with household members
Exercise objective: To rapidly obtain relevant information, working with all active family members. This is a group application of the semi-structured dialogue technique.
Some of its applications:
• When livelihoods and problems need to be studied from the perspective of the entire family;
• When the relevance of information on a given topic must be determined with the participation of all the members of the family.
Talking to the entire family provides a much clearer perspective than would talking only to the head of household.
Time required: This varies in each case; the participants should not be pushed too hard.
Materials: See semi-structured dialogue.
Methodology:
Step 1: Develop an interview guide (6-7 topics max.), using the semi-structured dialogue methodology.
Step 2: Select the family to be interviewed. As with key respondents, the families must represent the different categories that exist within the community. The information used to select them may come, for example, from the social map. The help of the local authorities or community organizations should be enlisted for this purpose.
Step 3: Introduction: the objective of the interview must be clearly explained. The purpose of the interview should be explained, as should the reason the respondents were selected; the institution responsible should be identified,the use given to the data should be disclosed, and the actions expected should be specified. The interview should be conducted at a convenient time for the participants, and all active household members should be present (father, mother, working children).
Step 4: Interview – see semi-structured dialogue. Care should be taken to “triangulate” the answers of different household members (the head of household must not monopolize the interview); this can be accomplished by asking open questions, such as “Could you tell me more about this?”
Step 5: The information obtained must be compared with other sources – other interviews and the results of other exercises on the same subject.

30 GENERALLY APPLICABLE DIALOGUE, OBSERVATION, AND GROUP-DYNAMIC TECHNIQUES
2.4 Dialogue with focus groups
Exercise objective: To rapidly obtain relevant information, working with a small group of people directly involved in the issue at hand. This is a group application of the semi-structured dialogue technique.
Some of its applications:
• When a specific category or group of people must be consulted (e.g., women, artisans, leaders, experts on the issue, etc.);
• When the relevance of the information on a given issue must be verified, using a group dynamic which allows people to participate more freely.
Time required: This varies in each case; the participants should not be pushed too hard.
Materials: Blackboard, newsprint, markers, cards.
Methodology:
Step 1: Develop an interview guide (6-7 topics max.), using the semi-structured dialogue methodology.
Step 2: Select group members (see section on focus group creation).
Step 3: Introduction: the objective of the interview must be clearly explained to every respondent before requesting his or her consent. The purpose of the interview should be explained, as should the reason the respondent was selected; the institution responsible should be identified, the use given to the data should be disclosed, and the actions expected should be specified.Transparency is important, since respondents will be talking with other members of the community, and confusion and erroneous expectations should be avoided.
Step 4: Interview – see semi-structured dialogue. Answers may be written on the board or on cards, to encourage discussion.
Step 5: The information obtained must be compared with other sources – other interviews and the results of other exercises on the same subject.

31GENERALLY APPLICABLE DIALOGUE, OBSERVATION, AND GROUP-DYNAMIC TECHNIQUES
2.5 Establishment of working groups (“focus groups”)
Exercise objective: To organize people in the community who share common interests/circumstances, in order to address a specific issue among the problems/alternatives identified by the community.
Focus groups are particularly useful in three situations:
• It is impossible to address every single issue in depth in a large group;• Participants should be split into groups because they have very different
perspectives on and relationships with the problems being addressed, and these views should not be overlooked (men vs. women, youth, etc.).
• Some individuals are particularly well informed on and/or interested in specificissues which the group as a whole either cannot or will not address.
Time required: This exercise may be conducted at any point during the appraisal.
Materials: Applicable to all exercises.
Methodology:
Step 1: Preparation. The topic to be addressed must be clear, since it will determine who participates. It may be established beforehand, or may come up during a group exercise.
Step 2: Selection of participants. The focus group should be homogenous; participants should be committed to the issue being addressed, or share common characteristics, or be local experts on the subject.
Participants may be selected on the basis of information from key respondents or other exercises (the social map, for example). Groups may include 4 to 12 people.

32
ALL IDEAS ARE WRITTEN ON CARDSAND TAPED TO THE BOARD
COMMUNITY PROBLEMS
PROBLEMS
LACK OF WATER
LACK OF WOOD
LACK OF WATER, WOOD, NO
CREDIT
AUTHORITIES DON’T COOPERATE LACK OF TRAINING SERVICES
BRAINSTORMING SESSION
YES: NO:
NO:YES: LOW PRICE OF CORN
ONLY ONE IDEA PER CARD
3 LINES, TOPS – MUST BE READABLE AT A DISTANCE
TECHNICAL ORGANIZA-TIONAL FINANCIAL EDUCATIONAL ENVIRONMENTAL
CARDS ARE ORGANIZED
BY TOPIC

33GENERALLY APPLICABLE DIALOGUE, OBSERVATION, AND GROUP-DYNAMIC TECHNIQUES
2.6 Brainstorming session
Exercise objective: To rapidly obtain relevant information, working with a large group, or with a small group of people directly involved in the issue at hand (a focus group). This exercise differs from interviewing in that it is open to more topics; the goal is to collect all of the ideas and perceptions expressed by people.
Some of its applications:• When an aspect of community life (e.g., the sources of income to which people
have access) must be researched for the first time;• When a general overview of people’s perceptions and reactions to a given proposal
or event is required.
Time required: This is a very quick exercise; it is usually used to introduce other exercises designed to analyze the results of a brainstorming session.
Materials: Blackboard, newsprint, markers, cards.
Methodology:
Step 1: Introduce the exercise with an open question on the issue. Write or visualize the question.
Step 2: The participants should visualize all of the ideas on the cards (one idea per card, 3 lines at most). Those with better writing skills should help the rest.
Step 3: The facilitator gathers the cards, mixes them, and tacks them onto the board, reading each one out loud. None may be discarded.
Step 4: Cards that express the same idea are grouped together. If the participants agree, repeats can be discarded, but it is best to replace them with a new card that expresses something agreed to by all. No cards may be removed from the board without the group’s agreement. Cards must be read out loud to participants whenever they are handled.
Step 5: Cards that express ideas directly related to one another are grouped together.
Step 6: The group decides what it is going to do with the results (depending on the circumstances in each case, the group may hold a new brainstorming session on one of the topics raised, or it may analyze, prioritize, etc.).

34 GENERALLY APPLICABLE DIALOGUE, OBSERVATION, AND GROUP-DYNAMIC TECHNIQUES
2.7 Participatory observation
Exercise objective: This is a method invented by anthropologists to “immerse” themselves for extended periods of time in the daily life of a community, in order to understand it better. Its purpose here is more realistic: to directly participate in some of the people’s activities, in order to better understand them and elicit more timely, spontaneous comments and information.
Some of its applications:• When people’s views, values, and rules of behavior must be researched; when
organizational and production practices must be understood in order to plan or adjust a project;
• When a project requires feedback concerning little-known aspects of community life, which are relevant to the implementation of actions (follow-up);
• Can be used alongside other methods to evaluate the impact of a project.
In a general sense, participatory observation is used to generate ideas and pointers on the direction of the project’s efforts with the community. It does not produce detailed or quantitative information.
Time required: Professionals must get personally involved with the people’s work – not necessarily for long periods of time, as anthropologists do (their commitments would make that impossible) – but on a regular basis. For example, instead of confiningthemselves to formal meetings, they could regularly participate in some community and/or farm activities long enough to earn people’s trust, without appearing to be “posers”.
Materials: Whatever the people use to work.
Methodology:
Step 1: Work with the project team to create a participatory observation “framework”. This will allow professionals and promoters to pool their observations and compare notes on what they have learned. The following guide should be used:
- What do we want to learn about?- Which activity and which people should we become involved with to find answers?- Develop “working hypotheses” on issues – in other words, answers that seem plausible and should be verified;- Agree on the role of the professional/promoter.
Step 2: Involve the people of the community. Their involvement may be combined with semi-structured interview techniques.
Step 3: Systematize observations, comparing them with the framework and the working hypotheses. Gather the “observers” and discuss lessons learned. Make follow-up commitments, and keep them!

35
3
PARTICIPATORY APPRAISAL:
GENERAL COMMUNITY ISSUES
SOCIAL ISSUES
36GROUP PROFILE
PRODUCTION
OTHER INCOME
LAND TENURE
CORN
LIVESTOCK
ORANGES
FARM WORK
OWNERS
CASSAVA
POULTRY
CARPENTRY
CRAFTS
SHARECROPPERS
BEANS
SWINE
WOOD
COMMERCE
TENANTS

37PARTICIPATORY APPRAISAL: GENERAL COMMUNITY ISSUES / SOCIAL ISSUES
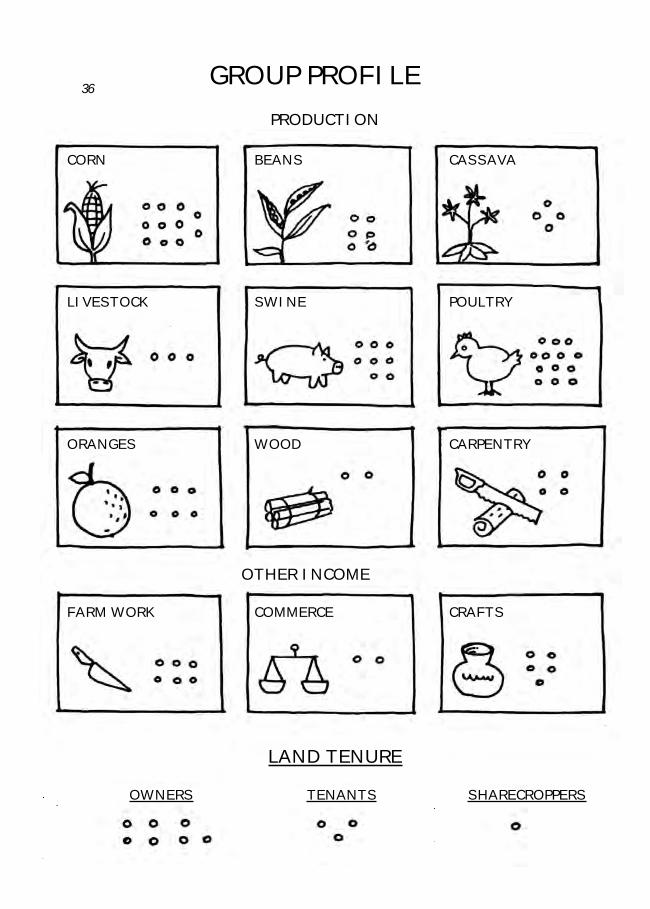
3.1 Group profile
Exercise objective: To jointly determine the characteristics of the participants vis-à-vis the activities being studied. This is a fast, convenient way of acquiring a general understanding of socio-economic, qualitative, and quantitative characteristics. All participants can be included in this exercise, which can be conducted as a fun game.
Time required: Approximately two hours.
Materials: Newsprint, construction-paper cards, glue or tape, markers (in different colors, if distinctions are to be made between participants – e.g., between men and women).
Methodology: The method is very flexible, and can be adapted to different objectives (collection of general information or specific appraisals).
Step 1: Explain the objective of the exercise (e.g., “In order to improve our work with the community, we want more information on your main activities.”)and the methodology employed.
Step 2: Start with basic information – for example, “What are the community’s main activities/crops?” Using cards, the facilitator may either write each item out or use symbols understood by all, depending on the reading skills of the participants. Once the first issue has been covered, the cards are taped to the board.
Step 3: Repeat the exercise to collect data on other relevant topics, such as land tenure, use of inputs, credit, etc. If the participants grow uncooperative because sensitive issues are being addressed, do not put those issues up on the board.
Step 4: Once the group feels it has covered all relevant topics, conduct the census. Each participant should draw an x or a small circle on each card to describe the activities he or she performs, or highlight relevant characteristics in each case. Colored markers are useful for this part of the exercise. Participants should not be apprehensive about the census, since it is anonymous.
Step 5: Discuss the results with the participants – e.g., explain obvious discrepancies, unusual activities, etc. If possible, discuss gender issues as well.
Step 6: Ask the participants what they think of the exercise. Write the results down and turn them over to the group.
NOTE: The results should serve mainly as a guide for a more detailed future analysis.

38 PARTICIPATORY APPRAISAL: GENERAL COMMUNITY ISSUES / SOCIAL ISSUES
LIVELIHOODS
HOW DO WE MAKE A LIVING?
THOSE OF US WHO OWN LAND
IRRIGATIONFARMING
STAPLEGRAINS
FACTORYWORK
WAGE FARM LABOR
STAPLEGRAINS
MILK CARPENTRY CRAFTS
GOATS
VEGETABLES
MILK
GOATS
IRRIGATED NON-IRRIGATED
THOSE OF US WHO DO NOT OWN LAND
LIVE OFF OF: LIVE OFF OF: LIVE OFF OF: LIVE OFF OF:
39PARTICIPATORY APPRAISAL: GENERAL COMMUNITY ISSUES / SOCIAL ISSUES
3.2 Livelihoods
Exercise objective: To understand income levels within the community, as well as the conditions in which people have access to sources of income. This information should be based on the perceptions of the people themselves. This is a very useful tool for understanding the general development situation of a community, as well as its position within the social structure.
Time required: 1-2 hours, depending on the complexity of the issue and the number of participants.
Materials: Blackboard and chalk, or newsprint and markers; cards.
Methodology:
Step 1: Gather a group of respondents that is representative of the community, or, if feasible, a large group of people. Explain the objective of the exercise.
Step 2: Ask the participants to name all the sources of income available to the members of the community. Encourage them to hold a “brainstorm” as thoroughly as possible. Record the income sources on cards or on the board. If some of the participants are illiterate, agree on symbols to represent each source of income.
Step 3: Begin classifying income sources on the basis of questions regarding access: Do all members of the community have access to this income? If not, who does? Who does not have access, and why? Use different marker colors for each set of access conditions, and group income sources as appropriate under each set of conditions.
Step 4: After the access conditions have been established, rank them in order of importance, so that the cards can be organized in flow-chart form. Discuss the results with the participants.
NOTE: This exercise can be used to analyze income sources (through a preference matrix) and develop a census (i.e. “group profile” or “social map”).
40 PARTICIPATORY APPRAISAL: GENERAL COMMUNITY ISSUES / SOCIAL ISSUES
SOCIAL ORGANIZATION(VENN DIAGRAM)
MAYOR’SOFFICE
POLITICIANS
FEDERATIONFORESTRY
NGOFOUNDATION
FARMERSASSOCIATION
Not organized
HEALTHCARE
SERVICESMOTHERS
CLUB
YOUTHCLUB
CATHOLICYOUTHGROUP
EXTENSIONSERVICE
PARKSERVICE
C O M M U N I T Y
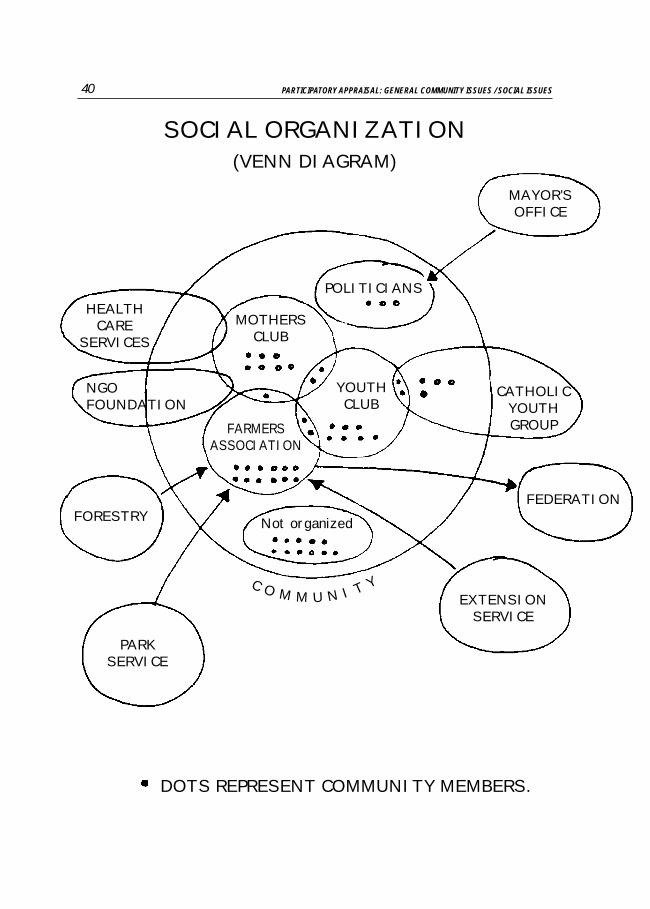
DOTS REPRESENT COMMUNITY MEMBERS.

41PARTICIPATORY APPRAISAL: GENERAL COMMUNITY ISSUES / SOCIAL ISSUES
3.3 Organizational/institutional analysis: Venn diagram
Exercise objective: To learn about the organizations and groups that are active in the community, determine how they are perceived by their members, and understand how they interact with one another. This may be of use when assigning responsibilities during the planning stage.
Time required: 1-2 hours.
Materials: Blackboard, or newsprint and markers. Circles of paper of different sizes (at least 20, in 3 different sizes).
Methodology:
The session should include people who are representative of different sectors in the community. It may be advisable to have the participants split into working groups.
Step 1: Begin a discussion on institutional issues. Submit the diagram as a visualization tool.
Step 2: Ask the participants to name all the organizations and institutions that have an impact on community life. The discussion could begin with a question: Which institution is most important for the development of the community? Let the participants decide.
Step 3: Write the names of the “most important” organizations inside the largest circles (1 per circle), and put them up on the board. Do the same with the other institutions; rank them in order of importance, using smaller and smaller circles.
Step 4: Ask the participants what relationships exist between these organizations. Arrange the circles of paper on the board so that related organizations are touching one another. If this is too complicated, use arrows to symbolize the relationships. This phase may require considerable discussion.
Step 5: The end result of the exercise is a diagram of inter-institutional relationships in the community. If you have been working in sub-groups, compare the results obtained by each group.
NOTE: The value of this exercise lies in triangulation (comparing the perspectives of different stakeholders).

TYPE OF CREDIT
LOANS FROM OTHER COMMUNITY MEMBERSOR RELATIVES
MONEYLENDERS
BANK LOANS
CONSOLIDATED RESULTS
No. OF HOUSEHOLDS: 22LOANS FROM RELATIVES: 10
(TOTAL OF US$ 14,200)LOANS FROM
MONEYLENDERS: 13(TOTAL OF US$ 75,000)
BANK LOANS: 12(TOTAL OF US$ 36,000)
42SOCIAL MAP – CREDIT

43PARTICIPATORY APPRAISAL: GENERAL COMMUNITY ISSUES / SOCIAL ISSUES
3.4 Social map
Exercise objective: To develop a visual breakdown of household income in the community, in order to study income levels and differences in access to resources. This tool can determine whether certain members of the community have less access to resources than others – a question which is difficult to answer using formal questionnaires. This map can serve as a first step toward the development of an income classification of the community.
Time required: 2 hours.
Materials: Blackboard and chalk, or newsprint and colored markers.
Methodology:
The advantage of the map is that it allows respondents to remain anonymous as they identify households, thus making it possible to address sensitive issues. An open agenda of topics should be prepared. Separate maps can be drawn up to cover different issues (number of family members, land, livestock, infrastructure, etc.).
Step 1: Gather a small group of respondents who know the community well. Explain the objective of the exercise.
Step 2: Work with participants to develop a basic map of certain reference points (roads…). Include all of the houses in the community. Ask questions such as, “How many people are there in each household?”, “What do they do for a living?”, etc., progressing, if possible, toward more specific questions concerning relevant resources for a general classification of households. The classification criteria can be visually portrayed on the map.
Step 3: The same exercise should be conducted with several groups of respondents, in order to verify data.
NOTE: The social map, like the resource map, is a first step toward understanding the reality of a community. It should lay the groundwork for more precise analytical exercises.

44 PARTICIPATORY APPRAISAL: GENERAL COMMUNITY ISSUES / SOCIAL ISSUES
INCOME CLASSIFICATION
RICH
MIDDLE-CLASS
POOR
VERY POOR
- Owners of at least 2.8 ha. of irrigated land
- Businesspeople- People who work
outside the community
- Owners of fewer than 2.8 ha. and more than 0.7
- Factory workers- Wage workers
- Owners of less than 0.7 ha.; keep animals
- Wage workers
- Landless- Keep only pigs- Occasional
workers
CLASS CRITERIA No. OF HOUSEHOLDS
Show final results.
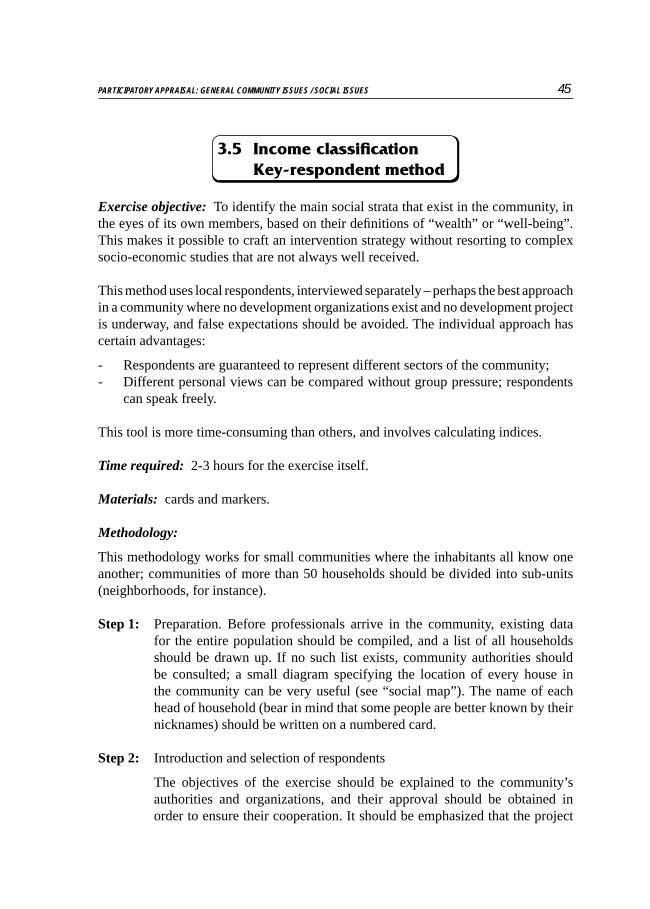
45PARTICIPATORY APPRAISAL: GENERAL COMMUNITY ISSUES / SOCIAL ISSUES
3.5 Income classification Key-respondent method
Exercise objective: To identify the main social strata that exist in the community, in the eyes of its own members, based on their definitions of “wealth” or “well-being”. This makes it possible to craft an intervention strategy without resorting to complex socio-economic studies that are not always well received.
This method uses local respondents, interviewed separately – perhaps the best approach in a community where no development organizations exist and no development project is underway, and false expectations should be avoided. The individual approach has certain advantages:
- Respondents are guaranteed to represent different sectors of the community;- Different personal views can be compared without group pressure; respondents
can speak freely.
This tool is more time-consuming than others, and involves calculating indices.
Time required: 2-3 hours for the exercise itself.
Materials: cards and markers.
Methodology:
This methodology works for small communities where the inhabitants all know one another; communities of more than 50 households should be divided into sub-units (neighborhoods, for instance).
Step 1: Preparation. Before professionals arrive in the community, existing data for the entire population should be compiled, and a list of all households should be drawn up. If no such list exists, community authorities should be consulted; a small diagram specifying the location of every house in the community can be very useful (see “social map”). The name of each head of household (bear in mind that some people are better known by their nicknames) should be written on a numbered card.
Step 2: Introduction and selection of respondents
The objectives of the exercise should be explained to the community’s authorities and organizations, and their approval should be obtained in order to ensure their cooperation. It should be emphasized that the project

46 PARTICIPATORY APPRAISAL: GENERAL COMMUNITY ISSUES / SOCIAL ISSUES
is not a “study” or an “assessment”; that help is needed in order to better understand people’s needs; and that information is required to determine whether different income levels and needs exist within the community.
Once the exercise has been explained and approved, a group of respondents should be selected. The group should represent several sectors of the community (social strata, authorities, genders, age groups). It should be made up of people who have been in the community for some time and know it well. They do not necessarily have to be literate. Individuals in positions of political or moral authority should be included, but they should be balanced by “ordinary” people from different social strata.
Step 3: Establishment of criteria
Terms for concepts such as “income level”, “household”, and “community” should be established, with the help of the respondents, in a manner which the community can understand. It is important that the exercise be understood by all. The local, most widely accepted terms for “wealth” or “well-being” should be used, in order to avoid the stigma or political connotations associated with “rich” or “poor”. There are several ways to accomplish this; one is to frame the issue in terms of needs – e.g., “those who can help others”, “those who can barely meet their own needs”, “those who cannot meet their needs on their own”.
Step 4: Classification
Each respondent is dealt with separately. He or she is given numbered cards labeled with the names of heads of household, and asked to divide them into classes, based on the criteria agreed. There should be at least 3 classes. If the respondent cannot read, the professional should read the cards to him/her, so that each one can be placed in the appropriate pile. The professional should never express an opinion on the respondent’s answers. If the respondent is unfamiliar with a household, that card should be set aside.
Once the classification is complete, the cards should be re-read, in case the respondent wishes to change his or her answers. The class number should be written on the back of each card (always start with the richest class at number 1).
Step 5: Discussion of criteria
After the classification has been completed, the respondent should be asked to comment on the criteria employed. He or she should also explain the
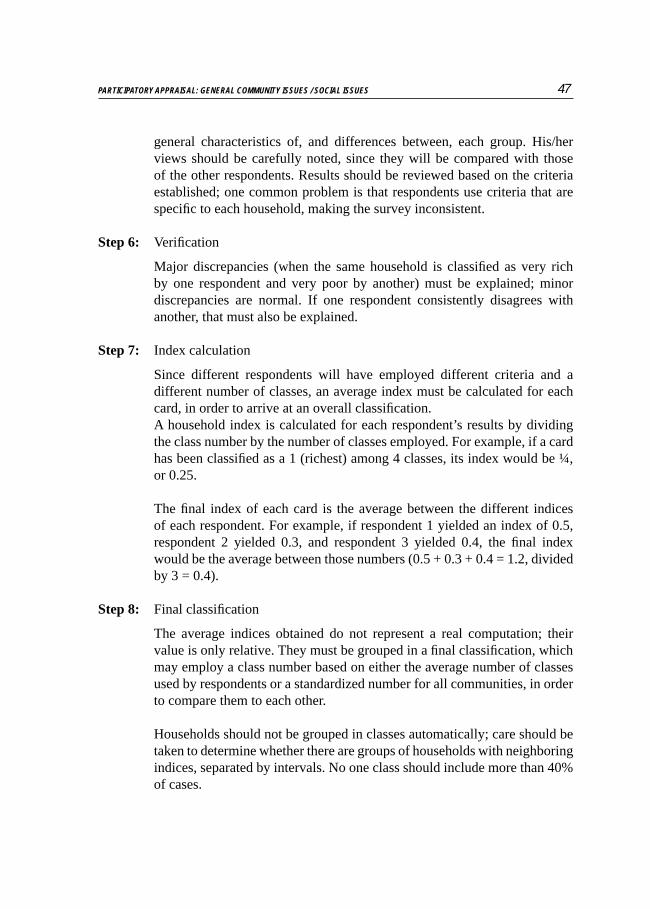
47PARTICIPATORY APPRAISAL: GENERAL COMMUNITY ISSUES / SOCIAL ISSUES
general characteristics of, and differences between, each group. His/her views should be carefully noted, since they will be compared with those of the other respondents. Results should be reviewed based on the criteria established; one common problem is that respondents use criteria that are specific to each household, making the survey inconsistent.
Step 6: Verification
Major discrepancies (when the same household is classified as very rich by one respondent and very poor by another) must be explained; minor discrepancies are normal. If one respondent consistently disagrees with another, that must also be explained.
Step 7: Index calculation
Since different respondents will have employed different criteria and a different number of classes, an average index must be calculated for each card, in order to arrive at an overall classification.A household index is calculated for each respondent’s results by dividing the class number by the number of classes employed. For example, if a card has been classified as a 1 (richest) among 4 classes, its index would be ¼, or 0.25.
The final index of each card is the average between the different indices of each respondent. For example, if respondent 1 yielded an index of 0.5, respondent 2 yielded 0.3, and respondent 3 yielded 0.4, the final index would be the average between those numbers (0.5 + 0.3 + 0.4 = 1.2, divided by 3 = 0.4).
Step 8: Final classification
The average indices obtained do not represent a real computation; their value is only relative. They must be grouped in a final classification, which may employ a class number based on either the average number of classes used by respondents or a standardized number for all communities, in order to compare them to each other.
Households should not be grouped in classes automatically; care should be taken to determine whether there are groups of households with neighboring indices, separated by intervals. No one class should include more than 40% of cases.
48 PARTICIPATORY APPRAISAL: GENERAL COMMUNITY ISSUES / SOCIAL ISSUES
3.6 Income classification Group method
Exercise objective: To identify the main social strata that exist in the community, in the eyes of its own members, based on their definitions of “wealth” or “well-being”. This makes it possible to craft an intervention strategy without resorting to complex socio-economic studies that are not always well received. The group method is intended for use with the entire population of the community. It is part of a participatory analysis and planning exercise, and is best suited to environments where such a process is underway. It is also generally suited to communities with a certain level of organization, as well as small communities where everyone knows everyone.
The group method is much faster than other exercises; it involves no mathematical equations, and offers the following advantages:
• It classifies all households;• It allows for a group discussion of the criteria employed;• It produces a classification based on consensus;• It invigorates the participatory analysis of community problems.
Care must be taken, however, with the following issues:
• The working group must include representatives from every social sector, gender, and age group;
• No social sector should be sidelined from any discussion;• Discussions pertaining to socio-economic status may be more sensitive in a group
situation; political and psychological barriers may be encountered (particularly among people at the far ends of the spectrum), and common ground must be sought.
Time required: 2-3 hours.
Materials: cards and markers.
Methodology:
Step 1: Preparation
There is no need for prior compilation of data, since they will be compiled during the group exercise.

49PARTICIPATORY APPRAISAL: GENERAL COMMUNITY ISSUES / SOCIAL ISSUES
Step 2: Introduction
The objectives of the exercise should be explained to the community’s authorities and organizations, and their approval should be obtained in order to ensure their cooperation.
Step 3: Group session
Most of the exercise is conducted in a group setting.
Its objective must be explained to the participants, and it must be conducted with absolute transparency. The participants should begin by drawing up a social map of the community, labeling each household and identifying its dwellers on a large sheet of paper or a writing board (see “social/household income map”).
As the group draws the map, a professional transcribes the data onto cards, using the key respondent method. The name of each head of household (bearing in mind that some people are better known by their nicknames) is written on a card. The cards are then numbered.
The most acceptable local definition of “wealth” is then determined with the group. This may be a delicate task, since it may draw attention to hidden rifts within the community. It is important to agree on a “positive” approach that does not appear to divide people, or lead them to believe they will be excluded from expected benefits, but rather reinforces the project’s objectives.
The same agreed approach should be used to decide how many social classes will be used (3 at least). Facilitators should never express an opinion regarding the classification. The participants are given cards at random, and then asked to categorize them by class. If a participant is unfamiliar with one of the households, he or she passes the card to someone else.
Once the classification is complete, the cards should be re-read, in case the respondents wish to change their answers. The class number should be written on the back of each card (always start with the richest class at number 1).
After the classification has been completed, the group should be asked to comment on the criteria employed. The participants should also explain the differences between each group. Their views should be carefully noted
No index calculation is necessary.

50 MAP OF SERVICES AND OPPORTUNITIES
COFFEE PICKING1 DAY
SUGARCANEPLANTATION
2-3 HOURS
MATCH FACTORY2 HOURS
HOSPITAL2 HOURS
SAN PABLO MARKET½ HOUR
SCHOOL½ HOURAGROCHEMICAL
STORE1 HOUR
HEALTHWORKER
ELEMENTARYSCHOOLTEACHER
SAN JACINTOCOMMUNITY
POLICESTATIONMAYOR’SOFFICE
2 HOURS
CAPITAL MARKET5 HOURS

51PARTICIPATORY APPRAISAL: GENERAL COMMUNITY ISSUES / SOCIAL ISSUES
3.7 Map of services and opportunities
Exercise objective: To visually portray the services and employment opportunities known to and used by the members of the community.
Time required: 1-2 hours.
Materials: Blackboard and chalk, or newsprint and colored markers.
Methodology:
Step 1: Gather a small group of respondents who know the community well. Explain the objective of the exercise.
Step 2: Draw a circle representing the community in the middle of the map. Ask the respondents which services (or sources of income/employment) exist in the community; write down the answers, or use symbols to represent them inside the circle.
Step 3: Ask the respondents where they travel outside the community to obtain services (or sources of income/employment); circle each location and identify it by name. List the services provided at each location inside each circle.
Step 4: Use arrows to identify which members of the community travel to which locations for services or income.
Step 5: The exercise can be repeated with other respondents for verificationpurposes (a separate exercise can be conducted for men and women – see mobility map).
NOTE: The results of the exercise must be compared with those produced by other groups. The information obtained regarding time constraints (among others) deserves special attention, as does the meaning of access to services in the eyes of the respondents.

52
TIMELINE
1932 PEASANTUPRISING
- Many deaths- Destruction
1969 WAR WITH HONDURAS
- Relatives return from Honduras
- Deaths
1980 WAR BREAKS OUT
- People flee to Honduras- Shelling
1988 REPOPULATION - No production yet- 20 families arrive
1989 FINALOFFENSIVE
- First harvest- Leadership organizes
1990 - Livestock purchased
1991 DROUGHT + ATTACKS
- Harvest almost completely lost
1992 PEACEAGREEMENTS
- 16 more families arrive- Trees felled
1993 PEACEAGREEMENTS
- Bad harvest- Loans for livestock
1994 ELECTIONS
YEAR EVENT COMMENTS

53PARTICIPATORY APPRAISAL: GENERAL COMMUNITY ISSUES / SOCIAL ISSUES
3.8 Timeline
Exercise objective: It is often necessary to identify significant changes in a community’s past that continue to influence events and attitudes in the present. A timeline is a list of key events as the participants remember them.
Time required: 2-3 hours maximum.
Materials: Blackboard and chalk, or newsprint and colored markers.
Methodology:
The timeline should reach as far back into the past as possible, to the earliest events the participants can recall. The exercise should include representatives from several generations and all groups, including men and women. The presence of the oldest members of the community is indispensable.
Step 1: Organize 1 or several working groups; this step is important, as working groups allow participants to agree on answers and have stimulating discussions. Explain the objective of the exercise.
Step 2: The facilitators should begin the discussion by asking questions such as “When was the community founded?”, and “Who were the first to arrive?” After that point, they should not become involved in deciding which events were important; that task should be left to the participants.
Step 3: As events are recalled, arrange them in a vertical column representing the timeline, with the oldest events at the top. Cards may be useful, as information will have to be rearranged in order to keep events in chronological order. If recalling dates becomes difficult, try to use important national or international events as points of reference.
Step 4: All comments on events should be placed alongside the timeline. Care should be taken not to forget these comments; participants should be encouraged to discuss them.
Step 5: As the timeline nears completion, discuss the trends that emerge (e.g., the frequent appearance of a given phenomenon).
Step 6: If the participants have been working in sub-groups, discuss the work of each one and agree on a common thread. Write down the results and explain how they will be used.
Step 7: Check the results against other sources.

54 PARTICIPATORY APPRAISAL: GENERAL COMMUNITY ISSUES / SOCIAL ISSUES
TREND LINEEROSION in an AFRICAN VILLAGE
EROSION
MAIN EVENTS:
1946: GOVERNMENT INTRODUCES TERRACING.
1951-54: TERRACES ARE WIDENED.
1955: CONSERVATION GROUPS ARE FORMED.
1959-1963: CIVIL WAR – FARMS ARE ABANDONED.
1965-1968: EROSION DECREASES THANKS TO INDIVIDUAL EFFORTS BY FARMERS.
1976-1986: GROUPS RE-FORM.
1987-1988: TOOLS TOO EXPENSIVE – DROUGHT AND HEAVY RAINS – CONSERVATION GROUP DISSOLVES.
This is an example from Africa
55PARTICIPATORY APPRAISAL: GENERAL COMMUNITY ISSUES / SOCIAL ISSUES
3.9 Trend lines
Exercise objective: In addition to identifying key events, it is important to understand people’s perception of changes that have occurred over time – particularly those which involve development, such as climate change and variations in production patterns, availability of resources, income, nutrition, etc… The study of change yields significant, if unquantifiable, data. It is also important to determine whether different groups have different perspectives on change.
Time required: 2-3 hours maximum.
Materials: Blackboard and chalk, or newsprint and markers.
Methodology:
Step 1: Organize working groups and explain the exercise
Step 2: Draw a blank matrix on the board; then draw a graph (once an example has been provided, graphs are easier to understand). Explain how time, measured in years, moves from left to right on the horizontal axis, while parameter intensity/availability moves upward on the vertical axis. Discuss the main change parameters illustrated, as well as the time scale (the degree to which the exercise reaches back into the past).
Step 3: Ask the participants what they think of the changes that have occurred in the community; was there more or less intensity/availability in the past? When was there more? When was there less? Using those points in time as benchmarks, draw a trend line across the years. When opinions differ, draw several lines in different colors until a consensus is reached.
Step 4: Once the participants have grasped the concept, the facilitator should take a back seat and ask one of the participants to draw.
Step 5: Encourage participants to discuss the main trends. Always ask why changes have occurred. Write comments/explanations in the margins of the diagram.
Step 6: If the participants have been working in sub-groups, discuss the work of each one and create a common diagram. Write down the results and explain how they will be used.
Step 7: Check the results against other sources.

56TE
OSI
NTE
CA
NTO
NPA
RTIC
IPA
NTS
:A
rnul
fo A
las
Mau
rilio
Ore
llana
Rafa
el G
uard
ado
HIS
TORY
CH
ART
YEA
RIS
SUE
PRO
DU
CTIO
N
FARM
LAN
D
FORE
ST
LIVE
STO
CK
WA
TER

57PARTICIPATORY APPRAISAL: GENERAL COMMUNITY ISSUES / SOCIAL ISSUES
3.10 Community history chart
Exercise objective: To visually portray the changes that have affected community life over the past few years, in terms of social organization, health, production, natural resources… This exercise may supplement others, such as the timeline and trend line.
Time required: 1-3 hours.
Materials: Blackboard and chalk, or newsprint and markers.
Methodology:
This is a group exercise intended for both focus groups and larger gatherings, as well as for families (farm histories). Its chronological scope is relatively limited (10 years, at most) – especially if participants are expected to recall quantitative data.
Step 1: Agree with the participants on the issues to be addressed. This will depend both on the focus of the study and the participants’ priorities. Create a matrix headed by those issues, with as many columns as there are years in the exercise. Agree on a symbol to represent each issue.
Step 2: For each issue, ask the participants if they remember an exceptional year (e.g., exceptionally good or bad harvests). That year will serve as a reference point; if there is no reliable information, try to fill out the matrix with approximate data, using symbols (see example).
Step 3: The process of completing the matrix may lead to considerable discussions, which may in turn produce a great deal of information on annual variations and the way they are perceived by different members of the community.
Step 4: Once the table has been completed, the facilitator may encourage discussion – e.g., to explain the most obvious fluctuations and changes recorded. The explanations offered should be transcribed, since they often turn out to be important. The table should also be analyzed in terms of problems and opportunities.
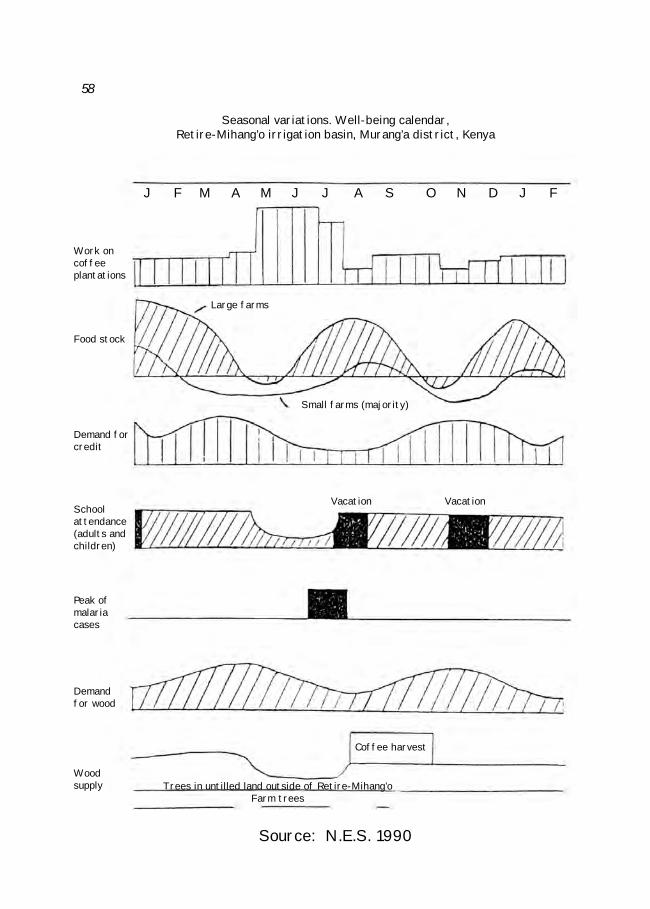
58
J F M A M J J A S O N D J F
Work on coffeeplantations
Food stock
Large farms
Small farms (majority)
Demand forcredit
Schoolattendance(adults and children)
Peak of malariacases
Demandfor wood
Woodsupply
Vacation
Trees in untilled land outside of Retire-Mihang’oFarm trees
Coffee harvest
Vacation
Seasonal variations. Well-being calendar, Retire-Mihang’o irrigation basin, Murang’a district, Kenya
Source: N.E.S. 1990

59PARTICIPATORY APPRAISAL: GENERAL COMMUNITY ISSUES / SOCIAL ISSUES
3.11 Seasonal analysis
Exercise objective: To portray seasonal variations in parameters and activities in community life. These diagrams are a particularly effective way of illustrating the relationship that exists between various activities and seasonal changes. They can be used to design initiatives and plan activities on issues such as food availability, income and labor, academic and social activities, income sources, expenditures, credit, disease, manpower, etc.
Time required: 2-3 hours.
Materials: Blackboard and chalk, or newsprint and markers.
Methodology:
Step 1: Organize a meeting with the community or with interested members. Explain the purpose of the seasonal calendar, and discuss the parameters to be included; these will vary depending on the approach and the group involved. Limit the discussion to 4 or 5 parameters.
Step 2: Draw a linear time scale on the blackboard or newsprint. Use the calendar employed by the community (January may not necessarily be its starting point). Let the participants decide who is going to draw.
Step 3: Use lines or boxes to describe the seasonal variations of each parameter. The starting point does not have to be the beginning of the year. The description of labor demand, for example, can begin at the month when demand is highest. Proceed in this manner until the year is completed. Repeat for each parameter.
Step 4: Discuss the results, identifying the best/worst times of year for each parameter.
Step 5: Explain how the calendar will be used. Provide the participants with a copy.
Step 6: The calendar developed by one group can be consolidated with and checked against the results of the other groups.

61
4
PARTICIPATORY APPRAISAL:NATURAL RESOURCE
MANAGEMENT
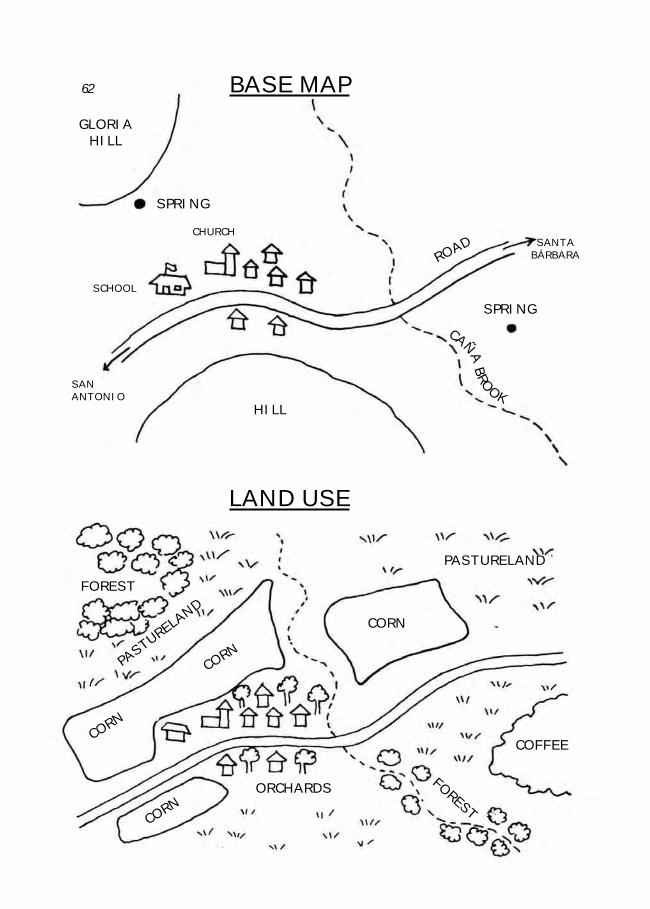
BASE MAP
LAND USE
GLORIAHILL
SPRING
SPRING
CHURCH
SCHOOL
SANANTONIO
HILL
ROAD
CAÑABROOK
SANTABÁRBARA
FOREST
FOREST
PASTURELAND
PASTURELA
NDCORN
COFFEE
CORN
CORN
CORNORCHARDS
62

63PARTICIPATORY APPRAISAL: NATURAL RESOURCES MANAGEMENT
4.1 Natural resource and land use map
Exercise objective: To draw a map that reflects the community’s perception of how physical space and resources are used, as well as other important data.
Time required: 1-3 hours, depending on the complexity of the data involved.
Materials: Blackboard and chalk, or newsprint and markers.
Methodology:
Step 1: Gather a group of people from the community (10 max.) and explain the objective of the exercise. If necessary, split them up by preference or group (e.g., men, women, youth).
Step 2: Discuss how the map is going to be drawn and which features are to be included (rivers, roads, houses, forests, farmland, etc.). If they wish to include a large number of features, the facilitator may suggest that several maps be drawn.
Step 3: Help “jumpstart” the process (for example, help the participants locate the first few reference points); then leave the group to continue working on its own, using the board, papers, or the ground. Start with a “basic map” that includes important reference points such as rivers, roads, etc. After that point, professionals should not intervene.
Step 4: Hold a plenary meeting to discuss the map drawn by the group/s. Develop a final map that reflects the comments of all the participants.
Step 5: Transcribe the map/s, providing one copy for the community and another for the technical team. Discuss its possible uses (see “transect” and “community planning”).
NOTE: The map is a starting point for further analysis. Its purpose is to guide the transect walk and diagramming. It may be revised and enhanced, or divided into different maps focusing on different issues.

64 PARTICIPATORY APPRAISAL: NATURAL RESOURCES MANAGEMENT
SOIL Poor, rocky Muck – loose earth
Red earth; very rocky
WATER Does not retainwater; very dry
Fresh; heavy rains bring floods
Dry Available year-round
CROPS Forest;pastureland
Corn; beans; fruit
Pastureland Forest
ANIMALS Livestock; horses
Swine;poultry
Horses
WHOWORKS?
- The entire community- Women gather wood
Individualfarm plots
Women and childrentend to the animals
WHATWAS DONE BEFORE
There was more forest
Cassavaand sweet potato were once grown
Fuelwoodwasgathered
There used to be more water
HIGHHILLSIDE
LOWHILLSIDE
CAÑABROOK
PLAIN

65PARTICIPATORY APPRAISAL: NATURAL RESOURCES MANAGEMENT
4.2 Transect walk and diagramming
Exercise objective: To conduct a field discussion on various items (topographical or otherwise) found within the community’s sphere of influence, focusing on their uses, the problems they entail, and their potential for development; and to illustrate these features in a diagram, which may be used as a starting point for a discussion of alternatives. The diagram may be a simple affair, used to help people express what they know about their environment. It may also be enhanced with data from other sources, and can convey large amounts of information.
Time required: This depends on the distances to be covered. The entire exercise can be completed in one day or less. The workshop following the walk should not be more than 2 hours long.
Materials: A map of the area (preferably the participatory map), a small notebook for use during the walk, and newsprint and markers for the final diagram.
Methodology: The concept of diagramming may seem odd to both the members of the community and the technical team; once it has been explained, however, it is a simple method that provides a very clear visual foundation for discussion and analysis. The idea is to visually portray different features and changes by taking a tour of the area.
Step 1: Select a small group of respondents/participants (3-5) and explain the exercise to the group, using a practical example. Discuss the best route for the transect walk; while it does not have to be a straight line, it should be as diverse as possible in terms of terrain, land use, etc. Transect walks in mountainous areas usually run from one peak to another, traversing the valley in between and covering every vegetation altitude band. It is easier to establish a route if the participatory mapping exercise has already been conducted.
Step 2: Begin the tour, following the agreed itinerary. Write down the main features and changes, always using local terms. Take time to stop and speak to the people encountered along the way.
Step 3: (This can be done during or after the walk, depending on the complexity of the exercise): write information on the participants on a large sheet of paper, and create a diagram to describe the terrain, the areas visited, and their names. Check with the participants to make sure they agree with the classification employed.
Step 4: Based on an individual or group discussion with the participants, add the following essential information on the use and status of resources in each area to the diagram:• What does each area contain? (land use, vegetation, soils – whatever is
relevant).• Why are those particular items found in this area?• Who works in this area and benefits from its resources? (access to resources)• Have significant changes occurred in the past?
Step 5: Ask the participants what they think of the exercise. Write down the results and turn the paper over to the group.
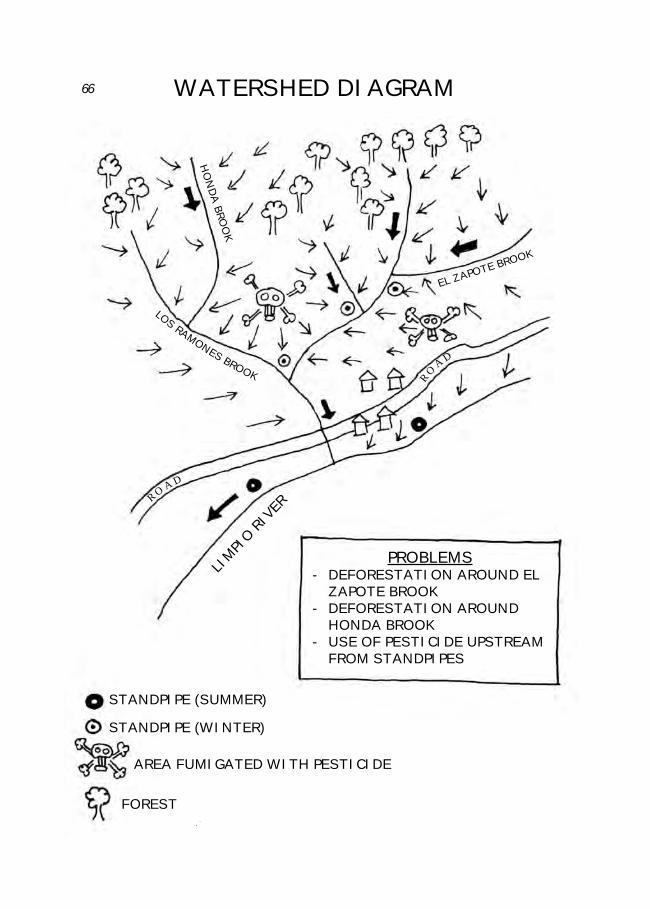
66 WATERSHED DIAGRAM
PROBLEMS- DEFORESTATION AROUND EL
ZAPOTE BROOK- DEFORESTATION AROUND
HONDA BROOK- USE OF PESTICIDE UPSTREAM
FROM STANDPIPES
STANDPIPE (SUMMER)
STANDPIPE (WINTER)
AREA FUMIGATED WITH PESTICIDE
FOREST
LIMPI
O RIVER
R OA D
RO
AD
HO
NDA BRO
OK
EL ZAPOTE BROOK
LOS RAMONES BROOK

67PARTICIPATORY APPRAISAL: NATURAL RESOURCES MANAGEMENT
4.3 Watershed diagramming
Exercise objective: Using the community map as a guide, analyze the area’s drainage patterns and micro-watersheds, in order to discuss the environmental interactions that take place within the vicinity of the community. This is a simple method based on local knowledge.
Time required: 2-3 hours.
Materials: The community map, newsprint and markers, blackboard.
Methodology:
The concept of a watershed is an effective way of highlighting the interaction between essential environmental factors in the community, such as the water supply, deforestation, erosion, pollution, overgrazing, etc.
Step 1: Form a working group that includes the individuals who participated in the community mapping exercise. Explain the objective of this session. Make a new copy of the basic features shown on the map (rivers, topography, main reference points).
Step 2: Work with the participants to revise and complete the map of rivers, brooks, and streams in the community, using arrows to indicate the direction of drainage flows. Also finish mapping water sources.
Step 3: Use smaller arrows or arrows of a different color to indicate the direction of rain water flows toward streams and rivers. This will provide a rough sketch of the area’s micro-watersheds.
Step 4: Agree on a symbol to indicate the quantity and quality of the water supply obtained from each river and spring (e.g., use different colors to distinguish permanent sources from those which disappear during the dry season).
Step 5: Begin the analysis by comparing the drainage map with other features on the community map. Try to identify relationships between current problems and potential ones (e.g., deforestation and overgrazing in a micro-watershed and the water supply, use of agrochemicals and pollution of water sources, etc.).
Step 6: Use the results obtained to begin planning actions.

68 HISTORICAL DIAGRAM
CHANGES IN LAND USE AND ENVIRONMENTAL QUALITY IN BOLIVIA
According to Hartmann, 1996
LLAMAS
SHEEP
COWS
BIOMASSPASTURELAND
% OF THE YEAR WETLANDS RETAIN WATER
NON-PALATABLESPECIES % OF RIVERS THAT
RETAIN WATER YEAR-ROUND
AGRICULTURALPRODUCTION
Farm
land
Past
urel
and
Rive
rs
Wet
land
s
69PARTICIPATORY APPRAISAL: NATURAL RESOURCES MANAGEMENT
4.4 Historical diagramming and mapping of natural resources
Exercise objective: Meet with the residents of the community who have lived there longest to discuss how its natural resources have changed, in order to better understand its current problems.
Time required: 2-3 hours maximum.
Materials: Current map and/or transect; old, large-scale (1/20,000) aerial photos of the community, if available.
Methodology:
Step 1: Gather a group of older residents who are well acquainted with the community’s past. Explain the objective of the exercise. It will make matters easier if they have already been involved in the mapping and transect exercises.
Step 2: Ask the participants to draw a map of the community as it was before, using current maps or transect diagrams as a guide. Agree on a time frame – preferably based on key historic events (see “history chart”).
Step 3: Compare the two sets of maps/transects and discuss the main changes that have occurred.
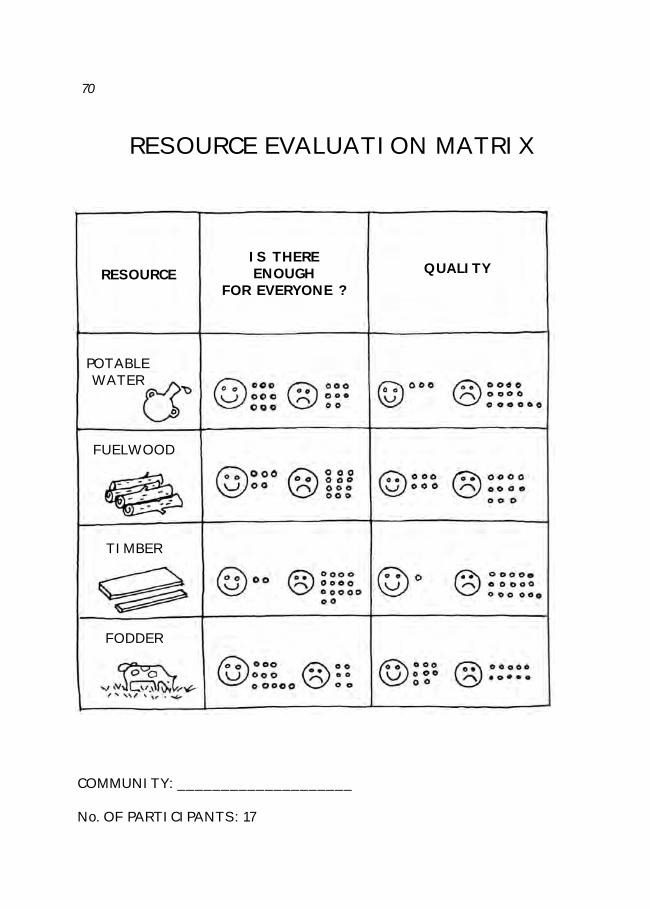
70
RESOURCE EVALUATION MATRIX
RESOURCE
POTABLEWATER
FUELWOOD
TIMBER
FODDER
COMMUNITY: ____________________
No. OF PARTICIPANTS: 17
IS THERE ENOUGH
FOR EVERYONE ?QUALITY

71PARTICIPATORY APPRAISAL: NATURAL RESOURCES MANAGEMENT
4.5 Resource evaluation matrix
Exercise objective: To evaluate the community’s views regarding public natural resources (fuelwood, timber, water, fodder, etc.).
Time required: Approximately 1-2 hours.
Materials: Blackboard and chalk, or newsprint and colored markers.
Methodology:
Transect diagrams can be used as a starting point. Gather the members of the community or the working groups and explain the objective of the exercise.
Step 1: Establish evaluation parameters and criteria. As with the preference-evaluation matrix, open questions such as “What is in our best interest?” and “What do we like?” are the best way to bring out the views of the participants. Once the criteria have been established, create symbols for each one, so that illiterate members of the community can fully participate in the exercise.
Step 2: Create a matrix that includes the criteria mentioned above. Agree on a simple qualitative scale; for example, the symbol could be used for “adequate”,while could be used for “inadequate”.
Step 3: The evaluation may be performed either by consensus (where everyone agrees on a score) or by voting (where participants assign scores individually. In this case, colored markers should be used, in order to allow men and women to vote together while also leaving a record of their preferences). Participants must rate each criterion.
Step 4: Discuss the results. Determine whether they are consistent with the experiences of the group. If strong differences of opinion emerge along gender lines – as is often the case – discuss their possible causes. Transcribe the results and provide the group with a copy of the final matrix.
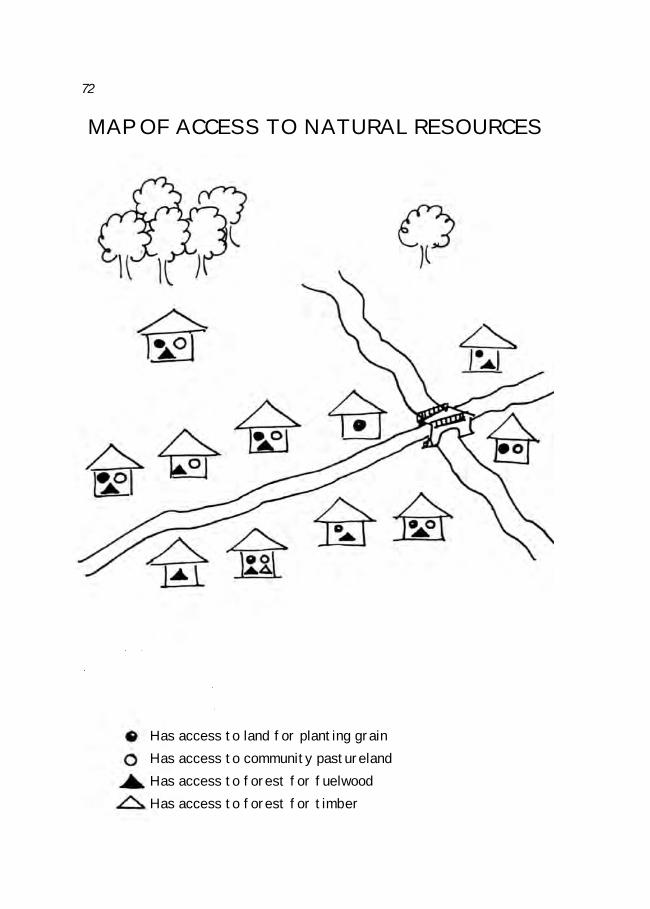
72
MAP OF ACCESS TO NATURAL RESOURCES
Has access to land for planting grainHas access to community pasturelandHas access to forest for fuelwoodHas access to forest for timber

73PARTICIPATORY APPRAISAL: NATURAL RESOURCES MANAGEMENT
4.6 Map of access to natural resources
Exercise objective: To develop a visual breakdown of household access to public natural resources (forests, pastureland, water, etc.). This tool can determine whether certain members of the community have less access to resources than others – a question which is difficult to answer using formal questionnaires. Access to resources is one of the most important issues in sustainable management planning.
Time required: 2-3 hours.
Materials: Blackboard and chalk, or newsprint and colored markers.
Methodology:
The methodology of this exercise is the same as that employed to create the social and household income map. It only focuses on certain resources. It is usually advisable to include other communities.
Step 1: Gather a small group of respondents who know the community well. Explain the objective of the exercise.
Step 2: Work with participants to develop a basic map of certain reference points (roads…). Include all of the houses in the community. Ask the members of each household whether they have access to the resources in question. Try to obtain quantifiable data, if possible. The criteria employed can be visually portrayed on the map.
Step 3: If other communities have access to the same resources, identify them on the map.
Step 4: Repeat the exercise with other members of the community (compare the views of men and women); if there is more than one community involved, repeat the exercise for each one.
NOTE: The conflict and decision-making matrices are indispensable complements to this exercise.
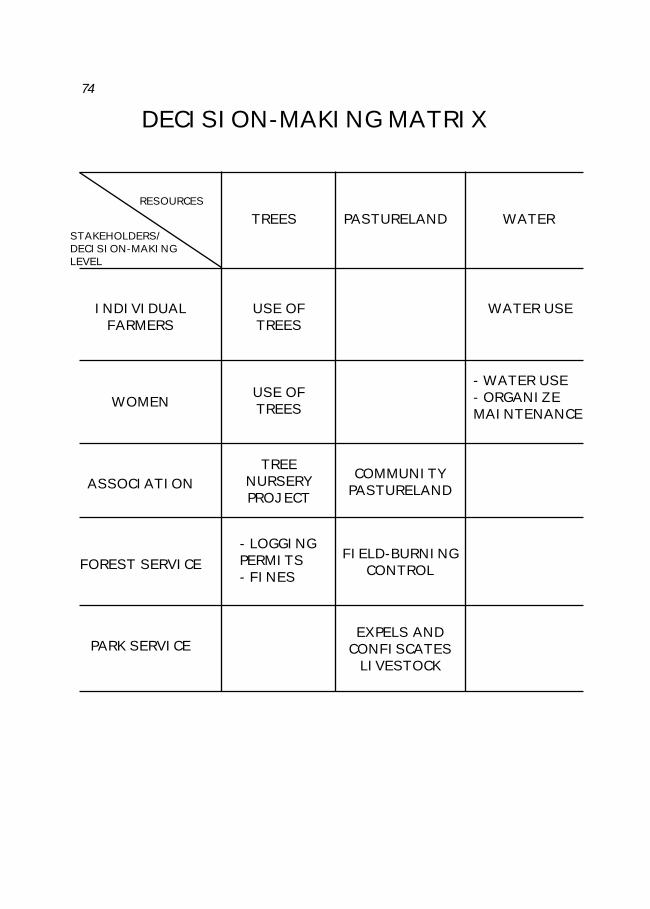
74
DECISION-MAKING MATRIX
RESOURCES
STAKEHOLDERS/DECISION-MAKINGLEVEL
TREES
USE OF TREES
WATER USE
- WATER USE- ORGANIZE MAINTENANCE
USE OF TREES
TREENURSERYPROJECT
COMMUNITYPASTURELAND
FIELD-BURNINGCONTROL
EXPELS AND CONFISCATES
LIVESTOCK
- LOGGING PERMITS- FINES
INDIVIDUALFARMERS
WOMEN
ASSOCIATION
FOREST SERVICE
PARK SERVICE
PASTURELAND WATER

75PARTICIPATORY APPRAISAL: NATURAL RESOURCES MANAGEMENT
4.7 Decision-making analysis matrix
Exercise objective: This exercise can quickly determine who or what institution is responsible for making decisions on a number of issues, such as the use of certain resources. It can play a crucial role in determining institutional arrangements and responsibilities.
Time required: 1 hour.
Materials: Blackboard and chalk, or newsprint and markers.
Methodology:
Step 1: Begin a discussion on decision making. Propose the matrix as a visual tool.
Step 2: Establish the parameters according to which decision-making processes will be studied. Identify the actors involved (people and organizations). Develop a dual-entry matrix, with processes on one side and actors on the other.
Step 3: Each parameter/actor or decision-making level should be accompanied by a discussion with participants on how decisions are made. Relevant information should be recorded in the matrix.
Step 4: The end result of the exercise is a diagram of the decision-making process in the community. If the participants have been working in sub-groups, check each group’s results against the others. Discuss the implications and possible problems.

76 CONFLICT ANALYSIS
Actors
Type of conflict
Overtrees
Overland
Overpastureland
Overwater
Overanimals
The number of dots ( ) represents the frequency of conflict, according to the participants.
Amongcommunitymembers
Withanother
community
Withlandholders
With the State

77PARTICIPATORY APPRAISAL: NATURAL RESOURCES MANAGEMENT
4.8 Conflict-analysis matrix
Exercise objective: To identify the main sources of conflict in the community; this may be vital to the handling of collective resources such as water, fuelwood, pasture, etc.
Time required: 1-2 hours.
Materials: Blackboard and chalk, or newsprint and markers.
Methodology:
This may be a sensitive discussion; it should not begin until a measure of trust has been established, and the subject can be addressed by the participants themselves. It should be emphasized that the purpose of the exercise is not to assign blame, but rather to study the sources and frequency of conflicts. If conflicts are clearly identifiedbut the process becomes too difficult, the exercise can be conducted in small groups rather than a plenary session.
Step 1: Begin a discussion on conflict. Propose the matrix as a visual tool.
Step 2: Establish the parameters according to which conflict will be studied. Identify the actors involved (people and organizations). Develop a dual-entry matrix, with processes on one side and actors on the other.
Step 3: Ask the participants to mark the squares of the matrix with an x or a dot if they are aware of any disputes over each issue, and between each set of actors. Squares with few dots represent a general absence of conflict, while those with many dots represent more contentious issues.
Step 4: The end result of the exercise is a diagram of conflicts in the community. If the participants have been working in sub-groups, check each group’s results against the others. Discuss the implications and possible problems. Important questions include the following:
Why are there so many disputes over this resource? Why is there so much conflict between these actors?
Are there ways to solve these disputes? Is conflict more frequent today than it was in the past?

78
LOCAL SOIL CLASSIFICATIONIN PETEN, GUATEMALA
Vernacular Classification of Lands and Production Aptitude
M1 first-year corn M2 second-year corn MSJ Dec. corn F1 winter beans
F2 summer beans Fs September beans F fertilizer fertilizer bean
CATEGORY TOPOGRAPHY SOIL APTITUDE MAINLIMITATIONS
Hills,mountains Irregular Black, rocky,
shallowM1 F1 F sept.
NutsRocky soil /
drought / windEarth dike,
high altitude Slightly rolling Black, loose, shallow
M1 M2 F1 Fs F2 F fertilizer Drought
High plain FlatBlack, loose, muddy, well
drained
M1 M2 F1 F2 F fertilizer Diseases (frost)
Lowland Flat
Black, muddy, prone to
temporaryflooding
(M1) M2 F2 MSJ Rice
Flooding / diseases (frost)
Dip Well-drainedflat depression Black, muddy M1 M2 F1 F2 Diseases (frost)
Low wetlands, swampland
Flatdepression
Black, muddy flooded
several months a year
M2 F2 MSJRice Pasture
Flooding /diseases / drainage/ summer
hardening / pests
Flat lowland plain
Alluvialterraces Sandy
M1 F1 MSJVegetables
PastureRiver flooding
Source: AHT/APESA, case studies, 1991
CONSOLIDATED TABLE BASED ON PARTICIPATORY APPRAISAL EXERCISES

79PARTICIPATORY APPRAISAL: NATURAL RESOURCES MANAGEMENT
4.9 Local soil classification
Exercise objective: To assess local knowledge regarding soils and their capacity. Using local classifications is one of the first steps toward adopting and recognizing local knowledge. In most cases, a clear correlation has been found to exist between local knowledge and scientific classifications. This approach allows a common language to be developed.
Time required: 1-2 hours.
Materials: Blackboard and chalk, or newsprint and markers.
Methodology:
The transect diagram can serve as a starting point for the discussion. The purpose of the exercise is to develop a matrix which systematically catalogues the knowledge of farmers; hence, the facilitator should have no role in determining its content.
Step 1: Gather a group of participants – preferably one which includes the more experienced members of the community. Explain the objective of the exercise.
Step 2: Follow the transect diagram or map and ask the participants about the soils encountered. They may have names, but usually there are only descriptions. These should be written down as accurately as possible. Encourage discussion, and make sure the descriptions offered are as precise as possible.
If this approach proves unworkable, take a walking tour similar to that of the land-use transect; collect samples, and take note of all comments.
Step 3: Once all the soils named by the participants have been reviewed, create a matrix with as many rows as there are soils. If samples are used, the matrix can be drawn on the ground, using samples as “headings”.
Step 4: List the main crops grown in the area. Head each column of the matrix with one crop. Ask the participants whether each soil type is adequate for each crop. List the limitations and advantages of each soil type. Quantification(yields) is permitted. Over the course of the exercise, the participants may wish to create sub-categories for a particular soil type.
Step 5: Once the matrix has been completed, try to add an additional column that summarizes the main management issues associated with each soil type, in the view of the participants.

80
TREE ASSESSMENT MATRIX
TREEPIEZQUITE ACACIA NIM TEAK TAMARIND
CRITERION
LOW INITIAL COST
RAPID GROWTH
INTERPLANTING
DROUGHTRESISTANCE
INCOME
TOTAL
SAMPLE FROM A VILLAGE IN INDIA.
FUELWOOD
WOOD VALUE

81PARTICIPATORY APPRAISAL: NATURAL RESOURCES MANAGEMENT
4.10 Local tree use (agroforestry inventory)
Exercise objective: To study local agroforestry knowledge – useful trees, their applications and management, and the social and gender issues they involve. This knowledge is essential to the development of agroforestry initiatives.Time required: At least 1 day per group.
Materials: A map of the area (preferably the participatory map), a notepad for use during the tour, and newsprint and markers for the final diagram.
Methodology:
Organize small working groups (preferably two teams, separated by gender). Explain the objective of the exercise.
Step 1: Work with each team to plan tours that cover the most diverse range of agro-ecological areas possible.
Step 2: Conduct the tours, creating a transect diagram and a list of all tree specimens encountered. Each specimen should be identified using the local name provided by the participants. Its surrounding environment (tilled fields,pastureland, enclosures, forests, etc.) should also be noted.
Step 3: Hold a workshop with the participants to discuss the tour. The transect diagram should include all of the specimens identified by the participants, as well as their uses.
Step 4: During the same workshop – if possible – or at some later point, create a preference matrix for the specimens identified.
Step 5: Compare the results of the working groups. There is usually a marked difference between the uses and preferences expressed by men and those expressed by women. This difference must be taken into account.
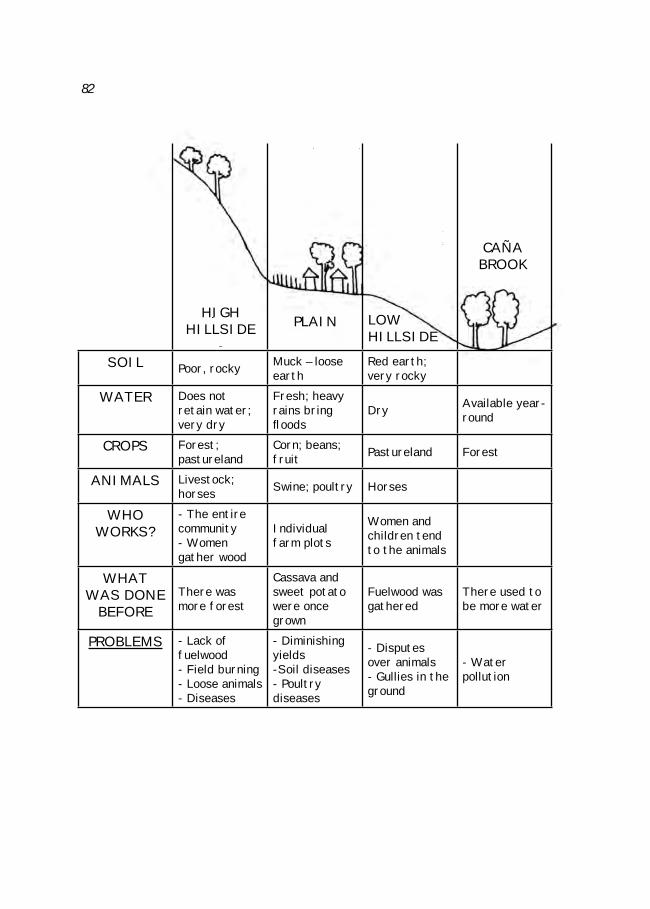
82
SOIL Poor, rocky Muck – loose earth
Red earth; very rocky
WATER Does not retain water; very dry
Fresh; heavy rains bring floods
Dry Available year-round
CROPS Forest;pastureland
Corn; beans; fruit Pastureland Forest
ANIMALS Livestock;horses Swine; poultry Horses
WHOWORKS?
- The entire community- Women gather wood
Individualfarm plots
Women and children tend to the animals
WHATWAS DONE
BEFOREThere was more forest
Cassava and sweet potato were once grown
Fuelwood was gathered
There used to be more water
PROBLEMS - Lack of fuelwood- Field burning- Loose animals - Diseases
- Diminishing yields-Soil diseases- Poultry diseases
- Disputes over animals- Gullies in the ground
- Water pollution
HIGHHILLSIDE LOW
HILLSIDE
CAÑABROOK
PLAIN

83PARTICIPATORY APPRAISAL: NATURAL RESOURCES MANAGEMENT
4.11 Resource-use problem census (based on transect)
Exercise objective: To work with the community to develop a list of the problems it faces in the use of its resources, using the transect diagram as a guide.
Time required: 1-3 hours, depending on the complexity of the issues and the number of participants involved.
Materials: Transect diagram, blackboard and chalk or newsprint and markers, cards.
Methodology:
Step 1: Gather the members of the community who participated in the transect and mapping exercises, and explain the need for – and desirability of – a precise inventory of the community’s problems.
Step 2: Using the transect diagram as a guide, ask the participants, “What are the main problems in each area?” This question should be asked regarding each area and resource user identified during the transect walk. Write each problem down on individual cards or on the blackboard.
Step 3: Once the participants believe they have finished addressing an issue, select the cards that are to be kept (to avoid repetition). No card should be eliminated without the agreement of all the participants.
Step 4: Repeat the exercise for every area included in the transect walk.
Step 5: Once the entire transect has been covered, discuss the problems as a whole, and record them in the transect diagram.
Step 6: Ask the participants what they think of the exercise. Write the results down and turn them over to the group.


85
5
PARTICIPATORY APPRAISAL:
PRODUCTION SYSTEMS

86
FARM CLASSIFICATION(based on access to resources)
FARM TYPE
RESOURCES
LESS THAN 0.7 Ha.
NONE
NONE
NONE
OVER ½ HOUR FROM ROAD
GOOD(CAN EMPLOY PAID
WORKERS)
ACCEPTABLE(CANNOT EMPLOY
WORKERS)
POOR(MUST WORK ELSEWHERE)
ARABLE LAND
HEADS OF CATTLE
PERSONSWORKING ON
FARM
SWINE
TRANSPORT
ACCESS
BANK MONEYLENDER
CLOSE TO THE ROAD
1.4 – 2.1 Ha. OR MORE
4 – 5 OR MORE
2 - 3
1 - 3
1
0.7 – 1.4 Ha.
CREDIT

87PARTICIPATORY APPRAISAL: PRODUCTION SYSTEMS
5.1 Preliminary farm classification (based on access to resources)
Exercise objective: To determine farmers’ views regarding the levels of sustainability of their farms, using a procedure similar to that employed to study income levels; and to assess the degree of access to the resources which, in their view, characterize each level.
Time required: 1-2 hours, depending on the complexity of the issue and the number of participants.
Materials: Blackboard and chalk, or newsprint and markers.
Methodology:
Step 1: Gather a group of experienced individuals – preferably from different groups / strata within the community. Explain the objective of the exercise.
Step 2: Work with the participants to divide farms into 3 or 4 different categories, based on simple standard-of-living and/or sustainability criteria, such as:• Farm income;• Need for additional income outside of agriculture;• Quality of life of families, as measured by social indicators.
Step 3: Develop a dual-entry matrix, with a different farm type at the head of each column. Use symbols.
Step 4: Ask the participants to identify the exact parameters that distinguish each farm type. Focus on access to production resources, such as arable land, land ownership, labor availability, animals, machinery, etc. Try to obtain quantitative data for each of the criteria employed; establish the resulting ranges in a simple matrix.
Step 5: Once the matrix has been completed, work with the participants to make sure the data is relevant.
Step 6: Prioritize the criteria. The resources identified should be prioritized in order to determine which ones are indispensable to each category, according to the participants. This can be accomplished using a dual-entry matrix (see “problem priority matrix”).
Step 7: Exercises of this type should be repeated with several sources, in order to verify the data obtained. The criteria-prioritization matrix can also be used to go one step further, and develop a recommendation-domain classification.

88
Char
acte
riza
tion
of
the
prod
uction
sys
tems
and
sour
ces
of inc
ome:
Low-
and
mid-a
ltitud
e zo
nes
(CEN
TA A
genc
y –
San
Rafa
el)
LAN
DTE
NUR
E /
size
Lowl
ands
(pla
ins
and
low
hills
)M
id-a
ltit
ude
(hill
s)Sm
all l
ando
wner
s
Up
to 3
.5 h
a.
Corn
– m
illet
(0.7
ha.
); ca
ttle
(1-2
hea
d), s
wine
(1-2
pig
s), p
oult
ry.
Som
e fa
rmer
s si
ngle
-cro
p se
sam
e se
ed (u
p to
0.7
ha.
), ri
ce, a
nd w
ater
mel
on (u
p to
0.7
ha.
).St
ubbl
e fo
r sa
le t
o co
oper
ativ
e (5
0 co
lone
s pe
r 0.
7 ha
.).D
ay la
bor,
mig
rati
on (s
ugar
cane
and
cof
fee
harv
ests
).
Corn
– m
illet
(0.7
ha.
); ca
ttle
(1-2
hea
d); s
wine
(1-2
pig
s),
poul
try.
Corn
(0.7
ha.
) – b
eans
(0.3
5 ha
.); c
attl
e (1
-2 h
ead)
,sw
ine
(1-2
pig
s), p
oult
ry.
Corn
– m
illet
– b
eans
(0.7
ha.
); ca
ttle
(1-2
hea
d),
swin
e (1
-2 p
igs)
, pou
ltry
.D
ay la
bor,
mig
rati
on (s
ugar
cane
and
cof
fee
harv
ests
).
Fish
erm
en –
fa
rmer
s(s
mal
l lan
down
ers
or C
EL
leas
ehol
ders
)
Corn
– m
illet
(0.7
ha.
); m
ainl
y fo
r su
bsis
tenc
e; p
oult
ry.
Med
ium
land
owne
rs
3.5
to 1
4 ha
.
Catt
le (1
0-20
hea
d); s
emi-
tech
nifie
d (s
ilage
, im
prov
ed
past
ure,
con
cent
rate
).Co
rn –
mill
et (0
.7 h
a.);
som
etim
es s
ugar
cane
(0.7
-1.4
ha.
) fo
r sa
le t
o co
oper
ativ
e, a
nd le
ttuc
e he
arts
for
live
stoc
k.Fa
rmer
s (p
aym
ent
/ st
ubbl
e) o
ccas
iona
lly le
ase
rice
fie
lds
and
past
urel
and
from
CEL
.
Exte
nsiv
e ca
ttle
far
min
g (1
0-20
hea
d).
Corn
– m
illet
(0.7
ha.
).
Leas
ehol
ders
(pay
men
t /
stub
ble)
.
Larg
e la
ndow
ners
Ove
r 14
ha.
Ex
tens
ive
catt
le f
arm
ing
(50
to 1
00 h
ead)
; man
y CE
L le
aseh
olde
rs.
Suga
rcan
e.Le
aseh
olde
rs (p
aym
ent
/ st
ubbl
e).
Exte
nsiv
e ca
ttle
far
min
g (3
0 to
100
hea
d).
Leas
ehol
ders
(pay
men
t /
stub
ble)
.Sa
le o
f wo
od.
Leas
ehol
ders
0.7
to 1
.4 h
a.
Corn
– m
illet
(0.7
ha.
); sw
ine
(1-2
pig
s), p
oult
ry.
Som
e fa
rmer
s le
ase
up t
o 2.
1 ha
. for
wat
erm
elon
.La
nd le
ased
to
med
ium
and
larg
e la
ndow
ners
(pay
men
t /
stub
ble)
and
CEL
(pay
men
t).
Day
labo
r, m
igra
tion
(sug
arca
ne a
nd c
offe
e ha
rves
ts).
Corn
– m
illet
(0.7
ha.
); sw
ine
(up
to 4
pig
s), p
oult
ry.
Corn
(0.7
ha.
) – b
eans
(0.3
5 ha
.); s
wine
(up
to 4
pig
s), p
oult
ry.
Leas
e fr
om m
ediu
m a
nd la
rge
land
owne
rs (p
aym
ent
/ st
ubbl
e).
Day
labo
r, m
igra
tion
(sug
arca
ne a
nd c
offe
e ha
rves
ts).
Prod
ucti
onco
oper
ativ
esSu
garc
ane
(hir
ed w
orke
rs).
Live
stoc
k (c
olle
ctiv
e he
rds
belo
ngin
g to
coo
pera
tive
and
sm
all l
ando
wner
s –
mem
bers
and
non
-mem
bers
).Pa
stur
elan
d le
ased
to
non-
mem
bers
.Te
ak (f
or u
se b
y m
embe
rs).
LAND U
SERS
IN T
HE
COM
MUNIT
Y:Sm
all l
andh
olde
rs –
up
to 3
.5 h
a.
M
ediu
m la
ndho
lder
s –
3.5
to 1
4 ha
.
Larg
e la
ndow
ners
– o
ver
14 h
a.
Leas
eholde
rs –
land
less
far
mer
s wh
o le
ase
land
bel
ongi
ng t
o m
ediu
m a
nd
larg
e la
ndow
ners
CEL
– CE
L le
ases
“fluc
tuat
ing
land
s” t
o ra
nche
rs a
nd f
arm
ers
89PARTICIPATORY APPRAISAL: PRODUCTION SYSTEMS
Exercise objective: Projects often require a farm classification, in order to describe different recommendation domains where initiatives and suggestions can be implemented. The knowledge of farmers themselves can also be useful for this purpose.
Time required: 1-2 hours, depending on the complexity of the issue and the number of participants.
Materials: Blackboard and chalk, or newsprint and markers.
Methodology:Step 1: Gather a group of experienced individuals – preferably from different groups /
strata within the community. This exercise is easier if at least a majority of the group is literate. Explain the objective of the exercise.
Step 2: Establish criteria. This can be an open process, starting with a brainstorming session that includes questions such as: Why do you think some farmers do better than others? and What are the reasons? This will help the participants identify the factors which, in their view, distinguish farmers from one another. A more closed process may be employed if a predetermined criterion is needed.
Step 3: Once the most important criteria have been expressed and clarified, perform a short prioritization exercise: select 2 or 3 criteria for inclusion in the matrix. Create a dual-entry matrix, placing the most important criterion at the head of a column (if three criteria are used, subdivide the rows).
Step 4: Each cell of the matrix should, in theory, represent a farm category. Ask the participants to describe the main characteristics of each category (including all of the criteria considered relevant). The facilitator should record this data in the matrix.
Step 5: Once the matrix has been completed, review the relevance of the data with the participants. There will probably be too many categories; a closer look will reveal that several cells are being used for the same type of farm. Certain categories may also need to be subdivided, since specific criteria may emerge to distinguish farms from one other.
Step 6: Study the relationships between categories. Place each farm type on the board (labeling them by name or by number), and ask the participants to identify the exchanges between them, using flow-chart arrows.
Step 7: Provide the group with a copy of the results. Exercises of this type should be repeated with several sources, in order to verify the data obtained. A “survey”-type approach may be useful.
5.2 Farm classification (based on recommendation domains as perceived by farmers)

90
FARM MAP
LAND UNDER LEASE (1.05 Ha.)
OWN LAND (0.7 Ha.)PASTURELAND
(0.7 Ha.)
COWS (2)
CORN (0.35 Ha.)
BEANS(0.35 Ha.)
TEAKPLANTATION
(5 Tasks)
MANGO
ORANGES
CORN 0.7 Ha.
BEANS 0.35 Ha.
SORGHUM 0.7 Ha.
½ HOUR DISTANCE
10-MINUTEDISTANCE
PASTURE
FUELWOOD
SWINE(3 PIGS) YARD
HOUSE
CHICKENS
VEGETABLEPATCH

91PARTICIPATORY APPRAISAL: PRODUCTION SYSTEMS
5.3 Farm mapping
Exercise objective: To describe farmers’ views regarding the use of physical space on their farms, and to map whatever relevant information is obtained.
Time required: 1-2 hours, depending on the complexity of the issue.
Materials: Blackboard and chalk and/or plain paper or newsprint and markers.
Methodology:
Mapping can be a group exercise, with each farmer drawing a map of his or her farm, with the help of the other participants. It can also be done individually. If the former approach is adopted, the educational aspect of the exercise should be emphasized, although the level of detail should perhaps be restricted. Greater detail is possible with families, since every member of the family group can participate. Efforts should be made to ensure the involvement of as many family members as possible, in order to avoid gender or age biases.
Step 1: Gather the participants (10 max.) or their relatives, and explain the objective of the exercise.
Step 2: Discuss how the map is going to be drawn and what items are going to be included (house, fields, pastureland, animals, storage areas, trees, springs, etc.).
Step 3: Help “jumpstart” the exercise (e.g., help locate the first few reference points), and then let the group work on its own, drawing on the board, on paper, or on the ground. Start with a “basic map” of important reference points, such as houses, roads, etc. After this point, the facilitators should refrain from any further involvement.
Step 4: Submit the map to the group for discussion. Complete the final draft with input from the participants.
Step 5: Provide one copy of the map/s for the community and one for the technical team. Discuss their possible uses (see “systemic farm model”, “farm planning map”).
NOTE: This map is an essential starting point for problem analysis and farm planning.

92
SYSTEMIC FARM MODEL
MARKET
SALE
SALE
CORN
SORGHUMFEED
MILK FEED
FEED
MAN
URE
CON
SUM
PTIO
N
CONSUMPTION
SEED FERTILIZERW
ORK
WO
RKSE
EDS
WORK
WO
RK
EGGS
PASTURE

93PARTICIPATORY APPRAISAL: PRODUCTION SYSTEMS
5.4 Systemic farm model
Exercise objective: Use the map to develop a model of the production unit, including its sub-components, flows, and exchanges. This will serve as the basis for a “system-oriented” analysis that can be understood by both farmers and professionals.
Time required: 2-3 hours, depending on the complexity of the issue.
Materials: Blackboard and chalk and/or paper or newsprint and markers.
Methodology:Step 1: Gather the participants and explain the objective of the exercise. Select one
of the farms as an example, with the approval of the group.
Step 2: The facilitator should begin the exercise him or herself, in order to make sure it is clearly understood. First, the participants must be asked to divide the farm into different components, based on the map: farmland, pastureland, house, storage areas, forest, etc. These components should then be put on the board, clearly separated from one another (a flowchart superimposed on the map itself would be too confusing). Universally understood symbols should be used.
Step 3: The facilitator should ask the farmer and his or her family to list (with the help of the group) everything that “comes out” of each component (production, by-products, waste), starting with one of the “crop” components. Labeled arrows should be used to show where each product comes from and where it goes (e.g., to the house for consumption, to the market for sale, etc.).
Step 4: The same procedure should be followed for everything that “goes in” to each component (inputs, labor, etc.). The source of each input should be identified.
Step 5: Repeat the process for each component (as long as the exercise does not become too complicated). As soon as the participants “get the hang” of the exercise, they should be left to work on their own, with as little interference as possible.
Step 6: If the participants agree, flows can be quantified.
Step 7: Transcribe the diagram/s, providing one copy for the community and one for the technical team. Discuss its possible uses (see “problem census”, feasibility of alternatives).

94 TRANSECT WALK AND PLOT DIAGRAMMING
ISSUE: Crop distribution (Peru)
P P PP P PC C CB
B B
PB
PB
PB
PB
PB
PB
PB
PB
PB
PB
PB
PB
PB
PB
PB
PB
PB
PB
PB
PB
PB
PB
PB
PB
PB
PB
PB
PB
PB
PB
PC
PC
PC
PC
PC
PC
PC
PC
PC
PC
PC
PC
PC
PC
PC
PC
PC
PC
PC
PC
PC
PC
PC
PC
PC
PC
PC
PC
PC
PC
PC
PBPBPBPB
P = POTATO C = CORN B = BEANS
(According to Rhoades)
PCPCPC
PC

95PARTICIPATORY APPRAISAL: PRODUCTION SYSTEMS
5.5 Transect walk and plot diagramming
Exercise objective: To identify in the field, and portray in a diagram, the various aspects of farm plot management: plot use, crops and varieties thereof, cultural practices, problems, and development potential. This diagram can serve as a starting point for a discussion of alternatives.
Time required: This may vary, depending on the distances covered and the complexity of each plot. The entire exercise can be completed in a couple of hours. The ensuing discussion should not last longer than 1 hour.
Materials: A farm map, a pad for note-taking during the tour, newsprint, and markers for the final diagram.
Methodology:
The methodology is similar to that employed for the community transect walk and diagramming exercise. In this case, the “micro” aspects of a farm plot are emphasized. The idea is to describe farm characteristics and changes by touring each plot. Management issues such as variations in cropping patterns, changes in varieties, pests, etc. should be documented in detail. The exercise follows the participatory farm mapping approach.Step 1: The exercise should be conducted with family members – and others, if
necessary (e.g., a focus group). Discuss the best route for the tour; it does not have to be a straight line, but it should be as diverse as possible in terms of terrain, land use, etc. The technical team may find a checklist or interview guide to be very useful (see “semi-structured dialogue”).
Step 2: Begin the tour, following the agreed itinerary. Write down the main features and changes encountered. Since changes can be difficult to detect in an individual plot, input should be requested from the participants. Write down all observations and comments.
Step 3: (This step can be carried out during or after the tour, depending on the complexity of the plot.) Portray the information obtained from the participants on a large sheet of newsprint, as a plot diagram that includes all of the sections identified and their respective names.
Step 4: Following a discussion with the group or with each participant, add essential information to the diagram regarding the use and state of resources in each section of the farm plot: What does each section contain (soil characteristics, use – whatever is relevant)?• Why have [management or other] changes taken place?• Who works in and benefits from each section?Specific problems associated with these issues can be listed.
Step 5: Ask the participants what they think of the exercise. Write the results down and turn them over to the group.

96
SOIL MANAGEMENT PRACTICES
CORN
1. BURNED 2. USED FOR LIVESTOCK
3. LEFT ON THE GROUND
SORGHUM
STUBBLE
- LEASEHOLDERS
- OUT OF HABIT
- TO FIGHT PESTS
- TO GROW PASTURE
- PART-TIME FARMERS
- LIVESTOCK OWNERS
OR
- LEASEHOLDERS PAYING IN STUBBLE
OR
- LEASE PLOT WITH STUBBLE
- OWN NO LIVESTOCK
OR
- HAVE ENOUGH LAND TO GRAZE ELSEWHERE
OR
- BUY LIVESTOCK FEED

97PARTICIPATORY APPRAISAL: PRODUCTION SYSTEMS
5.6 Description of management practices
Exercise objective: Farmers differ from each other, not only in terms of access to resources, but also in the way they manage such resources. Management practices can be identified in a participatory manner. More importantly, farmers can be asked why they adopt different practices.
Time required: 1-2 hours, depending on the complexity of the issue and the number of participants.
Materials: Blackboard and chalk, or newsprint and markers, cards.
Methodology:
Step 1: Identify the issue/s to be analyzed (based on a prior assessment of problems).
Step 2: Gather a group of experienced individuals – preferably from different groups / strata within the community. Explain the objective of the exercise.
Step 3: Ask the participants to identify the management practices followed in the community. Portray them visually.
Step 4: Hold a “brainstorming session” to determine who employs different practices and why they do so. The facilitator should not settle for superficial answers; the factors that influence management practices – access to resources, land tenure, family composition, influence of external factors such as projects and extension workers, etc. – must all be examined. Use open questions.
Step 5: A number of ideas will emerge regarding the purpose of each practice and the factors that shape it. These ideas must be analyzed and, if necessary, classified (e.g., natural factors, economic factors, etc.). They should also be ranked in order of importance, if there is a large number of them. An analysis of the relationship between problems and causes may be necessary.
Step 6: Final analysis. The sustainability of each practice (economically, environmentally, etc.) should be assessed, in order to determine whether it constitutes a problem or a solution for development. Other tools are also available for this purpose (analysis of solutions, prioritization, etc.).

98
FARM PROBLEM CENSUS
PASTURE(0.7 Ha.)
COWS (2)
LOW MILK PRODUCTION
-VERY POOR PASTURE-EROSION DISEASES
DISEASES
CHICKENS
SWINE(3)
HOUSE
VEGETABLESYARD
PASTURE
FUELWOOD
-NOT ENOUGH-POOR QUALITY
NOT ENOUGH TO SELL
NOT ENOUGH STUBBLE
EROSION
NOT ENOUGH STUBBLETO FEED
LIVESTOCKAND LEAVE ON THE GROUND
MANGO
Doesn’t sell
Old trees
Losses
1. Low yields
2. Low price
3. Borer
ORANGES
CORN 0.7 Ha.
BEANS 0.35 Ha.
SORGHUM 0.7 Ha.
CORN(0.35 Ha.)
BEANS(0.35 Ha.)
TEAKPLANTATION
-POOR GROWTH-PAPERWORK

99PARTICIPATORY APPRAISAL: PRODUCTION SYSTEMS
5.7 Farm problem census (based on farm map and systemic model)
Exercise objective: To work with farmers and their families and/or the working group to inventory all problems involving the use of resources and the production system, using the map and/or the model as a guide. “Bottlenecks” are easy to identify using the model.
Time required: 1-2 hours, depending on the complexity of the issue and the number of participants.
Materials: Farm map and/or farm model diagram, blackboard and chalk or newsprint and markers, cards.
Methodology:
Step 1: Gather the participants and explain the need for – and desirability of – a precise inventory of the problems facing the community’s production system. Use the details in the map and the flows in the diagram to develop a comprehensive, thorough view of the situation.
Step 2: Using the diagram as a guide, ask the participants the following question regarding each flow: What are the main problems in this area? Write the problems down on individual cards or on the blackboard, at each level.
Step 3: Once the participants believe they have finished addressing an issue, select the cards that are to be kept (to avoid repetition). No card should be eliminated without the agreement of all the participants.
Step 4: Move on to the next stage of the diagram and repeat the exercise.
Step 5: Once the entire process has been completed, discuss the problems as a whole. Record them in the diagram.
Step 6: Ask the participants what they think of the exercise. Write the results down and turn them over to the group.

100
CROP CALENDARin an African village
JAN. FEB. MAR. APR. MAY. JUN. JUL. AUG. SEPT. OCT. NOV. DEC.
JAN. FEB. MAR. APR. MAY. JUN. JUL. AUG. SEPT. OCT. NOV. DEC.
CROPS
RAINS
BEANS BEANS
CORN
RUSTC.B.D. C.B.D.
PIGEON PEA PIGEON PEA
SORGHUM
APHIDSFROST
APHIDSFROST
SORGHUM
RAINS
COFFEE - PAPAYA - MANGO
PESTS - DISEASES
CORN / BEAN HARVEST
PIGEON PEA / CORN HARVESTPIGEON PEA HARVEST
FOOD AVAILABILITY
101PARTICIPATORY APPRAISAL: PRODUCTION SYSTEMS
5.8 Seasonal crop calendars
Exercise objective: To illustrate the community’s production calendar. These diagrams are a particularly effective way of illustrating the relationship that exists between various activities and seasonal changes. They can be used to design initiatives and plan appropriate measures. Parameters may include rainfall, crop calendars, calendars of related activities, labor availability and demand, pests and diseases, visits by extension workers, and social events, among others.
Time required: 2 hours.
Materials: Blackboard and chalk, or newsprint and colored markers.
Methodology:
Step 1: Organize a meeting with the entire community or with interested members. Explain the purpose of the seasonal calendar, and discuss the parameters to be included; these will vary depending on the approach and the group involved. Limit the discussion to 4 or 5 parameters.
Step 2: Draw a time scale on the blackboard or newsprint. Use the calendar employed by the community (January may not necessarily be its starting point). Let the participants decide who is going to draw.
Step 3: Use lines or boxes to describe the seasonal variations of each parameter. The starting point does not have to be the beginning of the year. Crop descriptions, for example, can begin at the month when most planting takes place. If necessary, a longer time period may be employed. Proceed in this manner until the year is completed. Repeat for each parameter.
Step 4: Discuss the results, identifying the best/worst times of year to carry out an initiative.
Step 5: Explain how the calendar will be used. Provide the participants with a copy.
Step 6: The calendar developed by one group can be consolidated with and checked against the results of the other groups.

102
FLOW CHART OF ACTIVITIES:CORN PRODUCTION
Decision to plant corn
Planting
First weeding
Second weeding
Drying
Harvest
Storage
Sale
Preparation of land
Plot selection

103PARTICIPATORY APPRAISAL: PRODUCTION SYSTEMS
5.9 Flowchart of activities
Exercise objective: To systematically portray the flow of events and decisions required to carry out a productive activity (for example, to grow a crop). This type of diagram has several uses; it can serve as a quantification criterion (e.g., for investments), as a basis for discussing problems, or as a means of illustrating the complexity of the knowledge required for certain processes.
Time required: 1/2-1 hour per diagram.
Materials: Blackboard and chalk, or newsprint and colored markers.
Methodology:
Step 1: Gather a group of people who are interested in and have experience with the issue. Explain the objective of the exercise. If the crop calendar has been completed, this exercise can focus on some of the items in that document.
Step 2: Ask the following: Where does the process begin? Write the first stage on the board, and proceed systematically until the entire process has been covered. Participants often add new stages that precede the first one written on the board.
Step 3: The diagram can be expanded by asking the participants which steps are required to make decisions at various points throughout the process. “Branches” are added, following a procedure similar to that of the problem tree (see card).
Step 4: Quantification. Quantifiable information, such as input amounts and labor required at various stages of the process, can be added to the diagram.
Step 5: Ask the participants what they think of the exercise. Write the results down and turn them over to the group.
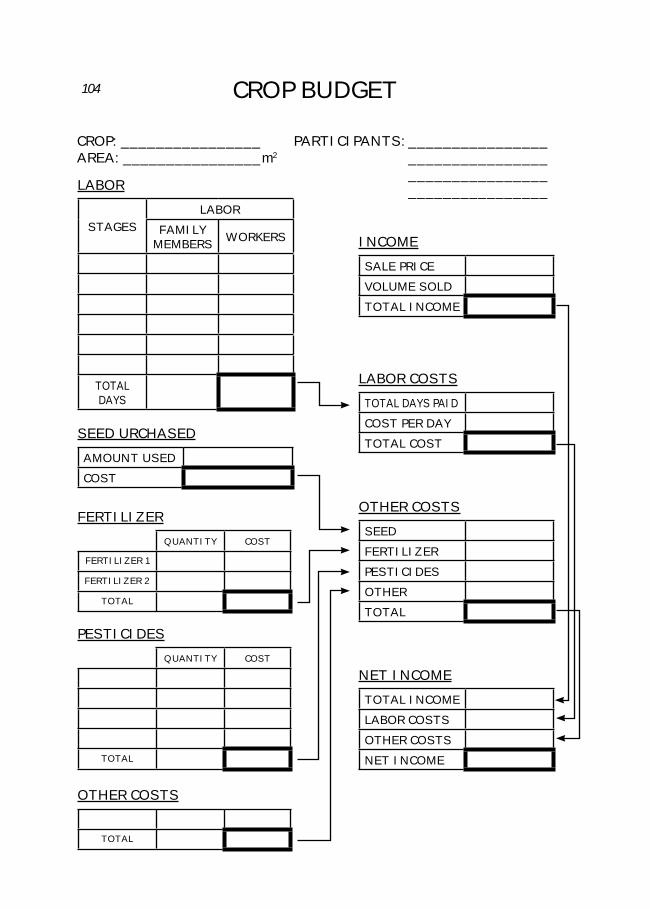
104 CROP BUDGET
CROP: ________________ PARTICIPANTS: ________________ AREA: ________________ m2 ________________ ________________ ________________LABOR
STAGESLABOR
FAMILYMEMBERS WORKERS
TOTAL DAYS
FERTILIZERQUANTITY COST
FERTILIZER 1
FERTILIZER 2
TOTAL
PESTICIDESQUANTITY COST
TOTAL
OTHER COSTS
TOTAL
SEED URCHASEDAMOUNT USEDCOST
INCOMESALE PRICEVOLUME SOLDTOTAL INCOME
LABOR COSTSTOTAL DAYS PAIDCOST PER DAYTOTAL COST
OTHER COSTSSEEDFERTILIZERPESTICIDESOTHERTOTAL
NET INCOMETOTAL INCOMELABOR COSTSOTHER COSTSNET INCOME

105PARTICIPATORY APPRAISAL: PRODUCTION SYSTEMS
5.10 Crop budget (based on flowcharts of activities)
Exercise objective: To analyze production costs and income with farmers, using the crop flowchart or some other sequence of activities as a guide. This exercise enables producers to easily devise their own budgets.
Time required: 1-2 hours, depending on the complexity of the issue and the number of participants.
Methodology: Flowchart of activities, blackboard and chalk or newsprint and markers.
Step 1: Gather the participants and explain the need for – and desirability of – a precise assessment of farming production costs and income. Tracking activities over time helps to provide a complete, detailed understanding of the situation. If the participants have not completed the flowchart, they should do so at this point. A detailed appraisal can be developed for a specificcase, or the group can work to establish average values or ranges.
Step 2: Using the flowchart of activities as a guide, ask the participants the following questions:• How much land is being farmed? – for calculations in manzanas or
hectares.• Family labor – Who works during this stage? For how many days?• Paid labor – Were paid workers employed during this stage? For how
many days, and at what cost?• Seeds – Were seeds purchased? If so, determine the amount and the
price (including shipping costs).• Pesticides – Were pesticides used? If so, determine the amount and the
price (including shipping costs). • Other inputs – machinery, plow rental, other.• Harvest shipment – Were there shipping costs? If so, determine the
total cost.• Production – How much was produced? Quantity produced (there
should be a clear understanding of the units of measure employed).• Sale – How much was sold? At what price?The data obtained should be written on the board in an orderly fashion (see illustration). Use symbols if necessary.
Step 3: Once the data are organized, total costs and income – gross, net (with or without the value of family labor), net daily income from family labor – can be easily calculated with the participants.
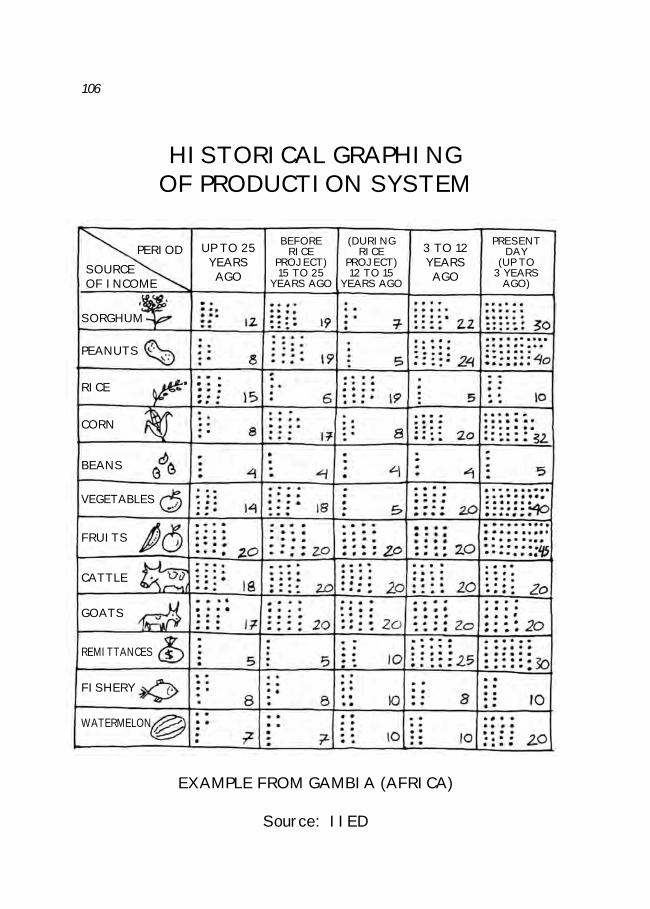
106
HISTORICAL GRAPHING OF PRODUCTION SYSTEM
PERIOD UP TO 25 YEARSAGO
BEFORERICE
PROJECT)15 TO 25
YEARS AGO
(DURINGRICE
PROJECT)12 TO 15
YEARS AGO
3 TO 12 YEARSAGO
PRESENTDAY
(UP TO 3 YEARS
AGO)SOURCEOF INCOME
SORGHUM
PEANUTS
RICE
CORN
BEANS
FRUITS
CATTLE
GOATS
FISHERY
WATERMELON
REMITTANCES
VEGETABLES
EXAMPLE FROM GAMBIA (AFRICA)
Source: IIED
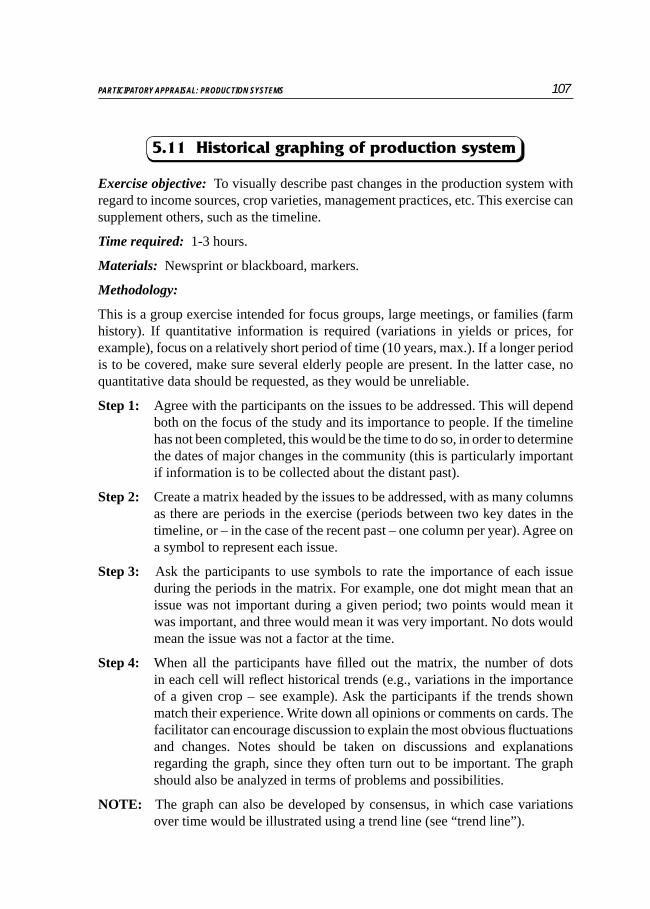
107PARTICIPATORY APPRAISAL: PRODUCTION SYSTEMS
5.11 Historical graphing of production system
Exercise objective: To visually describe past changes in the production system with regard to income sources, crop varieties, management practices, etc. This exercise can supplement others, such as the timeline.
Time required: 1-3 hours.
Materials: Newsprint or blackboard, markers.
Methodology:
This is a group exercise intended for focus groups, large meetings, or families (farm history). If quantitative information is required (variations in yields or prices, for example), focus on a relatively short period of time (10 years, max.). If a longer period is to be covered, make sure several elderly people are present. In the latter case, no quantitative data should be requested, as they would be unreliable.
Step 1: Agree with the participants on the issues to be addressed. This will depend both on the focus of the study and its importance to people. If the timeline has not been completed, this would be the time to do so, in order to determine the dates of major changes in the community (this is particularly important if information is to be collected about the distant past).
Step 2: Create a matrix headed by the issues to be addressed, with as many columns as there are periods in the exercise (periods between two key dates in the timeline, or – in the case of the recent past – one column per year). Agree on a symbol to represent each issue.
Step 3: Ask the participants to use symbols to rate the importance of each issue during the periods in the matrix. For example, one dot might mean that an issue was not important during a given period; two points would mean it was important, and three would mean it was very important. No dots would mean the issue was not a factor at the time.
Step 4: When all the participants have filled out the matrix, the number of dots in each cell will reflect historical trends (e.g., variations in the importance of a given crop – see example). Ask the participants if the trends shown match their experience. Write down all opinions or comments on cards. The facilitator can encourage discussion to explain the most obvious fluctuationsand changes. Notes should be taken on discussions and explanations regarding the graph, since they often turn out to be important. The graph should also be analyzed in terms of problems and possibilities.
NOTE: The graph can also be developed by consensus, in which case variations over time would be illustrated using a trend line (see “trend line”).
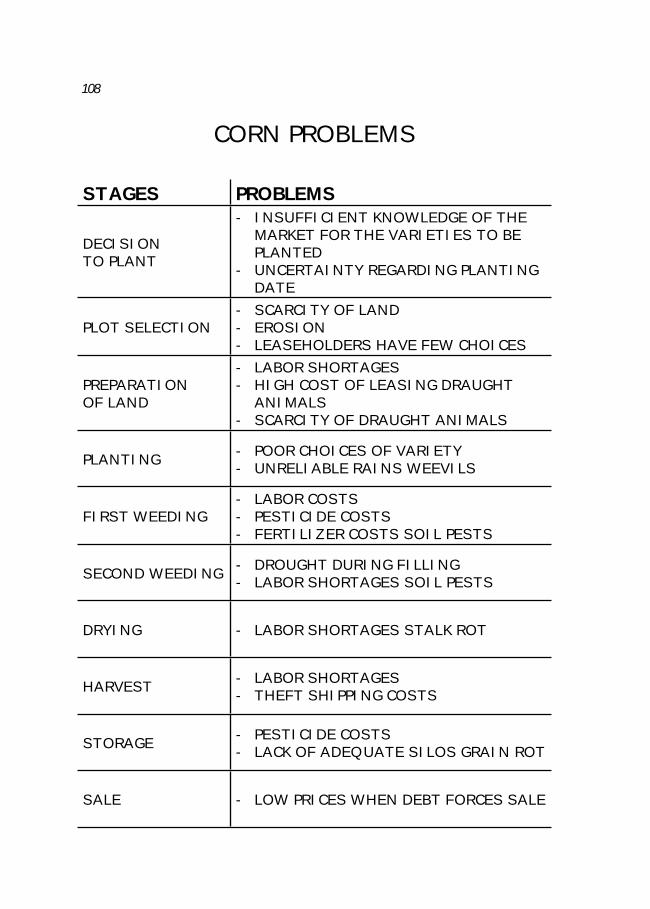
108
CORN PROBLEMS
STAGES PROBLEMS
DECISIONTO PLANT
- INSUFFICIENT KNOWLEDGE OF THE MARKET FOR THE VARIETIES TO BE PLANTED
- UNCERTAINTY REGARDING PLANTING DATE
PLOT SELECTION- SCARCITY OF LAND- EROSION- LEASEHOLDERS HAVE FEW CHOICES
PREPARATIONOF LAND
- LABOR SHORTAGES- HIGH COST OF LEASING DRAUGHT
ANIMALS- SCARCITY OF DRAUGHT ANIMALS
PLANTING - POOR CHOICES OF VARIETY- UNRELIABLE RAINS WEEVILS
FIRST WEEDING- LABOR COSTS- PESTICIDE COSTS- FERTILIZER COSTS SOIL PESTS
SECOND WEEDING - DROUGHT DURING FILLING- LABOR SHORTAGES SOIL PESTS
DRYING - LABOR SHORTAGES STALK ROT
HARVEST - LABOR SHORTAGES- THEFT SHIPPING COSTS
STORAGE - PESTICIDE COSTS- LACK OF ADEQUATE SILOS GRAIN ROT
SALE - LOW PRICES WHEN DEBT FORCES SALE

109PARTICIPATORY APPRAISAL: PRODUCTION SYSTEMS
Exercise objective: To identify all of the problems the community faces with regard to crops / seasonal activities, using the crop flowchart or some other sequence of activities as a guide.
Time required: 1-2 hours, depending on the complexity of the issue and the number of participants.
Materials: Flowchart of activities, blackboard and chalk or newsprint and markers, cards.
Methodology:
Step 1: Gather the participants and explain the need for – and desirability of – a precise assessment of farming production costs and income. Tracking activities over time helps to provide a complete, detailed understanding of the situation. If the participants have not completed the flowchart, they should do so at this point.
Step 2: Using the diagram as a guide, ask the participants the following question regarding each flow: What are the main problems in this area? Write the problems down on individual cards or on the blackboard, at each level.
Step 3: Once the participants believe they have finished addressing an issue, select the cards that are to be kept (to avoid repetition). No card should be eliminated without the agreement of all the participants.
Step 4: Move on to the next stage of the diagram and repeat the exercise.
Step 5: Once the entire process has been completed, discuss the problems as a whole. Record them in the diagram.
Step 6: Ask the participants what they think of the exercise. Write the results down and turn them over to the group.
5.12 Crop / seasonal activity problem census (based on flowcharts of activities)

110CO
TTO
N A
ND
RIC
E BI
OGR
APH
IES
(IN
DIA
)
Dur
atio
n: 1
80 d
ays
Har
vest
: 2.
5 Q
/acr
e
Dur
atio
n: 1
60-1
80 d
ays
Har
vest
: 26
sac
ksIm
med
iate
res
pons
e to
fe
rtili
zer
Dur
atio
n: 1
40 d
ays
Har
vest
: 30
-40
sack
sLa
te r
espo
nse
to
fert
ilize
r
Dur
atio
n: 1
80 d
ays
Har
vest
: 2.
5 Q
/acr
eD
urat
ion:
170
day
sH
arve
st:
3 Q
/acr
e
Dur
atio
n: 1
60 d
ays
Har
vest
: 3.
5 Q
/acr
e
NO
RIC
E GR
OW
ING
EDO
SYST
EM
TALL VARIETIES SHORT VARIETIES

111PARTICIPATORY APPRAISAL: PRODUCTION SYSTEMS
5.13 Crop biographies
Exercise objective: To become acquainted with the community’s crop history – the varieties it has traditionally employed, and those it has imported from other areas. The exercise sheds considerable light on agricultural changes, as well as the decision-making process of farmers. It can also serve as a starting point for a discussion of the relative merits of each variety (see “agronomic preference matrix”).
Time required: Approximately 1 hour.
Materials: Blackboard and chalk, or newsprint and markers.
Methodology:
Step 1: Gather a group of respondents, including elderly people, and explain the objective of the exercise.
Step 2: Ask the participants about the varieties currently employed. Have they always been used? If not, when were they introduced? Why? Who brought them? What varieties were used before? Create a time scale that shows when each variety was introduced.
Step 3: Ask the participants to describe the characteristics of each variety. Then ask them to illustrate the diagram.
This exercise can be followed by the development of an agronomic preference matrix. It should be repeated with several sources, in order to “cross-check” the data of different communities.

112PR
EFER
ENCE
MA
TRIX
RICE
VA
RIET
IES
VARI
ETIE
SCR
ITER
IA
HA
RVES
T
(
0.7
Ha.
)
STO
RAGE
CAPA
CITY
PEST
RESI
STA
NCE
GRA
INQ
UA
LITY
PRO
DU
CTIO
NCO
STS
INCO
ME
PREF
EREN
CE
FE
RT
IL
IZ
ER
NEE
DCO
MPO
ST

113PARTICIPATORY APPRAISAL: PRODUCTION SYSTEMS
5.14 Agronomic preference matrix
Exercise objective: To analyze the criteria and preferences that determine which crops, varieties, etc. are preferred by the community. This analysis should be based on the knowledge of the community’s farmers. This is an essential first step, which should precede any recommendation or transfer of technology.
Time required: A maximum of 3 hours, depending on the complexity of the issue and the type of participants involved.
Materials: Paper, cards, markers, blackboard, or newsprint.
Methodology:
The example shows an assessment of farmers’ knowledge of beans, as well as the criteria they employ and the varieties they prefer.Step 1: Gather a group of experienced farmers from the area. It is very important
to include women; they should either participate alongside the others or be included in separate working groups. Explain the objective of the exercise.
Step 2: Work with the participants to create a list of criteria they believe to be important in the selection of a crop variety. The discussion can begin with open questions such as, “What do we like in a bean variety?” and “What do we not want?”
Step 3: Draw up a list of locally known varieties (no restrictions should be applied, and local names should be used).
Step 4: Draw a matrix on the board. The matrix should have as many columns as there are varieties to be analyzed, and as many lines as there are selection criteria. Explain the purpose of the matrix, and agree on an evaluation scale (from 3 to a maximum of 5; for example, 0 = bad, 1 = good, 2 = very good). Use symbols if there are illiterate people in the group.
Step 5: The evaluation may be performed either by consensus (where everyone agrees on a score) or by voting (where participants assign scores individually. In this case, colored markers should be used, in order to allow men and women to vote together while also leaving a record of their preferences). Participants must rate each criterion.
Step 6: Discuss the results. Determine whether they are consistent with the experiences of the group. If strong differences of opinion emerge along gender lines – as is often the case – discuss their possible causes. Transcribe the results and provide the group with a copy of the final matrix.
NOTE: The facilitator may conclude the exercise by asking the group to “create” an ideal variety, specifying the most important characteristics that would please everyone. This information can be very useful when experimenting with new varieties in the community.

114
EX ANTE EVALUATION MATRIX
MUCK
SANDYSOIL
ROCKYSOIL
VARIETY “X”
2 SACKSFERTILIZER /
M2
3 SACKS
2 SACKS COMPOST
2 SACKS COMPOST
3 SACKS
3 SACKS
SHADESOIL
SAMPLE
VARIETY “H” VARIETY “Y”
FARMER CREATING AN EVALUATION MATRIX
ON THE GROUND FOR 2 VARIETIES OF COFFEE
Pebbles represent expected yield.

115PARTICIPATORY APPRAISAL: PRODUCTION SYSTEMS
5.15 Ex ante agronomic evaluation matrix
Exercise objective: To work with the community to determine whether certain crop varieties are suited to local conditions, according to the knowledge of local farmers. Unlike the preference matrix, this exercise provides much more reliable quantitative data than a closed-question interview.
Time required: A maximum of 3 hours, depending on the complexity of the issue and the commitment of the participants.
Materials: Paper, cards, markers, blackboard or newsprint. Soil samples and specimens of the crops being studied may also be useful.
Methodology:The matrix shown in the example was created to determine what the “normal” yield of local corn varieties should be.
Step 1: Gather a group of experienced farmers from the area. Explain the objective of the exercise.
Step 2: Discuss the soil types suited to corn in the area, as well as the varieties known and used by farmers. It may be useful to visit the area and take soil samples. Discuss other growing conditions that influence yields (steepness, cultural practices); use the categories created by the farmers. Two parameters are used in the example: soils (3 types) and fertilizer (2 types). Three varieties of corn are evaluated.
Step 3: Draw a matrix made up of 3 columns (3 varieties of corn) and 6 rows (3 types of soils, 2 levels of fertilizer use). The matrix can be drawn either on the ground (if samples are used, as is the case when illiterate farmers are present) or on the board. Explain the matrix. If it is drawn on the ground, samples (soil, fertilizer, corncobs) may be used instead of writing.
Step 4 : Ask the group to determine the expected corn yield for each “treatment” (ranges can also be requested). If there are strong disagreements, discuss and write down the differing results. The yield can be expressed using writing, rocks, corn kernels, etc.
Step 5: Discuss the results. Determine whether they are consistent with the experiences of the group. Transcribe the results and provide the group with a copy of the final matrix.
NOTE: This method is also used for ex ante analysis in the development of techniques for testing varieties and treatments, in order to learn the opinion of farmers beforehand. It has cut costs by eliminating unrealistic treatments.

117
6
PARTICIPATORY APPRAISAL:
ANIMAL PRODUCTION

118
LIVESTOCK INVENTORY
COWS1-3
1-2
3-6
3 or morePIGS
119PARTICIPATORY APPRAISAL: ANIMAL PRODUCTION
6.1 Livestock inventory
Exercise objective: To visually portray household livestock resources in the community.
Time required: 1-2 hours.
Materials: Blackboard and chalk or newsprint and colored markers.
Methodology:
Step 1: Gather a small group of respondents who know the community well. Explain the objective of the exercise.
Step 2: Work with the participants to create a basic map detailing certain reference points (roads, etc.). The map should include all of the houses in the community. Ask the participants whether each household owns livestock; obtain a quantitative assessment, if possible. The same procedure can be applied to pasture resources. The respondents can identify households anonymously.
Step 3: The exercise should be repeated with several groups of respondents, in order to verify the data obtained.

120
ANIMAL PRODUCTION CALENDARS1. AVAILABILITY OF FODDER (INDIA)
WINTER
RICE CHAFF
PASTURE CUT GRASS
STUBBLE
CONTINUOUS OCCASIONAL
Horse sickness
Tafia
Swine Fever
TREE LEAVES
Pneumonia
Anthrax
According to IIED
Parasites (ticks)
WINTERDROUGHT RAINS
2. PREVALENCE OF DISEASES (AFRICA)

121PARTICIPATORY APPRAISAL: ANIMAL PRODUCTION
6.2 Seasonal animal production calendars
Exercise objective: To draw a calendar of animal-production activities. These diagrams are a particularly effective way of illustrating the relationship that exists between various activities and seasonal changes. They can be used to design initiatives and plan appropriate measures. Parameters may include climate, availability of fodder and water, the reproductive cycle, production, labor investment, etc.
Time required: 2 hours.
Materials: Blackboard and chalk, or newsprint and colored markers.
Methodology:
Step 1: Organize a meeting with the community or with interested members. Explain the purpose of the seasonal calendar, and discuss the parameters to be included.
Step 2: Draw a linear time scale on the blackboard or newsprint. Use the calendar employed by the community (January may not necessarily be its starting point). Let the participants decide who is going to draw.
Step 3: Use lines or boxes to describe the seasonal variations of each parameter. The starting point does not have to be the beginning of the year. If necessary, a longer time period may be employed. Proceed in this manner until the year is completed. Repeat for each parameter.
Step 4: Discuss the results, identifying the best/worst times of year to take action in each case.
Step 5: Explain how the calendar will be used. Provide the participants with a copy.
Step 6: The calendar developed by one group can be consolidated with and checked against the results of the other groups.

122
FORAGE MAP
12.6 ha.PRIVATE
PASTURELAND(12 head)
4.9 ha.PRIVATE PASTURELAND
(8 head)
22.4 ha.COMMUNITY
PASTURELAND6 partners – 12/18 head
PRIVATEPASTURELANDUNDER LEASE
8.4 HA.
CUT GRASS (4 TAREAS)
TROUGHS

123PARTICIPATORY APPRAISAL: ANIMAL PRODUCTION
6.3 Forage map
Exercise objective: To map the forage resources used to feed livestock throughout the year. This instrument is applied mainly when part of the fodder used to feed animals proceeds from communal pastureland, and/or when livestock is moved on a seasonal basis.
Time required: 2 hours.
Materials: Blackboard and chalk, or newsprint and colored markers.
Methodology:
Step 1: Gather a group of respondents and explain the objective of the exercise.
Step 2: Ask the participants to identify the main grazing areas on a basic map of the community. Determine whether each area is private or communally owned.
Step 3: Show the location of each herd on the map, as well as its seasonal movements, if any.
Step 4: Show the location of other fodder sources, drinking troughs, etc.
NOTE: This exercise can be used to evaluate forage resources (see “preference matrix”) and conduct problem-assessment exercises.
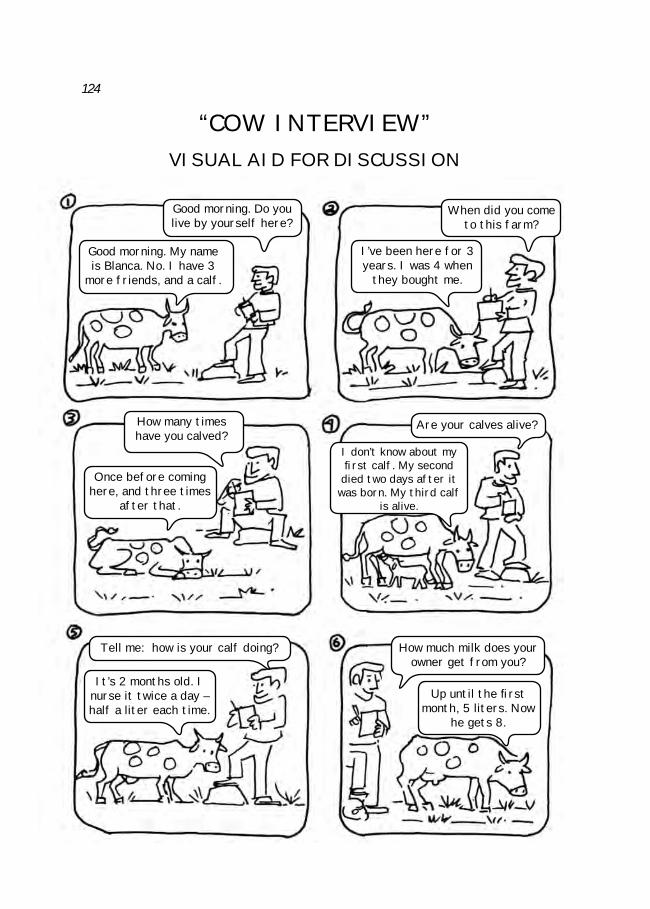
124
“COW INTERVIEW”VISUAL AID FOR DISCUSSION
Good morning. Do you live by yourself here?
When did you come to this farm?
Good morning. My name is Blanca. No. I have 3
more friends, and a calf.
Once before coming here, and three times
after that.
It’s 2 months old. I nurse it twice a day – half a liter each time.
Up until the firstmonth, 5 liters. Now
he gets 8.
I don’t know about my first calf. My second
died two days after it was born. My third calf
is alive.
I’ve been here for 3 years. I was 4 when
they bought me.
How many times have you calved?
Are your calves alive?
Tell me: how is your calf doing? How much milk does your owner get from you?

125PARTICIPATORY APPRAISAL: ANIMAL PRODUCTION
6.4 “Cow interview”
Exercise objective: It is usually very difficult to obtain reliable information from farmers regarding mortality and birth rates, disease prevalence, and management practices when animals are raised on a large scale, as is often the case. If one asks a farmer, “How many of your animals have died?”, the answer will probably be a reflection of what he or she expects to receive from the professional. “Interviewing a cow” is a humorous way of obtaining accurate information on a specific animal.
Time required: 1/2 hour.
Materials: A notepad.
Methodology:
Before beginning the exercise, the facilitators should prepare a questionnaire (of the “semi-structured interview” type) that covers the issues they wish to address.
Step 1: Explain to the participants that a specific animal must be selected in order to obtain concrete data. This animal will be “interviewed” with the help of the participants, who will serve as “interpreters”. Ask the farmer to lead the group to the animals.
Step 2: Ask the “interpreter” to help interview the animal. All questions should refer specifically to the animal selected. The interview may include questions such as “When did you come to this farm?”, “How many times have you calved?”, “What became of your children?”, etc. The questionnaire should be used as a guide. Write the answers down.
Step 3: Repeat the exercise with as many animals as necessary, in order to cover a representative portion of the herd.
The data obtained can be consolidated with a survey.
The most important questions and answers in the interview may also be illustrated, in order to encourage problem analysis.

126
“DISEASE MAP”A swine disease, as described by farmers (Africa)
DIARRHEA
SPOTTEDBLADDER
WORMS IN INTESTINES
SPOTTEDKIDNEY
SNOT
SPOTS
LOCALNAME
TECHNICALNAME FARMERS HEALERS
EXTENSIONWORKERS AND
VETERINARIANS
NJOKA HELMINTIASIS XXX XXX XXX
MEETHO CONJUNCTIVITIS XX X X
MAURI PNEUMONIA XX XX XX
MUTOMBO TRIPANOSOMIASIS XX X
PREVALENCE OF DISEASESAccording to farmers, traditional healers,
and extension workers (Africa)
XXX = VERY COMMON XX = COMMON X = RAREAccording to IIED

127PARTICIPATORY APPRAISAL: ANIMAL PRODUCTION
6.5 Assessment of veterinary problems
Exercise objective: To work with the community to assess the main veterinary problems suffered by its domestic animals. This allows professionals to inventory and analyze problems, as well as to evaluate local knowledge of the issue.
Time required: A maximum of 2 hours, depending on the complexity of the issue and the commitment of the participants.
Materials: Paper and markers, blackboard or newsprint.
Methodology:
Step 1: Create a “disease map”. Ask the participants to draw a large picture of the animal to be studied. Then ask them to identify the diseases found in the animal, based on the organs where symptoms appear. This visualization technique helps participants convey their knowledge.
Step 2: Once the diseases have been identified and illustrated in the drawing, their causes should be displayed in a flowchart, using the same procedure employed for the problem tree.
Step 3: Identify possible solutions.
Step 4: If a large number of options are identified, ask the participants to prioritize them (see “problem priority matrix”).


129
7
PARTICIPATORY APPRAISAL:
GENDER ISSUES
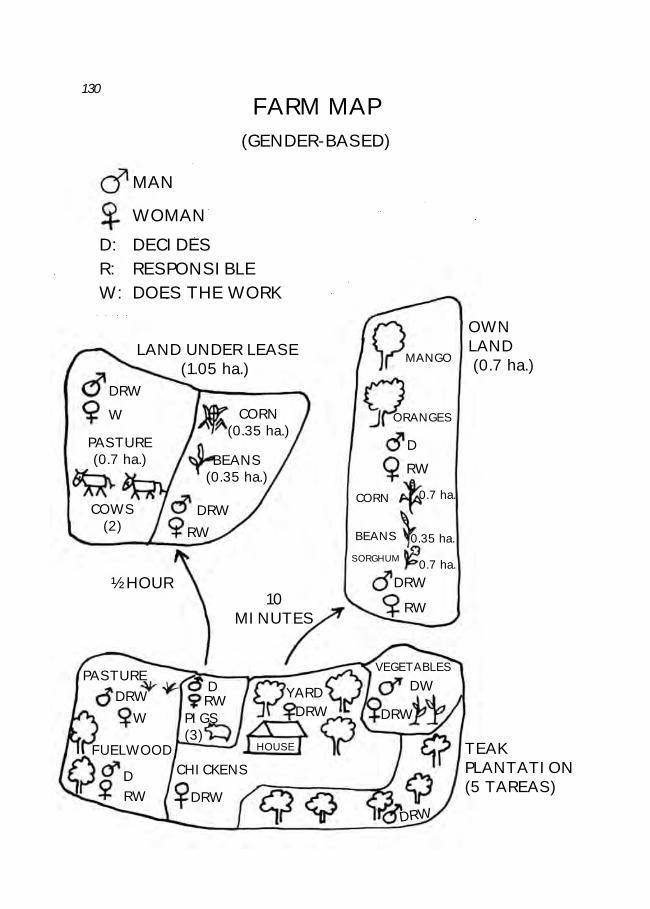
130
FARM MAP(GENDER-BASED)
MAN
WOMAND: DECIDESR: RESPONSIBLEW: DOES THE WORK
DRW
DRW
RW
DRW
DRWDRW DRW
DRWDRW
D
D
RW
RWDW
PASTURE
FUELWOODCHICKENS
YARD
VEGETABLES
HOUSE
DRW
W
W PIGS(3)
RW
PASTURE(0.7 ha.)
CORN(0.35 ha.)
BEANS(0.35 ha.)
COWS(2)
½ HOUR10
MINUTES
OWNLAND (0.7 ha.)
LAND UNDER LEASE(1.05 ha.)
TEAKPLANTATION(5 TAREAS)
MANGO
ORANGES
CORN
BEANS
SORGHUM
0.7 ha.
0.7 ha.
0.35 ha.

131PARTICIPATORY APPRAISAL: GENDER ISSUES
7.1 Gender-based farm map
Exercise objective: To foster mutual learning on the different roles of gender in family farming, using the farm map as a guide. This issue is essential to developing better initiatives.
Time required: Approximately 1 hour, depending on the complexity of the issue and the commitment of the participants.
Materials: Farm map, colored markers.
Methodology:
This exercise requires a farm map. Men, women, and children should participate; ideally, they should be involved in the initial development of the map.
Step 1: Explain to the participants that, in order to complete the map, information must be provided as to who does what on the farm. The criteria may be as follows:
Gender: Distinguish men, women, and children from each other.
Responsibilities: “D” – Who decides? Ask: Who decides how a resource is used? (For example, the man may be in charge of deciding where wood is cut).
“R” – Who is responsible? Ask: Who is responsible for procuring goods? (For example, the wife may be responsible for making sure firewood is available).
“W” – Who does the work? (For example, women and children may be in charge of gathering firewood).
Step 2: Study all of the aforementioned farm areas and production activities, in order to determine who makes decisions, who is responsible for each task, and who does the work. In the example mentioned above, which involves firewood, the area of the farm where firewood is gathered may be labeled with the following symbols:
D R T
Step 3: Once the map has been finished, the different roles identified can be transcribed on separate sheets of paper. This can lead to lengthy discussions, it is important for the professional not to get involved.

132
USE OF TIME
Example from the Dominican Republic(according to C. Butler, in “Tools for the Field”)
A TYPICAL DAY IN THE LIFE OF A WOMANSHE RECEIVES HELP FROM:
TASK HERHUSBAND
HERDAUGHTERS
HERSONS
HERYOUNGERCHILDREN
Lighting the stove XX XXXXXMaking coffee X XXXXFeeding chickens X XXX XXGathering palm X XXXX XXX XMilking cow
Finding water XXXXX XX XCookingbreakfast
Cooking beans XXXXCleaning house and yard XXXBuying groceries XXX XX XXXCooking rice XXXXWashing clothes XXEating and taking lunch to husband
Washing dishes
Ironing XXXXMaking coffee XXXKnitting XXXGathering wood XXX XXX XXRoasting coffee XMaking supper XXXXWashing dishes XXXBathing children XX
133PARTICIPATORY APPRAISAL: GENDER ISSUES
7.2 Use of time
Exercise objective: To foster mutual learning among men and women regarding the true contribution of the latter to the family farm. This exercise is the simplest, most effective way of dispelling myths regarding the “limited” role of women.
Time required: 1-2 hours.
Materials: Blackboard or newsprint; markers.
Methodology:
This exercise can be conducted in a number of different ways: with women only, with men and women together, or with men and women split into separate groups, in order to compare notes at the end.
Step 1: Gather the participants and explain the objective of the exercise.
Step 2: Create a timeline (the exercise is easier if a day is used as the basis for the scale). Ask each woman (or a sampling of the group) what time she gets up in the morning; then ask her to list everything she does during the day – and at what time – until she goes to bed.
Step 3: Once each woman’s use of time has been analyzed, a simple mathematical operation can be performed: how many hours a day does each woman work? How many different activities does she perform over the course of a day?
Step 4: This exercise can lead to interesting discussions between men and women. If they have been working separately, show the results of the women’s group to the men, and ask for feedback. If the men have created their own diagram to illustrate the time use of women, comparing the two versions will inevitably lead to much discussion. The facilitator must never express an opinion; the participants should be allowed to draw their own conclusions.
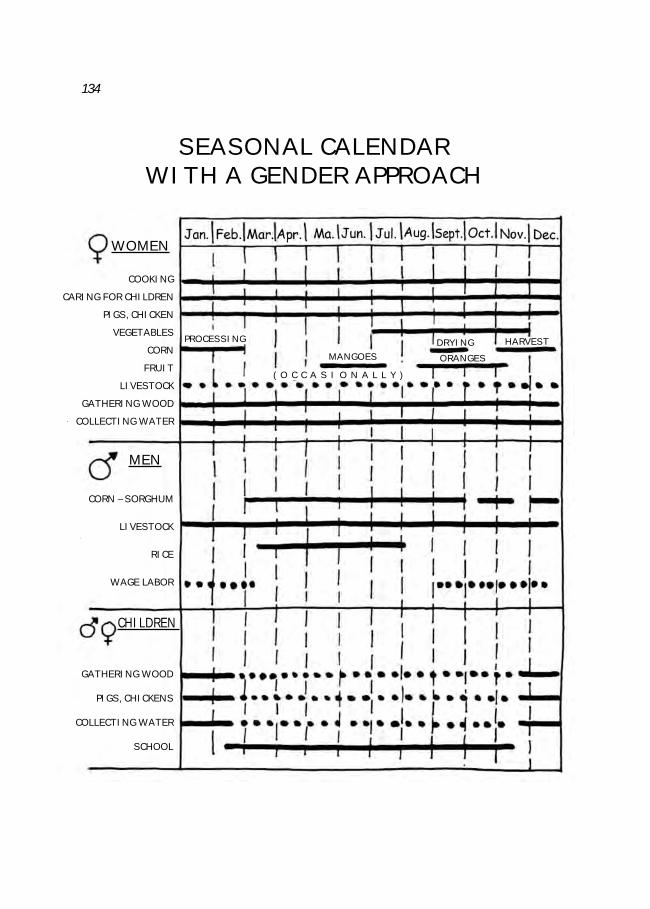
134
SEASONAL CALENDAR WITH A GENDER APPROACH
COOKING
CARING FOR CHILDREN
PIGS, CHICKEN
VEGETABLES
CORN
FRUIT
LIVESTOCK
GATHERING WOOD
COLLECTING WATER
CORN – SORGHUM
LIVESTOCK
RICE
WAGE LABOR
GATHERING WOOD
PIGS, CHICKENS
COLLECTING WATER
SCHOOL
WOMEN
MEN
CHILDREN
PROCESSING
MANGOESDRYING HARVEST
ORANGES
( O C C A S I O N A L L Y )

135PARTICIPATORY APPRAISAL: GENDER ISSUES
7.3 Gender-based seasonal calendar
Exercise objective: To create a production calendar which shows how responsibilities are distributed by gender.
Time required: 2 hours.
Materials: Blackboard and chalk, or newsprint and colored markers.
Methodology:
Step 1: Organize a meeting with the community or with interested members (it may be advisable to split men and women into two separate groups). Explain the purpose of the seasonal calendar, and discuss the parameters to be included.
Step 2: Draw a linear time scale on the blackboard or newsprint. Use the calendar employed by the community (January may not necessarily be its starting point). Let the participants decide who is going to draw.
Step 3: Use lines or boxes to describe the seasonal variations of each parameter. Specify whether each activity is carried out by men, women, or children. Proceed in this manner until the year is completed. Repeat for each parameter.
Step 4: Discuss the results, identifying the best/worst times of year to carry out an initiative.
Step 5: Explain how the calendar will be used. Provide the participants with a copy.
Step 6: The calendar developed by one group can be consolidated with and checked against the results of the other groups.

136
VISIT RELATIVES IN THE CITY
FIND LOST ANIMALS
VISITFRIENDS
VISITMARKETTO SELL
LIVESTOCK
VISITRELATIVES IN
THE CITY
AGROCHEMICALSTORE
MEETING IN TOWN
MEETING IN TOWN
VISIT RELATIVES IN THE CITY
VISITHOSPITAL
FARMERS’BANK
VISITHOSPITAL
1 DAY
1 DAY
MOBILITY MAPHOUSEHOLD: X

137PARTICIPATORY APPRAISAL: GENDER ISSUES
7.4 Mobility map
Exercise objective: While this exercise is similar to the map of exchanges, its main objective is to determine where each member of the family spends his or her time outside the farm, in order to study roles and responsibilities by gender.
Time required: Approximately, 1 hour, depending on the complexity of the issue and the commitment of the participants.
Materials: Blackboard and chalk, or newsprint and colored markers.
Methodology:
The mobility map should be developed on an individual basis (if a group is involved, each participant should do the exercise individually). Men and women should both participate, separately or together.
Step 1: Explain the objective of the exercise, which is to determine why people leave the farm, and for how long.
Step 2: Draw the farmhouse in the middle of the blackboard or sheet. Ask the individual where he or she goes most frequently (e.g., the market, school, hospital, etc.). Draw these locations around the house (distance can be conveyed by placing them closer to or further from the house), and specify the objective of the trip in each case.
Step 3: Ask the person to draw arrows from the house to each location; more arrows should be drawn for locations that are visited frequently (for example, the facilitator could ask How many times per week or month?). Transcribe the information obtained.
Step 4: Discuss the results. What differences do the maps show between the tasks assigned to men and women?

138
BENEFIT ANALYSIS
BANANA
LEAVES
FRUIT
STALK
ROOT
USE
WHODECIDES
HOWIT IS USED?
WHODOESTHE
WORK?
IS IT SOLD?WHATFOR?
HO
USE
HO
LDEX
PEN
SES
HO
USE
HO
LDEX
PEN
SES
WHODECIDES
HOW MONEY FROM SALE IS USED?
- AS PLATES
- TO WRAP FOOD
- FOR PIGS
- PLANTING IN THE YARD
- SALE
- AS A GIFT
- SALE
- FOOD
- AS A GIFT
- FOR PIGS
ANY ANY
ACCORDING TO: “TOOLS OF GENDER ANALYSIS”, 1993

139PARTICIPATORY APPRAISAL: GENDER ISSUES
7.5 Benefit analysis
Exercise objective: To determine who has access to the products of family labor, and how decisions are made regarding those products. This allows for a more detailed analysis of gender roles within the family.
Time required: Approximately 1-2 hours.
Materials: Blackboard and chalk, or newsprint and colored markers; cards.
Methodology:
This exercise is designed to be carried out at the family level. It is important to make sure that everyone participates. The exercise can also be conducted with a small focus group.
Step 1: Explain the objective of the exercise to the family. Reach an agreement on the resources to be discussed.
Step 2: The facilitator should draw each resource on the board. If the household uses of the product have not all been determined, ask the participants to fillin the missing data. Cards can also be used for the drawings.
Step 3: Ask each member of the household the following questions regarding how resources are used:
Who decides how the resource is used? Who uses the resource? If it is sold, how are the proceeds used? Who decides how money is used?
Each participant’s answers are transcribed in a matrix. If contradictions emerge, the facilitator can encourage discussion to clarify them.
Step 4: Review the matrix and ask the participants for input. What does this matrix teach them?

141
8
PARTICIPATORY APPRAISAL:
COMMUNICATION AND EXTENSION

142
MA
P O
F EX
CHA
NGE
SA
ccor
ding
to
FAO
, 199
5
NGO
INST
IT.
MIN
.AGE
NCY
AGRO
CHEM
ICAL
S
PRO
MO
TER
EXPE
RIM
ENTA
LPL
OT
EXTE
NSI
ON
WO
RKER
MARK
ET INTE
RMED
IARY
VETE
RIN
ARI
AN FA
RMER
FRO
M
OTH
ER C
OM
MU
NIT
Y
WO
MEN
, NO
N-
AFF
ILIA
TED
FARM
ERGR
OU
PM
EN, N
ON
-A
FFIL
IATE
D

143PARTICIPATORY APPRAISAL: COMMUNICATION AND EXTENSION
8.1 Map of exchanges
Exercise objective: To visually portray the exchanges that occur within and outside the community. This exercise differs from the Venn diagram in that it is designed to describe the flows of exchanges (information, materials) involved in agricultural activities. It makes it possible, on the one hand, to cover aspects such as commercial exchanges and, on the other, to identify formal and informal channels of communication. This latter aspect is fundamental to assessing needs for improved communications for extension work.
Time required: Approximately 1-2 hours, depending on the complexity of the issue and the number of participants.
Materials: Paper, markers, blackboard, or newsprint.
Methodology:
Step 1: Gather a group of experienced respondents – preferably from different groups/strata within the community. Explain the objective of the exercise.
Step 2: One way to begin is to discuss exchanges of information. Ask the participants to identify all the actors with whom they exchange technical information, market information, etc. (extension workers from different institutions, other farmers, promoters, agrochemical sales agents, buyers and others); list the actors they mention on the blackboard. Use arrows to draw the flowsof exchange, specifying beside each arrow what is exchanged.
Step 3: The exercise can be extended to a different area (for example, commercial exchanges), following the same methodology.
Step 4: Transcribe the results and leave the original with the participants. Discuss how the exercise will be used.
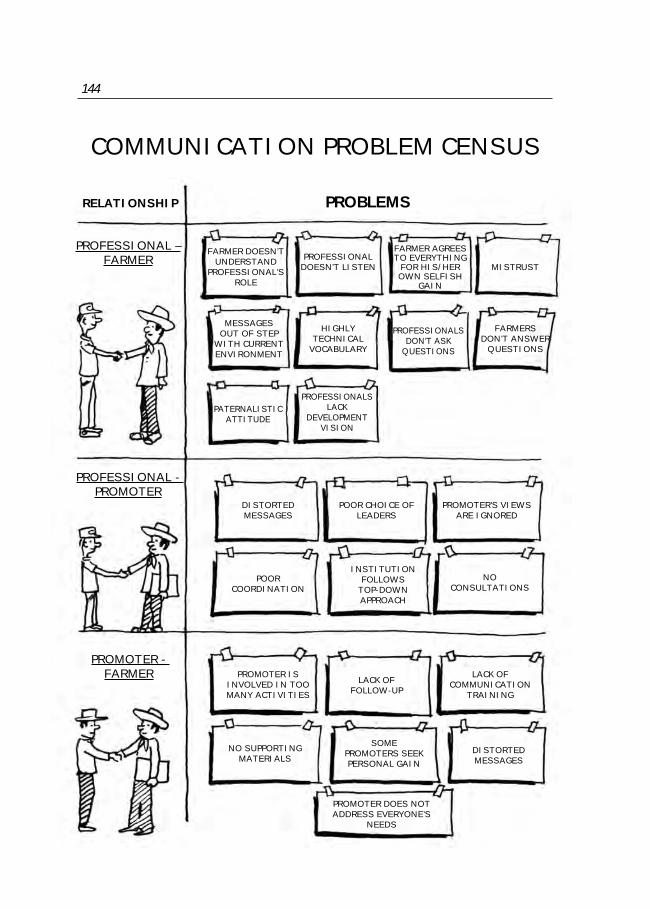
144
COMMUNICATION PROBLEM CENSUS
RELATIONSHIP
PROFESSIONAL – FARMER
PROFESSIONAL - PROMOTER
PROMOTER - FARMER
PROBLEMS
FARMER DOESN’T UNDERSTAND
PROFESSIONAL’SROLE
MESSAGESOUT OF STEP
WITH CURRENT ENVIRONMENT
PATERNALISTICATTITUDE
DISTORTEDMESSAGES
POORCOORDINATION
PROMOTER IS INVOLVED IN TOO MANY ACTIVITIES
NO SUPPORTING MATERIALS
PROFESSIONALDOESN’T LISTEN
HIGHLYTECHNICAL
VOCABULARY
PROFESSIONALSLACK
DEVELOPMENTVISION
POOR CHOICE OF LEADERS
INSTITUTIONFOLLOWS
TOP-DOWNAPPROACH
LACK OF FOLLOW-UP
SOMEPROMOTERS SEEK PERSONAL GAIN
PROMOTER DOES NOT ADDRESS EVERYONE’S
NEEDS
PROMOTER’S VIEWS ARE IGNORED
NOCONSULTATIONS
LACK OF COMMUNICATION
TRAINING
DISTORTEDMESSAGES
FARMER AGREES TO EVERYTHING
FOR HIS/HER OWN SELFISH
GAIN
PROFESSIONALSDON’T ASK
QUESTIONS
MISTRUST
FARMERSDON’T ANSWER
QUESTIONS
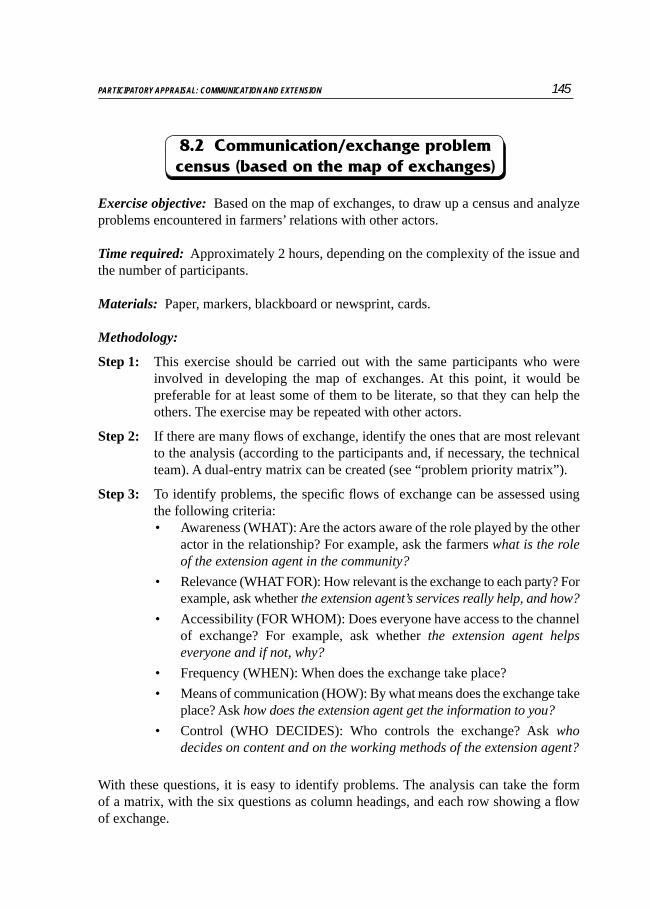
145PARTICIPATORY APPRAISAL: COMMUNICATION AND EXTENSION
Exercise objective: Based on the map of exchanges, to draw up a census and analyze problems encountered in farmers’ relations with other actors.
Time required: Approximately 2 hours, depending on the complexity of the issue and the number of participants.
Materials: Paper, markers, blackboard or newsprint, cards.
Methodology:
Step 1: This exercise should be carried out with the same participants who were involved in developing the map of exchanges. At this point, it would be preferable for at least some of them to be literate, so that they can help the others. The exercise may be repeated with other actors.
Step 2: If there are many flows of exchange, identify the ones that are most relevant to the analysis (according to the participants and, if necessary, the technical team). A dual-entry matrix can be created (see “problem priority matrix”).
Step 3: To identify problems, the specific flows of exchange can be assessed using the following criteria:• Awareness (WHAT): Are the actors aware of the role played by the other
actor in the relationship? For example, ask the farmers what is the role of the extension agent in the community?
• Relevance (WHAT FOR): How relevant is the exchange to each party? For example, ask whether the extension agent’s services really help, and how?
• Accessibility (FOR WHOM): Does everyone have access to the channel of exchange? For example, ask whether the extension agent helps everyone and if not, why?
• Frequency (WHEN): When does the exchange take place?
• Means of communication (HOW): By what means does the exchange take place? Ask how does the extension agent get the information to you?
• Control (WHO DECIDES): Who controls the exchange? Ask whodecides on content and on the working methods of the extension agent?
With these questions, it is easy to identify problems. The analysis can take the form of a matrix, with the six questions as column headings, and each row showing a flowof exchange.
8.2 Communication/exchange problem census (based on the map of exchanges)

146
EXTENSION / TECHNICAL ASSISTANCE PRIORITY MATRIX
PROBLEM NEED PRIORITY
CORN VARIETY RIPENS TOO LATE
- TO STUDY AND TRY DIFFERENT VARIETIES
- ADVICE ON WHEN TO PLANT
- BETTER MARKET INFORMATION
- TO LEARN ABOUT OTHER PROFITABLECROPS
- TOUR OF SUSTAINABLE-AGRICULTUREPROJECTS
- TO LEARN ABOUT ALTERNATIVESTO BURNING
- TO LEARN CONSERVATIONMETHODS
- TO DEVELOP FARM PLANS
TIRED LAND
LOW CORN PRICES

147PARTICIPATORY APPRAISAL: COMMUNICATION AND EXTENSION
8.3 Extension/technical assistance priority matrix
Exercise objective: To identify extension and technical assistance needs and priorities. The exercise has three components: the census of needs, the definition of priorities, and the discussion of priority issues. This tool is very helpful in designing a program based on the felt needs of the people.
Time required: 2-3 hours.
Materials: Newsprint and markers, cards, blackboard.
Methodology:
The exercise can be carried out following a “group profile” or “problem census” approach.
Step 1: Gather a group of interested people/focus group (when working with both men and women, use different marker colors for each sex). Explain the objective of the exercise, clearly specifying that they will be identifying needs for technical assistance and messages, not needs for inputs, credit, etc.
Step 2: Review the aspects of agricultural production discussed earlier (problems, if these have already been identified) and list them in graphic form.
Step 3: Ask the participants what issues/problems require technical assistance and messages; let the participants bring up issues that have not been mentioned already. If certain important issues have not been mentioned, the facilitator may suggest them. Visualize all the issues.
Step 4: List all the issues that have been visualized, in no particular order, on a dual-entry prioritization matrix so that they can be prioritized in pairs (see problem priority matrix), or leave them unchanged on the board if the participants are going to vote individually. Review the issues and set priorities following whatever procedure is best for the participants.
Step 5: Choose the issues with the highest scores and discuss them in greater detail with the participants. Try to determine what messages and technical assistance would be needed, and when.


149
9
ANALYSIS OF PROBLEMS
AND SOLUTIONS

150
PROBLEM TREE
RAINSENDEDEARLY
“IMPROVED”VARIETIES
DIDN’T WORK
DROUGHTDURING
CORN SEED FILLING
EROSIONREDUCESWATER
RETENTION
LACK OF ORGANICMATERIAL
TOO MUCH LIVESTOCKDAMAGES
SOIL
FARMERSIMPORTEDVARIETY
FROM OTHERAREA
LATE-RIPENINGVARIETY
HARVESTWASTE IS BURNED

151ANALYSIS OF PROBLEMS AND SOLUTIONS
9.1 Problem tree: cause-and-effect diagram
Exercise objective: To carry out a more detailed problem census in order to clarify the analysis. This exercise should help the community and the technical team to better understand the issues and distinguish between causes and effects. Although it is a relatively complex exercise, the causes of the main problems can be identified. This exercise should not be used if the group does not seem to be flexible and interested in the discussion.
Time required: 1-3 hours, depending on the complexity of the issue and the number of participants (ideally following the previous exercise).
Materials: Cards, newsprint, and markers, or blackboard and chalk.
Methodology:
Step 1: Review the problems identified and list each one on a separate card.
Step 2: Explain to the participants that they are going to try to identify the problems and their causes. Give a simple example. Ask them to identify a problem they consider very important. Place the card in the middle of the blackboard or paper.
Step 3: Ask the participants to review the other cards to see if other problems might be causing the one that was placed in the middle. Put the “cause” cards under the middle card, in the “causes” line; brainstorm to see if they can identify other causes. Discuss each step.
Step 4: Repeat the exercise to identify other problems that might be a “consequence” of problems already placed on the board.
Step 5: Review all the cards that have not been put up, to see if there might not be a relationship between them and some of the cards already placed on the board.
Step 6: At the end, there should be one or more problem “trees”. It is very important to be able to determine if there is a “central” problem on the tree or trees that leads to most of the other problems.
Step 7: Ask the participants what they think of the exercise. Write down the result and give the paper or a copy of the results to the group.
NOTE: Distinguishing between problems and causes is important in order to correctly define objectives (see, for example, the objectives matrix).

152
PROBLEM PRIORITIES MATRIX
PROBLEM Drought
Drought
Pests
No land
Weeds
No irrigation
Cost of fertilizer
Soil erosion
Pests Weeds Cost of fertilizer
Cost of fertilizer
Cost of fertilizer
Cost of fertilizer
Drought
No land
Drought
No land
No land
Cost of fertilizer
Drought
Pests
Noirrigation
Drought
Noirrigation
Noirrigation
Cost of fertilizer
No land
Soilerosion
Drought
Pests
Weeds
Cost of fertilizer
No land
Noirrigation
PROBLEMS FREQUENCY RANK
DROUGHT . . . . . . . . . . . . . . . . . . . . 5. . . . . . . . . . . . . . . . . . . . . . .2PESTS . . . . . . . . . . . . . . . . . . . . . . . 2. . . . . . . . . . . . . . . . . . . . . . .5WEEDS . . . . . . . . . . . . . . . . . . . . . . 1 . . . . . . . . . . . . . . . . . . . . . . .6COST OF FERTILIZER . . . . . . . . . 6. . . . . . . . . . . . . . . . . . . . . . .1NO LAND . . . . . . . . . . . . . . . . . . . . 4. . . . . . . . . . . . . . . . . . . . . . .3NO IRRIGATION. . . . . . . . . . . . . . 3. . . . . . . . . . . . . . . . . . . . . . .4SOIL EROSION . . . . . . . . . . . . . . . 0. . . . . . . . . . . . . . . . . . . . . . .7

153ANALYSIS OF PROBLEMS AND SOLUTIONS
9.2 Problem priority matrix
Exercise objective: To develop a diagram showing the main problems facing the community. Before prioritizing the problems, it is a good idea to do the preceding exercise, which enables them to distinguish between problems and causes.
Time required: 1 hour.
Materials: Newsprint and markers, or blackboard and chalk.
Methodology:
Step 1: Explain to the participants what the plan is now, to determine as a group what problems have been identified and which are most important to the community or group.
Step 2: Prepare a dual-entry matrix with the same number of rows and columns as the number of problems identified.
Step 3: Start with the cell that includes problem number 1 (first column) and problem number 2 (second row). Ask the participants, “Which problem seems more important, number 1 or number 2?” or “Which problem needs to be solved most urgently, number 1 or number 2?” Once there is a consensus, record the most important problem in the cell.
Step 4: Repeat the exercise comparing all the problems two by two. At the end, half the matrix will have been filled (since only half is necessary)
Step 5: Count how many times each problem appears in the matrix so that they can be organized in order of frequency. The problem that appears most often will be the most important one. This comparison by pairs is less subjective than any other prioritization method.
Step 6: Ask the participants what they think about the exercise. Write down the result and give the sheet of newsprint or a copy of the results to the group.

154
IDENTIFICATION OF LOCAL SOLUTIONS
PROBLEMS:SHORTAGE OF
FUELWOOD
ARE THERE LOCAL SOLUTIONS?
YES:
YES:
YES:
PLANT LIVE FENCES OF MADRECACAO.
TRY PLANTING WITH CUTTINGS
BETTER STOVES
TRY PLANTINGSOMEWHERE ELSE
COMMUNITY FORESTS
DOES THAT PRODUCE GOOD RESULTS?
CAN WE IMPROVE?
NOT ENOUGHHAVE WE
SEEN OTHER SOLUTIONS?

155ANALYSIS OF PROBLEMS AND SOLUTIONS
9.3 Identification of local or imported solutions
Exercise objective: To enable people to identify, with the help of facilitators, what solutions for each problem considered have been tried locally, and if none have, what solutions might be imported or validated. Priority is given to local solutions, leaving imported solutions only for cases in which no local solution has been found or in which local solutions have not produced satisfactory results. There are two advantages to this approach: people are helped in the light of what they are doing to design programs, and the group is encouraged to have trust, self-esteem, and an inquisitive spirit.
Time required: 1-3 hours at the general meeting; several days if field work is required.
Materials: Paper, markers, blackboard.
Methodology:
The work is done at a general meeting (e.g., with a focus group). Note each of the problems identified on the blackboard or paper. Use the following logical flowchart:
Question 1: Have local solutions been found? (What have we done to try to solve the problem?)No: Identify potential solutions that might be imported.Yes: Go to question 2.Don’t know: Do field research.
Question 2: Have local solutions produced good results? (Use an evaluation matrix if necessary).No: Go to question 3.Yes: These solutions should be promoted.Don’t know: Do field research.
Question 3: Can local solutions be improved?No: Go to question 4.Yes: Focus on improving local solutions and possibly changing them with some imported features.Don’t know: Do field research and conduct a technical review.
Question 4: Have we seen solutions elsewhere that might be imported?No: We need to do research, with the help of the technical team.Yes: Make a list of what we have seen so that we can analyze it.
If there is not enough information about local solutions, field work will have to be done (see the next card: self-assessment and field analysis of local solutions). Once the flowchart has been completed, the solutions to all the problems discussed can be organized in a matrix.

156
PLANNING SELF-ASSESSMENT AND FIELD ANALYSIS OF LOCAL SOLUTIONS
Problems Shortage of fuelwood Shortage of wood
What are we looking for?
1) Trees that people use for fuelwood
2) What do people think of these species?
3) What species they plant and where
1) Trees that people use for lumber
2) What do people think of these species?
3) Why don’t people plant more?
Where are we going to look for it?
- Men and women:What is being done now?- Older people: What did they use to
do?
- Men and women: What is being done
now?- Older people: What did they use
to do?- Forestry service
How will we do it? - 3 workshops (men, women, older people)
- walk around the farms
- evaluation matrix
- The same (fuelwood and lumber)
- Interview with forest rangers
Who does it? The Ecology Committee(in charge: María)
The Ecology Committee(in charge: Andrés)
What will we present?
We will make a presentation with the entire community to analyze the results.Invitees: technicians and the forest ranger

157ANALYSIS OF PROBLEMS AND SOLUTIONS
9.4 Self-assessment and field analysis of local solutions
Exercise objective: To identify in the field the solutions that have been implemented locally, in order to respond to the different problems encountered. This is one of the most interesting and important diagnostic exercises, and yet it has often been neglected in project identification processes. It should be conducted in a group format; it allows participants, including technical facilitators, to become aware of their own potential for adaptation and innovation, so that they are able to evaluate it, improve it and organize it systematically.
Time required: Preparation (1-2 hours in a general meeting); field work, from a few hours to several days, depending on the complexity of the issue (the facilitators do not necessarily participate); analysis (2-3 hours).
Materials: Paper, markers, blackboard for preparation; notebooks for field work.
Methodology:
Preparation phase: This depends on the exercise of identifying of local solutions, in which the group will have identified what field research is needed. Depending on the needs, the group will decide what course to take. Decisions must be taken on the following basic points:
• What are we looking for? (Exercise objective: what type of solutions do we want to identify and analyze? What information do we still need?)
• Where are we going to look for it? (In what part of the community, from whom, in what part of the production system, etc.).
• What tools are we going to use? (Among those mentioned in this book: semi-structured dialogue, field observation, community workshops, etc.).
• Define and prepare tools.• Who is going to conduct the assessment? (Responsibilities).
The best approach is to entrust the research to a focus group. By replying to the questions mentioned, the group can agree on the “terms of reference” for the fieldwork. They can agree in advance on a list of outputs expected.
Implementation phase: It is very important to let the group do the research without the presence or participation of facilitators, whose role is more related to preparation and analysis.
Analysis phase: Once the field work has been completed, another meeting should be convened for the group to present its findings. These findings feed into other exercises: identification, analysis and prioritization of solutions.

158SO
LUTI
ON
EVA
LUA
TIO
N M
ATR
IXPr
oble
m: L
osse
s du
e to
dro
ught
in c
orn
field
s
SOLU
TION
Try
othe
r va
riet
ies
Plan
t la
ter
Keep
res
idue
s in
th
e so
il
Plan
t be
ans
as
fert
ilize
r
Bene
fit
Help ne
eded
Ever
ybod
y
bene
fits
Feas
ible
Do we h
ave
to w
ait?
Cost
?Sco
rePr
iori
ty
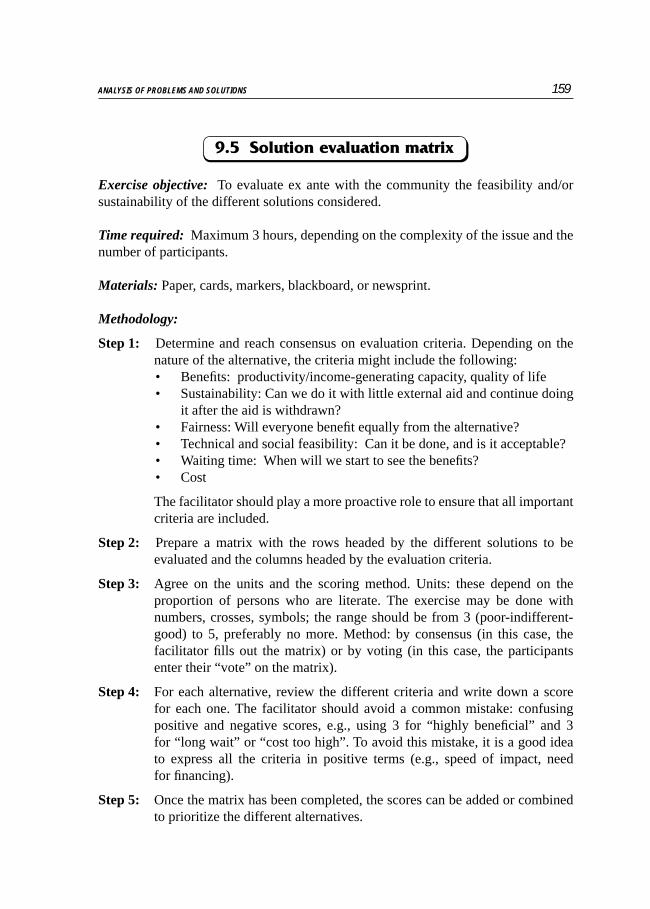
159ANALYSIS OF PROBLEMS AND SOLUTIONS
9.5 Solution evaluation matrix
Exercise objective: To evaluate ex ante with the community the feasibility and/or sustainability of the different solutions considered.
Time required: Maximum 3 hours, depending on the complexity of the issue and the number of participants.
Materials: Paper, cards, markers, blackboard, or newsprint.
Methodology:
Step 1: Determine and reach consensus on evaluation criteria. Depending on the nature of the alternative, the criteria might include the following:• Benefits: productivity/income-generating capacity, quality of life• Sustainability: Can we do it with little external aid and continue doing
it after the aid is withdrawn?• Fairness: Will everyone benefit equally from the alternative?• Technical and social feasibility: Can it be done, and is it acceptable?• Waiting time: When will we start to see the benefits?• Cost
The facilitator should play a more proactive role to ensure that all important criteria are included.
Step 2: Prepare a matrix with the rows headed by the different solutions to be evaluated and the columns headed by the evaluation criteria.
Step 3: Agree on the units and the scoring method. Units: these depend on the proportion of persons who are literate. The exercise may be done with numbers, crosses, symbols; the range should be from 3 (poor-indifferent-good) to 5, preferably no more. Method: by consensus (in this case, the facilitator fills out the matrix) or by voting (in this case, the participants enter their “vote” on the matrix).
Step 4: For each alternative, review the different criteria and write down a score for each one. The facilitator should avoid a common mistake: confusing positive and negative scores, e.g., using 3 for “highly beneficial” and 3 for “long wait” or “cost too high”. To avoid this mistake, it is a good idea to express all the criteria in positive terms (e.g., speed of impact, need for financing).
Step 5: Once the matrix has been completed, the scores can be added or combined to prioritize the different alternatives.

160
SWOT ANALYSIS
Today we can
We can’t control tomorrow
STRENGTHS
OPPORTUNITIES
WEAKNESSES
THREATS
- Community organization - Women do not participate- Availability of land - Lots of tired land- Credit - Tenants have no credit- Local knowledge - Young people not interested in learning - Don’t know the market
- Support of the institution - Change in credit policy- Training, field trips - Imports- Possibility of irrigating - Attitude of wholesalers- Municipal committee on - Property titles sustainable development
161ANALYSIS OF PROBLEMS AND SOLUTIONS
9.6 SWOT Analysis
Exercise objective: To conduct an ex ante evaluation of the main alternatives that have highest priority, to try to compare advantages and disadvantages, foresee possible problems. SWOT methodology is a whole system; in this case, a very simplifieddesign is presented.
Time required: 1-3 hours, depending on the complexity of the issue and the number of participants.
Materials: Paper, cards, markers, blackboard or newsprint.
Methodology:
For each alternative to be analyzed, brainstorm to establish four series of characteristics:
• Strengths: What are the advantages of this solution?• Weaknesses: What are the disadvantages of the solution?• Opportunities: What external elements (in the community, society, institutions,
the natural environment) could positively affect the outcome of the alternative?• Threats: What external elements (in the community, society, institutions, the
natural environment) could negatively affect the outcome of the alternative?
This exercise can be used to review the elements included in the evaluation matrix. The advantage is that it includes external factors that can affect the outcome of the alternative.
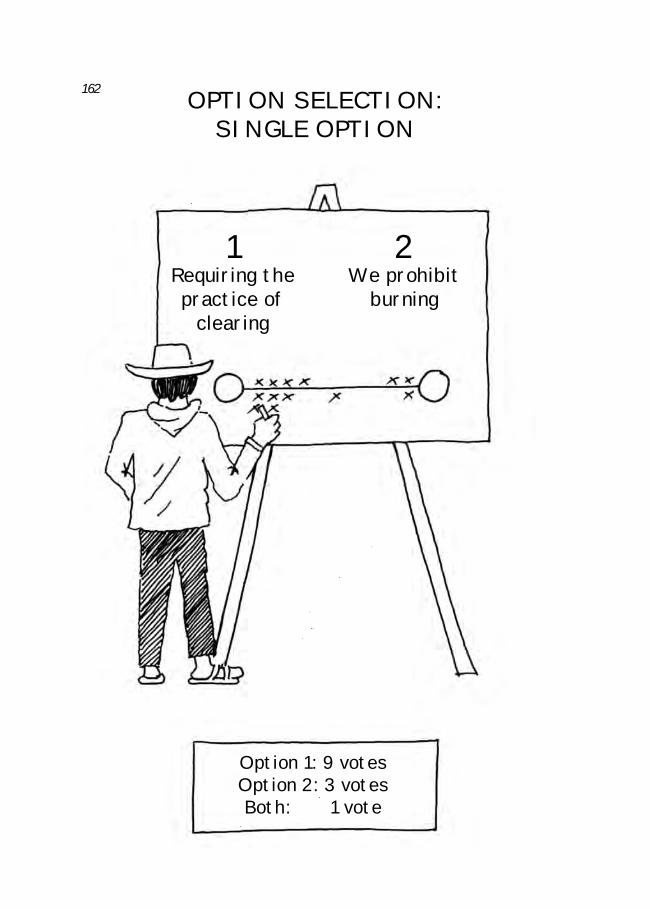
162 OPTION SELECTION:SINGLE OPTION
1Requiring the practice of
clearing
2We prohibit
burning
Option 1: 9 votesOption 2: 3 votesBoth: 1 vote

163ANALYSIS OF PROBLEMS AND SOLUTIONS
9.7 Option selection: single option
Exercise objective: To quickly establish the degree of convergence or divergence among participants regarding different options or opinions being discussed (max. 3 options). The exercise makes it possible to determine immediately how to proceed with the discussion.
Time required: 10-15 minutes.
Materials: Blackboard, newsprint, markers.
Methodology:
Step 1: If the discussion comes to an impasse or goes on too long in connection with just 2 or 3 options, the facilitator should illustrate these points on the blackboard or paper. Join the points with lines (making a triangle if there are three options) (see page 164).
Step 2: Ask each participant to mark with a single cross (or circle) the option that he considers best. The mark can be placed a bit farther, so it is between the options; for example, if the person agrees with both options, he can put the mark halfway between the two.
Step 3: The participants interpret the results: whether there is consensus about one of the options, whether they need to find a compromise between two options, etc. The facilitator should not state his opinion until after the people have stated theirs.

164 OPTION SELECTION:MULTIPLE OPTIONS
BURN SUPERVISION COMMITTEE
OBLIGATORYCLEARING
PROHIBITBURNING
OPTION 1: 3 VOTESOPTION 2: 6 VOTESBETWEEN 1 AND 2: 2 VOTESOPTION 3: 3 VOTES
WHAT SHALL WE DO?
165ANALYSIS OF PROBLEMS AND SOLUTIONS
9.8 Option selection: multiple options
Exercise objective: To quickly establish the preferences of participants for different options or opinions being discussed (when there are more than 3 options and up to 20). The exercise makes it possible to determine immediately how to proceed with the discussion, establishing priorities. This method is less objective than prioritization by pair-comparison matrix, but it is quicker.
Time required: 30-45 minutes.
Materials: Blackboard, newsprint, markers, cards.
Methodology:
Step 1: After a brainstorming session, discussion or diagramming, too many problems or options will have been mentioned to continue discussing all of them. The least relevant ones need to be eliminated. The facilitator puts all the cards on the blackboard and proposes that the participants vote. The group needs to decide how many “votes” each participant will have (this will depend on the number of options and of participants; if there are lots of options and only a few participants, each one might have several votes; the opposite would be the case if there are few options and lots of participants).
Step 2: Each participant is asked to mark all the votes they have with a single cross (or circle) per option.
Step 3: The facilitator organizes the cards in descending order by the number of votes received. The participants interpret the results and decide what steps to take, e.g., stop discussing options that have not received any votes, go into greater detail, etc.

166
VISUALIZED QUESTIONNAIRE
Evaluation of a farmer exchange workshop
MY GROUP’S PARTICIPATION
ORGANIZATIONOF THE
WORKSHOP
VISIT TO THE FARM
TRANSPORTATION
OTHER GROUPS’ PRESENTATION
MEALS
WE HAVE LEARNED SOMETHING NEW
167ANALYSIS OF PROBLEMS AND SOLUTIONS
9.9 Visualized questionnaire
Exercise objective: To quickly establish the views of participants based on a series of questions or subjects. They do not vote, but rather they indicate their opinion by simple marks (e.g., satisfied, not satisfied). This exercise is particularly useful with participants who are illiterate or semi-literate, as their opinion can be determined with a pre-structured questionnaire. The visualized questionnaire can also help to end a discussion that has been too lengthy, or to make the event more interesting.
Application examples: List of problems: to what extent are the participants affected?• list of options: what do the participants think?• evaluation meeting
Time required: 30-45 minutes.
Materials: Blackboard, paper, markers.
Methodology:
Step 1: Develop the questionnaire (depending on the circumstances, the questionnaire may be predetermined, or the points can be decided with the participants).
Step 2: The questions are visualized on the blackboard (using symbols, if some of the participants are illiterate) and organized in matrix form. The group agrees on a simple evaluation scale (e.g., good, indifferent, bad), and columns are drawn in the matrix. An additional column can be included for comments.
Step 3: Each participant is asked to mark with a single cross (or circle) each question in the column that best expresses his opinion.
Step 4: The participants interpret the results. The facilitator should not state his opinion until the people have stated theirs.

168
“YES SIR, NO SIR”
SHOULD WE PROHIBIT BURNING?
YES SIR NO SIR
Pests can be controlled
The Ecology Committee has no authority
That way we can stop
deforestation
Burning is necessary to
eliminate pests
Livestockowners need
it
Crops will increase
The mayor will support us
People will continue
burning anyway
Tenantfarmers are required to
burn
The stubble can be left
Womenshould be included

169ANALYSIS OF PROBLEMS AND SOLUTIONS
9.10 Analysis of pros and cons: “yes sir, no sir” exercise
Exercise objective: To foster open dialogue on a contradictory subject using dynamic role playing to overcome obstacles to the discussion.
Application examples:• When the group needs to evaluate in depth the pros and cons of an option, and
there seem to be limitations and problems that are not being expressed clearly.• When the different perceptions people have of a topic need to be clarified.
Time required: 2-3 hours as needed, not counting preparation time.
Materials: Blackboard, newsprint, markers, cards.
Methodology:Step 1: Identify the topic that needs to be clarified. This should be an issue that
affects everyone in the group, so that they will participate actively. The issue should be expressed in the form of a proposal or a positive statement (e.g., we should completely eliminate the practice of burning).
Step 2: Choose two volunteers from among the participants: the optimist (yes sir) will try to stress all the positive aspects of the proposal or statement (all the good reasons for adopting the proposal). The pessimist (no sir) will do likewise with the negative aspects (all the problems and difficulties that might arise). Members of the technical team may participate as one or the other of the leading characters. They should be given time apart from the group to prepare their arguments.
Step 3: Both of the leading characters should try to get participants to speak in favor of their side. Each idea is visualized on a card and placed on the blackboard, on the “yes sir” or “no sir” side. The game should be seen as a competition to see which of the two will have more ideas on their side.
Step 4: Analysis: When neither side can produce any more ideas or arguments, the pros and cons of the proposal are analyzed, and the cards are placed in order of priority and discussed when pertinent. This can lead to a new round; if there are new volunteers, the first two players can be replaced.
Step 5: The information obtained should be set out in a comparative chart of pros and cons for the original proposal. It might be useful to organize the ideas in the form of an impact diagram.

170
IMPACT DIAGRAM:
INTRODUCING IRRIGATION
BUYLIVESTOCK
NOT EVERYONE BENEFITS
LACK OF MAINTENANCE
BUYEQUIPMENT
BETTERCLOTHES
MEDICINE
INTRODUCING IRRIGATION
BETTER HEALTH
CHILDREN GROW BETTER
ROBBERIES
DISPUTESMORE
POVERTY
REDUCESBENEFITS EQUIPMENT DAMAGED
DISPUTES
BETTER CAPACITY TO WORK
MOREINCOME MORE
FOOD

171ANALYSIS OF PROBLEMS AND SOLUTIONS
9.11 Impact assessment
Exercise objective: To analyze ex ante with members of the community the possible/probable consequences of implementing a project or a specific action. The product is a flowchart similar to the problem tree, but it is usually more specific and easier to develop. It can be used as the basis for important decisions concerning implementation.
Time required: 1-2 hours.
Materials: Paper, cards, markers, blackboard or newsprint.
Methodology:
Step 1: Explain the exercise to the participants.
Step 2: Write in the middle of the blackboard or on a card the title of the action/project the impact of which is to be assessed.
Step 3: Brainstorm about the potential positive consequences of the action; place the ideas at the top of the blackboard/newsprint, in the form of a flowchart:the consequences should be organized in cause-effect chains.
Step 4: Repeat the exercise listing possible negative consequences, placing them in the lower half of the blackboard/newsprint.
Step 5: Discuss the final flowchart.


173
10
PLANNING

174
COMMUNITY PLANNING MAP
Forest
IrrigationIrrigationForest
Forest
Forest
Fruit trees Coffee
Agriculture
Forest and grazing
Forest and grazing
Forest
and gr
azing
Agricul
ture
F r u i t
t r e e s
Fore
stan
d grazing
PLAN 96-98Reforestation
Reforestation
Creek
Soil recovery
Stage 1
Soil recovery
Stage 2
Fruit trees 1
Fruit t
rees 2

175PLANNING
10.1 Community planning map
Exercise objective: To produce a map representing the final objective envisioned by the community, in terms of the planning of natural resources within its area of influence. This document is essential to visualizing the planning for any project that involves changes in resource management.
Time required: 2-3 hours, depending on the complexity of the issue.
Materials: Basic map (participatory map including relevant topics) and transect with a diagram of problems and possible solutions.
Methodology:
Step 1: Explain the exercise to the participants.
Step 2: Using the participatory maps, draw a new “basic map”.
Step 3: Ask the participants to draw a map of how their area might look with the most desirable changes.
Step 4: review the diagrams of problems and alternatives and try to show the different alternatives considered on the map.
Step 5: The planning map incorporating the actions envisaged can help guide a discussion which in turn can provide feedback for the discussion of different alternatives.

176
FARM PLANNING MAPThis is how we want the farm to look 5 years from now
BUY THE PLOT OF
PASTURELAND
LIVEMADRECACAO
FENCE
LIVE VETIVERHEDGES
LEAVE THE STUBBLE
Hayfield
MANUREFERTILIZER
CORN
CORN
CORN
LIVE HAY HEDGES
GRAINSILO
FRUIT TREES
PigstyVEGETABLE
GARDEN
Bananas
EXPAND THE TEAK PLANTATION WITH OTHER SPECI
ES
GRAFTEDORANGE

177PLANNING
10.2 Farm Planning Map
Exercise objective: To produce a map representing the final objective envisioned by families for planning their farm. This map is a “vision” of how they would like to see their farm within, for example, five years. It is not a plan drawn up by the technical team. It is a basic document for visualizing their plans for changes in the management of resources on a specific farm.
Time required: 2-3 hours, depending on the complexity of the issue.
Materials: Map of the farm, preferably including gender aspects.
Methodology:
Step 1: The exercise should be carried out by every member of the family group who is involved in the use of resources. The promoters and/or extension workers should facilitate the process and stress the importance of its being a group effort (a working group could help draft maps of the participants’ farms). Explain to them that they should describe how they would like to see their farm within a given period of time (five years would be a good time frame), and that this map will serve as a point of reference for technical assistance and for planning changes.
Step 2: Ask the participants to draw up a new map of how their farm might look when the most desirable changes are made. Use symbols that are clear to everyone.
Step 3: The map should be kept by the farmers. The technical team should make copies to take back with them. The diagram can be improved year after year so that it can be used as the basis for the yearly plans of the farmers and of the institution, as well as to establish their working goals.
Step 4: The farmers should meet regularly to exchange ideas about their maps. They can also agree on follow-up procedures (see the farm plan).

178
FARM PLAN
PROBLEMS1) LOW CORN PRODUCTION 2) SOIL EROSION3) SHORTAGE OF ANIMAL FEED4) LOW PRICE OF CORN 5) SHORTAGE OF FUELWOOD
SOLUTIONSSHORT-TERM (1-3 YEARS)1) PLANT HEDGES (VETIVER
AND MERKER)2) LEAVE THE STUBBLE3) TRY BEANS AS FERTILIZER4) PLANT A HAYFIELD5) GET A GRAIN SILO6) PLANT MADRECACAO FENCE
LONG-TERM1) BUY A PLOT FOR FORAGE
CROPS2) EXPAND THE VEGETABLE
GARDEN3) PLANT GRAFTED FRUIT
TREES THAT ARE SUITABLE FOR TIMBER
LIMITATIONS1) FAR FROM THE ROAD2) THERE IS NOT FLAT LAND3) THERE IS NO WATER
CLOSER
Name of farmer:Juan PérezCommunity: San JacintoGroup: La Esperanza
THE FARM TODAY
THE FARM FIVE YEARS FROM NOW
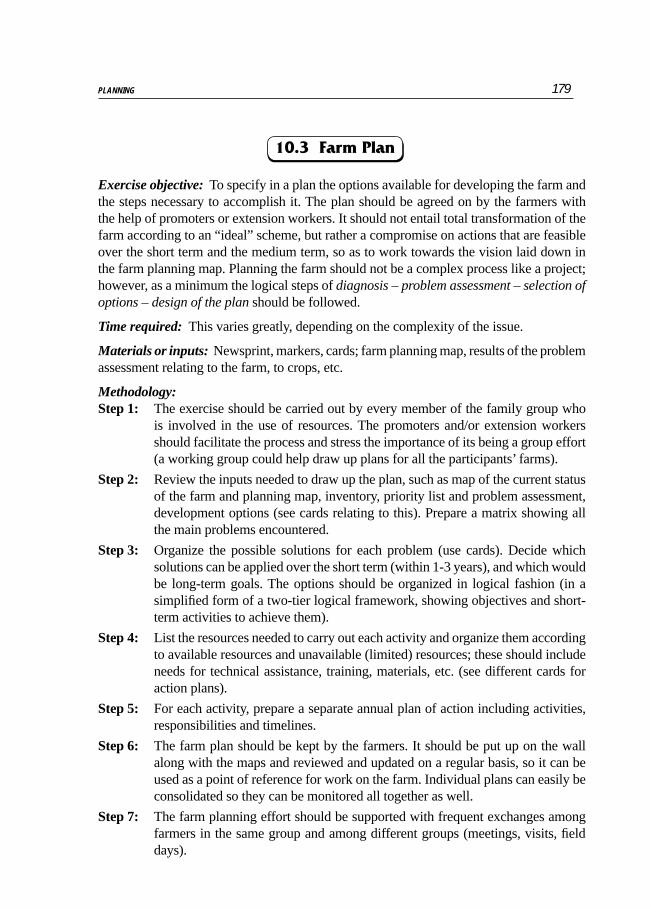
179PLANNING
10.3 Farm Plan
Exercise objective: To specify in a plan the options available for developing the farm and the steps necessary to accomplish it. The plan should be agreed on by the farmers with the help of promoters or extension workers. It should not entail total transformation of the farm according to an “ideal” scheme, but rather a compromise on actions that are feasible over the short term and the medium term, so as to work towards the vision laid down in the farm planning map. Planning the farm should not be a complex process like a project; however, as a minimum the logical steps of diagnosis – problem assessment – selection of options – design of the plan should be followed.
Time required: This varies greatly, depending on the complexity of the issue.
Materials or inputs: Newsprint, markers, cards; farm planning map, results of the problem assessment relating to the farm, to crops, etc.
Methodology:Step 1: The exercise should be carried out by every member of the family group who
is involved in the use of resources. The promoters and/or extension workers should facilitate the process and stress the importance of its being a group effort (a working group could help draw up plans for all the participants’ farms).
Step 2: Review the inputs needed to draw up the plan, such as map of the current status of the farm and planning map, inventory, priority list and problem assessment, development options (see cards relating to this). Prepare a matrix showing all the main problems encountered.
Step 3: Organize the possible solutions for each problem (use cards). Decide which solutions can be applied over the short term (within 1-3 years), and which would be long-term goals. The options should be organized in logical fashion (in a simplified form of a two-tier logical framework, showing objectives and short-term activities to achieve them).
Step 4: List the resources needed to carry out each activity and organize them according to available resources and unavailable (limited) resources; these should include needs for technical assistance, training, materials, etc. (see different cards for action plans).
Step 5: For each activity, prepare a separate annual plan of action including activities, responsibilities and timelines.
Step 6: The farm plan should be kept by the farmers. It should be put up on the wall along with the maps and reviewed and updated on a regular basis, so it can be used as a point of reference for work on the farm. Individual plans can easily be consolidated so they can be monitored all together as well.
Step 7: The farm planning effort should be supported with frequent exchanges among farmers in the same group and among different groups (meetings, visits, field days).

180
LOGICAL FRAMEWORK(Incomplete example)
BROAD OBJECTIVETo increase and normalizethe community’s water supply
SPECIFIC OBJECTIVES1) To reforest the heads of
streams2) To plan land use around
springs
RESULTS1.1 Landowners make the land
available1.2 The community develops and
maintains plantations2.1 A Surveillance Committee is
appointed2.2 Regulations and a land use plan
are drawn up
ACTIVITIES1.1 -Participatory diagnostic analysis -Landowners organize
-Reforestation plan drawn up and negotiated1.2 -Establish the nursery -Planting -Maintenance and protection plan -Fence2.1 -Elect the Committee -Plan of activities2.2 -Land use plan approved by the
Assembly -Land use regulations for use
adopted
…we achieve the broad objective
if we achieve the specific objectives…
we achieve the specific objective
…if we achieve the results
if we implement the activities...
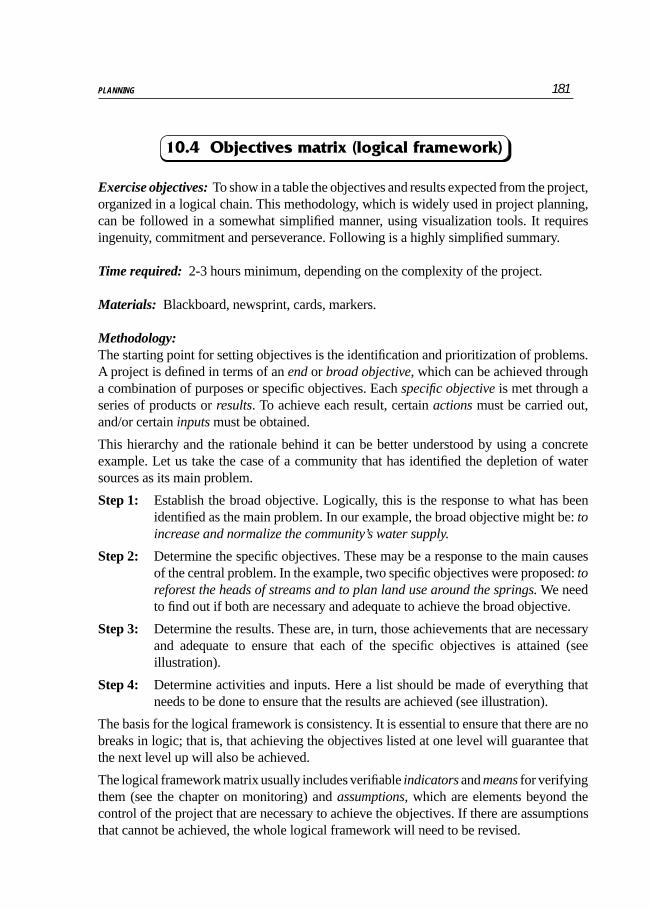
181PLANNING
10.4 Objectives matrix (logical framework)
Exercise objectives: To show in a table the objectives and results expected from the project, organized in a logical chain. This methodology, which is widely used in project planning, can be followed in a somewhat simplified manner, using visualization tools. It requires ingenuity, commitment and perseverance. Following is a highly simplified summary.
Time required: 2-3 hours minimum, depending on the complexity of the project.
Materials: Blackboard, newsprint, cards, markers.
Methodology:The starting point for setting objectives is the identification and prioritization of problems. A project is defined in terms of an end or broad objective, which can be achieved through a combination of purposes or specific objectives. Each specific objective is met through a series of products or results. To achieve each result, certain actions must be carried out, and/or certain inputs must be obtained.
This hierarchy and the rationale behind it can be better understood by using a concrete example. Let us take the case of a community that has identified the depletion of water sources as its main problem.
Step 1: Establish the broad objective. Logically, this is the response to what has been identified as the main problem. In our example, the broad objective might be: to increase and normalize the community’s water supply.
Step 2: Determine the specific objectives. These may be a response to the main causes of the central problem. In the example, two specific objectives were proposed: to reforest the heads of streams and to plan land use around the springs. We need to find out if both are necessary and adequate to achieve the broad objective.
Step 3: Determine the results. These are, in turn, those achievements that are necessary and adequate to ensure that each of the specific objectives is attained (see illustration).
Step 4: Determine activities and inputs. Here a list should be made of everything that needs to be done to ensure that the results are achieved (see illustration).
The basis for the logical framework is consistency. It is essential to ensure that there are no breaks in logic; that is, that achieving the objectives listed at one level will guarantee that the next level up will also be achieved.
The logical framework matrix usually includes verifiable indicators and means for verifying them (see the chapter on monitoring) and assumptions, which are elements beyond the control of the project that are necessary to achieve the objectives. If there are assumptions that cannot be achieved, the whole logical framework will need to be revised.
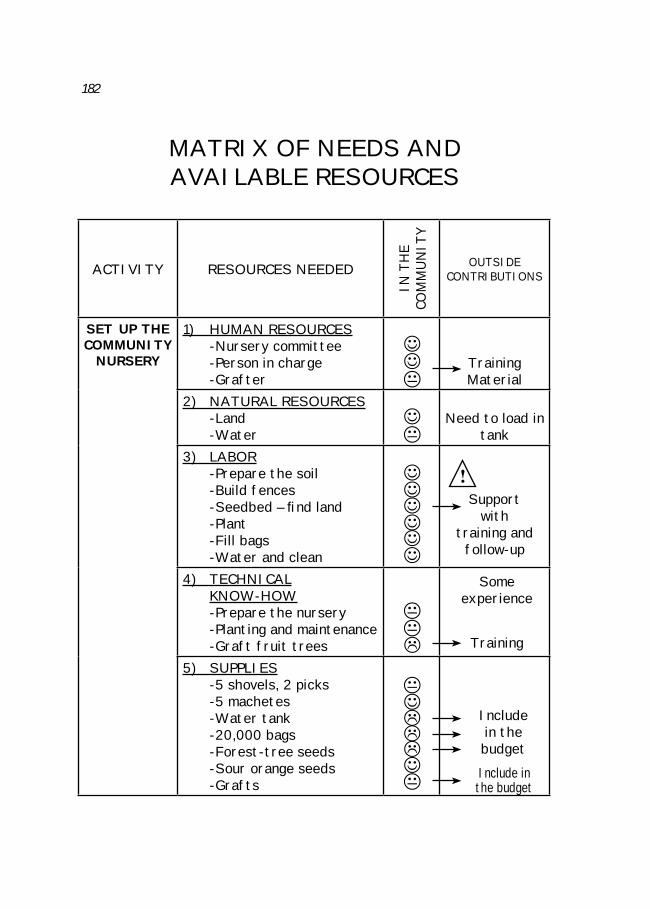
182
MATRIX OF NEEDS AND AVAILABLE RESOURCES
ACTIVITY RESOURCES NEEDED
IN T
HE
COM
MUN
ITY
OUTSIDECONTRIBUTIONS
SET UP THE COMMUNITY
NURSERY
1) HUMAN RESOURCES -Nursery committee -Person in charge -Grafter
TrainingMaterial
2) NATURAL RESOURCES -Land -Water
Need to load in tank
3) LABOR -Prepare the soil -Build fences -Seedbed – find land -Plant -Fill bags -Water and clean4) TECHNICAL
KNOW-HOW -Prepare the nursery -Planting and maintenance -Graft fruit trees5) SUPPLIES -5 shovels, 2 picks -5 machetes -Water tank -20,000 bags -Forest-tree seeds -Sour orange seeds -Grafts
Supportwith
training and follow-up
Someexperience
Training
Includein the budgetInclude in the budget
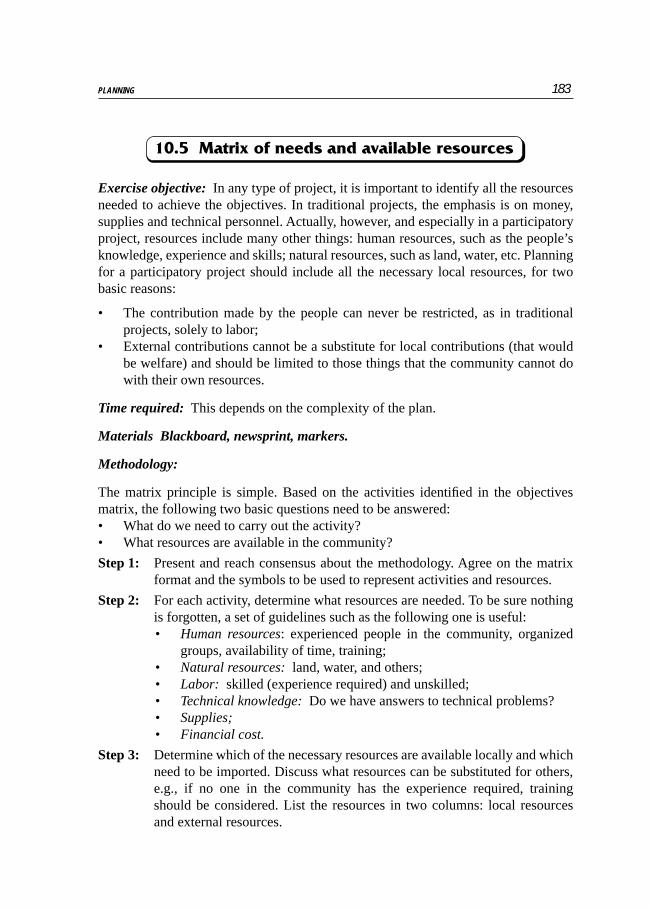
183PLANNING
10.5 Matrix of needs and available resources
Exercise objective: In any type of project, it is important to identify all the resources needed to achieve the objectives. In traditional projects, the emphasis is on money, supplies and technical personnel. Actually, however, and especially in a participatory project, resources include many other things: human resources, such as the people’s knowledge, experience and skills; natural resources, such as land, water, etc. Planning for a participatory project should include all the necessary local resources, for two basic reasons:
• The contribution made by the people can never be restricted, as in traditional projects, solely to labor;
• External contributions cannot be a substitute for local contributions (that would be welfare) and should be limited to those things that the community cannot do with their own resources.
Time required: This depends on the complexity of the plan.
Materials Blackboard, newsprint, markers.
Methodology:
The matrix principle is simple. Based on the activities identified in the objectives matrix, the following two basic questions need to be answered:• What do we need to carry out the activity?• What resources are available in the community?
Step 1: Present and reach consensus about the methodology. Agree on the matrix format and the symbols to be used to represent activities and resources.
Step 2: For each activity, determine what resources are needed. To be sure nothing is forgotten, a set of guidelines such as the following one is useful:• Human resources: experienced people in the community, organized
groups, availability of time, training;• Natural resources: land, water, and others;• Labor: skilled (experience required) and unskilled;• Technical knowledge: Do we have answers to technical problems?• Supplies;• Financial cost.
Step 3: Determine which of the necessary resources are available locally and which need to be imported. Discuss what resources can be substituted for others, e.g., if no one in the community has the experience required, training should be considered. List the resources in two columns: local resources and external resources.

184
ACTION PLAN MATRIXA
CTIV
ITY
SUB-
ACT
IVIT
YPE
RSO
NS
IN C
HA
RGE
DA
TEEs
tabl
ish
the
nurs
ery
JF
MA
MJ
JA
(1) P
repa
re t
he la
nd a
nd
build
fen
ce-N
urse
ry C
omm
itte
eJu
an, I
gnac
io, J
osé,
A
rnol
do, E
lba,
Die
go(2
) Pre
pare
see
d be
ds-N
urse
ry C
omm
itte
e an
d Yo
uth
Club
(3) F
ill b
ags
-Nur
sery
Com
mit
tee
and
Yout
h Cl
ub(4
) Pla
nt-N
urse
ry C
omm
itte
e an
d Yo
uth
Club
(5) W
ater
, cle
an, s
pray
-Nur
sery
Com
mit
tee
(6) P
repa
re p
lant
ing
site
-Nur
sery
Com
mit
tee
and
Yout
h Cl
ub(7
) Pla
ntat
ion
-Nur
sery
Com
mit
tee
and
Yout
h Cl
ub(8
) Tra
inin
g in
gra
ftin
g te
chni
ques
-Nur
sery
Com
mit
tee
-NGO
(9) I
nfor
mat
ion
mee
ting
s wi
th t
he
fore
st r
ange
r
Juan
185PLANNING
10.6 Action plan matrix
Exercise objective: The action plan includes the objectives and corresponding actions, and should indicate goals, persons in charge, and timelines. The executives of the institution usually do this; here, the idea is to mobilize the people’s ability to design a plan of action. The participatory action plan should be drawn up on the basis of criteria that are easy to understand; the matrix is a graphic representation of the plan and must be clear to everyone, since it will be used as the basis for follow-up and evaluation.
Time required: Depends on the complexity of the plan.
Materials: Blackboard, newsprint, markers.
Methodology:
The action plan should be drawn up after the objectives matrix (logical framework) has been developed. The participants have a list of objectives, activities, sub-activities (if they need to be subdivided), and goals. Everyone involved should take part in drawing up the matrix, since this entails making decisions.
Step 1: Present and reach consensus on methodology. Agree on the matrix format and on symbols to be used for activities and sub-activities, as well as the time frames to be used (they should be convenient for the people).
Step 2: Review activities/sub-activities and goals. The action plan matrix repeats the last level of the objectives matrix and, where necessary, divides the activities in as many sub-activities as necessary. The goals have to do with verifiableindicators from the objectives matrix. They indicate how far we plan to go with the action plan. There are quantitative goals (e.g., how many trees will we plant) and qualitative goals (e.g., how will we better organize the people).
Step 3: Decide on responsibilities. Who will do what? Indicate who will be responsible for each sub-activity.
Step 4: Timeline. Indicate how much time is envisaged for carrying out each activity (the best way is to make a graph showing when the activity starts and when the goal must be completed). The graphic timeline makes it possible to determine if all the activities planned can actually be done; for each period, make sure that the plan does not include too many activities.
Step 5: Review. The action plan is very important, since it will guide project implementation and monitoring. Since it is usually drawn up by a small working group, the matrix proposed should be reviewed and discussed by all actors involved before it is approved.

186
RESPONSIBILITY MATRIX
ACT
IVIT
YW
HO C
AN D
O I
T?W
HO D
OES
WHAT?
WE
CAN
D
O I
T O
URS
ELVE
S
WE
CAN
DO
IT
WIT
H
HEL
PTH
E ST
ATE
ASS
OCI
ATI
ON
NGO

187PLANNING
10.7 Responsibility matrix
Exercise objective: To clarify and reach consensus on the assignment of responsibilities among the community and external agents, and encourage participants to take on responsibilities.
Time required: Depends on the complexity of the planning exercise.
Materials: Blackboard and/or newsprint, markers, and cards.
Methodology:
Step 1: List on the blackboard or on cards all the actions that have been proposed for the planning exercise.
Step 2: For each action, ask the participants to decide in which of the following three categories it should be placed:• We can do it ourselves without outside help.• We can do it, with help.• We can’t do it ourselves; the State has to do it (or any other external
agent).
Step 3: For each action that is feasible, clearly establish mutual responsibilities: within the community, and with external agents. The matrix produced will be an essential input for the final planning matrix.


189
11
PARTICIPATORY FOLLOW-UP
AND EVALUATION

190
BRAINSTORMING ABOUT INDICATORS
FOLLOW-UP AND EVALUATION MATRIX
ACTIVITYSUB-ACTIVITY INDICATORS MEANS OF
VERIFICATIONPERSONS IN
CHARGETIMELINE
J F M A M J J A S O N D
PLANTINGPROGRAM
1. Planting promoted
- Number of farmersparticipating
- Planting plans - Reforestation Committee
2.Planconsolidated
- Number of trees and total area
- Reforestation plan 1997
- Reforestation Committee
Number of farmers participating
Number of nurseries and production
Km. of windbreaks Areas planted
Type and number of trees planted
Income from timber sales
Reforesting
Income from sale of fuelwood
Increase in cosumption of wood
and firewood
Increase in corn yields when
windbreaks are used
Improvements in water supply
AGROFORESTRYPROJECT
Participationof women
FOLLOW-UPIMPACT
ASSESSMENT

191PARTICIPATORY FOLLOW-UP AND EVALUATION
11.1 Follow-up and evaluation planning matrix
Exercise objective: draw up a matrix for planning of the participatory monitoring (or follow-up) and evaluation process. This should be a repetitive process, as it entails repeating, at specific intervals, the stages of action (project implementation), observation (monitoring of indicators), and reflection (analysis of results of the observation and proposed adjustments and corrections). The matrix should summarize the actions to be taken, the responsibilities assigned, and the timeline.
Time required: 2-3 hours, depending on the complexity of the issue.
Materials: Blackboard, newsprint, markers, cards.
Methodology:
Hold a meeting with project participants. During the meeting, a matrix will be drawn up to indicate the different activities and their expected results, how measurement will be accomplished (indicators), who will do the measuring (responsibilities), how it will be presented (products), and when (timeline).
Step 1: Analysis of participants and of the group’s situation: “What do we know about the different actors in the project and their respective responsibilities?”
Step 2: Analysis of expectations and fears about activities scheduled: “What are our expectations (expected results) and fears (potential problems) about the project?” This allows the group to expand their vision and enriches the search for indicators.
Step 3: Analysis of indicators: “How can we observe progress and the impact of activities?” (See indicator matrix).
Step 4: Analysis of follow-up responsibilities: “Who should observe the different indicators?” At this level, a decision should be made about setting up a follow-up committee and who will be on it.
Step 5: Analysis of follow-up tasks: “Who will carry out follow-up and evaluation, and what products are expected?”

192
FOLLOW-UP INDICATOR MATRIX
ACTIVITY SUB-ACTIVITY INDICATORS MEANS OF
VERIFICATION
Establishingthe nursery
Organize the Nursery Committee
The Committee serves with the members appointed to it
- Minutes- Meetings- Attendance of
members Prepare the land
The land is fenced, cleared and seed beds ready and bags full
- Evaluation meeting during the second week of February
- Materials Planting and maintenance
Fruit and timber species planted
Number and quality of plants
% germinated by the second week of April
% of survival and quality by the fourth week of May
Planning for planting of timber species
Plantation plan with members
Plan agreed on by 11 members by May
Training in graftingtechniques
3 workshops Members performgrafting
- Evaluation of workshops
- Number of plants and % of grafts that have taken
193PARTICIPATORY FOLLOW-UP AND EVALUATION
11.2 Follow-up indicator matrix
Exercise objective: To draw up a matrix showing the indicators to be used in monitoring or following up on the project. (Here we have made a distinction between follow-up indicators and impact assessment indicators, but in some cases, this is not necessary). Reaching consensus on indicators is a very important aspect of participation in the project.
Time required: 2-3 hours, depending on the complexity of the issue.
Materials: Blackboard, newsprint, markers, cards.
Methodology:
Hold a meeting with project participants.
Step 1: Explain the objective of the meeting and the need for follow-up and evaluation. Participants are usually not familiar with the concept of “indicator”, so practical examples should be given to explain it: take as an example one of the activities in the plan of work and suggest they brainstorm about the question, “How can we know if the activity is being carried out according to plan?” It is easier to identify potential indicators if they are organized under four categories:• Input availability indicators: Do we have the necessary resources to
carry out the activity?• Product availability indicators: Do we have the products needed for
the activity?• Task performance indicators: Are the requisite tasks being
performed?• Process indicators: Are the processes taking place?
Step 2: The second step entails determining how the indicators will be measured. This enables the group to realize that there are the two main types of indicators:• Quantitative indicators: these can be measured in terms of quantities
(usually inputs and products);• Qualitative indicators: these cannot be measured in terms of quantity
(usually tasks and processes).
Step 3: If a large number of indicators have been listed, it may be necessary to prioritize them; one criterion could be to determine if the indicators are measurable.
Step 4: The exercise should be repeated for the different activities and sub-activities, thus constructing the matrix of indicators and results.

194
PARTICIPATORY FOLLOW-UP(TASK COMPLETION)
ALL MEMBERS OF THE GROUP
PARTICIPATE IN FOLLOW-UP
THIS MONTH’S TASKS: MAY
TASK
FILL BAGS
GATHERTIMBER-TREESEEDS
GATHERORANGE-TREESEEDS
GETINPUTS
COMPLETION COMMENTS
-3,000 LARGE BAGS-8,000 SMALL BAGS
-ONLY GOT 1 POUND CEDAR SEEDS
-3 POUNDS
-THE PROFESSIONAL DIDN’T BRING THE FUNGICIDE-WE GOT 1 SACK OF FERTILIZER
195PARTICIPATORY FOLLOW-UP AND EVALUATION
11.3 Participatory follow-up forms (task completion)
Exercise objective: To facilitate for the community some simple forms to enable them to monitor progress with the tasks assigned in the work plans. This exercise is designed for the community, so they can get an idea of the progress being made with activities and have feedback for the evaluation meetings. It should not be used as a tool for the development institution, which should conduct its own follow-up process.
Materials: Paper, construction paper, markers.
Methodology:
The follow-up forms and diagrams should be carefully adapted to the actual circumstances of the project:
• Needs pertaining to follow-up of activities;• The degree of organization and familiarity of participants with the concepts
at hand;• The literacy level of the participants.
The forms should be introduced gradually, not in a manner pre-established by the institution, but rather in response to the people’s demands. The professional should not propose the forms without having first discussed the problems that need to be monitored. It is important that from the outset, the people themselves be entrusted with gathering the information and completing the forms. In the beginning, very simple graphs should be used.
Different types of forms can be used. In monitoring tasks, it is important to use the time frame the people are most comfortable with and to agree on a set of symbols that are clear to everyone. The form should list the tasks that need to be completed, the responsibilities involved, and the deadlines to be met.
The participatory follow-up forms should be large, and should be put in a clearly visible place in the area where the working group meets.

196
QUANTITATIVE INDICATORSSHOULD BE ILLUSTRATED IN A CLEAR AND SIMPLE MANNER
NURSERY PRODUCTION
VACC
INA
TIO
N O
F CH
ICKS
4,000 plants
3,000 plants
2,000 plants
1,000 plants
FRUIT TREES TIMBER TREES
SOU
RCE:
FA
O-R
APA
198
8

197PARTICIPATORY FOLLOW-UP AND EVALUATION
11.4 Participatory follow-up forms (quantitative indicators)
Exercise objective: To facilitate for the community some simple forms to enable them to monitor progress with the activities. For quantitative indicators, the forms show simply and clearly the flow of resources, products, income, etc. This exercise is designed for the community, so they can get an idea of the progress being made with activities and have feedback for the evaluation meetings. It should not be used as a tool for the development institution, which should conduct its own follow-up process.
Materials: Paper, fine cardboard, markers.
Methodology:
See the general instructions in “Participatory follow-up form (task completion).”
Different types of forms can be used. For quantitative indicators, simplified versions of the forms normally used are recommended.
Tables with figures are meaningless to people who barely know how to read. Replacing these with a simple graph enables anyone in the community, after a short briefing, to interpret the data. They can easily learn how to draw the graph, and the members of the local committee should be responsible for follow-up and evaluation.
The participatory follow-up forms should be large, and should be put in a clearly visible place in the area where the working group meets.
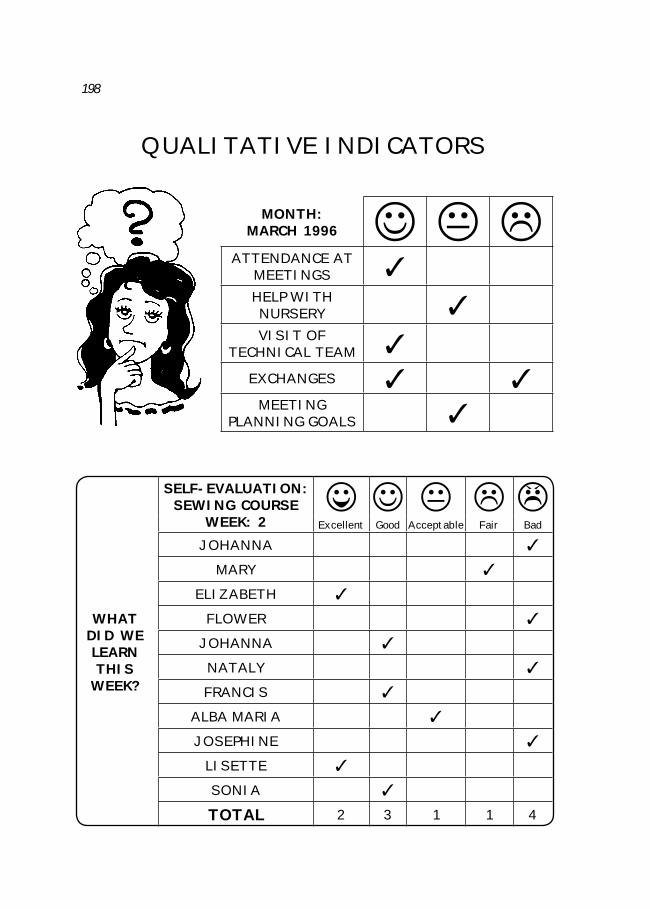
198
QUALITATIVE INDICATORS
MONTH:MARCH 1996
ATTENDANCE AT MEETINGSHELP WITH NURSERYVISIT OF
TECHNICAL TEAM
EXCHANGES
MEETINGPLANNING GOALS
WHATDID WE LEARNTHISWEEK?
SELF-EVALUATION:SEWING COURSE
WEEK: 2 Excellent Good Acceptable Fair Bad
JOHANNA
MARY
ELIZABETH
FLOWER
JOHANNA
NATALY
FRANCIS
ALBA MARIA
JOSEPHINE
LISETTE
SONIA
TOTAL 2 3 1 1 4

199PARTICIPATORY FOLLOW-UP AND EVALUATION
11.5 Participatory follow-up forms (qualitative indicators)
Exercise objective: To offer the community some simple forms to enable them to monitor progress with the activities. Many important activities cannot be evaluated with exact quantitative measurements: people’s attitudes, changes in participation, organization, leadership, perceptions, etc., can be represented graphically. This exercise is designed for the community, so they can get an idea of the progress being made with activities and have feedback for the evaluation meetings. It should not be used as a tool for the development institution, which should conduct its own follow-up process.
Materials: Paper, fine cardboard, markers.
Methodology:
See general instructions in “Participatory follow-up forms (task completion).”
Different types of forms can be used. For qualitative indicators, we recommend the use of simple symbols to express different degrees of appreciation (like “smiley faces”) so as to allow for qualitative monitoring that is not confusing.
The participatory follow-up forms should be large, and should be put in a clearly visible place in the area where the working group meets.

200
IMPACT INDICATORSObjective: To increase and normalize the community’s water supply
SOCIALINDICATORS
ORGANIZATIONALINDICATORS
ECONOMICINDICATORS
ENVIRONMENTALINDICATORS
WELLS DO NOT PROVIDE
ENOUGHWATER FOR ALL
THE WATER IS SUITABLE FOR HUMAN
CONSUMPTION
DISEASES AND PARASITES HAVE
BEEN REDUCEDONLY 30%
ANIMAL PRODUCTION HAS INCREASED
20%
NATURALREGENERATION
INCOME FROM PRODUCTION
OF FUELWOOD AND TIMBER
A WATER COMMITTEEIS ACTIVE
GREATERFLOW OF WATER
WATER USE REGULATIONS
REFORESTEDAREAS
PRODUCTIONOF
VEGETABLESIN SUMMER
COMMUNITYPLANNING
MAP
WATER ALL YEAR ROUND
BURNINGUNDER
CONTROLMOREBIRDS

201PARTICIPATORY FOLLOW-UP AND EVALUATION
11.6 Impact assessment indicator matrix
Exercise objective: To draw up a matrix with the indicators that will be used in evaluating the impact of the project. Reaching consensus on indicators is a very important aspect of participation in a project.
Time required: 2-3 hours, depending on the complexity of the issue.
Materials: Blackboard, newsprint, markers, cards.
Methodology:
Hold a meeting with participants in the project. Step 1: Explain the objective of the meeting and the need for the assessment. Participants
are usually not familiar with the concept of “indicator”, so practical examples should be given to explain it: take as an example one of the activities in the plan of work and suggest they brainstorm about the question, “How can we know if the activity is being carried out according to plan?” It is easier to identify potential indicators if they are organized under four categories:• Social indicators: these help measure changes in the social situation
of participants (e.g., access to services, housing, education, land tenure, health, gender equality, adoption of new practices);
• Economic indicators: these help measure changes in the economic situation of participants (e.g., indebtedness and investments, access to credit, production goods and others, income, levels of production, levels of self-employment, use of wage-earners, levels of technology, etc.);
• Political-organizational indicators: these help measure changes in the degree to which the beneficiaries are organized and have control over the decisions that affect their lives (e.g., degrees of organization and social control, leadership, distribution of benefits among participants, etc.);
• Environmental indicators: these help measure changes in the environment (e.g., deforestation and reforestation, pollution, protected areas, water sources, wildlife, adoption of practices and level of awareness about the environment, etc.).
The facilitator should organize the cards and conduct several rounds of brainstorming until everything has been covered.
Step 2: The second step entails determining how the indicators will be measured. This enables the group to realize that there are two main types of indicators (see follow-up indicator matrix).
Step 3: If a large number of indicators have been listed, it may be necessary to prioritize them; one criterion could be to determine if the indicators are measurable. The exercise should be repeated for the different activities and sub-activities, thus constructing the matrix of indicators and results.


203BIBLIOGRAPHY
BIBLIOGRAPHY
Aberley D. (Ed) 1993 Boundaries of home. Mapping for local empowerment. The New Catalyst Bioregional Studies. New Society Publishers, Gabriola, BC, Canada.
AKRSP-India 1992 Participatory Rural Appraisal and Plannig (PRAP): the experience of the AKRSP. Aga Khan Rural Support Programme –India, Ahmedabad, India.
Asby J. 1992 Manual para la evaluación de tecnología con los pruductores. IPRA Project, CIAT. CIAT Paper No. 188. Cali, Colombia.
Bawden R. Et al 1984 System thinking and practices in the education of agriculuralists. AgriculuralSystems 13(1984): 205-225.
Biggs S. 1995 Participatory echnology development; a critique of the new orthodoxy. PTD Workshop, Intermediary Technology, Bedford, Great Britain.
Bojanic A. Et al. 1994 Demandas campesinas. Manual para un análisis participativo. La Paz, Royal Netherlands Embassy.
Bronson J. 1995 Conducting PRA in the South Pacific: experiences in natural resource management from Vanuatu. Program for Internaional Development, Clark University, Worcester, MA USA.
Bruce J.W. 1989 Rapid appraisal of tree and land tenure for community forestry initiaives. LandTenure Center. University of Wisconsin, Madison WI USA.
Chambers R. 1992 Methods for analysis by farmers: the professional challenge. Institute of Development Studies, University of Sussex, Brighton, Great Britain.
Chambers R. Shortcut and participatory methods for gaining social information for projetsin: Putting People First.
Chambers R. 1990 A workshop on Participatory Learning Method., MYRADA, PRA-PALM Series #1. Bangalore, India.
Chambers R. 1995 Participatory Rural Appraisal and South Africa. PTD Workshop, Intermediary Technology, Bedford, Great Britain.
Chambers R. 1994 All power deceives. IDS Bulletin Vol. 25(2) 1994: 14-26.
Chambers R. Ed. 1989 Farmer first. Farmer innovation and agricultural research. Intermediate technology Publications, London, Great Britain.
Colaco P. et al. 1993 Post-harvest goes participatory : participating and learning in a fishingvillage. Bay of Bengal News, September 1993.
Crouch R.B. 1993 The problem census technique. Ministry of Agricultural Development and Research, Sri Lanka.
Crouch R.B. n.d. The problem census: farmer-centred problem identification.

204 BIBLIOGRAPHY
De Villiers A.K. 1996 Quantifying indigenous knowledge: a rapid method for assessing crop performance without field trails. ODI-Agricultural Research & Extension Network Paper 66, July 1996. London, Great Britain.
Kojo Amanor 1990 Analytical Abstracts of Farmer Participatory Research. Overseas Development Institute, London, Great Britain.
Farrington J. 1989 Farmer participation in Agricultural Research: a reviev of concepts and practices, Overseas Development Institute, London, Great Britain.
ODI 1996 Reforming agricultural extension in Bangladesh: blending greater participation and sustainability with institutional strenghening. ODI Network Paper 61, 1996.
ODI 1996 Farmer-led approaches to extension. Paper presented at a workshop in the Philippines, July 1995. ODI Network Paper 59
Defoer T. et al. 1996 Toward more sustainable soild fertility management. ODI-Agricultural Research & Extension Network Paper 63, July 1996. London, Great Britain.
Dunn T. 1993 Farmer participation in extension. in: proceedings of the symposium on the future of irrigation in the Murray-Darling basing, Griffith, NSW, Australia.
Dunn T. 1991 Action research: the application of rapid rural appraisal to learn about issues of concern in Landcare areas near Wagga Wagga, NSW. Murrumbigee College of Agriculture, NSW, Australia.
Dunn T. 1994 Rapid rural appraisal: a description of the methodology and its application in teaching and Charles Sturt University. Rural Society 4/3-4(30-36), Australia:
Dunn A.M. 1991 Family farming and extension. in: M. Allson (es) Family farming in Australia and New Zeland: Charles Sturt University, NSW, Australia.
Dunn T. 1993 Learning to use RRA and PRA to improve the activities of tho Landcare groups in Australia. RRA Notes 18, International Institute for Environment and Development (IIED), London, Great Britain.
EDM 1993 “Start with what the people know”. Rural family and welfare projetc Bangladesh. Enfants du Monde, Dhaka Bangladesh.
EDM 1995 “Imagine we are villagers”. Report on the review and reorientation training workshop for DDS and EDM staff. Enfants du Monde, Dhaka, Bangladesh.
ELCI 1996 Participatory Project Evaluation : allowing local people to have their say. An NGO guide for community driven project evaluation. Environment Liaison Centre International, Nairobi, Kenya.
FAO 1990 The community toolbox. The idea, methods and tools for participatory assessment, monitoring and evaluation in community forestry. Community Forestry Field Manual 2.
FAO 1995 Selecting tree species on the basis of community needs. Community Forestry Field Manual n. 5.

205BIBLIOGRAPHY
FAO 1995 Undestanding farmers´ communication networks: an experience in the Philippines. Communications for Development Case Study 14. FAO, Rome, Italy.
FAO 1994 Tree and land tenure: rapid appraisal tools. Community Forestry Manual n.4.
FAO 1995 Participatory approaches to planning for community forestry. Forest, Trees and People Programme-Forestry Department. Working paper.
FAO-IDA 1993 Planificación participativa. Chorotega Forest Project. IDA-FAO-Holland. Liberia, Guanacaste, Costa Rica.
FAO-IIRR 1995 Resource Management for Upland Areas in Southeast Asia: an information kit. Farm Field Document 2. FAO, Bangkok, Thailand – IIRR, Silang Cavite, Philippines.
FAO-RAPA 1988 Participatory monitoring and evaluation: handbook for trainign field workers. FAO Regional Office for Asia and the Pacific (RAPA), Bangkok, Thailand.
FAO-RAPA 1990 Taking hold of Rural Life. FAO Regional Office for Asia and the Pacific(RAPA), Bangkok, Thailand.
Feldstein H. 1994 Tools for the field: methodologies handbook for gender analysis in agriculture. Kumarian Press, West Hartford, Con. USA.
Ford R. Et al. 1992 Sustaining Development through community mobilization: a case study of Participatory Rural Appraisal in the Gambia. Program for International Development, Clark University, Worcester, MA USA.
Ford R. Et al 1993 Managing resources with PRA partnerships: a case tudy of Lesoma, Botswana. Program for International Development, Clark University, Worcester, MA USA.
Frankenberger T. 1992 Rapid Food Security Assessment. Office of US Foreing Disaster Assistance, AID.
Gill G.J. 1992 But how does it compare with the real data? Lessons from a RRA Training exercise in Western Nepal. HMG Ministry of Agriculture-Winrock International: Katrhmandu, Nepal.
Gohl E. Et al 1993 Pequeña guía al seguimiento participativo del impacto “PIM”. FAKT-
Stuttgart, Germany. Hartmann B. 1996 Sciocultural constraints to land management decisions: the case of bofedal
restoration in Bolivia. Tropical Resources Institute News Vol 15(1), Yale, USA.
Hitinayake H. Et al. 1994 The use of knowledge-based systems approach for the incremental improvemente of traditional agroforestry practices. UP-OFI Workshop, Sri Lanka.
IIED 1991 Proceedings of the February 1991 Bangalore PRA trainers workshop. RRA Notes 13, August 1991. International Institute for Environment and Develonment (IIED), London, Great Britain.
206 BIBLIOGRAPHY
IIED 1992 Special issue on applications of Wealth Ranking. RRA Notes 15, May 1992. International Institute for Environment and Development (IIED), London, Great Britain.
IIED 1994 RRA Notes: special issue on livestock. N. 20, April 1994. International Institute for Environment and Development (IIED), London, Great Britain.
IWID n.d. Gender and participatory approaches: implications and experiences.Initiatives: Women in Development. Madras, India.
Jones F.G. et bal.1993 Report on the use of participatory researh methods in Sri Lanka with recommendations for participatory on-farm trails. Oxford Forestry Institute-University of Peradeniya Link Project. Sri Lanka.
Landcare 1991 The Kyemba valley: issues of concern to landholders and their families.Landcare, University of Sydney, Australia.
Leurs R. 1996 Current challenges facing participatory rural appraisal. Public Administration and developmente Vol 16, 57-72,
Leurs R. 1990 Rapid Rural Appraisal for local governmente planning in Northern Nigeria. DAG/IIED workshop on adaptive local level planning, London, Great Britain.
Leurs R. 1996 A resource guide for trainers and facilitators of Participatory Learning and Action. Development Administration Group, University of Birmingham, Great Britain.
Lightfoot C. Et al. 1991 Households, agroecosystems and rural resources management. BangladeshAgricultural Research Institute (BARI), International Center for Living Aquatic Resources Management (ICLARM), Philippines.
Lightfoot C. 1989 Training Resource Book for farming systems diagnosis. International Rice Research institute- International Center for Living Aquatic Resources Management. Manila, Philippines.
Lightfoot C. 1991 Training Resource Book on a participatory method for modelling bioresource flows: International Center for Living Aquatic Resources Management. Manila, Philippines.
Lightfoot C. 1989 Training Resource Book for agro-ecosystem mapping.: International Rice Research Institute- Philippines; Ford Foundation, India.
Macadam R. et al. 1995 A case study in development planning using a Systems Learning Approach: generating a master plan for the livestock sector of Nepal. AgriculturalSystems 49(1995): 299-323.
Mascarenhas J. Participatory Rural Appraisal and participatory Learning Methods: recent experiences from MYRADA and South India. Forest, Trees and People Newsletter N. 15/16.
Messerchmidt D. 1995 Rapid Appraisal for Community Forestry. The RA process and rapid diagnostic tools. IIED Participatory Methodology Series. International Institute for Environment and Development, Great Britain.
207BIBLIOGRAPHY
MIDNET 1994 Notes on a workshop on participatory methods. Cedara, South Africa.
Mukherjee N. 1992 Rural Communities´perceptions of poverty and well being: some case studies in a participatory framework. South Asian Centre, School of Oriental and African Studies, London, Great Britain.
MYRADA n.d. From RRA to…? The process begins. MYRADA, PRA-PALM Series #2. Bangalore, India.
MYRADA n.d. A review workshop on Participatory Learning Methods. MYRADA, PRA-PALM Series #4. Bangalore, India.
MYRADA n.d. Sharing our limited experience. MYRADA, PRA-PALM Series #5. Bangalore, India.
MYRADA n.d. Training Programme Report. MYRADA, PRA-PALM Series #3. Bangalore, India.
MYRADA n.d. PRA and PALM: recent experiences from MYRADA and South India.MYRADA, PRA-PALM Series #6. Bangalore, India.
MYRADA n.d. Analysis of societal roles and problems from a gender perspective and development of gender-sensitive tools in PRA-PALM. MYRADA, PRA-PALM Series #7. Bangalore, India.
MYRADA n.d. Exploring the interactive effects of wells in hardrock areas of peninsular Indian illustration of the PRA approach. MYRADA, PRA-PALM Series #9. Bangalore, India.
Nabasa J. Et al. 1995 Participatory Rural Appraisal: practical experiences. Natural Resources Institute (Great Britain), Action Aid (Uganda).
Nagels U. (Ed.) 1992 Developing a participatory extension approach: a design for Siavonga district, Zambia. Technische Universitat Berlin. Schirtenreihe des Fachbereich N. 149.
Narayan D. Et al. 1994 Participatory Development Tool Kit. International Bank for Reconstruction and Development/The World Bank. Washington, USA.
NES 1990 Participatory Rural Appraisal Handbook. Natural Resources Management Support Series 1. World Resources Institute. USA.
Odour.Noah E. Et. Al. 1992 Implementing PRA: a handbook to facilitate participatory rural appraisal.National Environment Secretariat (Kenya), Program for International Development, Clark University (USA).
Pretty J. 1995 Participatory learning for sustainable agriculture. World Development Vol. 23 (8): 1247-1263.
Redd Barna 1993 Not only the well off: but also the worse off. Report of a training workshop in Chiredzi, Zimbadwe. Redd Barna Regional Office Africa Training and Development. Kampala, Uganda.
Reveley P. Et al. 1993 Analyse participative en vue de la réduction des pressions sur une aire protégée: Andasibe, Madagascar. Program for International Development, Clark University, Worcester, MA USA.
208 BIBLIOGRAPHY
Rocheleau D. Et al. 1995 Gendered Resource Mapping. Cultural Sourvival Quarterly Winter 1995.
Rodríguez Sandoval R. 1996 Metodología de Extensión Agrícola Comunitaria para el Desarrollo Sostenible. PLAN International-IICA, San Salvador, El Salvador.
Rodríguez Sandoval R. 1990 Determinación y priorización de problemas a nivel de la comunidad. CENTA, San Andrés, El Salvador.
Rudqvist A. 1991 Fieldwork methods for consultations and popular participation. Popular Participation Program, Working Paper No. 9, Department of Anthropology, Stockholm University, Sweden.
Rudqvist A. 1991 Guidelines for consultations and popular participation in development processes and projects. Popular Participation Program, Working Paper No. 9, Department of Anthropology, Stockholm University, Sweden.
Save the Cildren 1995 Participatory Rural Appraisal: a report on women. Save the Children (USA), Bangladesh Field Office, Dhaka, Bangladesh.
Sheuermeir U. 1988 Approach Development: a contribution to participatory development of techniques based o a practical experience in Tinau Watershed Project, Nepal. LBL, Lindau, Switzerland.
Schonhut M. 1994 Participatory Learning Approaches: rapid rural appraisal, participatory appraisal. An introductory guide. TZ- Schriftenreihe der GTZ No 248, Rossdorf, Germany.
Scoones I. Ed. 1994 Beyond farmer first. Rural people´s knowledge, agricultural research and extension practice. Intermediate Technology Publications, London, Great Britain.
Stewart S. Et al. 1995 Participatory rural appraisal: abstracts of sources. An annotated bibliography. IDS Development bibliography 11. Institute of Development Studies, Brighton, Sussex, Great Britain.
Tamil Nadu A. U. 1992 Participatory Rural Appraisal (PRA) for agricultural research at Aruppukottai, tamil Nadu. Centre for Agricultural and Fural Development Studies, Tamil Nadu ATricultural University & International Institute for Environment and Development (IIED). Coimbatore, India.
Thomas-Slayter B. 1993 Tools of gender analysis: a guide to field methods for bringing gender into sustainable resource management. ECOGEN, Clark University, USA.
Townsley P. 1993 A manual on rapid appraisal methods for coastal communities. Bay of Bengal Programme, Madras, India.
UNICEF-Bangladesh 1993 VIPP: visualisation in participatory programmers. A manual for facilitators and trainers involved in participatory group events. Dhaka, Bangla Desh.
VSF 1995 De la gestion des feux de brousse à la gestion du terroir : bilan de quatre années d´actions environnementales de VSF en Haute Guinée. Veterinarians Without Borders, Lyon, France.

This book was printed by the IICA press in September 2008, with a first run of 500 copies