8 th meeting of the hungarian- croatian working group on tourism budapest, june 18, 2013
TRANSCRIPT

8th MEETING OF THE HUNGARIAN-CROATIAN WORKING GROUP ON TOURISM
Budapest, June 18, 2013
Governance of tourism
Republic of Croatia - Tourist traffic 2010-2013
Top 5 Markets
Hungarian tourists visiting Croatia 2010-2013
Croatian Tourism Development Strategy until 2020
Multilateral cooperation Croatia-Hungary
Overview:
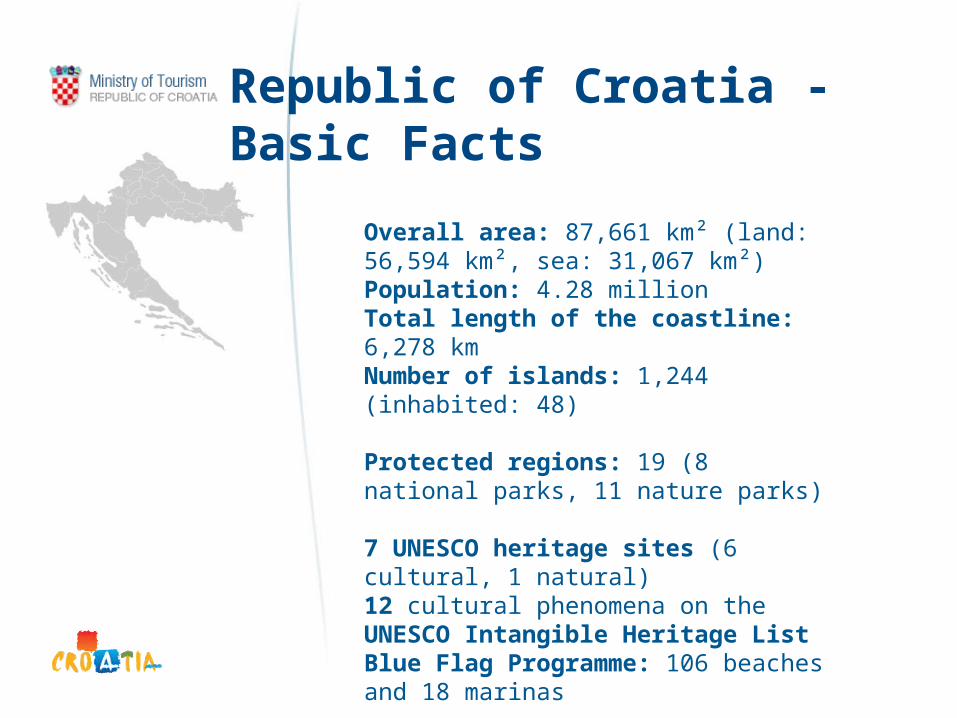
Republic of Croatia - Basic Facts
Overall area: 87,661 km² (land: 56,594 km², sea: 31,067 km²)Population: 4.28 millionTotal length of the coastline: 6,278 kmNumber of islands: 1,244 (inhabited: 48)
Protected regions: 19 (8 national parks, 11 nature parks) 7 UNESCO heritage sites (6 cultural, 1 natural)12 cultural phenomena on the UNESCO Intangible Heritage ListBlue Flag Programme: 106 beaches and 18 marinas

Organisational chart of tourism bodies
MINISTRY OF TOURISM
TOURISM COMMITTEE OF CROATIAN PARLAIMENT
CROATIAN NATIONAL TOURIST BORDCOUNTY AND LOCAL TOURIST BOARDS
TOURISM ASSOCIATIONS(private sector)Chambers of Economy- national and regional levels
DEPARTMENTS OF ECONOMY /TOURISM IN REGIONAL ANDLOCAL ADMINISTRATION
MinisterMr Darko Lorencin [email protected]
Vice ministerMr Ratomir Ivičić [email protected]
Assistant MinistersMr Želimir Kramarić [email protected] Robert Pende [email protected] Božica Lapić [email protected] Davor Ižaković [email protected]
Ministry of Tourism

2011- 11.4 million arrivals (increase of 8% compared to 2010)- 60 million overnights (increase of 7% compared to 2010)
Republic of Croatia - Tourist traffic 2010/2011 -arrivals and overnights-
2012-11.8 million arrivals (increase of 3% compared to 2011)-62.7 million overnights (increase of 4% compared to 2011)
ARRIVALS INDEX OVERNIGHTS INDEX
2011 2012 12/11 2011 2012 12/11
TOTALTOTALCROATIACROATIA 11,455,677 11,834.975 103,31 60,354,275 62.743,057 103,96
DOMESTIC 1,529,003 1,465,756 95,86 5,602,970 5,220,931 93,18
FOREIGN 9,926,674 10,369,219 104,46 54,751,305 57,522,126 105,06

Croatian tourism nowadays represents a strategic branch of Croatian economy. It records the constant growth in the number of tourists, in the number of newly-opened workplaces in the tourism sector and in total revenue.
2012 INDEX 12/11
6.8 110
2012INDEX 12/11
11.8 103
Number of tourists (million)Number of tourists (million)
Tourism revenue (billion €)Tourism revenue (billion €)

Top 5 Markets
No. Country ARRIVALS OVERNIGHTS
2012 Index12/11 2012 Index
12/11
TOP 5 MARKETS
1. GERMANY 1,852,731 11.52 13,946,703 111.72. SLOVENIA 1,053,553 95.78 6,239,493 97.63. AUSTRIA 945,578 105.95 5,103,762 105.54. ITALY 1,050,507 91.3 4,534,553 90.85. CZECH REPUBLIC 647,211 101.4 4,519,489 103
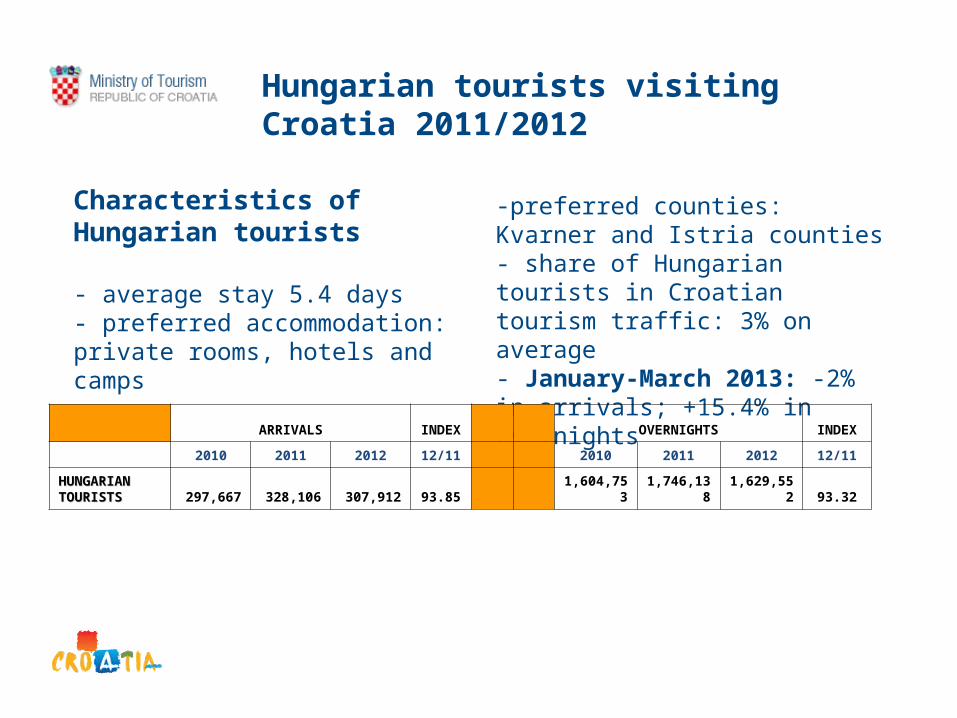
Characteristics ofHungarian tourists
- average stay 5.4 days- preferred accommodation: private rooms, hotels and camps
Hungarian tourists visiting Croatia 2011/2012
-preferred counties: Kvarner and Istria counties- share of Hungarian tourists in Croatian tourism traffic: 3% on average- January-March 2013: -2% in arrivals; +15.4% in overnights
ARRIVALS INDEX OVERNIGHTS INDEX
2010 2011 2012 12/11 2010 2011 2012 12/11
HUNGARIAN HUNGARIAN TOURISTSTOURISTS 297,667 328,106 307,912 93.85 1,604,753 1,746,138 1,629,552 93.32

The Strategy covers the period from 2013 to 2020 and among other things:
gives a new vision of development of Croatian tourism
is the precondition for the withdrawal of funds from the EU funds
clearly defines the measures and activities to raise the competitiveness of the sector
Croatian Tourism Strategy

• state of affairs, competitive status• 10 key directions for Croatian
tourism development until 2020• vision for Croatian tourism until
2020• main goal of development• operational strategies• action plan• expected effects
Croatian Tourism Development Strategy until 2020, content
Over 852,000 registered beds: 13% in hotels, 25% in camps, 49% in private households and 13% in other accommodation facilities
40% of hotel capacity of 4* and 5* Over 62.7 mn overnights in registered commercial
accommodation Over 95,000 employed in catering and tourism
sector (close to 7% of total employment) Pronounced seasonality – 87% of all overnights take
place from June to September Predominant tourism product: sun and sea Product and services not diversified enough Inherited orientation towards seasonal operation However, in times of crisis still achieving better
results than many of its Mediterranean competitors
Market opportunities for Croatia: attracting new consumers, creating higher value-added products, implementing the ‘green’ concept, clusters, DMO, direct marketing
State of affairs, competitive status

10 key directions in Croatian tourism development till 2020
• Deregulation• Success through
partnership• Culture of quality• The ‘green’ as an
operational concept• Beyond the sun and
sea
• Tourism embracing the entire national territory
• Hotel trade – key initiator of the investment cycle
• Innovation of the market image
• Authenticity and creativity
• Croatian products for Croatian tourism
Vision for Croatian tourism by 2020
By 2020 Croatia will be a globally recognised tourist destination, competitive and attractive to investments. It creates jobs and manages in a sustainable way the development on its entire territory, nurtures the culture of quality, and offers its guests hospitality, safety an authentic attractions and experiences all year round.

Main goal of development
Getting ranked among top 20 tourist destinations in the world
in terms of competitiveness.

Objective of the tourism development till 2020
• € 7 bn new investment• Increase in hotels’ share from 13% to
18%• Upgrade accommodation in household
facilities and campsites• Create new employment: 20 thousand
direct and 10 thousand indirect jobs• Increase tourist consumption to € 14.3
bn (€ 12.5 bn by foreigners)

Operational strategies
• Marketing– Restructure NTO, strengthen DMOs, switch to online
communication
• Tourism offer development– Diversify products, accelerate privatisation, upgrade
accommodation, upgrade other elements of tourism offer
• Investments– Greenfield and brownfield (hotels, campsites,
nautical tourism, convention centres)
• Human resources development– Strong regional centres of education, curricula aligned
with economy requirements, setting up of LLL system
• Processes Management– State, county and local level

Effects expected by 2020
• 955,000 beds in commercial accommodation• 86 million overnights in commercial
accommodation (43% increase compared to 2011)• € 14.3 bn worth total tourist consumption (an
increase of € 6 bn)• Total occupancy rate 24.7%
Effects expected by 2025• Further growth in number of accommodation in
commercial and in overnights• Growth of tourist expenditure doubling the number
of employed (in tourism and induced in other activities)
• € 13 bn total investment

Encourage investment and privatization
Investment catalogue: www.mint.hr
Rapid privatization of state-owned hotels-Sale of state-owned shares in 13
tourism companies - the Government Asset Management Agency (AUDIO)

Investment opportunities in Croatia tourism
# Company PlaceEquity
knkn %
1 Imperial d.d. Rab 254.342.000 127.318.800 50,06 17.440.9322 ZRC Lipik d.d. Lipik 3.192.000 2.877.500 90,15 394.1783 Bizovačke toplice d.d. Bizovac 130.912.500 130.140.000 99,41 17.827.3974 Hotel Medena d.d. Seget Donji 118.140.000 63.324.600 53,60 8.674.6035 Hotel Makarska d.d. Makarska 223.894.000 92.661.000 41,39 12.693.2886 Hotel Živogošće d.d. Živogošće 112.021.200 84.328.550 75,28 11.551.8567 Hotel Podgora d.d. Podgora 135.512.500 75.437.450 55,67 10.333.8978 Modra Špilja d.d. Komiža 18.496.500 7.978.500 43,13 1.092.9459 Vranjica Belvedere d.d. Seget Donji 30.806.200 16.632.610 53,99 2.278.440
10 Hoteli Maestral d.d. Dubrovnik 103.144.000 62.551.600 60,65 8.568.71211 Hoteli Plat d.d. Plat 59.176.500 54.732.000 92,49 7.497.53412 HTP Korčula d.d. Korčula 128.229.300 76.257.000 59,47 10.446.16413 HTP Orebić d.d. Orebić 35.164.000 22.369.400 63,62 3.064.30114 Club Adriatic d.o.o. Zagreb 108.008.500 108.008.500 100,00 14.795.68515 Dalma d.d. Split 459.228.090 387.073.280 84,29 53.023.737
TOTAL 1.920.267.290 1.311.690.790 179.683.670
Available for Sale in €
Availabe for Sale
* * Total nominal value of state owned portfolio available for Total nominal value of state owned portfolio available for privatization amounts to 1,9 blprivatization amounts to 1,9 blnn kkunaunass (approx (approx . . € 180 mil) € 180 mil)
Present Status of State Owned PortfolioPresent Status of State Owned Portfolio

THANK YOU FOR YOUR ATTENTIONTHANK YOU FOR YOUR ATTENTION
Ministry of Tourism of the Republic of CroatiaMinistry of Tourism of the Republic of Croatia Prisavlje 14Prisavlje 14
10000 Zagreb10000 ZagrebCROATIACROATIA
www.mint.hrwww.mint.hr