8. data report: paleomagnetism of basaltic rocks cored
TRANSCRIPT
Sager, W.W., Kanazawa, T., and Escutia, C. (Eds.)Proceedings of the Ocean Drilling Program, Scientific Results Volume 191
8. DATA REPORT: PALEOMAGNETISM OF BASALTIC ROCKS CORED FROM WESTERN PACIFIC DSDP AND ODP BOREHOLES1
William W. Sager2
INTRODUCTION
Oceanic basalts and other related igneous rocks are considered excel-lent recorders of the Earth’s paleomagnetic field. Consequently, basaltcore paleomagnetic data are valuable for the constraints they provideon plate tectonic motions, especially for oceanic plates such as the Pa-cific. Unfortunately, few Deep Sea Drilling Project (DSDP) and OceanDrilling Program (ODP) boreholes have been cored very deeply into theocean crust. The result is that there are only a few sites at which a largeenough number of basalt flows have been cored to properly average sec-ular variation (e.g., Kono, 1980; Cox and Gordon, 1984). Furthermore,there are a number of sites where basaltic core samples were retrievedbut the cores were not measured. Often this occurs because leg scien-tists had more important sections to work on, or the section was ig-nored because it was too short to record enough time to average secularvariation and obtain a reliable paleolatitude. Even though it may not bepossible to determine a precise paleolatitude from such short sections,measurements from a small number of flows are important becausethey can be combined with other coeval paleomagnetic data from thesame plate to calculate a paleomagnetic pole (Gordon and Cox, 1980;Cox and Gordon, 1984). For this reason, I obtained samples for paleo-magnetic measurements from eight Pacific sites (169, 170, 171, 581,597, 800, 803, and 865), most of which have not been previously mea-sured for paleomagnetism.
1Sager, W.W., 2004. Data report: Paleomagnetism of basaltic rocks cored from western Pacific DSDP and ODP boreholes. In Sager, W.W., Kanazawa, T., and Escutia, C. (Eds.), Proc. ODP, Sci. Results, 191, 1–27 [Online]. Available from World Wide Web: <http://www-odp.tamu.edu/publications/191_SR/VOLUME/CHAPTERS/003.PDF>. [Cited YYYY-MM-DD]2Department of Oceanography, Texas A&M University, College Station TX 77843-3146, USA. [email protected]
Initial receipt: 3 September 2002Acceptance: 2 October 2003Web publication: 27 February 2004Ms 191SR-003
W.W. SAGERDATA REPORT: PALEOMAGNETISM OF BASALTIC ROCKS 2
SAMPLE SITES
Sites 169, 170, and 171
Sites 169–171 were cored during DSDP Leg 17 in the Central Pacific.Site 169 (10.7°N, 173.6°E) is located on the abyssal seafloor ~300 kmeast of Mejit Island in the Marshall Islands (Shipboard Scientific Party,1973a). Igneous rocks were recovered in four cores: diabase sills inCores 17-169-5R and 6R (6.1 m recovered) and basalt in Cores 17-169-11R and 12R (4.0 m recovered). The igneous rocks from Site 169 havenot been dated; however, the basalts from the bottom of the hole areprobably crustal basalts (Bass et al., 1973), so the age can be inferredfrom magnetic lineations. Site 169 sits on Anomaly M21 (Nakanishi etal., 1992), which implies a date of 148 Ma using the timescale of Grad-stein et al. (1994). The diabase sill is likely mid-Cretaceous in age, simi-lar to other sills that are widespread in the western Pacific (Schlanger etal., 1981).
Site 170 was drilled on the abyssal seafloor in the Central Pacific Ba-sin (11.8°N, 177.6°E). The only igneous rock recovered was 3.0 m of al-tered basalt in Core 17-170-16R (Shipboard Scientific Party, 1973b).Although the basalt has not been dated, an age can be inferred frommagnetic lineations mapped in the Central Pacific Basin. Site 170 is lo-cated on Anomaly M16 (Nakanishi and Winterer, 1998), implying adate of 140 Ma (Gradstein et al., 1994).
Site 171 (19.1°N, 169.5°W) is located atop Horizon Guyot at thenorth end of the Line Islands chain (Shipboard Scientific Party, 1973c).Coring recovered a single basalt flow, ~3 m in thickness, from amongCenomanian limestones in Cores 17-171-26R and 27R. In addition,some basalt fragments were recovered at the bottom of the hole, inCore 17-171-33R, but no fragments were large enough for paleomag-netic sampling. Although basalt samples from Site 171 have not beendated, dredged basalt from the flanks of Horizon Guyot gave a 39Ar/40Artotal fusion date of 88.1 ± 0.4 Ma (Schlanger et al., 1984) (this and otherage errors are given as 1�).
Site 581
Site 581 (43.9°N, 159.8°E) is located on the abyssal seafloor of thenorthwest Pacific plate, north of Shatsky Rise. The site was cored duringLegs 86 and 88. Drilling during Leg 86, Hole 581 was cored as a pilothole for a downhole seismometer experiment conducted during Leg 88.Hole 581 was terminated after basement was struck and 3.7 m of basaltin Core 86-581-19R (Shipboard Scientific Party, 1985) was recovered.Basalt cores were recovered during Leg 88 from Holes 581A, 581B, and581C (Shipboard Scientific Party, 1987). According to the Leg 88 InitialReports volume (Shipboard Scientific Party, 1987), Hole 581A was sited293 m south of Hole 581, whereas Hole 581B was sited 305 m north ofHole 581A, which would put it within 12 m of Hole 581, if the position-ing was accurate. As is seen in the results (below), differences in mag-netic polarity suggest that the holes are not that closely spaced. Nodetails of the siting of Hole 581C were given in the Leg 88 Initial Reportsvolume. In Hole 581A, one core (88-581A-3R) was drilled into base-ment, recovering 4.9 m of basalt. Coring in Hole 581B recovered 15.8 mof basalt from four cores (88-581B-1R through 4R). This section was di-vided into 13 flows on the basis of cooling boundaries (Shipboard Sci-
W.W. SAGERDATA REPORT: PALEOMAGNETISM OF BASALTIC ROCKS 3
entific Party, 1987). Hole 581C penetrated deepest into basement (20.6m), recovering 16.3 m of basalt, divided into six flow units (ShipboardScientific Party, 1987).
No accurate dating has been done for Site 581 basalts. However, anestimate of the age is possible from seafloor magnetic lineations. Site581 is located between Anomaly M1 and another lineation that is un-identified (Nakanishi et al., 1999). From the pattern, it appears therewas a ridge jump in the vicinity and the unidentified lineation isslightly older than Anomaly M1. Thus, we can estimate the age of thelineation at 124–127 Ma (Anomaly M1–M3) using the timescale ofGradstein et al. (1994).
Site 597
During DSDP Leg 92, Site 597 was drilled on abyssal seafloor in thesoutheast Pacific (18.6°S, 129.8°W; Shipboard Scientific Party, 1986).The site is located on Anomaly C9, which indicates the seafloor is 27.5Ma in age (Cande and Kent, 1995). Although basalt was cored in fourholes, pieces large enough to be vertically oriented were only recoveredin Holes 597B and 597C. Hole 597B penetrated 24.6 m of igneous sec-tion, recovering 5.4 m, whereas Hole 597C penetrated 91 m of base-ment, recovering 48.5 m. Although the section was lacking clear chilledmargins that indicate flow boundaries, shipboard scientists divided thesection into three units based on differences in olivine content (Ship-board Scientific Party, 1986). The boundary between the upper twounits, I and II, is located between Sections 92-597C-7R-5 and 8R-1(100.5 meters below seafloor [mbsf]), whereas the boundary betweenUnits II and III is situated in Section 10R-2 (121.3 mbsf).
Paleomagnetic measurements were conducted on Site 597 samplesbecause it appeared that the initial shipboard studies did not includedemagnetization on basalt samples to properly remove overprints anddetermine the characteristic magnetization direction (Shipboard Scien-tific Party, 1986). However, alternating-field (AF) demagnetization wasperformed on 69 samples, reported in another section of the Leg 92 Ini-tial Reports volume (Nishitani, 1986). Although the samples were de-magnetized in fields up to 90 mT, Nishitani did not explain how thecharacteristic remanence inclination values were calculated. Havingcollected additional samples and made new analyses in this study, I re-port the new data here and combine them with the older data.
Site 800
During Leg 129, three dolerite sill units that intruded into Berriasiansediments located on Jurassic-age abyssal seafloor in the western Pacificwere cored in Hole 800A (21.9°N, 152.3°E; Shipboard Scientific Party,1990). Approximately 7.1 m of igneous core was recovered from 46.4 mof section. These sills are probably part of a widespread mid-Cretaceousvolcanic episode (Schlanger et al., 1981). A 39Ar/40Ar radiometric date of126.1 ± 0.6 Ma was determined from Hole 800A dolerite samples (Prin-gle, 1992). Shipboard paleomagnetic studies used whole-core fragmentsand did not demagnetize above 12 mT (Shipboard Scientific Party,1990), suggesting these preliminary results were not accurate owing todifficulties in measuring irregular core pieces and incompletely re-moved overprints.
W.W. SAGERDATA REPORT: PALEOMAGNETISM OF BASALTIC ROCKS 4
Site 803
A 22.5-m section of tholeiitic basalt flows and pillow lavas was coredin Hole 803A (2.4°N, 160.5°E) on the Ontong Java Plateau during Leg130 (Shipboard Scientific Party, 1991). Approximately 12.9 m of igne-ous core was recovered, and shipboard scientists divided the sectioninto nine igneous units (Shipboard Scientific Party, 1991). A weightedaverage of four 39Ar/40Ar radiometric dates given in Mahoney et al.(1993) yields an age of 90.2 ± 1.2 Ma for the igneous section. No mag-netic measurements have been reported from these rocks.
Site 865
Hole 865A (18.4°N, 179.6°W) was drilled into the summit of AllisonGuyot in the Mid-Pacific Mountains during Leg 143 (Shipboard Scien-tific Party, 1993). Coring penetrated four basaltic sills, recovering 18.3m of igneous core, but only three of the units yielded pieces suitablyoriented for paleomagnetic study. A 39Ar/40Ar radiometric date of 110.7± 1.2 Ma was determined for these sills (Pringle and Duncan, 1995). Pre-liminary shipboard paleomagnetic measurements were made from largeoriented core pieces (Shipboard Scientific Party, 1993) but are likely in-accurate for reasons previously stated.
METHODS AND ANALYSIS
Samples were obtained as 2.5-cm (1 in) minicores drilled perpendicu-lar to the split face of the rock cores. Samples were taken only fromhemi-cylindrical pieces long enough to ensure that they remained ori-ented during rotary coring. An upcore orientation mark was scribed oneach sample to provide vertical orientation. Samples were spaced at ir-regular intervals in the core, with the object of collecting at least two tothree samples from each flow unit, where units have been defined. Inthose cores without any igneous unit definitions, the sampling rate wasone to three samples per section.
Samples were measured with the shipboard cryogenic magnetometeraboard the JOIDES Resolution during Leg 191. All samples were demag-netized to isolate a characteristic remanent magnetization. Typically, AFdemagnetization was attempted on a subset of samples and if this pro-cedure seemed adequate, it was used for the remainder of the samples.AF demagnetization was conducted in two different demagnetizationunits. Demagnetization in low fields (up to 30 mT) was conducted us-ing the inline AF demagnetization coils mated to the shipboard cryo-genic magnetometer. Because these coils may produce a spuriousmagnetization with high AF field values, demagnetization at fieldsabove 30 mT was done with a separate discrete sample demagnetizationunit. Usually the AF demagnetization proceeded in 5-mT steps from 10to 40 or 50 mT and 10-mT steps up to 70 mT, but a few experiments in-cluded smaller demagnetization steps.
For some cores, thermal demagnetization methods were used whenAF demagnetization apparently worked poorly. Thermal demagnetiza-tion samples underwent stepwise demagnetization beginning at 150°Cand typically continuing in 50°C steps up to 450°–625°C. On occasion,more detailed demagnetization experiments were conducted with 25°Csteps above 400°–450°C. If the sample demagnetization appeared to iso-late the characteristic remanence direction at lower-temperature steps,
W.W. SAGERDATA REPORT: PALEOMAGNETISM OF BASALTIC ROCKS 5
the demagnetization was sometimes curtailed at lower temperatures(e.g., ~450°–500°C).
Demagnetization results from each sample were plotted on an or-thogonal vector diagram (Zijderveld plot) to find a characteristic mag-netization direction. Using principal component analysis (Kirschvink,1980), a least-squares line was fit to a straight segment of the demagne-tization curve (if one was evident) anchored at the plot origin. The bestleast-squares magnetization vector was calculated, along with the maxi-mum angle of deflection (MAD) (Kirshvink, 1980), which is a measureof the scatter in the points constraining the magnetization inversion.
Magnetization inclinations from the individual samples were com-bined to calculate a mean direction for the site in several steps. I usedanalysis methods described by Cox and Gordon (1984), which recom-mend working with colatitude, rather than inclination, but are other-wise analogous to inclination analysis. First, colatitude values forsamples from each individual flow were averaged to determine a flowmean. Flow average colatitude values were tested against those of adja-cent flows to see if they are statistically different at the 95% confidencelevel using the Z statistic (Kono, 1980). If adjacent means were not sta-tistically distinct, they were combined and the procedure repeated withother adjacent flows. A few flows were sampled with a single sample,which precluded determining the standard deviation for that flow. Insuch cases, the average standard deviation for all flows was used for thesingle sample for testing the colatitude relative to surrounding flows.Using this method, a series of group means was calculated. Cox andGordon (1984) recommend that group means representing an intervalof time less than the coherency time of paleosecular variation should becombined and averaged so that oversampling of short time intervalsdoes not bias the mean colatitude and uncertainty estimates. To accom-plish this, group means were judged to be serially correlated if they didnot show a large change between successive means (~8° to 10°) or if agroup of colatitudes followed a smooth trend (Cox and Gordon, 1984).Although this procedure is subjective, the result is a more conservativeestimate of the mean colatitude, the number of independent flow meancolatitudes, and the error limits.
Using the independent group mean colatitude values, the site meanvalue was computed, again following the methods of Cox and Gordon(1984). This procedure both provides a correction for bias caused by av-eraging inclination-only data and gives an estimate of the data errorsand site mean colatitude. The mean colatitude is calculated by averag-ing the group means and applying a correction for bias from inclina-tion-only data. An estimate of the random error is determined frombetween-group colatitude variations, and an estimate of the colatitudevariance produced by secular variation is taken from a model of secularvariation. The final error bounds are calculated including an assump-tion of 2° of systematic error possibly caused by off-vertical tilt of theborehole (a quantity not measured during most legs) and correcting forthe number of independent group means (Cox and Gordon, 1984).
RESULTS
Site 169
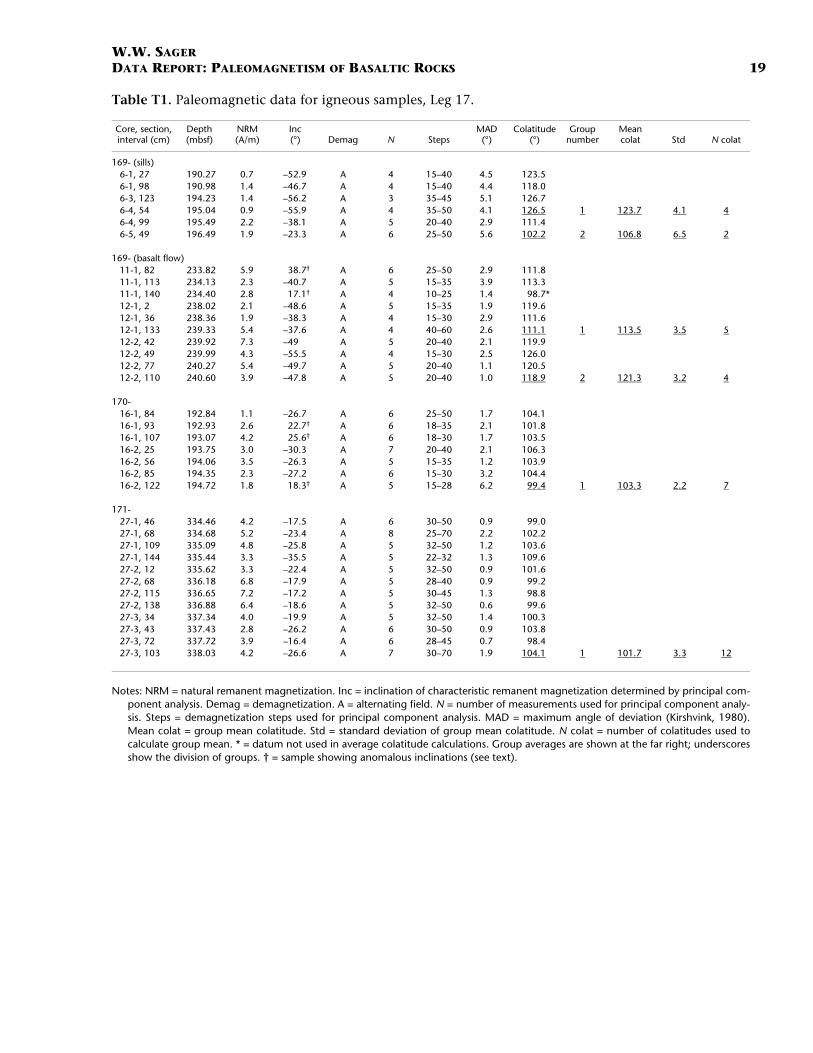
Sixteen samples were measured from Site 169, with six from the dia-base and the other ten from the basement basalt (Table T1). Natural
T1. Paleomagnetic data for ig-neous samples, Leg 17, p. 19.
W.W. SAGERDATA REPORT: PALEOMAGNETISM OF BASALTIC ROCKS 6
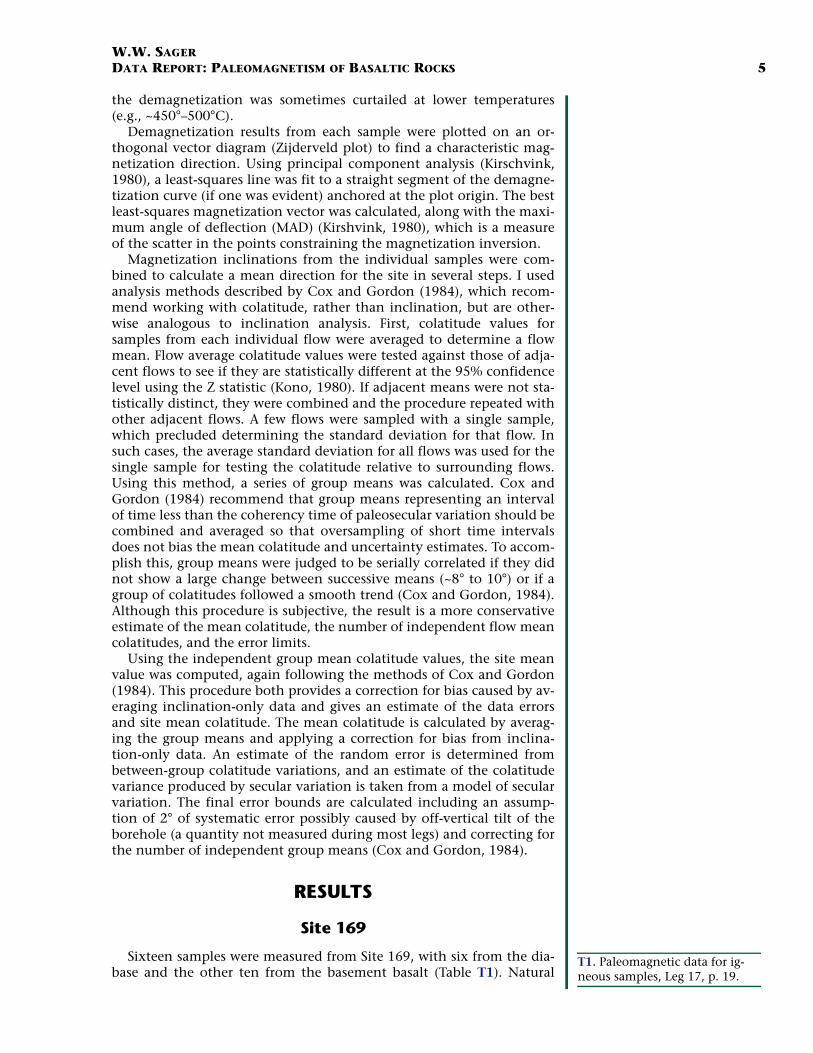
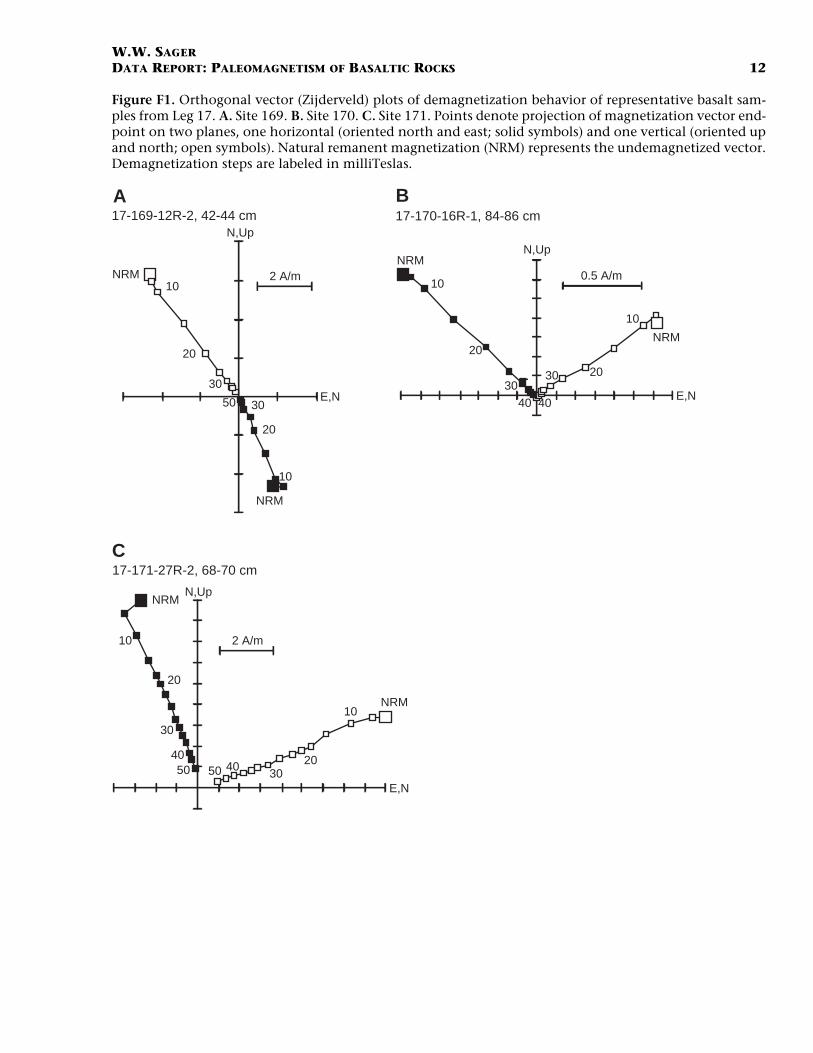
remanent magnetization (NRM) intensities were higher in the basaltsection (1.9–7.3 A/m) than in the diabase (0.7–1.9 A/m). All sampleswere AF demagnetized. Demagnetization behavior for the basalts wasgenerally excellent, with successive demagnetization steps tracing asmooth line toward the origin (Fig. F1). Because of this behavior, MADangles were small, typically <2° (Table T1). Although the results fromthe diabase sill were not quite as consistent, as indicated by larger MADangles (2.9°–5.6°), it was possible to define characteristic magnetizationdirections for all samples (Table T1).
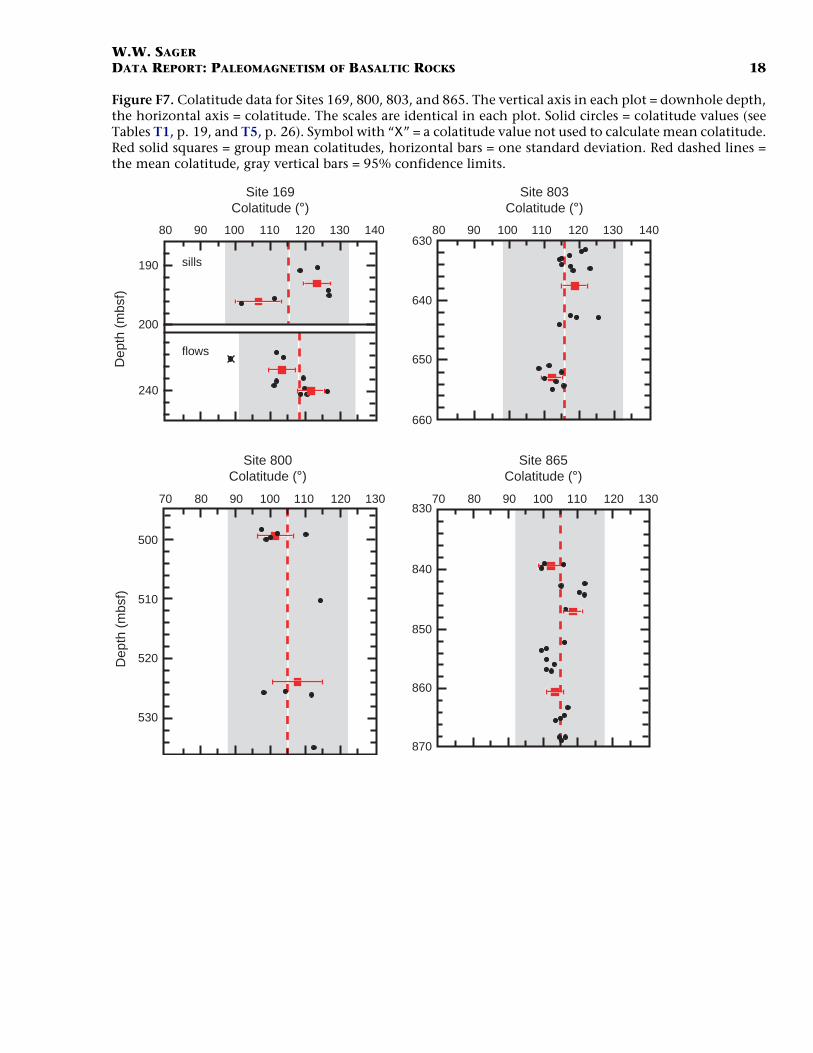
All inclinations from the diabase sill are negative and define two dis-tinct units. The upper four samples (17-169-6R-1, 27–29 cm, to 6R-4,54–56 cm) yield an average colatitude of 123.7°, whereas the lower twosamples (17-169-6R-4, 99–101 cm, and 6R-5, 49–51 cm) give an averageof 106.8°. This difference suggests that there are two sills, probably em-placed at times separated by at least a few thousand years, long enoughfor secular variation to change the magnetic field inclination. If the sillswere formed during the mid-Cretaceous, their magnetic polarity shouldbe normal. The colatitude values are consistent with normal magnetiza-tion acquired south of the equator.
Two of the samples from the basalt flow section have positive incli-nations. This is likely a result of inadvertent inversion of the core piecesduring handling. This section could be interpreted as normal polarityformed south of the equator or a reversed polarity formed north of theequator if the inclinations of these samples are assumed to be negative.Given that the site is near Anomaly M21 and the observation that Ju-rassic paleomagnetic data probably indicate significantly less north-ward drift of the Pacific plate than mid-Cretaceous data (Cox andGordon, 1984; Larson et al., 1992), the reversed polarity interpretationmay be the correct one. The sample colatitudes fall into two groups: theupper six samples with colatitudes <113°, and the lower four sampleswith colatitudes >118° (Table T1). The Z-test indicates that these twogroups are statistically distinct at 95% confidence.
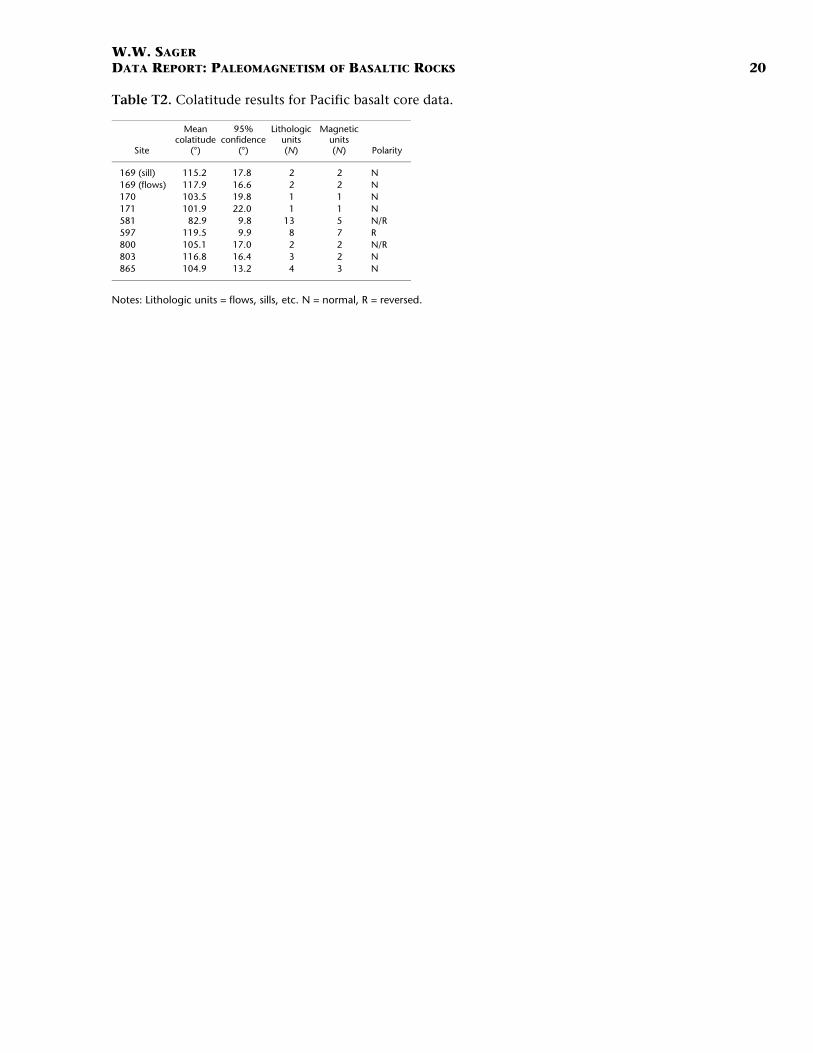
Calculation of corrected colatitudes and confidence limits gives115.2° ± 17.8° (this and other colatitude errors are 2 � bounds, approxi-mating 95% confidence) for the diabase sills and 117.9° ± 16.6° for thebasalt section (Table T2).
Site 170
Seven samples were measured from Core 17-170-16R (Table T1), re-cording moderate NRM intensities (1.1–4.2 A/m). Although the samplesgave good demagnetization results (Fig. F1), the sample inclinations areinconsistent in sign. Four samples gave negative inclinations, whereasthree gave positive values. Because the demagnetization results appearconsistent, I assume the difference in signs reflects inversion duringhandling or transport and that the negative inclination is appropriate.This corresponds to a normal polarity magnetization acquired south ofthe equator. When given the same inclination signs, the samples showlittle variation in colatitude values, implying a single magnetic unit. Av-eraging of the colatitude values gives a mean of 103.5° ± 19.8° (TableT2).
Site 171
Twelve samples were measured from Site 171 (Table T1). NRM valueswere slightly higher than those from Sites 169 and 170, ranging from
F1. Orthogonal vector plots for basalt, Leg 17, p. 12.
E,N
NRM
NRMN,Up
17-171-27R-2, 68-70 cm
10
20
30
4050
10
2030
4050
2 A/m
N,Up
E,N
NRM
17-169-12R-2, 42-44 cm
NRM
2 A/m10
20
30
50
10
20
30
NRM
NRM
17-170-16R-1, 84-86 cm
N,Up
E,N
10
20
3040
10
2030
40
0.5 A/m
A B
C
T2. Colatitude results for Pacific basalt core data, p. 20.
W.W. SAGERDATA REPORT: PALEOMAGNETISM OF BASALTIC ROCKS 7
3.3 to 7.2 A/m. All produced smooth demagnetization plots (Fig. F1)and consistent negative inclinations that imply a single magnetic unit.The measurements define a mean colatitude of 101.9° ± 22.0° (TableT2).
Site 581
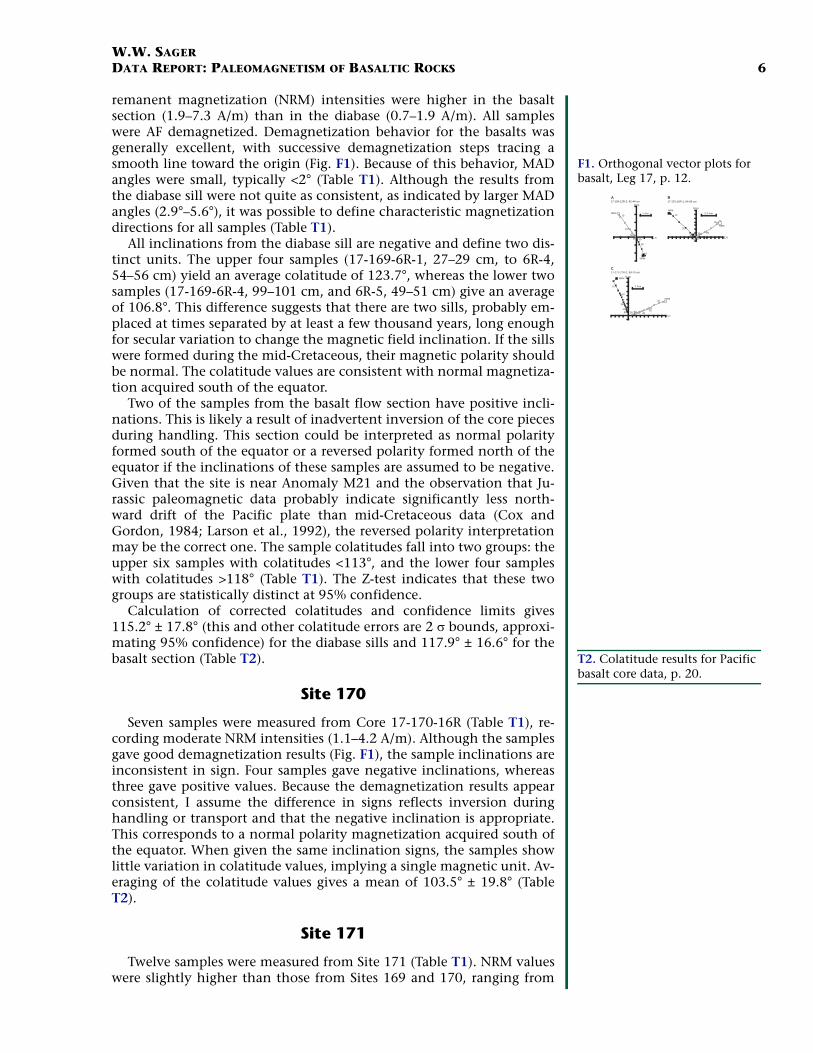
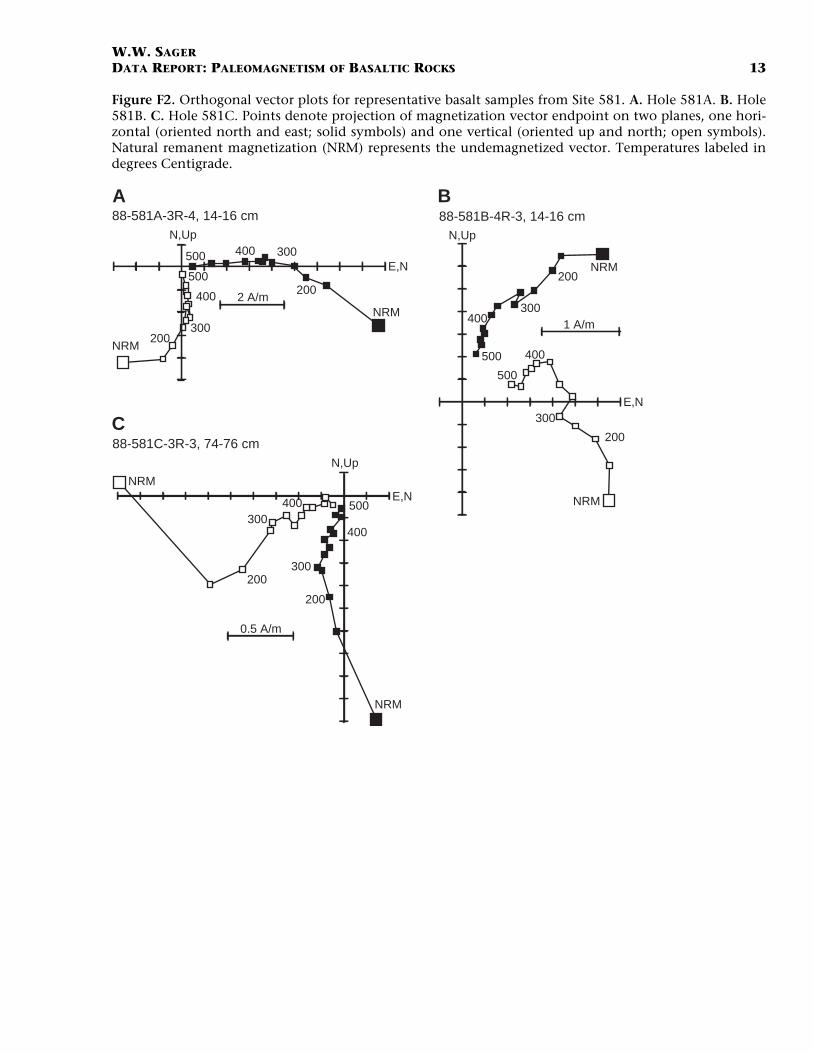
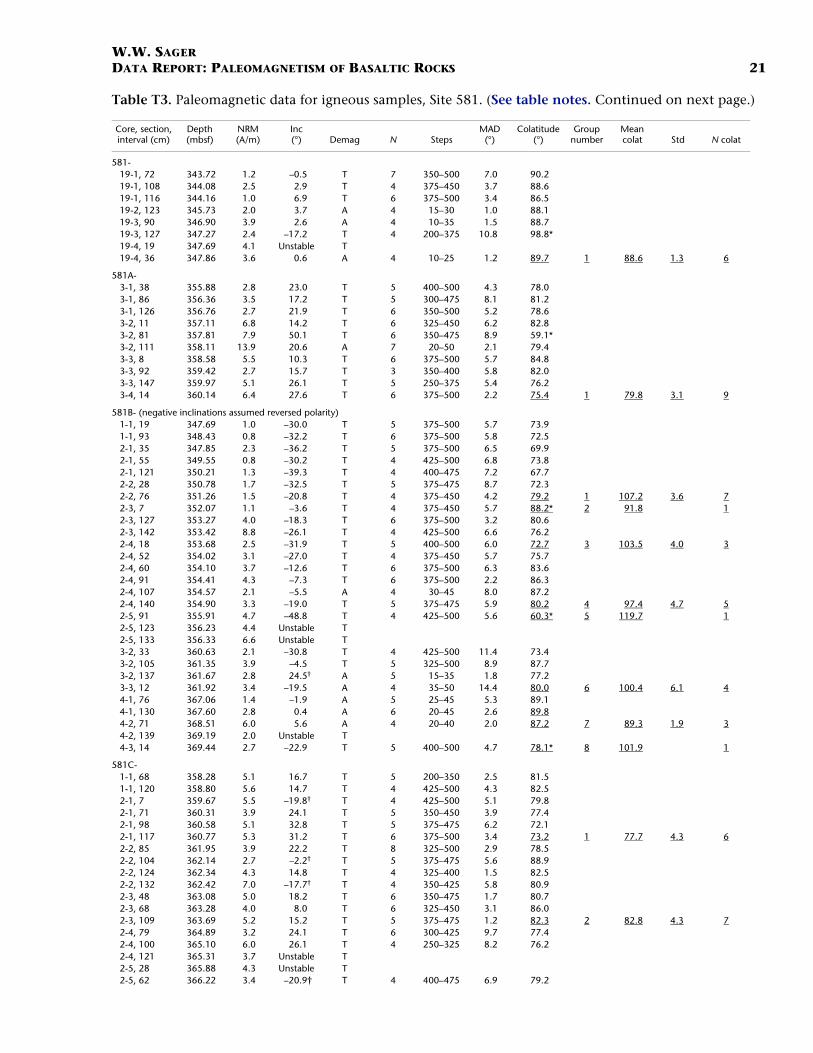
A total of 84 samples from Site 581 was measured: 8 from Hole 581,10 from Hole 581A, 28 from Hole 581B, and 38 from Hole 581C (TableT3). In general, NRM values were moderate to strong but display arange from 1.4 to 13.9 A/m. Only 10 samples were AF demagnetizedbecause the samples appeared to be prone to acquisition of a spuriousmagnetization, perhaps an anhysteretic remanent magnetization(ARM), induced in the demagnetization apparatus at high demagnetiza-tion steps. Demagnetization behavior of Site 581 samples was not assmooth as those from Sites 169–171; although only three samples dis-played unstable behavior. Commonly, the demagnetization removed amoderate to large low-temperature overprint and sometimes a separatemedium-temperature overprint (Fig. F2). The characteristic magnetiza-tion direction was typically revealed at temperatures of 300°C andabove (Fig. F2). Typically, four to six demagnetization steps were usedto calculate the characteristic direction, producing relatively low MADangles of less than ~8° (Table T3).
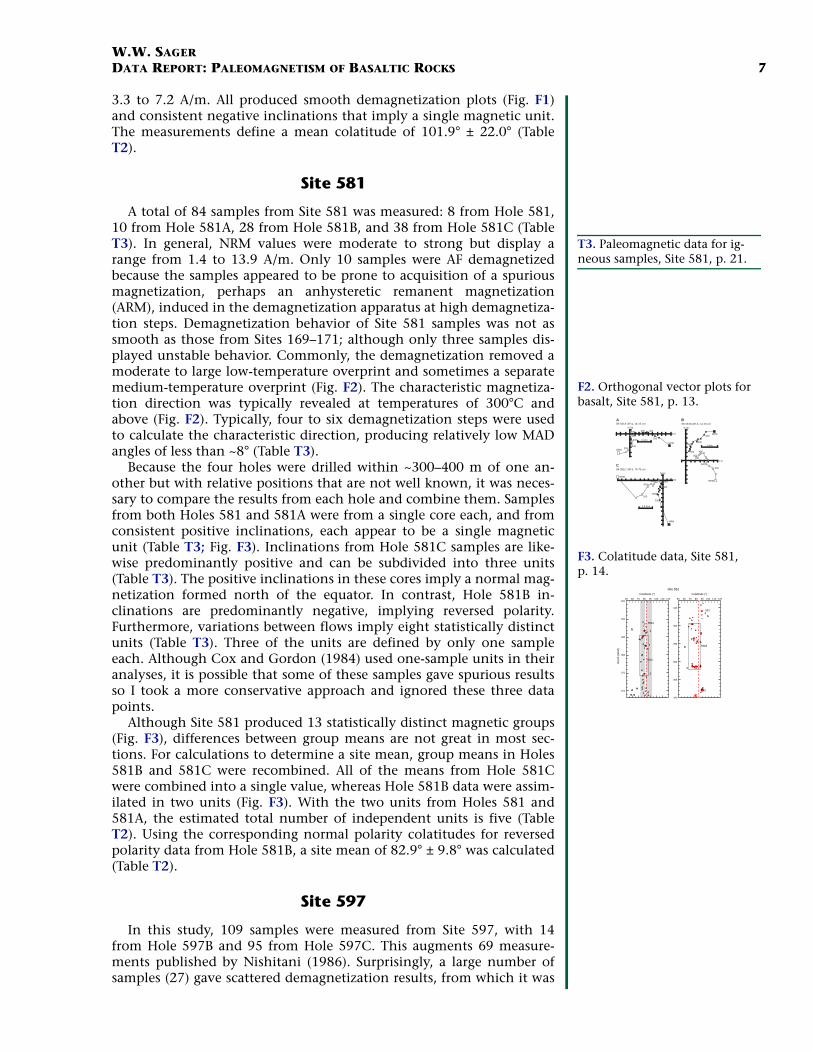
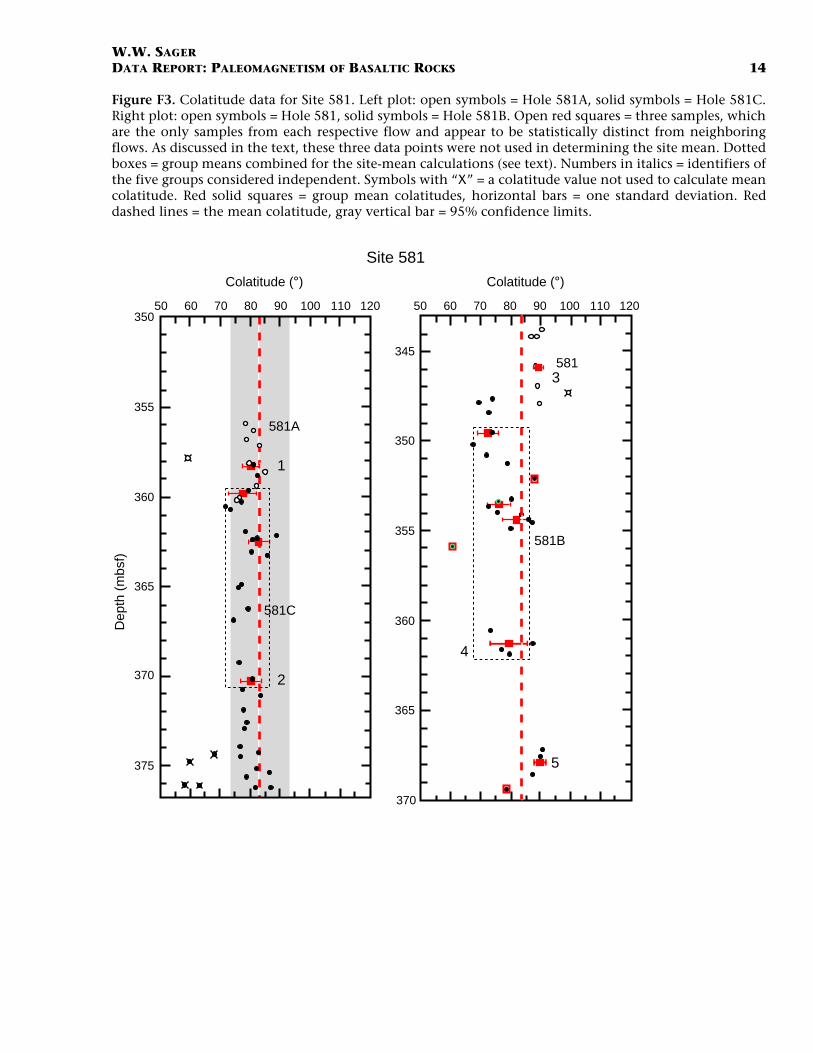
Because the four holes were drilled within ~300–400 m of one an-other but with relative positions that are not well known, it was neces-sary to compare the results from each hole and combine them. Samplesfrom both Holes 581 and 581A were from a single core each, and fromconsistent positive inclinations, each appear to be a single magneticunit (Table T3; Fig. F3). Inclinations from Hole 581C samples are like-wise predominantly positive and can be subdivided into three units(Table T3). The positive inclinations in these cores imply a normal mag-netization formed north of the equator. In contrast, Hole 581B in-clinations are predominantly negative, implying reversed polarity.Furthermore, variations between flows imply eight statistically distinctunits (Table T3). Three of the units are defined by only one sampleeach. Although Cox and Gordon (1984) used one-sample units in theiranalyses, it is possible that some of these samples gave spurious resultsso I took a more conservative approach and ignored these three datapoints.
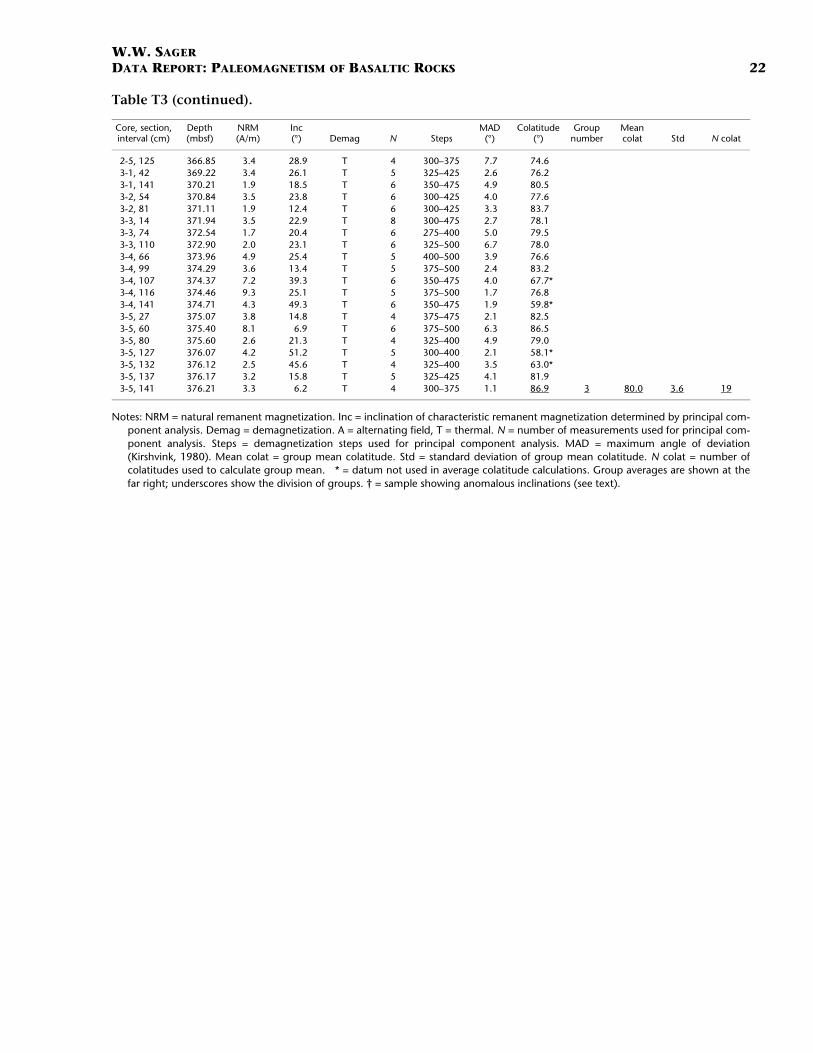
Although Site 581 produced 13 statistically distinct magnetic groups(Fig. F3), differences between group means are not great in most sec-tions. For calculations to determine a site mean, group means in Holes581B and 581C were recombined. All of the means from Hole 581Cwere combined into a single value, whereas Hole 581B data were assim-ilated in two units (Fig. F3). With the two units from Holes 581 and581A, the estimated total number of independent units is five (TableT2). Using the corresponding normal polarity colatitudes for reversedpolarity data from Hole 581B, a site mean of 82.9° ± 9.8° was calculated(Table T2).
Site 597
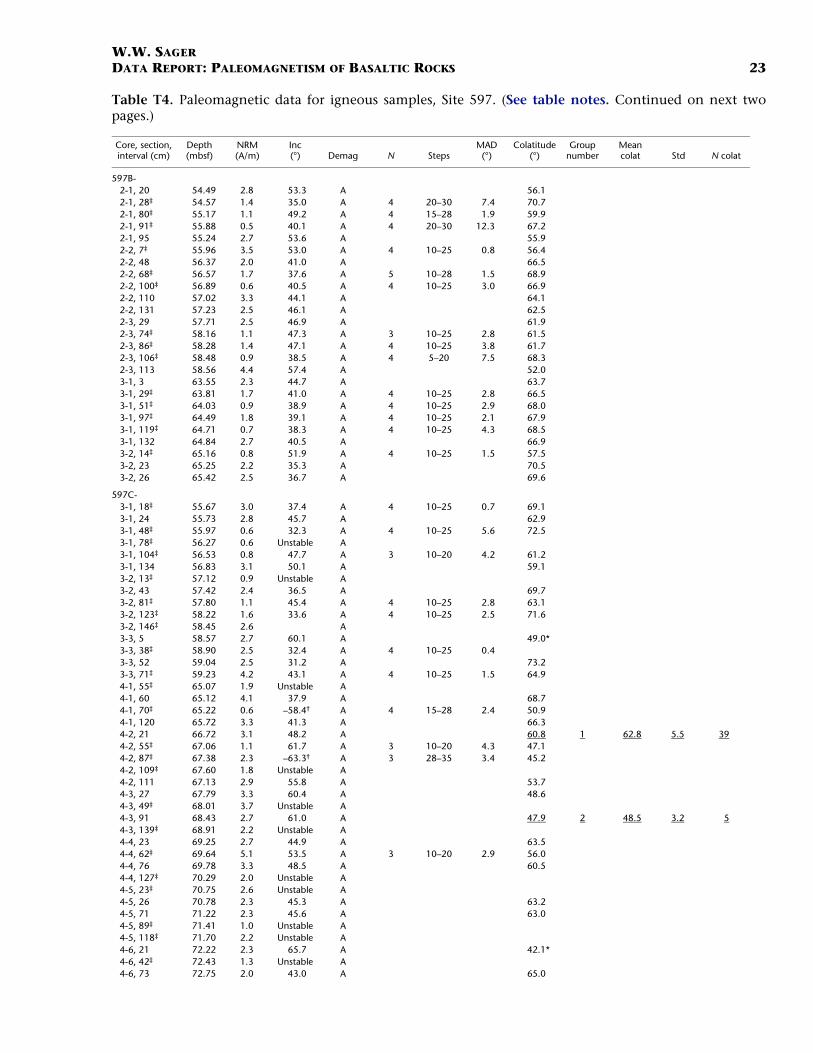
In this study, 109 samples were measured from Site 597, with 14from Hole 597B and 95 from Hole 597C. This augments 69 measure-ments published by Nishitani (1986). Surprisingly, a large number ofsamples (27) gave scattered demagnetization results, from which it was
T3. Paleomagnetic data for ig-neous samples, Site 581, p. 21.
F2. Orthogonal vector plots for basalt, Site 581, p. 13.
NRM
NRM
N,Up
E,N
88-581A-3R-4, 14-16 cm
200
300400500
200300
400
500
2 A/m
NRM
NRM
88-581B-4R-3, 14-16 cm
200
300
400
500
200
300400
500
1 A/m
E,N
N,Up
88-581C-3R-3, 74-76 cm
NRM
200
300400 500
E,N
N,Up
200
300
400
NRM
0.5 A/m
A B
C
F3. Colatitude data, Site 581, p. 14.
Dep
th (
mbs
f)
Site 581
581C
581A
581B
581
1
2
3
4
5
350
355
360
365
370
375
345
350
355
360
365
370
50 60 70 9080 100 110 120 50 60 70 9080 100 110 120
Colatitude (°) Colatitude (°)
W.W. SAGERDATA REPORT: PALEOMAGNETISM OF BASALTIC ROCKS 8
impossible to define a characteristic direction (Table T4). Moreover,with many samples it was impossible to define the characteristic mag-netization direction with more than three to four demagnetizationsteps (Table T4). It is not clear why the samples in this study gave er-ratic results: whether the problem occurred in measurement or in the17 years of storage, or whether Nishitani, who also used AF demagneti-zation, simply did not mention spurious results in his report. Interest-ingly, all of the unstable samples are from Hole 597C, suggesting theerratic behavior is at least partly dependent on lithology.
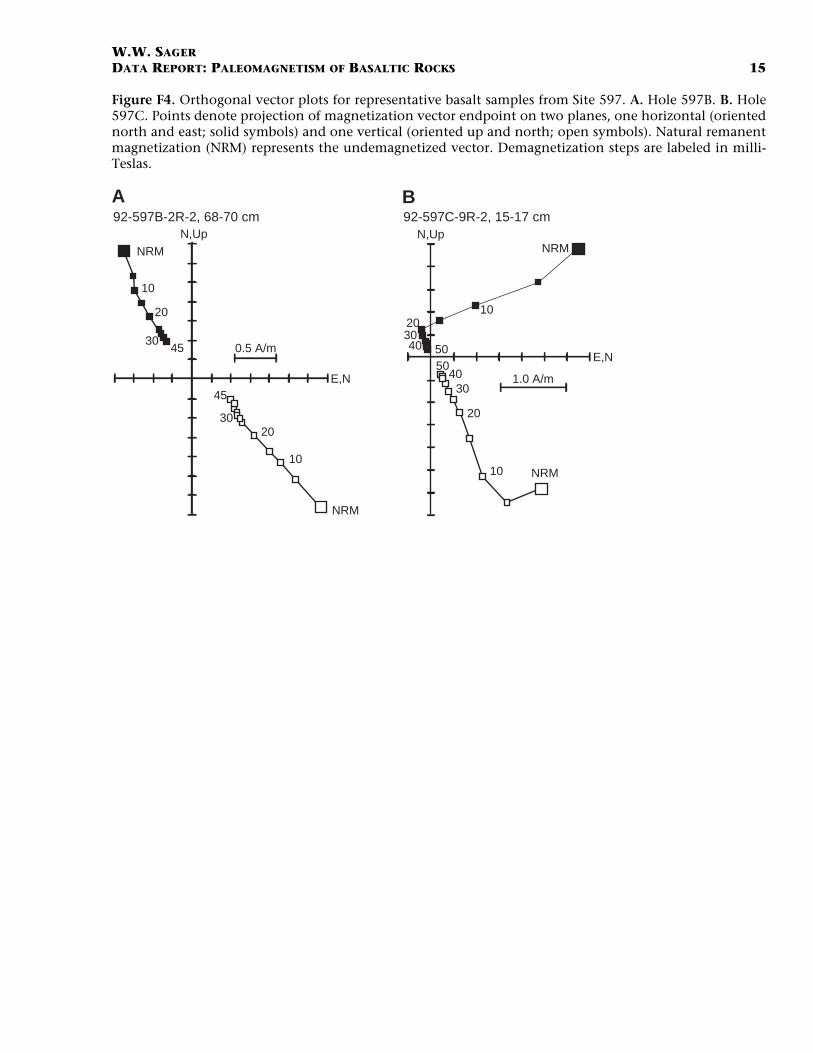
Despite these problems, the best demagnetization data yield smoothorthogonal vector plots (Fig. F4) that define consistent magnetizationvectors. Most samples give positive inclinations, indicative of reversedmagnetic polarity in the Southern Hemisphere, where the site is lo-cated. NRM values are somewhat low, with most samples having mag-netizations <3 A/m.
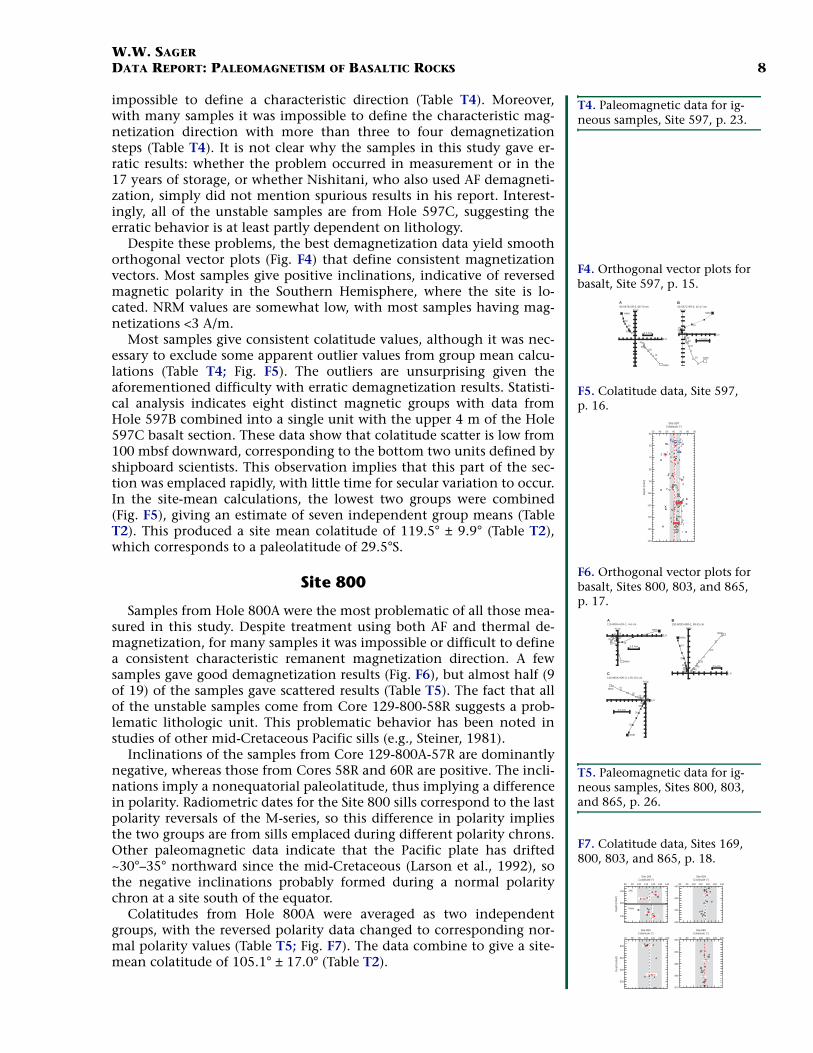
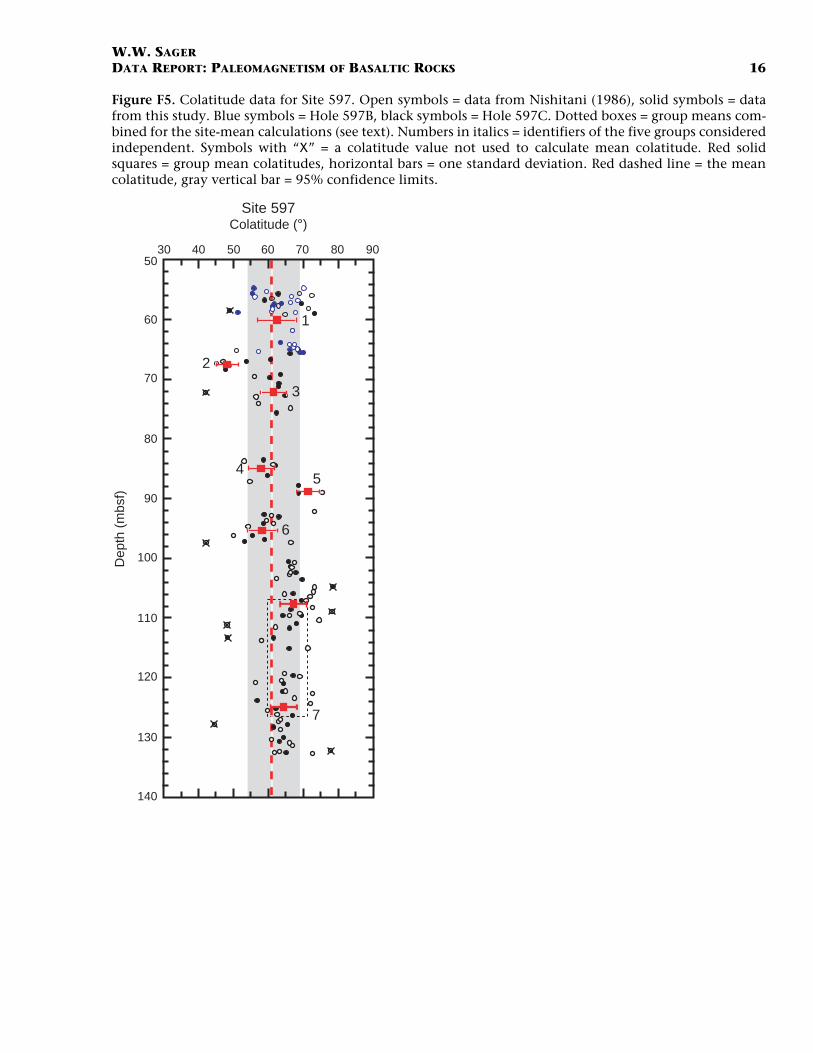
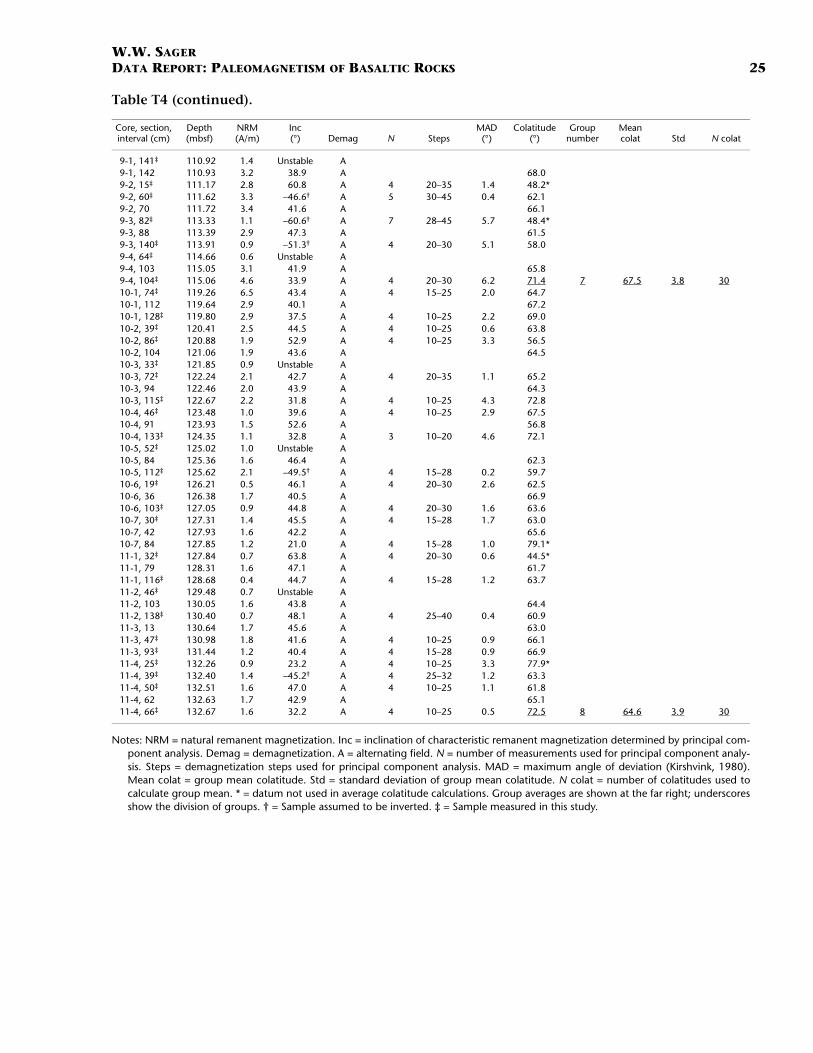
Most samples give consistent colatitude values, although it was nec-essary to exclude some apparent outlier values from group mean calcu-lations (Table T4; Fig. F5). The outliers are unsurprising given theaforementioned difficulty with erratic demagnetization results. Statisti-cal analysis indicates eight distinct magnetic groups with data fromHole 597B combined into a single unit with the upper 4 m of the Hole597C basalt section. These data show that colatitude scatter is low from100 mbsf downward, corresponding to the bottom two units defined byshipboard scientists. This observation implies that this part of the sec-tion was emplaced rapidly, with little time for secular variation to occur.In the site-mean calculations, the lowest two groups were combined(Fig. F5), giving an estimate of seven independent group means (TableT2). This produced a site mean colatitude of 119.5° ± 9.9° (Table T2),which corresponds to a paleolatitude of 29.5°S.
Site 800
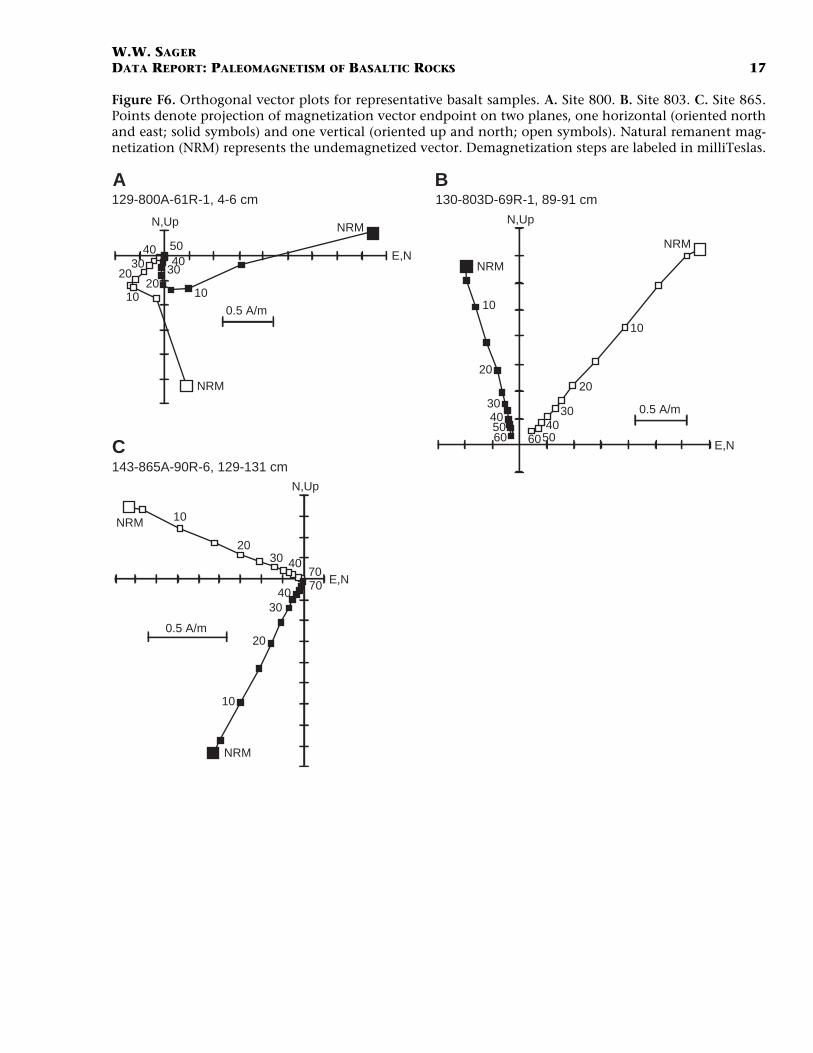
Samples from Hole 800A were the most problematic of all those mea-sured in this study. Despite treatment using both AF and thermal de-magnetization, for many samples it was impossible or difficult to definea consistent characteristic remanent magnetization direction. A fewsamples gave good demagnetization results (Fig. F6), but almost half (9of 19) of the samples gave scattered results (Table T5). The fact that allof the unstable samples come from Core 129-800-58R suggests a prob-lematic lithologic unit. This problematic behavior has been noted instudies of other mid-Cretaceous Pacific sills (e.g., Steiner, 1981).
Inclinations of the samples from Core 129-800A-57R are dominantlynegative, whereas those from Cores 58R and 60R are positive. The incli-nations imply a nonequatorial paleolatitude, thus implying a differencein polarity. Radiometric dates for the Site 800 sills correspond to the lastpolarity reversals of the M-series, so this difference in polarity impliesthe two groups are from sills emplaced during different polarity chrons.Other paleomagnetic data indicate that the Pacific plate has drifted~30°–35° northward since the mid-Cretaceous (Larson et al., 1992), sothe negative inclinations probably formed during a normal polaritychron at a site south of the equator.
Colatitudes from Hole 800A were averaged as two independentgroups, with the reversed polarity data changed to corresponding nor-mal polarity values (Table T5; Fig. F7). The data combine to give a site-mean colatitude of 105.1° ± 17.0° (Table T2).
T4. Paleomagnetic data for ig-neous samples, Site 597, p. 23.
F4. Orthogonal vector plots for basalt, Site 597, p. 15.
NRM
E,N
N,Up
NRM
10
2030
45
10
20
3045 0.5 A/m
10
20
3040
50
NRM
NRM
10203040 50
E,N
N,Up
1.0 A/m
92-597B-2R-2, 68-70 cm 92-597C-9R-2, 15-17 cmA B
F5. Colatitude data, Site 597, p. 16.
30 40 50 60 70 9080
Dep
th (
mbs
f)
Site 597Colatitude (°)
1
2
3
45
6
7
50
60
70
80
90
100
110
120
130
140
F6. Orthogonal vector plots for basalt, Sites 800, 803, and 865, p. 17.
NRM
E,N
N,Up NRM
1020
30
10
2030
0.5 A/m
129-800A-61R-1, 4-6 cm
405040
130-803D-69R-1, 89-91 cm
N,Up
E,N
0.5 A/m
NRM
NRM
10
20
304050
60
10
20
3040
5060
E,N
N,Up
143-865A-90R-6, 129-131 cm
0.5 A/m
10
20
3040
70
NRM
NRM
10
2030 40
70
A B
C
T5. Paleomagnetic data for ig-neous samples, Sites 800, 803, and 865, p. 26.
F7. Colatitude data, Sites 169, 800, 803, and 865, p. 18.
90 100 110 120 130 140
90 100 110 12080 130
Dep
th (
mbs
f)
190
200
240
Dep
th (
mbs
f)
sills
flows
630
640
650
660
80100 110 120 130 1409080
Site 803Colatitude (°)
Site 169Colatitude (°)
7090 100 110 1208070 130
Site 865Colatitude (°)
Site 800Colatitude (°)
830
840
850
860
870
500
510
520
530
W.W. SAGERDATA REPORT: PALEOMAGNETISM OF BASALTIC ROCKS 9
Site 803
Demagnetization results from the 20 Site 803 samples were excellent,with most samples showing little overprint and giving smooth demag-netization curves (Fig. F6). Characteristic remanent magnetization di-rections were precisely defined, with five to seven steps used in thecalculation, producing MAD angles <2° (Table T5). Inclination valueswere consistently negative, indicating a normal polarity acquired southof the equator. Colatitudes were grouped into two independent units(Fig. F7) and defined a site-mean colatitude of 116.8° ± 16.5° (Table T2).
Site 865
Data from Site 865 also displayed consistent demagnetization behav-ior with little overprint (Fig. F6). Almost all of the 22 samples allowedfive to seven demagnetization steps for definition of the characteristicremanent magnetization direction, often giving MAD angles of <1° (Ta-ble T5). All samples gave negative inclinations, indicating normal po-larity sills emplaced south of the equator. This result is consistent withthe radiometric date for the sites, which falls within the CretaceousLong Normal Superchron. Mean colatitudes for the three sampled sillswere distinct, averaging to give a site-mean of 104.9° ± 13.2° (Table T2;Fig. F7).
ACKNOWLEDGMENTS
The author thanks Jerry Bode of the West Coast Core Repository forhis help in sampling DSDP cores as well as Phil Rumford and the staff ofthe Gulf Coast Repository for their help with ODP cores. This researchused samples and data provided by the Ocean Drilling Program (ODP).The ODP is sponsored by the U.S. National Science Foundation (NSF)and participating countries under the management of Joint Oceano-graphic Institutions (JOI), Inc. Funding from JOI/USSSP supported themeasurements and analyses.
W.W. SAGERDATA REPORT: PALEOMAGNETISM OF BASALTIC ROCKS 10
REFERENCES
Bass, M.N., Moberly, R., Rhodes, J.M., Shih, C.C., and Church, S.E., 1973. Volcanicrocks cored in the Central Pacific, Leg 17, Deep Sea Drilling Project. In Winterer,E.L., Ewing, J.I., et al., Init. Repts. DSDP, 17: Washington (U.S. Govt. PrintingOffice), 429–503.
Cande, S.C., and Kent, D.V., 1995. Revised calibration of the geomagnetic polaritytimescale for the Late Cretaceous and Cenozoic. J. Geophys. Res., 100:6093–6095.
Cox, A., and Gordon, R.G., 1984. Paleolatitudes determined from paleomagnetic datafrom vertical cores. Rev. Geophys. Space Phys., 22:47–72.
Gordon, R.G., and Cox, A., 1980. Calculating paleomagnetic poles for oceanic plates.Geophys. J. R. Astron. Soc., 63:619–640.
Gradstein, F.M., Agterberg, F.P., Ogg, J.G., Hardenbol, J., van Veen, P., Thierry, J., andHuang, Z., 1994. A Mesozoic time scale. J. Geophys. Res., 99:24051–24074.
Kirschvink, J.L., 1980. The least-squares line and plane and the analysis of palaeo-magnetic data. Geophys. J. R. Astron. Soc., 62:699–718.
Kono, M., 1980. Paleomagnetism of DSDP Leg 55 basalts and implications for the tec-tonics of the Pacific plate. In Jackson, E.D., Koizumi, I., et al., Init. Repts. DSDP, 55:Washington (U.S. Govt. Printing Office), 737–752.
Larson, R.L., Steiner, M.B., Erba, E., and Lancelot, Y., 1992. Paleolatitudes and tec-tonic reconstructions of the oldest portion of the Pacific plate: a comparativestudy. In Larson, R.L., Lancelot, Y., et al., Proc. ODP, Sci. Results, 129: College Sta-tion, TX (Ocean Drilling Program), 615–631.
Mahoney, J.J., Storey, M., Duncan, R.A., Spencer, K.J., and Pringle, M., 1993.Geochemistry and geochronology of Leg 130 basement lavas: nature and origin ofthe Ontong Java Plateau. In Berger, W.H., Kroenke, L.W., Mayer, L.A., et al., Proc.ODP, Sci. Results, 130: College Station, TX (Ocean Drilling Program), 3–22.
Nakanishi, M., Sager, W.W., and Klaus, A., 1999. Magnetic lineations within ShatskyRise, northwest Pacific Ocean: implications for hot spot–triple junction interactionand oceanic plateau formation. J. Geophys. Res., 104:7539–7556.
Nakanishi, M., Tamaki, K., and Kobayashi, K., 1992. Magnetic anomaly lineationsfrom Late Jurassic to Early Cretaceous in the west-central Pacific Ocean. Geophys. J.Int., 109:701–719.
Nakanishi, M., and Winterer, E.L., 1998. Tectonic history of the Pacific-Farallon-Phoenix triple junction from Late Jurassic to Early Cretaceous: an abandonedMesozoic spreading system in the Central Pacific Basin. J. Geophys. Res.,103:12453–12468.
Nishitani, T., 1986. Magnetic properties of basalt samples from Deep Sea DrillingProject Holes 597B and 597C. In Leinen, M., Rea, D.K., et al., Init. Repts. DSDP, 92:Washington (U.S. Govt. Printing Office), 527–535.
Pringle, M.S., 1992. Radiometric ages of basaltic basement recovered at Sites 800, 801,and 802, Leg 129, western Pacific Ocean. In Larson, R.L., Lancelot, Y., et al., Proc.ODP, Sci. Results, 129: College Station, TX (Ocean Drilling Program), 389–404.
Pringle, M.S., and Duncan, R.A., 1995. Radiometric ages of basaltic lavas recovered atSites 865, 866, and 869. In Winterer, E.L., Sager, W.W., Firth, J.V., and Sinton, J.M.(Eds.), Proc. ODP, Sci. Results, 143: College Station, TX (Ocean Drilling Program),277–283.
Schlanger, S.O., Garcia, M.O., Keating, B.H., Naughton, J.J., Sager, W.W., Haggerty,J.A., Philpotts, J.A., and Duncan, R.A., 1984. Geology and geochronology of theLine Islands. J. Geophys. Res., 89:11261–11272.
Schlanger, S.O., Jenkyns, H.C., and Premoli-Silva, I., 1981. Volcanism and vertical tec-tonics in the Pacific Basin related to global Cretaceous transgressions. Earth Planet.Sci. Lett., 52:435–449.
Shipboard Scientific Party, 1973a. Site 169. In Winterer, E.L., Ewing, J.I., et al., Init.Repts. DSDP, 17: Washington (U.S. Govt. Printing Office), 247–262.
W.W. SAGERDATA REPORT: PALEOMAGNETISM OF BASALTIC ROCKS 11
————, 1973b. Site 170. In Winterer, E.L., Ewing, J.I., et al., Init. Repts. DSDP, 17:Washington (U.S. Govt. Printing Office), 263–281.
————, 1973c. Site 171. In Winterer, E.L., Ewing, J.I., et al., Init. Repts. DSDP, 17:Washington (U.S. Govt. Printing Office), 283–334.
————, 1985. Site 581. In Heath, G.R., Burkle, L.H., et al., Init. Repts. DSDP, 86:Washington (U.S. Govt. Printing Office), 241–266.
————, 1986. Site 597. In Leinen, M., Rea, D.K., et al., Init. Repts. DSDP, 92: Wash-ington (U.S. Govt. Printing Office), 25–96.
————, 1987. Site 581. In Duennebier, F.K., Stephen, R., Gettrust, J.F., et al., Init.Repts. DSDP, 88: Washington (U.S. Govt. Printing Office), 9–36.
————, 1990. Site 800. In Lancelot, Y., Larson, R.L., et al., Proc. ODP, Init. Repts., 129:College Station, TX (Ocean Drilling Program), 33–89.
————, 1991. Site 803. In Kroenke, L.W., Berger, W.H., Janecek, T.R., et al., Proc.ODP, Init. Repts., 130: College Station, TX (Ocean Drilling Program), 101–176.
————, 1993. Site 865. In Sager, W.W., Winterer, E.L., Firth, J.V., et al., Proc. ODP,Init. Repts., 143: College Station, TX (Ocean Drilling Program), 111–180.
Steiner, M.B., 1981. Paleomagnetism of the igneous complex, Site 462. In Larson, R.L., Schlanger, S.O., et al., Init. Repts. DSDP, 61: Washington (U.S. Govt. PrintingOffice), 717–729.
W.W. SAGERDATA REPORT: PALEOMAGNETISM OF BASALTIC ROCKS 12
Figure F1. Orthogonal vector (Zijderveld) plots of demagnetization behavior of representative basalt sam-ples from Leg 17. A. Site 169. B. Site 170. C. Site 171. Points denote projection of magnetization vector end-point on two planes, one horizontal (oriented north and east; solid symbols) and one vertical (oriented upand north; open symbols). Natural remanent magnetization (NRM) represents the undemagnetized vector.Demagnetization steps are labeled in milliTeslas.
E,N
NRM
NRMN,Up
17-171-27R-2, 68-70 cm
10
20
30
4050
10
2030
4050
2 A/m
N,Up
E,N
NRM
17-169-12R-2, 42-44 cm
NRM
2 A/m10
20
30
50
10
20
30
NRM
NRM
17-170-16R-1, 84-86 cm
N,Up
E,N
10
20
3040
10
2030
40
0.5 A/m
A B
C
W.W. SAGERDATA REPORT: PALEOMAGNETISM OF BASALTIC ROCKS 13
Figure F2. Orthogonal vector plots for representative basalt samples from Site 581. A. Hole 581A. B. Hole581B. C. Hole 581C. Points denote projection of magnetization vector endpoint on two planes, one hori-zontal (oriented north and east; solid symbols) and one vertical (oriented up and north; open symbols).Natural remanent magnetization (NRM) represents the undemagnetized vector. Temperatures labeled indegrees Centigrade.
NRM
NRM
N,Up
E,N
88-581A-3R-4, 14-16 cm
200
300400500
200300
400
500
2 A/m
NRM
NRM
88-581B-4R-3, 14-16 cm
200
300
400
500
200
300400
500
1 A/m
E,N
N,Up
88-581C-3R-3, 74-76 cm
NRM
200
300400 500
E,N
N,Up
200
300
400
NRM
0.5 A/m
A B
C
W.W. SAGERDATA REPORT: PALEOMAGNETISM OF BASALTIC ROCKS 14
Figure F3. Colatitude data for Site 581. Left plot: open symbols = Hole 581A, solid symbols = Hole 581C.Right plot: open symbols = Hole 581, solid symbols = Hole 581B. Open red squares = three samples, whichare the only samples from each respective flow and appear to be statistically distinct from neighboringflows. As discussed in the text, these three data points were not used in determining the site mean. Dottedboxes = group means combined for the site-mean calculations (see text). Numbers in italics = identifiers ofthe five groups considered independent. Symbols with “X” = a colatitude value not used to calculate meancolatitude. Red solid squares = group mean colatitudes, horizontal bars = one standard deviation. Reddashed lines = the mean colatitude, gray vertical bar = 95% confidence limits.
Dep
th (
mbs
f)
Site 581
581C
581A
581B
581
1
2
3
4
5
350
355
360
365
370
375
345
350
355
360
365
370
50 60 70 9080 100 110 120 50 60 70 9080 100 110 120
Colatitude (°) Colatitude (°)
W.W. SAGERDATA REPORT: PALEOMAGNETISM OF BASALTIC ROCKS 15
Figure F4. Orthogonal vector plots for representative basalt samples from Site 597. A. Hole 597B. B. Hole597C. Points denote projection of magnetization vector endpoint on two planes, one horizontal (orientednorth and east; solid symbols) and one vertical (oriented up and north; open symbols). Natural remanentmagnetization (NRM) represents the undemagnetized vector. Demagnetization steps are labeled in milli-Teslas.
NRM
E,N
N,Up
NRM
10
2030
45
10
20
3045 0.5 A/m
10
20
3040
50
NRM
NRM
10203040 50
E,N
N,Up
1.0 A/m
92-597B-2R-2, 68-70 cm 92-597C-9R-2, 15-17 cmA B
W.W. SAGERDATA REPORT: PALEOMAGNETISM OF BASALTIC ROCKS 16
Figure F5. Colatitude data for Site 597. Open symbols = data from Nishitani (1986), solid symbols = datafrom this study. Blue symbols = Hole 597B, black symbols = Hole 597C. Dotted boxes = group means com-bined for the site-mean calculations (see text). Numbers in italics = identifiers of the five groups consideredindependent. Symbols with “X” = a colatitude value not used to calculate mean colatitude. Red solidsquares = group mean colatitudes, horizontal bars = one standard deviation. Red dashed line = the meancolatitude, gray vertical bar = 95% confidence limits.
30 40 50 60 70 9080
Dep
th (
mbs
f)
Site 597Colatitude (°)
1
2
3
45
6
7
50
60
70
80
90
100
110
120
130
140
W.W. SAGERDATA REPORT: PALEOMAGNETISM OF BASALTIC ROCKS 17
Figure F6. Orthogonal vector plots for representative basalt samples. A. Site 800. B. Site 803. C. Site 865.Points denote projection of magnetization vector endpoint on two planes, one horizontal (oriented northand east; solid symbols) and one vertical (oriented up and north; open symbols). Natural remanent mag-netization (NRM) represents the undemagnetized vector. Demagnetization steps are labeled in milliTeslas.
NRM
E,N
N,Up NRM
1020
30
10
2030
0.5 A/m
129-800A-61R-1, 4-6 cm
405040
130-803D-69R-1, 89-91 cm
N,Up
E,N
0.5 A/m
NRM
NRM
10
20
304050
60
10
20
3040
5060
E,N
N,Up
143-865A-90R-6, 129-131 cm
0.5 A/m
10
20
3040
70
NRM
NRM
10
2030 40
70
A B
C
W.W. SAGERDATA REPORT: PALEOMAGNETISM OF BASALTIC ROCKS 18
Figure F7. Colatitude data for Sites 169, 800, 803, and 865. The vertical axis in each plot = downhole depth,the horizontal axis = colatitude. The scales are identical in each plot. Solid circles = colatitude values (seeTables T1, p. 19, and T5, p. 26). Symbol with “X” = a colatitude value not used to calculate mean colatitude.Red solid squares = group mean colatitudes, horizontal bars = one standard deviation. Red dashed lines =the mean colatitude, gray vertical bars = 95% confidence limits.
90 100 110 120 130 140
90 100 110 12080 130
Dep
th (
mbs
f)
190
200
240
Dep
th (
mbs
f)
sills
flows
630
640
650
660
80100 110 120 130 1409080
Site 803Colatitude (°)
Site 169Colatitude (°)
7090 100 110 1208070 130
Site 865Colatitude (°)
Site 800Colatitude (°)
830
840
850
860
870
500
510
520
530
W.W. SAGERDATA REPORT: PALEOMAGNETISM OF BASALTIC ROCKS 19
Table T1. Paleomagnetic data for igneous samples, Leg 17.
Notes: NRM = natural remanent magnetization. Inc = inclination of characteristic remanent magnetization determined by principal com-ponent analysis. Demag = demagnetization. A = alternating field. N = number of measurements used for principal component analy-sis. Steps = demagnetization steps used for principal component analysis. MAD = maximum angle of deviation (Kirshvink, 1980).Mean colat = group mean colatitude. Std = standard deviation of group mean colatitude. N colat = number of colatitudes used tocalculate group mean. * = datum not used in average colatitude calculations. Group averages are shown at the far right; underscoresshow the division of groups. † = sample showing anomalous inclinations (see text).
Core, section, interval (cm)
Depth (mbsf)
NRM(A/m)
Inc(°) Demag N Steps
MAD(°)
Colatitude(°)
Group number
Meancolat Std N colat
169- (sills)6-1, 27 190.27 0.7 –52.9 A 4 15–40 4.5 123.56-1, 98 190.98 1.4 –46.7 A 4 15–40 4.4 118.06-3, 123 194.23 1.4 –56.2 A 3 35–45 5.1 126.76-4, 54 195.04 0.9 –55.9 A 4 35–50 4.1 126.5 1 123.7 4.1 46-4, 99 195.49 2.2 –38.1 A 5 20–40 2.9 111.46-5, 49 196.49 1.9 –23.3 A 6 25–50 5.6 102.2 2 106.8 6.5 2
169- (basalt flow)11-1, 82 233.82 5.9 38.7† A 6 25–50 2.9 111.811-1, 113 234.13 2.3 –40.7 A 5 15–35 3.9 113.311-1, 140 234.40 2.8 17.1† A 4 10–25 1.4 98.7*12-1, 2 238.02 2.1 –48.6 A 5 15–35 1.9 119.612-1, 36 238.36 1.9 –38.3 A 4 15–30 2.9 111.612-1, 133 239.33 5.4 –37.6 A 4 40–60 2.6 111.1 1 113.5 3.5 512-2, 42 239.92 7.3 –49 A 5 20–40 2.1 119.912-2, 49 239.99 4.3 –55.5 A 4 15–30 2.5 126.012-2, 77 240.27 5.4 –49.7 A 5 20–40 1.1 120.512-2, 110 240.60 3.9 –47.8 A 5 20–40 1.0 118.9 2 121.3 3.2 4
170- 16-1, 84 192.84 1.1 –26.7 A 6 25–50 1.7 104.116-1, 93 192.93 2.6 22.7† A 6 18–35 2.1 101.816-1, 107 193.07 4.2 25.6† A 6 18–30 1.7 103.516-2, 25 193.75 3.0 –30.3 A 7 20–40 2.1 106.316-2, 56 194.06 3.5 –26.3 A 5 15–35 1.2 103.916-2, 85 194.35 2.3 –27.2 A 6 15–30 3.2 104.416-2, 122 194.72 1.8 18.3† A 5 15–28 6.2 99.4 1 103.3 2.2 7
171- 27-1, 46 334.46 4.2 –17.5 A 6 30–50 0.9 99.027-1, 68 334.68 5.2 –23.4 A 8 25–70 2.2 102.227-1, 109 335.09 4.8 –25.8 A 5 32–50 1.2 103.627-1, 144 335.44 3.3 –35.5 A 5 22–32 1.3 109.627-2, 12 335.62 3.3 –22.4 A 5 32–50 0.9 101.627-2, 68 336.18 6.8 –17.9 A 5 28–40 0.9 99.227-2, 115 336.65 7.2 –17.2 A 5 30–45 1.3 98.827-2, 138 336.88 6.4 –18.6 A 5 32–50 0.6 99.627-3, 34 337.34 4.0 –19.9 A 5 32–50 1.4 100.327-3, 43 337.43 2.8 –26.2 A 6 30–50 0.9 103.827-3, 72 337.72 3.9 –16.4 A 6 28–45 0.7 98.427-3, 103 338.03 4.2 –26.6 A 7 30–70 1.9 104.1 1 101.7 3.3 12
W.W. SAGERDATA REPORT: PALEOMAGNETISM OF BASALTIC ROCKS 20
Table T2. Colatitude results for Pacific basalt core data.
Notes: Lithologic units = flows, sills, etc. N = normal, R = reversed.
Site
Mean colatitude
(°)
95% confidence
(°)
Lithologic units(N)
Magnetic units(N) Polarity
169 (sill) 115.2 17.8 2 2 N169 (flows) 117.9 16.6 2 2 N170 103.5 19.8 1 1 N171 101.9 22.0 1 1 N581 82.9 9.8 13 5 N/R597 119.5 9.9 8 7 R800 105.1 17.0 2 2 N/R803 116.8 16.4 3 2 N865 104.9 13.2 4 3 N
W.W. SAGERDATA REPORT: PALEOMAGNETISM OF BASALTIC ROCKS 21
Table T3. Paleomagnetic data for igneous samples, Site 581. (See table notes. Continued on next page.)
Core, section, interval (cm)
Depth (mbsf)
NRM(A/m)
Inc(°) Demag N Steps
MAD(°)
Colatitude (°)
Group number
Mean colat Std N colat
581-19-1, 72 343.72 1.2 –0.5 T 7 350–500 7.0 90.219-1, 108 344.08 2.5 2.9 T 4 375–450 3.7 88.619-1, 116 344.16 1.0 6.9 T 6 375–500 3.4 86.519-2, 123 345.73 2.0 3.7 A 4 15–30 1.0 88.119-3, 90 346.90 3.9 2.6 A 4 10–35 1.5 88.719-3, 127 347.27 2.4 –17.2 T 4 200–375 10.8 98.8*19-4, 19 347.69 4.1 Unstable T19-4, 36 347.86 3.6 0.6 A 4 10–25 1.2 89.7 1 88.6 1.3 6
581A-3-1, 38 355.88 2.8 23.0 T 5 400–500 4.3 78.03-1, 86 356.36 3.5 17.2 T 5 300–475 8.1 81.23-1, 126 356.76 2.7 21.9 T 6 350–500 5.2 78.63-2, 11 357.11 6.8 14.2 T 6 325–450 6.2 82.83-2, 81 357.81 7.9 50.1 T 6 350–475 8.9 59.1*3-2, 111 358.11 13.9 20.6 A 7 20–50 2.1 79.43-3, 8 358.58 5.5 10.3 T 6 375–500 5.7 84.83-3, 92 359.42 2.7 15.7 T 3 350–400 5.8 82.03-3, 147 359.97 5.1 26.1 T 5 250–375 5.4 76.23-4, 14 360.14 6.4 27.6 T 6 375–500 2.2 75.4 1 79.8 3.1 9
581B- (negative inclinations assumed reversed polarity)1-1, 19 347.69 1.0 –30.0 T 5 375–500 5.7 73.91-1, 93 348.43 0.8 –32.2 T 6 375–500 5.8 72.52-1, 35 347.85 2.3 –36.2 T 5 375–500 6.5 69.92-1, 55 349.55 0.8 –30.2 T 4 425–500 6.8 73.82-1, 121 350.21 1.3 –39.3 T 4 400–475 7.2 67.72-2, 28 350.78 1.7 –32.5 T 5 375–475 8.7 72.32-2, 76 351.26 1.5 –20.8 T 4 375–450 4.2 79.2 1 107.2 3.6 72-3, 7 352.07 1.1 –3.6 T 4 375–450 5.7 88.2* 2 91.8 12-3, 127 353.27 4.0 –18.3 T 6 375–500 3.2 80.62-3, 142 353.42 8.8 –26.1 T 4 425–500 6.6 76.22-4, 18 353.68 2.5 –31.9 T 5 400–500 6.0 72.7 3 103.5 4.0 32-4, 52 354.02 3.1 –27.0 T 4 375–450 5.7 75.72-4, 60 354.10 3.7 –12.6 T 6 375–500 6.3 83.62-4, 91 354.41 4.3 –7.3 T 6 375–500 2.2 86.32-4, 107 354.57 2.1 –5.5 A 4 30–45 8.0 87.22-4, 140 354.90 3.3 –19.0 T 5 375–475 5.9 80.2 4 97.4 4.7 52-5, 91 355.91 4.7 –48.8 T 4 425–500 5.6 60.3* 5 119.7 12-5, 123 356.23 4.4 Unstable T2-5, 133 356.33 6.6 Unstable T3-2, 33 360.63 2.1 –30.8 T 4 425–500 11.4 73.43-2, 105 361.35 3.9 –4.5 T 5 325–500 8.9 87.73-2, 137 361.67 2.8 24.5† A 5 15–35 1.8 77.23-3, 12 361.92 3.4 –19.5 A 4 35–50 14.4 80.0 6 100.4 6.1 44-1, 76 367.06 1.4 –1.9 A 5 25–45 5.3 89.14-1, 130 367.60 2.8 0.4 A 6 20–45 2.6 89.84-2, 71 368.51 6.0 5.6 A 4 20–40 2.0 87.2 7 89.3 1.9 34-2, 139 369.19 2.0 Unstable T4-3, 14 369.44 2.7 –22.9 T 5 400–500 4.7 78.1* 8 101.9 1
581C-1-1, 68 358.28 5.1 16.7 T 5 200–350 2.5 81.51-1, 120 358.80 5.6 14.7 T 4 425–500 4.3 82.52-1, 7 359.67 5.5 –19.8† T 4 425–500 5.1 79.82-1, 71 360.31 3.9 24.1 T 5 350–450 3.9 77.42-1, 98 360.58 5.1 32.8 T 5 375–475 6.2 72.12-1, 117 360.77 5.3 31.2 T 6 375–500 3.4 73.2 1 77.7 4.3 62-2, 85 361.95 3.9 22.2 T 8 325–500 2.9 78.52-2, 104 362.14 2.7 –2.2† T 5 375–475 5.6 88.92-2, 124 362.34 4.3 14.8 T 4 325–400 1.5 82.52-2, 132 362.42 7.0 –17.7† T 4 350–425 5.8 80.92-3, 48 363.08 5.0 18.2 T 6 350–475 1.7 80.72-3, 68 363.28 4.0 8.0 T 6 325–450 3.1 86.02-3, 109 363.69 5.2 15.2 T 5 375–475 1.2 82.3 2 82.8 4.3 72-4, 79 364.89 3.2 24.1 T 6 300–425 9.7 77.42-4, 100 365.10 6.0 26.1 T 4 250–325 8.2 76.22-4, 121 365.31 3.7 Unstable T2-5, 28 365.88 4.3 Unstable T2-5, 62 366.22 3.4 –20.9† T 4 400–475 6.9 79.2
W.W. SAGERDATA REPORT: PALEOMAGNETISM OF BASALTIC ROCKS 22
Table T3 (continued).
Notes: NRM = natural remanent magnetization. Inc = inclination of characteristic remanent magnetization determined by principal com-ponent analysis. Demag = demagnetization. A = alternating field, T = thermal. N = number of measurements used for principal com-ponent analysis. Steps = demagnetization steps used for principal component analysis. MAD = maximum angle of deviation(Kirshvink, 1980). Mean colat = group mean colatitude. Std = standard deviation of group mean colatitude. N colat = number ofcolatitudes used to calculate group mean. * = datum not used in average colatitude calculations. Group averages are shown at thefar right; underscores show the division of groups. † = sample showing anomalous inclinations (see text).
2-5, 125 366.85 3.4 28.9 T 4 300–375 7.7 74.63-1, 42 369.22 3.4 26.1 T 5 325–425 2.6 76.23-1, 141 370.21 1.9 18.5 T 6 350–475 4.9 80.53-2, 54 370.84 3.5 23.8 T 6 300–425 4.0 77.63-2, 81 371.11 1.9 12.4 T 6 300–425 3.3 83.73-3, 14 371.94 3.5 22.9 T 8 300–475 2.7 78.13-3, 74 372.54 1.7 20.4 T 6 275–400 5.0 79.53-3, 110 372.90 2.0 23.1 T 6 325–500 6.7 78.03-4, 66 373.96 4.9 25.4 T 5 400–500 3.9 76.63-4, 99 374.29 3.6 13.4 T 5 375–500 2.4 83.23-4, 107 374.37 7.2 39.3 T 6 350–475 4.0 67.7*3-4, 116 374.46 9.3 25.1 T 5 375–500 1.7 76.83-4, 141 374.71 4.3 49.3 T 6 350–475 1.9 59.8*3-5, 27 375.07 3.8 14.8 T 4 375–475 2.1 82.53-5, 60 375.40 8.1 6.9 T 6 375–500 6.3 86.53-5, 80 375.60 2.6 21.3 T 4 325–400 4.9 79.03-5, 127 376.07 4.2 51.2 T 5 300–400 2.1 58.1*3-5, 132 376.12 2.5 45.6 T 4 325–400 3.5 63.0*3-5, 137 376.17 3.2 15.8 T 5 325–425 4.1 81.93-5, 141 376.21 3.3 6.2 T 4 300–375 1.1 86.9 3 80.0 3.6 19
Core, section, interval (cm)
Depth (mbsf)
NRM(A/m)
Inc(°) Demag N Steps
MAD(°)
Colatitude (°)
Group number
Mean colat Std N colat
W.W. SAGERDATA REPORT: PALEOMAGNETISM OF BASALTIC ROCKS 23
Table T4. Paleomagnetic data for igneous samples, Site 597. (See table notes. Continued on next twopages.)
Core, section, interval (cm)
Depth (mbsf)
NRM(A/m)
Inc(°) Demag N Steps
MAD(°)
Colatitude(°)
Group number
Meancolat Std N colat
597B-2-1, 20 54.49 2.8 53.3 A 56.12-1, 28‡ 54.57 1.4 35.0 A 4 20–30 7.4 70.72-1, 80‡ 55.17 1.1 49.2 A 4 15–28 1.9 59.92-1, 91‡ 55.88 0.5 40.1 A 4 20–30 12.3 67.22-1, 95 55.24 2.7 53.6 A 55.92-2, 7‡ 55.96 3.5 53.0 A 4 10–25 0.8 56.42-2, 48 56.37 2.0 41.0 A 66.52-2, 68‡ 56.57 1.7 37.6 A 5 10–28 1.5 68.92-2, 100‡ 56.89 0.6 40.5 A 4 10–25 3.0 66.92-2, 110 57.02 3.3 44.1 A 64.12-2, 131 57.23 2.5 46.1 A 62.52-3, 29 57.71 2.5 46.9 A 61.92-3, 74‡ 58.16 1.1 47.3 A 3 10–25 2.8 61.52-3, 86‡ 58.28 1.4 47.1 A 4 10–25 3.8 61.72-3, 106‡ 58.48 0.9 38.5 A 4 5–20 7.5 68.32-3, 113 58.56 4.4 57.4 A 52.03-1, 3 63.55 2.3 44.7 A 63.73-1, 29‡ 63.81 1.7 41.0 A 4 10–25 2.8 66.53-1, 51‡ 64.03 0.9 38.9 A 4 10–25 2.9 68.03-1, 97‡ 64.49 1.8 39.1 A 4 10–25 2.1 67.93-1, 119‡ 64.71 0.7 38.3 A 4 10–25 4.3 68.53-1, 132 64.84 2.7 40.5 A 66.93-2, 14‡ 65.16 0.8 51.9 A 4 10–25 1.5 57.53-2, 23 65.25 2.2 35.3 A 70.53-2, 26 65.42 2.5 36.7 A 69.6
597C-3-1, 18‡ 55.67 3.0 37.4 A 4 10–25 0.7 69.13-1, 24 55.73 2.8 45.7 A 62.93-1, 48‡ 55.97 0.6 32.3 A 4 10–25 5.6 72.53-1, 78‡ 56.27 0.6 Unstable A3-1, 104‡ 56.53 0.8 47.7 A 3 10–20 4.2 61.23-1, 134 56.83 3.1 50.1 A 59.13-2, 13‡ 57.12 0.9 Unstable A3-2, 43 57.42 2.4 36.5 A 69.73-2, 81‡ 57.80 1.1 45.4 A 4 10–25 2.8 63.13-2, 123‡ 58.22 1.6 33.6 A 4 10–25 2.5 71.63-2, 146‡ 58.45 2.6 A3-3, 5 58.57 2.7 60.1 A 49.0*3-3, 38‡ 58.90 2.5 32.4 A 4 10–25 0.43-3, 52 59.04 2.5 31.2 A 73.23-3, 71‡ 59.23 4.2 43.1 A 4 10–25 1.5 64.94-1, 55‡ 65.07 1.9 Unstable A4-1, 60 65.12 4.1 37.9 A 68.74-1, 70‡ 65.22 0.6 –58.4† A 4 15–28 2.4 50.94-1, 120 65.72 3.3 41.3 A 66.34-2, 21 66.72 3.1 48.2 A 60.8 1 62.8 5.5 394-2, 55‡ 67.06 1.1 61.7 A 3 10–20 4.3 47.14-2, 87‡ 67.38 2.3 –63.3† A 3 28–35 3.4 45.24-2, 109‡ 67.60 1.8 Unstable A4-2, 111 67.13 2.9 55.8 A 53.74-3, 27 67.79 3.3 60.4 A 48.64-3, 49‡ 68.01 3.7 Unstable A4-3, 91 68.43 2.7 61.0 A 47.9 2 48.5 3.2 54-3, 139‡ 68.91 2.2 Unstable A4-4, 23 69.25 2.7 44.9 A 63.54-4, 62‡ 69.64 5.1 53.5 A 3 10–20 2.9 56.04-4, 76 69.78 3.3 48.5 A 60.54-4, 127‡ 70.29 2.0 Unstable A4-5, 23‡ 70.75 2.6 Unstable A4-5, 26 70.78 2.3 45.3 A 63.24-5, 71 71.22 2.3 45.6 A 63.04-5, 89‡ 71.41 1.0 Unstable A4-5, 118‡ 71.70 2.2 Unstable A4-6, 21 72.22 2.3 65.7 A 42.1*4-6, 42‡ 72.43 1.3 Unstable A4-6, 73 72.75 2.0 43.0 A 65.0

W.W. SAGERDATA REPORT: PALEOMAGNETISM OF BASALTIC ROCKS 24
Table T4 (continued).
4-6, 100‡ 73.01 2.2 53.0 A 4 10–25 1.5 56.45-1, 9‡ 73.61 1.2 Unstable A5-1, 62‡ 74.14 7.3 52.2 A 3 10–20 2.2 57.25-1, 129 74.81 2.6 41.0 A 66.55-1, 134‡ 74.86 1.2 41.2 A 3 10–20 3.0 66.45-2, 63 75.64 4.0 46.1 A 62.5 3 61.8 3.8 116-1, 28‡ 82.80 2.3 Unstable A6-1, 109 83.61 3.6 50.6 A 58.76-1, 119‡ 83.71 4.6 56.4 A 3 10–20 0.4 53.06-2, 12‡ 84.14 1.5 –34.6† A 3 10–20 1.8 71.0*6-2, 35‡ 84.37 1.3 47.4 A 4 10–25 4.5 61.56-2, 49 84.51 2.3 46.5 A 62.26-3, 62 86.14 2.9 49.3 A 59.86-3, 55‡ 86.07 2.1 Unstable A6-3, 78‡ 86.30 1.0 Unstable A6-3, 105 86.57 0.7 49.2 A 4 25–35 2.16-4, 19‡ 87.21 2.4 54.6 A 4 10–25 3.6 54.9 4 58.3 3.7 76-4, 53‡ 87.55 1.7 Unstable A6-4, 74 87.76 3.0 37.8 A 68.86-4, 116‡ 88.18 2.1 Unstable A6-5, 38‡ 88.90 0.6 27.5 A 3 10–20 3.5 75.46-5, 58 89.10 3.3 37.9 A 68.76-5, 82‡ 89.34 2.3 Unstable A7-1, 70‡ 92.22 1.8 31.0 A 4 15–28 2.2 73.3 5 71.6 3.3 47-1, 128‡ 92.80 5.8 48.1 A 4 10–25 1.6 60.97-1, 115 92.67 3.1 50.2 A 59.07-2, 7‡ 93.08 2.8 Unstable A7-2, 16 93.17 3.3 45.6 A 63.07-2, 66‡ 93.67 6.7 49.8 A 4 15–20 2.4 59.47-2, 117 94.18 3.7 50.6 A 58.77-2, 123‡ 94.24 3.9 47.4 A 4 10–25 0.5 61.57-3, 10‡ 94.61 4.3 55.2 A 4 10–25 0.7 54.37-4, 17‡ 96.19 5.2 58.9 A 4 10–25 2.5 50.37-4, 18 96.20 3.0 54.0 A 55.57-4, 87 96.89 4.4 50.2 A 59.07-4, 91‡ 96.93 6.7 –49.9† A 4 28–35 2.2 59.37-4, 111 97.13 2.8 56.0 A 53.57-4, 137 97.39 1.9 –41.1† A 66.47-4, 141‡ 97.43 2.3 –65.6† A 4 5–20 1.2 42.2*7-5, 70 98.22 2.2 –76.7† A 25.3* 6 58.5 4.3 138-1, 9 100.60 3.2 41.9 A 65.88-1, 25‡ 100.76 1.8 39.6 A 4 10–25 2.0 67.58-1, 94 101.46 3.2 41.0 A 66.58-1, 103‡ 101.54 3.7 40.4 A 4 15–28 1.2 66.98-2, 41‡ 102.42 3.5 41.0 A 4 10–25 1.9 66.58-2, 50 102.51 2.8 39.1 A 67.98-2, 66‡ 102.67 2.2 41.3 A 3 10–20 2.3 66.38-2, 137‡ 103.38 2.7 46.1 A 4 15–28 1.5 62.58-3, 5 103.57 2.5 36.5 A 69.78-3, 44‡ 103.96 1.5 Unstable A8-3, 130 104.82 2.5 22.1 A 78.5*8-3, 138‡ 104.90 2.4 30.8 A 5 10–28 2.6 73.48-4, 70‡ 105.72 1.8 31.7 A 4 10–25 4.9 72.88-4, 102 106.04 2.6 40.2 A 67.18-4, 103‡ 106.05 2.9 43.5 A 4 15–28 1.7 64.68-4, 137‡ 106.39 1.0 33.1 A 3 20–28 2.3 71.98-5, 49 107.01 3.9 34.8 A 4 10–25 0.3 70.88-5, 60 107.12 2.7 37.0 A 69.48-5, 88‡ 107.40 2.5 Unstable A8-6, 30‡ 108.32 1.3 32.1 A 4 10–25 2.7 72.68-6, 56 108.58 3.3 40.9 A 66.68-6, 92‡ 108.94 1.2 –22.7† A 3 20–28 0.7 78.2*8-6, 135‡ 109.37 2.7 37.2 A 4 10–25 3.7 69.28-7, 7‡ 109.57 1.4 41.6 A 3 15–25 1.9 66.18-7, 9 109.59 2.9 44.0 A 64.28-7, 86‡ 110.36 2.0 28.9 A 4 10–25 6.3 74.69-1, 9 109.59 3.8 36.5 A 69.79-1, 76‡ 110.27 0.8 Unstable A9-1, 139 110.90 2.2 34.5 A 4 15–28 1.7
Core, section, interval (cm)
Depth (mbsf)
NRM(A/m)
Inc(°) Demag N Steps
MAD(°)
Colatitude(°)
Group number
Meancolat Std N colat
W.W. SAGERDATA REPORT: PALEOMAGNETISM OF BASALTIC ROCKS 25
Table T4 (continued).
Notes: NRM = natural remanent magnetization. Inc = inclination of characteristic remanent magnetization determined by principal com-ponent analysis. Demag = demagnetization. A = alternating field. N = number of measurements used for principal component analy-sis. Steps = demagnetization steps used for principal component analysis. MAD = maximum angle of deviation (Kirshvink, 1980).Mean colat = group mean colatitude. Std = standard deviation of group mean colatitude. N colat = number of colatitudes used tocalculate group mean. * = datum not used in average colatitude calculations. Group averages are shown at the far right; underscoresshow the division of groups. † = Sample assumed to be inverted. ‡ = Sample measured in this study.
9-1, 141‡ 110.92 1.4 Unstable A9-1, 142 110.93 3.2 38.9 A 68.09-2, 15‡ 111.17 2.8 60.8 A 4 20–35 1.4 48.2*9-2, 60‡ 111.62 3.3 –46.6† A 5 30–45 0.4 62.19-2, 70 111.72 3.4 41.6 A 66.19-3, 82‡ 113.33 1.1 –60.6† A 7 28–45 5.7 48.4*9-3, 88 113.39 2.9 47.3 A 61.59-3, 140‡ 113.91 0.9 –51.3† A 4 20–30 5.1 58.09-4, 64‡ 114.66 0.6 Unstable A9-4, 103 115.05 3.1 41.9 A 65.89-4, 104‡ 115.06 4.6 33.9 A 4 20–30 6.2 71.4 7 67.5 3.8 3010-1, 74‡ 119.26 6.5 43.4 A 4 15–25 2.0 64.710-1, 112 119.64 2.9 40.1 A 67.210-1, 128‡ 119.80 2.9 37.5 A 4 10–25 2.2 69.010-2, 39‡ 120.41 2.5 44.5 A 4 10–25 0.6 63.810-2, 86‡ 120.88 1.9 52.9 A 4 10–25 3.3 56.510-2, 104 121.06 1.9 43.6 A 64.510-3, 33‡ 121.85 0.9 Unstable A10-3, 72‡ 122.24 2.1 42.7 A 4 20–35 1.1 65.210-3, 94 122.46 2.0 43.9 A 64.310-3, 115‡ 122.67 2.2 31.8 A 4 10–25 4.3 72.810-4, 46‡ 123.48 1.0 39.6 A 4 10–25 2.9 67.510-4, 91 123.93 1.5 52.6 A 56.810-4, 133‡ 124.35 1.1 32.8 A 3 10–20 4.6 72.110-5, 52‡ 125.02 1.0 Unstable A10-5, 84 125.36 1.6 46.4 A 62.310-5, 112‡ 125.62 2.1 –49.5† A 4 15–28 0.2 59.710-6, 19‡ 126.21 0.5 46.1 A 4 20–30 2.6 62.510-6, 36 126.38 1.7 40.5 A 66.910-6, 103‡ 127.05 0.9 44.8 A 4 20–30 1.6 63.610-7, 30‡ 127.31 1.4 45.5 A 4 15–28 1.7 63.010-7, 42 127.93 1.6 42.2 A 65.610-7, 84 127.85 1.2 21.0 A 4 15–28 1.0 79.1*11-1, 32‡ 127.84 0.7 63.8 A 4 20–30 0.6 44.5*11-1, 79 128.31 1.6 47.1 A 61.711-1, 116‡ 128.68 0.4 44.7 A 4 15–28 1.2 63.711-2, 46‡ 129.48 0.7 Unstable A11-2, 103 130.05 1.6 43.8 A 64.411-2, 138‡ 130.40 0.7 48.1 A 4 25–40 0.4 60.911-3, 13 130.64 1.7 45.6 A 63.011-3, 47‡ 130.98 1.8 41.6 A 4 10–25 0.9 66.111-3, 93‡ 131.44 1.2 40.4 A 4 15–28 0.9 66.911-4, 25‡ 132.26 0.9 23.2 A 4 10–25 3.3 77.9*11-4, 39‡ 132.40 1.4 –45.2† A 4 25–32 1.2 63.311-4, 50‡ 132.51 1.6 47.0 A 4 10–25 1.1 61.811-4, 62 132.63 1.7 42.9 A 65.111-4, 66‡ 132.67 1.6 32.2 A 4 10–25 0.5 72.5 8 64.6 3.9 30
Core, section, interval (cm)
Depth (mbsf)
NRM(A/m)
Inc(°) Demag N Steps
MAD(°)
Colatitude(°)
Group number
Meancolat Std N colat
W.W. SAGERDATA REPORT: PALEOMAGNETISM OF BASALTIC ROCKS 26
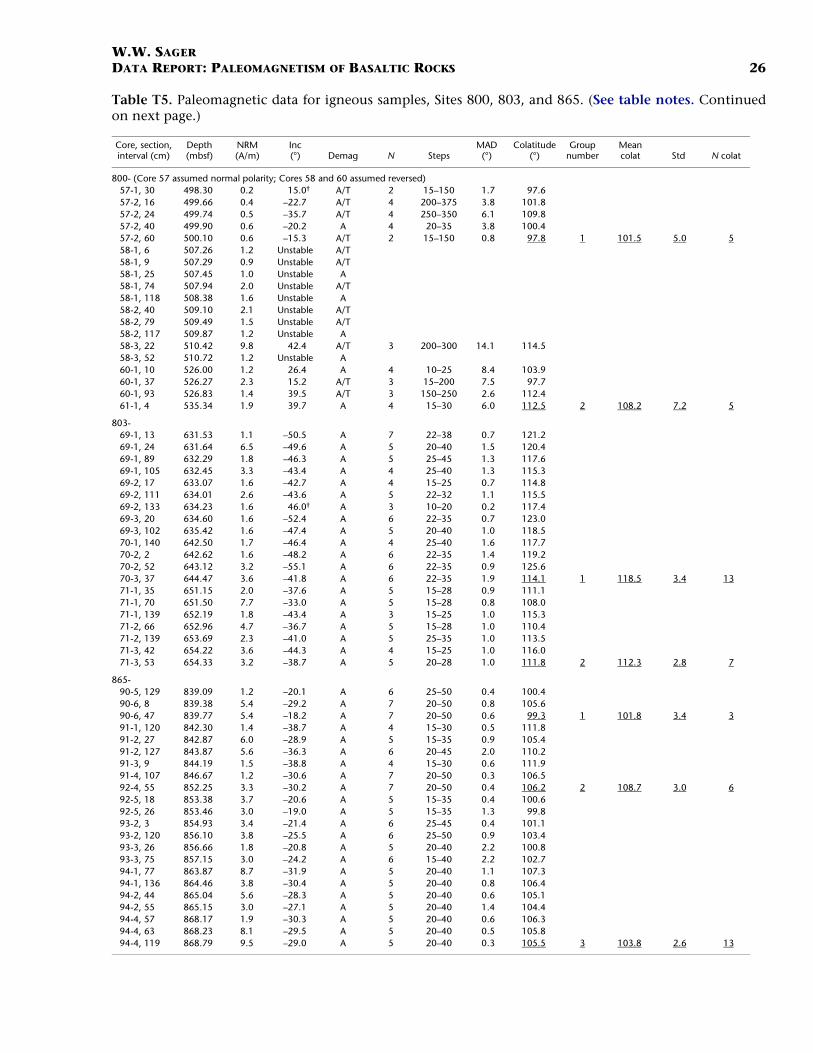
Table T5. Paleomagnetic data for igneous samples, Sites 800, 803, and 865. (See table notes. Continuedon next page.)
Core, section, interval (cm)
Depth (mbsf)
NRM(A/m)
Inc(°) Demag N Steps
MAD(°)
Colatitude (°)
Group number
Meancolat Std N colat
800- (Core 57 assumed normal polarity; Cores 58 and 60 assumed reversed)57-1, 30 498.30 0.2 15.0† A/T 2 15–150 1.7 97.657-2, 16 499.66 0.4 –22.7 A/T 4 200–375 3.8 101.857-2, 24 499.74 0.5 –35.7 A/T 4 250–350 6.1 109.857-2, 40 499.90 0.6 –20.2 A 4 20–35 3.8 100.457-2, 60 500.10 0.6 –15.3 A/T 2 15–150 0.8 97.8 1 101.5 5.0 558-1, 6 507.26 1.2 Unstable A/T58-1, 9 507.29 0.9 Unstable A/T58-1, 25 507.45 1.0 Unstable A58-1, 74 507.94 2.0 Unstable A/T58-1, 118 508.38 1.6 Unstable A58-2, 40 509.10 2.1 Unstable A/T58-2, 79 509.49 1.5 Unstable A/T58-2, 117 509.87 1.2 Unstable A58-3, 22 510.42 9.8 42.4 A/T 3 200–300 14.1 114.558-3, 52 510.72 1.2 Unstable A60-1, 10 526.00 1.2 26.4 A 4 10–25 8.4 103.960-1, 37 526.27 2.3 15.2 A/T 3 15–200 7.5 97.760-1, 93 526.83 1.4 39.5 A/T 3 150–250 2.6 112.461-1, 4 535.34 1.9 39.7 A 4 15–30 6.0 112.5 2 108.2 7.2 5
803- 69-1, 13 631.53 1.1 –50.5 A 7 22–38 0.7 121.269-1, 24 631.64 6.5 –49.6 A 5 20–40 1.5 120.469-1, 89 632.29 1.8 –46.3 A 5 25–45 1.3 117.669-1, 105 632.45 3.3 –43.4 A 4 25–40 1.3 115.369-2, 17 633.07 1.6 –42.7 A 4 15–25 0.7 114.869-2, 111 634.01 2.6 –43.6 A 5 22–32 1.1 115.569-2, 133 634.23 1.6 46.0† A 3 10–20 0.2 117.469-3, 20 634.60 1.6 –52.4 A 6 22–35 0.7 123.069-3, 102 635.42 1.6 –47.4 A 5 20–40 1.0 118.570-1, 140 642.50 1.7 –46.4 A 4 25–40 1.6 117.770-2, 2 642.62 1.6 –48.2 A 6 22–35 1.4 119.270-2, 52 643.12 3.2 –55.1 A 6 22–35 0.9 125.670-3, 37 644.47 3.6 –41.8 A 6 22–35 1.9 114.1 1 118.5 3.4 1371-1, 35 651.15 2.0 –37.6 A 5 15–28 0.9 111.171-1, 70 651.50 7.7 –33.0 A 5 15–28 0.8 108.071-1, 139 652.19 1.8 –43.4 A 3 15–25 1.0 115.371-2, 66 652.96 4.7 –36.7 A 5 15–28 1.0 110.471-2, 139 653.69 2.3 –41.0 A 5 25–35 1.0 113.571-3, 42 654.22 3.6 –44.3 A 4 15–25 1.0 116.071-3, 53 654.33 3.2 –38.7 A 5 20–28 1.0 111.8 2 112.3 2.8 7
865- 90-5, 129 839.09 1.2 –20.1 A 6 25–50 0.4 100.490-6, 8 839.38 5.4 –29.2 A 7 20–50 0.8 105.690-6, 47 839.77 5.4 –18.2 A 7 20–50 0.6 99.3 1 101.8 3.4 391-1, 120 842.30 1.4 –38.7 A 4 15–30 0.5 111.891-2, 27 842.87 6.0 –28.9 A 5 15–35 0.9 105.491-2, 127 843.87 5.6 –36.3 A 6 20–45 2.0 110.291-3, 9 844.19 1.5 –38.8 A 4 15–30 0.6 111.991-4, 107 846.67 1.2 –30.6 A 7 20–50 0.3 106.592-4, 55 852.25 3.3 –30.2 A 7 20–50 0.4 106.2 2 108.7 3.0 692-5, 18 853.38 3.7 –20.6 A 5 15–35 0.4 100.692-5, 26 853.46 3.0 –19.0 A 5 15–35 1.3 99.893-2, 3 854.93 3.4 –21.4 A 6 25–45 0.4 101.193-2, 120 856.10 3.8 –25.5 A 6 25–50 0.9 103.493-3, 26 856.66 1.8 –20.8 A 5 20–40 2.2 100.893-3, 75 857.15 3.0 –24.2 A 6 15–40 2.2 102.794-1, 77 863.87 8.7 –31.9 A 5 20–40 1.1 107.394-1, 136 864.46 3.8 –30.4 A 5 20–40 0.8 106.494-2, 44 865.04 5.6 –28.3 A 5 20–40 0.6 105.194-2, 55 865.15 3.0 –27.1 A 5 20–40 1.4 104.494-4, 57 868.17 1.9 –30.3 A 5 20–40 0.6 106.394-4, 63 868.23 8.1 –29.5 A 5 20–40 0.5 105.894-4, 119 868.79 9.5 –29.0 A 5 20–40 0.3 105.5 3 103.8 2.6 13

W.W. SAGERDATA REPORT: PALEOMAGNETISM OF BASALTIC ROCKS 27
Notes: NRM = natural remanent magnetization. Inc = inclination of characteristic remanent magnetization determined by principal compo-nent analysis. Demag = demagnetization. A = alternating field, T = thermal. N = number of measurements used for principal componentanalysis. Steps = demagnetization steps used for principal component analysis. MAD = maximum angle of deviation (Kirshvink, 1980).Mean colat = group mean colatitude. Std = standard deviation of group mean colatitude. N colat = number of colatitudes used to calcu-late group mean. Group averages are shown at the far right; underscores show the division of groups. † = sample assumed to beinverted.