8 10 09 draft
TRANSCRIPT

Daytime surface and air temperature of NYC streets adjacent to DOH monitors

Research Questions
How do street level temperatures compare to city monitoring sites? How hot is it on city sidewalks? Can we ID street/neighborhood features that

Project Development
Planning & resourcing: Summer 2008 – May 2009
Preliminary fieldwork: June 16–30, 2009
Consultations with GISS & NYCDOH-MH
Team organization
Development of wiki & monitoring protocols
Beta site fieldwork & refinement of protocols
Weekly team meeting

Project Development Wiki Development http://planetnyc.wikischolars.columbia.edu/

Project Development Site Criteria
June 15 – August 15
Manhattan & the Bronx
Trees
> ¼ mile from coastline
Near subwayQuickTime™ and a
TIFF (Uncompressed) decompressorare needed to see this picture.

Advance Team
Field Team
Admin & Tech Support
Data CollectionOrganization

Data CollectionEquipment kits
Advance Team
field notebooks site map colored tape measuring tape sharpie
Field Team 1
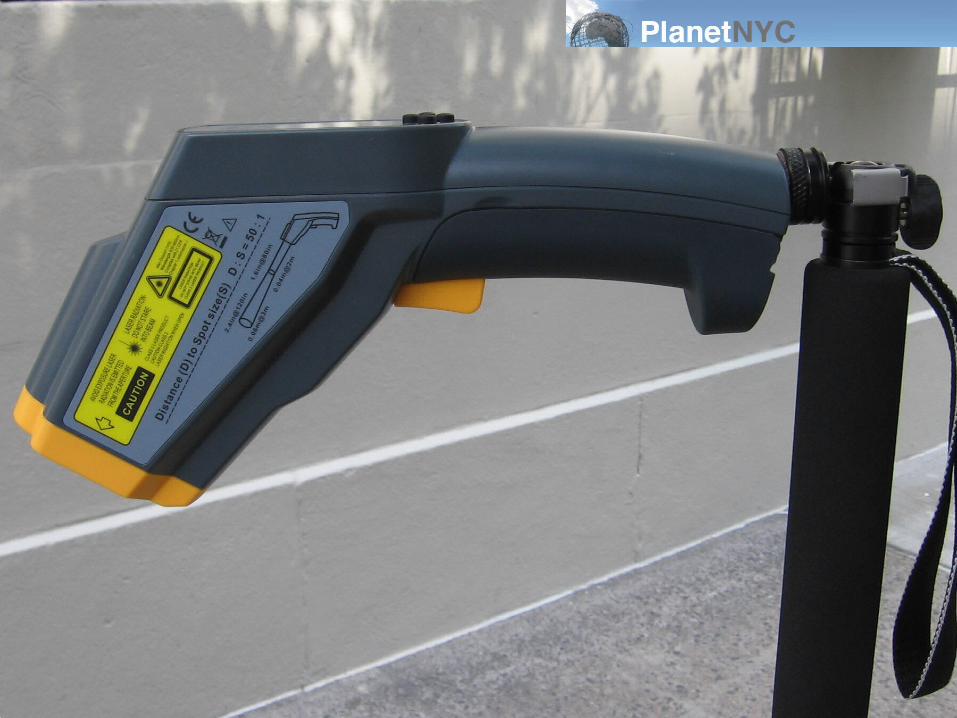
Pro-IR Thermosensor with type K air temp probe
tripod Umbrella site map field notebooks
Field Team 2
IR Thermosensor Thermocouple
meter with type K Air temp probe, Tripod, Umbrella, Site map, Field notebooks

Brooklyn Tech’s ConEd lab
equipment ID & purchase
equipment training, calibration, use
Data CollectionEquipment


Sampling zone
Sampling locations
Time of day
Number of events
Use of equipment
Roles of team members
Data
QA/QC
Data CollectionProtocol


QuickTime™ and aTIFF (Uncompressed) decompressor
are needed to see this picture.

QuickTime™ and aTIFF (Uncompressed) decompressor
are needed to see this picture.


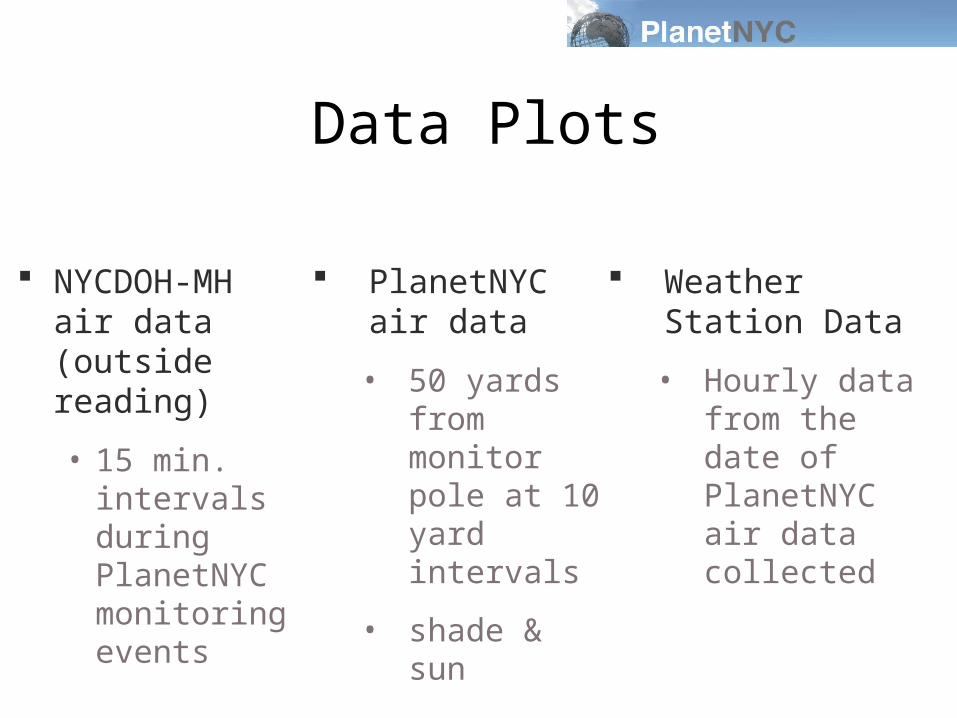
Data Plots
NYCDOH-MH air data (outside reading)
• 15 min. intervals during PlanetNYC monitoring events
PlanetNYC air data
• 50 yards from monitor pole at 10 yard intervals
• shade & sun
Weather Station Data
• Hourly data from the date of PlanetNYC air data collected

Sample Sites
1) Site #11892: West 174th Street
2) Site # 10225: East 59th St, Park Ave

Site #11892: West 174th StreetMaps
QuickTime™ and aTIFF (Uncompressed) decompressor
are needed to see this picture.QuickTime™ and aTIFF (Uncompressed) decompressor
are needed to see this picture.

QuickTime™ and aTIFF (Uncompressed) decompressor
are needed to see this picture.
QuickTime™ and aTIFF (Uncompressed) decompressor
are needed to see this picture.
QuickTime™ and aTIFF (Uncompressed) decompressor
are needed to see this picture.

Site #11892: West 174th StreetData & Plots
LOCATION ST Pass 1 ST Pass 2 ST Pass 3 DoH data
23-Jul 27-Jul 27-Jul Pass 1 Pass 2 Pass 3
0 0 80.8 91 101 23-Jul 27-Jul
0 1 79.9 104.25 106 75.117 87.528 87.528
10 2 80.8 106.5 113.5 75.117 87.528 87.528
10 1 82.5 109.75 111 75.117 87.528 87.528
10 4 81.1 111.25 115.5 75.117 87.528 87.528
10 5 76.1 96.5 99.5 75.117 87.528 87.528
20 1 78.1 99 96.5 75.117 87.528 87.528
20 4 81.6 113 117 75.117 87.528 87.528
20 5 78.6 98 101 75.117 87.528 87.528
20 6 78.6 95.5 97 75.29 87.528 87.528
30 1 81.1 108 107.5 75.117 87.528 87.528
30 4 80.6 112 117 75.117 87.528 87.528
30 5 78.9 99 102.5 75.117 87.528 87.528
30 6 78.8 92.75 94 75.117 87.528 87.528
40 1 74.8 88.75 87 75.117 87.528 87.528
40 4 75.2 87.75 98.5 75.117 87.528 87.528
40 5 79.9 102.5 107 75.117 87.528 87.528
40 6 76.1 103.25 100.5 75.29 87.528 87.528
50 1 78 94.25 86.5 75.117 87.528 87.528
50 4 77.3 108.5 110 75.117 87.528 87.528
50 5 80.4 111 116.6 75.117 87.528 87.528
50 6 77.6 92.4 94 75.29 87.528 87.528
Data excerpt Sanborn Map

These scatter plots depict the dispersion of air and surface temperatures recorded by PlanetNYC about the reading recorded by the DoH monitor. Points are spaced at 10 yard intervals from the monitoring sites.
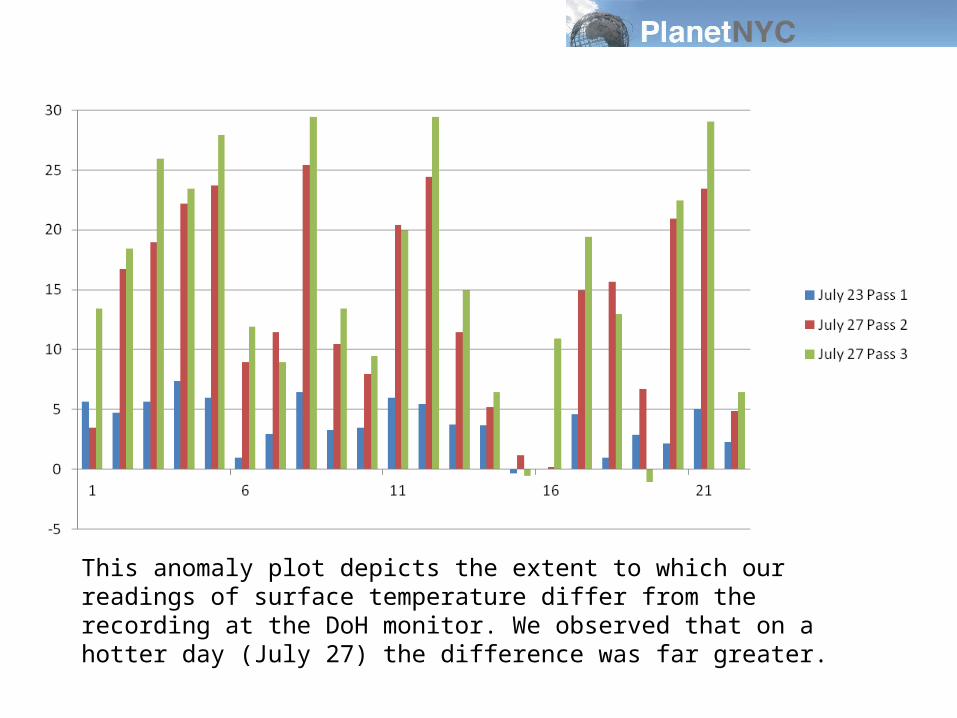
This anomaly plot depicts the extent to which our readings of surface temperature differ from the recording at the DoH monitor. We observed that on a hotter day (July 27) the difference was far greater.

Site # 10225: East 59th St, Park Ave Maps
QuickTime™ and aTIFF (Uncompressed) decompressor
are needed to see this picture.
QuickTime™ and aTIFF (Uncompressed) decompressor
are needed to see this picture.

QuickTime™ and aTIFF (Uncompressed) decompressor
are needed to see this picture.
QuickTime™ and aTIFF (Uncompressed) decompressor
are needed to see this picture.

Site Location ST 1 Doh distance marker
direction marker Pass 1 Pass 2 Pass 3 Pass 1 20-Jul 20-Jul 14-Jul
0 0 86.5 88.5 83.4 85.939 85.262 83.646
0 1 86 88 79 87 85.939 85.262 83.646
0 2 86 88 88.3 87 85.939 85.262 83.646
10 1 88.5 88.5 89.8 87 85.262 85.262 83.646
10 3 88 89.5 97.6 87 85.939 85.262 82.753
20 1 89 88.5 80.9 87 85.262 85.262 83.646
20 5 87 88.5 79.3 87 85.939 85.262 82.753
30 1 88.5 87.5 83.3 87 85.262 85.262 83.646
30 7 91.5 91.5 103.9 87 85.939 85.262 84.452
30 10 104 95.2 87 85.262 84.452
30 12 99 97.5 106.6 87 85.262 85.262 82.753
40 2 86.5 81.5 66.4 87 85.262 85.262 83.646
40 6 93 92.5 85.3 87 85.939 85.894 82.753
40 7 93 93 85.3 87 85.939 85.894 83.332
40 8 102 99.5 96.7 87 85.939 85.894 83.332
40 10 106 100.5 77.6 87 85.939 85.894 82.753
40 11 104.5 103.5 89.8 87 85.939 85.894 82.753
50 1 87.5 88 91.3 87 85.262 85.894 82.753
50 2 82 81.5 67.2 87 85.262 85.894 83.332
50 3 82.5 83 73.9 87 85.939 85.894 82.753
Sanborn Map Data Excerpt
Site # 10225: East 59th St, Park Ave Data & Plots

Observed weather conditions: Very CloudyWeather stn: 84F

This anomaly plot depicts the extent to which our readings of surface temperature differ from the recording at the DoH monitor.


Data AnalysisEcotect – Surface Studies
QuickTime™ and aTIFF (Uncompressed) decompressor
are needed to see this picture.

QuickTime™ and aTIFF (Uncompressed) decompressor
are needed to see this picture.
Data AnalysisEcotect – Shadow Studies

QuickTime™ and aTIFF (Uncompressed) decompressor
are needed to see this picture.
Data AnalysisEcotect – Shadow Studies

Next Step
Emissivity of different materials
Human exposure/pathways
Adaptation: cooling the city
Other species: vectors, fish & wildlife