8 1 ns# /n - g 8 n
TRANSCRIPT

JAPANESE
CANDLESTICKS
HISTORICAL OVERVIEW
Candlesticks have been around a lot longer than anything similar in the Western world.The Japanese were looking at charts as far back as the 17th century, whereas the earliestknown charts in the US appeared in the late 19th century.
Rice trading had been established in Japan in 1654, with gold and silver following soonafter. Rice markets dominated Japan at this time and the commodity became, it seems,more important than hard currency.
Munehisa Homma (aka Sokyu Honma), a Japanese rice trader born in the early 1700s, iswidely credited as being one of the early exponents of tracking price action. Heunderstood basic supply and demand dynamics, but also identified the fact that emotionplayed a part in the setting of price. He wanted to track the emotion of the market players,and this work became the basis of candlestick analysis.
The Japanese did an extremely good job of keeping candlesticks quiet from the Westernworld, right up until the 1980s, when suddenly there was a large cross-pollination of banksand financial institutions around the world. This is when Westerners suddenly got wind ofthese mystical charts. Obviously, this was also about the time that charting in generalsuddenly became a lot easier, due to the widespread use of the PC.
In the late 1980s several Western analysts became interested in candlesticks. In the UKMichael Feeny, began using candlesticks in his daily work, and started introducing theideas to London professionals.
In the December 1989 edition of Futures magazine Steve Nison, who was a technicalanalyst at Merrill Lynch in New York, produced a paper that showed a series ofcandlestick reversal patterns and explained their predictive powers. He went on to write abook on the subject.
Since then candlesticks have gained in popularity by the year, and these days they seemto be the standard template that most analysts work from.

Candlesticks are considered a visual representation of what is going on in the market.By looking at candlesticks, we get valuable information about the open, high, low andclose of price, which gives us an idea about price action and movement.
Candlesticks can be used alone or in conjunction with technical analysis tools such asmoving averages. They can be used with methods such as the Dow theory or the Eliotwave theory.
Human behavior in relation to money is always dominated by fear, greed and hope(amongst other emotions). Candlestick analysis helps us understand these changingpsychological factors by showing us how buyers and sellers interact with each other.
Candlesticks are used by most professional traders, banks and hedge funds – theseguys trade millions of dollars every day and can move the market whenever they want.Your money can be lost easily if you don’t understand the game. Using candlestickpatterns will help you understand what the big boys are doing and will show you whento enter, when to exit and when to stay away from the market.
Japanese candlesticks can be used on any timeframe.They are used to describe the price action during the given timeframe.Japanese candlesticks are formed using the open, high, low and close of the chosetimeframe.If the close is above the open, we say that the candlestick is bullish – this means thatthe market is rising in this period.If the close is below the open, we say that the candlestick is bearish – this means thatthe market is falling in this period.
WHY CANDLESTICKS ARE IMPORTANT TO YOUR TRADING ANALYSIS?
WHAT IS A CANDLESTICK?
The filled part of the candlestick is called thereal body.The thin line poking above and below thebody are called shadows or wicks.The top of the upper wick is the high.The bottom of the lower wick is the low.

Long bodies refer to strong buying or selling pressure.
If there is a candlestick in which the close is above the open with a long body, thisindicates that prices increased considerably from open to close and buyers wereaggressive.
Conversely, if there is a bearish candlestick in which the open is above the close with along body, this indicates that prices fell a great deal from the open and sellers wereaggressive.
Short and small bodies indicate a little buying or selling activity.
(In forex lingo, Bulls mean buyers and Bears mean sellers)
Upper wicks signify the session high.Lower wicks signify the session low.
The upper and lower wicks give us important information about the trading session.
Candlesticks with long wicks show that the trading action occurred well past the open andclose.
Candlesticks have different body sizes.
CANDLESTICK ANATOMY
CANDLESTICK SHADOWS/WICKS

If a candlestick has a longer upper wick and short lower wick, it means that buyers bidprice higher. For some reason, sellers came in and drove price back down to end thesession back near its open price.If a candlestick has a long lower wick and short upper wick, it means that sellersforced price lower. For some reason, buyers came in and drove prices back up to endthe session back near its open price.
Candlestick patterns are one of the most powerful trading concepts – they’re easilyidentifiable and prove for very profitable setups. A research has confirmed that candlestickpatterns have a high predictive value and produce positive results.
This is NOT a ‘holy grail’ to a trading system! This system does work in conjunction withother technical analysis – BUT, remember not all trades will be won. That is part of thetrading game. There is NO 100% fool-proof winning system.
Candlestick patterns are the language of the market. If you know how to read candlestickpatterns the right way, you will be able to understand what these patterns tell you aboutmarket dynamics and the trader’s behavior. This skill will help you better enter and exit themarket at the right time – we look for a high probability setup.
Reading further on, take note to focus on the anatomy of the pattern and the psychologybehind its formation. This will help you acquire the skill of identifying any pattern you findin the market and understand what it tells you to do next.
BASIC CANDLESTICK PATTERNS
Japanese candlesticks with short wicks indicate that most of the trading action wasconfined near the open and close.

A bullish (white candle above) marubozu is when the open price equals the low price andthe close price equals the high price. This is a very bullish candle as it shows that buyerswere in control the entire session. It usually becomes the first part of a bullish continuationor a bullish reversal pattern.
A bearish (black candle above) marubozu is when the open price equals the high priceand the close price equals the low. This is a very bearish candle as it shows that sellerscontrolled the price action for the entire session. It usually implies bearish continuation orbearish reversal.
The small real body shows little movement from open to closeand the wicks indicate that both buyers and sellers werefighting, but neither gained the upper hand.If a spinning top forms during an uptrend, this usually meansthere aren’t many buyers left and a possible reversal indirection could occur.If a spinning top forms during a downtrend, this usually meansthere are not many sellers left and a possible reversal indirection could occur.
Japanese candlesticks with a long upper wick, long lower wick and small real bodies arecalled spinning tops. The pattern indicates the indecision between the buyers and sellers.
SPINNING TOPS
MARUBOZU
Marubozu means there are no wicks from the bodies. The high and low are the same asits open or close.

When a doji candlestick forms, it tells us that the market opens and closes at the sameprice. Their bodies are extremely short – appears as a thin line. This indicates indecisionbetween buyers and sellers; there is no one in control of the market. Prices move aboveand below the open price during the session, buy close at or very near the open price
The dragonfly doji is a bullish candlestick pattern which is formed when the open highand close are the same or about the same price. The long lower tail shows theresistance of buyers and their attempt to push the market up.
There are four special types of doji candlesticks:
DOJI
The length of the upper and lower wicks can vary andthe resulting candlestick may look like a cross, inverted
cross or plus sign.
Dragonfly Doji:

This pattern indicates that while buyers were able to push prices well above the open,later, the sellers overwhelmed the market by pushing the price back down. This isinterpreted as a sign that the bulls are losing their momentum and the market is ready fora reversal.
NOTE: You will need additional information about the placement and context of thegravestone doji to interpret the signal effectively.
If a doji forms after a series of bullish, the dojisignals that the buyers are becoming exhaustedand weakening.
In order for price to continue rising, more buyers areneeded but there aren’t anymore! Sellers arelooking to come in and drive the price back down.
If a doji forms after a series of bearish candlesticks, the doji signals that sellers are becoming exhausted &weak.
In order for price to continue falling, more sellers areneeded but sellers are all tapped out! Buyers arelooking for a chance to get in cheap.
While the decline is ending due to lack of sellers,further buying strength is required to confirm anyreversal.
The gravestone doji is the bearish version of the dragonfly doji. It is formed when theopen and close are the same or about the same price. The formation of the long uppertail is an indication that the market is testing a powerful supply or resistance area.
Gravestone Doji:
When a Doji forms on your chart, pay special attention to the preceding candlesticks.

The first candlestick is bearish which indicates that sellers are still in charge of themarket.The second candle is a small one which represents that sellers are in control, butthey don’t push the market much lower and this candle can be bullish or bearish.The third candle is a bullish candlestick that gapped up on the open and closedabove the midpoint of the body of the first day. This candlestick holds a significanttrend reversal signal.
The morning star pattern is considered a bullish reversal pattern, it often occurs at thebottom of a downtrend and it consists of three (3) candlesticks:
The morning star pattern shows us how buyers took control of the market from sellers.Then this pattern occurs at the bottom of a downtrend near a support level, it isinterpreted as a powerful trend reversal signal.
This helps us identify the morning star pattern andhow it is significant when it is formed at the bottom
of a downtrend. You can see the pattern occurred atan obvious bearish trend.
The first candle confirmed the seller’s dominationand the second one produces indecision in the
market. The second candle could be a doji or othercandle.
Here, the doji candle indicated that sellers arestruggling to push the market lower. The third
bullish candle indicates that buyers took controlfrom sellers and the market is likely to reverse.
MORNING STAR

The first candle is a bullish candle.The second candle is a small candlestick. It can be bullish or bearish or it can be adoji or other candlestick.The third candle is a large bearish candle.
The evening star pattern is considered a bearish reversal pattern that usually occurs atthe top of an uptrend. The pattern consists of three (3) candlesticks:
The evening star pattern is the bearish version of the morning star pattern
The first part of an evening star is a bullish candle. This means that the bulls are stillpushing the market higher. The formation of the smaller body shows that buyers are stillin control, but they are not as powerful. The third bearish candle indicates that thebuyer’s domination is over, and a possible bearish trend reversal is likely to happen.
Here we see the market was trending up. The first candle in the pattern indicates a longmove up. The second one is a short candle indicating price consolidation and indecision.
In other words, the trend that created the first long bullish candlestick is losingmomentum. The final candlestick gaping lower than the previous candlestick indicating aconfirmation of the reversal and the beginning of a new trend down.
EVENING STAR

The hammer candlestick is created when the open high and close are roughly the sameprice. It is also characterized by a long lower wick that indicates a bullish rejection frombuyers and their intention to push the market higher.
The hammer is a reversal candlestick pattern when it occurs at the bottom of adowntrend.
This candle forms when sellers push the market lower after the open, but get rejected bybuyers. So, the market closes higher than the lowest price.
Here the market was trending down – the formation of the hammer (pin bar) was asignificant reversal pattern. The long wick represents the high buying pressure from thispoint.
Sellers were trying to push the market lower, but in at that level the buying power wasstronger than the selling pressure, which resulted in a trend reversal.
HAMMER (PIN BAR)
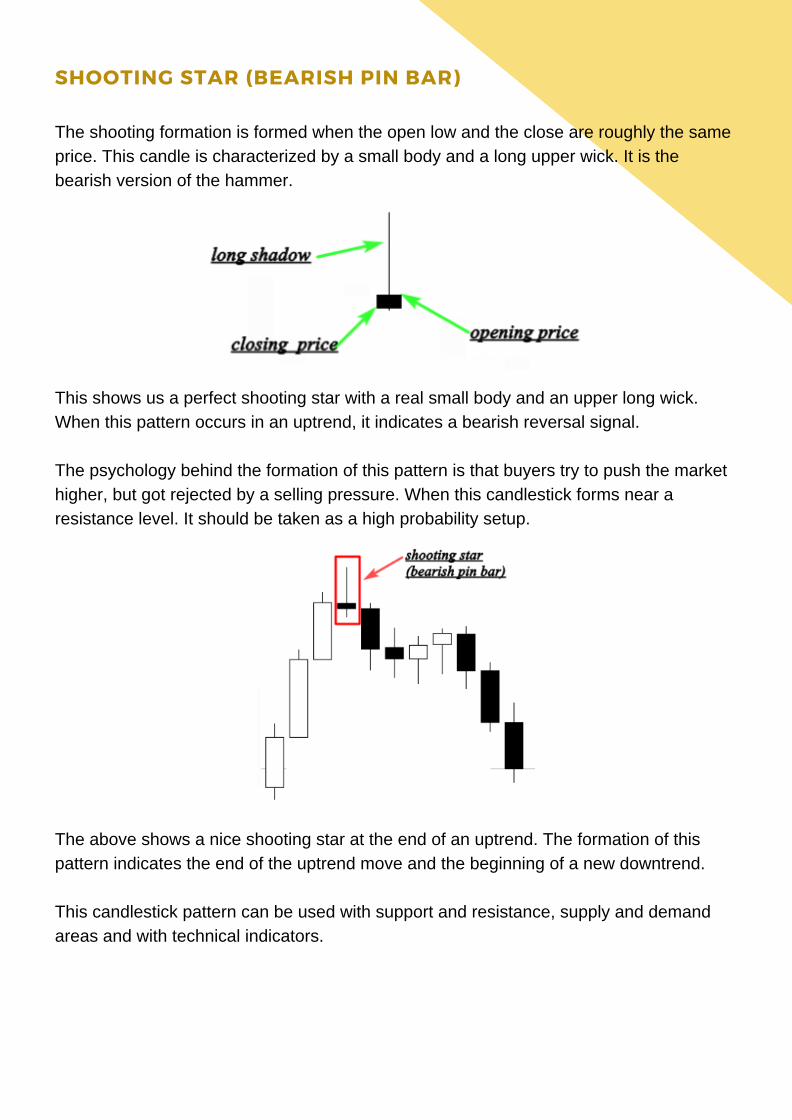
The shooting formation is formed when the open low and the close are roughly the sameprice. This candle is characterized by a small body and a long upper wick. It is thebearish version of the hammer.
This shows us a perfect shooting star with a real small body and an upper long wick.When this pattern occurs in an uptrend, it indicates a bearish reversal signal.
The psychology behind the formation of this pattern is that buyers try to push the markethigher, but got rejected by a selling pressure. When this candlestick forms near aresistance level. It should be taken as a high probability setup.
The above shows a nice shooting star at the end of an uptrend. The formation of thispattern indicates the end of the uptrend move and the beginning of a new downtrend.
This candlestick pattern can be used with support and resistance, supply and demandareas and with technical indicators.
SHOOTING STAR (BEARISH PIN BAR)

The long wick is about 2 or 3 times the length of the real body.Little or no upper wick.The real body is at the upper end of the trading range.
A long lower wick which is about 2 or 3 times the length of the real body.Little or no upper wick.The real body is at the upper end of the trading range.
The hammer and hanging man look alike, but have totally different meanings, dependingon past price action. Both have little bodies, long lower wicks and short or absent upperwicks.
The hammer is a bullish reversal pattern that forms during a downtrend. When price isfalling, a hammer candlestick signals that the bottom is near and price will start risingagain. This long lower wick indicates that sellers pushed prices lower, but buyers wereable to overcome this selling pressure and closed near the open.
NOTE: When you see a hammer candlestick form in a downtrend, it does not mean youautomatically place a buy order. More bullish confirmation is needed before it’s safe totake the trade. E.g. wait for a bullish candlestick to close above the open to the right sideof the hammer candlestick.
Anatomy of a Hammer candlestick:
The hanging man is a bearish reversal pattern that can also mark a top or strongresistance level. When price is rising, the formation of a hanging man indicates thatsellers are beginning to outnumber buyers. The long lower wick show that sellers pushedprices lower during the session. Buyers were able to push the price back up, but onlynear the open.
Anatomy of a Hanging man candlestick:
HAMMER AND HANGING MAN

The inverted hammer and shooting star also look identical. The difference between themis whether you’re in a downtrend or uptrend.
An inverted hammer is a bullish reversal candlestick.
A shooting star is a bearish reversal candlestick.
Both candlesticks have little bodies, long upper wicks and small or absent lower wicks
The inverted hammer occurs when price has been falling. This suggests the possibilityof a reversal. Its long upper wick shows that buyers tried to bid the price higher.
The shooting star is a bearish reversal pattern that looks identical to the invertedhammer, but occurs when price has been rising. Its shape indicates that the priceopened at its low, rallied, but pulled back to the bottom. This means that buyersattempted to push the price up, but sellers cam in and overpowered them. This is abearish sign since there are no more buyers left.
INVERTED HAMMER AND SHOOTING STAR

The first candle is the large candle. It is called the mother candle.This is followed by a small candle which is called the baby.
The Harami pattern (meaning pregnant in Japanese) is considered a reversal andcontinuation pattern.
It consists of two (2) candlesticks:
For the harami pattern to be valid, the second candle should close outside the previousone. This candlestick is considered as a bearish reversal signal when it occurs at the topof an uptrend. It is a bullish signal when it occurs at the bottom of a downtrend
You will notice above that the small body is totally covered by the previous mothercandle. The harami candle tells us that the market is in an indecision period – the marketis consolidation. So, there is no one in control of the market.
When this candlestick pattern happens during an uptrend or downtrend. It is interpretedas a continuation pattern which give a good opportunity to join the trend.
If it occurs at the top of an uptrend or the bottom of a downtrend, it is considered a trendreversal signal.
THE HARAMI PATTERN

Here you can see how the trend direction changes after the harami pattern formation.The first bullish harami pattern occurred at the bottom of a downtrend – sellers werepushing the market lower – then price starts consolidating and this indicates that theselling power is not longer in control of the market.
The bearish harami is the opposite of the bullish. This one occurred at the top of anuptrend indicating that buyer’s domination is over and the beginning of a downtrend ispossible.
When this pattern is created during an uptrend or a downtrend, it indicates a continuationsignal with the direction of the market.
If it occurs at the top of an uptrend or the bottom of a downtrend, it is considered a trendreversal signal.

This candlestick pattern gives us valuable information about the bulls and the bears inthe market.
This pattern tells us that the sellers are in control of the market. When this pattern occursat the end of an uptrend, it indicates that buyers are engulfed by sellers – this signals atrend reversal.
This price action occurs in an uptrend – we can anticipate a trend reversal becausebuyers are not still in control of the market and sellers are trying to push the marketdown.
NOTE: You cannot trade any bearish candlestick pattern on your chart. You will needother technical tools to confirm your entry.
The engulfing bar as it states, is formed when it fully engulfs the previous candle. Theengulfing candle can engulf more than one previous candle, but to be considered anengulfing candle, at least one candle must be fully consumed.
The bearish engulfing is one of the most important candlestick patterns.
This candlestick pattern consists of two (2) bodies: The first one is smaller than thesecond one. The second body engulfs the previous one.
ENGULFING CANDLESTICKS
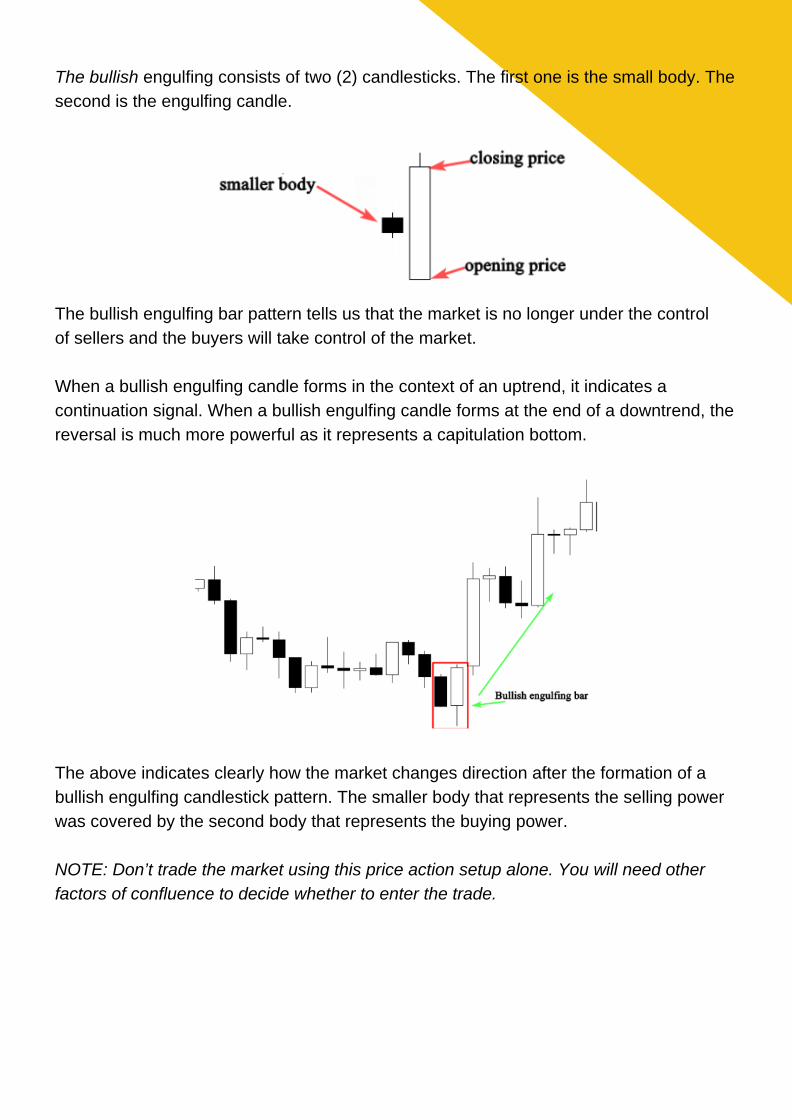
The bullish engulfing bar pattern tells us that the market is no longer under the controlof sellers and the buyers will take control of the market. When a bullish engulfing candle forms in the context of an uptrend, it indicates acontinuation signal. When a bullish engulfing candle forms at the end of a downtrend, thereversal is much more powerful as it represents a capitulation bottom.
The above indicates clearly how the market changes direction after the formation of abullish engulfing candlestick pattern. The smaller body that represents the selling powerwas covered by the second body that represents the buying power.
NOTE: Don’t trade the market using this price action setup alone. You will need otherfactors of confluence to decide whether to enter the trade.
The bullish engulfing consists of two (2) candlesticks. The first one is the small body. Thesecond is the engulfing candle.

The first candlestick is the same as the overall trend. If price is moving up, then thefirst candle should be bullish.The second candlestick is opposite than the overall trend. If price is moving up, thenthe second candle should be bearish.The wicks of the candlesticks should be of equal length.Tweezer tops should have the same highs, while tweezer bottoms should have thesame lows.
The tweezer top formation is considered a bearish reversal pattern seen at the top of anuptrend.
The tweezer bottom formation is seen as a bullish reversal pattern seen at the bottom ofa downtrend.
Effective tweezers have the following characteristics:
The above shows us tweezer bottoms that occurs in a downtrend – the bears pushed themarket downward in the first session, however, the second session went straight upindicating a reversal buy signal that you can trade if you have other elementsthat confirm your buying decision.
TWEEZER BOTTOM AND TOPS

The three white soldiers pattern is formed when three long bullish candles follow adowntrend, signaling a reversal has occurred.
This type of triple candlestick pattern is considered as one of the most potent bullishsignals, especially when it occurs after an extended downtrend and a short period ofconsolidation.
The first of the three soldiers is called the reversal candle.
It either ends the downtrend or implies that the period of consolidation that followed thedowntrend is over.
For the pattern to considered valid, the second candlestick should be bigger than theprevious candle’s body. Also, the second candlestick should close near its high, leavinga small or non-existent upper wick.
For the three white soldiers pattern to be completed, the last candlestick should be atleast the same size as the second candle and have a small or no shadow.
The three black crows candlestick pattern is just the opposite of the three whitesoldiers. It is formed when three bearish candles follow a strong uptrend, indicating that areversal is in the works.
The second candle’s body should be bigger than the first candle and should close at orvery near its low.
Finally, the third candle should be the same size or larger than the second candle’s bodywith a very short or no lower shadow.
THREE WHITE SOLDIERS & BLACK CROWS

The first candle should be found at the bottom of a downtrend and is characterized bya long bearish candlestick.
The second candle should at least make it up all the way up to the midpoint of thefirst candle.
The third candlestick needs to close above the first candle’s high to confirm thatbuyers have overpowered the strength of the downtrend.
The first candle should be found at the top of an uptrend and is characterized by along bullish candlestick.
The second candle should make it up all the way down the midpoint of the firstcandle.
The third candlestick needs to close below the first candles’ low to confirm thatsellers have overpowered the strength of the uptrend.
The three inside up candlestick formation is a trend reversal pattern that is found at thebottom of a downtrend. The triple candlestick pattern indicates that the downtrend ispossibly over and that a new uptrend has started.
For a valid three inside up candlestick formation, look for these characteristics:
Conversely, the three inside down candlestick formation is found at the top of an uptrend.It means that the uptrend is possibly over and that a new downtrend has started.
The three inside down candlestick formation needs to have the following characteristics:
THREE INSIDE UP AND DOWN