7th pipeline technology conference 2012 · maop = 1135 psig km8 km211 ... process dynamics...
TRANSCRIPT
© Copyright 2011, Saudi Aramco. All rights reserved. No portion of this article may be reproduced, by any process or technique, without the express written consent
of Saudi Aramco.
Pablo Genta March 27-30, 2012
7th Pipeline Technology Conference 2012
Outline
• Introduction
• RTTM Saudi Aramco scenario
• RTTM Safety and Integrity Data Model
• Technology Implementation Model
• S&I RTTM challenges under “real-life”operation
• Practices & Accomplishments
– Technology screening,
– Engineering Design,
– Testing & Commissioning
– Operations and Maintenance Infrastructure
• RTTM…what it really takes
• Conclusions
2

RTTM Introduction
Q Q P P T T
Pipelines RTTM
Pipeline/s
Other Systems
Estimated Process
Variable & Deviations
Function Specific Results
Estimated Fluid & Pipe
Parameters & Deviations
Leak Detection Batch Tracking Scraper Tracking Inventory
Calculations Operation
Deviation Alerts Corrosion
Forecasting
Basic Functions
Advanced Functions
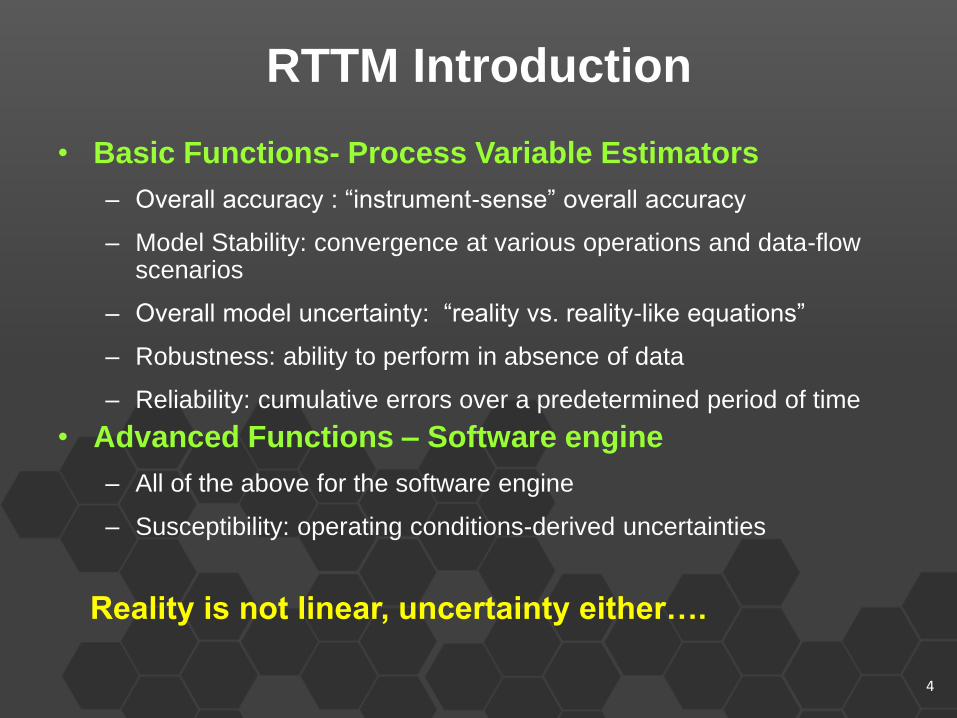
RTTM Introduction
• Basic Functions- Process Variable Estimators
– Overall accuracy : “instrument-sense” overall accuracy
– Model Stability: convergence at various operations and data-flow scenarios
– Overall model uncertainty: “reality vs. reality-like equations”
– Robustness: ability to perform in absence of data
– Reliability: cumulative errors over a predetermined period of time
• Advanced Functions – Software engine
– All of the above for the software engine
– Susceptibility: operating conditions-derived uncertainties
Reality is not linear, uncertainty either….
4
RTTM on Saudi Aramco Pipelines
• Large-scale pipeline operations more than 350
pipelines
• Large flow-rates exceeding millions of barrels per day
per lines
• Large capacity pipeline network and large pressure
and flow control facilities
• Built-in redundant Pipeline network topology
• Rapidly growing transporting network
• Multiple hydrocarbon supply interconnected facilities
• Multiple fluids transported, natural gas, various crude
oil bends, NGL, condensates, various types of
products
5

SHARED DEVICES
RTTM Only
RTTM Only
FULLY INTEGRATED
SHARED
PARTIALLY INTEGRATED
SHARED
STAND ALONE
OTHERS HARDWARE RTTM RTTM
SHARED DRIVERS
RTTM DRIVER
RTTM DRIVERS
SCADA SCADA
RTTM APPLICATIONS RTTM
APPLICATIONS
RTTM on Saudi Aramco Pipelines
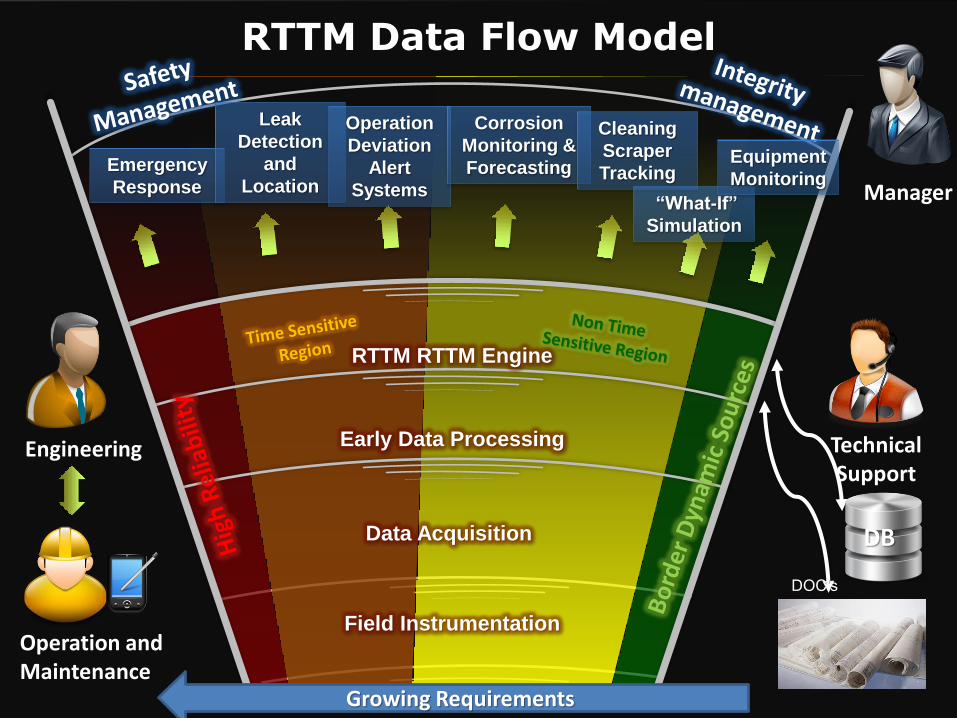
RTTM Data Flow Model
Field Instrumentation
Data Acquisition
Early Data Processing
RTTM RTTM Engine
Emergency
Response
Leak
Detection
and
Location
Operation
Deviation
Alert
Systems
Corrosion
Monitoring &
Forecasting
Cleaning
Scraper
Tracking
“What-If”
Simulation
DOC’s
Growing Requirements
DB
Engineering
Operation and Maintenance
Manager
Technical Support
Equipment
Monitoring

RTTM Implementation Model
8
Identify Need
Assess Technology
Performance
Current Practices
Acceptable
No
Yes
Apply Develop
Select Cost-
Effective
Technology
Execute Project • Identify Target
Facilities
• Cost-Benefit Analysis
• Implementation
Guidelines
• Standardization
Screen
Technologies/
Methods
Does current practice
meet
Performance level?
Categorize Selected Technology based on
Priority and Maturity
Does the selected
Technology meets required
Performance?
No
Yes Go to Step
1
Pilot Test
In-House
Expertise
Step 1 Step 2
Step 3
Step 4
Step 5
Step 6
Step 7
Step 8
Step 9
Step 10
RTTM Pipeline Safety Leak Detection and Location
9
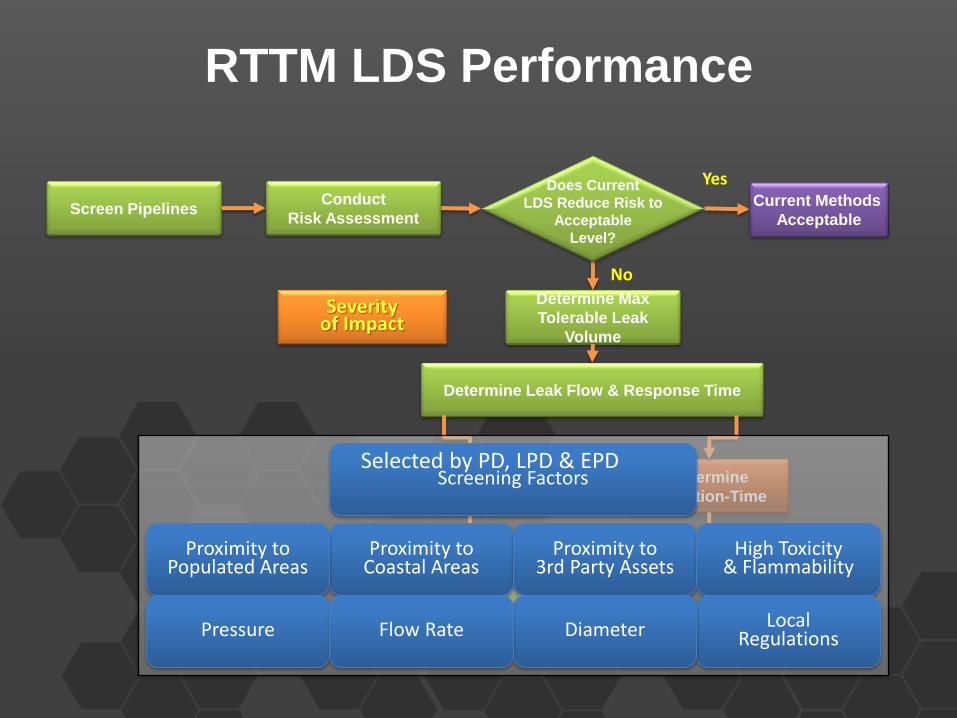
RTTM LDS Performance
Screen Pipelines Current Methods
Acceptable
No
Yes
Determine
Min Leak-Size to
Detect
Determine
Detection-Time
Determine Max
Tolerable Leak
Volume
Determine Required
LDS Performance
Conduct
Risk Assessment
Severity of Impact
Does Current
LDS Reduce Risk to
Acceptable
Level?
Determine Leak Flow & Response Time
Proximity to
Coastal Areas
Proximity to
3rd Party Assets
High Toxicity & Flammability
Local
Regulations
Diameter
Proximity to Populated Areas
Pressure Flow Rate
Screening Factors Selected by PD, LPD & EPD

RTTM Performance
Product vs Requirements QRA-Based
11
0%
10%
20%
30%
40%
50%
5 min10 min
15 min30 min
1 hour2 hours
4 hours
Required Performance
Product Performance
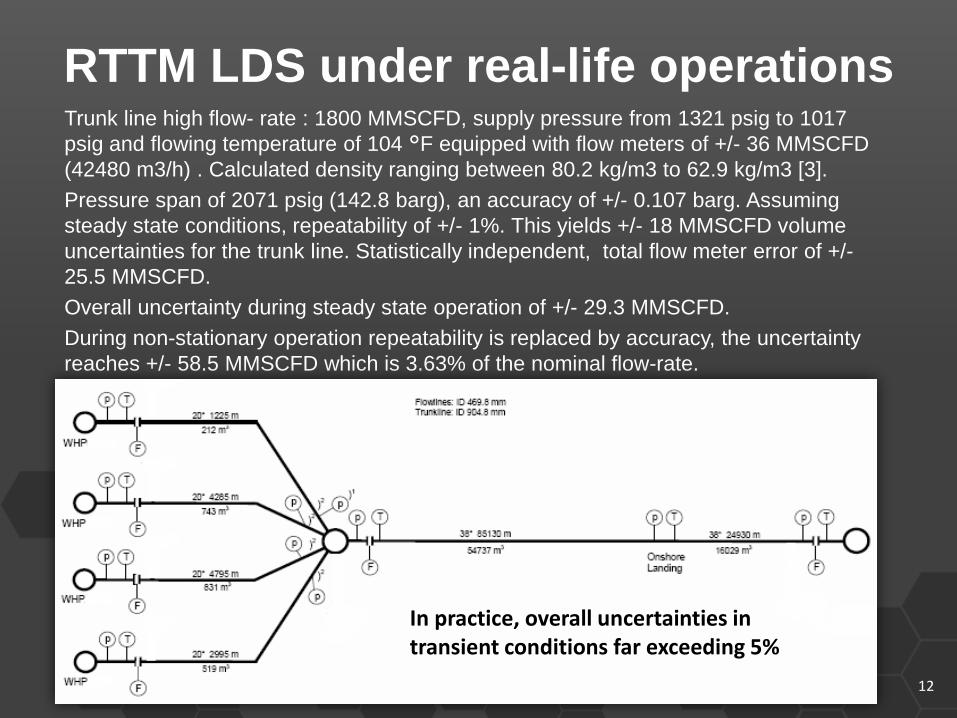
RTTM LDS under real-life operations
12
Trunk line high flow- rate : 1800 MMSCFD, supply pressure from 1321 psig to 1017
psig and flowing temperature of 104 °F equipped with flow meters of +/- 36 MMSCFD
(42480 m3/h) . Calculated density ranging between 80.2 kg/m3 to 62.9 kg/m3 [3].
Pressure span of 2071 psig (142.8 barg), an accuracy of +/- 0.107 barg. Assuming
steady state conditions, repeatability of +/- 1%. This yields +/- 18 MMSCFD volume
uncertainties for the trunk line. Statistically independent, total flow meter error of +/-
25.5 MMSCFD.
Overall uncertainty during steady state operation of +/- 29.3 MMSCFD.
During non-stationary operation repeatability is replaced by accuracy, the uncertainty
reaches +/- 58.5 MMSCFD which is 3.63% of the nominal flow-rate.
Without taking into account errors in the RTTM model including heat transfer during
transients
In practice, overall uncertainties in transient conditions far exceeding 5%

16” Single Phase Gas Pipleine
Recording Time Frame 12:11:41.531 Hs – 12:13:20.291 Hs
13
Challenging Leak-like buried transients
RTTM LDS under real-life operations

GOSP-3
GOSP-1
GOSP-2
GOSP-4
ABQ
46” Crude Oil
30” Crude Oil
Length = 640 km
WT = 0.42” to 0.625”
MAOP = 815 psig
Length = 223 km
WT = 0.375”
MAOP = 1135 psig
KM8 KM211
RTTM LDS under real-life operations
DRA Injection
DRA Injection
30” Single Phase Crude Oil Pipleine- DRA Injection
Calculated
Uncertainty

15
DRA injection
MAOP = 815 psig
RTTM LDS under real-life operations 30” Single Phase Crude Oil Pipleine

16
High frequency pressure fluctuations under buried in low frequency transients.
RTTM LDS under real-life operations

Practices
17

RTTM Product- Application
• Gap Analysis : RTTM Optimum Scenario vs
Application Scenario
18
0
10
20
30
40Fluid GTL %
Line design
P,Q LevelTransientSeverity
Infrastructure
Readiness
Application Scenario
RTTM Optimum Scenario
Will we succeed?
Do we really know this RTTM too?
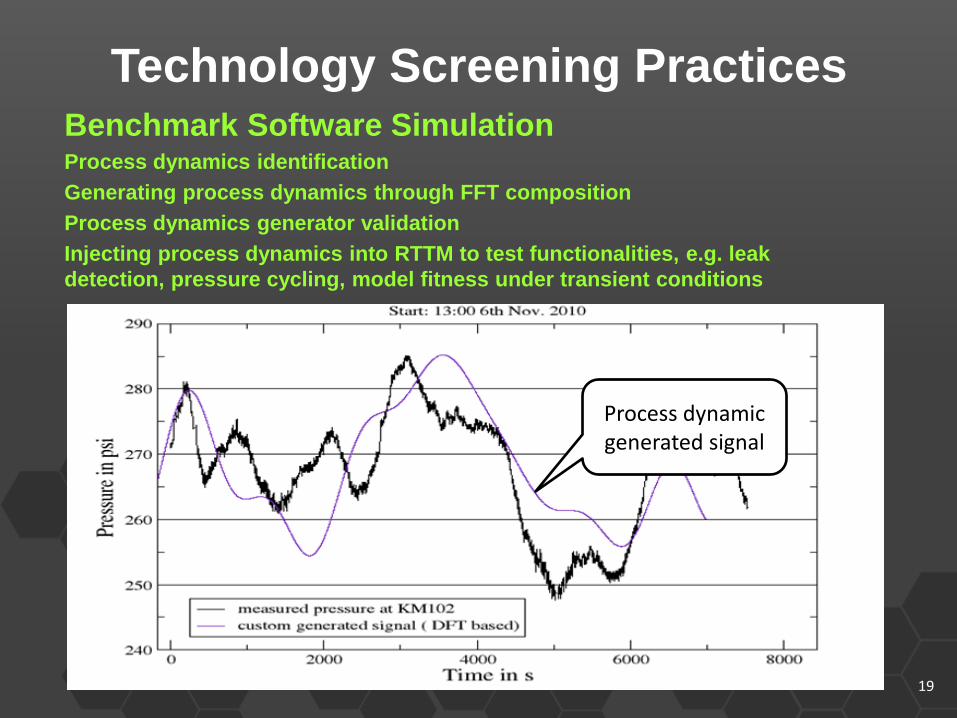
Technology Screening Practices
19
Benchmark Software Simulation Process dynamics identification
Generating process dynamics through FFT composition
Process dynamics generator validation
Injecting process dynamics into RTTM to test functionalities, e.g. leak
detection, pressure cycling, model fitness under transient conditions
Process dynamic generated signal
20
Average Signal
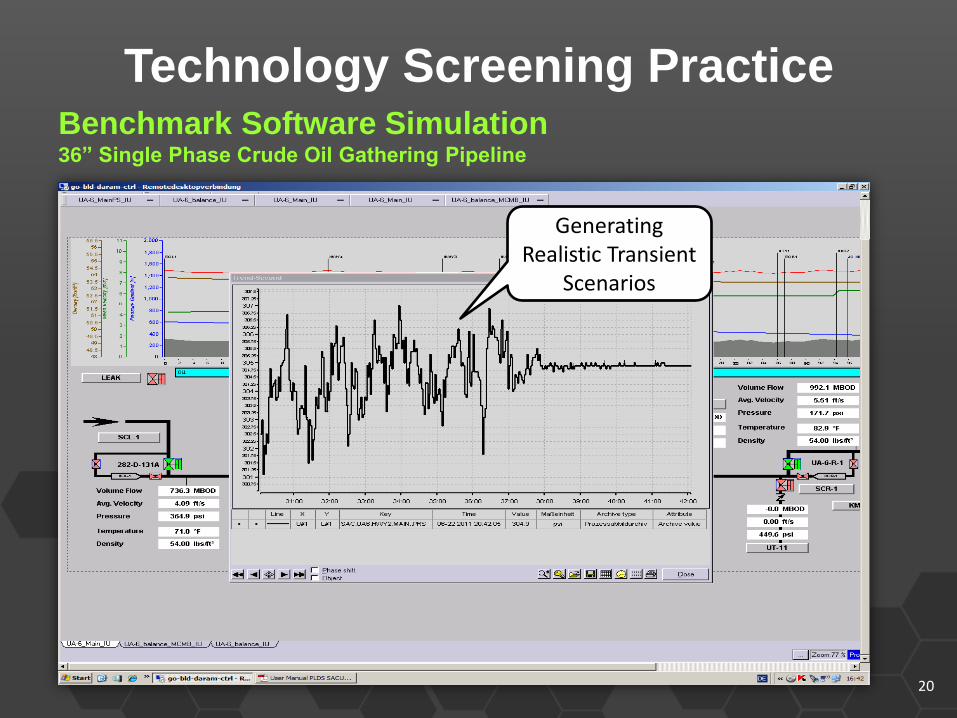
Benchmark Software Simulation 36” Single Phase Crude Oil Gathering Pipeline
Generating Realistic Transient
Scenarios
Technology Screening Practice

UP1,2
UT1,2
U Qv
Uρ
UФ
Total U Q U Line Fill
U Length
U Roughness
U Pipe Wall
U
Expected Sensitivity &
Accuracy
ISO 5168
ASME PTC 19.1 & 2
Model Uncertainty
Infrastructure
EXPECTED PERFORMANCE
at REAL-LIFE CONDITIONS
Performance Study
Assessment real-life comm round-trip delay+latency+bandwidth+ availability
Engineering Practices Baseline RTTM Model Uncertainty Analysis
Engineering Practice
• Field Device Infrastructure for Time-Sensitive Data Flow
– Minimum Availability 99.9% for RTU’s
– Minimum Availability of 99.999% for communication links
– Field Data buffering, “store and pull” strategy
– Time synchronization through GPS
– Distributed data processing function-specific, field processors
– Built-in RTU diagnostic for communication ports with port auto-reset
– Minimizing field throughput demand through optimizing field processing functions
– Requirements for handling
22

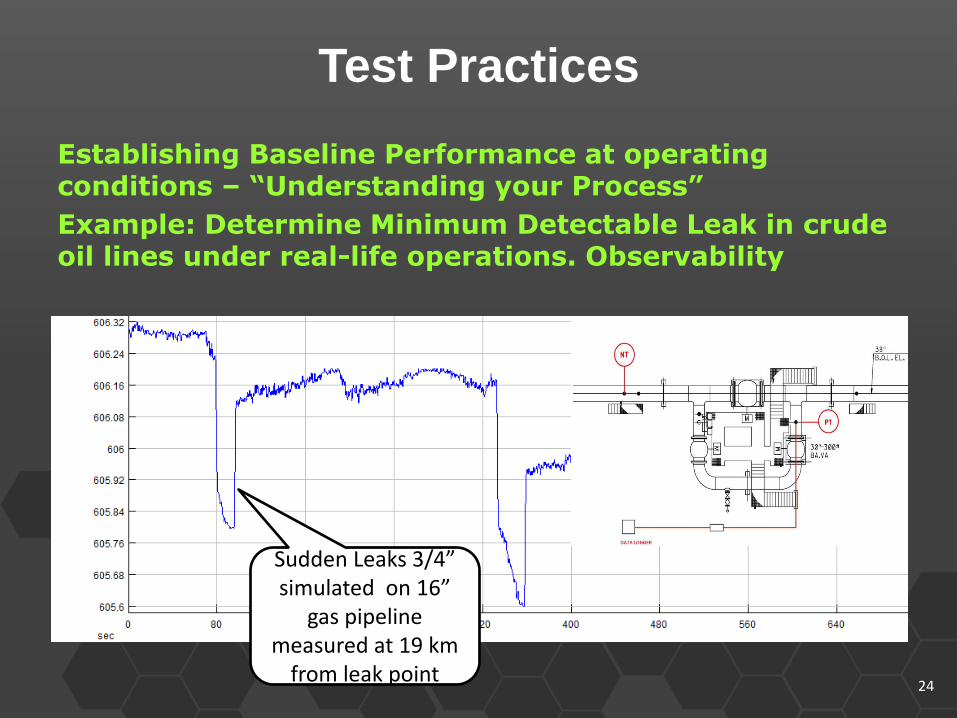
Test Practices
38
39
40
41
42
43
44
11
40
82
81
54
22
25
62
97
03
68
44
39
85
01
12
57
12
66
41
40
71
15
47
81
68
85
18
29
21
96
99
21
10
62
25
13
23
92
02
53
27
26
73
42
81
41
29
54
83
09
55
32
36
23
37
69
35
17
63
65
83
37
99
03
93
97
40
80
44
22
11
43
61
8
Establishing Baseline Performance at operating conditions – “Understanding your Process” Example: Determine Minimum Detectable Leak in crude oil lines under real-life operations. Observability
Actual Leak 2” on 24” Crude oil line
low pressure
Spectrogram Actual Leak 2” on 24” Crude oil line low
pressure in benign hydraulic noise conditions
Test Practices
Establishing Baseline Performance at operating conditions – “Understanding your Process”
Example: Determine Minimum Detectable Leak in crude oil lines under real-life operations. Observability
24
Sudden Leaks 3/4” simulated on 16”
gas pipeline measured at 19 km
from leak point

RTU
RTU
RTU
Maint. Center (Abq)
Maint. Center (DH)
Maint. Center (PS-6)
Distributed Architecture
Optimum Performance
Effective O&M
Sensible Resource Allocation
Infrastructure

Resources Overview
what it takes…. • Technology Screening, Development and Pilot-Testing
– Reliable and valid supplier’s past test records supplier openness
– “Realistic” model specifications supplier openness
– “Real-life” testing platform or reliable software-based tools
• Engineering Design
– Engineering Best-Practices , Industry Standards poor or inexistent
– Data acquisition and
instrumentation time-performance data poor or inexistent
• Infrastructure
– Real-time field availability and reliability careful assessment
– Application-oriented instrumentation sometimes underdeveloped
– Remote monitoring facilities geographical resource allocation
26

Conclusions
• S&I RTTM Performance means understanding process and technology limitations
• RTTM sustainability implies best-fit infrastructure & data-flow architecture
• Poor Industry Standardization
• Limitations against expected benefits ……can we achieve watch-maker accuracy using stone-age tools?
• Understanding your RTTM tool through valid supplier data is a must
• High potential platform
27

Thank You
28