7th grade curriculum - michigan · e.e.k! project for sustainability s10/24/2006–sustainable...
TRANSCRIPT

E.E.K! Project for Sustainability 10/24/2006–Sustainable Futures Group 2006–[email protected]
7th–80
Lesson 9: 7th Grade Automobile emissions and pollutants, and global warming
Lesson Overview: Develop a working knowledge of global warming and the automobile’s role in the warming of the planet.
Lesson Concept: Increase conscious awareness of the state of the planet with the class as individuals and as a whole.
Materials:
• Note-taking journals Standards:
• English: o IX.11.MS.1 (Inquiry and Research: Define and investigate important issues
and problems using a variety of resources). • Mathematics:
o III.1.MS.1 (Data Analysis & Statistics: Collect and explore data through observation, measurements, surveys, sampling techniques and simulations).
o III.1.MS.4 (Data Analysis & Statistics: Identify what data are needed to answer a particular question or solve a given problem, and design and implement strategies to obtain, organize and present those data).
• Science: o I.1.MS.1 (Construct new Scientific and personal Knowledge: Generate
scientific questions about the world based on observation). o II.1.MS.3 (Reflect on the Nature, Adequacy and Connections Across
Scientific Knowledge: Show how common themes of science, mathematics, and technology apply in real-world contexts).
• Social Studies: o II.3.MS.4 (Geographic Perspective: Describe the major economic and
political connections between the United States and different world regions and explain their causes and consequences).
o II.5.MS.1 (Geographic Perspective: Describe how social and scientific changes in regions may have global consequences).
o IV.2.MS.4 (Economic Perspective: Examine the historical and contemporary role an industry has played and continues to play in a community).
o VI.1.MS.3 (Public Discourse and Decision Making: Explain how culture and experiences shape positions that people take on an issue).
Timeline: 1 – 2 class periods (50 - 60 minutes each) Class Structure: class discussion and question review Assessment Strategy: EEK! Daily Assessment
General Assessment Strategy #2 General Assessment Strategy #4
E.E.K! Project for Sustainability 10/24/2006–Sustainable Futures Group 2006–[email protected]
7th–81
Lesson 9: 7th Grade Emissions, pollutants, and global warming
Lesson Overview: Develop a working knowledge of global warming and the automobile’s role in the warming of the planet.
Lesson Concept: Increase conscious awareness of the state of the planet with the class as individuals and as a whole.
Materials: Student Hand-out #1: Global Warming Primer Student Hand-out / Overhead #2: Review Questions for Brainstorming
Background Information As discussed at the end of Lesson 8, we have now learned that the combustion process of gasoline in a car engine is not perfect. Motor vehicles generate three major pollutants: hydrocarbons, nitrogen oxides, and carbon monoxide. Even though global warming has been widely studied and discussed for many years by concerned citizens, environmental organizations, energy organizations, and scientists around the world, global warming is now making its way into mainstream, American news discussions. Nearly every week, there is a news article discussing the causes and affects of global warming–increase in pollutants, decrease air quality, increase in childhood asthma, increased speed of glacier melting, and the list continues. But, what is global warming and what is the role of the automobile? This lesson will provide a brief overview to those two questions:
• How does global warming occur? • What is the automobile’s role in the warming of the planet?
Lesson 10 will then follow the conversation and discuss how to reduce our pollutant quotient and what are alternatives to petroleum fueled vehicles.
CLASS EXERCISES: I. Global Warming: Reading and Discussion This section includes the following brief readings
• Global Warming: A working definiion • The Greenhouse Effect • Global Warming and Increased Health Problems
II. The Automobile’s Role in Global Warming: Reading and Discussion III. Review Questions: Student feedback and discussion

E.E.K! Project for Sustainability 10/24/2006–Sustainable Futures Group 2006–[email protected]
7th–82
Global Warming: A working definition
Technically, the term(s) global warming or global cooling refer to the natural warming and cooling trends that the earth has experienced all through its history. However, the term “global warming” has become a popular term encompassing all aspects of the global warming problem, including the potential climate changes that will be brought about by an increase in global temperatures. (ww.climatechangecentral.com/default.asp)
This term has become popularized and is currently used to express an extremely different set of circumstances–than the natural warming trends throughout history–the world’s population is now facing. For the first time in history, people are the direct cause of the warming of the planet. This unprecedented event is upsetting the balance of nature causing climatic shifts that even thus far have proven to be disastrous for all life. The current rate of habitat loss, increase in storm severity, increase in pollution induced illnesses, and the increase in death, and malformation of those living in areas that are exposed to polluted foods, land, and water is intensifying at an alarming rate around the globe. It is of the utmost importance for the youth of today to have a conscious awareness of their direct complicity in the warming of the planet and to then decide how they might or might not change their actions that directly affect the health of all life on the planet and the life of the planet itself. Therefore, an encompassing, working definition of global warming can be thought of as: A gradual warming of the Earth’s atmosphere caused by the burning of fossil fuels and industrial pollutants.
E.E.K! Project for Sustainability 10/24/2006–Sustainable Futures Group 2006–[email protected]
7th–83
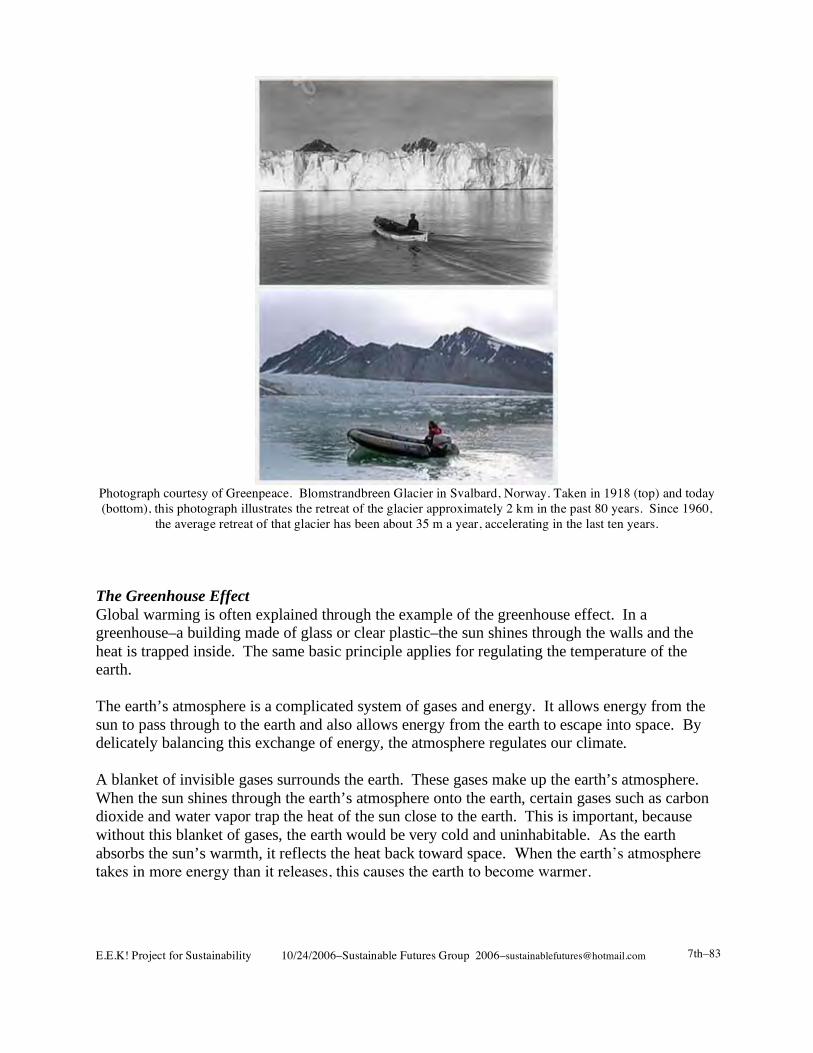
Photograph courtesy of Greenpeace. Blomstrandbreen Glacier in Svalbard, Norway. Taken in 1918 (top) and today (bottom), this photograph illustrates the retreat of the glacier approximately 2 km in the past 80 years. Since 1960,
the average retreat of that glacier has been about 35 m a year, accelerating in the last ten years.
The Greenhouse Effect Global warming is often explained through the example of the greenhouse effect. In a greenhouse–a building made of glass or clear plastic–the sun shines through the walls and the heat is trapped inside. The same basic principle applies for regulating the temperature of the earth. The earth’s atmosphere is a complicated system of gases and energy. It allows energy from the sun to pass through to the earth and also allows energy from the earth to escape into space. By delicately balancing this exchange of energy, the atmosphere regulates our climate. A blanket of invisible gases surrounds the earth. These gases make up the earth’s atmosphere. When the sun shines through the earth’s atmosphere onto the earth, certain gases such as carbon dioxide and water vapor trap the heat of the sun close to the earth. This is important, because without this blanket of gases, the earth would be very cold and uninhabitable. As the earth absorbs the sun’s warmth, it reflects the heat back toward space. When the earth’s atmosphere takes in more energy than it releases, this causes the earth to become warmer.

E.E.K! Project for Sustainability 10/24/2006–Sustainable Futures Group 2006–[email protected]
7th–84
The burning of coal, oil, and natural gas has increased the concentration of certain gases in our atmosphere. Factories, electric power plants, and vehicles that burn fossil fuels to create energy are raising the level of carbon dioxide in the atmosphere. How does this happen? Fossil fuels consist primarily of hydrocarbons. Hydrocarbons are atoms created from hydrogen and water. When hydrocarbons burn, the carbon combines with oxygen to produce carbon dioxide. When excessive amounts of carbon dioxide build up in the atmosphere, more and more of the sun’s heat is trapped in the atmosphere surrounding the earth. In this scenario, rate of greenhouse gas increase exceeds the rate of absorption. The result is a human activity induced climate warming. Carbon dioxide is one of the greenhouse gases believed to cause global warming; others are methane, nitrous oxide, and chlorofluorcarbons (CFCs). How is this a problem? A rise in temperature, even a degree, can wreck havoc on the balance of ecosystems. At this point, scientists have documented an increase of nearly one degree Fahrenheit in the past century. The rising global temperatures are the most serious threat of global warming. The Warming Trend: Can a few degrees make a difference? Throughout history, major shifts in temperatures have occurred at a very slow rate–usually changing only a few degrees over thousands of years. However, over the last century, scientists have documented a 1° F rise in the temperature of the planet. If temperatures continue to rise at this rate, climate scientists predict that global warming will raise the average temperature of the planet by 3 to 10 degrees Fahrenheit over the next 80 years. How much of a difference can a few degrees make? The answer is simply: a few degrees in global temperature change can have drastic affects on the planet. The warming trend increases the intensity of both droughts and storms such as hurricanes, tornadoes, and flooding. Since 1995, more than 5,400 square miles of Arctic ice shelves have melted causing rises in sea-levels around the world. Given that 70% of the earth’s surface is covered by water, low-lying parts of the world are now much more vulnerable to flooding and the devastation that follows. Variability in temperature, precipitation, soil moisture, humidity, and wind can increase susceptibility or growth of diseases and pest resistance, and change the natural occurrence of fires, droughts, and floods. Varieties of plants and animals including coral reefs and pine forests are incapable of shifting habitat and are in rapid decline. Climate shifts can also affect food supplies, and the availability of shelter, space, and water for all. This change in climate is likely to accelerate in the next century and could continue until several decades after the greenhouse gas concentrations reach a peak. (When that peak occurs specifically depends on how we choose to live our lives).

E.E.K! Project for Sustainability 10/24/2006–Sustainable Futures Group 2006–[email protected]
7th–85
As studies suggest, according to the EPA (Environmental Protection Agency), breathing smoggy air containing fine pollution particles can be as dangerous as breathing second hand cigarette smoke. (Photo courtesy EIA: the air over
the Los Angeles, California is hazy with pollution). Global Warming and Increased Health Problems Infectious disease is the second major threat that global warming poses to human health. Scientists at Harvard Medical School have linked recent U.S. outbreaks of dengue fever, malaria, and hantavirus to climate change. As temperatures increase, formerly cool areas become new habitats for disease-carrying mosquitoes and rodents. These creatures are the vectors for diseases that more commonly thrived in tropical climates. Since 1990, outbreaks of locally transmitted malaria have occurred in California, Florida, Georgia, Michigan, New Jersey, and New York. The Intergovernmental Panel on Climate Change (IPCC) predicts that as warmer temperatures spread north and south from the tropics and to higher elevations, malaria-carrying mosquitoes will spread with the shifting climates. This may put as much as 65% of the world’s population at risk of infection. This is an increase of 20% within the next century.
E.E.K! Project for Sustainability 10/24/2006–Sustainable Futures Group 2006–[email protected]
7th–86
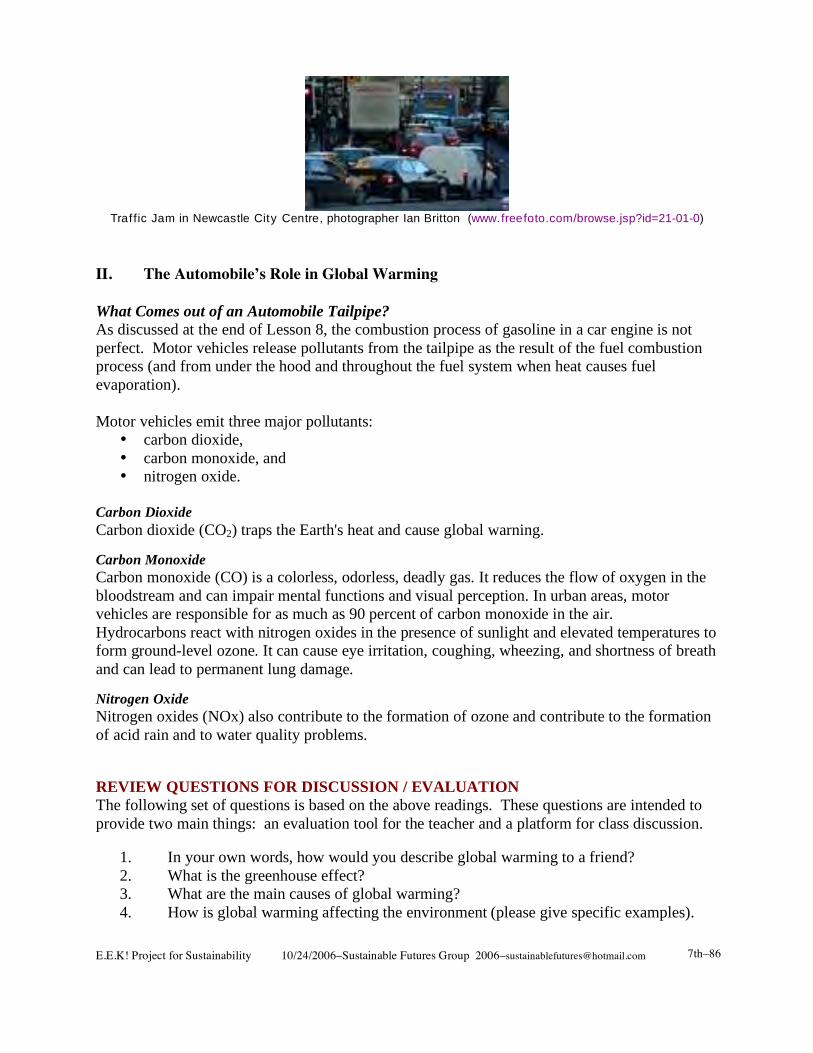
Traf fic Jam in Newcastle City Centre, photographer Ian Britton (www.freefoto.com/browse.jsp?id=21-01-0)
II. The Automobile’s Role in Global Warming What Comes out of an Automobile Tailpipe? As discussed at the end of Lesson 8, the combustion process of gasoline in a car engine is not perfect. Motor vehicles release pollutants from the tailpipe as the result of the fuel combustion process (and from under the hood and throughout the fuel system when heat causes fuel evaporation). Motor vehicles emit three major pollutants:
• carbon dioxide, • carbon monoxide, and • nitrogen oxide.
Carbon Dioxide Carbon dioxide (CO2) traps the Earth's heat and cause global warning. Carbon Monoxide Carbon monoxide (CO) is a colorless, odorless, deadly gas. It reduces the flow of oxygen in the bloodstream and can impair mental functions and visual perception. In urban areas, motor vehicles are responsible for as much as 90 percent of carbon monoxide in the air. Hydrocarbons react with nitrogen oxides in the presence of sunlight and elevated temperatures to form ground-level ozone. It can cause eye irritation, coughing, wheezing, and shortness of breath and can lead to permanent lung damage. Nitrogen Oxide Nitrogen oxides (NOx) also contribute to the formation of ozone and contribute to the formation of acid rain and to water quality problems. REVIEW QUESTIONS FOR DISCUSSION / EVALUATION The following set of questions is based on the above readings. These questions are intended to provide two main things: an evaluation tool for the teacher and a platform for class discussion.
1. In your own words, how would you describe global warming to a friend? 2. What is the greenhouse effect? 3. What are the main causes of global warming? 4. How is global warming affecting the environment (please give specific examples).

E.E.K! Project for Sustainability 10/24/2006–Sustainable Futures Group 2006–[email protected]
7th–87
5. Are there also global warming induced threats to humans (please give specific examples).
6. What could you do in your daily life to decrease global warming effects?
E.E.K! Project for Sustainability 10/24/2006–Sustainable Futures Group 2006–[email protected]
7th–88
Lesson 10: 7th Grade Creating Change: Personal Decision-making and Automobiles
Lesson Overview: Introduce and discuss hybrid vehicle technology. Lesson Concept: Develop an understanding of feedback loops and how they can be used as
a tool for complex decision-making. Materials:
• Note-taking journals • Student Hand-out / Overhead #1: Average U.S. driving habits and gasoline
consumption Standards:
• English: o IX.11.MS.1 (Inquiry and Research: Define and investigate important issues
and problems using a variety of resources). • Mathematics:
o III.1.MS.1 (Data Analysis & Statistics: Collect and explore data through observation, measurements, surveys, sampling techniques and simulations).
o III.1.MS.4 (Data Analysis & Statistics: Identify what data are needed to answer a particular question or solve a given problem, and design and implement strategies to obtain, organize and present those data).
• Science: o I.1.MS.1 (Construct new Scientific and personal Knowledge: Generate
scientific questions about the world based on observation). o II.1.MS.3 (Reflect on the Nature, Adequacy and Connections Across
Scientific Knowledge: Show how common themes of science, mathematics, and technology apply in real-world contexts).
• Social Studies: o II.3.MS.4 (Geographic Perspective: Describe the major economic and
political connections between the United States and different world regions and explain their causes and consequences).
o II.5.MS.1 (Geographic Perspective: Describe how social and scientific changes in regions may have global consequences).
o IV.2.MS.4 (Economic Perspective: Examine the historical and contemporary role an industry has played and continues to play in a community).
o VI.1.MS.3 (Public Discourse and Decision Making: Explain how culture and experiences shape positions that people take on an issue).
Timeline: 2 – 3 class periods (50 – 60 minutes each) Class Structure: class discussion and small group brainstorming Assessment Strategy: EEK! Daily Assessment
General Assessment Strategy #2 General Assessment Strategy #3
General Assessment Strategy #4

E.E.K! Project for Sustainability 10/24/2006–Sustainable Futures Group 2006–[email protected]
7th–89
Lesson 10: 7th Grade Creating Change: Personal Decision-making and Automobiles
Lesson Overview: Introduce and discuss hybrid vehicle technology. Lesson Concept: Develop an understanding of feedback loops and how they can be used as a tool for complex decision-making. Materials: Note-taking journals Student Hand-out / Overhead #1: Average U.S. driving habits and gasoline consumption Background Information There are a number of alternative fuels and technologies currently being discussed and developed by scientists and the automotive industry. In this final section, hybrid vehicles will be introduced as a growing alternative for automobile buyers. The Transportation Module culminates with a brainstorming session introducing the concept of feedback loops and how teasing out complex questions from a systems point of view can help individuals’ make more informed decisions. CLASS EXERCISES;
I. Average U.S. driving habits and gasoline consumption • Interpreting and calculating statistical figures
II. Hybrid vehicles: a growing alternative
III. Brainstorming Session: global warming and automobiles
• Introducing feedback loops
IV. Module Evaluation and Assessment

E.E.K! Project for Sustainability 10/24/2006–Sustainable Futures Group 2006–[email protected]
7th–90
I. Average U.S. driving habits and gasoline consumption Write the following statistics either on the front board of the classroom or have the class view as an overhead. Have the students read the statistics out loud. Many students may have difficulty in grasping the size and significance of the numbers. If this is the case, introduce the Interpreting the Statistics section and this will both break down the numbers into smaller chunks and increase the numbers by size. Consider the following statistics:
• U.S. population is approximately 300,000,000 and growing (censusus.gov 2006) • Approximately 243,000,000 passenger cars are on the road in the U.S. (2006,
wikipedia.org) • U.S. consumes about 20 million barrels of crude oil per day (eia.gov) • U.S. consumes approximately 400 million gallons of gasoline every day (eia.gov) • Average CO2 emissions per gallon of gasoline is 22.2 lbs./gallon • U.S. drivers average 15,000 miles of driving per year (aaa.org) • U.S. average automobile fuel economy is 20 mpg (eia.gov) • Average U.S price for a gallon of gasoline is $2.40 (2006)
Class Exercise: Interpreting the Statistics Either in small groups or as a whole class, have the students compute the following figures based on the above statistics:
1. Approximately how many miles are driven in the United States per year? Per day? 2. How many gallons of gasoline are consumed in the United States per week? Per month?
Per year?
3. Approximately how many lbs. of CO2 are emitted into the atmosphere in the U.S. per day from gasoline? Per week? Per month? Per year?
4. Approximately how many gallons of gasoline are consumed per person in the U.S. daily? 5. Approximately how much money is spent on gasoline per year per car?

E.E.K! Project for Sustainability 10/24/2006–Sustainable Futures Group 2006–[email protected]
7th–91
II. Hybrid Vehicles: a growing alternative
the above graphic was created by the Sierra Club for their internally developed Hybrid Cars–Driving Solutions flyer.
The flyer in its entirety can be downloaded from www.sierraclub.org
The Concept: How do Hybrids work? Hybrid vehicles combine an electric-drive motor and an efficient gasoline engine to create a vehicle that gets better-than-average U.S. fuel economy plus reduced emissions. Please see the following website for a 3-d illustration to view the different parts of a hybrid car. www.howstuffworks.com/hybrid-car.htm Do hybrids have to be plugged in to recharge? No. Even though hybrids use electric motors that draw power from a battery, they never have to be plugged in. The battery is recharged from two sources: a generator powered by the internal combustion engine and through reclaiming the energy that is normally wasted when the brakes are used. How do hybrids reclaim normally wasted energy from using the brakes? This technique is called regenerative braking. This is how it works: hybrids use a combination of an electric motor and an electric generator. A generator is a motor ran in reverse. In the hybrid system, when you step on the brakes, instead of the friction (inertia) converting into heat–which is what happens in non-hybrid vehicles–they connect the generator to the battery that charges the electric motor.
E.E.K! Project for Sustainability 10/24/2006–Sustainable Futures Group 2006–[email protected]
7th–92
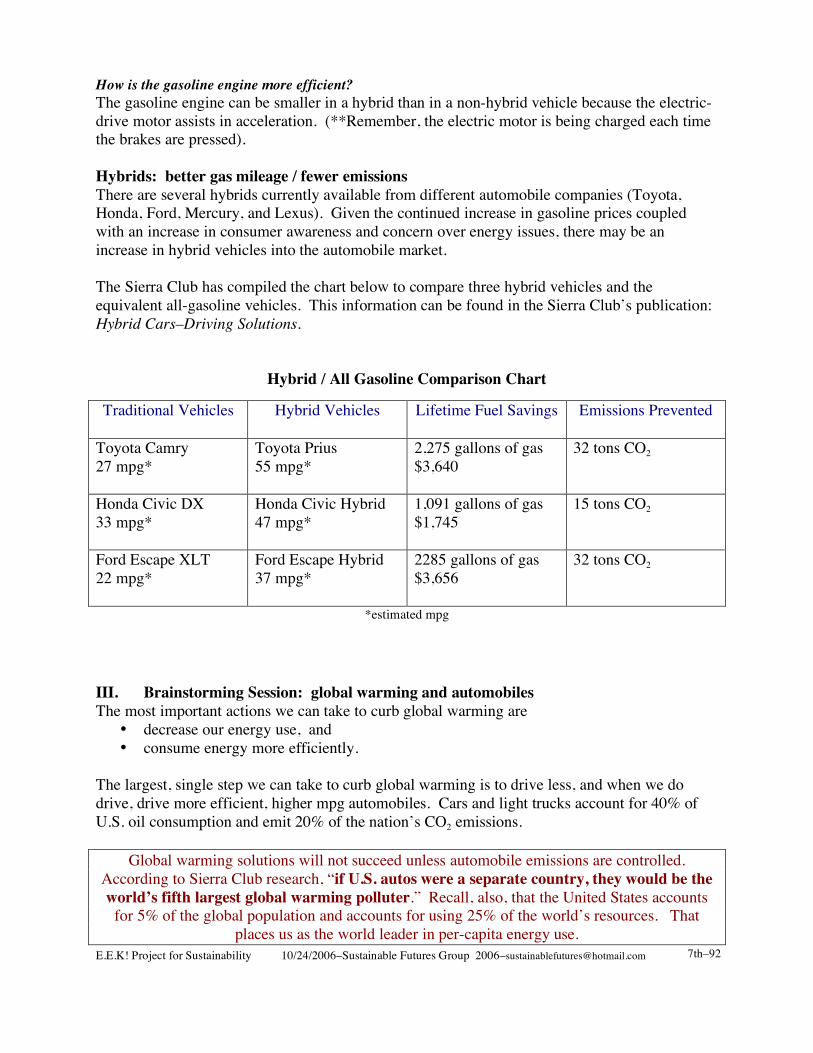
How is the gasoline engine more efficient? The gasoline engine can be smaller in a hybrid than in a non-hybrid vehicle because the electric-drive motor assists in acceleration. (**Remember, the electric motor is being charged each time the brakes are pressed). Hybrids: better gas mileage / fewer emissions There are several hybrids currently available from different automobile companies (Toyota, Honda, Ford, Mercury, and Lexus). Given the continued increase in gasoline prices coupled with an increase in consumer awareness and concern over energy issues, there may be an increase in hybrid vehicles into the automobile market. The Sierra Club has compiled the chart below to compare three hybrid vehicles and the equivalent all-gasoline vehicles. This information can be found in the Sierra Club’s publication: Hybrid Cars–Driving Solutions.
Hybrid / All Gasoline Comparison Chart Traditional Vehicles Hybrid Vehicles Lifetime Fuel Savings Emissions Prevented
Toyota Camry 27 mpg*
Toyota Prius 55 mpg*
2,275 gallons of gas $3,640
32 tons CO2
Honda Civic DX 33 mpg*
Honda Civic Hybrid 47 mpg*
1,091 gallons of gas $1,745
15 tons CO2
Ford Escape XLT 22 mpg*
Ford Escape Hybrid 37 mpg*
2285 gallons of gas $3,656
32 tons CO2
*estimated mpg
III. Brainstorming Session: global warming and automobiles The most important actions we can take to curb global warming are
• decrease our energy use, and • consume energy more efficiently.
The largest, single step we can take to curb global warming is to drive less, and when we do drive, drive more efficient, higher mpg automobiles. Cars and light trucks account for 40% of U.S. oil consumption and emit 20% of the nation’s CO2 emissions.
Global warming solutions will not succeed unless automobile emissions are controlled. According to Sierra Club research, “if U.S. autos were a separate country, they would be the world’s fifth largest global warming polluter.” Recall, also, that the United States accounts
for 5% of the global population and accounts for using 25% of the world’s resources. That places us as the world leader in per-capita energy use.

E.E.K! Project for Sustainability 10/24/2006–Sustainable Futures Group 2006–[email protected]
7th–93
We have a responsibility to make wiser decisions about our daily energy use. We also have a responsibility to embrace the understanding that our personal energy-use decisions have a ripple effect throughout the world. But, the first step is to raise awareness and education about energy issues. Then, we must learn how to navigate making complex decisions in the face of competing, and oftentimes, conflicting desires and goals. Class Exercise: Brainstorming Session Using Balancing and Reinforcing Feedback This final lesson requires synthetic thinking and an understanding of cause and effect. Given that this is an introduction to feedback loops, they will be introduced as simple models without explaining amplification or weighting. Background Information In general, when analyzing complex problems, one strategy is to determine what causes outcomes to be balancing or reinforcing. Essentially, when reinforcing feedback is being given, the situation continues on the same course or action or events. But, if balancing feedback is given, the opposite course of action or events will occur. One example to describe this idea, is the following story: During class, a student yells out at another student. The other student yells a retort in return. This continues, an escalating situation ensues, other students become involved and within a matter of a few minutes there is a highly emotionally charged, angry class of students yelling at one another. This situation would evolve via reinforcing feedback. If the initial student who was yelled at did not respond in kind (yelling back), then the situation might evolve with balancing feedback. The following is another example: There is a small child crying in the supermarket because they want some candy. The parent tells the child they cannot have the candy. (The crying increases). The child then grabs a bag of candy off the shelf. In response, the parent takes the bag of candy away from the child and scolds the child. (The crying increases even more). As both, the child and the parent become increasingly frustrated, the child’s crying becomes stronger and the parent’s frustration becomes stronger. This is an example of a reinforcing feedback loop. There is an initial cause (the child wants candy), then a response (the child cries), and then a reinforcing behavior to the response (the parent denies the child candy). The frustration of the parent and child then begin to reinforce one another and escalate the situation. The situation will not be resolved (the child stop crying) until a different method is taken–diversion about something else by the parent, the parent does not engage in an emotional power struggle with the child, the child decides they no longer want the candy, etc. In other words, all of those tactics would then become balancing to the situation–cause a different result or course of action to the situation.

E.E.K! Project for Sustainability 10/24/2006–Sustainable Futures Group 2006–[email protected]
7th–94
The following symbols are used when discussing feedback–balancing is indicated with a minus (–) and reinforcing with a plus (+): Balancing – Reinforcing + This concept, when first introduced to your class, might be confusing. It is important to note, that the “+” and “–“ signs do not equate with “more” or “less” “better” or “worse”. The following game is a great way to visually describe how the idea of feedback works. This game has been slightly modified from the original found in The Systems Thinking Playbook: Exercises to Stretch and Build Learning and Systems Thinking Capabilities by Linda Booth Sweeney and Dennis Meadows, 1995
Exercise: Living Loops • Physically demonstrate the difference between balancing and reinforcing feedback • Show the difference between open and closed loops • Use a physical activity to engage the students and facilitate understanding • Link physical experience with intellectual analysis • Demonstrate the principle that balancing loops have an odd number of negative (-) links
and reinforcing loops have an even number of negative (-) links • Develop a realization and appreciation that changing one link of a feedback chain can
profoundly change the outcome The Game Supplies: 6-12 players and a group of recorders (active observers) 1 small ball or colorful object that can be easily held in the student’s hand 3x5 cards with a “+” on one side and a “–“ on the other tape How To Play: Game #1: Open Loops: Reinforcing, Balancing, and Mixture
• Choose 6 – 12 students to act out the experiment (the players) • Ask the remainder of the class to be the scientific observers • Ask the players to stand in a line, shoulder to shoulder facing the scientific observers • Ask the scientific observers to sit in front of the line • Give the observers a pencil and paper • The scientific observers role will be to create a visual description (graph) of what they
see the players doing Players
• Tape the cards onto the players with the “+” facing out • Explain that everyone’s left hand is going to be the active hand • Ask the players to open their left hand and hold it out at waist height • Explain that the players’ right hand is passive • Ask them to lightly rest their right hand on the hand of the person to their right • Explain that the signs on the cards indicate the kind of movement required of each
player’s left hand
E.E.K! Project for Sustainability 10/24/2006–Sustainable Futures Group 2006–[email protected]
7th–95
• If a person is wearing a “+” sign, then their hand must move exactly the same as the person on their right
• If a person is wearing a “–“ sign, then their hand must move the opposite as the person on their right
• Demonstrate how far to move their hand up for “+” and down for a “–“ Scientific Observors
• Ask the observers to draw a rectangle on their paper • Then, divide the rectangle in half (draw a line through the middle of the rectangle) • Write a “0” at the middle line, write “10” at the top of the rectangle and “-10” at the
bottom • Explain that the observers will be drawing a behavior-over-time graph
Begin the Game • Try the game with everyone wearing the “+” sign • Try the game with everyone wearing the “–‘ sign • Make sure the observers are recording the data • Look at each graph • Then, randomly have the players change their signs to either “+” or “–“ • Record what happens
Another option: Instead of the students placing their hands on each other, you can have them pass a small ball or other object that is easy to hold. If you use this option, have each student meet their right hand (receiving hand) to the person’s hand on their left (the object will pass down the line from left to right). Game #2: Closed Reinforcing Loop
• Ask the players to create a circle • Reset all the cards to “+” • Initiate by saying you are going to raise your hand 2” • Ask for predictions about where the ball will go • Run the game • Keep the game going until no one can reach any higher
Game #3: Closed Reinforcing Loop
• Keep the cards at “+” • Begin the game by moving your hand 2” down • Run the game • Keep the game going until the ball reaches the floor
DEBRIEF When the circle is created a closed feedback loop is created Ask how the circle is different from the line
E.E.K! Project for Sustainability 10/24/2006–Sustainable Futures Group 2006–[email protected]
7th–96
Game #4: Closed Balancing Loop
• Change 1 person’s card to a “–“ • Keep everyone else’s a “+” • Run the game • Begin the move with 2” down • Stop the game after a few rounds
Game #5: Closed Balancing Loop
• Change 3 player’s cards to a “–“ • Run the game
Game #6: Closed Balancing Loop
• Change ½ of the player’s cards to a “–“ • Run the game • Stop the game after 2 rounds and then begin at another point • Discuss the differences
DEBRIEF
• What happened? Why was the result so different? • How long do you think this system could continue? (the answer is forever)
Global Warming Discussion
• Discuss Project: causes and effects of global warming • What behaviors or actions could act as balancing feedback? • What behaviors or actions could act as reinforcing feedback? • How does feedback affect a situation?
CLASS EXERCISE: This final exercise is an opportunity for the class to work together and extrapolate the basic information they have read about global warming. Once the students have a basic working knowledge of the causes and effects of global warming, introduce the idea of feedback loop diagrams to the class. Essentially, this is a strategy for organizing information that involves different effects that different strategies or information may have on an initial problem. This is a particularly useful strategy for discussing dynamic situations / problems that have multiple consequences and / or multiple causes–which are most real-world problems. Given that different groups of students may be more or less versed on the causes and effects of global warming, you may want the students to delve further into global warming research given that the above information is a very quick overview of the issues. One suggestion would be to show the class the An Inconvenient Truth DVD. This film is an excellent overview to the issues (historically and at hand) and delves into extrapolating scientific information on global warming to hypothesize future global trends.

E.E.K! Project for Sustainability 10/24/2006–Sustainable Futures Group 2006–[email protected]
7th–97
Question:
• What is the relationship between a change in the earth’s temperature, snow and ice cover, and driving automobiles?
Diagrams:
• Create diagrams of feedback loops that are reinforcing, and; • Create diagrams of feedback loops that are balancing.
IV. Assessment Overview for the Module
Assessment: Using the information from Lesson 9 on global warming and this lesson, help facilitate the class to create the culminating project for the module: creating feedback loop charts that synthesize their learning comprehension. This final lesson will help determine the student’s level of cognitive, emotional, and practical understanding of the materials and provide a final assessment tool.
Now is the time to synthesize the students’ learning from the entire Transportation module. They have researched and discussed topics in transportation history, and hopefully have a basic understanding of: how gasoline is produced, how an automobile engine works, global warming, automobile emissions, and hybrid vehicles. They have also hopefully learned strategies of how to work in small groups effectively, organize information using word maps, extrapolate data using back-of-the-envelope calculations, and make hypotheses for potential outcomes. Conceivably, they also have a broader understanding of how the automobile has and continues to play a significant role in shaping the future of the quality of life in the United States. And, how, something as seemingly simple as driving a car, may have a devastating affect on the future of the United States and energy issues around the globe. Please refer to the assessment section for further module assessment strategies.

E.E.K! Project for Sustainability 10/24/2006–Sustainable Futures Group 2006–[email protected]
7th–98
Student Hand-out / Overhead #1: Average U.S. driving habits and gasoline consumption
Average U.S. driving habits and gasoline consumption Write the following statistics either on the front board of the classroom or have the class view as an overhead. Have the students read the statistics out loud. Many students may have difficulty in grasping the size and significance of the numbers. If this is the case, introduce the Interpreting the Statistics section and this will both break down the numbers into smaller chunks and increase the numbers by size. Consider the following statistics:
• U.S. population is approximately 295,000,000 and growing (censusus.gov) • Approximately 243,000,000 passenger cars are on the road in the U.S. (2006,
wikipedia.org) • U.S. consumes about 20 million barrels of crude oil per day (eia.gov) • U.S. consumes approximately 400 million gallons of gasoline every day (eia.gov) • Average CO2 emissions per gallon of gasoline is 22.2 lbs./gallon • U.S. drivers average 15,000 miles of driving per year (aaa.org) • U.S. average automobile fuel economy is 20 mpg (eia.gov) • Average U.S price for a gallon of gasoline is $2.40 (2006)
Class Exercise: Interpreting the Statistics Either in small groups or as a whole class, have the students compute the following figures based on the above statistics:
1. Approximately how many miles are driven in the United States per year? Per day?
2. How many gallons of gasoline are consumed in the United States per week? Per month?
Per year?
3. Approximately how many lbs. of CO2 are emitted into the atmosphere in the U.S. per day from gasoline? Per week? Per month? Per year?
4. Approximately how many gallons of gasoline are consumed per person in the U.S. daily? 5. Approximately how much money is spent on gasoline per year per car?