dpisciencejanewright.pbworks.comdpisciencejanewright.pbworks.com/f/grade+7+goal+3+a… · web...
TRANSCRIPT

I. Grade Level/Unit Number: 7th grade/Unit 3
II: Unit Title: Weather & Atmosphere
III. Unit Length:34 days
IV. Essential concepts (major goals & learning outcomes)
What do you think air is made of?
What is the composition of air?
Is ozone good or bad for you, or both?
What essential gases make up the atmosphere?
What are the characteristics of each layer of the atmosphere?
What are point sources air pollution?
What are and non-point sources of pollution?
How does weather affect our daily lives?
How is weather predictable?
What are the various ways we study weather?
How is air quality monitored and measured?
How is air quality communicated to the public?
How do humans impact air quality?
What are some ways to reduce air pollution?
What are the financial and economic trade-offs affecting air quality?
How does technology help us better predict weather conditions?
How do humans impact the atmosphere and natural resources?
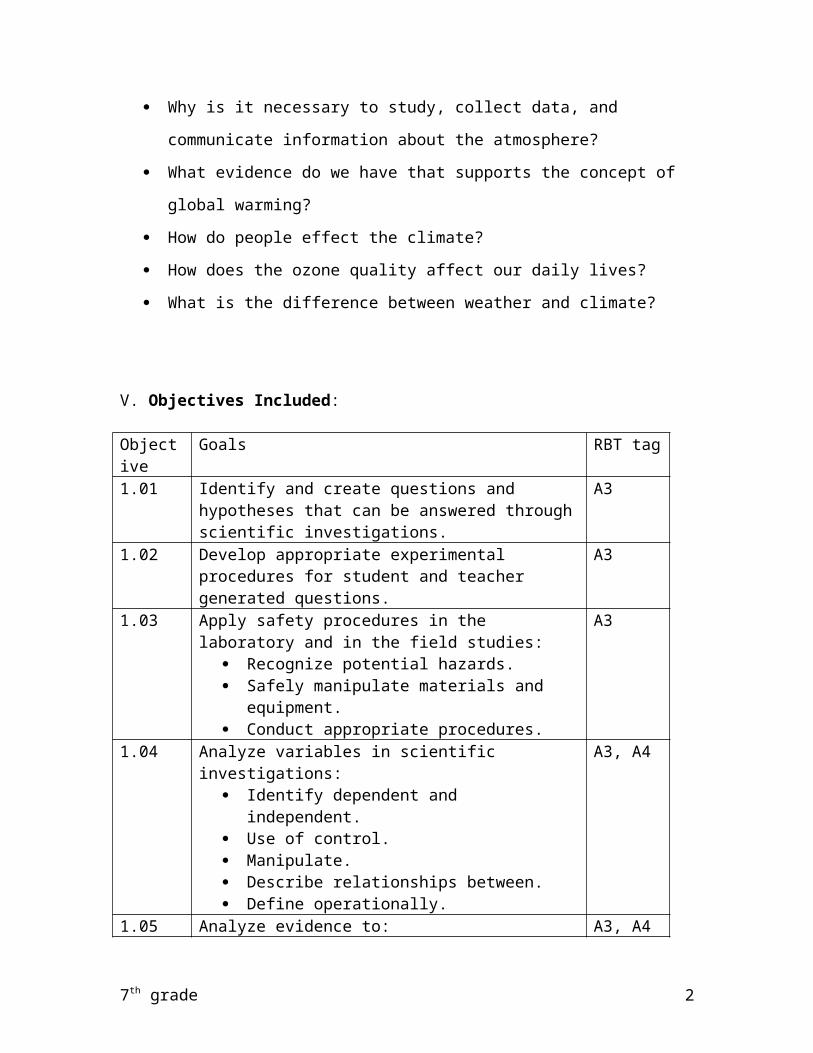
Why is it necessary to study, collect data, and communicate information
about the atmosphere?
What evidence do we have that supports the concept of global warming?
How do people effect the climate?
How does the ozone quality affect our daily lives?
What is the difference between weather and climate?
V. Objectives Included:
7th grade 1
Objective
Goals RBT tag
1.01 Identify and create questions and hypotheses that can be answered through scientific investigations.
A3
1.02 Develop appropriate experimental procedures for student and teacher generated questions.
A3
1.03 Apply safety procedures in the laboratory and in the field studies:
Recognize potential hazards. Safely manipulate materials and equipment. Conduct appropriate procedures.
A3
1.04 Analyze variables in scientific investigations: Identify dependent and independent. Use of control. Manipulate. Describe relationships between. Define operationally.
A3, A4
1.05 Analyze evidence to: Explain observations. Make inferences and predictions. Develop the relationship between evidence
and explanation.
A3, A4
1.06 Use mathematics to gather, organize, and present quantitative data resulting from scientific investigations:
Measurement. Analysis of data. Graphing. Prediction models.
A2, A3
1.08 Use oral and written language to: Communicate findings. Defend conclusions of scientific investigations.
A6
1.09 Use technologies and information systems to Research. Gather and analyze data. Visualize data. Disseminate finding to others.
A3
1.10Analyze and evaluate information from a scientifically literate viewpoint by reading, hearing and/or viewing:
Scientific text Articles Events in the popular press
A4, A5
3.02 Describe properties that can be observed and measured to predict air quality
Particulate matter.
B3
7th grade 2

Ozone.3.03 Conclude that the good health of environments and
organisms requires: The monitoring of air quality. Taking steps to maintain healthy air quality. Stewardship.
B2, B3
3.04 Evaluate how humans impact air quality including: Air quality standards. Point and non-point sources of air pollution in
North Carolina. Financial and economic trade-offs. Local air quality issues.
B3, B4, B5
3.05 Examine evidence that atmospheric properties can be studied to predict atmospheric conditions and weather hazards.
Wind speed and direction Temperature Humidity Air pressure Precipitation Tornados Hurricanes Floods Storms
C2, C3
3.06 Assess the use of technology in studying atmospheric phenomena and weather hazards:
Satellites. Weather maps. Predicting. Recording. Communicating information about conditions.
A2, A3, A4
VI. English Language Development (ELD)/ Exceptional Children (EC) Modifications appear in gray boxes throughout the unit. Additional handouts and diagrams will appear after each unit. ELD modifications are mainly for novice low- intermediate low Limited English Proficient (LEP) students.If not present then it will be forthcoming!
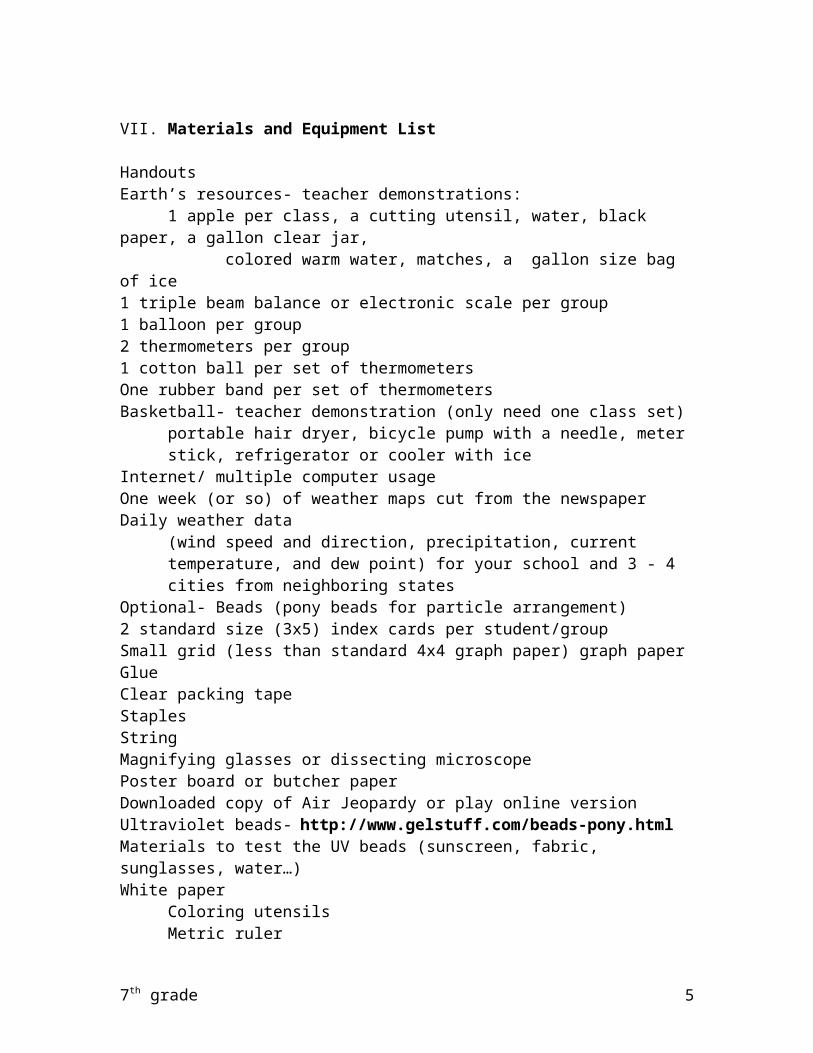
VII. Materials and Equipment List
HandoutsEarth’s resources- teacher demonstrations:
1 apple per class, a cutting utensil, water, black paper, a gallon clear jar, colored warm water, matches, a gallon size bag of ice1 triple beam balance or electronic scale per group1 balloon per group2 thermometers per group1 cotton ball per set of thermometersOne rubber band per set of thermometers
7th grade 3

Basketball- teacher demonstration (only need one class set)portable hair dryer, bicycle pump with a needle, meter stick, refrigerator or cooler with ice
Internet/ multiple computer usageOne week (or so) of weather maps cut from the newspaperDaily weather data
(wind speed and direction, precipitation, current temperature, and dew point) for your school and 3 - 4 cities from neighboring states
Optional- Beads (pony beads for particle arrangement)2 standard size (3x5) index cards per student/groupSmall grid (less than standard 4x4 graph paper) graph paperGlueClear packing tapeStaplesStringMagnifying glasses or dissecting microscopePoster board or butcher paperDownloaded copy of Air Jeopardy or play online versionUltraviolet beads- http://www.gelstuff.com/beads-pony.htmlMaterials to test the UV beads (sunscreen, fabric, sunglasses, water…)White paper
Coloring utensilsMetric rulerA protractor, compass, jar lid, or circle template
Demonstration materials:Baby food jar with two large diameter straws 1000 ml beaker filled with ice waterWarm waterFood coloring (blue and green work best)
Access to the internet
VIII. Big idea- Atmosphere
The atmosphere is a mixture of gases, such as nitrogen, oxygen, argon, carbon dioxide, trace gases and water vapor. The amount of each gas in the mixture is usually very constant from the surface of the planet up to the top of the troposphere. These gases are constantly being used and renewed by the processes of respiration, photosynthesis, evaporation and condensation, the weathering of rock, and the decay of organic matter.
The atmosphere has different properties at different elevations and different locations around the earth. The air pressure is less on the top of mountains (higher elevation) than in valleys. At the equator the atmosphere is warmer; at the poles it is cooler. The uneven heating of land and water causes a
7th grade 4
rising and sinking of warm and cool air masses, creating convection currents and causing winds.
Five layers make up the atmosphere: the troposphere, stratosphere, mesosphere, thermosphere, and exosphere. Each of these layers has unique properties. Weather occurs in the troposphere and is the physical condition of the atmosphere at a specific place at a specific time. Fronts, global wind systems, atmospheric pressure changes and many other factors influence the weather. Major atmospheric activities such as thunderstorms, tornadoes and hurricanes affect humans and can result in huge natural disasters.
Technology has greatly influenced the ease and accuracy of predicting weather. Weather data at thousands of locations can be gathered instantaneously and applied to weather prediction models to produce weather maps. Weather maps show air masses, fronts, and pressure centers, helping to predict approaching weather. Weather forecasting has been improved by the additional data gained from Doppler radar units and satellites.
Air quality affects the quality of life for all organisms on Earth. Natural and human activities greatly influence the quality of the air. Technology has allowed us to measure the characteristics of the air and to monitor how air quality changes. This information helps us make informed decisions to protect air quality and the risks to organisms and human health.
The cumulative ecological effects of global ozone depletion, air pollution, increased particulate matter, acid rain, and global warming concern the entire global community. Studies have shown that human activity influenced and impacted the global ecosystem.
IX. Notes to the teacher/storyline
The first lesson begins with an introduction to the atmosphere, its composition and properties of each layer. Students will begin the lesson by investigating ultraviolet rays using UV beads. Throughout the lesson, they will learn about the three ways energy can be transferred and apply each to how it impacts weather. Finally, students will look at the layers of the atmosphere and create a scale model illustrating each layer.
The second lesson focuses on atmospheric conditions and weather hazards. It begins with an overview of clouds and several teacher demonstrations, which will lead into a discussion on stewardship and the effects of pollution. Students will complete several labs on predicting if air has mass and its behavior under certain conditions. The lesson will be concluded with a discussion of weather conditions and hazards. Students will collect daily readings of relative humidity and create a graph illustrating the data. As a culminating activity, several project choices and foldable options are included.
7th grade 5

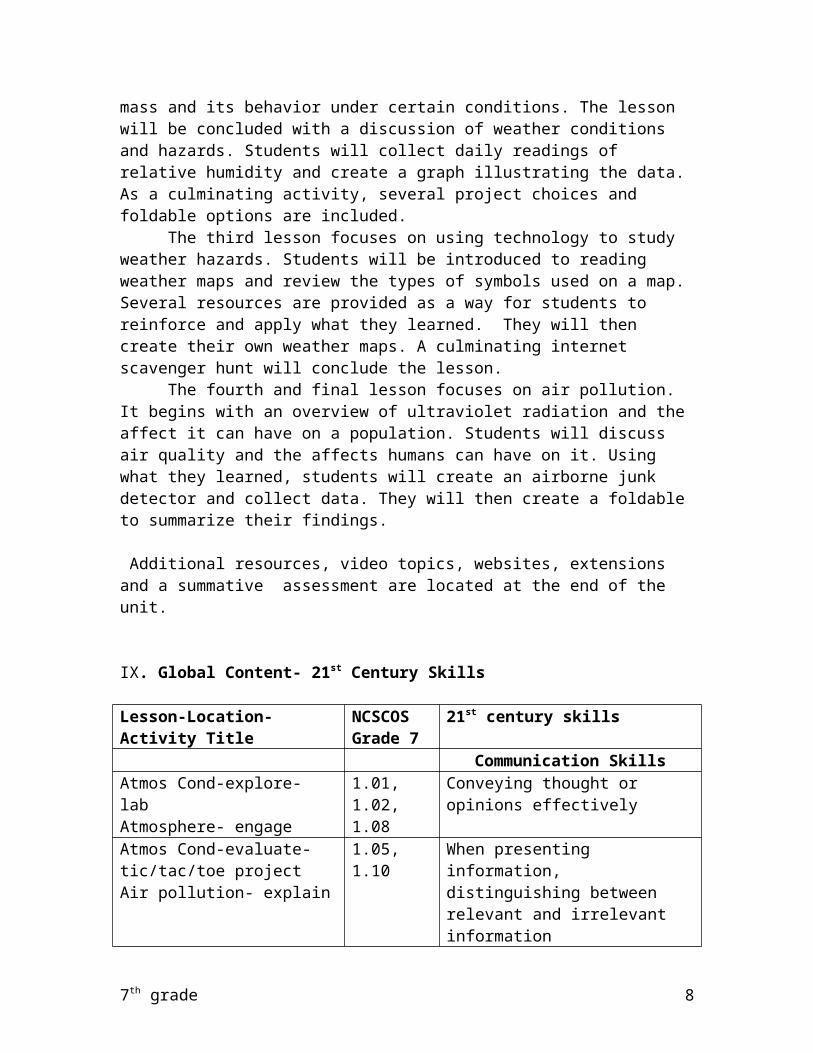
The third lesson focuses on using technology to study weather hazards. Students will be introduced to reading weather maps and review the types of symbols used on a map. Several resources are provided as a way for students to reinforce and apply what they learned. They will then create their own weather maps. A culminating internet scavenger hunt will conclude the lesson.
The fourth and final lesson focuses on air pollution. It begins with an overview of ultraviolet radiation and the affect it can have on a population. Students will discuss air quality and the affects humans can have on it. Using what they learned, students will create an airborne junk detector and collect data. They will then create a foldable to summarize their findings.
Additional resources, video topics, websites, extensions and a summative assessment are located at the end of the unit.
IX. Global Content- 21st Century Skills
Lesson-Location-Activity Title
NCSCOS Grade 7
21st century skills
Communication SkillsAtmos Cond-explore- labAtmosphere- engage
1.01, 1.02, 1.08
Conveying thought or opinions effectively
Atmos Cond-evaluate-tic/tac/toe projectAir pollution- explain
1.05, 1.10 When presenting information, distinguishing between relevant and irrelevant information
Atmos Cond-evaluate-tic/tac/toe projectAir pollution- explain
1.04, 4.02, 4.03, 4.06, 4.07, 4.08,
Explaining a concept to others
Atmos Cond-evaluate-tic/tac/toe project
Interviewing others or being interviewed
Computer KnowledgeAtmos Cond-ext-excel graphUsing Tech- NC Desk lesson
1.09 Using word-processing and database programs
Atmos Cond-evaluate-tic/tac/toe project
1.07 Developing visual aides for presentations
Atmosphere-extension-excelUsing Tech- NC Desk lesson
1.08 Using a computer for communication
Atmos Cond-evaluate-tic/tac/toe projectUsing Tech- NC Desk lesson
2.04 Learning new software programs
Employability Skills
7th grade 6

Atmos Cond-ext-excel graphAir pollution- explain
1.02 Assuming responsibility for own learning
Atmos Cond-ext-excel graph Persisting until job is completedAtmos Cond-evaluate-tic/tac/toe project
1.03 Working independently
Tech-elaborate-meteorologistAtmosphere- engage
Developing career interest/goals
1.08 Responding to criticism or questions
Information-retrieval SkillsTech-extension-satellite imag.Using Tech- NC Desk lesson
1.09 Searching for information via the computer
1.08 Searching for print informationAtmosphere- engage 1.09, 2.02 Searching for information using
community membersLanguage Skills - Reading
Atmos Cond-evaluate-tic/tac/toe projectUsing Tech- NC Desk lesson
1.03, 1.05 Following written directions
Lesson-Location-Activity Title
NCSCOS Grade 7
21st century skills
Atmos Cond-ext-foldableAir pollution- explain
1.10 Summarizing main points after reading
Atmos Cond-evaluate-tic/tac/toe project
1.07, 1.08 Locating and choosing appropriate reference materials
Atmos Cond-evaluate-tic/tac/toe project
1.10 Reading for personal learning
Language Skill - WritingAtmos Cond-explore-lab Using language accuratelyAtmos Cond-engage-map 1.07, 1.08,
1.10Organizing and relating ideas when writing
Atmos Cond-explore-tic proj 1.10 Proofing and EditingAir pollution- explain 2.04 Synthesizing information from
several sourcesAll projects, & powerpoints 1.10 Documenting sources
2.03 Developing an outlineAtmosphere- engage 1.05 Writing to persuade or justify a
positionAtmosphere- engage 1.09 Creating memos, letters, other
forms of correspondenceTeamwork
7th grade 7
Air pollution- explain 1.01, 1.05 Taking initiativeAir pollution- explainAir pollution- evaluate
Working on a team
Thinking/Problem-Solving SkillsAtmosphere- engage 1.02 Identifying key problems or
questionsAtmos Cond-evaluate-tic/tac/toe projectAtmos Cond-explore-lab
1.05, 1.07, 1.10, 2.03, 4.04
Evaluating results
Atmosphere- engage 1.06, 4.01, 4.05,
Developing strategies to address problems
Atmosphere- engage 1.09 Developing an action plan or timeline
I. Grade Level/Unit Number: 7th grade Unit 3
II: Unit Title: Structure of the Atmosphere
III. Unit Length: 7 days
IV. Objectives Included:
1.01, 1.02, 1.03, 1.04, 1.05, 1.06, 1.08, 1.09, 1.10, 3.01, 3.02
V. Materials Needed:HandoutsUltraviolet beads (enough for each student to have several)String for the beadsDifferent types of materials to test the beads for a class project
(sunglasses, sunscreen with various SPF’s, water, construction paper, various materials, tissues, mirror, light bulbs, Ziploc, jar…)
White paperColoring utensilsMetric rulerA protractor, compass, jar lid, or circle templateOne set of agree and disagree signsDemonstration materials:
Baby food jar with two large diameter straws 1000 ml beaker filled with ice waterWarm waterFood coloring (blue and green work best)
VI. Notes to Teacher:
7th grade 8

The following website can be used to order ultra violet beads. You may want to give students several on a string or just 1 or 2 to use for the investigation. They can do the lab at home or you can investigate as a class. Students can informally discuss their findings and/or write a lab report. Magic Ultraviolet beads- http://www.gelstuff.com/beads-pony.html
Days 1- 2Engage:Give students a few of the ultraviolet beads or a bracelet they can wear or add to their book bag. Take students outside and allow them to investigate what the beads are and what they do. Do not tell them ahead of time that the beads are triggered by ultraviolet light. Once you expose the beads to sunlight/ UV light they will turn bright colors. Allow students time to see the change. After investigation they should determine that the beads did not change color inside, but the beads changed color when exposed to sunlight. Explain the purpose of the assignment.Students can complete the list of tasks as a class or give several beads to each student and assign tasks to be completed for homework.
TASK: Develop or design several experiments to test what will cause the beads to change color and what will cause them to stay the same. Each student must carry out 5 inquiry investigations. You may assign them any from the list below or allow them to create their own. Students can complete the task at home or as a class. You can also divide the choices and explore several during one class period.
a. Do the beads change when in the sun, but under sunglasses?b. Do the beads change when submersed in sunscreen?c. Test the various SPF’s of sunscreen and the affect on the beads.d. Do the beads change when the sky is overcast or cloudy?e. Do the beads change when it is raining? (sprinkling vs. heavy rain)f. Do the beads change when in the sun, but submersed under water?g. Do the beads change inside a car? Do tinted windows affect the
results?h. Do the beads change differently when on different colored surfaces,
such as bright, dark or black construction paper?i. Do the beads change differently when on different materials, such as
cotton, fleece, metallic, black, vinyl, felt….?j. Do the beads change under soil, or in a bush, or under a shaded tree?k. Do the beads change when placed under a tissue? If so, measure how
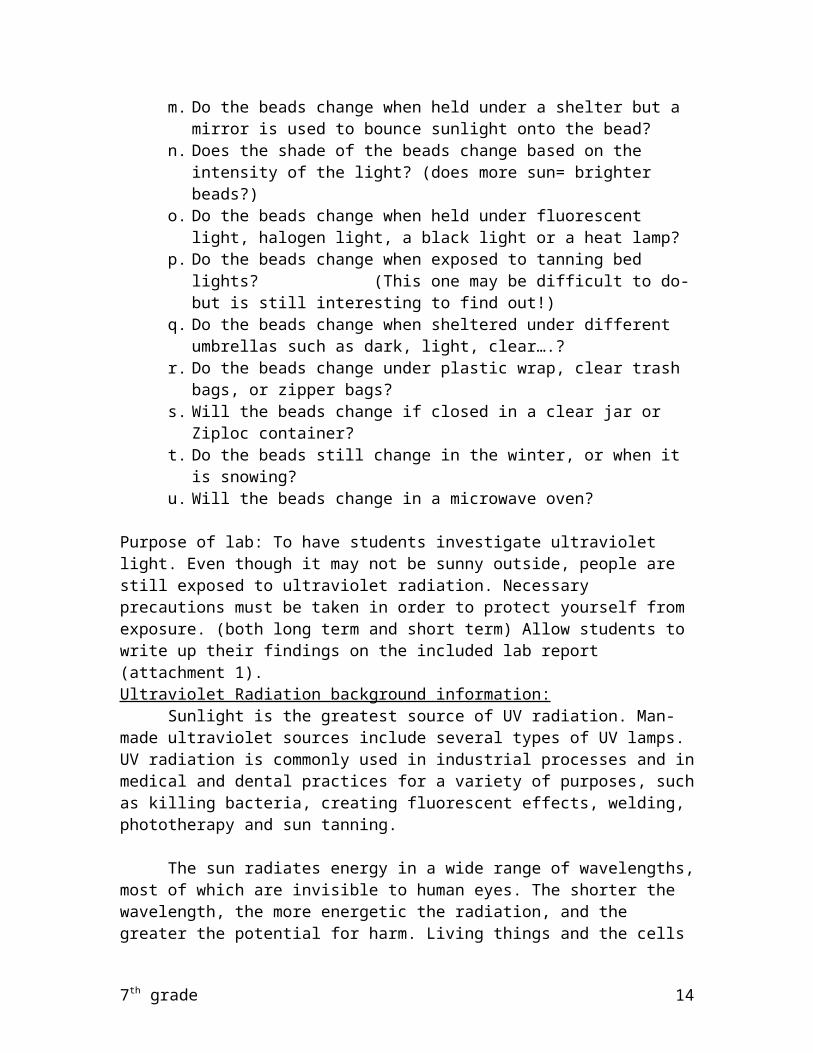
many tissues it takes before no change occurs.l. Do the beads change when kept inside but held up to a window?m. Do the beads change when held under a shelter but a mirror is used to
bounce sunlight onto the bead?
7th grade 9

n. Does the shade of the beads change based on the intensity of the light? (does more sun= brighter beads?)
o. Do the beads change when held under fluorescent light, halogen light, a black light or a heat lamp?
p. Do the beads change when exposed to tanning bed lights? (This one may be difficult to do- but is still interesting to find out!)
q. Do the beads change when sheltered under different umbrellas such as dark, light, clear….?
r. Do the beads change under plastic wrap, clear trash bags, or zipper bags?
s. Will the beads change if closed in a clear jar or Ziploc container?t. Do the beads still change in the winter, or when it is snowing?u. Will the beads change in a microwave oven?
Purpose of lab: To have students investigate ultraviolet light. Even though it may not be sunny outside, people are still exposed to ultraviolet radiation. Necessary precautions must be taken in order to protect yourself from exposure. (both long term and short term) Allow students to write up their findings on the included lab report (attachment 1).Ultraviolet Radiation background information:
Sunlight is the greatest source of UV radiation. Man-made ultraviolet sources include several types of UV lamps. UV radiation is commonly used in industrial processes and in medical and dental practices for a variety of purposes, such as killing bacteria, creating fluorescent effects, welding, phototherapy and sun tanning.
The sun radiates energy in a wide range of wavelengths, most of which are invisible to human eyes. The shorter the wavelength, the more energetic the radiation, and the greater the potential for harm. Living things and the cells they are made of are protected from large amounts of UV radiation by a chemical called ozone. A layer of ozone in the upper atmosphere absorbs UV radiation and prevents most of it from reaching the Earth. Without the layer of ozone in the stratosphere to protect us from excessive amounts of UV-B radiation, life as we know it would not be the same. Ozone can be good or bad, depending on where it is found.Good ozone (stratospheric ozone)- shields us from the suns UV rays. It is found 10-30 miles above Earth’s surface in the stratosphere.Bad ozone (tropospheric ozone)- found in the lower atmosphere, near the ground, is formed by cars, power plants, chemical plants and other sources that react in the presence of sunlight. It is a greater concern in areas with higher temperatures and higher pollution.
Who is at the highest risk for damage from the ozone?1. Children who spend a lot of time playing outdoors in the summer.2. Anyone who has asthma or other respiratory disorders.3. Adults of all ages who work vigorously outside.
7th grade 10

Ozone is like sunburn for the lungs. The only difference is that the lungs have no nerves, so you can’t feel the pain.
If you want to discuss ozone, can visit the following website and request a class set of the booklet titled Ozone Alert. It is also in a PDF file so you can print it out or project it on an overhead. It shows the direct effect that ozone (good and bad) has on the environment and the human body.http://www.niehs.nih.gov/health/scied/teachers/lesson.cfm#Booklets
Discuss with the students that radiation is good because it keeps Earth warm. Some UV exposure is essential for good health because it stimulates vitamin D production in the body. In medical practice, UV lamps are used for treating psoriasis and for treating jaundice in newborn babies.
However, ultraviolet radiation can also be harmful because too much exposure can lead to cancer. Possible eye damage can result from high doses of UV light, particularly to the cornea, which is a good absorber of UV light. Even careful tanning kills skin cells, damages DNA and causes permanent changes in skin connective tissue, leading to wrinkle formation in later life. (There is no such thing as a safe tan.)Day 3Explore:Ask students- What is air?Accept all possible answers. Show the 2-minute explanation of what makes up air (link below). The video summarizes the properties of air and says, “it is similar to us living on the bottom of an ocean of air because it is constantly pushing down on us. It creates pressure, and even though you cannot see air, you can see the affects of it”. It will present the characteristics of air that students may not have known.
What is air made up of?-The clip is from: http://www.videojug.com
Direct link: http://www.videojug.com/expertanswer/fun-science-space/what-is-air-made-up-of
Ask students: What gases are in the air?They probably will quickly answer “oxygen,” because we need it to breathe, and carbon dioxide, because plants convert it into oxygen. Introduce them to the word atmosphere - a blanket of air that surrounds the earth. Air is made up of 78% nitrogen, 21% oxygen and 1% trace gases (the 1% is a combination of several gases). We breathe air that is 21% oxygen, and we require oxygen to breathe. (You might think that breathing 100% oxygen would be good for us, but actually it can be very harmful. It can cause nausea, dizziness and chest pains.)
The atmosphere is divided into distinct layers. Introduce students to the main 4 layers: troposphere, stratosphere, mesosphere and thermosphere.
7th grade 11

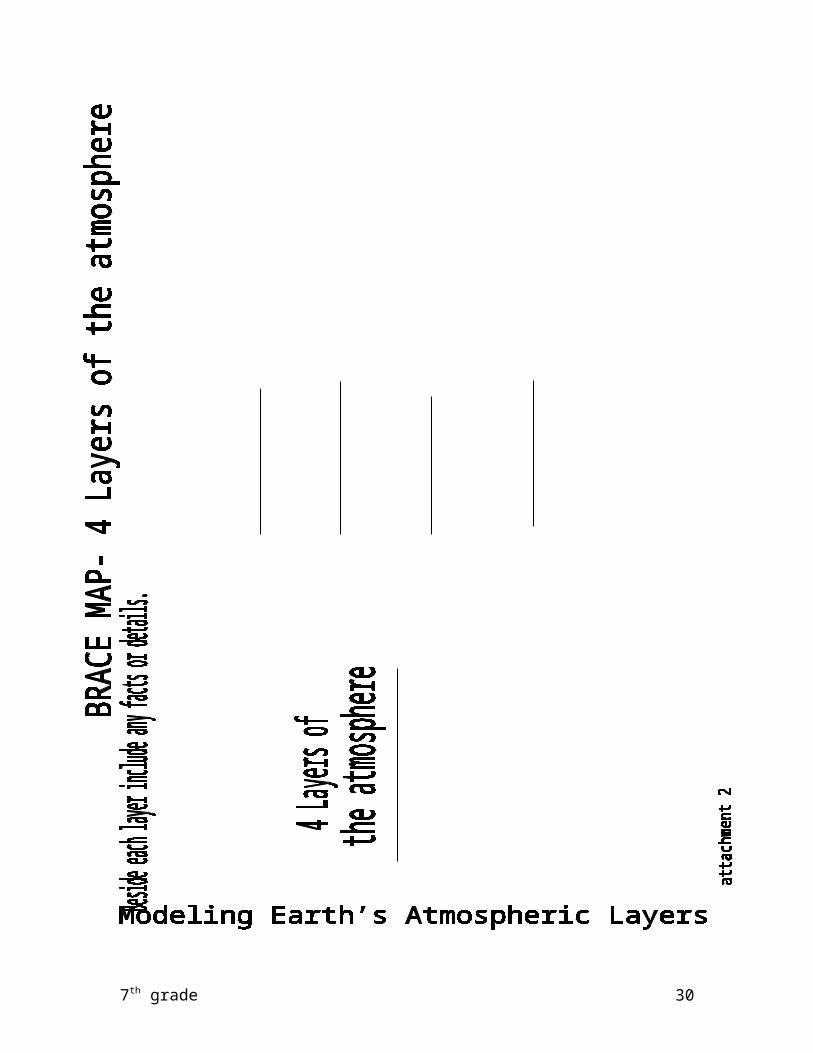
Allow students to complete the 4 layers of the atmosphere brace map. The 4 layers are listed to the left and on the lines to the right they should list two properties or characteristics of that layer. At the bottom there is a square to draw a picture so they remember something about each layer (attachment 2). They can use their text or research materials to fill in the blanks. Go over the answers as a class and allow students to keep them as notes or complete as a graded assignment.
The upper layer of the atmosphere, the exosphere, is not included in the brace map; it is the layer beyond the thermosphere that includes space.
Sample student answers for the brace map: troposphere- layer nearest Earth, where weather occurs and airplanes fly, temperature drops as altitude increases, where people live, known as lower layer of atmosphere
stratosphere- where most jets fly, where the ozone layer is found, atmosphere is drier, ozone here absorbs and scatters UV radiation
mesosphere- called the middle atmosphere, it is the coldest layer of the atmosphere, radio waves are reflected to Earth and meteors burn up in this layer, temperature continues to decrease with altitude
thermosphere- temperatures can be very hot in this layer, known as upper atmosphere, temperature increases with altitude- it is the hottest layer, aurora lights occur here, may also be called the ionosphere
The website -AccuWeather.com Videos- has a variety of weather related clips. Once you have accessed the site, choose a weather video from the segments at the bottom of the screen.
Below is the direct link to the AccuWeather.com video :http://www.accuweather.com/media-player.asp?partner=accuweather&myadc=0&traveler=0&vidcode=undefined&issub=undefined&subindex=undefined&adfirst=undefined
Day 4To check for understanding thus far, ask students the following agree or disagree questions. You can make it more challenging by having them correct the statements they disagree with. Post the word AGREE on one side of the room and the word DISAGREE on the other. Everyone starts in the middle of the room. After you ask the question, instruct students to move to the side of the room that supports their opinion. No one may stay in the middle. Students can use their brace map for help if needed.
1. We live in the troposphere. (AGREE)
7th grade 12

2. Radio waves travel in the mesosphere. (AGREE)
3. There are 7 main layers of the atmosphere
(DISAGREE- there are 4 main layers in the atmosphere)
4. The exosphere (layer 5) is commonly called space. (AGREE)
5. All weather occurs in the stratosphere.
(DISAGREE- weather occurs in the troposphere)
6. The hottest layer of the atmosphere is the troposphere.
(DISAGREE- warmest layer is the thermosphere)
7. The mesosphere is the coldest layer of the atmosphere. (AGREE)
8. The ozone is found in the thermosphere.
(DISAGREE- ozone is found in the stratosphere)
9. Temperature gets colder as you move higher away from the Earth. (AGREE)
10. The main component of air is oxygen. (DISAGREE- it is nitrogen)
Explain:Reinforce the concept of the layers of the atmosphere. Students can complete the Modeling Earth’s Atmospheric Layers scale activity. (attachment 3) Students can complete it in individually in class, in small groups or as a homework assignment. A grading rubric is included as attachment 4. You can easily assess what they learned on the previous day’s lesson. Students or groups will need butcher paper (bulletin board), about 3 square feet and coloring utensils.
Day 5When discussing the layers of the atmosphere, you might have mentioned the following two statements –
As altitude increases, air pressure decreases.As altitude increases, temperature decreases.
This means, as you go higher there is less pressure. As you go higher it also gets colder.To show the effect this directly has on the body go to unitedstreaming.com and search: Science Investigations: Life Science: Investigating Human BiologyShow the clip- Respiration at high elevations (8 min)
This video shows the effect that high elevations can have on the density of the air we breathe.
For a direct link to the clip, visit:
7th grade 13
http://streaming.discoveryeducation.com/search/assetDetail.cfm?guidAssetID=1b8e8b22-cea0-476f-b858-7771a5a4e2c0&tabDisplay=myContent
After the video, discuss: Why is the air thinner at higher elevations? Because there is less air pressure and the molecules are spread farther from each other. When at higher elevations you can take the same amount of air in with one breath, but you have fewer oxygen molecules in that breath. This can lead to altitude sickness.
As altitude increases, air pressure decreases.As altitude increases, temperature decreases.
Revisit the statement presented at the beginning of class. Allow students to discuss what each statement means. Clarify any misconceptions they may have. It may be necessary to first go over a few vocabulary words.
Ask students: what does altitude or elevation mean? It is the height above sea level. As you move up from sea level your altitude is increasing.
Air pressure refers to the weight of air that pushes on all things. Air pressure is greatest at sea level because it has the weight of the whole atmosphere on it. As you move up from sea level the amount of air pushing down decreases.
Draw the mountain picture on the board or overhead when discussing the questions.
1. Where is altitude or elevation greatest? B2. Where is air pressure greatest? A3. Where does air have less mass? B4. Where are oxygen molecules farther apart? B5. Where is the temperature the coldest? B6. Where would air seem the heaviest? A7. Where might a hiker have the most difficulty breathing? B8. If air pressure is constantly pushing down why doesn’t it crush things such as a tin can or hollow objects? Because the air is pushing in all directions and is balancing out.9. As you move toward sea level, from B to A, what will happen to the air pressure and the air temperature? The air pressure and temperature will both increase and become greater.
For additional practice with the concepts of altitude and temperature, have students solve the following math problems.
7th grade 14

As altitude increases, temperature decreases. At higher altitudes the air is thinner and colder than at lower altitudes. The air drops 3º for every 1,000 feet of altitude above sea level. (This rule is not accurate for altitudes above 40,000 ft)
Calculate the temperature at each altitude given.Go over the chart to check that students calculated the correct answer.(answers are rounded)
Temperature Altitude Temperature @ altitude32º 1,000 feet 29º47º 3,300 feet 37º66º 2,600 feet 58º76º 39,999 feet -44º21º 16,900 feet -29º
For a follow-up, ask students to write a summary comparing the effect that altitude has on air pressure. Make sure to explain what each word means so that others can fully understand the explanation. Each written word is worth 10 cents. While explaining their answer they are to spend between $2.60-$3.00. Attachment 5 contains a piggy bank for them to write their summary inside.
Day 6Elaborate:Energy is transferred between the earth's surface and the atmosphere by conduction, convection, and radiation. Students may not be familiar with the terms but may be able to understand with a few real-world connections.The following is a good lead-in to convection and currents, either air or water. To help students tie in to real world situations, discuss where the coldest water in the swimming pool is always found (at the bottom).Ask students why? Because the density of cold water is greater than the density of warm water.
Ask: If you put a cold pot of water on the stove, what happens as the pot is heated?The bottom of the pot (the part touching the burner) will become hot. This heats the water in the bottom of the pot and since hot air/hot water rises it would then move to the top of pot of water. The bottom layer of water (now heated) will then be pushed to the water in the top. This circulation continues until the entire pot boils. This is an example of convection currents. This principal can also be applied to air.
7th grade 15

The following is a teacher demonstration that will reinforce the movement of air and or water based on its temperature difference.
Materials: Baby food jar with two large diameter straws inserted through the top and sealed
as shown below1000 ml beaker filled with ice waterWarm waterFood coloring (blue and green work best)
Place two drops of food coloring into the bottom of the baby food jar. Fill the jar with warm/hot water and cover with the altered cap. Place the baby food jar apparatus into the beaker of ice water. Have the students record what occurs and why.
Demonstration diagram:
The following terms can be for teacher review and to reinforce vocabulary for students. Later in the unit, students will create a foldable about these terms.
Conduction is the process by which heat energy is transmitted through contact with close-by molecules. Some solids, such as metals, are good
7th grade
straws
Jar lid
Baby Food Jar
16

conductors of heat while others, such as wood, are poor conductors. Air and water are poor conductors.
Since air is a poor conductor, most energy transfer by conduction occurs right at the earth's surface. At night, the ground cools and the cold ground conducts heat away from the adjacent air. During the day radiation from the sun heats the ground, which heats the air next to it by conduction.
Convection transmits heat by transporting groups of molecules from place to place within a substance. Convection occurs in fluids such as water and air, which move freely.
In the atmosphere, convection includes rising and sinking air masses. This distributes heat and moisture throughout the atmosphere and contributes to the development of clouds and storms.
Radiation is the direct transfer of heat energy. Energy travels from the sun to the earth by electromagnetic waves.
The following is an example that students can relate to, incorporating all three types of energy transfer.
There are three ways to cook popcorn.
1. Put oil in the bottom of a pan. Cover the bottom of the pan with popcorn kernels. Place the pan on the stove and turn on the burner to medium heat. Cover the pan with a lid. Periodically shake the pan so the kernels move around in the oil. (Heat from the stove burner is transferred through the pan heating the popcorn.) This is an example of conduction.
2. Obtain an electric popcorn popper. Place the popcorn kernels in the popper. Plug in/turn on the popper. (Hot air will transfer heat to the kernels, making them expand and pop.) This is an example of convection.
3. Microwave a bag of microwave popcorn. (The microwave directly produces heat which is transferred to the bag. Heat is trapped in the bag and pops the popcorn.)This is an example of radiation.
The activity is from:
http://outreach.physics.utah.edu/labs/atmosphere/popcorn.html
7th grade 17

Discuss the following scenarios and ask students to determine if each is an example of conduction, convection, or radiation.
Have signs prepared ahead of time (3 for each student) or ask students to take 3 scrap pieces of paper and label each one with a type of energy transfer. As you read the scenarios to them, give them a few seconds to answer. When you say show, students hold up the paper with their choice.
Attachment 6 includes 2 diagrams to share with your class. It shows a visual of each energy transfer. Attachment 7 is a page to copy to give students so they may complete the scenario activity (cut on dotted lines).
Scenarios:
1. A pot sitting on a hot burner. (conduction)
2. How the inside of a greenhouse works. (convection)
3. Touching a metal spoon that is sitting in a pot of boiling water. (conduction)
4. Using a heating blanket to get warm. (conduction)
5. A person placing their cold hands over a warm fire. (radiation)
6. A person placing their hand over a hot burner. (radiation)
7. Lying out in the sun to get a tan. Or… Lying in a tanning bed. (radiation)
8. Putting your wet shoes on a floor vent to dry them faster. (convection)
9. A pot of water being heated on a hot burner. The focus is on the water. (convection)
10. Picking up a hot cup of coffee. (conduction)
11. Macaroni rising and falling in a pot of boiling water. (convection)
The following is a simulation of conduction, convection and radiation, which you might like to show your students.http://www.wisc-online.com/objects/index_tj.asp?objID=SCE304
For homework, allow students to make a 3-tab foldable illustrating what they have learned about energy transfer. On the outside of the tab, write each energy transfer. Under each tab include a 3-sentence description and a diagram reinforcing the concept. Make the tab by cutting on the dotted lines. The word energy transfer hangs down to show the title. The name should go on the back.
7th grade 18

Evaluate:Pass out the homework assignment sheet. It gives 8 options to check students’ understanding of the content. Allow students to pick one option, 2 or 3 times per week (or per unit) to summarize what they have learned that day. You may even decide to give them a certain topic or several to choose from each day. Students can keep the same homework handout to choose from each day, so additional handouts will not be necessary (attachment 8).
Suggested topics for the homework writing topics: ultraviolet radiation ozone layers of the atmosphere sun safety energy transfer conduction convection radiation altitude air pressure
Day 7Extension:Students can create a circle graph illustrating the percent composition of exhaled air. It shows a direct link to the air that makes up the atmosphere even though the percentages are slightly different. This exercise integrates knowledge from the respiratory system in the human body unit. This will give math integration and practice with using a protractor. A grading rubric is included on the handout (attachment 9)
The components of exhaled air are: 74.5% nitrogen 6.2% water vapor 3.6% carbon dioxide 15.7% oxygen
7th grade 19

Lab Report Unit - Atmosphere
Date Lab Performed: Lab: Testing Ultraviolet Light with Beads
Student Name:
The Lab Question: What substances will/won’t cause UV beads to change?
Student Hypothesis: I think..
Materials Used:
Procedures/ Steps Observations/Drawings
7th grade 20

Conclusion/ Results: (how does your data support or reject your hypothesis)
Explain 2 possible sources of error (factors that could have changed your results)
7th grade 21

1. Start with a large piece of paper. You can use legal paper or ~ 3 sq. ft of butcher/chart paper.2. Draw the Earth. Use coloring utensils to trace a Earth in the center of the paper. Be sure to leave space to draw around it. Color the Earth blue and green to represent the continents and oceans.3. Draw the troposphere, which is the first layer of the atmosphere. The troposphere extends 16 km above Earth.
a. Use the following scale - 1mm=1km. Put a series of dots around Earth, 16 mm from the Earth’s surface.
b. Connect the dots and label it the troposphere. Color it yellow. Draw pictures to help indicate what happens in this layer. You can add airplanes, people, weather occurrences, bad ozone.
4. Draw the stratosphere, which is the second layer of the atmosphere. It extends 16km-50km above the Earth’s surface.
a. Measure and draw a circle 50 mm from Earth’s surface. Be careful- do not draw it starting from the troposphere, remember to start measuring from Earth’s surface.b. Connect the dots and label it stratosphere. Color it orange.c. Draw pictures to help indicate what happens here. Jet streams occur here,
which are fast moving currents of air between the 2 layers. This is also where the ozone layer is found, which absorbs ultraviolet radiation.
5. Draw the mesosphere, which extends 50km-90km from the Earth’s surface.a. Measure and draw a circle 90 mm from the Earth’s surface.b. Label this layer mesosphere. Color it red. c. Draw pictures to help show characteristics. It is the coldest layer of the
atmosphere. Radio waves are reflected to Earth and meteors burn up in this layer.
6. Label the ozone. The ozone is not a main layer of the atmosphere, but plays an important role in how it works.
a. The ozone is between the stratosphere and the mesosphere. Its symbol is O3 because it is made of three oxygen atoms.
b. Color a thin, blue line to represent the ozone. Make a small section of the line dotted (----) to represent the “hole” in the ozone layer.
7. Draw the thermosphere. This is the fourth layer of the atmosphere. It extends 90km-300km from the Earth’s surface.
a. Label it the thermosphere and color it green.
7th grade 22

b. Draw pictures to help show characteristics. The thermosphere is very hot and contains light “shows” called auroras.
8. Beyond the thermosphere is the exosphere. It extends 300km-> 600 km.a. Color this gray and label it exosphere.b. When meteoroids enter Earth’s atmosphere, they enter through the
thermosphere, which is extremely hot. Because of the heat, most meteoroids burn up. Draw and label a meteor entering Earth’s atmosphere.
Grading Rubric
Category Well Done
(20 points)
MeetsExpectations(15 points)
NeedsWork(10 points)
Area ofConcern(5 points)
Measurement All layers areaccurately measured.
Three or more layers have accurate measurement.
Two of the layers have accurate measurement.
One or less of the layers are accurately measured.
Color Coding All layers are color coded correctly.
Three or more layers are color coded correctly.
Two of the layers are color coded correctly.
One or less of the layers are color coded correctly.
Labels All layers are correctly labeled.
Five layers are correctly labeled.
Three layers are correctly labeled.
Two or less layers are correctly labeled.
Symbols All symbols or drawings are accurate placed.
Five symbols or drawings are accurately placed.
Three symbols or drawings are accurately placed.
Two or less symbols or drawings are accurately placed.
Neatness The drawing is neat. There are no eraser marks or redrawn lines visible. The student name is on the back.
The drawing is neat. There are a few eraser marks or redrawn lines. Student’s name is on the back.
There is visible evidence of several mistakes. The paper is wrinkled and or ripped. Student’s name is not
The drawing looks like it has been in your backpack for a month. There is visible evidence of many mistakes.
7th grade 23

on back or is missing.
Student’s name is missing or not on back.
What is altitude and air pressure?What effect do they have on each other?
7th grade 24

Diagram 1 taken from:http://www.beodom.com/assets/images/blog/heat-transmittance-means.jpg
Diagram 2 taken from:
7th grade 25

http://images.google.com/images?sourceid=navclient&ie=UTF-8&rlz=1T4ADBR_enUS204US205&q=conduction,+convection,+radiation&um=1&sa=N&tab=wi
7th grade 26

Attachment 7 (copy and cut out, every student needs one of each word) Name _________________________________
-Homework- Choose any option-You cannot choose the same option twice in one week
7th grade 27

(attachment 8 )
Name __________________________ Date _____
7th grade 28
74.5 % Nitrogen __________ Symbol _____6.2 % Water Vapor _________ Symbol _____3.6 % Carbon Dioxide ________ Symbol _____15.7 % Oxygen __________ Symbol _____
Key- 20 _____Accuracy- 28 (7each) ______Color Coded- 22 ________% included-20 (5each) _______Neat- 10 ______

(Attachment 9)I. Grade Level/Unit Number: 7th grade
II: Unit Title: Atmospheric conditions and weather hazards
III. Unit Length: 10 days
IV. Objectives Included:
1.01, 1.02, 1.03, 1.04, 1.05, 1.06, 1.08, 1.09, 1.10, 3.03, 3.05, 3.06
V. Materials Needed:HandoutsFor the teacher demonstrations:
1 apple per class, a cutting utensil, water, black paper, a gallon clear jar, colored warm water, matches, a gallon size bag of ice
Does air have mass lab-1 triple beam balance or electric scale per group, 1 balloon per groupBuilding a psychrometer- 2 thermometers, 1 cotton ball, one rubber bandBasketball demonstration: basketball, portable hair dryer, bicycle pump
with a needle, meter stick, refrigerator or cooler with ice
VI. Notes to Teacher:If possible you can build several psychrometers and allow students to travel to locations within your school and collect the readings or assign 2 students a day to do the collecting and rotate the responsibility.
Day 1Engage:
To assess prior knowledge ask students to brainstorm what they think weather includes. Allow them to use the concept map to record their answers. (attachment 1) (Suggest that students might list words like temperature, and types of storms.)
You can introduce that weather also includes the humidity, wind speed, air pressure, and precipitation. These properties have to be studied in order to predict conditions and weather hazards. Humans can have a positive or negative impact on weather such as the theory of global warming. The following are teacher demonstrations that can be used to introduce a few weather concepts:
You can introduce that there are 3 main types of clouds: cumulus, stratus and cirrus. Clouds are formed from condensed water that sits on top of dust particles. Fog is an example of a stratus, or low lying cloud. Clouds that indicate
7th grade 29
a storm usually have the prefix or suffix nimbo added. Use the following as a teacher demonstration on how to make a cloud or fog in a jar:You will need a piece of black paper, a clear jar, colored warm water, matches, and a gallon size bag of ice.
Cloud demonstration: #1
1. Tape black paper on the side of the jar so you can’t see through the jar.
2. Fill one third of the jar with colored warm water.3. Light the match and hold it over the jar opening.4. After a few seconds, drop the match into the jar and cover the top of
the jar with the bag of ice.5. Record your observations.6. If it does not work the first time, try it again.
The following link provides a visual and a step of processes illustrating how clouds are formed.http://www.vivoscuola.it/us/rsigpp3202/umidita/lezioni/form.htm
The following link provides a cloud gallery. This can follow up the teacher demonstration and flow into a discussion about the different types of clouds. http://www.wildwildweather.com/clouds.htm
To introduce the second demonstration you can remind students that all the earth’s resources may not be available indefinitely. We have to protect and conserve the resources we have so they may continue to be available. Introduce students to the word stewardship. Environmental stewardship is the responsibility to take care of natural resources to ensure that they are managed for current and future generations. Stewardship of the environment can include recycling, conservation, and restoration.
Ask students: What are some ways that you can show stewardship?(by not wasting water, recycle plastics and cans, don’t pollute by littering trash, carpool when able, volunteer for highway clean up, compost food waste, replanting trees or ground cover, using biodegradable products, using car washes because they recycle water, not destroying forests or ground cover)
You can encourage students to go further by getting involved in “Make a Difference Day.” They can get involved in service learning projects and make a difference in their own community. They can create recycling programs in the school, help with cleaning up litter, volunteering or start beautification efforts in their school or community. Students can create an action plan to chart their progress. They can work individually or on teams. Their information can be shared with classmates, the school and community through a show and tell or volunteer guest speakers.
7th grade 30

Learn more by visiting:http://www.usaweekend.com/diffday/aboutmadd.html
Day 2Students may not know the difference between renewable and nonrenewable resources. Renewable resources can be easily replenished such as sunlight, oxygen, and freshwater. Nonrenewable resources may take time to be replenished so they are not guaranteed to always be available such as coal and fossil fuels.
To illustrate Earth and its resources you can demonstrate the following to your classes: (This will reinforce the responsibility that we all have to be good stewards of our land and resources).
Materials needed per class: 1 apple, 1 knife1. Slice an apple into quarters. Set 3 of the sections aside to represent the world’s oceans.2. Cut the remaining quarter (which represents land) in half. Set on section aside. (This is the land that is uninhabitable to humans such as polar areas, high mountains, deserts and swamps.)3. The portion left (1/8 of the apple) represents land where people can live. Slice it into four sections. Set 3 sections aside (3/32 of the apple). These areas are too rocky, wet, cold, steep, or populated to grow food.4. Carefully peel the skin off the remaining section (1/32 of the apple). This small peel represents the portion of the earth’s land that is cultivated. 5. Take the ¾ of the apple that represents water (from #1). Cut a thin slice off to represent the 3% of water that is fresh.6. Cut off 1/3 of the thin slice to represent the amount of fresh water that is not locked up in glaciers or polar ice caps.7. Half of that slice actually represents the amount of fresh water that is accessible (less than 1% of all water on earth).
Let students know that we can change salt water into freshwater but it is a very expensive process. Water is a natural resource that is continually recycled every day. We do not have factories that create fresh water.
To illustrate the amount of water located on earth, you can demonstrate the following to your classes:Materials needed per class: water, measuring containers
1. 5 gallon bucket = total water on earth2. Take out 2 ¼ cups = fresh water, the remainder left is salty water3. From the 2 ¼ cups remove 1 ½ cups = polar ice caps and glaciers4. From the remaining ¾ cup, remove ¼ cup water = water tied up in atmosphere or soil
7th grade 31

5. ½ cup remaining = ground water and surface water6. From the ½ cup, remove 5 drops = fresh water available to humans7. The rest is either unreachable or unfeasible to use
(adapted from CESI Newsletter – Winter 87-88)Explore: Ask: What happens when we pollute?Pollution can damage buildings, or structures. It can create smog that lingers in a town or even travels to nearby towns. It can contribute to acid rain which can damage buildings or contaminate water supplies. Collect rain water or water from a nearby lake or stream and introduce students to pH paper. Allow them to check the pH of your local water to determine if it is acid or basic. Rain water is naturally, slightly acidic. Brainstorm ways that humans can decrease pollution and reduce acid rain. You can also review the Clean Air Act which is legislation that reduces smog and air pollution and works toward maintaining clean air standards. Ask: How does the water cycle play a role in smog or pollution? (Since rain is recycled, acid rain can be transported to new towns or regions and can effect others)
Visit the following website for an interactive pH activity:http://www.miamisci.org/ph/
The website below shows a pH scale with several examples:http://library.thinkquest.org/3659/acidbase/ph.html
Visit the following website for an interactive on the water cycle:http://www.epa.gov/safewater/kids/flash/flash_watercycle.html
Day 3Before you start teaching or discussing all the things that weather includes, begin with the lab “Does Air Have Mass?”Distribute attachment 2 lab sheet. Ask students to predict their answers to the question. Break students into groups and pass out the materials being used. Each group will need 1 balloon and 1 triple beam balance or electronic scale.
Discuss with students what you think a good procedure will be in order to find the answer to the question “Does Air Have Mass?” Make a list of procedures on the board and allow them to add and delete steps until they perfect it. Once your class agrees on a set procedure ask them to begin.
An example of a set of procedures are:1. Calibrate the balances2. Find the mass of the deflated balloon and record it3. Blow up the balloon and tie it4. Find the mass of the inflated balloon5. Subtract the first mass from the second
7th grade 32

6. Formulate a conclusion, fill out the lab sheet
Allow groups to work independently to complete the lab and each student to complete his own lab sheet (attachment 2). Explain:Follow up the lab with a discussion and ask the following questions:
If you had made your balloon bigger or smaller how, if any, would your data have changed?
If you were to take your balloon and put it in a freezer overnight what would have happened? Why? (it would shrink- because air particles come closer when cooled)
If you have a balloon and take it outside into 100 degree weather what might happen? Why? (it would expand- because air particles spread out when heated)
As a further classroom lesson on air and its particles you can show a demonstration on the following activity or create a student lab.
Ask: How do air particles affect a basketball and its bounce height?
Ask: Have you ever seen a hot air balloon floating in the sky? What keeps them up? Why do they have to be so big? Why don’t they usually fly in the middle of the day?
Day 4The following is an additional lab to demonstrate air’s properties and how it moves. Introduce the lab to the class and ask the included questions, or, if materials allow, students can complete the lab in groups.Materials: basketball, portable hair dryer, bicycle pump with a needle, meter stick, refrigerator or cooler with ice
Procedure:1. Fill up the basketball to standard pressure.2. Have a student hold the meter stick so that it’s sticking straight up from the
floor.3. Drop (don’t throw) the ball onto the floor from about waist height next to
the meter stick, and measure how high up it bounces. Be sure to measure from the bottom of the ball.
4. Repeat the initial bounce measurements 2-3 times and record the average bounce height.
7th grade 33

Ask students to predict: What would happen to the “Bounce of the ball” if we….
1. Put it in the refrigerator or cooler of ice for about 15 minutes? Would the bounce be higher, lower or the same? Allow students to give their prediction and then demonstrate what happens.
Once the ball has returned to room temperature pose the second question.
2. After letting the basketball warm to room temperature, Ask: what would happen if we used a hair dryer to heat the ball for 2-3 minutes?
Would the bounce be higher, lower or the same?
Allow students to give their prediction and then demonstrate what happens.
How did the actual temperature of the air affect the “bounce” height of the basketball?
End results:1. As you cool the air in the ball the bounce height decreases because it
“seems” to have less air, the air particles have come closer together.2. As you heat the air the bounce height increases, because the air is more
spread out in the ball.
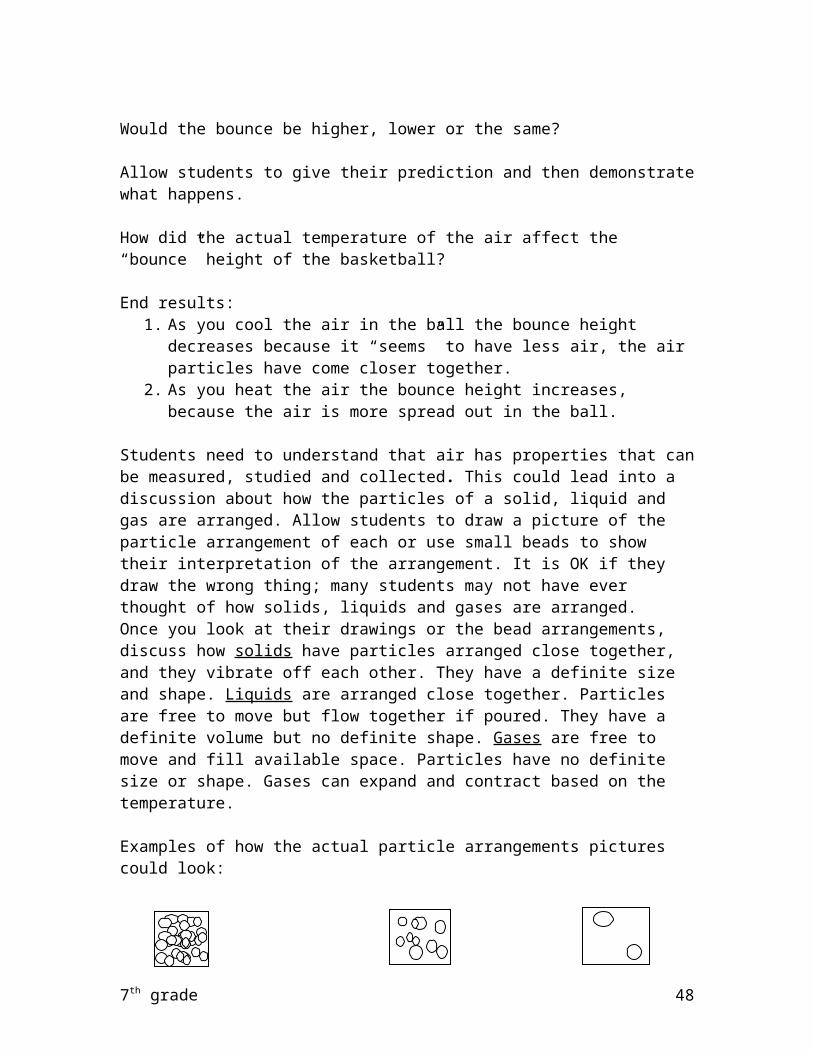
Students need to understand that air has properties that can be measured, studied and collected. This could lead into a discussion about how the particles of a solid, liquid and gas are arranged. Allow students to draw a picture of the particle arrangement of each or use small beads to show their interpretation of the arrangement. It is OK if they draw the wrong thing; many students may not have ever thought of how solids, liquids and gases are arranged. Once you look at their drawings or the bead arrangements, discuss how solids have particles arranged close together, and they vibrate off each other. They have a definite size and shape. Liquids are arranged close together. Particles are free to move but flow together if poured. They have a definite volume but no definite shape. Gases are free to move and fill available space. Particles have no definite size or shape. Gases can expand and contract based on the temperature.
Examples of how the actual particle arrangements pictures could look:
7th grade 34

Solids Liquids GasesDay 5In order for meteorologists to study weather data must be collected for several properties. Briefly discuss what each property is and how it affects weather. (See the following list.)
Introduce key vocabulary related to weather, conditions and hazards.A brief description is included for each term along with an informative website in case you need additional information.
Humidity - Measures the amount of moisture in the air. It can be measured with a hygrometer or a sling psychrometer. The scale goes from 0%=100%.http://daphne.palomar.edu/jthorngren/measures.htm
Temperature - Measures the hot or coldness of the air. There are 3 scales: Kelvin, Celsius, and Fahrenheit. The units are degrees.http://www.weatherwizkids.com/temperature.htm
Wind speed and direction - Measured with an anemometer and a weather vane. It tells the direction the wind is blowing and the speed. The units are miles per hour. The following is a wind speed conversion chart: http://www.srh.noaa.gov/elp/wxcalc/windconvert.shtml
Air pressure - Force exerted on you by the weight of the air. It is measured with a barometer. Barometers are used to measure the current air pressure at a particular location in "inches of mercury" or in "millibars" (mb). The following website has additional information on how air pressure affects you. http://kids.earth.nasa.gov/archive/air_pressure/index.html
Precipitation - Five main forms of precipitation: rain, sleet, snow, freezing rain and hail. The following website outlines the atmospheric conditions that allow each type of precipitation to form. Precipitation can be measured with a rain gauge. http://ww2010.atmos.uiuc.edu/(Gh)/guides/mtr/cld/prcp/home.rxml
Tornados - Funnels of high speed, spinning air. A tornado watch means that one is possible; a tornado warning means that one has been spotted nearby. Tornadoes can be classified with the Fujita scale.http://green.nationalgeographic.com/environment/natural-disasters/tornado-profile.html?source=G2306
Hurricanes - Severe tropical storm that forms over water. Hurricanes rotate in a counterclockwise direction around an "eye." A hurricane is classified when winds reach 74 mph. The Saffir-Simpson scale can be used to classify hurricanes.http://hurricanes.noaa.gov/
7th grade 35

http://www.aoml.noaa.gov/general/lib/laescae.htmlDrought - Deficiency of precipitation over an extended period of time, usually one season or more. A drought is a prolonged, abnormally dry period when there is not enough water for users' normal needs.U.S. drought monitor- http://www.drought.unl.edu/dm/monitor.html
Floods - Caused by stationary or slow-moving thunderstorms that produce heavy rain over a small area. Flash floods can strike any time and any place with little or no warning. Natural processes, such as hurricanes, weather systems, and snowmelt, can cause floods. Failure of levees or dams and inadequate drainage can also result in flooding. http://www.fema.gov/areyouready/flood.shtm
Tsunami - Series of waves generated by an undersea disturbance such as an earthquake. From the area of the disturbance, the waves will travel outward in all directions, almost like the ripples caused by throwing a rock into a pond. The tsunami is proportional to the intensity of the earthquake.http://science.howstuffworks.com/tsunami.htmhttp://serc.carleton.edu/NAGTWorkshops/visualization/collections/tsunami.html
Based on the information just discussed ask students to complete the window pane graphic organizer for each property discussed. Instruct them to only use pictures to explain what each word means or how it affects weather (attachment 3).
Day 6Demonstrate to students how to collect relative humidity by building a psychrometer. You will need two thermometers, one will be called the dry bulb and one will be called the wet bulb. The dry bulb will be a plain thermometer. In order to make the wet bulb you will need a second thermometer, a cotton ball and a rubber band. Wrap the cotton ball around the end of the second thermometer and attach it with a rubber band. Dip the cotton ball thermometer in room temperature water, therefore making a wet bulb. Carefully move the 2 thermometers back and forth in your hands (for about one minute) to allow them contact with the air. At the end of the one minute take the reading for both thermometers, the wet and dry bulb.
Record the temperature of the dry bulb (regular thermometer), then record the temperature for the wet bulb. Find the difference between the 2 readings and record it. Create the chart below and ask students to fill in the answers. They may need additional reinforcement with interpreting the relative humidity chart. The chart included is in Celsius, you may find one in Fahrenheit at:
http://www.bigelow.org/virtual/handson/humidity.html#glossary
7th grade 36

Dry bulb reading Wet bulb reading
Difference between wet and dry bulbs Relative humidity ________%
In order to calculate relative humidity you:
1. Take the number that is the difference between the wet and dry bulb (found at the top of the chart).
2. Take the dry bulb or air temperature reading (found on the left vertical axis).
3. Use the chart to calculate the relative humidity. Find the location where the two numbers meet and this will be your relative humidity reading. A number closer to 100% would indicate humid weather such as rain.
The following website has an electronic relative humidity calculatorhttp://www.bom.gov.au/lam/humiditycalc.shtml.
Below is an additional relative humidity chart with directions if you need extra assistance http://155.44.225.28/science/hmxs/es/pdf/5rs_3_2-3.pdf.A Celsius relative humidity chart is included (attachment 4).
You can make and laminate a class set of the relative humidity charts for students to use. Review how to read the chart and what factors you need in order to find the correct reading. Example problems are included to allow for practice, the answers are bolded. A Celsius relative humidity chart is included (attachment 4) Remind students that the answers will be in percent. The higher the percent, the higher the humidity.
1. If the difference between the wet and dry bulb is 9 ° C and the dry bulb reading is 17° C, what is the relative humidity? 25%
2. If the difference between the wet and dry bulb is 4 ° C and the dry bulb reading is 26° C, what is the relative humidity? 70%
3. If the difference between the wet and dry bulb is 14 ° C and the dry bulb reading is 29° C, what is the relative humidity? 19%
4. If the difference between the wet and dry bulb is 2 ° C and the dry bulb reading is 10° C, what is the relative humidity? 76%
5. If the difference between the wet and dry bulb is 6 ° C and the dry bulb reading is 22° C, what is the relative humidity? 53%
7th grade 37

Students will collect the wet and dry bulb readings for your classroom everyday for one or two weeks and calculate the relative humidity. Post the readings on chart paper in your room so students can keep a log. After a period of collection time (1 or 2 weeks) students will use these readings to create a line graph. Extend the project over several weeks and actually add several locations like the gymnasium, cafeteria or outside. Students can use the collected date to create a multiple line graph. As an extension students can use Excel to insert their data and create a computer generated line graph. (Excel directions are included as attachment 5. It compares the relative humidity readings for 2 locations- the classroom and outside) Students can work individually or with a partner when creating the Excel graph.
If time allows a sample set of Excel directions is included for students to create a computer generated line graph of their relative humidity readings (attachment 5).
Day 7Elaborate:Weather conditions are dependent on the constant movement of water and air in the atmosphere. Students are probably familiar with the water cycle and the constant movement of water in the atmosphere. You may want to review the basic steps - condensation, evaporation, precipitation, transpiration, runoff, infiltration. A diagram is included for reinforcement. Copy it as a student handout or create an overhead. Review the diagram as a class or students can review it individually (attachment 6).
Students should know that the water in the environment is continuously cycled. No new water is ever created. This could lead into a good discussion on how to conserve water and methods that each person can incorporate in their own home. The website listed below explains why we cannot easily manufacture new water.
Why can’t we manufacture water? (how stuff works) http://science.howstuffworks.com/manufacture-water.htmHow stuff works- video on water: (2 minutes)http://videos.howstuffworks.com/water-video.htm
After your discussion ask students to assemble and complete a Triarama. This will help students summarize the water cycle, types of precipitation and cloud types. (attachment 7) (Myth examples taken from Creative Teaching Press)
If students need help writing a short myth you can share the following with them:
1. In the past, people from many cultures interpreted the weather as signs from the gods. Angry gods might send lightning to strike a person or place.
7th grade 38

2. Some Native Americans believe that giant birds called thunderbirds beat their wings to produce thunder. The flashing of their eyes creates lightning.
3. An ancient Chinese myth tells how a thunderstorm is created by different gods. The thunder god is helped by Mother Lightning. She produces lightning using mirrors in her hands. The Master of the Rain sprinkles water from his pot with a sword. The Little Boy of the Clouds, piles up the clouds, while the Prince of Wind releases winds from a bag.
4. According to Kenyan legend, God creates two rainbows, one male and one female, which must work together to stop the rain.
The following site has mini videos on weather folklore:http://www.accuweather.com/media-player.asp?partner=accuweather&myadc=0&traveler=0&vidcode=undefined&issub=undefined&subindex=undefined&adfirst=undefined
Day 8Evaluate:Distribute the tic-tac-toe project and allow students to pick any 3 projects to complete (attachment 8).
The center choice is for students to create their own project if they have an original idea. All 3 projects may be turned in at one time or stagger the due dates over several weeks.
Students can present their information to the class or display their projects on their desks and have a class walk through. Each student can give feedback to each other’s project(s).
Day 9 (optional)Extension:Option 1 - Once students have turned in their hand drawn relative humidity line graph, use Excel to create an additional graph. This can be done individually at home as a separate project, it can be done as an interdisciplinary project with a math or computer teacher in your school, or it can be done during a science class period (attachment 5).
Day 10Option 2- Distribute the foldable project. Students must choose 5 words from the list and create a foldable illustrating what they have learned. A few of the terms may be new to their vocabulary and could require student research (attachment 9).
7th grade 39

Name _________________________________ Date ___________
Weather concept mapList any facts you know about weather
(attachment 1)
7th grade 40

Lab Report Unit – Weather- Atmospheric Properties
Date Lab Performed Lab: Does Air Have Mass?
Student Name:
The Lab Question: Does air have mass?
Student Hypothesis:
Materials used:
Procedures/ Steps Observations/Drawings
Conclusion/ Results: (how does your data support or reject your hypothesis)
7th grade 41

(attachment 2)
Name __________________________________ Date ________
Use pictures to define or explain each weather related term below
7th grade 42

(attachment 3)
The difference between the wet and dry bulb thermometer
0 1 2 3 4 5 6 7 8 9 10 11 12 13 14 15-20 100 28 -18 100 40 -16 100 48 -14 100 55 11 -12 100 61 23 -10 100 66 33
-8 100 71 41 13 -6 100 73 48 20 -4 100 77 54 32 11 -2 100 79 58 37 20 1 0 100 81 63 45 28 11 2 100 83 67 51 36 20 6 4 100 85 70 56 42 27 14 6 100 86 72 59 46 35 22 10 8 100 87 74 62 51 39 28 17 6
10 100 88 76 65 54 43 33 24 13 4 11 100 88 77 66 55 45 36 26 15 7 12 100 88 78 67 57 48 38 28 19 10 2 13 100 89 78 68 58 49 39 31 22 14 5 14 100 89 79 69 60 50 41 33 25 16 8 1 15 100 90 79 70 61 52 43 35 27 18 12 5 16 100 90 80 71 62 54 45 37 29 21 14 7 1 17 100 90 80 72 63 55 46 39 31 25 17 10 4 18 100 91 81 72 64 56 48 40 33 26 19 12 6 19 100 91 82 73 65 57 49 43 35 28 21 15 9 20 100 91 82 74 66 58 51 44 36 30 23 17 11 5 21 100 92 83 75 67 59 52 45 28 32 25 19 13 7 22 100 92 83 75 68 60 53 46 40 33 27 21 15 10 4 23 100 92 84 76 69 61 54 48 41 35 29 24 18 13 5 224 100 92 84 76 69 62 55 49 42 36 30 25 20 14 9 425 100 92 85 77 70 63 56 50 44 37 32 27 22 16 11 626 100 92 85 77 70 64 57 51 45 39 34 28 23 18 13 927 100 93 86 78 71 65 58 52 46 40 35 30 25 20 15 11
7th grade 43
Dry bulbthermometer in Celsius

28 100 93 86 78 71 65 59 53 47 42 36 31 26 21 17 1229 100 93 86 79 72 66 60 54 46 43 38 33 28 24 19 1530 100 93 86 79 72 66 61 55 49 44 39 34 29 25 20 16
Start, Programs, Microsoft Excel
In column A list the datesIn column B list the classroom percentagesIn column C list the outside percentagesLeft click on A1 and highlight all 3 columns of information
Go up to the top and choose Insert then click on ChartUnder Chart choose Line and then choose any of the graphs shown
Click on NEXT, The tabs DATA range and SERIES will come upUnder DATA tab- make sure series in: columns is checked offGo to the SERIES tabClick SERIES 1- and look to the right beside the word name. Type: CLASSROOM
Click SERIES 2- and look to the right beside the word name. Type: OUTSIDEClick on NEXT6 tabs will pop upGo to the TITLES tabChoose CHART TITLE and type in RELATIVE HUMIDITY READINGS AT SCHOOLCategory (X) axis- type in DatesCategory (Y) axis- type in Percentages
Under Gridlines Click major gridlines for both (the X and Y axis)
Go to the LEGEND TABPick your preference for the location of the KEYClick on NEXTPlace chart as a new sheetFINISH- Left click on the chart (in the gray area) onceGo down to the paint bucket (where you can change color)- & choose NO FILL
Click on the VIEW tab located at the topChoose Header/FooterCustom Header- Under the left section- type your name, date and period. Click OK, OK
7th grade 44

Click File, then print preview, -- view your graph (make sure all components are labeled)
Close, File Print
Diagram copied from: http://www.marietta.edu/~biol/biomes/ecosystems.htm
7th grade 45

Name __________________________________ Due Date __________
Side 1- Write the 3 main cloud types. Include a hand drawn picture of each & at least one descriptive word.
Side 2- Make up an original myth with an explanation of why one of the following occurs:
lightning rain thunder snow sleet
tornado rainbows hail floods droughts
Side 3- Make a drawing of the water cycle illustrating & labeling at least 4 of the following steps:
infiltration or groundwater runoff precipitation
transpiration condensation evaporation
1. Cut paper to create a perfect square. (This can be found by bringing the corner of the paper to the opposite side- then cut off the flap left over)
2. Fold the top right corner of the square down to the lower left corner, making a half X.
3. Repeat step 2, making the folded marks of a completed X.
4. Cut one side of a triangle to the center.
5. Add your information to the inside or outside and then staple the unused flap to form a pyramid.
6. Add tissue paper or a ribbon to one corner to create a kite effect.
7th grade 46

(attachment 7) Foldable diagram adapted from Creative Teaching PressName _______________________________ Due Date __________
Weather Tic- Tac –Toe Project
Choose any 3 of the activities listed in the tic tac toe. If you have an idea of your own, list it in the space below and get it approved by your teacher. I choose activities # _____________, _______________, ______________
I would like to choose activity 5. My idea is ______________________________
7th grade 47
If a tornado or hurricane were spotted in your area, what would you do? Research warning signs and safety precautions for each storm and present the information in a 6 sided brochure.
Stage a talk show with you as the host and the 4 guests as hurricane, tsunami, tornado and flood. Include a list of 4 questions you will ask each guest and their predicted responses.
Create a shoebox diorama illustrating at least 3 weather concepts we have discussed. Include a preplanning drawing of your idea and a paragraph explaining details about your final product.
Research the ozone layer and create an informational poster on the following:1. What does it do?2. What type of things can destroy it?3. How can we protect it from being destroyed?4. What are some consequences of the ozone being depleted?
Your Choice(This must be approved
by your teacher)
How do you measure the intensity of a tornado? Research the Fujita scale. Create an illustrated diagram explaining each level from F0-F5. Each of the six diagrams must be accompanied with a complete description.
Create a PowerPoint slideshow on the five occurrences below.
TsunamiHurricaneTornadoFloodDrought
Define each and include specific details.
Write and illustrate a children’s book on four of the weather instruments listed below.
PsychrometerThermometerBarometerAnemometerRain gaugeHygrometer
Include what they measure and the units used.
Construct a 3-Dimensional model of a hurricane. Label the eye, eyewall and the direction it rotates. Write a paragraph explaining each part and include specific characteristics.
1. Fold a sheet of paper in half2. Fold the paper so that one-third is left out and the other two-thirds are covered3. Fold the two-thirds section in half4. Lastly, fold the one-third section back to create a fold line
Key Words:Ultraviolet radiation, chlorofluorocarbons, ozone, conduction, pollutants, land breeze, sea breeze, humidity, dew point, tornado, hurricane, acid rain, meteorologist, renewable resources, fog, drought, flood, Beaufort scale,pH scale, convection, radiation, Fujita scale,greenhouse effect, cloud types, hail, condensation, evaporation, sublimation, microclimate, cyclone, altitude, Doppler Radar, Butterfly effect
________________________________________________________________
Student signature____________________Teacher Signature _______________
Choose 5 words and use the folded diagram above to create an information display
Each word must be creatively written on the outside fold. When you flip up the fold you should have a 2- 3 sentence definition of the word on the bottom half and a hand drawn picture on the top half. The definition must be accurate and written in complete sentences. The diagram must be relevant to the word you are describing. A title and your name should be on the bottom overhang.
Rubric:
5 hand drawn Illustrations _________ Title _______
Overall product: Time and effort ________ Handwriting legible ________
Grammar/ complete sentences ________ Creativity _________
7th grade 48

Accurate definitions __________ Guidelines followed __________
I. Grade Level/Unit Number: 7th grade
II: Unit Title: Using technology to study weather hazards
III. Unit Length: 8 days
IV. Objectives Included:
1.05, 1.06, 1.09, 1.10, 3.05, 3.06
V. Materials Needed:HandoutsInternet/ multiple computer usageOne week (or so) of weather maps cut from the newspaperDaily weather data (wind speed and direction, precipitation, current temperature, and dew point) for your school and 3 - 4 cities from neighboring states
VI. Notes to Teacher:This activity is good to start after there has been some unsettling weather, because it will help students to link the visual changes that are shown on a series of weather maps with their experience. If you have had a series of fair weather days, it may be helpful to use one of the Internet weather sites to identify weather changes in other parts of the country with maps from the newspaper.
Helpful WebsitesReading the Map Resourceshttp://ww2010.atmos.uiuc.edu/(Gh)/home.rxmlhttp://okfirst.ocs.ou.edu/train/meteorology/Fronts.htmlhttp://www.aos.wisc.edu/~hopkins/aos100/sfc-anl.htmhttp://www.usatoday.com/weather/wmapread.htmhttp://www.mohonasen.org/staffdev/weather5/weathermaps.htmhttp://weather.unisys.com/surface/details.html http://www.wildwildweather.com/index.html http://www.ametsoc.org/amsedu/dstreme/extras/wxsym2.htmlhttp://dstreme.comet.ucar.edu/extras/wxsym2.htmlwww.epa.gov/airnow//state_local/pm_for_meteorologists9-19.ppt (air pollution)
Day 1Engage:
7th grade 49
Begin the unit by having students write down (on paper or the board) as many specific features as possible of the weather conditions in your city that have occurred in the last week or so. Encourage them to (if necessary) to mention temperature changes, cloud types, any precipitation, wind direction, and wind strength. Assess prior knowledge of weather maps by passing out a “teacher, newspaper or Internet generated” map with some randomly drawn fronts, isobars and isotherms. At this point, some type of brainstorming session / peer work would be good. Have the student pairs/groups attempt to identify different features such as fronts, precipitation, approaching major storms, isobars and isotherms and weather conditions found on those maps.
Day 2Explore: Have the students work on the map activity located at http://www.srh.noaa.gov/jetstream/synoptic/wxmaps.htm. The link will take them to a page entitled “How to Read Weather Maps.” The information in this section will be referenced in the Elaborate section of this unit. Go to the bottom of the page and click on “Learning Lesson: Drawing Conclusions.” Have student complete these activities. If you do not have Internet access, the maps, directions and solutions are located at the back of this unit (Attachments 1-6).The first attachment is a student handout or can be made into an overhead; the second copy contains the actual directions.
Day 3Explain: Weather fronts are air masses of different types that collide with each other. The boundary where the air masses collide may be relatively narrow (10s of km) or rather wide (100s of km). Based on which air mass is moving / not moving determines the specific type of front. Each frontal type has particular characteristics that can be experienced on the ground and represented on a weather map. A couple of definitions will also help with the explanation of the weather map:
Isotherm – contour lines on a map that connect areas of equal temperature.
Isobars – contour lines on a map that connect areas of equal atmospheric pressure.Isobars and isotherms are somewhat “fluid” measures, so their lines on a map tend to be curved and irregular. These measures often are on a particular scale (every 10o C, or every 20 mb) representing a gradual change across a geographic region.
High Pressure – region of the greatest atmospheric pressure. Winds around a high-pressure system circulate in a clockwise rotation termed “anti-cyclonic.”
7th grade 50
Low Pressure – region of the lowest atmospheric pressure. Winds around a low- pressure system circulate in a counter-clockwise motion termed “cyclonic.” To help students remember “cyclonic,” remind them that low pressure systems can be associated with large/violent storms and the term “cyclone” is used for both tornadoes and hurricanes (Pacific), both of which rotate in the counter-clockwise direction.
One frontal type is a cold front. A cold front is a mass of “colder” air that moves under a mass of warmer air at a particular location. Cold air masses tend to move quickly and are characteristic of rather abrupt changes in local weather. As a cold front moves into an area, it pushes the warmer air mass upward at a fairly steep angle. The movement of warm (typically moister air) upward can cause violent storms to occur along the front. The appearance of cirrus clouds in the upper atmosphere can often be used an indicator of an approaching cold front. Storms may occur ahead of the front as well as along the frontal barrier, but skies tend to clear rather quickly after the passage of a cold front. Strong lines of thunderstorms are characteristic of the passage of a cold front. On the weather maps cold fronts are represented as a line of triangles. The triangles are often colored blue or green (cooler colors), with the point of the triangle signifying the direction of movement.
Warm fronts move slower and tend to be less dramatic than cold fronts. Warm air, which is naturally less dense, rises slowly above an area of cooler air. The passage of a warm front also causes precipitation, but more typically these areas experience light to moderate continuous rain. The lighter rain is in contrast to the severe thunderstorms associated with the passage of a cold front. Cloud formations with the passage of a warm front tend to have a greater concentration of mid-level stratus and cumulus clouds. The formation of fog is also associated with the passage of a warm front. The formation of fair weather occurs more gradually with the passage of a warm front. Warm fronts appear on the weather map as a line of semi-circles (often red in color), with movement signaled by the leading edge of the circle.
A third type of front is a stationary front. In a stationary front, the moving air mass (warm or cold) does not contain sufficient energy to move the existing air mass. Consequently, what happens is that the front tends to move rather slowly out of a region. Cold fronts often “stall” along the coast of North Carolina as they lose energy. A stationary front will often cause precipitation in an area for extended periods of time. Eventually, a new air mass will move in and replace the stationary front. Stationary fronts appear on the map as a line of alternating triangles and semi-circles that face in opposite directions. Wind patterns are often parallel on both sides of the front.
The fourth frontal type is an occluded front. In an occluded front, the faster moving cold front catches and overtakes an existing warm front. The denser cold front forces itself under the existing warm front causing heavier amounts of
7th grade 51

precipitation to fall (inches of rain or snow). Due to the hybrid nature of the occluded front, weather patterns at the beginning of its formation are similar to those of a warm front. Occluded fronts appear as a line of alternating triangles and semicircles facing the same direction.
Weather patterns in the Unites States most often move from west to east. Therefore the weather to one’s west (northwest or southwest) is the precursor of what one should expect. Severe weather events like tropical storms vary from this pattern and move from east to west.
Additional Internet resources covering this topic include:http://ww2010.atmos.uiuc.edu/(Gh)/wx/surface.rxmlhttp://www.mohonasen.org/staffdev/weather5/weathermaps.htm
Pass out the vocabulary chart (attachment 7). Either assign or ask students to select 2 or more of the vocabulary words just explained and complete the chart for additional vocabulary reinforcement.
Day 4Elaborate:Remind students of the various weather conditions that you have previously discussed - humidity, storms, drought, flood, tornado, tsunami, hurricanes . . . and provide discussion time to recall characteristics of each.
Ask: Why do we study weather conditions? (to monitor changes, predict occurrences & evaluate air quality )
How do we study weather conditions? (gather data- temperature/humidity/air quality/air pressure)
What instruments do scientists use to study weather or climate? (thermometer, barometer, satellite imagery, anemometers, radar)
How do meteorologists communicate their weather research to the public?(by weather maps, news reports, diagrams, weather alerts…..)
How are storms such as hurricanes named? (accept all answers) How are storms such as hurricanes and tornados measured? (by intensity)A meteorologist is an individual with specialized education who uses scientific principles to explain, understand, observe or forecast the earth's atmospheric phenomena and/or how the atmosphere affects the earth and life on the planet. Meteorologists and other people with a need for more detailed information about the weather (pilots) utilize a more complex system of map details to forecast the weather. The type of data used by meteorologists includes barometric pressure, wind speed and direction, precipitation, cloud cover, dew point and current temperature.
Have the students complete the activity located at http://radar.meas.ncsu.edu/education/saer/aer_summer_00.html.
7th grade 52

Similar symbols and explanations are located on attachments 8-11. If this web link is unavailable, use attachments 8-11 in cooperation with the weather data from several cities to build their own map.
Sample symbol chart:
(chart adapted from Carolina Academic Press)
Day 5Meteorologists use symbols to easily convey the data they collect. It gives a visual that can easily be looked at and interpreted by others. They also keep track of storms by naming them. Students probably do not realize that there is a method to categorizing and naming storms. To reinforce storms, how they form and how they are named, students will use a computer and the internet to answer the questions to the Internet Scavenger Hunt (attachment 12).
This should take one class period. The websites are listed above the questions. A copy of the answers is included as attachment 12- answers.
7th grade 53

(To make the websites easier to access, go to ikeepbookmarks.com and create an account for yourself. This will allow you to create a folder with all the links, so students can easily access and maneuver between sites.)
Day 6Evaluate:Return the students to their original groups/pairs (as in the engage section of the lesson) and give them a new set of “teacher/Internet generated” weather maps. Students should write down as many new features they can recognize, and should be able to infer what the precipitation should be, like around the different fronts. Using the weather data from your school and other cities over the past five or more days, draw the appropriate weather symbol for each day’s readings(samples attachment 13).
As a review of terminology, students can play the tic-tac-toe game included (attachment 14).
Tic-Tac-Toe-Directions: Two people play on one person’s paper. One person is the X and the other person is the O. If you want to put an X or an O, you must know the answer to the question in the square and record it on the line. If your partner agrees that it is the correct answer then you get to put your X or O in the empty square. If your answer is wrong, then you must go to another square. The object is
a. to know the answer to the questionb. to try to get tic-tac-toe yourselfc. also block the other person from getting tic-tac-toe first.
Day 7Extension:As part of any weather forecast, meteorologists utilize satellite imagery to analyze and explain the upcoming weather. Students can also learn to conduct a basic interpretation of weather from satellite imagery. Infrared images (IR) are some of the more common images available through most weather websites. The IR sensors aboard most satellites measure the temperature of the land, sea surface, and the tops of clouds. Low clouds, which are relatively warm compared to high clouds, appear dark gray (gray scale calibration), while high cloud under the same parameters appear white due to the colder temperatures. An additional way to explain the cloud patterns is with color-enhanced IR. In the case of color-enhanced IR, higher clouds appear in green, yellow, orange or red based on their height. Colder objects are brighter and warmer objects are darker.
In the same way, water vapor (WV) images also help meteorologists predict the upcoming weather. Bright and colored areas indicate high water vapor (moisture) content (colored and white areas indicate the presence of both high moisture
7th grade 54

content and/or ice crystals). Black and brown areas indicate little or no moisture present. WV imagery is useful for both determining locations of moisture and atmospheric circulations.
Because IR measures heat differences of different objects, it can be used to help explain energy transfer throughout the atmosphere. Conductive circulation allows for warm air to rise up into the atmosphere (often carrying moisture). As the moist air rises, condensation occurs and clouds form. In intense convection situations, large cumulonimbus clouds can tower several miles into the air. These large clouds are the harbingers of extreme weather. With extreme weather, there is a movement of energy back to the Earth in terms of rainfall and wind intensity. Cloud height correlates to the amount of potential energy, and translates into rainfall amounts and wind velocities.
To demonstrate the link between satellite imagery and weather intensity, have students complete the Satellite Imagery Project (attachment 15). This assignment focuses on hurricanes and helps students relate weather strength with energy transfer as can be seen in satellite imagery. It would helpful to review a few satellite images with students before they begin the project.
Day 8 (optional)2nd Extension- Focuses on the computer skills test
Visit the following website:http://ncdesk.ncsu.edu/ncdesk/
It is designed to help students become more proficient on the NC computer skills test, which is given in the 8th grade. The following activity can be used with NC desk as a way to incorporate practice and computer literacy. After you visit the website you will need to go to download the current version.
Title Activity- Worst Weather in US HistoryReview vocabulary words and definitions prior to the lesson such as:
sort database record field text ascending order descending order
Pass out a copy of the Worst Weather in US History Handout (attachment 16)
Students will need access to computers and NC Desk will need to be loaded on all of them. Students can work individually, in pairs or you can present it to the class and work on it together. The answers are included as attachment 17.
7th grade 55

Students should NOT SAVE the database after answering the questions.
Surface Pressure MapUnited states
7th grade 56
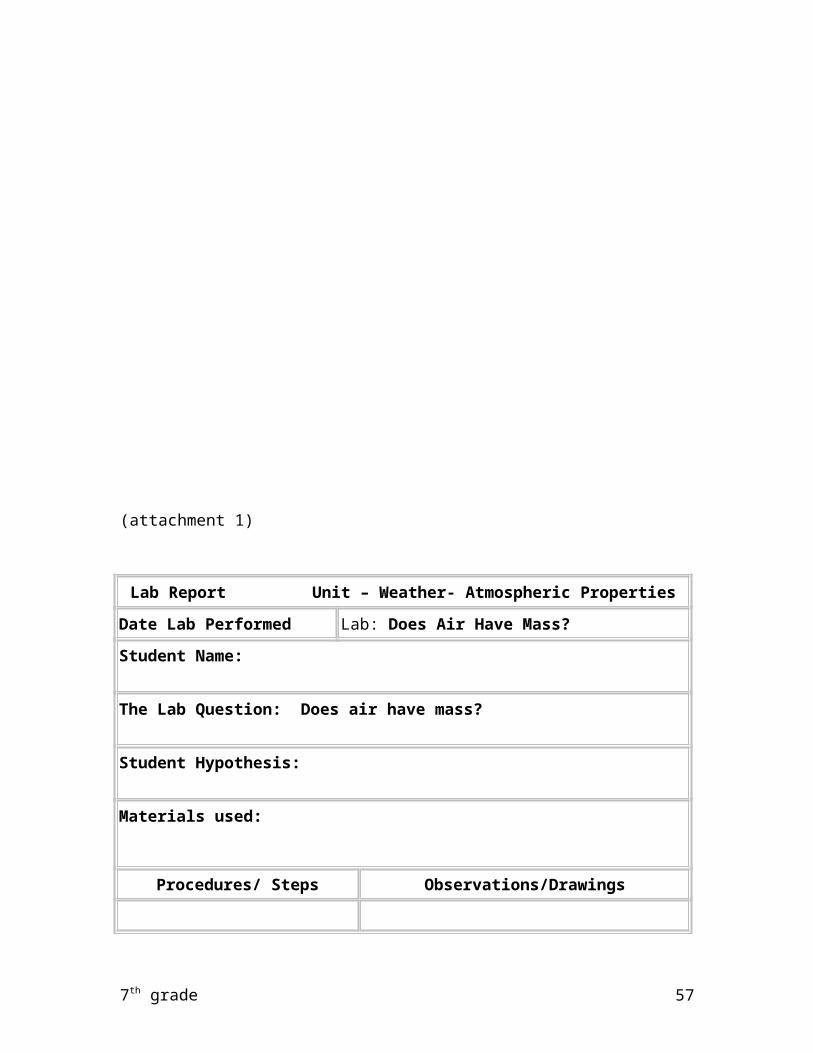
(Attachment 1- handout)
7th grade 57

Surface Pressure Map
This map shows the sea level pressures for various locations over the contiguous U.S. The values are in whole millibars.
Objective: Using a black colored pencil, lightly draw lines connecting identical values of sea level pressure. Remember, these lines, called isobars, do not cross each other. Isobars are usually drawn for every four millibars, using 1000 millibars as the starting point. Therefore, these lines will have values of 1000, 1004, 1008, 1012, 1016, 1020, 1024, etc., or 996, 992, 988, 984, 980, etc.
Procedure: Begin drawing from the 1024 millibars station pressure over Salt Lake City, Utah (highlighted in blue). Draw a line to the next 1024 value located to the northeast (upper right). Without lifting your pencil draw a line to the next 1024 value located to the south, then to the one located southwest, finally returning to the Salt Lake City value. Remember, isobars are smooth lines with few, if any, kinks.
The result is an elongated circle, centered approximately over Eastern Utah. The line that was drawn represents the 1024 millibars line and you can expect the pressure to be 1024 millibars everywhere along that line. Repeat the procedure with the next isobar value. Remember, the values between isobars is 4. Since there are no 1028 millibars values on the map, then your next line will follow the 1020 millibars reports. Then continue with the remaining values until you have all the reports connected with an isobar.
(Attachment 2- directions)
7th grade 58

Analysis: Isobars can be used to identify "Highs" and "Lows." The pressure in a high is greater than the surrounding air. The pressure in a low is lower than the surrounding air. Label the center of the high pressure with a blue H.
High pressure regions are usually associated with dry weather because as the air sinks it warms and the moisture evaporates. Low pressure regions usually bring precipitation because when the air rises it cools and the water vapor condenses.
Shade, in green, the state(s) would you expect to see rain or snow.
Shade, in yellow, the state(s) would you expect to see clear skies.
In the northern hemisphere the wind blows clockwise around centers of high pressure. The wind blows counterclockwise around lows.
Draw arrows around the "H" on your map to indicate the wind direction.
Draw arrows around the "L" on your map to indicate the wind direction.
(Attachment 2- directions continued)
7th grade 59

Surface Pressure Map Solution
(Attachment 3- answers)
7th grade 60

Surface Temperature Map
(Attachment 4- handout)
7th grade 61

Surface Temperature Map
Objective: Using a blue colored pencil, lightly draw lines connecting equal values of temperatures every 10°F. Remember, like isobars, these lines (called isotherms) are smooth and do not cross each other.
Procedure: You will draw lines connecting the temperatures, much like you did with the sea-level pressure map. However, you will also need to interpolate between values. Interpolation involves estimating values between stations which will enable you to properly analyze a map.
We will begin drawing from the 40°F temperature in Seattle, Washington (top left value). Since we want to connect all the 40°F temperatures together, the nearest 40°F value is located in Reno, Nevada, (southeast of Seattle). However, in order to get there you must draw a line between a 50°F temperature along the Oregon coast and a 30°F temperature in Idaho. Since 40°F is halfway between the two locations, your line from Seattle should pass halfway between the 50°F and 30°F temperatures.
(Attachment 5- directions)Place a light dot halfway between the 50°F and 30°F temperatures. This is your interpolated 40°F location.
7th grade 62
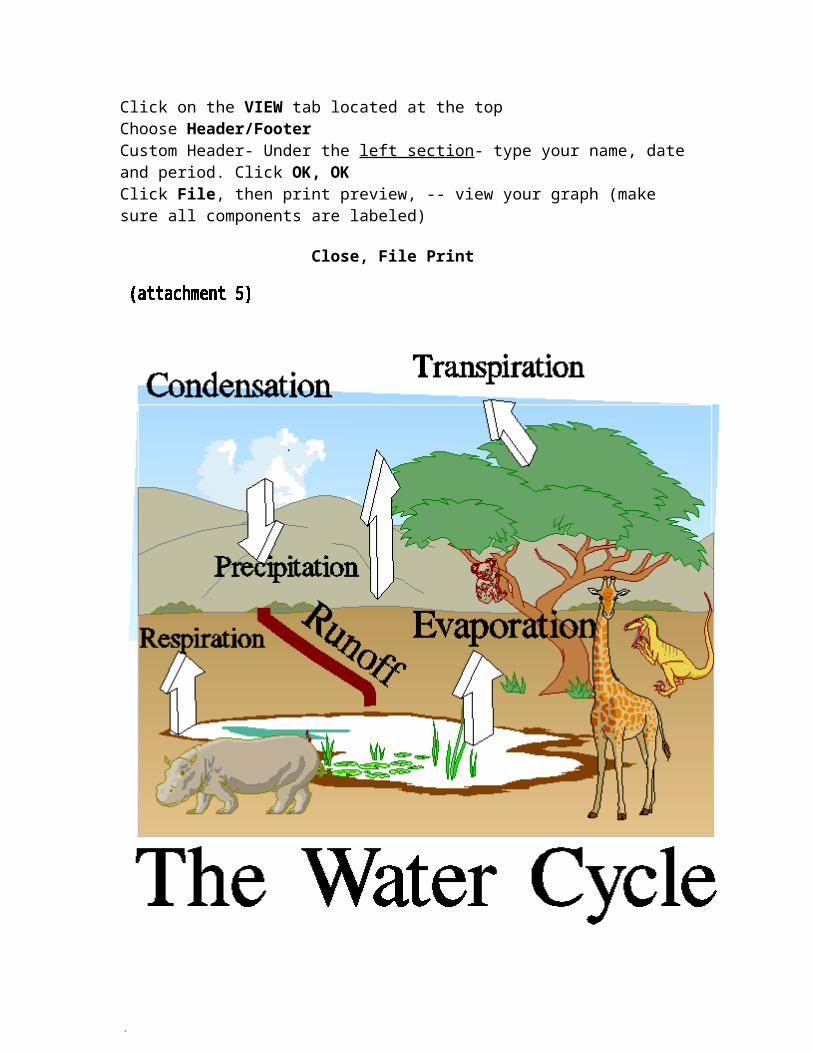
Next connect the Seattle 40°F temperature with the Reno 40°F temperature ensuring your line moves through your interpolated 40°F temperature. Continue connecting the 40°F temperatures until you get to Texas.
Now your line will pass between two values, 60°F and 30°F. Like the last time, you should make a mark between the 60°F and 30°F but this time a 50°F is also to be interpolated in addition to the 40°F. Between the 60°F and 30°F temperatures, place a small dot about 1/3 the distance from the 30°F and another small dot about 2/3 the distance from the 30°F. These dots become your interpolated 40°F and 50°F temperatures. Finish drawing your 40°F isotherm passing through your interpolated 40°F value. Repeat the above procedures with the other isotherms drawn at 10°F intervals. Label your isotherms.
Analysis: Isotherms are used to identify warm and cold air masses. Shade, in blue, the region with the lowest temperatures. Shade, in red, the region with the warmest air.
Note: Temperatures themselves are neither "cold" nor "hot." The air temperature is the measure of energy in the atmosphere. Often, television meteorologists will erroneously say "cold temperatures are moving in" or "we have hot temperatures in such and such place." What they should say is "cold air is moving in" or "the weather is hot" in describing the air mass as indicated by the temperatures.
(Attachment 5- directions continued)
7th grade 63

Surface Temperature Map Solution
(Attachment 6- answers)
7th grade 64

7th grade 65

Diagram adapted from Carolina Academic Press(Attachment 8)
7th grade 66

Diagram taken from: http://www.aos.wisc.edu/~hopkins/aos100/sfc-anl.htm (Attachment 9)
7th grade 67

Selected DataStreme Atmosphere Weather Map
SymbolsSurface Station Model
Temp (F)WeatherDewpoint (F)
Pressure (mb)Sky CoverWind (kts)
Data at Surface StationTemp 45 °F, dewpoint 29 °F,overcast, wind from SE at 15 knots,weather light rain, pressure 1004.5 mb
Upper Air Station Model
Temp (C)
Dewpoint (C)
Height (m)
Wind (kts)
Data at Pressure Level - 500 mbTemp -5 °C, dewpoint -12 °C,wind from S at 75 knots,height of level 5640 m
Forecast Station Model
Temp (F)WeatherDewpoint (F)
PoP (%)Sky CoverWind (kts)
Forecast at Valid TimeTemp 78 °F, dewpoint 64 °F,scattered clouds, wind from E at 10 knots,probability of precipitation 70% with rain showers
Diagram taken from: http://www.aos.wisc.edu/~hopkins/aos100/sfc-anl.htm
(Attachment 10)
7th grade 68

Map Symbols
Sky Cover Wind Fronts SelectedWeather Symbols
clear Calm cold front
warm front
Rain
1/8 1-2 knots (1-2 mph) stationary front
occluded
frontRain Shower
scattered
3-7 knots (3-8 mph)trough
Thunderstorm
3/8 8-12 knots (9-14
mph)radar intensities
Drizzle
4/8 13-17 knots (15-20
mph)tornado (T) #300
or Snow
5/8 18-22 knots (21-25
mph) severe thunderstorm (S) #287Snow Shower
broken 23-27 knots (26-31
mph)
Freezing Rain
7/8 48-52 knots (55-60
mph)Freezing
Drizzle
overcast 73-77 knots (84-89
mph) Fog
obscured
103-107 knots (119-123 mph) Haze
missing Shaft in direction wind is coming from
Smoke
Dust or Sand
Blowing Snow
(Attachment 11)
7th grade 69

Name _______________________________________ Date ___________
Storm Internet Scavenger HuntUse the listed website and the tabs found on it to answer the questions below.
Naming Hurricanes – http://www.enchantedlearning.com/subjects/weather/hurricane/naming.shtml
1. In what year did the National Weather Service start naming storms after women?
_____________________
2. What was the first United States named hurricane?_____________________
3. Why are some storm names retired? ______________________________________
4. If the alphabetical list of names gets used, what will they use to name storms?
________________________________________________________________
Hurricanes- http://www.enchantedlearning.com/subjects/weather/hurricane/naming.shtml
1. What symbol is used to indicate a hurricane on a weather map? _______________
2. Which alphabet letters are not used when naming storms? _____________________
3. Storms are named as soon as winds are _________ mph or more.
4. How do they decide when to use a male or female name? _____________________
5. How large can the eye of a hurricane actually be? _________________________
6. What do you call the wall of thunderclouds that surrounds the eye? ______________
7. What is the weather map symbol used for a tropical storm? _______________
8. A hurricane watch means that a hurricane is possible within ____ hours, in that area.
Naming Hurricanes-http://www.fema.gov/kids/hunames.htm
1. Who decides the names that are used for storms each year?
7th grade 70

_______________________________________________________
(attachment 12) (Answers)
Storm Internet Scavenger HuntUse the listed website and tabs found on it to answer the questions below.
Naming Hurricanes – http://www.enchantedlearning.com/subjects/weather/hurricane/naming.shtml
1. In what year did the National Weather Service start naming storms after women?
1953
2. What was the first United States named hurricane? George
3. Why are some storm names retired? The storm was too devastating
4. If the alphabetical list of names gets used, what will they use to name storms?
The Greek Alphabet
Hurricanes- http://www.enchantedlearning.com/subjects/weather/hurricane/naming.shtml
1. What symbol is used to indicate a hurricane on a weather map?
2. Which alphabet letters are not used when naming storms? Q,U,X,Y,Z
3. Storms are named as soon as winds are 39 mph or more.
4. How do they decide when to use a male or female name? they are alternated
5. How large can the eye of a hurricane actually be? 20-30 miles
6. What do you call the wall of thunderclouds that surrounds the eye? eyewall
7. What is the weather map symbol used for a tropical storm?
8. A hurricane watch means that a hurricane is possible within 36 hours, in that area.
Naming Hurricanes-http://www.fema.gov/kids/hunames.htm
1. Who decides the names that are used for storms each year?
World Meteorological Organization
7th grade 71

(attachment 12- answers)
Sample Weather Map
(Attachment 13)
7th grade 72

7th grade 73
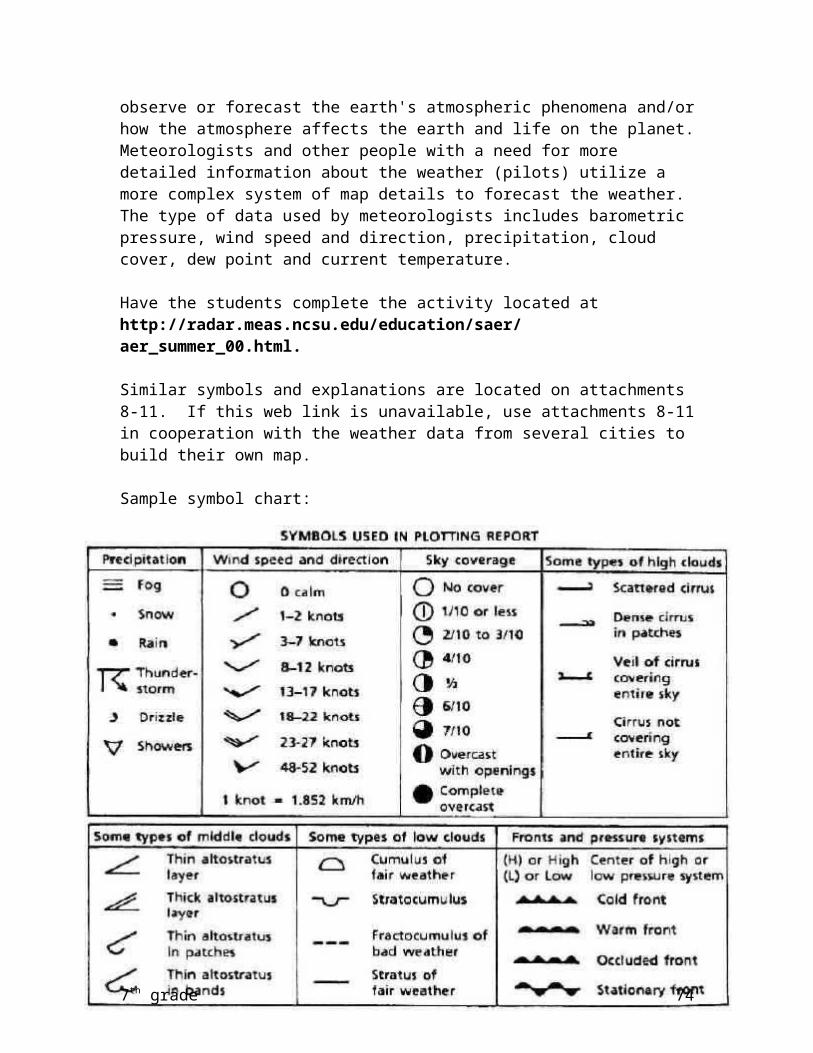
Satellite Imagery Project
Choose a hurricane that has made landfall in the U.S. in the last 30 years. For your chosen hurricane, provide the following information:
Computer-generated map of the path of the hurricane from Category 1 status to its ultimate disintegration.
Infrared color picture of the hurricane with an explanation of the meaning of the different colors that appear for rainfall intensity, energy and wind speed.
A one-page typed explanation of the hurricane’s history – path , pressure, landfall, category , wind speed, storm surge, overall size, death toll (if applicable) and monetary cost.
It would be beneficial to consult some of the following websites for information:
The National Hurricane Center – http://www.nhc.noaa.gov/
Weather Underground – tropical weather – http://www.wunderground.com/tropical/
NOAA Home Page – http://hurricanes.noaa.gov/
Atlantic Hurricane Information Network – http://www.hurricanes.net/
Unisys Weather – Hurricanes – http://weather.unisys.com/hurricane/
Hurricane.com - http://www.hurricane.com/
The Weather Channel - http://www.weather.com/newscenter/hurricanecentral/?cm_ven=PPCgoogle&cm_cat=Hurricane&cm_pla=2007%2520Hurricanes&cm_ite=hurricane%2520information
7th grade 74

(Attachment 15)
Name __________________________________Worst Weather in US History
Directions: Use the database entitled “Worst Weather in US History” to answer the following questions. DO NOT SAVE the database after answering the questions.
Sort Questions
1. How many fields are in each record? ____________________________
2. How many of them are text fields? ______________________________
3. How many of the fields are number fields? ________________________
4. How many of the fields are date fields? __________________________
5. How many records are in the database? _________________________
Sort the database by NAME in ascending order
6. How many deaths occurred as a result of the event in the first record? ____________
7. In what year did the last record occur? ______________________
8. What was the cost of the 10th record? _______________________
Sort the database by YEAR in descending order
9. What is the most recent event to occur in the United States? _________________
10. What is the name of the event in the last record? __________________________
11. What type of storm was the 5th record? __________________________________
Sort the database by DEATHS in ascending order
12. What is the name of the event which caused the most deaths? _______________
13. Which event caused 100 deaths? ____________________________
7th grade 75

14. Which type of storm caused 30 deaths? _______________________
Name __________________________________
Worst Weather in US History- AnswersDirections: Use the database entitled “Worst Weather in US History” to answer the following questions.
Sort Questions
1. How many fields are in each record? _______6__
2. How many of them are text fields? _________4___
3. How many of the fields are number fields? _____1__
4. How many of the fields are date fields? _______1__
5. How many records are in the database? ______26__
Sort the database by NAME in ascending order
6. How many deaths occurred as a result of the event in the first record? _____65__
7. In what year did the last record occur? _______1925___
8. What was the cost of the 10th record? _________$600_million_
Sort the database by YEAR in descending order
9. What is the most recent event to occur in the United States? __Evansville disaster
10. What is the name of the event in the last record? __The Great White Hurricane
11. What type of storm was the 5th record? ______Tornado____
Sort the database by DEATHS in ascending order
12. What is the name of the event which caused the most deaths? Galveston Storm
7th grade 76
13. Which event caused 100 deaths? _________Hurricane Hugo_____
14. Which type of storm caused 30 deaths? _______Blizzard____
I. Grade Level/Unit Number: 7th Grade
II. Unit Title: Air Pollution – It’s More Expensive than You Think
III. Unit Length: 9 days
IV. Objectives Included: 1.01, 1.04, 1.05, 1.06, 1.08, 3.02, 3.03, 3.04
V. Materials Needed:2 standard size (3x5) index cards per student/groupSmall grid (less than standard 4x4 graph paper) graph paperGlueClear packing tapeStaplesStringMagnifying glasses or dissecting microscopePoster board or butcher paperDownloaded copy of Air Jeopardy or play online version
Day 1Engage: Search unitedstreaming.com for the following video-(http://streaming.discoveryeducation.com/index.cfm)
Title: Enviro-Tacklebox: Module 1: Science in Personal and Social Perspective: You & Me & UV (20 min)
It gives an overview of ultra-violet rays, the ozone and how to protect yourself from sun damage. Show the entire video or choose segments appropriate for your discussion. Students can answer the following questions while they view the segments.
The answers to the questions are included for post-video discussion.
1. What does SPF stand for? Sun protection factor2. Do you absorb ultra violet rays in winter? Yes3. You can find ultra violet light just below which color on a spectrum? Purple or
violet4. What does light travel in? Waves or frequencies5. Gamma rays can be used to kill _cancer _ cells.6. The ultraviolet spot on a butterfly wing tells if it is ….. male or female7. What does ozone filter out? UVC
7th grade 77

8. In which layer of the atmosphere do you find the protective layer of ozone? Stratosphere
9. UV _A__ penetrates the top layer of the skin.UV _B__ damages skin cells and may be linked to skin cancer.
10. What vitamin does our skin get from the sun? vitamin D 11. What is sunburn caused by? Ultraviolet light 12. What human body system does sun damage harm? Immune 13. Are tanning booths a safe way to get a tan? NO 14. What are the peak hours for sun exposure? 9am-3pm standard time 15. You should use a lotion with a SPF of at least…. 15
Day 2Begin the unit by asking this question – “Is the air that we breathe here in insert your city name healthy?” Be sure to have students provide an example/justification for their opinion. Place all the answers on the board and group them in whatever categories seem appropriate. You may also want to ask a question comparing the air quality now versus 50 or 100 years ago. It will be interesting to see how students respond. Next, ask the question – “What is the Air Quality Index? What is it used for? What are the implications for our city/school?” Briefly explain the Air Quality Index (Attachment #1). If possible, check the local newspaper or television weather report to investigate current air quality levels.
Go to the EPA website on air quality http://www.epa.gov/airtrends/factbook.html and choose a city to show trends in air quality. Have the students graph this data and make comparison between regions, city size or some other factor. Point out that one of the measures of air quality is ozone, O3.
Ask the questions: What do you know about ozone? Is ozone good or bad? Enter into a discussion of stratospheric ozone versus tropospheric or ground level ozone. Stratospheric ozone is the substance that makes up the ozone layer and protects the Earth from harmful UV (ultraviolet) radiation. Tropospheric ozone is produced by the burning of fossil fuels and is one of the main components of urban smog. That is why ozone, something that many people only link to UV protection, is one of the criteria used to gauge air quality.
Go to the Web and find pictures of good and bad air quality to show the students. Try to pick both urban and rural settings. Be sure to explain that although ozone does react with other chemicals to form smog, it is a colorless gas and is not easily seen. A picture of the “haze” over the North Carolina mountains can be used as an example of poor air quality, but the area is very rural.
Some examples of images are the following:http://img1.photographersdirect.com/img/12956/pd318428_s.jpghttp://img1.photographersdirect.com/img/19941/pd1167231_s.jpghttp://img1.photographersdirect.com/img/9009/pd1320921_s.jpg
7th grade 78

http://img1.photographersdirect.com/img/15356/pd1445503_s.jpg
Day 3Explore- Ask the students to brainstorm on ways to determine air quality at a particular location. Most students will start big in their discussions. Continue to question until you work your way to checking the air quality in/around your school.
Introduce and use the “airborne junk detector” or other commercial air quality detectors to investigate the air quality in/around your school (Attachment #2).
Have the students consider the following questions when determining the location for their detectors:
1. Where is student traffic heaviest?2. Where do students spend the largest portion of their day?3. Which areas of the school are less traveled, but also may not get as much
attention from the custodial staff?
After collecting data from their air junk collector have students complete a Triarama or other foldable about the relative amount of particulate matter (or other measurable pollutants if you used a commercial kit) that are located at your school. (Attachment #3)
Day 4Explain-Air pollution is not a new phenomenon. It occurs in natural and man-made forms. Natural air pollution includes particulate matter from volcanoes, and nitrogen and sulfur oxides (also from volcanic activity) that form with water vapor to form acidic rain. Man made forms of air pollution may be very ancient (burning wood) to those originating in the 20th century (Chlorofluorocarbons – CFCs, halons). A complete table of pollutants is located on attachment 4.
After a brief discussion of the pollutants, divide the class into groups of three. Provide each student with information on three of the pollutants, their sources, and effects. Each student becomes the “expert” for their particular information. Once students have mastered their material, they need to “teach” their fellow teammates the information. After the information is disseminated to the members of the group, each group will place their information on poster board or butcher paper and present to the class. Information presentation types may vary, but encourage your groups to utilize concept maps, graphic organizers or formats other than simple lists. In this way, students take more ownership of the information. After completion of the project, students should hang their creations on the wall (names on the back) for later evaluation by the class. All students will critique the projects according to the following questions:
Is the information clearly stated and legible?
7th grade 79

Is the presentation of the information creative and aesthetically pleasing?How could their project be improved? In other words, what are they missing?
Day 5 and 6Elaborate:Due to the variety of pollutants that contribute to the Air Quality Index, it is difficult to isolate single contributors to health problems. Therefore, discussions of reduced health risks, economic costs, and possible solutions will encompass overall air quality problems.
From information in attachment 4, one can see that the major cause of air pollution in North Carolina (as well as other states) is caused by the burning of fossil fuels. Emissions from fossil fuel combustion come primarily from automobiles and industry. It is possible to measure and regulate direct amounts of air pollution from industrial smoke stacks and during emission testing of cars during an annual inspection (point source pollution). It is more difficult, however, to measure a quantity of a pollutant in the air and trace it directly back to only one source (non-point source pollution). This is especially true since air readily travels across county, state and country lines. If the pollution comes from many sources, it is also called non-point source pollution.
Poor air quality can also have economic effects on a city or region. Most people think of air quality issues as primarily outdoor air pollution. In 2004, the American Lung Association estimated the total cost of asthma-related illness (one of the major human health effects of poor air quality) was $16.1 billion. Direct costs from this disease are related to medical expenses. Of this cost, approximately $4.6 billion (24%) was a result of indirect cost such as lost wages, missed school days, and loss of productivity due to death.
Indoor air pollution is also another major problem, especially in schools. The North Carolina Department of Health and Human Services has estimated that poor indoor air quality, especially in schools, costs approximately $100 million annually. Taking the costs of both outdoor and indoor air pollution into consideration, one can see that poor air quality is bad for our health, and also costly economically.
To gain a better understanding of the effects of poor air quality, have students complete an air quality Power Point Presentation (Attachment #5). If students do not have computers at home, have them complete research at school and write their information in the form of an essay or an illustrated children’s book.
Day 7Evaluate:After completion of this unit, test your students’ understanding using the Air Jeopardy produced by the North Carolina Division of Air Quality. This game is located at http://daq.state.nc.us/airaware/edu/. You can either download the questions and produce a hardcopy Jeopardy board or play the game online.
7th grade 80

A second activity to evaluate understanding is for students to produce a brochure to present to businesses promoting healthy indoor and outdoor air quality. In the brochure, students should address not only the health reasons for improving air quality, but also touch on costs, savings and worker productivity (number of days lost to air quality related illnesses).
Day 8 (optional)Extension 1: Contact other 7th grade science teachers in your area about conducting similar air quality tests in their school. Have students develop a plan to present to the administration about improving AQ in the schools. The plan should be based on physical evidence collected by students (see “Junk Detector “data, Attachment #2). Besides the collection of particulate matter, evidence can also be gathered investigating the type of cleaning products used, age of the HVAC units, frequency of cleaning air filters, etc.
Day 9 (optional)Extension 2: An additional activity is to have a group of students participate in the “Awful Eight Lesson Plan.” This activity takes the form of a play and allows students to build skills in public speaking, drama, and presenting in front of a crowd. The play can be downloaded at:
http://www.uncw.edu/smec/gk_fellows/Documents/TheAwfulEightLessonPlan.pdf
Students not directly participating in the play should write an evaluative essay explaining the purpose of the play and the effectiveness of the presentation.
An air pollution crossword puzzle is also included (Attachment 6).
Additional Resources:http://www.uncw.edu/smec/gk_fellows/Documents/TheAwfulEightLessonPlan.pdfhttp://daq.state.nc.us/airaware/edu/http://www.epa.gov/airtrends/factbook.htmlhttp://www.epi.state.nc.us/epi/air/schools.htmlhttp://www.asthma.ncdhhs.gov/ncapBurdenReport.htmlhttp://www.DiscoverySchool.comhttp://www.factmonster.com/ipka/A0004695.html
7th grade 81

Air Quality Weather Conditions Recommended Actions Health Effects
Good
AQI: 0-50
(Green)
Cool summer temperatures Windy conditions Significant cloud cover
Heavy or steady precipitation
Keep cars and boats tuned up
Use environmentally safe paints and cleaning products
Conserve electricity-set A/C to highest comfortable level
No health effects are expected.
Moderate
AQI: 51-100
(Yellow)
Temperatures in the upper 70's to lower 80's
Light to moderate winds Partly cloudy or mostly
sunny skies
Chance of rain or afternoon thunderstorms
Unusually sensitive people should consider limiting prolonged outdoor exertion.
Unhealthy for Sensitive
Groups
AQI: 101-150
(Orange)
Temperatures in the 80's and 90's
Light winds Mostly sunny skies
Slight chance of afternoon thunderstorms
Limit daytime driving
Limit vehicle idling
Refuel vehicles after dusk
Don't "top off" your gas tank
Avoid congested periods
Use water-based paints
Use transit or car pool
Bike or walk for short trips
Use newest/best maintained car
Combine trips and share rides
Postpone using gasoline mowers
Barbecue without starter fluid
Active children and adults, and people with respiratory disease, such as asthma, should limit prolonged outdoor exertion.
Unhealthy
AQI: 151-200
(Red)
Hot, hazy, and humid Stagnant air Sunny skies
Little chance of precipitation
Active children and adults, and people with respiratory disease such as asthma, should avoid prolonged outdoor exertion; everyone else, especially children, should limit prolonged outdoor exertion.
Very Unhealthy
AQI: 201-300
(Purple)
Hot and very hazy Extremely stagnant air Sunny skies
No precipitation
Active children and adults, and people with respiratory disease such as asthma, should avoid all outdoor exertion; everyone else, especially children, should avoid prolonged outdoor exertion.
AQI refers to the Air Quality Index.An AQI of 100 is equivalent to the National Ambient Air Quality Standard (NAAQS).
An AQI greater than 100 is considered to be above the national standard or NAAQS.An AQI Calculation Table is available online to convert raw ozone concentrations to the Air Quality Index
*The weather conditions listed above are common weather types associated with the respective air quality levels.A combination of part or of all these weather conditions could lead to a certain level of observed air quality.
7th grade 82

(Attachment 1) http://daq.state.nc.us/Ozone/codecalc.shtml- Division of Air Quality
7th grade 83

Airborne Junk Detector LabPurpose: The purpose of this lab is to demonstrate how different areas within/around a building are prone to accumulate small particulate matter. Airborne particulate matter is used as one of the indicator of air quality.
Materials Needed:
2 standard size (3x5) index cards per student/groupSmall grid (less than standard 4x4 graph paper) graph paperGlueClear packing tapeStaplesStringMagnifying glasses or dissecting microscope
Procedure:
Each student should obtain a piece of graph paper smaller than the index cards that will be used in the experiment. Glue the graph paper to one index card, and set aside to dry. On the second card, cut out the center leaving a rectangular border of 1.5 – 2 cm in width. Place pieces of the packing tape over the hole in the second index card. The card will now have one side that is sticky from the tape, and one side that is not adhesive. With the sticky side of the second index card facing upward, place card two over the first card with the graph paper. BE SURE THE STICKY SIDE OF THE TAPE IS FACING AWAY FROM THE GRAPH PAPER. Connect the two cards together by stapling around the border. Attach a piece of string to the top of the “junk detector” for hanging purposes. Be sure to put your name somewhere on the detector.
Card 1 Card 2
Finished Product
7th grade
Graph Paper
Graph Paper
84
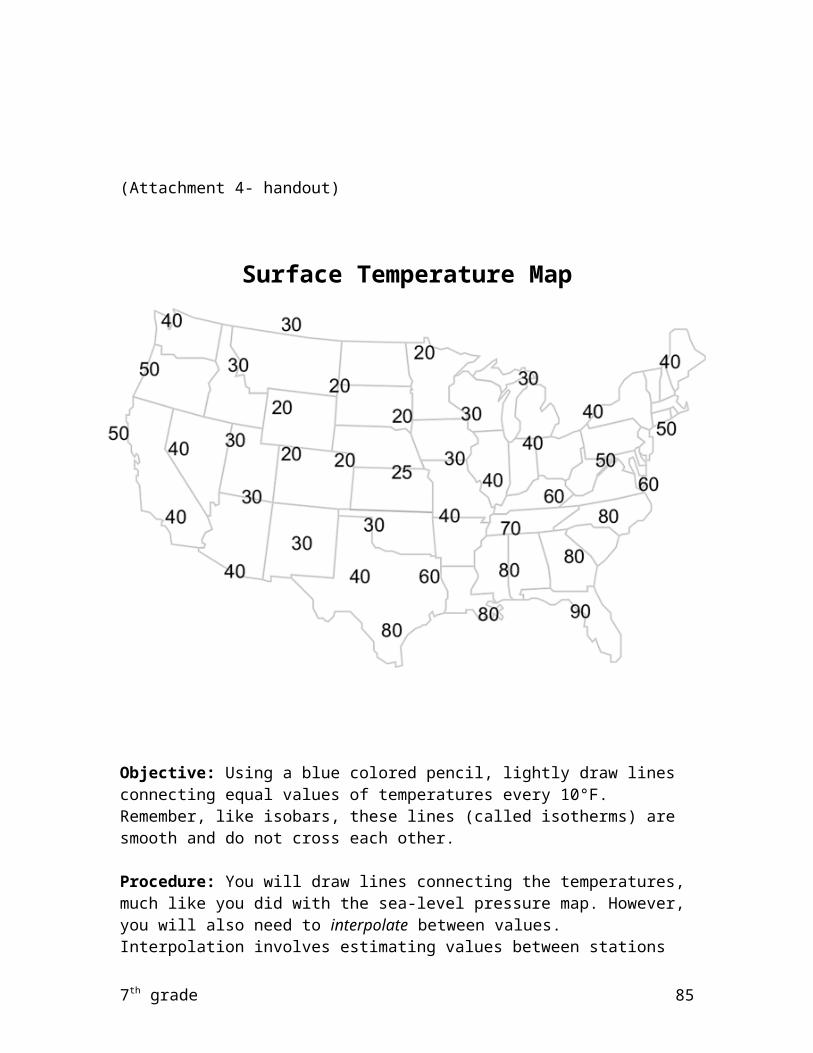
7th grade 85

Place the “junk detectors” in different locations in/around the school for 2-4 days. Be sure that any outside detectors are protected from rain.
After collecting the detectors, use the magnifying glass to attempt to count the number of particles in a predetermined number of grid spaces.
Choose 3 random locations around your graph paper and average the number of particles for the 3 measurements.
Compare the number of airborne particles from each location and develop a chart/graph to show the results. These data, although rather qualitative during to the particle counting method, should show differences in the relative amounts of airborne particles in/around a school.
Be sure to point out to the students that many of the smaller particles collected may be small enough to inhale and affect the respiratory and/or immune systems.
(Attachment 2- continued)
7th grade 86
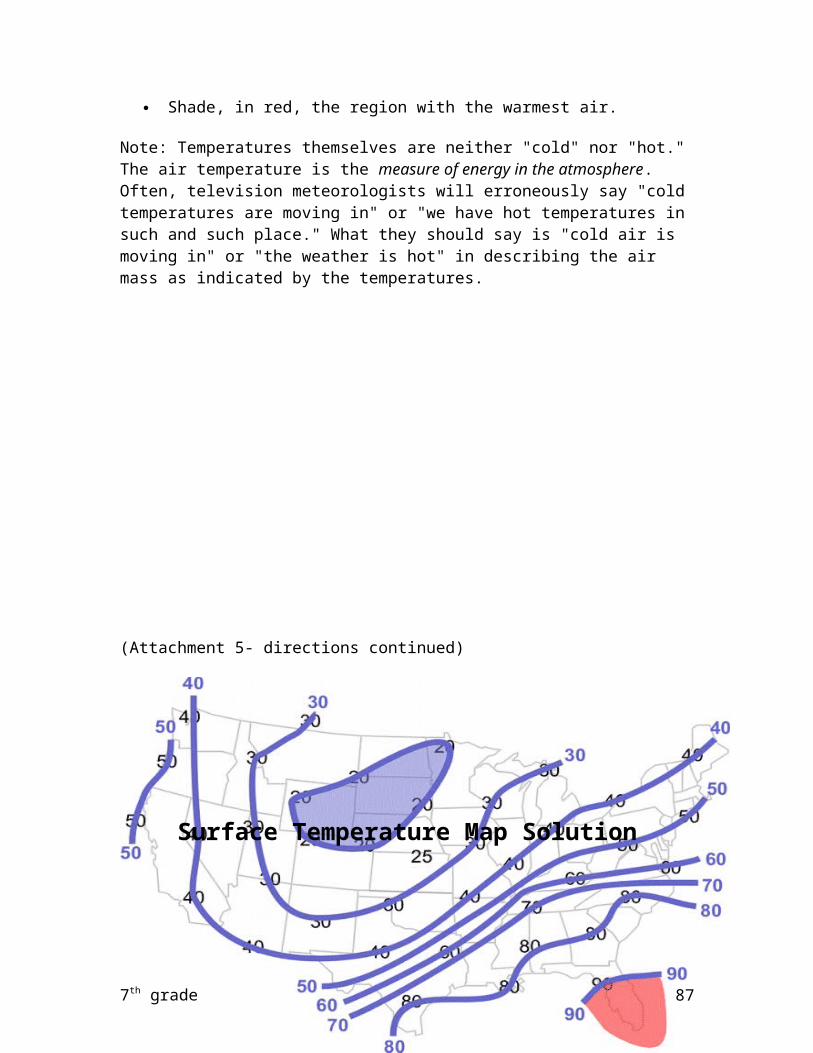
Name____________________________________ Due Date ___________
Include information about the particulate matter you collected during the lab.
An example Triarama to guide your thinking:
Side 1- Draw the graph of the relative amounts of particulate matter from different locations within your school.
Side 2- Describe the four top air pollutants located near your school.
Side 3- Suggest ways to reduce the air pollution in or around your school.
1. Cut paper to create a perfect square by folding the corner of the paper to the opposite side, and then cut off the excess.
2. Fold the top right corner of the square down to the lower left corner, making a half X.
3. Repeat step 2, making the folded marks of a completed X.
4. Cut one side of a triangle to the center.
5. Add your information to the inside or outside and then staple the unused flap to form a pyramid.
7th grade 87

(Attachment 3) Foldable diagram adapted from Creative Teaching Press
Major Air PollutantsPollutant Sources EffectsOzone. A gas that can be found in two places. Near the ground (the troposphere), it is a major part of smog. The harmful ozone in the lower atmosphere should not be confused with the protective layer of ozone in the upper atmosphere (stratosphere), which screens out harmful ultraviolet rays.
Ozone is not created directly, but is formed when nitrogen oxides and volatile organic compounds mix in sunlight. That is why ozone is mostly found in the summer. Nitrogen oxides come from burning gasoline, coal, or other fossil fuels. There are many types of volatile organic compounds, and they come from sources ranging from factories to trees.
Ozone near the ground can cause a number of health problems. Ozone can lead to more frequent asthma attacks in people who have asthma and can cause sore throats, coughs, and breathing difficulty. It may even lead to premature death. Ozone can also hurt plants and crops.
Carbon monoxide. A gas that comes from the burning of fossil fuels, mostly in cars. It cannot be seen or smelled.
Carbon monoxide is released when engines burn fossil fuels. Emissions are higher when engines are not tuned properly and when fuel is not completely burned. Cars emit a lot of the carbon monoxide found outdoors. Furnaces and heaters in the home can emit high concentrations of carbon monoxide, too, if they are not properly maintained.
Carbon monoxide makes it hard for body parts to get the oxygen they need to run correctly. Exposure to carbon monoxide makes people feel dizzy and tired and gives them headaches. In high concentrations it is fatal. Elderly people with heart disease are hospitalized more often when they are exposed to higher amounts of carbon monoxide.
7th grade 88
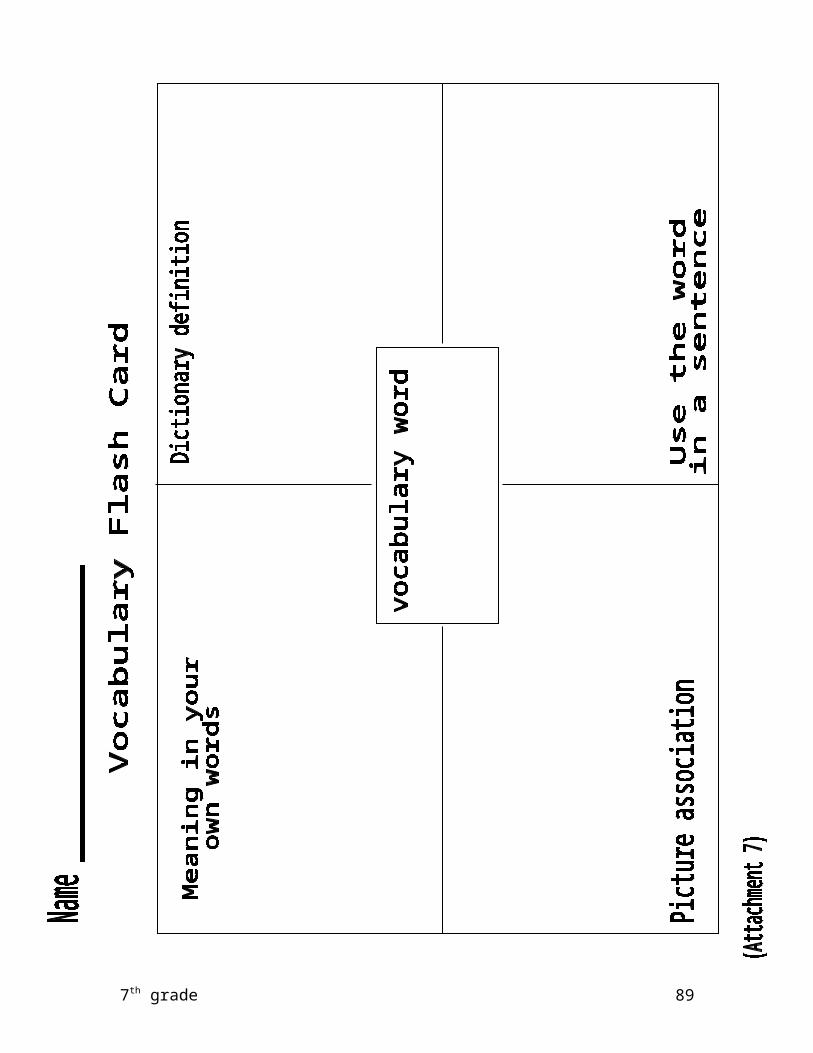
Nitrogen dioxide. A reddish-brown gas that comes from the burning of fossil fuels. It has a strong smell at high levels.
Nitrogen dioxide mostly comes from power plants and cars. Nitrogen dioxide is formed in two ways—when nitrogen in the fuel is burned, or when nitrogen in the air reacts with oxygen at very high temperatures. Nitrogen dioxide can also react in the atmosphere to form ozone, acid rain, and particles.
High levels of nitrogen dioxide exposure can give people coughs and can make them feel short of breath. People who are exposed to nitrogen dioxide for a long time have a higher chance of getting respiratory infections. Nitrogen dioxide reacts in the atmosphere to form acid rain, which can harm plants and animals.
Pollutant Sources Effects
Sulfur dioxide. A corrosive gas that cannot be seen or smelled at low levels but can have a “rotten egg” smell at high levels.
Sulfur dioxide mostly comes from the burning of coal or oil in power plants. It also comes from factories that make chemicals, paper, or fuel. Like nitrogen dioxide, sulfur dioxide reacts in the atmosphere to form acid rain and particles.
Sulfur dioxide exposure can affect people who have asthma or emphysema by making it more difficult for them to breathe. It can also irritate people's eyes, noses, and throats. Sulfur dioxide can harm trees and crops, damage buildings, and make it harder for people to see long distances.
Lead. A blue-gray metal that is very toxic and is found in a number of forms and locations.
Outside, lead comes from cars in areas where leaded gasoline is used. Lead can also come from power plants and other industrial sources. Inside, lead paint is an important source of lead, especially in houses where paint is peeling. Lead in old pipes can also be a source of lead in drinking water.
High amounts of lead can be dangerous for small children and can lead to lower IQs and kidney problems. For adults, exposure to lead can increase the chance of having heart attacks or strokes.
Toxic air pollutants. A large number of chemicals that are known or suspected to cause cancer. Some important pollutants in this category include arsenic, asbestos, benzene, and dioxin.
Each toxic air pollutant comes from a slightly different source, but many are created in chemical plants or are emitted when fossil fuels are burned. Some toxic air pollutants, like
Toxic air pollutants can cause cancer. Some toxic air pollutants can also cause birth defects. Other effects depend on the pollutant, but can include skin and eye irritation
7th grade 89

asbestos and formaldehyde, can be found in building materials and can lead to indoor air problems. Many toxic air pollutants can also enter the food and water supplies.
and breathing problems.
Stratospheric ozone depleters. Chemicals that can destroy the ozone in the stratosphere. These chemicals include chlorofluorocarbons (CFCs), halons, and other compounds that include chlorine or bromine.
CFCs are used in air conditioners and refrigerators, since they work well as coolants. They can also be found in aerosol cans and fire extinguishers. Other stratospheric ozone depleters are used as solvents in industry.
If the ozone in the stratosphere is destroyed, people are exposed to more radiation from the sun (ultraviolet radiation). This can lead to skin cancer and eye problems. Higher ultraviolet radiation can also harm plants and animals.
Greenhouse gases. Gases that stay in the air for a long time and warm up the planet by trapping sunlight. This is called the “greenhouse effect” because the gases act like the glass in a greenhouse. Some of the important greenhouse gases are carbon dioxide, methane, and nitrous oxide.
Carbon dioxide is the most important greenhouse gas. It comes from the burning of fossil fuels in cars, power plants, houses, and industry. Methane is released during the processing of fossil fuels, and also comes from natural sources like cows and rice paddies. Nitrous oxide comes from industrial sources and decaying plants.
The greenhouse effect can lead to changes in the climate of the planet. Some of these changes might include more temperature extremes, higher sea levels, changes in forest composition, and damage to land near the coast. Human health might be affected by diseases that are related to temperature or by damage to land and water.
7th grade 90
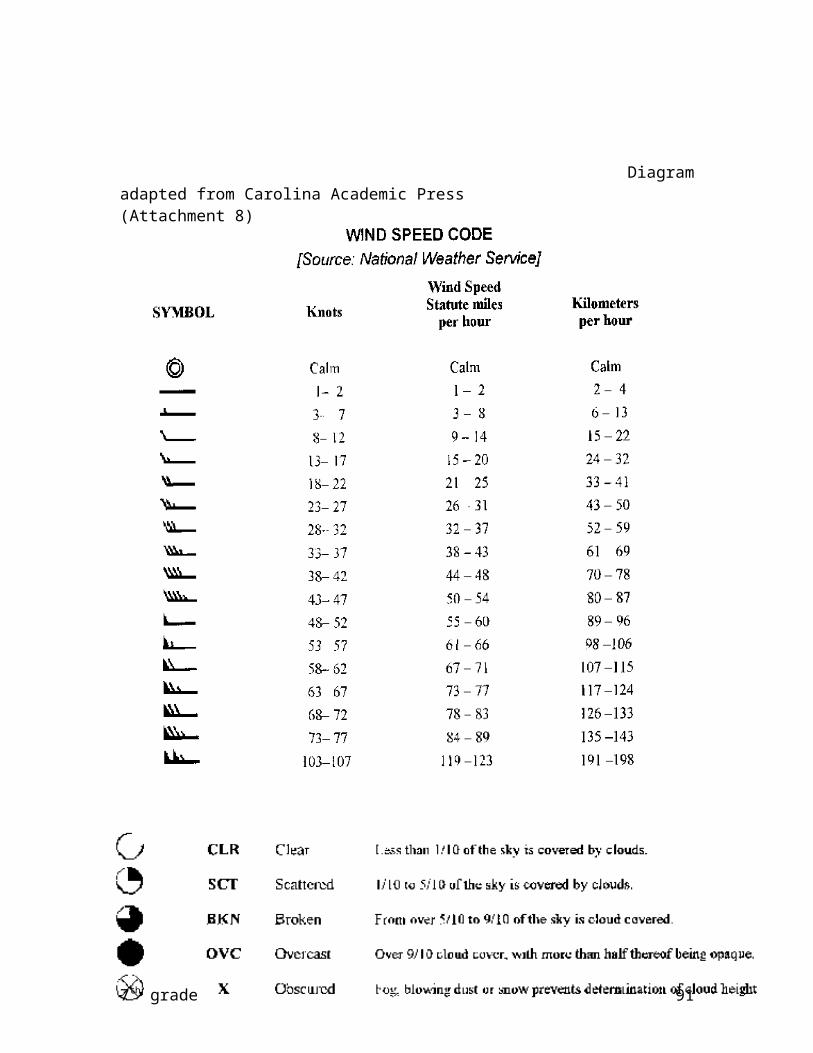
(Attachment 4- all 3 pages) http://www.factmonster.com/ipka/A0004695.html
7th grade 91

Air Quality Power PointAs part of the study of Air Quality, each student will complete a Power Point presentation that will cover the following topics.
1. Pollutants directly related to human health issues – respiratory problems.
2. Pollutants that influence plants and animals other than humans.
3. Pollutants linked to the destruction of the ozone layer.
Presentations are to contain at least 2 slides per topic. Information on each slide must be at least 5 sentences/bullets in length. The presentation must include a title slide, at least one (1) chart or table, graphics on each slide and a list of citations. In addition, students need to provide reasonable suggestions for reducing and/or eliminating these pollutants. A grading rubric is included below.
Assessment Rubric for a Technology Presentation
Points PointsPossible Earned
Concepts and information are appropriate and accurate. _____ _____
Student demonstrates thoughtful mastery _______ ______of the content.
All required information is included. ______ ______
Student uses graphics to highlight ideas ______ ______or supplement information.
Student uses appropriate backgrounds ______ ______to create interest and appropriate visualdifferentiation.
The presentation is organized with a ______ ______beginning, body and conclusion.
Correct spelling, grammar and ______ ______punctuation is evident.
7th grade 92

(Attachment 5)
Air PollutionP U T U Z O U Y N D R D G J W S L G Y I E A A A F B Q J W O G Z V C G M I G P K R K R E D I X O I D B E U K M O S A A J T B Y T E E T B E G H R N B A G S A G C I C I F I H R P X D Q N A S C M O R Y K A F C U N C F V V D I W R C F W F P Z N G N U L R Z L C A N C E R U G J V R I S K Q Z C R V U E R F U K E Q C W B T I F C W N D G Y X N S Y U L Z O B Y R G V N X H E I F O C O W D F X X U A O M M I W R U D K H O D V E R Q W T D G W R D B L D C D I K V J R R K T P J E D O V R N F E B H G D E B B T K N O N E C O Z O V W B X U O R D V G M H X L P X D M Y O C E V W R Q Z V A O X T E L B A U G J M N I Z E K X M M L U G Y F U S A K J P F M E O D M H H R J G U Y L T R X T C A C O N K K N T F S L V L W V I P P D W A B B L N D S F B O K M K I D O O T U D M E D U W A I F G U C M X N C N C H A T B B A D
ASTHMA CARBON DIOXIDE
CANCER FOSSIL
FUEL LUNG
NITROGEN OZONE
PARTICLES POLLUTION
SMOG
7th grade 93

(Attachment 6) Created by Puzzlemaker at DiscoverySchool.com
Weather Resource List
Interactive Sites:
Discovery channel- Anatomy of a Disasterhttp://dsc.discovery.com/convergence/perfectdisaster/tours/tours.html
Climate change games/quizzeshttp://epa.gov/climatechange/kids/games/index.html
Climate, weather, greenhouse effecthttp://epa.gov/climatechange/kids/index.html
Global Warming simulationhttp://epa.gov/climatechange/kids/version2.html
Storm Quiz- 2 player jeopardyhttp://www.quia.com/cb/4786.html
Storm simulationhttp://www.wcmsolutions.com/products/thestorm/index.html
Water Cycle videohttp://www.epa.gov/safewater/kids/flash/flash_watercycle.html
Weather and cloud gameshttp://eo.ucar.edu/webweather/games.html
Weather playtimehttp://www.weather.gov/om/reachout/kidspage.shtml
Climate Gameshttp://radar.meas.ncsu.edu/education/games.htm
Web Weather for Kidshttp://eo.ucar.edu/webweather/
Cloud pictureshttp://vortex.plymouth.edu/clouds.html/
Kid’s Hazards- Various Quizzeshttp://www.ngdc.noaa.gov/seg/hazard/kqStart.shtml
Kidstorm
7th grade 94

http://skydiary.com/kids/
Lightning Experiments- http://weathereye.kgan.com/cadet/lightning/experiment.html
Lightning Safety Quiz- http://www.mos.org/sln/toe/safety.html
Make your own weather tools- http://www.fi.edu/weather/todo/todo.html
NASA weather photos & clips- http://rsd.gsfc.nasa.gov/rsd/movies/preview.html
How to read a weather map-http://www.srh.noaa.gov/jetstream/synoptic/wxmaps.htm
Reading weather maps- http://www.can-do.com/uci/ssi2001/weathermaps.html
Reading and creating a weather maphttp://www.bigelow.org/virtual/handson/create_weather_map.html#temp
The National Hurricane Center – http://www.nhc.noaa.gov/
Weather Underground – tropical weather – http://www.wunderground.com/tropical/
NOAA Home Page – http://hurricanes.noaa.gov/
Atlantic Hurricane Information Network – http://www.hurricanes.net/
Unisys Weather – Hurricanes – http://weather.unisys.com/hurricane/
Hurricane.com - http://www.hurricane.com/
The Weather Channel - http://www.weather.com/newscenter/hurricanecentral/?cm_ven=PPCgoogle&cm_cat=Hurricane&cm_pla=2007%2520Hurricanes&cm_ite=hurricane%2520information
Fujita Scale- http://science.howstuffworks.com/tornado3.htm
NC Weather database by county: http://www.weatherbase.com/weather/city.php3?c=US&s=NC&refer=
Interactive weather maker simulation-http://www.iknowthat.com/com/L3?Area=Science%20Lab
7th grade 95

Resource Sites:
Clouds and Precipitationhttp://ww2010.atmos.uiuc.edu/(Gh)/guides/mtr/cld/home.rxml
Fujita Tornado Damage Scalehttp://www.spc.noaa.gov/faq/tornado/f-scale.html
Global Warming Photoshttp://www.climatehotmap.org/photos/photoallevents.html
New Enhanced Fujita Scalehttp://www.spc.noaa.gov/efscale/
Several Weather Linkshttp://www.illiniweather.com/pages/kids_weather_links.htm
Stormshttp://www.thompson.ctschool.net/Teachers/SpecialEL/Weather/index_page0003.html
Tornadoeshttp://skydiary.com/kids/tornadoes.html
Weather- various linkshttp://www.kidskonnect.com/Weather/WeatherHome.html
National Weather Service- Weather term glossaryhttp://www.weather.gov/glossary/
World View of Global Warming pictureshttp://www.worldviewofglobalwarming.org/pages/arctic.html
DPI- 7th grade support documentshttp://www.ncpublicschools.org/curriculum/science/middlegrades/
Advanced & Satellite Imagery
http://radar.meas.ncsu.edu/education/saer/aer_summer_00.html
http://www.weather.gov/sat_tab.php?image=ir
http://wwwghcc.msfc.nasa.gov/GOES/satlinks.html
How satellites work- http://science.howstuffworks.com/satellite7.htm
7th grade 96

United Streaming Videos
These may have to be purchased!
Visit unitedstreaming.com and search for the following topics:
Weather Smart: Thunderstorms- (15)
Weather Smart: Hurricanes- (15)
Weather Smart: Ozone and Pollution- (15)
Weather Smart: Forecasting and Weather Instruments (15)
Exploring Weather: The Job of a Meteorologist (20)
Water Smart: Water as a Natural Resource (15)
Magic School Bus Kicks Up A Storm- (30)
Magic School Bus Goes On Air- (30)
Magic School Bus- Wet All Over- (30)
Lightning Strikes- (17)
Science Investigations: Earth Science: Investigating Weather & Climate Earth Atmosphere segment (8)Air Currents segment (11)Hurricane Tracking (9)Earth’s Changing Climates (9)
Exploring Weather: The Atmosphere in Motion (21)
Greatest Discoveries with Bill Nye: Earth Science (47) Animations:How stuff works: Wonders of Weather Lightning video (5) http://videos.howstuffworks.com/lightning_phenomena-video.htm
How stuff works: How Katrina Formed (3)http://videos.howstuffworks.com/HowKatrina_Formed-video.htm
Online Guide to Meteorology:
7th grade 97

http://www.howstuffworks.com/framed.htm?parent=tornado.htm&url=http://ww2010.atmos.uiuc.edu/(Gh)/guides/mtr/home.rxml
Weather Assessment Questions
3.01 Explain the composition, properties and structure of the atmosphere. RBT tag- A2, B2
1. Which layer of the atmosphere is coldest and why?a. Troposphere, because it is closest to the ground.b. Stratosphere, because it contains ozone.c. Mesosphere, because the molecules are spaced far apart.d. Thermosphere, because it is closest to outer space.
2. A student is given a balloon filled with air and tied. Which answer best
explains what would happen if the balloon were placed in a freezer.a. The air molecules in the balloon would spread out and the balloon size would
increase.b. The air molecules in the balloon would condense and the balloon size
would shrink.c. The air molecules will freeze and the balloon will pop.d. There will be no change in the balloon.
3.02 Describe properties that can be observed and measured to predict air quality. RBT tag – B3
1. Meteorologists observe and measure various factors as a way to track changes in weather. Which statement best supports why meteorologists need to predict air quality?
a. Radiation from the sun naturally produces smog.b. Excessive rain is linked to poor air quality.c. Exposure to ozone can lead to respiratory difficulties.d. Large particulate matter can be inhaled and can lead to digestive
problems.
2. There is a construction site near your house. It has not rained in many weeks. Predict what effect if any this would have on current air quality near your house.
a. Ground level ozone would be lower under these conditions.b. There would be a greater level of particulate matter which would improve
air quality.c. There would be a higher level of particulate matter which would
lower air quality.d. It would not have any affect on the air quality.
7th grade 98

3.03 Conclude that the good health of environments and organisms requires …. RBT tag – B2, B3
1. Which of the following explains what is meant by stewardship?a. Stewardship is using a resource without wasting it.b. Stewardship is the process of removing a resource.c. Stewardship leads to fewer resources.d. Stewardship is never successful.
2. Predict what would happen to the air quality index if EPA restrictions on emissions were to decrease.
a. Air quality would get worse.b. Air quality would improve.c. Air quality would not change.d. There are no emission restrictions, so they could not decrease.
3.04 Evaluate how humans impact air quality. RBT tag – B3, B4, B5
1. What conclusion can be drawn from the following statement? – “It is far too costly not to reduce emissions from automobiles and improve air quality.”
a. It is very costly to reduce emissions from automobiles.b. Costs associated with bad air quality are more expensive than the
cost to reduce car emissions.c. Reducing air quality is expensive, so we should worry more about
industrial air pollution than pollution from automobiles.d. We should improve air quality, because its inexpensive.
2. The governor of North Carolina announced that reducing air pollution is extremely difficult. What conclusion can be drawn from this statement?a. There isn’t enough money to reduce air pollution in North Carolina.b. Industry produces the greatest amount of pollution, but they can’t be stopped.c. Since most cars in North Carolina come from another state, it would be difficult to reduce air pollution from them.d. Most of the air pollution in North Carolina is from non-point sources.
3.05 Examine evidence that atmospheric properties can be studied to predict atmospheric conditions and weather hazards. RBT tag – C2, C3
1. Predict what would happen if a cold front passed through a warmer air mass.a. The front would stop, and the temperature would drop.b. The warm air would move overtop of the cold air producing light rain
showers.
7th grade 99

c. The cold front would force the warm air mass upward producing thunderstorms.
d. The cold air would push the warm air further to the south.
2. Which of the following would tell what would happen to an air particle that was drawn into a hurricane?
a. The air particle would spin clockwise and outward from the center of the storm.
b. The air particle would spin clockwise and inward from the center of the storm.
c. The air particle would spin counterclockwise and outward from the center of the storm.
d. The air particle would spin counterclockwise and inward from the center of the storm.
3.06 Assess the use of technology in studying atmospheric phenomena and weather hazards. RBT tag – A2, A3, A4
1. What would the result be from a switch from using satellite imagery to only radar for the forecasting of the weather?
a. Forecasts could be more accurate, because satellites are often limited on when they can view weather phenomena.
b. Forecasts will be limited to shorter time periods.c. Weather forecasts will be less accurate at closer distances to the
meteorologist.d. Radar is actually more accurate than satellites, so overall there would be
no gain or loss with the process of forecasting the weather.
2. Which of the following information about using satellite imaging to monitor weather is true?
a. Satellite images of Earth are taken with cameras during the night using light from the moon.
b. Satellites monitor the Earth’s coastal waters and track storms so predictions can be made.
c. Satellite images appear in their true colors, which helps with predicting weather changes.
d. Satellite images are constantly changing which affects the weather.
7th grade
Dry bulbthermometer in Celsius
100