73-8028-b45 7. performing organization name(s) and address(es) 8. performing organization performing...
TRANSCRIPT

Form ApprovedREPORT DOCUMENTATION PAGE OMB No. 0704-0188
The public reporting burden for this collection of information is estimated to average 1 hour per response, including the time for reviewing instructions, searching existing data sources,gathering and maintaining the data needed, and completing and reviewing the collection of information. Send comments regarding this burden estimate or any other aspect of this collection ofinformation, including suggestions for reducing the burden, to the Department of Defense, Executive Services and Communications Directorate (0704-0188). Respondents should be awarethat notwithstanding any other provision of law, no person shall be subject to any penalty for failing to comply with a collection of information if it does not display a currently valid OMBcontrol number.PLEASE DO NOT RETURN YOUR FORM TO THE ABOVE ORGANIZATION.1. REPORT DATE (D-MM-YYYY) 2. REPORT TYPE 3. DATES COVERED (From - To)
I ~ Final1
4. TITLE AND SUBTITLE 5a. CONTRACT NUMBER
Application of a Near-Infrared Slope Algorithm to Derive Optical Propertiesfrom High-Resolution, Hyperspectral Aircraft Imagery 5b. GRANT NUMBER
5c. PROGRAM ELEMENT NUMBER
0601153N
6. AUTHOR(S) 5d. PROJECT NUMBER
Gould, R.W., Jr., Arnone, R.A., Sydor, M. Kohler, D.D.R., Bissett, W.P.
5e. TASK NUMBER
5f. WORK UNIT NUMBER
73-8028-B45
7. PERFORMING ORGANIZATION NAME(S) AND ADDRESS(ES) 8. PERFORMING ORGANIZATION
Naval Research Laboratory REPORT NUMBER
Oceanography Division NRL/PP/7330--04-0006
Stennis Space Center, MS 39529-5004
9. SPONSORING/MONITORING AGENCY NAME(S) AND ADDRESS(ES) 10. SPONSOR/MONITOR'S ACRONYM(S)
Office of Naval Research ONR800 N. Quincy St.Arlington, VA 22217-5660 11. SPONSOR/MONITOR'S REPORT
NUMBER(S)
12. DISTRIBUTION/AVAILABILITY STATEMENT
Approved for public release, distribution is unlimited.
13. SUPPLEMENTARY NOTES
14. ABSTRACTUsing new algorithms, we derive estimates of partitioned absorption (a) and scattering (b) coefficients from high-resolution, hyperspectral aircraft imagery collectedwith the PHILLS sensor. During May 2002, we conducted simultaneous ship and aircraft surveys in a dynamic environment in the northern Gulf of Mexico (coastal
waters near Mobile Bay, Alabama). Optical measurements included hyperspectral remote sensing reflectance, partitioned absorption coefficients (phytoplankton,detrital, and colored dissolved organic matter components), beam attenuation (c), backscattering coefficient, HPLC phytoplankton pigment concentrations, andorganic/inorganic particle loads. Our objectives are to: (1) develop new algorithms to estimate optical properties from hyperspectral ocean color imagery; (2) applyto high-resolution aircraft imagery to characterize the spatial optical variability in an environment impacted by high concentrations of dissolved and particulatematerials; and (3) perform an optical water mass classification on the aircraft imagery. The new optical classification system based on the partitioned absorptioncoefficients is used to distinguish water masses and track coastal features.
15. SUBJECT TERMS
algorithms, imagery, phytoplankton, absorption coefficients
16. SECURITY CLASSIFICATION OF: 17. LIMITATION OF 18. NUMBER 19a. NAME OF RESPONSIBLE PERSONa. REPORT b. ABSTRACT c. THIS PAGE ABSTRACT OF Richard W. Gould, Jr.,
PAGESUnclassified Unclassified Unclassified UL 12 19b. TELEPHONE NUMBER (Include area code)
228-688-4494Standard Form 298 (Rev. 8/98)Prescribed by ANSI Std. Z39.18

PUBLICATION OR PRESENTATION RELEASE REQUEST Pubkey: 4172 NRLINST5600.2
Abstract only, published ( ) Abstract only, not published STRN NRL/PP/7330-04-6
Ref: (a) NRL Instruction 5600.2 ( ) Book ( ) Book chapter
(b) NRL Instruction 5510.40D ( ) Conference Proceedings (X ) Conference Proceedings Route Sheet No.7330/
(refereed) (not refereed) Job Order No. 73-8028-B4.5
End: (1) Two copies of subject paper ( ) Invited speaker ( ) Multimedia report Classification X U __ C
(or abstract) ) Journal article (refereed) ( ) Journal article (not refereed) Sponsor ONR BASE) Oral Presentation, published ) Oral Presentation, not published) Other, explain approval obtained yes __n
Title of Paper or Presentation
Application of a Near-Infrared Slope Algorithm to Derive Optical Properties from High-Resolution, Hyperspectral Aircraft Imagery
Author(s) Name(s) (First, MI, Last), Code, Affiliation if not NRL
Richard W. Gould, Robert A Arnone, Michael Sydor, D.D. Kohler, W.P. Bissett
It is intended to offer this paper to the Proceedings of Ocean Optics XVII
(Name of Conference)
25-OCT - 29-OCT-2004, Fremantle, Australia, Unclassified(Date, Place and Classification of Conference)
and/or for publication in Proceedings of Ocean Optics XVII, Unclassified(Name and Classification of Publication) (Name of Publisher)
After presentation or publication, pertinent publication/presentation data will be entered in the publications data base, in accordancewith reference (a).It is the opinion of the author that the subject paper (is __ ) (is not X ) classified, in accordance with reference (b).This paper does not violate any disclosure of trade secrets or suggestions of outside individuals or concerns which have beencommunicated to the Laboratory in confidence. This paper (does __ ) (does not X ) contain any militarily critical technology.This subject paper (has__ ) (has never X ) been incorporated in an official NRL Report.
Richard W. Gould, 7333 I a4 j
Name and Code (Principal Author) (Signature)
CODE SIGNATURE DATE COMMENTSAuthor(s) ____________( 0
Section Head
Branch Head Gould, acting
Robert A Arnone, 7330 •' ________,.____,._____/__/_____
Division Head 1. Release of this paper is approved.2. To the best knowledge of this Division, thesubject matter of this paper (has _ )
Payne, acting (has never X ) been classified.
Security, Code 1. Paper or abstract was released.7030.1 17;90, 2.A 9
Office of CounselCode1008.3
ADOR/Director NCSTE.O. Hartwig, 7000
Public Affairs (Unclassified!Unlimited Only), Code 7030.4
Division, Code
Author, Code
HQ-NRL 5511/6 (Rev. 12-98) (e) THIS FORM CANCELS AND SUPERSEDES ALL PREVIOUS VERSIONS

A'A - Approved for public release, distribution Is unlimited. *
fl B - Distribution authorized to U.S. Government agencies only (check reason below):
f] Foreign Government Information [l Contractor Performance Evaluation [] Critical Technology
fl Proprietary information il Administrative/Operational Use D Premature Dissemination
Test and Evaluation [] Software Documentation Cite "Specific Authority
Date statement applied (Identification of valid documented authority)
Other requests for this document shall be referred to
(Insert Controlling DOD Office*)
l C - Distribution authorized to U.S. Government agencies and their contractors (check reason below):
FD Foreign Government Information [] Software Documentation
[I Admlnistrative/Operational Use f] Critical Technology [] Cite "Specific Authority _
Date statement applied (Identification of valid documented authority)
Other requests for this document shall be referred to
(Insert Controlling DOD Office*)
fl D - Distribution authorized to DOD and DOD contractors only (check reason below):
fl Foreign Government Information fl Critical Technology
LI Software Documentation [l Cite "Specific Authority
SAdministrativelOperatlonal Use (Identification of valid documented authority)
Date statement applied
Other requests for this document shall be referred to
(Insert Controlling DOD Office*)
I E -Distribution authorized to DOD components only (check reason below):
il Proprietary information fl Premature Dissemination fl Critical Technology
fl Foreign Government Information [] Software Documentation LI Direct Military Support
El Administrative/Operational Use [] Contractor Performance Evaluation fl Test and Evaluation
Date statement applied __ Cite 'Specific Authority _
Other requests for this document shall be referred to (Identification of valid documented authority)
(Insert Controlling DOD Office*)
LI F - Further dissemination only as directed by(Insert Controlling DOD Office*)
Date statement applied or higher DOD authority
fl G - Distribution authorized to U.S. Government agencies and private individuals or enterprises eligible to obtain export-controlledtechnical data in accordance with regulations Implementing 10 U.S.C. 140c.
Date statement applied
Other requests for this document shall be referred to
(Insert Controlling DOD Office*)*For NRL publications, this Is usually the Commanding Officer, Naval Research Laboratory, Washington, DC 20375-5320
[I Classification fl NOFORN [] DTIC exempt (explain)
Classification Review Substantive changes made In this document after approval by Classification Review and Public Release invalidate(initial/Date) these reviews. Therefore, if any substantive changes are made by the author, Technical Information, or anyone else,
the document must be returned for another Classification Review and Publication Release.
-I
Author completes and submits this form with the manuscript via line channels to the division head for review and approval according tothe routing in Section 4.
1. NRL Reports ................................................................................................ Submit the diskette (if available), manuscript, typed double-spaced,complete with tables, Illustrations, references, draft SF 298, andproposed distribution list.
2. NRL Memorandum Reports ......................................................................... Submit a copy of the original, typed manuscript complete withtables, illustrations, references, draft SF 298, and proposeddistribution list.
3. NRL Publications or other books, brochures, pamphlets ........................... Handled on a per case basis by Site Technical Information Office.proceedings, or any other printed publications.
HQ-NRL 5219/1 (Rev. 5-97) (e) (Back)

L)OXVII Page 1 of 1
OOXVII Fremantle, Western Australia
"AlCSIRO
tle://E:\start.htm 1/6/2005

Application of a Near-Infrared Slope Algorithm to Derive Optical Propertiesfrom High-Resolution, Hyperspectral Aircraft Imagery
Gould, R. W., Jr.1, R.A. Arnone2,_M Sydor3 , D.D.R. Kohler4, W.P. Bissett4
'Naval Research Laboratory, Code 7333, Stennis Space Center, MS, USA, 395292Naval Research Laboratory, Code 7330, Stennis Space Center, MS, USA, 395293University of Minnesota-Duluth, Dept. of Physics, Duluth, MN, USA, 55812
4Florida Environmental Research Institute, Tampa, FL, USA, 33611
ABSTRACT
Using new algorithms, we derive estimates of partitioned absorption (a) and scattering (b)coefficients from high-resolution, hyperspectral aircraft imagery collected with thePHILLS sensor. During May 2002, we conducted simultaneous ship and aircraft surveysin a dynamic environment in the northern Gulf of Mexico (coastal waters near MobileBay, Alabama). Optical measurements included hyperspectral remote sensing reflectance(R,,), partitioned absorption coefficients (phytoplankton, detrital, and colored dissolvedorganic matter components), beam attenuation (c), backscattering (bb) coefficient, HPLCphytoplankton pigment concentrations, and organic/inorganic particle loads. Ourobjectives are to: (1) develop new algorithms to estimate optical properties fromhyperspectral ocean color imagery; (2) apply the algorithms to high-resolution aircraftimagery to characterize the spatial optical variability in an environment impacted by highconcentrations of dissolved and particulate materials; and (3) perform an optical watermass classification on the aircraft imagery. The new optical classification system basedon the partitioned absorption coefficients is used to distinguish water masses and trackcoastal features.
The PHILLS radiance values are first converted to atmospherically-corrected reflectancesthrough an empirical line calibration technique that couples the imagery with in situreflectance measurements. Then, by focusing initially on the near-infrared (NIR) regionof the reflectance spectrum where absorption is dominated by pure water, we canestimate the backscattering coefficient at 715 nm by solving a quadratic equation. Alinear model extends this estimate spectrally to shorter wavelengths. From reflectanceand backscattering we subsequently estimate the total absorption coefficient. Empiricalrelationships based on filter pad measurements are used to partition the total absorptioninto phytoplankton, detrital, and CDOM components, as well as organic and inorganicparticulate loads. Finally, we compare the aircraft-derived estimates with in situ opticalmeasurements collected during the coincident ship surveys, and assess errors.
INTRODUCTION
Remote sensing imagery can provide synoptic snapshots of water optical properties.Airborne imagery generally provides increased spectral and spatial resolution comparedto satellite imagery (Hyperion is the only hyperspectral satellite sensor currently on orbit(220 channels, 30 m ground resolution, 16-day repeat cycle), but it was launched byNASA as a demonstration project with a one-year on-orbit design lifetime, and it does
1 20050504 012

not provide operational data). In addition, the temporal resolution of the aircraft imagery(repeat coverage) is only limited by flight requirements and cost constraints, not byorbital paths and times. Thus, shorter temporal and spatial scales (i.e., higher frequencyprocesses such as tidal variability) can generally be resolved with aircraft imagery.
However, aircraft imagery is also fraught with problems unique to that platform. Forexample, because the sensor is flown at variable heights within the atmospheric layer,rather than above it as is the case for satellite sensors, the atmospheric correction problemis more difficult, particularly over coastal areas. The platform itself is also less stablethan a satellite; the aircraft data require roll, pitch, and yaw corrections for accurateground pixel locations. Instrument calibration is an ongoing issue for any optical sensorthat is operated in a harsh environment, such as the constantly vibrating and jarringconditions within an airplane. These difficulties represent challenges that must beovercome before high-quality data are available for incorporation into bio-opticalalgorithms.
OBJECTIVES
Our objectives are to: (1) develop new algorithms to estimate optical properties fromhyperspectral ocean color imagery; (2) apply the algorithms to high-resolution aircraftimagery to characterize the spatial optical variability in an environment impacted by highconcentrations of dissolved and particulate materials; and (3) perform an optical watermass classification on the aircraft imagery.
METHODS
In May 2002, we conducted field experiments near Mobile Bay, Alabama, to characterizethe coastal optical properties using ship, satellite, and aircraft data. A total of 63 stationswere occupied by two ships over an eight-day period. One ship, the RNV Pelican, mappedthe outflow plume from Mobile Bay while the other vessel, the R/V Ocean Color,examined spatial variability of optical properties in Mobile Bay and Mississippi Sound(shoreward of the barrier islands). In situ optical measurements included hyperspectralremote sensing reflectance (ASD and Spectrex instruments), absorption and beamattenuation coefficients (and scattering coefficient by difference; ac9 instrument),backscattering coefficient (Hydroscat instrument).
In addition, whole water samples were collected on both ships. Filter pad absorptionanalyses were performed using the ASD fiber optic spectroradiometer to partition thetotal absorption coefficient into phytoplankton (ao), detrital (ad), and colored dissolvedorganic matter (gelbstoff, ag) components. GF/F filtered samples were also collected andfrozen in liquid nitrogen for subsequent fluorometric and HPLC pigment analysis. Totalsuspended solids (TSS), particulate inorganic matter (PIM), and particulate organicmatter (POM) were determined gravimetrically. Prior to the cruise, 47 mm GF/F filterswere rinsed three times with Milli-Q water, dried for two hours at 103' C, ashed for 15minutes at 5500 C, weighed on an analytical scale, and stored for analysis in small,labeled plastic petri dishes. During the experiment, whole water samples were
2

subsequently filtered through the prepared filters, rinsed thoroughly, dried, and weighedto determine TSS in mg/l. The filters were then ashed and re-weighed to determine PIM(and POM through subtraction).
Coincident aircraft imagery was collected with the Portable Hyperspectral Imager forLow-Light Spectroscopy (PHILLS). Four flight days were successfully completed with4-8 overlapping flight lines per day oriented parallel to the coast (into or away from thesun) to allow image mosaicking with minimal sun glint. PHILLS operated with 220spectral bands at a flight altitude of 10,000 m to yield a 10 m ground pixel spatialdimension. Figure 1 shows an example of the flight lines and times, as well as thecoincident ship stations and collection times, for 21 May, 2002. Similar figures forflights on 19, 20, and 23 May are not shown.
All Flight Lines
: Ocean Color Stations........... .. .... ... ................. ..2 . 21s0 908:58am (D
21 Ma 200221s02_0 9:58am (D21 My 202 )21s03_10:43am QPHILLS Flight Lines C 21s04-11:30am
Run ILine88:508:5621s041_0:Oam
l • • 'i 21s05-12:55pm"
i : •21s06..2:15proG
SMobile Bay,Run 5 Line 9 9:14-9:20am Alabama ' Pelican Stations. R ijn I Line 8 8:5 0-8:56o : .n: 21s02 09:02am
RjRn 3 Line 7 9:03-9:09am- 21s0309:30am÷ Run 9 Line 6 9:43-9:50aS .n ......... .... 21s04_10:28am C- Run 7 Line 5 9:28-9:35am 21s05_11:08am
Rnn 11 Line 4 9:56-10:031 i 21s06_12:48pm SRun 13Line 3 10:06 10:13am 2107_02:23pm 0
<- Run 15Line 2 10:20-10:28am 210804:35pm3C}. 0 .. ... ... .. .,'•, . .• . .. .....•?:? .?, . . .......... •... ............ !... .
-8.60 i -8.20 -87,80
Figure 1. Locations and times offlight lines and ship stations, 21 May, 2002.
The geolocated, calibrated radiance data (Kohler, 2002) were subsequently converted toremote-sensing reflectancs (Rrs) using an empirical line calibration (ELC) technique(Moran et al., 2001). This approach simultaneously applies an atmospheric correction tothe imagery by forcing the aircraft radiance data to match the in situ Rrs data. Followingthe ELC, a near-infrared (NIR) slope algorithm was applied to the imagery to deriveestimates of inherent optical properties and chlorophyll. The NIR algorithm is describedbelow. Following application of the NIR algorithm, the imagery was goecorrected andmosaicked. Optical property values were then extracted from the imagery at the locationsof the ship stations and compared to the measured values. The steps are outlined inFigure 2.
3
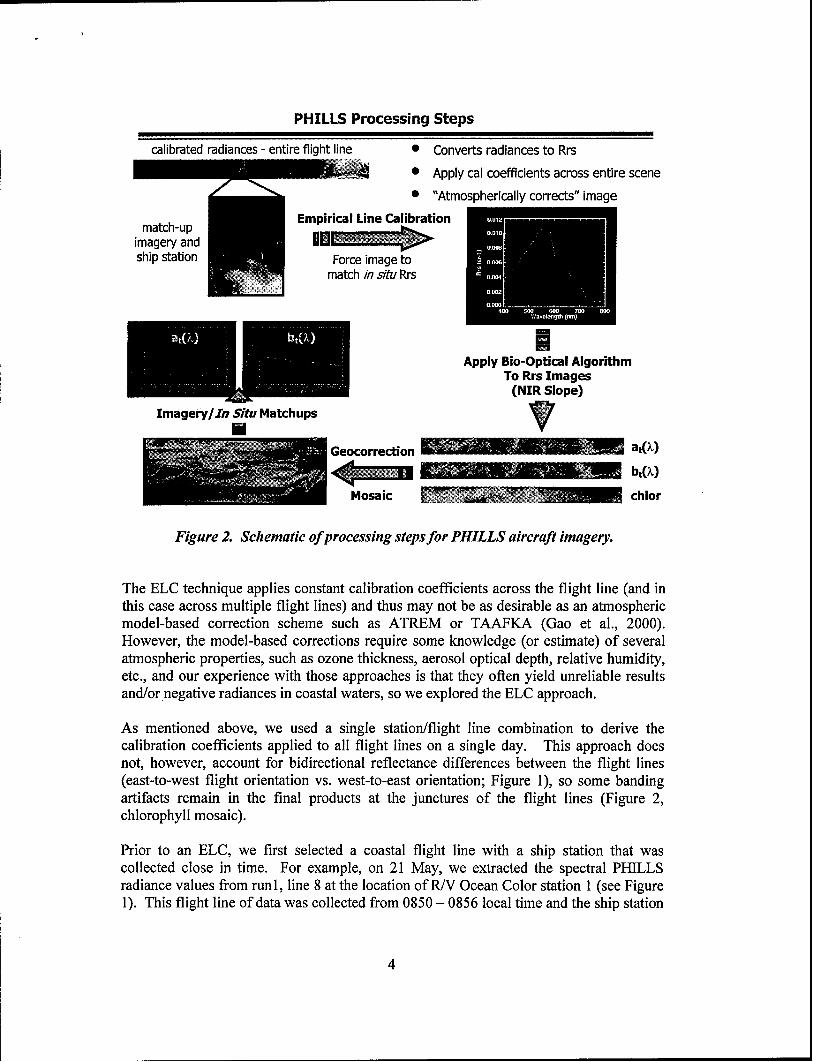
PHILLS Processing Steps
calibrated radiances - entire flight line 0 Converts radiances to Rrs
• Apply cal coefficients across entire scene
0 "Atmospherically corrects" image
Empirical Line Calibration
ship station Force image tomatch in situ Rrs
Apply Bio-Optical AlgorithmTo Rrs Images
(NIR Slope)
Imagery/In Situ Matchups
Geocorrection " at(k)~~I M 6' ': , bt(2)
Mosaic • chlor
Figure 2. Schematic of processing steps for PHILLS aircraft imagery.
The ELC technique applies constant calibration coefficients across the flight line (and inthis case across multiple flight lines) and thus may not be as desirable as an atmosphericmodel-based correction scheme such as ATREM or TAAFKA (Gao et al., 2000).However, the model-based corrections require some knowledge (or estimate) of severalatmospheric properties, such as ozone thickness, aerosol optical depth, relative humidity,etc., and our experience with those approaches is that they often yield unreliable resultsand/or negative radiances in coastal waters, so we explored the ELC approach.
As mentioned above, we used a single station/flight line combination to derive thecalibration coefficients applied to all flight lines on a single day. This approach doesnot, however, account for bidirectional reflectance differences between the flight lines(east-to-west flight orientation vs. west-to-east orientation; Figure 1), so some bandingartifacts remain in the final products at the junctures of the flight lines (Figure 2,chlorophyll mosaic).
Prior to an ELC, we first selected a coastal flight line with a ship station that wascollected close in time. For example, on 21 May, we extracted the spectral PHILLSradiance values from run 1, line 8 at the location of R/V Ocean Color station 1 (see Figure1). This flight line of data was collected from 0850 - 0856 local time and the ship station
4

was occupied at 0858. We then applied the ELC technique to derive calibrationcoefficients to convert the image radiances to the ship-measured Rrs values. This forcesthe PHILLS and ship Rrs spectra to match exactly at that single point in the image. Thesecoefficients were subsequently applied to each pixel in the flight line, and to each flightline for that day. Comparisons between ELC-calculated and ship-measured Rrs spectraagreed well at independent stations not used to derive the coefficients (Figure 3), so weadopted the ELC approach for all PHILLS imagery.
Figure 3. Comparison of ship-measured Rrs (red line) and ELC-derivedPHILLS Rrs (green line), for R/V Ocean Color station 3 on 20 May, 2002.
We also explored the effect of different flight line/station combination pairs on thecalculated calibration coefficients and resulting derived optical products. On three of thedays, several flight line/station combinations were selected for ELC to develop differentsets of calibration coefficients. The coefficients were subsequently applied to theimagery, and the agreement between PHILLS-derived and ship-measured absorption andscattering coefficients was used to evaluate the coefficients and select the best set. Forexample, on 21 May, we evaluated two other potential flight line/station combinations(run 5, line 9 and R/V Ocean Color station 4; run 9, line 6 and RNV Ocean Color station5). However, the errors between the derived and measured spectral optical propertieswere larger than with the original calibration coefficients. In general, the different flightline/station combinations used in the ELC did not have as large an impact on the resultingoptical estimates as might have been expected (results not shown).
NIR SLOPE ALGORITHM (CALCULATING a AND bb)
Following application of the ELC to the PHILLS imagery, a NIR slope algorithm wasapplied to the Rrs spectra at each image pixel, to derive the optical properties of the water.The NIR algorithm is based on the observation that the total absorption in the 715 - 735nm wavelength range is controlled by pure-water absorption (i.e., the absorption by theother components such as phytoplankton, detritus, and CDOM is minimal). Furthermore,
5

we assume that the spectral shapes of b and bb are linear and relatively flat over thisnarrow wavelength range (only a 2.8% difference in b(715) and b(735), based on thes ectral model of Gould et al., 1999), and that the C term below is constant (C = (t 2*f) / (n *Q) = 0.05 1). These assumptions allow calculation of the backscattering coefficient at715 nm from the corrected Rrs values, and subsequently spectral backscattering andabsorption over the entire 400 - 700 nm range. The calculations are summarized below.
Based on Rrs = C bb / (a+bb) (Gordon et al., 1988))Subscript 1 denotes X = 715 nm, subscript 2 denotes X = 735 nmawl, pure-water absorption at 715 nm = 1.007aw2, pure-water absorption at 735 nm = 2.39bb2 = 0.97234 bbl
First, calculate the reflectance difference at two NIR wavelengths:
RrsI - Rrs 2 = Cbbl /(aw + bbl) - Cbb2 I(aw2 + bb2 ) (1)
Then, substitute and rearrange terms:
0.97234bb,2 + [0.97234aw, +ae -C(a2 -0.97234awl)/(rslR rs2-}bb2 +awa =0 (2)
Solve the quadratic for the backscattering coefficient at 715 nm, bbl:
bbl =(-B- B2- 9.362)/1.945 (3)
where B is the term in brackets in equation 2.Next, calculate spectral bb(,):
bb (A) = bbl x bbshape(A) (4)
where bbshape(A) = (1.62517 - 0.001132)/0.817220 (5)
from the spectral model of Gould et al. (1999).Convert bb(,) to b(X):
b(A)= 53.56857 xbb (A)+0.00765 (6)
also from Gould et al. (1999).Finally, calculate total absorption, aT(X):
aT (1) =Cbb (A)/ Rrs(A) - bb (A) (7)
6

OPTICAL WATER MASS CLASSIFICATION ALGORITHMS (PARTITIONING aAND b INTO COMPONENTS)
Following calculation of a, bb, and b, the scattering coefficient is partitioned into organicand inorganic components and the total absorption coefficient is partitioned intophytoplankton, detrital, and CDOM components, using empirical relationships. Inaddition, we require estimates of chlorophyll (here we use the Stumpf et al. (2000)algorithm) as well as a,(443) derived from the chlorophyll value (Stumpf et al., 2003).The algorithm steps can be summarized as follows:
1. Calculate the organic component of scattering at 660 nm, bo(660), fromchlorophyll (Loisel & Morel, 1998)
2. Calculate bo(555) from bo(660)3. Calculate the inorganic component of scattering at 555 nm, bi(555) = b(555) -
bo(555)4. Calculate ad(4 12) from bi(555)
5. Calculate total absorption minus water absorption, aT--w(X) = aT(X) - aw(k)
6. Calculate spectral phytoplankton absorption, a<,(X), from a,(443)7. Calculate combined detrital and CDOM absorption, adg(X) = aT-w(X) - a 4,(X)
8. Calculate CDOM absorption at 412 nm, ag(4 12) = adg( 4 12 ) - ad(412)
9. Calculate agQ() from ag(4 12 )
10. Calculate ad(X) = adg(Q) - ag(X)
11. Calculate particulate absorption a%(X) = a,,(?,) + ad(X)
12. Calculate PIM from ap(412)13. Calculate POM from ap(443)14. Calculate TSS = PIM + POM
See Gould et al. (2002) for equations, references, and further details on calculating
organic scattering (bo), ad(4 12), ag(X,), PIM, and POM.
RESULTS
After applying the ELC, chlorophyll, and NIR bio-optical algorithms, we combine thedaily flight lines to create image mosaics of the region, for each of the optical products.PHILLS and SeaWiFS chlorophyll images covering roughly the same area of MississippiSound near Mobile Bay for May 20 are shown in Figure 4. The same chlorophyllalgorithm was applied to both images, and the color scales are identical. Although thePHILLS imagery is at much higher spatial resolution, the close agreement between thetwo images, in both magnitude and pattern, indicates that the Rrs values resulting from theELC must also be in close agreement with the SeaWiFS Rrs values.
7

[XFigure 4. Chlorophyll concentration, 20 May, 2002. A. Sea WiFS. B. PHILLS
Mosaics of organic and inorganic scattering coefficients, CDOM, detrital, andphytoplankton absorption coefficients, PIM, and POM, for 21 May are shown in Figure5. Note the different scales and units. The scattering coefficients due to inorganic matterare in general an order of magnitude larger than the organic ones, although concentrationsof particulate inorganic matter are only 2-3 times larger than concentrations of particulateorganic matter. Also, the phytoplankton absorption coefficients are about 6 times lowerthan those due to CDOM and detritus, and the distribution is more dispersed.
Comparisons of PHILLS-derived and ac9-measured spectral absorption and scatteringcoefficients from R/V Ocean Color station 1 on 21 May are shown in Figure 6. Thisstation was used to perform the ELC, so the PHILLS Rrs spectrum matches the shipmeasurements exactly. The strong agreement between the PHILLS and ac9 values at thisstation where the atmospheric correction was "perfect", particularly for the scatteringcoefficient, indicates the efficacy of the NIR slope algorithms. A non-constant spectralshape for the C term in equation 1, or variability in the bb/b ratio could contribute to thediscrepancy between the derived and measured absorption values. Calculations of errorstatistics for all coincident ship and aircraft values are in progress.
We use the partitioned absorption components in an optical water mass classificationscheme to characterize the region. The percentages of total absorption due to ad( 4 12),ag( 4 12), and a,(443) form the three axes in a ternary diagram, to quantitatively illustratethe dominant absorbing species at each image pixel. Because we are using absorptionpercentages, we are looking at relative changes in the dominant absorbing characteristicsat each pixel rather than changes in absolute magnitude of the absorption coefficients.Thus the patterns show compositional changes. The optical classification scheme allowsus to examine spatial and temporal optical variability, as well as follow features and trackwater masses. Figure 7 shows an example of this approach applied to the 19 MayPHILLS imagery. Red pixels in the RGB composite mage indicate relativelyhigherdetrital absorption, green pixels indicate relatively higher phytoplanktonabsorption, and blue pixels indicate relatively higher CDOM absorption.
8

Figure 5. PHILLS flight line mosaics for 21 May. A. bi(555). B.bo(555). C. PIM concentration. D. POM concentration.
E. ag(4 12). F. ad(4 12). G. a,(443).
9

6 20
PHILLS Total Absorptionac9 Total AbsorptionPHILLS Scattering
-e-ac9 Scattering 15
4-
o E
C- . 0)3- 10 *a
0 a,
400 450 500 550 600 650 700 7.50Wavelength (nm)
Figure 6. Total absorption and scattering coefficients vs. wavelength,PHILLS-derived and ac9-measured, R/V Ocean Color station I on 21 May.
.0 .0 (.00
o O~ ~trt~ i /•o~ ::....................
0.0
I-x
0* 0
0.000.00 0.25 0,50 0.75 1.00
% CDOM absorption
Figure 7. Optical water mass classification for PHILLS imagery, 19 May. RGBcomposite image with %ad(412)) loaded in the red channel, %a•,(443) loaded in the
green channel, and %ag(4 12) loaded in the blue channel. The black points clustered inthe lower right corner of the ternary diagram indicate that although there is somevariability, CDOM absorption dominates the total absorption signal in this region.
10

DISCUSSION AND SUMMARY
We have presented new algorithms to estimate backscattering and absorption coefficientsfrom hyperspectral ocean color imagery; based on spectral Rs at NIR wavelengths.Empirical relationships are used to partition the absorption coefficient intophytoplankton, detrital, and CDOM components, and these components are ultimatelyused in an optical water mass classification scheme. These approaches were applied tohigh-resolution (10 m pixels), hyperspectral aircraft imagery collected near Mobile Bay,Alabama. Several sources of error contribute to the overall agreement between PHILLSestimates and ship measurements:
1. PHILLS sensor calibration
2. Empirical Line Calibration method - incorrect R, estimates
3. Non-negligible CDOM, detrital, or pigment absorption at NIR wavelengths
4. C term incorrect or not constant
5. Incorrect shape of spectral b(k) or bb(X)
6. Incorrect or variable bb(?)/b(X) ratio (i.e., variable volume-scattering functionbetween stations)
We are exploring these error sources further, but initial results show good agreementbetween PHILLS-derived values and ship measurements (both Rrs and optical properties).The optical water mass classification technique (RGB imagery and ternary plots) helpeddelineate patterns in the absorbing characteristics of the waters in and around MississippiSound, and indicated that CDOM dominates absorption in this region.
ACKNOWLEDGMENTS
Support for this work was provided by the Naval Research Laboratory (Program Element0601153N), NASA, and the Office of Naval Research.
REFERENCES
Gao, B.-C., M.J. Montes, Z. Ahmad, and C.O. Davis. 2000. Atmospheric correctionalgorithm for hyperspectral remote sensing of ocean color from space. Appl. Opt., 39(6):887-896.
Gordon, H.R., O.B. Brown, R.H. Evans, J.W. Brown, R.C. Smith, K.S. Baker and D.K.Clark. 1988. A semianalytic radiance model of ocean color. J. Geophys. Res., 93(D9):10,909-10,924.
Gould, R.W., Jr., R.A. Arnone, and P.M. Martinolich. 1999. Spectral dependence of thescattering coefficient in Case 1 and Case 2 waters. Appl. Opt., 38(12): 2377-2383.
11

Gould, R.W., Jr., R.H. Stavn, M.S. Twardowski, and G.M. Lamela. 2002. Partitioningoptical properties into organic and inorganic components from ocean color imagery.Proceedings, Ocean Optics XVI, Santa Fe, New Mexico.
Kohler, D.D.R., W.P. Bissett, C.O. Davis, J. Bowles, D. Dye, R. Steward, J. Britt, M.Montes, 0. Schofield, and M. Moline. 2002. High resolution hyperspectral remotesensing over oceanographic scales at the Leo 15 field site. Proceedings, Ocean OpticsXVI, Santa Fe, New Mexico.
Loisel, H. and A. Morel. 1998. Light scattering and chlorophyll concentration in Case 1waters: A reexamination. Limnol. Oceanogr., 43(5): 847-858.
Moran, M.S., R. Bryant, K. Thome, W. Ni, Y. Mouvelllon, M.P. Gonzalez-Dugo, J. Qi,and T.R. Clarke. 2001. A refined empirical line approach for reflectance factor retrievalfrom Landsat-5 TM and Landsat-7 ETM+. Rem. Sens. Environ., 78: 71-82.
Stumpf, R.P., R.A Arnone, R.W. Gould, Jr., P. Martinolich, V. Ransibrahmanakul. 2003.A Partially-Coupled Ocean-Atmosphere Model for Retrieval of Water-Leaving Radiancefrom SeaWiFS in Coastal Waters: In: Patt, F.S., et al.: Algorithm Updates for the FourthSeaWiFS Data Reprocessing. NASA Tech. Memo. 2002_206892, Vol. 22, S.B. Hookerand E.R. Firestone, Eds., NASA Goddard Space Flight Center, Greenbelt, Maryland.
Stumpf, R.P. Arnone, R.A. R.W. Gould, P. Martinolich, V. Ransibrahmanakul, P.A.Tester, R.G. Steward, A. Subramaniam, M. Culver, J.R. Pennock. 2000. SeaWiFS oceancolor data for US Southeast coastal waters. Sixth International Conference on RemoteSensing for Marine and Coastal Environments. Charleston, SC. Veridian ERIM Intl. AnnArbor MI, USA, p. 25-2
12