7/2/14 wbur poll crosstabs
DESCRIPTION
A WBUR/MassINC poll.TRANSCRIPT

Massachusetts Statewide Poll of 502 Likely Voters
in November 2014 General ElectionField Dates: June 27-29, 2014
OVERAL
L
Overall
Democra
t
Republic
an
Unenroll
ed /
Other Male Female
UNWEIGHTED COUNT Unweighted count 502 190 61 251 238 264
Charlie Baker 28% 7% 79% 31% 36% 21%
Martha Coakley 41% 62% 10% 34% 35% 47%
Jeff McCormick 2% 3% 0% 3% 4% 1%
Evan Falchuk 2% 2% 0% 3% 3% 2%
Scott Lively 1% 1% 2% 1% 1% 2%
Another candidate 2% 4% 0% 2% 2% 3%
Wouldn't vote 2% 1% 3% 3% 2% 3%
Don't Know / Refused 20% 19% 6% 24% 18% 22%
Total 502 181 60 261 243 259
Charlie Baker 30% 11% 75% 34% 37% 24%
Steve Grossman 28% 50% 5% 19% 29% 28%
Jeff McCormick 5% 3% 3% 7% 6% 4%
Evan Falchuk 2% 2% 0% 2% 2% 1%
Scott Lively 2% 2% 0% 3% 1% 4%
Another candidate 2% 2% 1% 1% 1% 2%
Wouldn't vote 2% 3% 3% 2% 1% 4%
Don't Know / Refused 28% 28% 13% 33% 23% 33%
Total 502 181 60 261 243 259
Charlie Baker 31% 12% 80% 32% 38% 24%
Don Berwick 19% 31% 0% 15% 19% 19%
Jeff McCormick 5% 3% 6% 5% 5% 4%
Evan Falchuk 2% 2% 0% 2% 2% 2%
Scott Lively 3% 1% 0% 4% 2% 3%
Another candidate 4% 6% 0% 3% 5% 3%
Wouldn't vote 4% 5% 4% 3% 3% 4%
Don't Know / Refused 34% 39% 10% 36% 26% 41%
Total 502 181 60 261 243 259
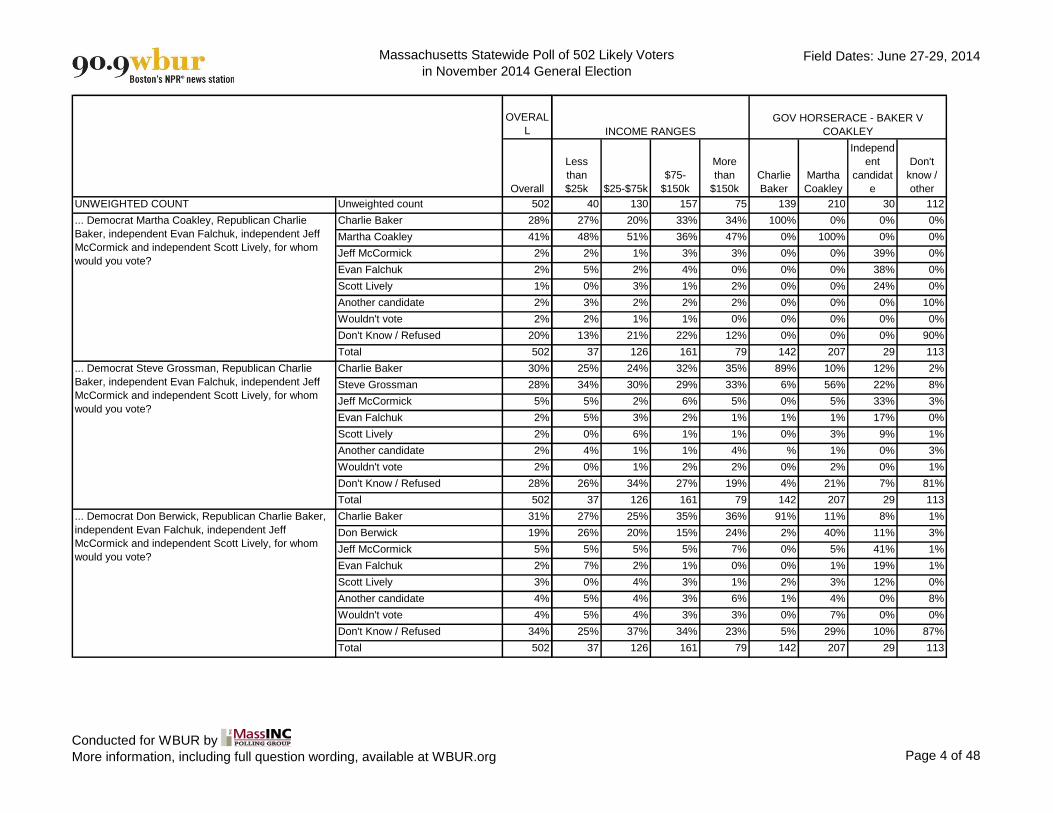
... Democrat Steve Grossman, Republican Charlie
Baker, independent Evan Falchuk, independent Jeff
McCormick and independent Scott Lively, for whom
would you vote?
... Democrat Don Berwick, Republican Charlie Baker,
independent Evan Falchuk, independent Jeff
McCormick and independent Scott Lively, for whom
would you vote?
... Democrat Martha Coakley, Republican Charlie
Baker, independent Evan Falchuk, independent Jeff
McCormick and independent Scott Lively, for whom
would you vote?
PARTY REGISTRATION GENDER
Conducted for WBUR by
More information, including full question wording, available at WBUR.org Page 1 of 48

Massachusetts Statewide Poll of 502 Likely Voters
in November 2014 General ElectionField Dates: June 27-29, 2014
OVERAL
L
Overall
UNWEIGHTED COUNT Unweighted count 502
Charlie Baker 28%
Martha Coakley 41%
Jeff McCormick 2%
Evan Falchuk 2%
Scott Lively 1%
Another candidate 2%
Wouldn't vote 2%
Don't Know / Refused 20%
Total 502
Charlie Baker 30%
Steve Grossman 28%
Jeff McCormick 5%
Evan Falchuk 2%
Scott Lively 2%
Another candidate 2%
Wouldn't vote 2%
Don't Know / Refused 28%
Total 502
Charlie Baker 31%
Don Berwick 19%
Jeff McCormick 5%
Evan Falchuk 2%
Scott Lively 3%
Another candidate 4%
Wouldn't vote 4%
Don't Know / Refused 34%
Total 502
... Democrat Steve Grossman, Republican Charlie
Baker, independent Evan Falchuk, independent Jeff
McCormick and independent Scott Lively, for whom
would you vote?
... Democrat Don Berwick, Republican Charlie Baker,
independent Evan Falchuk, independent Jeff
McCormick and independent Scott Lively, for whom
would you vote?
... Democrat Martha Coakley, Republican Charlie
Baker, independent Evan Falchuk, independent Jeff
McCormick and independent Scott Lively, for whom
would you vote?
18 to 29 30 to 44 45 to 59 60+
Men age
18-49
Women
age 18-
49
Men age
50+
Women
age 50+
63 122 169 148 113 112 125 152
24% 31% 27% 30% 36% 19% 37% 22%
46% 36% 42% 43% 32% 47% 37% 47%
6% 2% 2% 1% 6% % 2% 2%
1% 1% 4% 2% 2% 2% 4% 2%
0% 2% 3% 0% 2% 2% 0% 1%
2% 2% 2% 2% 0% 3% 3% 2%
2% 2% 2% 3% 2% 3% 2% 3%
18% 24% 18% 20% 20% 24% 17% 21%
60 131 166 146 109 120 134 139
18% 33% 35% 28% 37% 21% 37% 28%
36% 22% 28% 31% 29% 27% 28% 29%
10% 4% 5% 4% 5% 5% 7% 3%
2% 1% 2% 1% 2% 1% 2% 1%
7% 4% 1% 1% 2% 7% 0% 1%
0% 1% 2% 3% 0% 1% 2% 3%
0% 1% 3% 4% 1% 1% 1% 6%
27% 34% 26% 27% 24% 38% 23% 29%
60 131 166 146 109 120 134 139
23% 31% 33% 32% 36% 20% 40% 28%
31% 14% 20% 17% 22% 20% 16% 17%
11% 3% 5% 3% 5% 6% 5% 3%
0% 2% 2% 3% 2% 1% 1% 2%
1% 4% 3% 2% 2% 4% 3% 2%
0% 4% 4% 5% 3% 1% 6% 4%
5% 3% 2% 6% 4% 3% 3% 6%
29% 40% 31% 34% 26% 45% 25% 38%
60 131 166 146 109 120 134 139
AGE CATEGORIES AGE AND GENDER
Conducted for WBUR by
More information, including full question wording, available at WBUR.org Page 2 of 48

Massachusetts Statewide Poll of 502 Likely Voters
in November 2014 General ElectionField Dates: June 27-29, 2014
OVERAL
L
Overall
UNWEIGHTED COUNT Unweighted count 502
Charlie Baker 28%
Martha Coakley 41%
Jeff McCormick 2%
Evan Falchuk 2%
Scott Lively 1%
Another candidate 2%
Wouldn't vote 2%
Don't Know / Refused 20%
Total 502
Charlie Baker 30%
Steve Grossman 28%
Jeff McCormick 5%
Evan Falchuk 2%
Scott Lively 2%
Another candidate 2%
Wouldn't vote 2%
Don't Know / Refused 28%
Total 502
Charlie Baker 31%
Don Berwick 19%
Jeff McCormick 5%
Evan Falchuk 2%
Scott Lively 3%
Another candidate 4%
Wouldn't vote 4%
Don't Know / Refused 34%
Total 502
... Democrat Steve Grossman, Republican Charlie
Baker, independent Evan Falchuk, independent Jeff
McCormick and independent Scott Lively, for whom
would you vote?
... Democrat Don Berwick, Republican Charlie Baker,
independent Evan Falchuk, independent Jeff
McCormick and independent Scott Lively, for whom
would you vote?
... Democrat Martha Coakley, Republican Charlie
Baker, independent Evan Falchuk, independent Jeff
McCormick and independent Scott Lively, for whom
would you vote?
White /
Caucasia
n All others
High
School or
less
Some
college,
no
degree
College
graduate
(BA/BS)
Advance
d degree
430 62 102 137 172 88
30% 16% 26% 26% 33% 27%
40% 53% 44% 33% 40% 50%
2% 3% 3% 2% 3% 1%
2% 0% 3% 4% 1% 2%
1% 6% 2% 2% 0% 1%
2% 2% 1% 3% 3% 0%
2% 2% 1% 3% 3% 0%
20% 20% 20% 26% 17% 18%
429 63 90 144 159 105
31% 24% 32% 28% 34% 28%
27% 36% 26% 20% 29% 38%
5% 5% 6% 8% 3% 3%
2% 0% 2% 3% 1% 0%
2% 5% 1% 3% 4% 1%
1% 5% 2% 2% 2% 0%
3% 0% 1% 3% 3% 2%
29% 25% 30% 33% 25% 27%
429 63 90 144 159 105
32% 25% 30% 29% 36% 28%
17% 30% 17% 14% 21% 24%
5% 4% 4% 7% 4% 4%
2% 1% 3% 1% 1% 0%
2% 3% 3% 3% 2% 2%
4% 5% 4% 5% 4% 1%
4% 2% 2% 5% 3% 4%
35% 28% 37% 36% 29% 38%
429 63 90 144 159 105
EDUCATION LEVELRACE
Conducted for WBUR by
More information, including full question wording, available at WBUR.org Page 3 of 48
Massachusetts Statewide Poll of 502 Likely Voters
in November 2014 General ElectionField Dates: June 27-29, 2014
OVERAL
L
Overall
UNWEIGHTED COUNT Unweighted count 502
Charlie Baker 28%
Martha Coakley 41%
Jeff McCormick 2%
Evan Falchuk 2%
Scott Lively 1%
Another candidate 2%
Wouldn't vote 2%
Don't Know / Refused 20%
Total 502
Charlie Baker 30%
Steve Grossman 28%
Jeff McCormick 5%
Evan Falchuk 2%
Scott Lively 2%
Another candidate 2%
Wouldn't vote 2%
Don't Know / Refused 28%
Total 502
Charlie Baker 31%
Don Berwick 19%
Jeff McCormick 5%
Evan Falchuk 2%
Scott Lively 3%
Another candidate 4%
Wouldn't vote 4%
Don't Know / Refused 34%
Total 502
... Democrat Steve Grossman, Republican Charlie
Baker, independent Evan Falchuk, independent Jeff
McCormick and independent Scott Lively, for whom
would you vote?
... Democrat Don Berwick, Republican Charlie Baker,
independent Evan Falchuk, independent Jeff
McCormick and independent Scott Lively, for whom
would you vote?
... Democrat Martha Coakley, Republican Charlie
Baker, independent Evan Falchuk, independent Jeff
McCormick and independent Scott Lively, for whom
would you vote?
Less
than
$25k $25-$75k
$75-
$150k
More
than
$150k
Charlie
Baker
Martha
Coakley
Independ
ent
candidat
e
Don't
know /
other
40 130 157 75 139 210 30 112
27% 20% 33% 34% 100% 0% 0% 0%
48% 51% 36% 47% 0% 100% 0% 0%
2% 1% 3% 3% 0% 0% 39% 0%
5% 2% 4% 0% 0% 0% 38% 0%
0% 3% 1% 2% 0% 0% 24% 0%
3% 2% 2% 2% 0% 0% 0% 10%
2% 1% 1% 0% 0% 0% 0% 0%
13% 21% 22% 12% 0% 0% 0% 90%
37 126 161 79 142 207 29 113
25% 24% 32% 35% 89% 10% 12% 2%
34% 30% 29% 33% 6% 56% 22% 8%
5% 2% 6% 5% 0% 5% 33% 3%
5% 3% 2% 1% 1% 1% 17% 0%
0% 6% 1% 1% 0% 3% 9% 1%
4% 1% 1% 4% % 1% 0% 3%
0% 1% 2% 2% 0% 2% 0% 1%
26% 34% 27% 19% 4% 21% 7% 81%
37 126 161 79 142 207 29 113
27% 25% 35% 36% 91% 11% 8% 1%
26% 20% 15% 24% 2% 40% 11% 3%
5% 5% 5% 7% 0% 5% 41% 1%
7% 2% 1% 0% 0% 1% 19% 1%
0% 4% 3% 1% 2% 3% 12% 0%
5% 4% 3% 6% 1% 4% 0% 8%
5% 4% 3% 3% 0% 7% 0% 0%
25% 37% 34% 23% 5% 29% 10% 87%
37 126 161 79 142 207 29 113
INCOME RANGES
GOV HORSERACE - BAKER V
COAKLEY
Conducted for WBUR by
More information, including full question wording, available at WBUR.org Page 4 of 48

Massachusetts Statewide Poll of 502 Likely Voters
in November 2014 General ElectionField Dates: June 27-29, 2014
OVERAL
L
Overall
UNWEIGHTED COUNT Unweighted count 502
Charlie Baker 28%
Martha Coakley 41%
Jeff McCormick 2%
Evan Falchuk 2%
Scott Lively 1%
Another candidate 2%
Wouldn't vote 2%
Don't Know / Refused 20%
Total 502
Charlie Baker 30%
Steve Grossman 28%
Jeff McCormick 5%
Evan Falchuk 2%
Scott Lively 2%
Another candidate 2%
Wouldn't vote 2%
Don't Know / Refused 28%
Total 502
Charlie Baker 31%
Don Berwick 19%
Jeff McCormick 5%
Evan Falchuk 2%
Scott Lively 3%
Another candidate 4%
Wouldn't vote 4%
Don't Know / Refused 34%
Total 502
... Democrat Steve Grossman, Republican Charlie
Baker, independent Evan Falchuk, independent Jeff
McCormick and independent Scott Lively, for whom
would you vote?
... Democrat Don Berwick, Republican Charlie Baker,
independent Evan Falchuk, independent Jeff
McCormick and independent Scott Lively, for whom
would you vote?
... Democrat Martha Coakley, Republican Charlie
Baker, independent Evan Falchuk, independent Jeff
McCormick and independent Scott Lively, for whom
would you vote?
Charlie
Baker
Steve
Grossma
n
Independ
ent
candidat
e
Don't
know /
other
150 145 45 150
82% 6% 2% 4%
14% 82% 45% 30%
1% 1% 17% 1%
0% 3% 16% 0%
2% 1% 6% 1%
0% 1% 5% 4%
1% 1% 3% 1%
1% 5% 6% 59%
153 142 45 151
100% 0% 0% 0%
0% 100% 0% 0%
0% 0% 54% 0%
0% 0% 19% 0%
0% 0% 27% 0%
0% 0% 0% 5%
0% 0% 0% 0%
0% 0% 0% 95%
153 142 45 151
88% 10% 4% 4%
1% 55% 12% 5%
1% 3% 41% 0%
0% 2% 11% 1%
1% 0% 20% 1%
1% 3% 0% 8%
0% 7% 1% 1%
7% 22% 10% 81%
153 142 45 151
GOV HORSERACE - BAKER V
GROSSMAN
Conducted for WBUR by
More information, including full question wording, available at WBUR.org Page 5 of 48

Massachusetts Statewide Poll of 502 Likely Voters
in November 2014 General ElectionField Dates: June 27-29, 2014
OVERAL
L
Overall
UNWEIGHTED COUNT Unweighted count 502
Charlie Baker 28%
Martha Coakley 41%
Jeff McCormick 2%
Evan Falchuk 2%
Scott Lively 1%
Another candidate 2%
Wouldn't vote 2%
Don't Know / Refused 20%
Total 502
Charlie Baker 30%
Steve Grossman 28%
Jeff McCormick 5%
Evan Falchuk 2%
Scott Lively 2%
Another candidate 2%
Wouldn't vote 2%
Don't Know / Refused 28%
Total 502
Charlie Baker 31%
Don Berwick 19%
Jeff McCormick 5%
Evan Falchuk 2%
Scott Lively 3%
Another candidate 4%
Wouldn't vote 4%
Don't Know / Refused 34%
Total 502
... Democrat Steve Grossman, Republican Charlie
Baker, independent Evan Falchuk, independent Jeff
McCormick and independent Scott Lively, for whom
would you vote?
... Democrat Don Berwick, Republican Charlie Baker,
independent Evan Falchuk, independent Jeff
McCormick and independent Scott Lively, for whom
would you vote?
... Democrat Martha Coakley, Republican Charlie
Baker, independent Evan Falchuk, independent Jeff
McCormick and independent Scott Lively, for whom
would you vote?
Charlie
Baker
Don
Berwick
Independ
ent
candidat
e
Don't
know /
other
VOTES
FOR 1+
INDY
VOTES
FOR NO
INDY Approve
Disappro
ve
154 95 45 189 101 401 280 191
83% 3% 6% 4% 21% 30% 27% 32%
14% 87% 42% 37% 37% 42% 42% 41%
1% 2% 18% 0% 11% 0% 3% 1%
1% 1% 15% 1% 11% 0% 2% 2%
0% 0% 13% % 7% 0% 1% 2%
0% 1% 0% 5% 2% 2% 2% 2%
1% 2% 3% 1% 3% 2% 1% 4%
1% 2% 4% 51% 8% 23% 22% 16%
155 94 45 188 101 401 281 190
86% 2% 8% 7% 29% 31% 29% 34%
9% 83% 13% 18% 18% 31% 27% 31%
1% 4% 33% 2% 24% 0% 7% 2%
0% 2% 15% 0% 9% 0% 2% 2%
0% 0% 24% 1% 12% 0% 2% 3%
% 0% 0% 4% 0% 2% 1% 2%
0% 2% 0% 1% 0% 3% 2% 2%
3% 8% 7% 67% 8% 33% 31% 23%
155 94 45 188 101 401 281 190
100% 0% 0% 0% 24% 33% 32% 31%
0% 100% 0% 0% 13% 20% 18% 20%
0% 0% 52% 0% 24% 0% 6% 3%
0% 0% 18% 0% 8% 0% 1% 2%
0% 0% 29% 0% 13% 0% 3% 3%
0% 0% 0% 10% 1% 4% 3% 5%
0% 0% 0% 0% 1% 5% 3% 4%
0% 0% 0% 90% 17% 38% 35% 31%
155 94 45 188 101 401 281 190
APPROVE OF
CASINOS?
GOV HORSERACE - BAKER V
BERWICK
VOTES FOR AN
INDEPENDENT IN
ANY MATCHUP
Conducted for WBUR by
More information, including full question wording, available at WBUR.org Page 6 of 48

Massachusetts Statewide Poll of 502 Likely Voters
in November 2014 General ElectionField Dates: June 27-29, 2014
OVERAL
L
Overall
UNWEIGHTED COUNT Unweighted count 502
Charlie Baker 28%
Martha Coakley 41%
Jeff McCormick 2%
Evan Falchuk 2%
Scott Lively 1%
Another candidate 2%
Wouldn't vote 2%
Don't Know / Refused 20%
Total 502
Charlie Baker 30%
Steve Grossman 28%
Jeff McCormick 5%
Evan Falchuk 2%
Scott Lively 2%
Another candidate 2%
Wouldn't vote 2%
Don't Know / Refused 28%
Total 502
Charlie Baker 31%
Don Berwick 19%
Jeff McCormick 5%
Evan Falchuk 2%
Scott Lively 3%
Another candidate 4%
Wouldn't vote 4%
Don't Know / Refused 34%
Total 502
... Democrat Steve Grossman, Republican Charlie
Baker, independent Evan Falchuk, independent Jeff
McCormick and independent Scott Lively, for whom
would you vote?
... Democrat Don Berwick, Republican Charlie Baker,
independent Evan Falchuk, independent Jeff
McCormick and independent Scott Lively, for whom
would you vote?
... Democrat Martha Coakley, Republican Charlie
Baker, independent Evan Falchuk, independent Jeff
McCormick and independent Scott Lively, for whom
would you vote?
Very /
somewh
at closely
Not too /
not at all
closely
Great
deal / fair
amount
Not too
much /
none at
all
Net
positive
Net
negative
303 198 224 249 247 203
32% 23% 20% 37% 27% 31%
41% 40% 52% 32% 42% 41%
3% 1% 3% 2% 3% 1%
2% 2% 2% 3% 2% 2%
1% 2% 2% 1% 2% %
2% 3% 3% 2% 2% 2%
3% 1% 1% 3% 1% 4%
15% 27% 18% 20% 19% 18%
300 201 218 255 248 201
34% 26% 22% 39% 30% 33%
30% 26% 32% 24% 27% 30%
5% 5% 5% 5% 7% 2%
2% 2% 2% 2% 2% 2%
2% 3% 3% 2% 2% 3%
2% 1% 2% 1% 1% 2%
3% 1% 3% 2% 2% 3%
24% 36% 31% 25% 28% 25%
300 201 218 255 248 201
35% 24% 25% 38% 32% 31%
20% 17% 22% 16% 19% 20%
4% 6% 7% 3% 7% 3%
2% 1% 2% 2% 1% 3%
4% 1% 2% 3% 3% 3%
4% 3% 5% 3% 3% 5%
3% 5% 4% 4% 3% 5%
27% 43% 34% 31% 33% 31%
300 201 218 255 248 201
HOW CLOSELY
FOLLOWING
CASINOS
CONFIDENCE IN
GAMING
COMMISSION
VIEW OF
CASINOS
Conducted for WBUR by
More information, including full question wording, available at WBUR.org Page 7 of 48

Massachusetts Statewide Poll of 502 Likely Voters
in November 2014 General ElectionField Dates: June 27-29, 2014
OVERAL
L
Overall
UNWEIGHTED COUNT Unweighted count 502
Charlie Baker 28%
Martha Coakley 41%
Jeff McCormick 2%
Evan Falchuk 2%
Scott Lively 1%
Another candidate 2%
Wouldn't vote 2%
Don't Know / Refused 20%
Total 502
Charlie Baker 30%
Steve Grossman 28%
Jeff McCormick 5%
Evan Falchuk 2%
Scott Lively 2%
Another candidate 2%
Wouldn't vote 2%
Don't Know / Refused 28%
Total 502
Charlie Baker 31%
Don Berwick 19%
Jeff McCormick 5%
Evan Falchuk 2%
Scott Lively 3%
Another candidate 4%
Wouldn't vote 4%
Don't Know / Refused 34%
Total 502
... Democrat Steve Grossman, Republican Charlie
Baker, independent Evan Falchuk, independent Jeff
McCormick and independent Scott Lively, for whom
would you vote?
... Democrat Don Berwick, Republican Charlie Baker,
independent Evan Falchuk, independent Jeff
McCormick and independent Scott Lively, for whom
would you vote?
... Democrat Martha Coakley, Republican Charlie
Baker, independent Evan Falchuk, independent Jeff
McCormick and independent Scott Lively, for whom
would you vote?
Western
/ Central
MA
Southeas
t MA
Outer
Boston
Suburbs
Boston /
Inner
Suburbs
127 62 165 129
20% 33% 34% 24%
47% 40% 33% 50%
3% 1% 3% 2%
3% 3% 2% 1%
1% 0% 2% 1%
1% 5% 2% 3%
0% 1% 4% 2%
25% 18% 20% 18%
128 58 184 113
25% 34% 35% 24%
30% 21% 20% 44%
4% 7% 7% 2%
2% 4% 1% 2%
3% 1% 3% 1%
1% 2% 2% 1%
1% 2% 4% 2%
34% 29% 28% 24%
128 58 184 113
24% 35% 32% 30%
18% 20% 16% 25%
4% 8% 7% 1%
2% 1% 2% 2%
3% 1% 3% 2%
3% 4% 3% 5%
4% 2% 6% 2%
41% 28% 31% 33%
128 58 184 113
REGIONS
Conducted for WBUR by
More information, including full question wording, available at WBUR.org Page 8 of 48

Massachusetts Statewide Poll of 502 Likely Voters
in November 2014 General ElectionField Dates: June 27-29, 2014
OVERAL
L
Overall
Democra
t
Republic
an
Unenroll
ed /
Other Male Female
UNWEIGHTED COUNT Unweighted count 502 190 61 251 238 264
PARTY REGISTRATION GENDER
Mark Fisher 13% 3% 53% 11% 15% 12%
Martha Coakley 43% 62% 13% 36% 36% 49%
Jeff McCormick 6% 5% 0% 9% 9% 4%
Evan Falchuk 2% 1% 0% 2% 2% 1%
Scott Lively 2% 1% 0% 3% 2% 2%
Another candidate 4% 4% 5% 3% 4% 4%
Wouldn't vote 5% 3% 11% 6% 7% 4%
Don't Know / Refused 25% 20% 18% 29% 25% 24%
Total 502 181 60 261 243 259
Mark Fisher 15% 2% 53% 15% 15% 14%
Steve Grossman 31% 49% 12% 22% 31% 30%
Jeff McCormick 8% 5% 3% 10% 8% 8%
Evan Falchuk 3% 2% 0% 4% 4% 1%
Scott Lively 3% 3% 0% 4% 2% 4%
Another candidate 3% 4% 3% 3% 3% 3%
Wouldn't vote 8% 9% 10% 6% 10% 6%
Don't Know / Refused 30% 25% 19% 36% 27% 33%
Total 502 181 60 261 243 259
Mark Fisher 14% 3% 52% 12% 16% 12%
Don Berwick 21% 36% 0% 15% 20% 22%
Jeff McCormick 9% 7% 2% 12% 9% 9%
Evan Falchuk 2% 1% 0% 2% 1% 2%
Scott Lively 4% 1% 2% 6% 4% 3%
Another candidate 3% 4% 1% 3% 4% 3%
Wouldn't vote 12% 13% 17% 9% 15% 9%
Don't Know / Refused 36% 34% 25% 40% 30% 41%
Total 502 181 60 261 243 259
... Democrat Martha Coakley, Republican Mark Fisher,
independent Evan Falchuk, independent Jeff
McCormick and independent Scott Lively, for whom
would you vote?
... Democrat Steve Grossman, Republican Mark
Fisher, independent Evan Falchuk, independent Jeff
McCormick and independent Scott Lively, for whom
would you vote?
... Democrat Don Berwick, Republican Mark Fisher,
independent Evan Falchuk, independent Jeff
McCormick and independent Scott Lively, for whom
would you vote?
Conducted for WBUR by
More information, including full question wording, available at WBUR.org Page 9 of 48

Massachusetts Statewide Poll of 502 Likely Voters
in November 2014 General ElectionField Dates: June 27-29, 2014
OVERAL
L
Overall
UNWEIGHTED COUNT Unweighted count 502
Mark Fisher 13%
Martha Coakley 43%
Jeff McCormick 6%
Evan Falchuk 2%
Scott Lively 2%
Another candidate 4%
Wouldn't vote 5%
Don't Know / Refused 25%
Total 502
Mark Fisher 15%
Steve Grossman 31%
Jeff McCormick 8%
Evan Falchuk 3%
Scott Lively 3%
Another candidate 3%
Wouldn't vote 8%
Don't Know / Refused 30%
Total 502
Mark Fisher 14%
Don Berwick 21%
Jeff McCormick 9%
Evan Falchuk 2%
Scott Lively 4%
Another candidate 3%
Wouldn't vote 12%
Don't Know / Refused 36%
Total 502
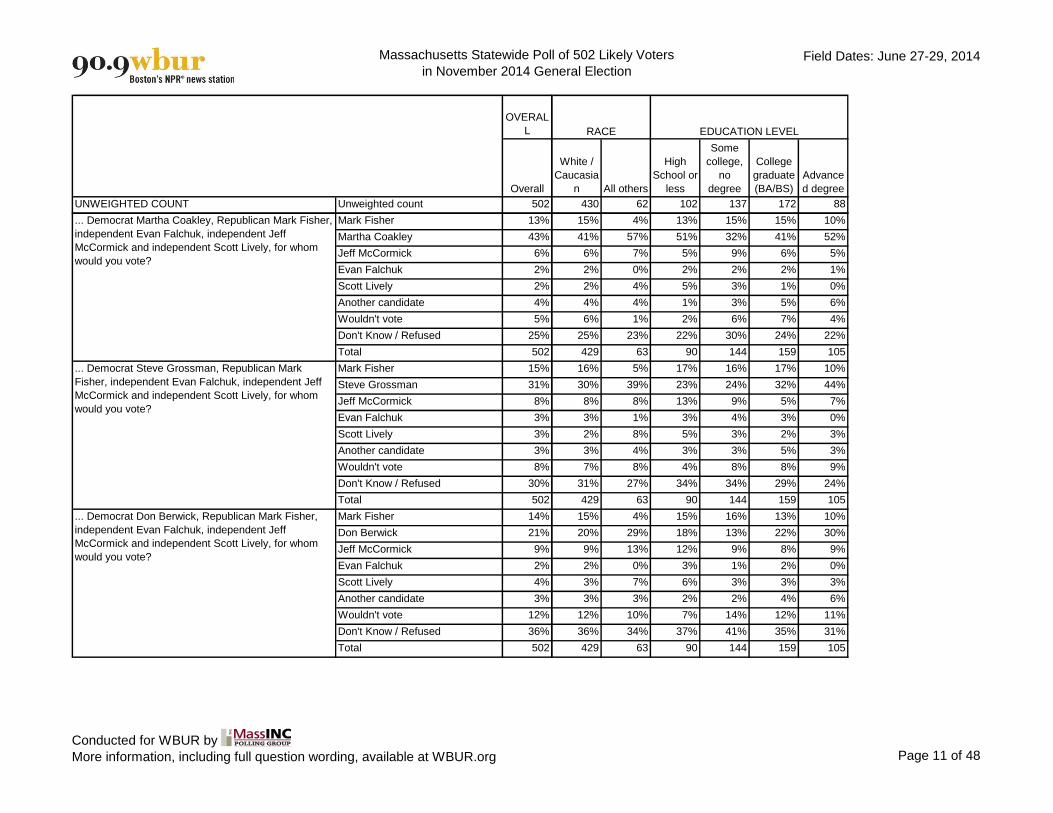
... Democrat Martha Coakley, Republican Mark Fisher,
independent Evan Falchuk, independent Jeff
McCormick and independent Scott Lively, for whom
would you vote?
... Democrat Steve Grossman, Republican Mark
Fisher, independent Evan Falchuk, independent Jeff
McCormick and independent Scott Lively, for whom
would you vote?
... Democrat Don Berwick, Republican Mark Fisher,
independent Evan Falchuk, independent Jeff
McCormick and independent Scott Lively, for whom
would you vote?
18 to 29 30 to 44 45 to 59 60+
Men age
18-49
Women
age 18-
49
Men age
50+
Women
age 50+
63 122 169 148 113 112 125 152
AGE CATEGORIES AGE AND GENDER
14% 14% 13% 13% 19% 11% 12% 13%
49% 37% 40% 47% 33% 47% 39% 50%
8% 6% 9% 4% 8% 4% 10% 4%
3% 1% 2% 1% 3% 2% 1% 1%
3% 2% 2% 1% 2% 3% 2% 1%
0% 6% 2% 6% 3% 4% 4% 5%
4% 6% 7% 4% 8% 2% 7% 5%
19% 28% 25% 24% 24% 28% 25% 21%
60 131 166 146 109 120 134 139
13% 16% 15% 14% 17% 14% 14% 15%
29% 26% 33% 34% 28% 29% 34% 31%
11% 9% 6% 7% 7% 9% 8% 7%
6% 1% 4% 1% 4% 2% 4% 1%
4% 6% 2% 1% 4% 6% 1% 2%
1% 3% 2% 5% 4% 2% 3% 5%
6% 6% 8% 9% 10% 2% 9% 8%
29% 33% 28% 31% 26% 37% 27% 31%
60 131 166 146 109 120 134 139
15% 14% 12% 15% 19% 10% 13% 13%
25% 16% 24% 20% 20% 23% 20% 21%
12% 12% 9% 6% 10% 11% 9% 8%
1% 1% 3% 1% 2% 2% 1% 2%
8% 4% 5% 1% 5% 6% 4% 1%
0% 6% 2% 4% 4% 3% 4% 2%
13% 8% 9% 17% 11% 6% 17% 12%
26% 39% 37% 36% 29% 40% 32% 42%
60 131 166 146 109 120 134 139
Conducted for WBUR by
More information, including full question wording, available at WBUR.org Page 10 of 48
Massachusetts Statewide Poll of 502 Likely Voters
in November 2014 General ElectionField Dates: June 27-29, 2014
OVERAL
L
Overall
UNWEIGHTED COUNT Unweighted count 502
Mark Fisher 13%
Martha Coakley 43%
Jeff McCormick 6%
Evan Falchuk 2%
Scott Lively 2%
Another candidate 4%
Wouldn't vote 5%
Don't Know / Refused 25%
Total 502
Mark Fisher 15%
Steve Grossman 31%
Jeff McCormick 8%
Evan Falchuk 3%
Scott Lively 3%
Another candidate 3%
Wouldn't vote 8%
Don't Know / Refused 30%
Total 502
Mark Fisher 14%
Don Berwick 21%
Jeff McCormick 9%
Evan Falchuk 2%
Scott Lively 4%
Another candidate 3%
Wouldn't vote 12%
Don't Know / Refused 36%
Total 502
... Democrat Martha Coakley, Republican Mark Fisher,
independent Evan Falchuk, independent Jeff
McCormick and independent Scott Lively, for whom
would you vote?
... Democrat Steve Grossman, Republican Mark
Fisher, independent Evan Falchuk, independent Jeff
McCormick and independent Scott Lively, for whom
would you vote?
... Democrat Don Berwick, Republican Mark Fisher,
independent Evan Falchuk, independent Jeff
McCormick and independent Scott Lively, for whom
would you vote?
White /
Caucasia
n All others
High
School or
less
Some
college,
no
degree
College
graduate
(BA/BS)
Advance
d degree
430 62 102 137 172 88
EDUCATION LEVELRACE
15% 4% 13% 15% 15% 10%
41% 57% 51% 32% 41% 52%
6% 7% 5% 9% 6% 5%
2% 0% 2% 2% 2% 1%
2% 4% 5% 3% 1% 0%
4% 4% 1% 3% 5% 6%
6% 1% 2% 6% 7% 4%
25% 23% 22% 30% 24% 22%
429 63 90 144 159 105
16% 5% 17% 16% 17% 10%
30% 39% 23% 24% 32% 44%
8% 8% 13% 9% 5% 7%
3% 1% 3% 4% 3% 0%
2% 8% 5% 3% 2% 3%
3% 4% 3% 3% 5% 3%
7% 8% 4% 8% 8% 9%
31% 27% 34% 34% 29% 24%
429 63 90 144 159 105
15% 4% 15% 16% 13% 10%
20% 29% 18% 13% 22% 30%
9% 13% 12% 9% 8% 9%
2% 0% 3% 1% 2% 0%
3% 7% 6% 3% 3% 3%
3% 3% 2% 2% 4% 6%
12% 10% 7% 14% 12% 11%
36% 34% 37% 41% 35% 31%
429 63 90 144 159 105
Conducted for WBUR by
More information, including full question wording, available at WBUR.org Page 11 of 48

Massachusetts Statewide Poll of 502 Likely Voters
in November 2014 General ElectionField Dates: June 27-29, 2014
OVERAL
L
Overall
UNWEIGHTED COUNT Unweighted count 502
Mark Fisher 13%
Martha Coakley 43%
Jeff McCormick 6%
Evan Falchuk 2%
Scott Lively 2%
Another candidate 4%
Wouldn't vote 5%
Don't Know / Refused 25%
Total 502
Mark Fisher 15%
Steve Grossman 31%
Jeff McCormick 8%
Evan Falchuk 3%
Scott Lively 3%
Another candidate 3%
Wouldn't vote 8%
Don't Know / Refused 30%
Total 502
Mark Fisher 14%
Don Berwick 21%
Jeff McCormick 9%
Evan Falchuk 2%
Scott Lively 4%
Another candidate 3%
Wouldn't vote 12%
Don't Know / Refused 36%
Total 502
... Democrat Martha Coakley, Republican Mark Fisher,
independent Evan Falchuk, independent Jeff
McCormick and independent Scott Lively, for whom
would you vote?
... Democrat Steve Grossman, Republican Mark
Fisher, independent Evan Falchuk, independent Jeff
McCormick and independent Scott Lively, for whom
would you vote?
... Democrat Don Berwick, Republican Mark Fisher,
independent Evan Falchuk, independent Jeff
McCormick and independent Scott Lively, for whom
would you vote?
Less
than
$25k $25-$75k
$75-
$150k
More
than
$150k
Charlie
Baker
Martha
Coakley
Independ
ent
candidat
e
Don't
know /
other
40 130 157 75 139 210 30 112
INCOME RANGES
GOV HORSERACE - BAKER V
COAKLEY
13% 10% 16% 11% 42% 1% 9% 2%
50% 51% 39% 44% 7% 92% 11% 8%
6% 6% 7% 7% 8% 1% 43% 3%
5% 3% 1% 0% 0% 1% 20% 1%
0% 4% 1% 0% 2% 0% 18% 1%
9% 1% 2% 6% 8% 1% 0% 6%
2% 1% 7% 10% 13% % 0% 1%
15% 23% 28% 22% 20% 3% 0% 78%
37 126 161 79 142 207 29 113
11% 14% 17% 8% 43% 4% 7% 2%
35% 32% 29% 39% 11% 58% 33% 8%
14% 6% 8% 9% 8% 8% 18% 5%
7% 3% 4% 1% 1% 1% 24% 1%
0% 5% 3% 1% 2% 3% 18% 1%
6% 2% 4% 3% 5% 3% 0% 3%
4% 3% 8% 10% 11% 7% 0% 3%
23% 34% 28% 28% 20% 17% 0% 78%
37 126 161 79 142 207 29 113
13% 11% 16% 7% 41% 4% 5% 0%
30% 22% 17% 26% 4% 43% 15% 3%
13% 8% 9% 12% 8% 8% 36% 6%
5% 3% 1% 1% 1% % 19% 1%
0% 7% 2% 3% 2% 4% 22% 1%
6% 1% 4% 4% 6% 2% 0% 3%
9% 8% 12% 16% 17% 13% 0% 3%
23% 40% 38% 31% 22% 26% 4% 83%
37 126 161 79 142 207 29 113
Conducted for WBUR by
More information, including full question wording, available at WBUR.org Page 12 of 48
Massachusetts Statewide Poll of 502 Likely Voters
in November 2014 General ElectionField Dates: June 27-29, 2014
OVERAL
L
Overall
UNWEIGHTED COUNT Unweighted count 502
Mark Fisher 13%
Martha Coakley 43%
Jeff McCormick 6%
Evan Falchuk 2%
Scott Lively 2%
Another candidate 4%
Wouldn't vote 5%
Don't Know / Refused 25%
Total 502
Mark Fisher 15%
Steve Grossman 31%
Jeff McCormick 8%
Evan Falchuk 3%
Scott Lively 3%
Another candidate 3%
Wouldn't vote 8%
Don't Know / Refused 30%
Total 502
Mark Fisher 14%
Don Berwick 21%
Jeff McCormick 9%
Evan Falchuk 2%
Scott Lively 4%
Another candidate 3%
Wouldn't vote 12%
Don't Know / Refused 36%
Total 502
... Democrat Martha Coakley, Republican Mark Fisher,
independent Evan Falchuk, independent Jeff
McCormick and independent Scott Lively, for whom
would you vote?
... Democrat Steve Grossman, Republican Mark
Fisher, independent Evan Falchuk, independent Jeff
McCormick and independent Scott Lively, for whom
would you vote?
... Democrat Don Berwick, Republican Mark Fisher,
independent Evan Falchuk, independent Jeff
McCormick and independent Scott Lively, for whom
would you vote?
Charlie
Baker
Steve
Grossma
n
Independ
ent
candidat
e
Don't
know /
other
150 145 45 150
GOV HORSERACE - BAKER V
GROSSMAN
37% 2% 6% 3%
17% 85% 41% 29%
9% 3% 31% 1%
1% 3% 8% 0%
2% 0% 10% 1%
7% 1% 3% 3%
9% 3% 0% 1%
17% 3% 2% 62%
153 142 45 151
41% 1% 12% 3%
13% 87% 2% 8%
10% 2% 40% 2%
1% 2% 18% 0%
3% 1% 16% 2%
5% 0% 3% 4%
10% 2% 4% 5%
18% 4% 5% 77%
153 142 45 151
39% 3% 5% 1%
3% 60% 8% 6%
11% 5% 45% 2%
1% 1% 10% 0%
3% 3% 23% 1%
6% 2% 0% 2%
12% 14% 3% 7%
24% 13% 5% 81%
153 142 45 151
Conducted for WBUR by
More information, including full question wording, available at WBUR.org Page 13 of 48

Massachusetts Statewide Poll of 502 Likely Voters
in November 2014 General ElectionField Dates: June 27-29, 2014
OVERAL
L
Overall
UNWEIGHTED COUNT Unweighted count 502
Mark Fisher 13%
Martha Coakley 43%
Jeff McCormick 6%
Evan Falchuk 2%
Scott Lively 2%
Another candidate 4%
Wouldn't vote 5%
Don't Know / Refused 25%
Total 502
Mark Fisher 15%
Steve Grossman 31%
Jeff McCormick 8%
Evan Falchuk 3%
Scott Lively 3%
Another candidate 3%
Wouldn't vote 8%
Don't Know / Refused 30%
Total 502
Mark Fisher 14%
Don Berwick 21%
Jeff McCormick 9%
Evan Falchuk 2%
Scott Lively 4%
Another candidate 3%
Wouldn't vote 12%
Don't Know / Refused 36%
Total 502
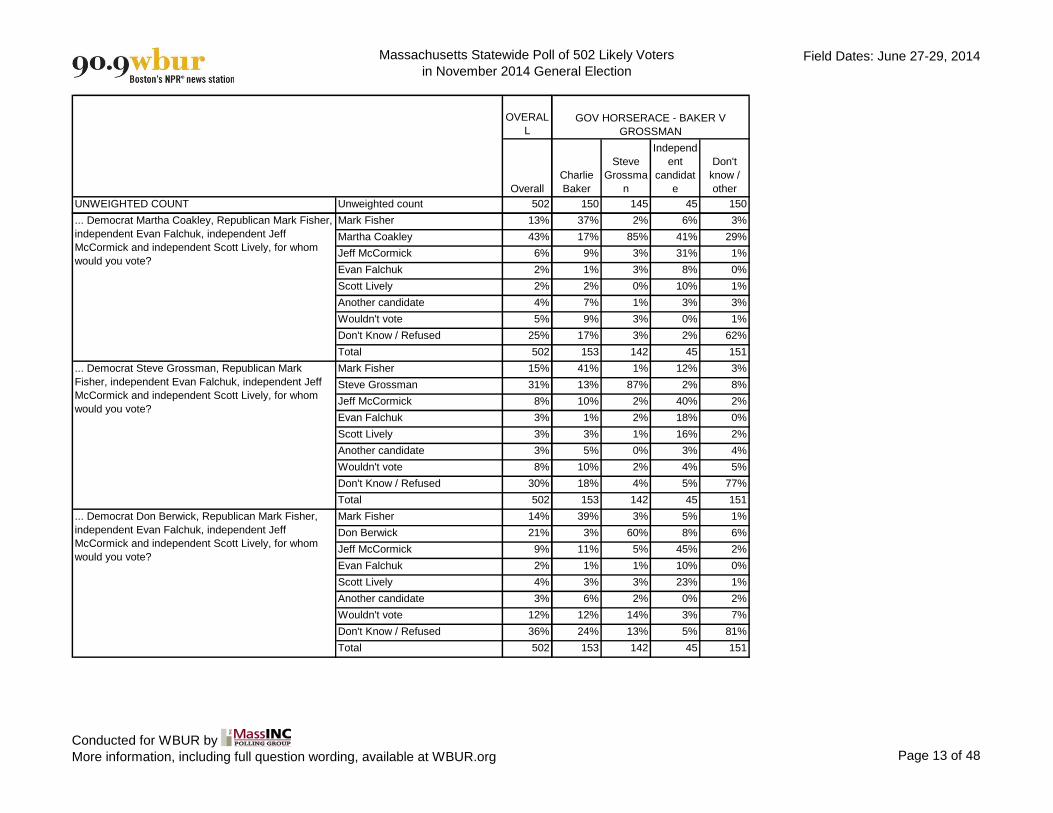
... Democrat Martha Coakley, Republican Mark Fisher,
independent Evan Falchuk, independent Jeff
McCormick and independent Scott Lively, for whom
would you vote?
... Democrat Steve Grossman, Republican Mark
Fisher, independent Evan Falchuk, independent Jeff
McCormick and independent Scott Lively, for whom
would you vote?
... Democrat Don Berwick, Republican Mark Fisher,
independent Evan Falchuk, independent Jeff
McCormick and independent Scott Lively, for whom
would you vote?
Charlie
Baker
Don
Berwick
Independ
ent
candidat
e
Don't
know /
other
VOTES
FOR 1+
INDY
VOTES
FOR NO
INDY Approve
Disappro
ve
154 95 45 189 101 401 280 191
APPROVE OF
CASINOS?
GOV HORSERACE - BAKER V
BERWICK
VOTES FOR AN
INDEPENDENT IN
ANY MATCHUP
36% 2% 9% 2% 8% 15% 16% 12%
19% 86% 40% 37% 34% 45% 42% 44%
9% 6% 24% 1% 32% 0% 7% 7%
0% 2% 8% 2% 8% 0% 2% 1%
2% 0% 12% 1% 10% 0% 3% 1%
8% 0% 2% 3% 2% 4% 3% 5%
12% 3% 0% 1% 1% 6% 5% 6%
14% 2% 3% 53% 4% 30% 23% 24%
155 94 45 188 101 401 281 190
42% 1% 12% 1% 8% 17% 17% 14%
15% 84% 13% 20% 16% 35% 28% 36%
8% 4% 30% 5% 39% 0% 10% 5%
1% 4% 15% % 13% 0% 3% 2%
1% 1% 23% 2% 15% 0% 3% 3%
5% 1% 3% 3% 2% 3% 3% 3%
12% 3% 2% 3% 3% 9% 8% 6%
16% 3% 2% 65% 4% 37% 28% 31%
155 94 45 188 101 401 281 190
40% 2% 4% 1% 6% 16% 16% 13%
3% 88% 3% 8% 10% 24% 20% 23%
10% 6% 41% 4% 46% 0% 10% 8%
% 1% 10% 1% 8% 0% 2% 1%
2% 0% 30% 2% 19% 0% 4% 5%
5% 0% 5% 3% 2% 3% 3% 4%
17% 3% 2% 6% 2% 14% 10% 12%
22% 0% 5% 76% 7% 43% 35% 34%
155 94 45 188 101 401 281 190
Conducted for WBUR by
More information, including full question wording, available at WBUR.org Page 14 of 48

Massachusetts Statewide Poll of 502 Likely Voters
in November 2014 General ElectionField Dates: June 27-29, 2014
OVERAL
L
Overall
UNWEIGHTED COUNT Unweighted count 502
Mark Fisher 13%
Martha Coakley 43%
Jeff McCormick 6%
Evan Falchuk 2%
Scott Lively 2%
Another candidate 4%
Wouldn't vote 5%
Don't Know / Refused 25%
Total 502
Mark Fisher 15%
Steve Grossman 31%
Jeff McCormick 8%
Evan Falchuk 3%
Scott Lively 3%
Another candidate 3%
Wouldn't vote 8%
Don't Know / Refused 30%
Total 502
Mark Fisher 14%
Don Berwick 21%
Jeff McCormick 9%
Evan Falchuk 2%
Scott Lively 4%
Another candidate 3%
Wouldn't vote 12%
Don't Know / Refused 36%
Total 502
... Democrat Martha Coakley, Republican Mark Fisher,
independent Evan Falchuk, independent Jeff
McCormick and independent Scott Lively, for whom
would you vote?
... Democrat Steve Grossman, Republican Mark
Fisher, independent Evan Falchuk, independent Jeff
McCormick and independent Scott Lively, for whom
would you vote?
... Democrat Don Berwick, Republican Mark Fisher,
independent Evan Falchuk, independent Jeff
McCormick and independent Scott Lively, for whom
would you vote?
Very /
somewh
at closely
Not too /
not at all
closely
Great
deal / fair
amount
Not too
much /
none at
all
Net
positive
Net
negative
303 198 224 249 247 203
HOW CLOSELY
FOLLOWING
CASINOS
CONFIDENCE IN
GAMING
COMMISSION
VIEW OF
CASINOS
14% 13% 10% 18% 16% 12%
45% 39% 52% 33% 43% 43%
8% 5% 5% 9% 7% 7%
1% 3% 2% 2% 2% 2%
2% 2% 2% 2% 3% 1%
4% 4% 2% 5% 3% 5%
7% 4% 5% 6% 5% 5%
20% 31% 22% 25% 21% 26%
300 201 218 255 248 201
16% 13% 13% 18% 17% 14%
33% 28% 33% 27% 30% 32%
7% 9% 8% 8% 10% 6%
2% 3% 2% 4% 3% 2%
2% 5% 4% 2% 3% 3%
4% 2% 3% 3% 4% 3%
10% 5% 7% 9% 8% 7%
26% 36% 30% 29% 25% 33%
300 201 218 255 248 201
14% 13% 11% 18% 16% 14%
23% 17% 23% 17% 20% 21%
9% 10% 10% 10% 11% 8%
1% 2% 2% 2% 2% 1%
4% 4% 4% 4% 5% 3%
4% 3% 2% 4% 3% 4%
12% 11% 13% 12% 10% 13%
33% 40% 36% 33% 33% 36%
300 201 218 255 248 201
Conducted for WBUR by
More information, including full question wording, available at WBUR.org Page 15 of 48
Massachusetts Statewide Poll of 502 Likely Voters
in November 2014 General ElectionField Dates: June 27-29, 2014
OVERAL
L
Overall
UNWEIGHTED COUNT Unweighted count 502
Mark Fisher 13%
Martha Coakley 43%
Jeff McCormick 6%
Evan Falchuk 2%
Scott Lively 2%
Another candidate 4%
Wouldn't vote 5%
Don't Know / Refused 25%
Total 502
Mark Fisher 15%
Steve Grossman 31%
Jeff McCormick 8%
Evan Falchuk 3%
Scott Lively 3%
Another candidate 3%
Wouldn't vote 8%
Don't Know / Refused 30%
Total 502
Mark Fisher 14%
Don Berwick 21%
Jeff McCormick 9%
Evan Falchuk 2%
Scott Lively 4%
Another candidate 3%
Wouldn't vote 12%
Don't Know / Refused 36%
Total 502
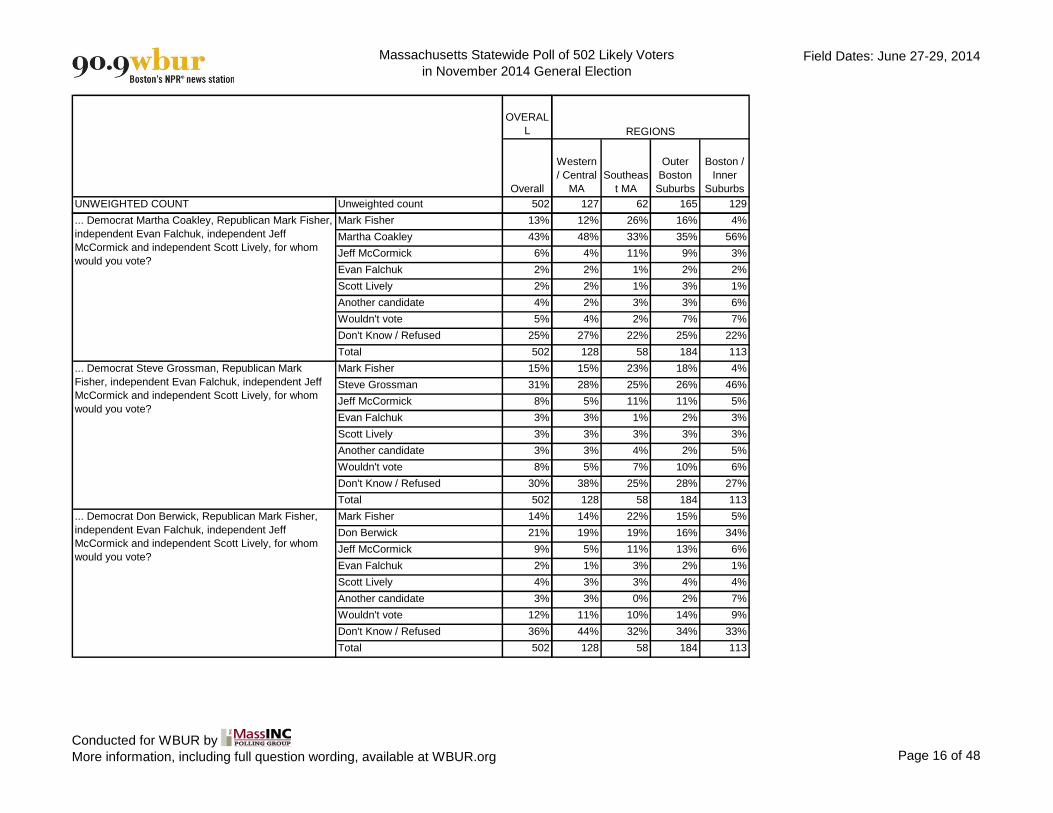
... Democrat Martha Coakley, Republican Mark Fisher,
independent Evan Falchuk, independent Jeff
McCormick and independent Scott Lively, for whom
would you vote?
... Democrat Steve Grossman, Republican Mark
Fisher, independent Evan Falchuk, independent Jeff
McCormick and independent Scott Lively, for whom
would you vote?
... Democrat Don Berwick, Republican Mark Fisher,
independent Evan Falchuk, independent Jeff
McCormick and independent Scott Lively, for whom
would you vote?
Western
/ Central
MA
Southeas
t MA
Outer
Boston
Suburbs
Boston /
Inner
Suburbs
127 62 165 129
REGIONS
12% 26% 16% 4%
48% 33% 35% 56%
4% 11% 9% 3%
2% 1% 2% 2%
2% 1% 3% 1%
2% 3% 3% 6%
4% 2% 7% 7%
27% 22% 25% 22%
128 58 184 113
15% 23% 18% 4%
28% 25% 26% 46%
5% 11% 11% 5%
3% 1% 2% 3%
3% 3% 3% 3%
3% 4% 2% 5%
5% 7% 10% 6%
38% 25% 28% 27%
128 58 184 113
14% 22% 15% 5%
19% 19% 16% 34%
5% 11% 13% 6%
1% 3% 2% 1%
3% 3% 4% 4%
3% 0% 2% 7%
11% 10% 14% 9%
44% 32% 34% 33%
128 58 184 113
Conducted for WBUR by
More information, including full question wording, available at WBUR.org Page 16 of 48
Massachusetts Statewide Poll of 502 Likely Voters
in November 2014 General ElectionField Dates: June 27-29, 2014
OVERAL
L
Overall
Democra
t
Republic
an
Unenroll
ed /
Other Male Female
UNWEIGHTED COUNT Unweighted count 502 190 61 251 238 264
PARTY REGISTRATION GENDER
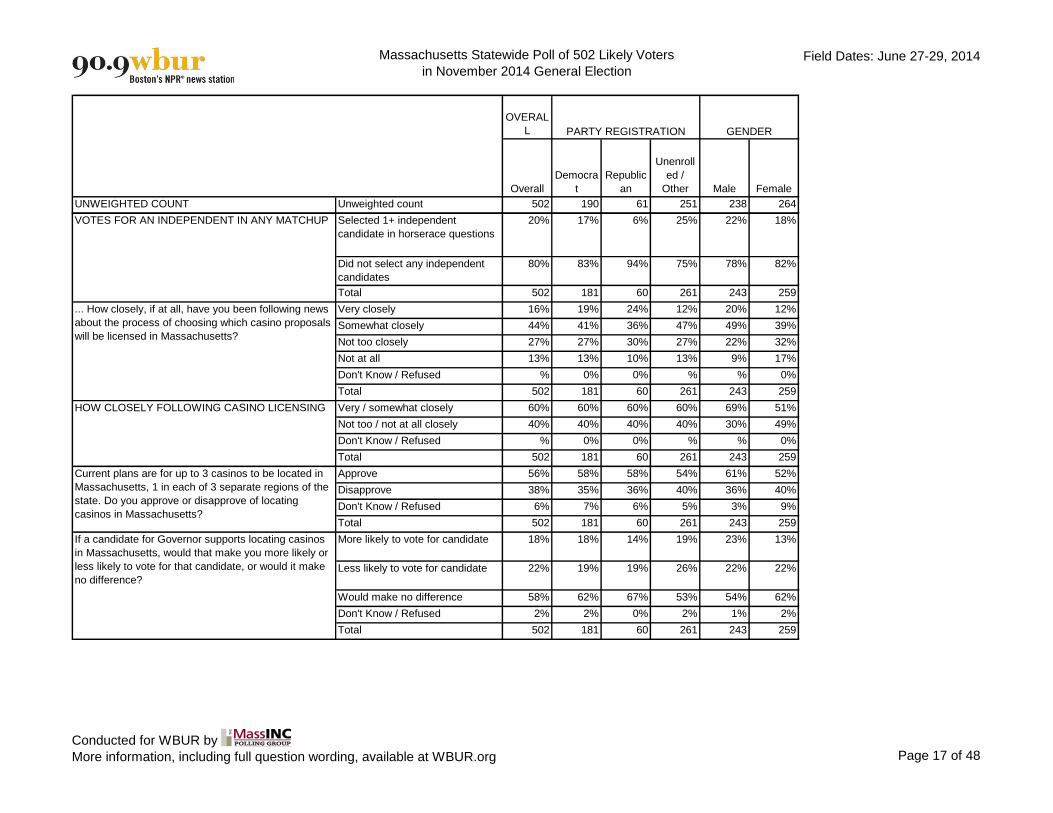
Selected 1+ independent
candidate in horserace questions
20% 17% 6% 25% 22% 18%
Did not select any independent
candidates
80% 83% 94% 75% 78% 82%
Total 502 181 60 261 243 259
Very closely 16% 19% 24% 12% 20% 12%
Somewhat closely 44% 41% 36% 47% 49% 39%
Not too closely 27% 27% 30% 27% 22% 32%
Not at all 13% 13% 10% 13% 9% 17%
Don't Know / Refused % 0% 0% % % 0%
Total 502 181 60 261 243 259
Very / somewhat closely 60% 60% 60% 60% 69% 51%
Not too / not at all closely 40% 40% 40% 40% 30% 49%
Don't Know / Refused % 0% 0% % % 0%
Total 502 181 60 261 243 259
Approve 56% 58% 58% 54% 61% 52%
Disapprove 38% 35% 36% 40% 36% 40%
Don't Know / Refused 6% 7% 6% 5% 3% 9%
Total 502 181 60 261 243 259
More likely to vote for candidate 18% 18% 14% 19% 23% 13%
Less likely to vote for candidate 22% 19% 19% 26% 22% 22%
Would make no difference 58% 62% 67% 53% 54% 62%
Don't Know / Refused 2% 2% 0% 2% 1% 2%
Total 502 181 60 261 243 259
VOTES FOR AN INDEPENDENT IN ANY MATCHUP
... How closely, if at all, have you been following news
about the process of choosing which casino proposals
will be licensed in Massachusetts?
HOW CLOSELY FOLLOWING CASINO LICENSING
Current plans are for up to 3 casinos to be located in
Massachusetts, 1 in each of 3 separate regions of the
state. Do you approve or disapprove of locating
casinos in Massachusetts?
If a candidate for Governor supports locating casinos
in Massachusetts, would that make you more likely or
less likely to vote for that candidate, or would it make
no difference?
Conducted for WBUR by
More information, including full question wording, available at WBUR.org Page 17 of 48

Massachusetts Statewide Poll of 502 Likely Voters
in November 2014 General ElectionField Dates: June 27-29, 2014
OVERAL
L
Overall
UNWEIGHTED COUNT Unweighted count 502
Selected 1+ independent
candidate in horserace questions
20%
Did not select any independent
candidates
80%
Total 502
Very closely 16%
Somewhat closely 44%
Not too closely 27%
Not at all 13%
Don't Know / Refused %
Total 502
Very / somewhat closely 60%
Not too / not at all closely 40%
Don't Know / Refused %
Total 502
Approve 56%
Disapprove 38%
Don't Know / Refused 6%
Total 502
More likely to vote for candidate 18%
Less likely to vote for candidate 22%
Would make no difference 58%
Don't Know / Refused 2%
Total 502
VOTES FOR AN INDEPENDENT IN ANY MATCHUP
... How closely, if at all, have you been following news
about the process of choosing which casino proposals
will be licensed in Massachusetts?
HOW CLOSELY FOLLOWING CASINO LICENSING
Current plans are for up to 3 casinos to be located in
Massachusetts, 1 in each of 3 separate regions of the
state. Do you approve or disapprove of locating
casinos in Massachusetts?
If a candidate for Governor supports locating casinos
in Massachusetts, would that make you more likely or
less likely to vote for that candidate, or would it make
no difference?
18 to 29 30 to 44 45 to 59 60+
Men age
18-49
Women
age 18-
49
Men age
50+
Women
age 50+
63 122 169 148 113 112 125 152
AGE CATEGORIES AGE AND GENDER
30% 19% 21% 16% 22% 21% 22% 16%
70% 81% 79% 84% 78% 79% 78% 84%
60 131 166 146 109 120 134 139
6% 14% 21% 17% 17% 9% 23% 16%
47% 39% 47% 43% 49% 35% 49% 42%
20% 31% 22% 32% 20% 32% 23% 32%
27% 15% 10% 8% 13% 25% 5% 10%
0% 1% 0% 0% 1% 0% 0% 0%
60 131 166 146 109 120 134 139
53% 53% 68% 60% 66% 43% 72% 58%
47% 46% 32% 40% 33% 57% 28% 42%
0% 1% 0% 0% 1% 0% 0% 0%
60 131 166 146 109 120 134 139
65% 55% 58% 52% 59% 56% 62% 48%
29% 41% 38% 39% 40% 37% 33% 42%
7% 4% 5% 10% 2% 8% 5% 10%
60 131 166 146 109 120 134 139
21% 16% 20% 16% 20% 13% 26% 13%
14% 23% 23% 24% 19% 20% 25% 25%
63% 60% 55% 58% 61% 66% 48% 59%
1% % 2% 2% 1% 1% 1% 3%
60 131 166 146 109 120 134 139
Conducted for WBUR by
More information, including full question wording, available at WBUR.org Page 18 of 48

Massachusetts Statewide Poll of 502 Likely Voters
in November 2014 General ElectionField Dates: June 27-29, 2014
OVERAL
L
Overall
UNWEIGHTED COUNT Unweighted count 502
Selected 1+ independent
candidate in horserace questions
20%
Did not select any independent
candidates
80%
Total 502
Very closely 16%
Somewhat closely 44%
Not too closely 27%
Not at all 13%
Don't Know / Refused %
Total 502
Very / somewhat closely 60%
Not too / not at all closely 40%
Don't Know / Refused %
Total 502
Approve 56%
Disapprove 38%
Don't Know / Refused 6%
Total 502
More likely to vote for candidate 18%
Less likely to vote for candidate 22%
Would make no difference 58%
Don't Know / Refused 2%
Total 502
VOTES FOR AN INDEPENDENT IN ANY MATCHUP
... How closely, if at all, have you been following news
about the process of choosing which casino proposals
will be licensed in Massachusetts?
HOW CLOSELY FOLLOWING CASINO LICENSING
Current plans are for up to 3 casinos to be located in
Massachusetts, 1 in each of 3 separate regions of the
state. Do you approve or disapprove of locating
casinos in Massachusetts?
If a candidate for Governor supports locating casinos
in Massachusetts, would that make you more likely or
less likely to vote for that candidate, or would it make
no difference?
White /
Caucasia
n All others
High
School or
less
Some
college,
no
degree
College
graduate
(BA/BS)
Advance
d degree
430 62 102 137 172 88
EDUCATION LEVELRACE
19% 25% 28% 22% 16% 16%
81% 75% 72% 78% 84% 84%
429 63 90 144 159 105
15% 20% 17% 18% 16% 14%
45% 34% 35% 43% 49% 44%
27% 28% 29% 26% 23% 32%
12% 17% 19% 13% 11% 10%
% 0% 0% 0% 1% 0%
429 63 90 144 159 105
60% 54% 52% 61% 65% 58%
40% 46% 48% 39% 34% 42%
% 0% 0% 0% 1% 0%
429 63 90 144 159 105
56% 61% 61% 61% 53% 51%
38% 35% 32% 34% 40% 44%
6% 4% 7% 5% 7% 5%
429 63 90 144 159 105
17% 24% 20% 23% 17% 11%
22% 18% 18% 18% 23% 32%
59% 55% 60% 58% 60% 54%
1% 3% 2% 1% 1% 2%
429 63 90 144 159 105
Conducted for WBUR by
More information, including full question wording, available at WBUR.org Page 19 of 48

Massachusetts Statewide Poll of 502 Likely Voters
in November 2014 General ElectionField Dates: June 27-29, 2014
OVERAL
L
Overall
UNWEIGHTED COUNT Unweighted count 502
Selected 1+ independent
candidate in horserace questions
20%
Did not select any independent
candidates
80%
Total 502
Very closely 16%
Somewhat closely 44%
Not too closely 27%
Not at all 13%
Don't Know / Refused %
Total 502
Very / somewhat closely 60%
Not too / not at all closely 40%
Don't Know / Refused %
Total 502
Approve 56%
Disapprove 38%
Don't Know / Refused 6%
Total 502
More likely to vote for candidate 18%
Less likely to vote for candidate 22%
Would make no difference 58%
Don't Know / Refused 2%
Total 502
VOTES FOR AN INDEPENDENT IN ANY MATCHUP
... How closely, if at all, have you been following news
about the process of choosing which casino proposals
will be licensed in Massachusetts?
HOW CLOSELY FOLLOWING CASINO LICENSING
Current plans are for up to 3 casinos to be located in
Massachusetts, 1 in each of 3 separate regions of the
state. Do you approve or disapprove of locating
casinos in Massachusetts?
If a candidate for Governor supports locating casinos
in Massachusetts, would that make you more likely or
less likely to vote for that candidate, or would it make
no difference?
Less
than
$25k $25-$75k
$75-
$150k
More
than
$150k
Charlie
Baker
Martha
Coakley
Independ
ent
candidat
e
Don't
know /
other
40 130 157 75 139 210 30 112
INCOME RANGES
GOV HORSERACE - BAKER V
COAKLEY
23% 24% 19% 18% 15% 18% 100% 9%
77% 76% 81% 82% 85% 82% 0% 91%
37 126 161 79 142 207 29 113
18% 19% 17% 11% 20% 16% 19% 9%
26% 40% 52% 44% 48% 44% 46% 36%
31% 26% 24% 31% 23% 28% 23% 34%
25% 16% 7% 12% 9% 11% 13% 20%
0% 0% 0% 1% 0% 1% 0% 0%
37 126 161 79 142 207 29 113
44% 58% 69% 56% 68% 60% 65% 46%
56% 42% 31% 43% 32% 39% 35% 54%
0% 0% 0% 1% 0% 1% 0% 0%
37 126 161 79 142 207 29 113
47% 58% 61% 55% 53% 57% 66% 59%
38% 36% 33% 40% 42% 38% 31% 31%
15% 6% 6% 5% 5% 5% 3% 10%
37 126 161 79 142 207 29 113
12% 23% 19% 15% 19% 19% 25% 13%
23% 22% 19% 26% 28% 22% 20% 12%
61% 52% 60% 57% 52% 57% 55% 72%
5% 2% 1% 1% 1% 2% 0% 3%
37 126 161 79 142 207 29 113
Conducted for WBUR by
More information, including full question wording, available at WBUR.org Page 20 of 48

Massachusetts Statewide Poll of 502 Likely Voters
in November 2014 General ElectionField Dates: June 27-29, 2014
OVERAL
L
Overall
UNWEIGHTED COUNT Unweighted count 502
Selected 1+ independent
candidate in horserace questions
20%
Did not select any independent
candidates
80%
Total 502
Very closely 16%
Somewhat closely 44%
Not too closely 27%
Not at all 13%
Don't Know / Refused %
Total 502
Very / somewhat closely 60%
Not too / not at all closely 40%
Don't Know / Refused %
Total 502
Approve 56%
Disapprove 38%
Don't Know / Refused 6%
Total 502
More likely to vote for candidate 18%
Less likely to vote for candidate 22%
Would make no difference 58%
Don't Know / Refused 2%
Total 502
VOTES FOR AN INDEPENDENT IN ANY MATCHUP
... How closely, if at all, have you been following news
about the process of choosing which casino proposals
will be licensed in Massachusetts?
HOW CLOSELY FOLLOWING CASINO LICENSING
Current plans are for up to 3 casinos to be located in
Massachusetts, 1 in each of 3 separate regions of the
state. Do you approve or disapprove of locating
casinos in Massachusetts?
If a candidate for Governor supports locating casinos
in Massachusetts, would that make you more likely or
less likely to vote for that candidate, or would it make
no difference?
Charlie
Baker
Steve
Grossma
n
Independ
ent
candidat
e
Don't
know /
other
150 145 45 150
GOV HORSERACE - BAKER V
GROSSMAN
19% 13% 100% 6%
81% 87% 0% 94%
153 142 45 151
20% 18% 13% 11%
46% 45% 43% 40%
24% 25% 29% 33%
9% 12% 15% 17%
0% 1% 0% 0%
153 142 45 151
66% 63% 56% 50%
34% 36% 44% 50%
0% 1% 0% 0%
153 142 45 151
53% 53% 68% 59%
43% 41% 31% 32%
5% 6% 2% 9%
153 142 45 151
19% 18% 28% 15%
29% 23% 26% 13%
51% 57% 46% 69%
1% 2% 0% 2%
153 142 45 151
Conducted for WBUR by
More information, including full question wording, available at WBUR.org Page 21 of 48

Massachusetts Statewide Poll of 502 Likely Voters
in November 2014 General ElectionField Dates: June 27-29, 2014
OVERAL
L
Overall
UNWEIGHTED COUNT Unweighted count 502
Selected 1+ independent
candidate in horserace questions
20%
Did not select any independent
candidates
80%
Total 502
Very closely 16%
Somewhat closely 44%
Not too closely 27%
Not at all 13%
Don't Know / Refused %
Total 502
Very / somewhat closely 60%
Not too / not at all closely 40%
Don't Know / Refused %
Total 502
Approve 56%
Disapprove 38%
Don't Know / Refused 6%
Total 502
More likely to vote for candidate 18%
Less likely to vote for candidate 22%
Would make no difference 58%
Don't Know / Refused 2%
Total 502
VOTES FOR AN INDEPENDENT IN ANY MATCHUP
... How closely, if at all, have you been following news
about the process of choosing which casino proposals
will be licensed in Massachusetts?
HOW CLOSELY FOLLOWING CASINO LICENSING
Current plans are for up to 3 casinos to be located in
Massachusetts, 1 in each of 3 separate regions of the
state. Do you approve or disapprove of locating
casinos in Massachusetts?
If a candidate for Governor supports locating casinos
in Massachusetts, would that make you more likely or
less likely to vote for that candidate, or would it make
no difference?
Charlie
Baker
Don
Berwick
Independ
ent
candidat
e
Don't
know /
other
VOTES
FOR 1+
INDY
VOTES
FOR NO
INDY Approve
Disappro
ve
154 95 45 189 101 401 280 191
APPROVE OF
CASINOS?
GOV HORSERACE - BAKER V
BERWICK
VOTES FOR AN
INDEPENDENT IN
ANY MATCHUP
15% 14% 100% 9% 100% 0% 22% 18%
85% 86% 0% 91% 0% 100% 78% 82%
155 94 45 188 101 401 281 190
22% 17% 16% 11% 21% 15% 16% 18%
46% 48% 48% 39% 39% 45% 47% 41%
25% 22% 21% 33% 22% 28% 27% 26%
7% 13% 15% 16% 18% 12% 9% 15%
0% 0% 0% 1% 0% % 0% 1%
155 94 45 188 101 401 281 190
68% 64% 64% 50% 60% 60% 64% 58%
32% 36% 36% 49% 40% 40% 36% 41%
0% 0% 0% 1% 0% % 0% 1%
155 94 45 188 101 401 281 190
58% 54% 59% 56% 61% 55% 100% 0%
38% 41% 37% 36% 35% 39% 0% 100%
4% 5% 4% 8% 4% 7% 0% 0%
155 94 45 188 101 401 281 190
20% 14% 32% 16% 30% 15% 30% 3%
27% 26% 22% 16% 26% 21% 1% 57%
52% 59% 46% 65% 43% 62% 69% 38%
1% 2% 0% 3% 1% 2% % 2%
155 94 45 188 101 401 281 190
Conducted for WBUR by
More information, including full question wording, available at WBUR.org Page 22 of 48

Massachusetts Statewide Poll of 502 Likely Voters
in November 2014 General ElectionField Dates: June 27-29, 2014
OVERAL
L
Overall
UNWEIGHTED COUNT Unweighted count 502
Selected 1+ independent
candidate in horserace questions
20%
Did not select any independent
candidates
80%
Total 502
Very closely 16%
Somewhat closely 44%
Not too closely 27%
Not at all 13%
Don't Know / Refused %
Total 502
Very / somewhat closely 60%
Not too / not at all closely 40%
Don't Know / Refused %
Total 502
Approve 56%
Disapprove 38%
Don't Know / Refused 6%
Total 502
More likely to vote for candidate 18%
Less likely to vote for candidate 22%
Would make no difference 58%
Don't Know / Refused 2%
Total 502
VOTES FOR AN INDEPENDENT IN ANY MATCHUP
... How closely, if at all, have you been following news
about the process of choosing which casino proposals
will be licensed in Massachusetts?
HOW CLOSELY FOLLOWING CASINO LICENSING
Current plans are for up to 3 casinos to be located in
Massachusetts, 1 in each of 3 separate regions of the
state. Do you approve or disapprove of locating
casinos in Massachusetts?
If a candidate for Governor supports locating casinos
in Massachusetts, would that make you more likely or
less likely to vote for that candidate, or would it make
no difference?
Very /
somewh
at closely
Not too /
not at all
closely
Great
deal / fair
amount
Not too
much /
none at
all
Net
positive
Net
negative
303 198 224 249 247 203
HOW CLOSELY
FOLLOWING
CASINOS
CONFIDENCE IN
GAMING
COMMISSION
VIEW OF
CASINOS
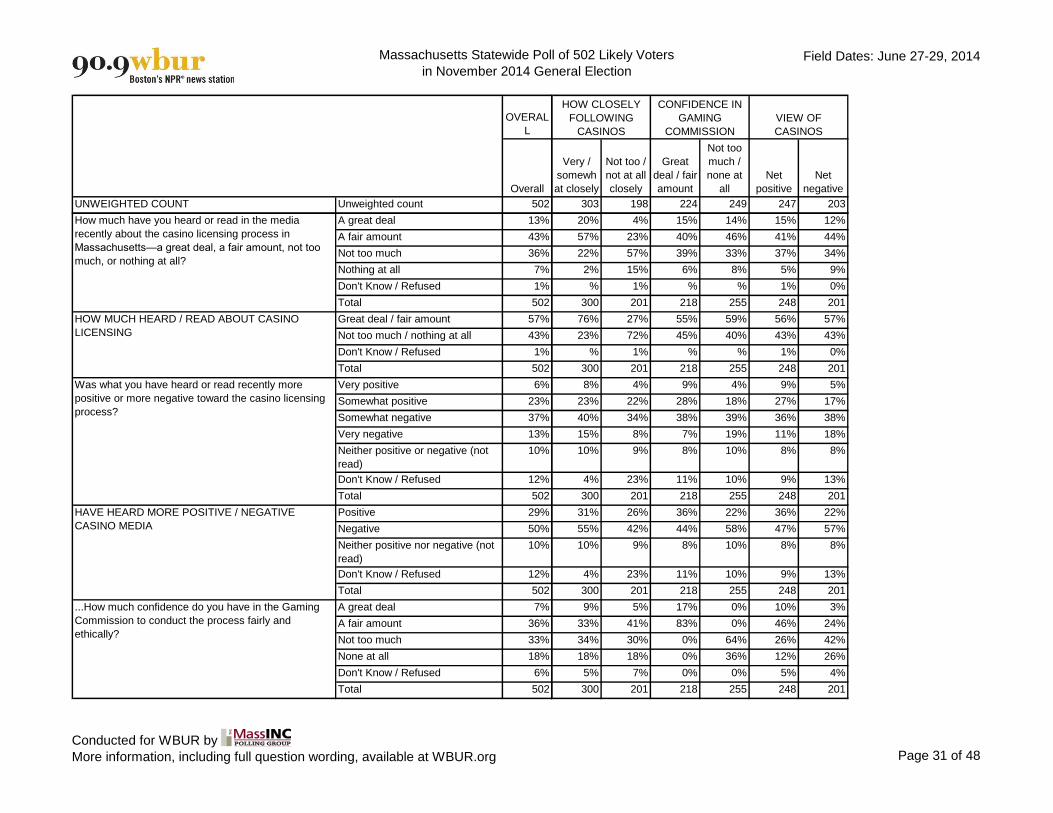
20% 20% 21% 21% 23% 18%
80% 80% 79% 79% 77% 82%
300 201 218 255 248 201
27% 0% 18% 16% 18% 16%
73% 0% 40% 47% 46% 42%
0% 68% 30% 24% 25% 27%
0% 32% 12% 13% 11% 14%
0% 0% 0% % 0% 1%
300 201 218 255 248 201
100% 0% 58% 62% 64% 58%
0% 100% 42% 37% 36% 42%
0% 0% 0% % 0% 1%
300 201 218 255 248 201
60% 51% 69% 44% 93% 12%
37% 39% 26% 49% 6% 84%
4% 10% 4% 6% 2% 5%
300 201 218 255 248 201
23% 11% 23% 13% 32% 4%
24% 19% 11% 33% 3% 51%
52% 68% 66% 51% 65% 43%
2% 1% % 2% % 2%
300 201 218 255 248 201
Conducted for WBUR by
More information, including full question wording, available at WBUR.org Page 23 of 48

Massachusetts Statewide Poll of 502 Likely Voters
in November 2014 General ElectionField Dates: June 27-29, 2014
OVERAL
L
Overall
UNWEIGHTED COUNT Unweighted count 502
Selected 1+ independent
candidate in horserace questions
20%
Did not select any independent
candidates
80%
Total 502
Very closely 16%
Somewhat closely 44%
Not too closely 27%
Not at all 13%
Don't Know / Refused %
Total 502
Very / somewhat closely 60%
Not too / not at all closely 40%
Don't Know / Refused %
Total 502
Approve 56%
Disapprove 38%
Don't Know / Refused 6%
Total 502
More likely to vote for candidate 18%
Less likely to vote for candidate 22%
Would make no difference 58%
Don't Know / Refused 2%
Total 502
VOTES FOR AN INDEPENDENT IN ANY MATCHUP
... How closely, if at all, have you been following news
about the process of choosing which casino proposals
will be licensed in Massachusetts?
HOW CLOSELY FOLLOWING CASINO LICENSING
Current plans are for up to 3 casinos to be located in
Massachusetts, 1 in each of 3 separate regions of the
state. Do you approve or disapprove of locating
casinos in Massachusetts?
If a candidate for Governor supports locating casinos
in Massachusetts, would that make you more likely or
less likely to vote for that candidate, or would it make
no difference?
Western
/ Central
MA
Southeas
t MA
Outer
Boston
Suburbs
Boston /
Inner
Suburbs
127 62 165 129
REGIONS
17% 21% 24% 15%
83% 79% 76% 85%
128 58 184 113
22% 12% 14% 16%
41% 53% 46% 41%
26% 21% 28% 28%
11% 14% 11% 14%
0% 0% 0% 1%
128 58 184 113
63% 65% 61% 57%
37% 35% 39% 42%
0% 0% 0% 1%
128 58 184 113
59% 62% 57% 51%
38% 29% 35% 45%
3% 9% 8% 5%
128 58 184 113
16% 23% 19% 17%
18% 16% 24% 25%
65% 58% 56% 54%
1% 2% 1% 4%
128 58 184 113
Conducted for WBUR by
More information, including full question wording, available at WBUR.org Page 24 of 48
Massachusetts Statewide Poll of 502 Likely Voters
in November 2014 General ElectionField Dates: June 27-29, 2014
OVERAL
L
Overall
Democra
t
Republic
an
Unenroll
ed /
Other Male Female
UNWEIGHTED COUNT Unweighted count 502 190 61 251 238 264
PARTY REGISTRATION GENDER
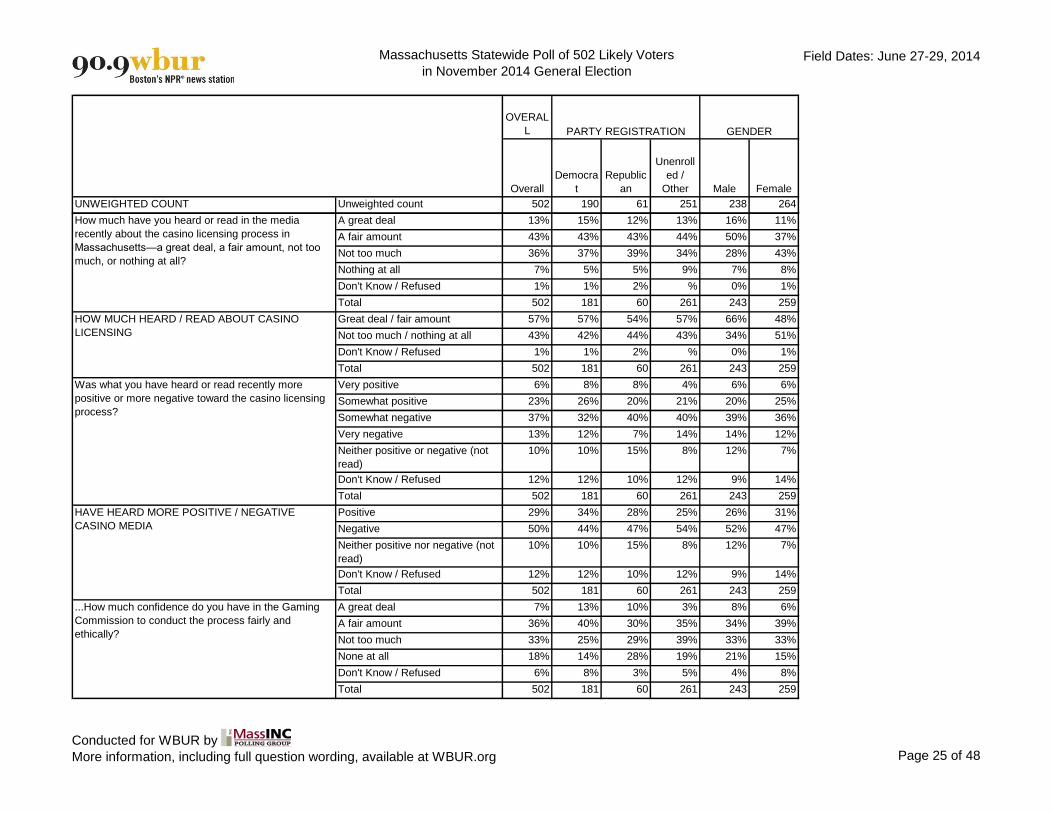
A great deal 13% 15% 12% 13% 16% 11%
A fair amount 43% 43% 43% 44% 50% 37%
Not too much 36% 37% 39% 34% 28% 43%
Nothing at all 7% 5% 5% 9% 7% 8%
Don't Know / Refused 1% 1% 2% % 0% 1%
Total 502 181 60 261 243 259
Great deal / fair amount 57% 57% 54% 57% 66% 48%
Not too much / nothing at all 43% 42% 44% 43% 34% 51%
Don't Know / Refused 1% 1% 2% % 0% 1%
Total 502 181 60 261 243 259
Very positive 6% 8% 8% 4% 6% 6%
Somewhat positive 23% 26% 20% 21% 20% 25%
Somewhat negative 37% 32% 40% 40% 39% 36%
Very negative 13% 12% 7% 14% 14% 12%
Neither positive or negative (not
read)
10% 10% 15% 8% 12% 7%
Don't Know / Refused 12% 12% 10% 12% 9% 14%
Total 502 181 60 261 243 259
Positive 29% 34% 28% 25% 26% 31%
Negative 50% 44% 47% 54% 52% 47%
Neither positive nor negative (not
read)
10% 10% 15% 8% 12% 7%
Don't Know / Refused 12% 12% 10% 12% 9% 14%
Total 502 181 60 261 243 259
A great deal 7% 13% 10% 3% 8% 6%
A fair amount 36% 40% 30% 35% 34% 39%
Not too much 33% 25% 29% 39% 33% 33%
None at all 18% 14% 28% 19% 21% 15%
Don't Know / Refused 6% 8% 3% 5% 4% 8%
Total 502 181 60 261 243 259
How much have you heard or read in the media
recently about the casino licensing process in
Massachusetts—a great deal, a fair amount, not too
much, or nothing at all?
HOW MUCH HEARD / READ ABOUT CASINO
LICENSING
Was what you have heard or read recently more
positive or more negative toward the casino licensing
process?
HAVE HEARD MORE POSITIVE / NEGATIVE
CASINO MEDIA
...How much confidence do you have in the Gaming
Commission to conduct the process fairly and
ethically?
Conducted for WBUR by
More information, including full question wording, available at WBUR.org Page 25 of 48

Massachusetts Statewide Poll of 502 Likely Voters
in November 2014 General ElectionField Dates: June 27-29, 2014
OVERAL
L
Overall
UNWEIGHTED COUNT Unweighted count 502
A great deal 13%
A fair amount 43%
Not too much 36%
Nothing at all 7%
Don't Know / Refused 1%
Total 502
Great deal / fair amount 57%
Not too much / nothing at all 43%
Don't Know / Refused 1%
Total 502
Very positive 6%
Somewhat positive 23%
Somewhat negative 37%
Very negative 13%
Neither positive or negative (not
read)
10%
Don't Know / Refused 12%
Total 502
Positive 29%
Negative 50%
Neither positive nor negative (not
read)
10%
Don't Know / Refused 12%
Total 502
A great deal 7%
A fair amount 36%
Not too much 33%
None at all 18%
Don't Know / Refused 6%
Total 502
How much have you heard or read in the media
recently about the casino licensing process in
Massachusetts—a great deal, a fair amount, not too
much, or nothing at all?
HOW MUCH HEARD / READ ABOUT CASINO
LICENSING
Was what you have heard or read recently more
positive or more negative toward the casino licensing
process?
HAVE HEARD MORE POSITIVE / NEGATIVE
CASINO MEDIA
...How much confidence do you have in the Gaming
Commission to conduct the process fairly and
ethically?
18 to 29 30 to 44 45 to 59 60+
Men age
18-49
Women
age 18-
49
Men age
50+
Women
age 50+
63 122 169 148 113 112 125 152
AGE CATEGORIES AGE AND GENDER
10% 10% 15% 16% 11% 11% 20% 11%
32% 39% 46% 49% 47% 30% 52% 42%
42% 42% 33% 30% 33% 46% 23% 41%
16% 9% 5% 4% 9% 11% 5% 5%
0% 1% 1% 1% 0% 2% 0% 1%
60 131 166 146 109 120 134 139
42% 48% 61% 65% 58% 41% 72% 54%
58% 51% 38% 34% 42% 57% 28% 46%
0% 1% 1% 1% 0% 2% 0% 1%
60 131 166 146 109 120 134 139
7% 5% 6% 8% 4% 7% 8% 6%
26% 15% 29% 21% 19% 21% 20% 29%
40% 40% 33% 38% 45% 34% 34% 37%
4% 13% 12% 16% 12% 11% 15% 12%
4% 11% 11% 9% 8% 9% 15% 6%
19% 16% 9% 8% 13% 18% 7% 10%
60 131 166 146 109 120 134 139
33% 20% 34% 29% 23% 28% 29% 35%
44% 53% 45% 54% 56% 45% 49% 49%
4% 11% 11% 9% 8% 9% 15% 6%
19% 16% 9% 8% 13% 18% 7% 10%
60 131 166 146 109 120 134 139
7% 6% 6% 9% 6% 8% 10% 5%
44% 38% 39% 29% 35% 44% 33% 34%
32% 35% 29% 35% 38% 29% 28% 35%
12% 16% 20% 20% 19% 12% 23% 18%
6% 4% 6% 7% 3% 7% 5% 8%
60 131 166 146 109 120 134 139
Conducted for WBUR by
More information, including full question wording, available at WBUR.org Page 26 of 48

Massachusetts Statewide Poll of 502 Likely Voters
in November 2014 General ElectionField Dates: June 27-29, 2014
OVERAL
L
Overall
UNWEIGHTED COUNT Unweighted count 502
A great deal 13%
A fair amount 43%
Not too much 36%
Nothing at all 7%
Don't Know / Refused 1%
Total 502
Great deal / fair amount 57%
Not too much / nothing at all 43%
Don't Know / Refused 1%
Total 502
Very positive 6%
Somewhat positive 23%
Somewhat negative 37%
Very negative 13%
Neither positive or negative (not
read)
10%
Don't Know / Refused 12%
Total 502
Positive 29%
Negative 50%
Neither positive nor negative (not
read)
10%
Don't Know / Refused 12%
Total 502
A great deal 7%
A fair amount 36%
Not too much 33%
None at all 18%
Don't Know / Refused 6%
Total 502
How much have you heard or read in the media
recently about the casino licensing process in
Massachusetts—a great deal, a fair amount, not too
much, or nothing at all?
HOW MUCH HEARD / READ ABOUT CASINO
LICENSING
Was what you have heard or read recently more
positive or more negative toward the casino licensing
process?
HAVE HEARD MORE POSITIVE / NEGATIVE
CASINO MEDIA
...How much confidence do you have in the Gaming
Commission to conduct the process fairly and
ethically?
White /
Caucasia
n All others
High
School or
less
Some
college,
no
degree
College
graduate
(BA/BS)
Advance
d degree
430 62 102 137 172 88
EDUCATION LEVELRACE
13% 16% 17% 16% 13% 8%
44% 35% 28% 45% 45% 51%
36% 37% 49% 30% 34% 34%
7% 8% 6% 9% 5% 8%
% 4% 0% 0% 2% 0%
429 63 90 144 159 105
57% 52% 45% 61% 58% 58%
43% 45% 55% 39% 40% 42%
% 4% 0% 0% 2% 0%
429 63 90 144 159 105
6% 13% 12% 4% 6% 4%
22% 25% 17% 26% 24% 21%
38% 29% 32% 38% 38% 40%
14% 6% 18% 8% 12% 16%
10% 10% 10% 13% 8% 7%
11% 17% 11% 11% 12% 12%
429 63 90 144 159 105
27% 38% 28% 30% 30% 25%
52% 35% 51% 46% 50% 56%
10% 10% 10% 13% 8% 7%
11% 17% 11% 11% 12% 12%
429 63 90 144 159 105
6% 15% 13% 3% 9% 6%
37% 37% 38% 36% 37% 34%
33% 30% 28% 36% 31% 35%
18% 13% 18% 18% 18% 19%
6% 5% 4% 8% 5% 6%
429 63 90 144 159 105
Conducted for WBUR by
More information, including full question wording, available at WBUR.org Page 27 of 48

Massachusetts Statewide Poll of 502 Likely Voters
in November 2014 General ElectionField Dates: June 27-29, 2014
OVERAL
L
Overall
UNWEIGHTED COUNT Unweighted count 502
A great deal 13%
A fair amount 43%
Not too much 36%
Nothing at all 7%
Don't Know / Refused 1%
Total 502
Great deal / fair amount 57%
Not too much / nothing at all 43%
Don't Know / Refused 1%
Total 502
Very positive 6%
Somewhat positive 23%
Somewhat negative 37%
Very negative 13%
Neither positive or negative (not
read)
10%
Don't Know / Refused 12%
Total 502
Positive 29%
Negative 50%
Neither positive nor negative (not
read)
10%
Don't Know / Refused 12%
Total 502
A great deal 7%
A fair amount 36%
Not too much 33%
None at all 18%
Don't Know / Refused 6%
Total 502
How much have you heard or read in the media
recently about the casino licensing process in
Massachusetts—a great deal, a fair amount, not too
much, or nothing at all?
HOW MUCH HEARD / READ ABOUT CASINO
LICENSING
Was what you have heard or read recently more
positive or more negative toward the casino licensing
process?
HAVE HEARD MORE POSITIVE / NEGATIVE
CASINO MEDIA
...How much confidence do you have in the Gaming
Commission to conduct the process fairly and
ethically?
Less
than
$25k $25-$75k
$75-
$150k
More
than
$150k
Charlie
Baker
Martha
Coakley
Independ
ent
candidat
e
Don't
know /
other
40 130 157 75 139 210 30 112
INCOME RANGES
GOV HORSERACE - BAKER V
COAKLEY
13% 18% 15% 11% 16% 13% 14% 10%
23% 35% 53% 38% 45% 41% 44% 43%
52% 37% 27% 45% 33% 38% 37% 37%
9% 9% 6% 6% 5% 7% 5% 11%
3% 0% 0% 0% 1% 1% 0% 0%
37 126 161 79 142 207 29 113
35% 53% 67% 49% 62% 55% 57% 52%
61% 47% 33% 51% 38% 44% 43% 48%
3% 0% 0% 0% 1% 1% 0% 0%
37 126 161 79 142 207 29 113
6% 7% 6% 5% 5% 8% 6% 4%
34% 22% 24% 20% 20% 20% 41% 27%
24% 31% 38% 43% 42% 35% 24% 37%
11% 16% 11% 12% 15% 13% 20% 7%
8% 9% 12% 7% 10% 9% 4% 10%
17% 15% 9% 13% 7% 14% 5% 15%
37 126 161 79 142 207 29 113
40% 29% 30% 25% 25% 29% 47% 31%
35% 47% 49% 55% 58% 48% 44% 43%
8% 9% 12% 7% 10% 9% 4% 10%
17% 15% 9% 13% 7% 14% 5% 15%
37 126 161 79 142 207 29 113
7% 6% 8% 7% 5% 9% 3% 8%
26% 43% 35% 37% 26% 46% 41% 33%
33% 30% 31% 37% 41% 27% 24% 35%
23% 13% 20% 16% 25% 12% 28% 14%
12% 7% 6% 3% 3% 6% 4% 10%
37 126 161 79 142 207 29 113
Conducted for WBUR by
More information, including full question wording, available at WBUR.org Page 28 of 48

Massachusetts Statewide Poll of 502 Likely Voters
in November 2014 General ElectionField Dates: June 27-29, 2014
OVERAL
L
Overall
UNWEIGHTED COUNT Unweighted count 502
A great deal 13%
A fair amount 43%
Not too much 36%
Nothing at all 7%
Don't Know / Refused 1%
Total 502
Great deal / fair amount 57%
Not too much / nothing at all 43%
Don't Know / Refused 1%
Total 502
Very positive 6%
Somewhat positive 23%
Somewhat negative 37%
Very negative 13%
Neither positive or negative (not
read)
10%
Don't Know / Refused 12%
Total 502
Positive 29%
Negative 50%
Neither positive nor negative (not
read)
10%
Don't Know / Refused 12%
Total 502
A great deal 7%
A fair amount 36%
Not too much 33%
None at all 18%
Don't Know / Refused 6%
Total 502
How much have you heard or read in the media
recently about the casino licensing process in
Massachusetts—a great deal, a fair amount, not too
much, or nothing at all?
HOW MUCH HEARD / READ ABOUT CASINO
LICENSING
Was what you have heard or read recently more
positive or more negative toward the casino licensing
process?
HAVE HEARD MORE POSITIVE / NEGATIVE
CASINO MEDIA
...How much confidence do you have in the Gaming
Commission to conduct the process fairly and
ethically?
Charlie
Baker
Steve
Grossma
n
Independ
ent
candidat
e
Don't
know /
other
150 145 45 150
GOV HORSERACE - BAKER V
GROSSMAN
15% 16% 13% 9%
44% 44% 40% 41%
32% 35% 39% 40%
6% 5% 8% 10%
2% 0% 0% 0%
153 142 45 151
60% 59% 53% 50%
38% 41% 47% 50%
2% 0% 0% 0%
153 142 45 151
5% 8% 9% 5%
18% 23% 33% 24%
42% 34% 31% 36%
15% 15% 14% 7%
10% 8% 5% 12%
10% 11% 8% 16%
153 142 45 151
23% 31% 42% 29%
57% 49% 45% 43%
10% 8% 5% 12%
10% 11% 8% 16%
153 142 45 151
5% 11% 0% 8%
27% 38% 49% 39%
42% 29% 26% 31%
23% 15% 25% 13%
3% 8% 0% 9%
153 142 45 151
Conducted for WBUR by
More information, including full question wording, available at WBUR.org Page 29 of 48

Massachusetts Statewide Poll of 502 Likely Voters
in November 2014 General ElectionField Dates: June 27-29, 2014
OVERAL
L
Overall
UNWEIGHTED COUNT Unweighted count 502
A great deal 13%
A fair amount 43%
Not too much 36%
Nothing at all 7%
Don't Know / Refused 1%
Total 502
Great deal / fair amount 57%
Not too much / nothing at all 43%
Don't Know / Refused 1%
Total 502
Very positive 6%
Somewhat positive 23%
Somewhat negative 37%
Very negative 13%
Neither positive or negative (not
read)
10%
Don't Know / Refused 12%
Total 502
Positive 29%
Negative 50%
Neither positive nor negative (not
read)
10%
Don't Know / Refused 12%
Total 502
A great deal 7%
A fair amount 36%
Not too much 33%
None at all 18%
Don't Know / Refused 6%
Total 502
How much have you heard or read in the media
recently about the casino licensing process in
Massachusetts—a great deal, a fair amount, not too
much, or nothing at all?
HOW MUCH HEARD / READ ABOUT CASINO
LICENSING
Was what you have heard or read recently more
positive or more negative toward the casino licensing
process?
HAVE HEARD MORE POSITIVE / NEGATIVE
CASINO MEDIA
...How much confidence do you have in the Gaming
Commission to conduct the process fairly and
ethically?
Charlie
Baker
Don
Berwick
Independ
ent
candidat
e
Don't
know /
other
VOTES
FOR 1+
INDY
VOTES
FOR NO
INDY Approve
Disappro
ve
154 95 45 189 101 401 280 191
APPROVE OF
CASINOS?
GOV HORSERACE - BAKER V
BERWICK
VOTES FOR AN
INDEPENDENT IN
ANY MATCHUP
17% 13% 17% 10% 19% 12% 15% 12%
44% 46% 35% 43% 34% 45% 44% 45%
33% 33% 37% 39% 37% 35% 35% 34%
4% 7% 12% 8% 10% 6% 6% 8%
1% 1% 0% 0% 0% 1% 1% 0%
155 94 45 188 101 401 281 190
62% 58% 52% 53% 53% 57% 59% 58%
37% 40% 48% 47% 47% 42% 40% 42%
1% 1% 0% 0% 0% 1% 1% 0%
155 94 45 188 101 401 281 190
7% 6% 13% 5% 12% 5% 8% 4%
19% 22% 25% 25% 28% 21% 27% 17%
44% 37% 28% 35% 31% 39% 37% 40%
14% 15% 17% 9% 13% 12% 10% 18%
8% 8% 5% 11% 5% 11% 9% 8%
8% 12% 12% 14% 10% 12% 9% 12%
155 94 45 188 101 401 281 190
25% 28% 38% 30% 41% 26% 35% 21%
58% 52% 46% 44% 44% 51% 47% 58%
8% 8% 5% 11% 5% 11% 9% 8%
8% 12% 12% 14% 10% 12% 9% 12%
155 94 45 188 101 401 281 190
6% 10% 5% 7% 4% 8% 10% 4%
29% 40% 48% 38% 40% 35% 44% 26%
39% 30% 28% 32% 33% 33% 26% 41%
24% 13% 17% 13% 21% 17% 14% 25%
2% 7% 2% 10% 1% 7% 6% 4%
155 94 45 188 101 401 281 190
Conducted for WBUR by
More information, including full question wording, available at WBUR.org Page 30 of 48
Massachusetts Statewide Poll of 502 Likely Voters
in November 2014 General ElectionField Dates: June 27-29, 2014
OVERAL
L
Overall
UNWEIGHTED COUNT Unweighted count 502
A great deal 13%
A fair amount 43%
Not too much 36%
Nothing at all 7%
Don't Know / Refused 1%
Total 502
Great deal / fair amount 57%
Not too much / nothing at all 43%
Don't Know / Refused 1%
Total 502
Very positive 6%
Somewhat positive 23%
Somewhat negative 37%
Very negative 13%
Neither positive or negative (not
read)
10%
Don't Know / Refused 12%
Total 502
Positive 29%
Negative 50%
Neither positive nor negative (not
read)
10%
Don't Know / Refused 12%
Total 502
A great deal 7%
A fair amount 36%
Not too much 33%
None at all 18%
Don't Know / Refused 6%
Total 502
How much have you heard or read in the media
recently about the casino licensing process in
Massachusetts—a great deal, a fair amount, not too
much, or nothing at all?
HOW MUCH HEARD / READ ABOUT CASINO
LICENSING
Was what you have heard or read recently more
positive or more negative toward the casino licensing
process?
HAVE HEARD MORE POSITIVE / NEGATIVE
CASINO MEDIA
...How much confidence do you have in the Gaming
Commission to conduct the process fairly and
ethically?
Very /
somewh
at closely
Not too /
not at all
closely
Great
deal / fair
amount
Not too
much /
none at
all
Net
positive
Net
negative
303 198 224 249 247 203
HOW CLOSELY
FOLLOWING
CASINOS
CONFIDENCE IN
GAMING
COMMISSION
VIEW OF
CASINOS
20% 4% 15% 14% 15% 12%
57% 23% 40% 46% 41% 44%
22% 57% 39% 33% 37% 34%
2% 15% 6% 8% 5% 9%
% 1% % % 1% 0%
300 201 218 255 248 201
76% 27% 55% 59% 56% 57%
23% 72% 45% 40% 43% 43%
% 1% % % 1% 0%
300 201 218 255 248 201
8% 4% 9% 4% 9% 5%
23% 22% 28% 18% 27% 17%
40% 34% 38% 39% 36% 38%
15% 8% 7% 19% 11% 18%
10% 9% 8% 10% 8% 8%
4% 23% 11% 10% 9% 13%
300 201 218 255 248 201
31% 26% 36% 22% 36% 22%
55% 42% 44% 58% 47% 57%
10% 9% 8% 10% 8% 8%
4% 23% 11% 10% 9% 13%
300 201 218 255 248 201
9% 5% 17% 0% 10% 3%
33% 41% 83% 0% 46% 24%
34% 30% 0% 64% 26% 42%
18% 18% 0% 36% 12% 26%
5% 7% 0% 0% 5% 4%
300 201 218 255 248 201
Conducted for WBUR by
More information, including full question wording, available at WBUR.org Page 31 of 48

Massachusetts Statewide Poll of 502 Likely Voters
in November 2014 General ElectionField Dates: June 27-29, 2014
OVERAL
L
Overall
UNWEIGHTED COUNT Unweighted count 502
A great deal 13%
A fair amount 43%
Not too much 36%
Nothing at all 7%
Don't Know / Refused 1%
Total 502
Great deal / fair amount 57%
Not too much / nothing at all 43%
Don't Know / Refused 1%
Total 502
Very positive 6%
Somewhat positive 23%
Somewhat negative 37%
Very negative 13%
Neither positive or negative (not
read)
10%
Don't Know / Refused 12%
Total 502
Positive 29%
Negative 50%
Neither positive nor negative (not
read)
10%
Don't Know / Refused 12%
Total 502
A great deal 7%
A fair amount 36%
Not too much 33%
None at all 18%
Don't Know / Refused 6%
Total 502
How much have you heard or read in the media
recently about the casino licensing process in
Massachusetts—a great deal, a fair amount, not too
much, or nothing at all?
HOW MUCH HEARD / READ ABOUT CASINO
LICENSING
Was what you have heard or read recently more
positive or more negative toward the casino licensing
process?
HAVE HEARD MORE POSITIVE / NEGATIVE
CASINO MEDIA
...How much confidence do you have in the Gaming
Commission to conduct the process fairly and
ethically?
Western
/ Central
MA
Southeas
t MA
Outer
Boston
Suburbs
Boston /
Inner
Suburbs
127 62 165 129
REGIONS
18% 13% 9% 18%
38% 49% 46% 42%
39% 30% 37% 30%
4% 5% 8% 10%
1% 2% 0% 1%
128 58 184 113
56% 63% 55% 60%
43% 36% 45% 39%
1% 2% 0% 1%
128 58 184 113
7% 8% 6% 6%
25% 20% 22% 24%
37% 47% 38% 30%
14% 10% 10% 16%
8% 6% 11% 10%
10% 8% 12% 14%
128 58 184 113
32% 28% 28% 30%
51% 57% 49% 47%
8% 6% 11% 10%
10% 8% 12% 14%
128 58 184 113
10% 5% 6% 6%
41% 48% 30% 37%
24% 31% 40% 32%
20% 11% 19% 17%
4% 6% 4% 9%
128 58 184 113
Conducted for WBUR by
More information, including full question wording, available at WBUR.org Page 32 of 48

Massachusetts Statewide Poll of 502 Likely Voters
in November 2014 General ElectionField Dates: June 27-29, 2014
OVERAL
L
Overall
Democra
t
Republic
an
Unenroll
ed /
Other Male Female
UNWEIGHTED COUNT Unweighted count 502 190 61 251 238 264
PARTY REGISTRATION GENDER
Great deal / fair amount 43% 53% 40% 38% 42% 45%
Not too much / none at all 51% 39% 57% 58% 54% 48%
Don't Know / Refused 6% 8% 3% 5% 4% 8%
Total 502 181 60 261 243 259
Agree 41% 44% 43% 39% 45% 38%
Disagree 33% 31% 32% 34% 36% 30%
Both / neither / depends (not
read)
5% 6% 5% 5% 5% 6%
Don't Know / Refused 21% 20% 20% 21% 15% 26%
Total 502 181 60 261 243 259
Agree 46% 53% 49% 41% 51% 42%
Disagree 26% 21% 23% 31% 27% 25%
Both / neither / depends (not
read)
5% 6% 9% 5% 5% 6%
Don't Know / Refused 22% 21% 19% 23% 17% 27%
Total 502 181 60 261 243 259
Net positive, providing thousands
of new, high paying jobs, and
major economic benefits
49% 52% 55% 46% 54% 45%
Net negative, driving out local
businesses, and bringing spikes
in crime, gambling addiction, and
other problems
40% 36% 37% 44% 37% 43%
Both / neither / depends (not
read)
6% 6% 6% 6% 6% 6%
Don't Know / Refused 4% 6% 2% 4% 3% 6%
Total 502 181 60 261 243 259
… How much confidence do you have in the Gaming
Commission to conduct the process fairly and
ethically?
Would you agree or disagree that most of the
business people involved in the proposed casino
developments have conducted themselves honestly
and ethically?
Would you agree or disagree that most of the public
officials from towns where casinos will be located have
conducted themselves honestly and ethically?
... Which is closer to your own point of view?
Conducted for WBUR by
More information, including full question wording, available at WBUR.org Page 33 of 48
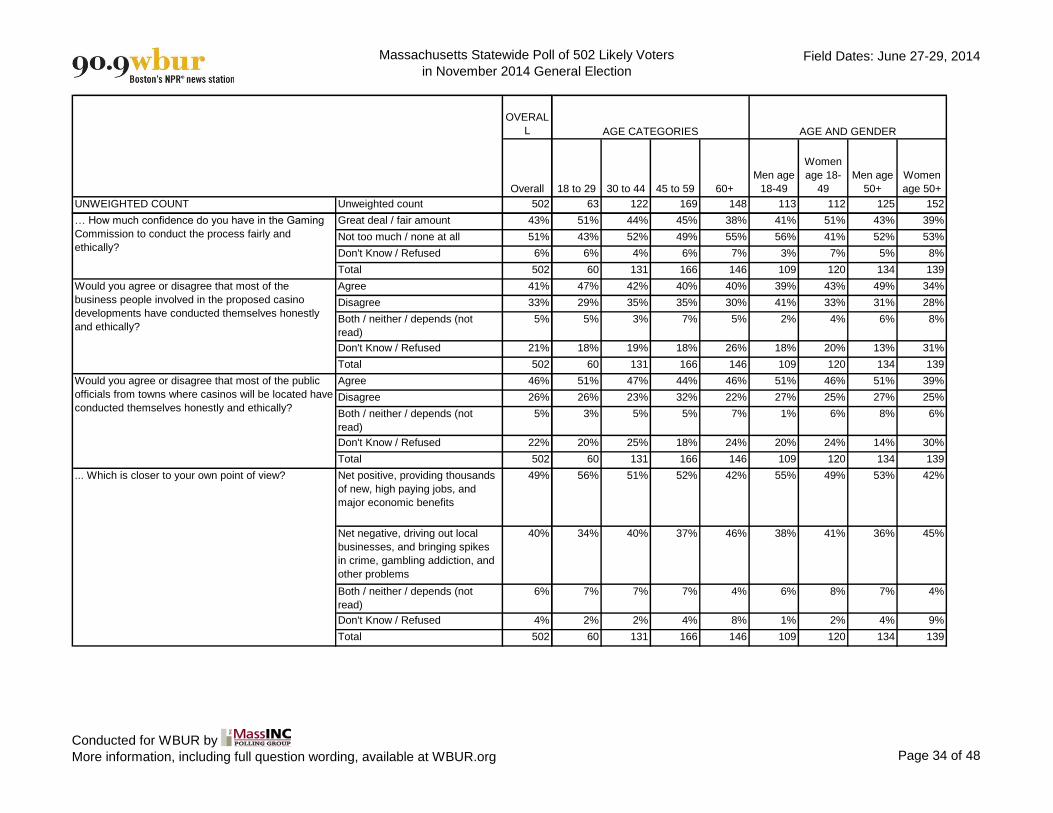
Massachusetts Statewide Poll of 502 Likely Voters
in November 2014 General ElectionField Dates: June 27-29, 2014
OVERAL
L
Overall
UNWEIGHTED COUNT Unweighted count 502
Great deal / fair amount 43%
Not too much / none at all 51%
Don't Know / Refused 6%
Total 502
Agree 41%
Disagree 33%
Both / neither / depends (not
read)
5%
Don't Know / Refused 21%
Total 502
Agree 46%
Disagree 26%
Both / neither / depends (not
read)
5%
Don't Know / Refused 22%
Total 502
Net positive, providing thousands
of new, high paying jobs, and
major economic benefits
49%
Net negative, driving out local
businesses, and bringing spikes
in crime, gambling addiction, and
other problems
40%
Both / neither / depends (not
read)
6%
Don't Know / Refused 4%
Total 502
… How much confidence do you have in the Gaming
Commission to conduct the process fairly and
ethically?
Would you agree or disagree that most of the
business people involved in the proposed casino
developments have conducted themselves honestly
and ethically?
Would you agree or disagree that most of the public
officials from towns where casinos will be located have
conducted themselves honestly and ethically?
... Which is closer to your own point of view?
18 to 29 30 to 44 45 to 59 60+
Men age
18-49
Women
age 18-
49
Men age
50+
Women
age 50+
63 122 169 148 113 112 125 152
AGE CATEGORIES AGE AND GENDER
51% 44% 45% 38% 41% 51% 43% 39%
43% 52% 49% 55% 56% 41% 52% 53%
6% 4% 6% 7% 3% 7% 5% 8%
60 131 166 146 109 120 134 139
47% 42% 40% 40% 39% 43% 49% 34%
29% 35% 35% 30% 41% 33% 31% 28%
5% 3% 7% 5% 2% 4% 6% 8%
18% 19% 18% 26% 18% 20% 13% 31%
60 131 166 146 109 120 134 139
51% 47% 44% 46% 51% 46% 51% 39%
26% 23% 32% 22% 27% 25% 27% 25%
3% 5% 5% 7% 1% 6% 8% 6%
20% 25% 18% 24% 20% 24% 14% 30%
60 131 166 146 109 120 134 139
56% 51% 52% 42% 55% 49% 53% 42%
34% 40% 37% 46% 38% 41% 36% 45%
7% 7% 7% 4% 6% 8% 7% 4%
2% 2% 4% 8% 1% 2% 4% 9%
60 131 166 146 109 120 134 139
Conducted for WBUR by
More information, including full question wording, available at WBUR.org Page 34 of 48
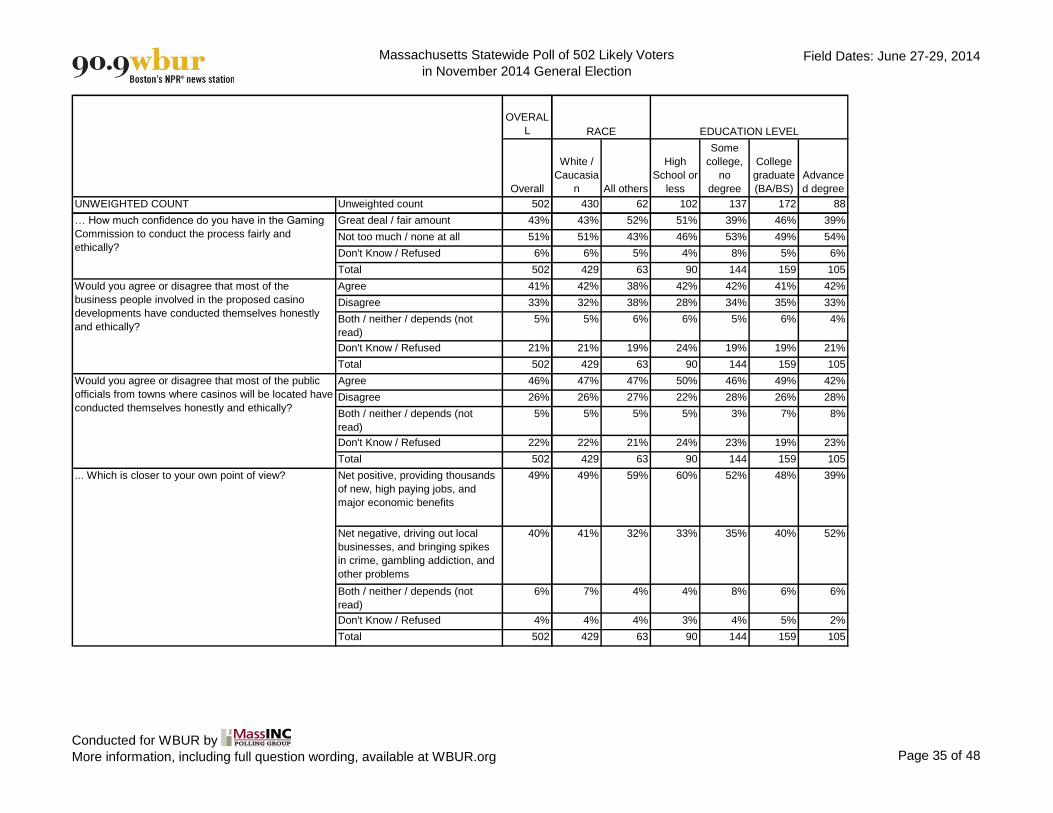
Massachusetts Statewide Poll of 502 Likely Voters
in November 2014 General ElectionField Dates: June 27-29, 2014
OVERAL
L
Overall
UNWEIGHTED COUNT Unweighted count 502
Great deal / fair amount 43%
Not too much / none at all 51%
Don't Know / Refused 6%
Total 502
Agree 41%
Disagree 33%
Both / neither / depends (not
read)
5%
Don't Know / Refused 21%
Total 502
Agree 46%
Disagree 26%
Both / neither / depends (not
read)
5%
Don't Know / Refused 22%
Total 502
Net positive, providing thousands
of new, high paying jobs, and
major economic benefits
49%
Net negative, driving out local
businesses, and bringing spikes
in crime, gambling addiction, and
other problems
40%
Both / neither / depends (not
read)
6%
Don't Know / Refused 4%
Total 502
… How much confidence do you have in the Gaming
Commission to conduct the process fairly and
ethically?
Would you agree or disagree that most of the
business people involved in the proposed casino
developments have conducted themselves honestly
and ethically?
Would you agree or disagree that most of the public
officials from towns where casinos will be located have
conducted themselves honestly and ethically?
... Which is closer to your own point of view?
White /
Caucasia
n All others
High
School or
less
Some
college,
no
degree
College
graduate
(BA/BS)
Advance
d degree
430 62 102 137 172 88
EDUCATION LEVELRACE
43% 52% 51% 39% 46% 39%
51% 43% 46% 53% 49% 54%
6% 5% 4% 8% 5% 6%
429 63 90 144 159 105
42% 38% 42% 42% 41% 42%
32% 38% 28% 34% 35% 33%
5% 6% 6% 5% 6% 4%
21% 19% 24% 19% 19% 21%
429 63 90 144 159 105
47% 47% 50% 46% 49% 42%
26% 27% 22% 28% 26% 28%
5% 5% 5% 3% 7% 8%
22% 21% 24% 23% 19% 23%
429 63 90 144 159 105
49% 59% 60% 52% 48% 39%
41% 32% 33% 35% 40% 52%
7% 4% 4% 8% 6% 6%
4% 4% 3% 4% 5% 2%
429 63 90 144 159 105
Conducted for WBUR by
More information, including full question wording, available at WBUR.org Page 35 of 48

Massachusetts Statewide Poll of 502 Likely Voters
in November 2014 General ElectionField Dates: June 27-29, 2014
OVERAL
L
Overall
UNWEIGHTED COUNT Unweighted count 502
Great deal / fair amount 43%
Not too much / none at all 51%
Don't Know / Refused 6%
Total 502
Agree 41%
Disagree 33%
Both / neither / depends (not
read)
5%
Don't Know / Refused 21%
Total 502
Agree 46%
Disagree 26%
Both / neither / depends (not
read)
5%
Don't Know / Refused 22%
Total 502
Net positive, providing thousands
of new, high paying jobs, and
major economic benefits
49%
Net negative, driving out local
businesses, and bringing spikes
in crime, gambling addiction, and
other problems
40%
Both / neither / depends (not
read)
6%
Don't Know / Refused 4%
Total 502
… How much confidence do you have in the Gaming
Commission to conduct the process fairly and
ethically?
Would you agree or disagree that most of the
business people involved in the proposed casino
developments have conducted themselves honestly
and ethically?
Would you agree or disagree that most of the public
officials from towns where casinos will be located have
conducted themselves honestly and ethically?
... Which is closer to your own point of view?
Less
than
$25k $25-$75k
$75-
$150k
More
than
$150k
Charlie
Baker
Martha
Coakley
Independ
ent
candidat
e
Don't
know /
other
40 130 157 75 139 210 30 112
INCOME RANGES
GOV HORSERACE - BAKER V
COAKLEY
32% 49% 43% 44% 31% 55% 44% 41%
55% 44% 51% 53% 67% 39% 52% 49%
12% 7% 6% 3% 3% 6% 4% 10%
37 126 161 79 142 207 29 113
40% 41% 42% 49% 39% 48% 38% 33%
41% 28% 33% 32% 39% 28% 43% 30%
4% 6% 7% 5% 3% 7% 7% 4%
15% 24% 18% 15% 19% 17% 11% 32%
37 126 161 79 142 207 29 113
54% 50% 45% 52% 44% 53% 40% 41%
22% 25% 30% 24% 33% 22% 45% 19%
4% 4% 4% 7% 5% 5% 2% 7%
20% 21% 21% 17% 18% 21% 12% 33%
37 126 161 79 142 207 29 113
37% 55% 53% 47% 48% 51% 66% 47%
48% 37% 35% 42% 44% 40% 26% 36%
8% 5% 7% 9% 5% 5% 8% 10%
7% 4% 4% 2% 3% 4% 0% 7%
37 126 161 79 142 207 29 113
Conducted for WBUR by
More information, including full question wording, available at WBUR.org Page 36 of 48

Massachusetts Statewide Poll of 502 Likely Voters
in November 2014 General ElectionField Dates: June 27-29, 2014
OVERAL
L
Overall
UNWEIGHTED COUNT Unweighted count 502
Great deal / fair amount 43%
Not too much / none at all 51%
Don't Know / Refused 6%
Total 502
Agree 41%
Disagree 33%
Both / neither / depends (not
read)
5%
Don't Know / Refused 21%
Total 502
Agree 46%
Disagree 26%
Both / neither / depends (not
read)
5%
Don't Know / Refused 22%
Total 502
Net positive, providing thousands
of new, high paying jobs, and
major economic benefits
49%
Net negative, driving out local
businesses, and bringing spikes
in crime, gambling addiction, and
other problems
40%
Both / neither / depends (not
read)
6%
Don't Know / Refused 4%
Total 502
… How much confidence do you have in the Gaming
Commission to conduct the process fairly and
ethically?
Would you agree or disagree that most of the
business people involved in the proposed casino
developments have conducted themselves honestly
and ethically?
Would you agree or disagree that most of the public
officials from towns where casinos will be located have
conducted themselves honestly and ethically?
... Which is closer to your own point of view?
Charlie
Baker
Steve
Grossma
n
Independ
ent
candidat
e
Don't
know /
other
150 145 45 150
GOV HORSERACE - BAKER V
GROSSMAN
32% 49% 49% 47%
65% 43% 51% 44%
3% 8% 0% 9%
153 142 45 151
41% 46% 39% 37%
38% 29% 46% 28%
2% 7% 5% 7%
18% 17% 10% 28%
153 142 45 151
43% 55% 44% 41%
36% 19% 43% 19%
3% 5% 0% 10%
18% 22% 13% 31%
153 142 45 151
49% 48% 61% 48%
43% 42% 32% 37%
5% 6% 5% 9%
3% 5% 2% 6%
153 142 45 151
Conducted for WBUR by
More information, including full question wording, available at WBUR.org Page 37 of 48
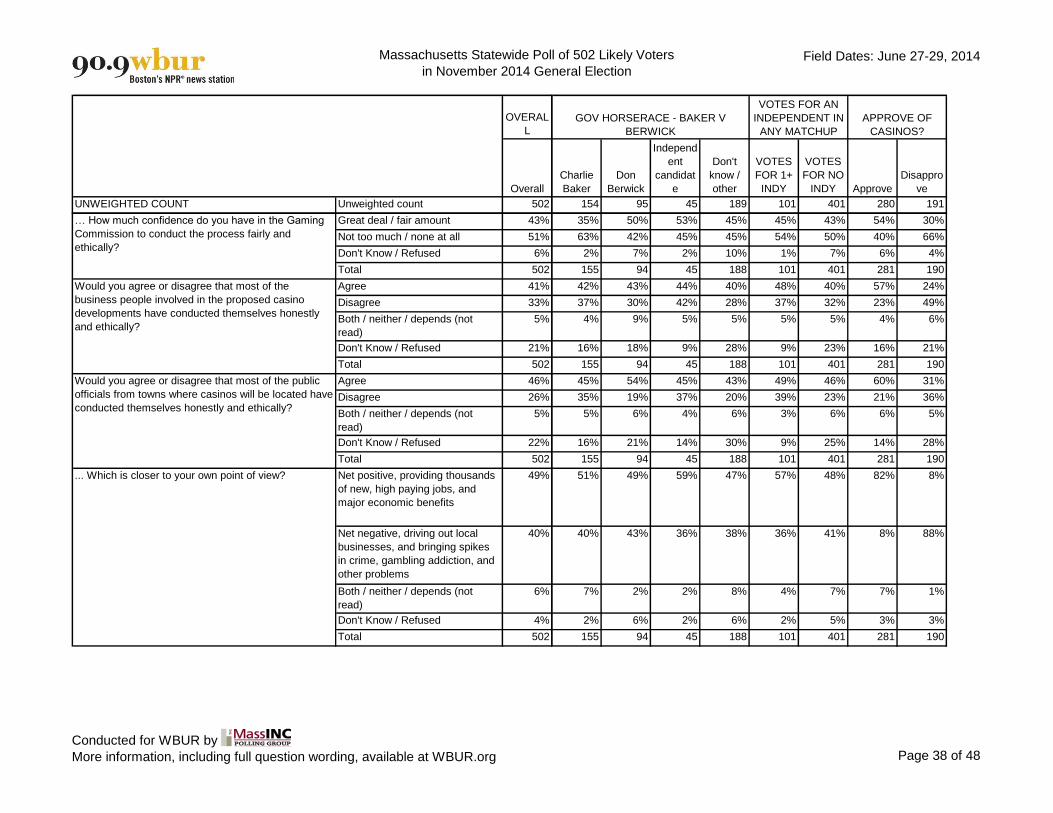
Massachusetts Statewide Poll of 502 Likely Voters
in November 2014 General ElectionField Dates: June 27-29, 2014
OVERAL
L
Overall
UNWEIGHTED COUNT Unweighted count 502
Great deal / fair amount 43%
Not too much / none at all 51%
Don't Know / Refused 6%
Total 502
Agree 41%
Disagree 33%
Both / neither / depends (not
read)
5%
Don't Know / Refused 21%
Total 502
Agree 46%
Disagree 26%
Both / neither / depends (not
read)
5%
Don't Know / Refused 22%
Total 502
Net positive, providing thousands
of new, high paying jobs, and
major economic benefits
49%
Net negative, driving out local
businesses, and bringing spikes
in crime, gambling addiction, and
other problems
40%
Both / neither / depends (not
read)
6%
Don't Know / Refused 4%
Total 502
… How much confidence do you have in the Gaming
Commission to conduct the process fairly and
ethically?
Would you agree or disagree that most of the
business people involved in the proposed casino
developments have conducted themselves honestly
and ethically?
Would you agree or disagree that most of the public
officials from towns where casinos will be located have
conducted themselves honestly and ethically?
... Which is closer to your own point of view?
Charlie
Baker
Don
Berwick
Independ
ent
candidat
e
Don't
know /
other
VOTES
FOR 1+
INDY
VOTES
FOR NO
INDY Approve
Disappro
ve
154 95 45 189 101 401 280 191
APPROVE OF
CASINOS?
GOV HORSERACE - BAKER V
BERWICK
VOTES FOR AN
INDEPENDENT IN
ANY MATCHUP
35% 50% 53% 45% 45% 43% 54% 30%
63% 42% 45% 45% 54% 50% 40% 66%
2% 7% 2% 10% 1% 7% 6% 4%
155 94 45 188 101 401 281 190
42% 43% 44% 40% 48% 40% 57% 24%
37% 30% 42% 28% 37% 32% 23% 49%
4% 9% 5% 5% 5% 5% 4% 6%
16% 18% 9% 28% 9% 23% 16% 21%
155 94 45 188 101 401 281 190
45% 54% 45% 43% 49% 46% 60% 31%
35% 19% 37% 20% 39% 23% 21% 36%
5% 6% 4% 6% 3% 6% 6% 5%
16% 21% 14% 30% 9% 25% 14% 28%
155 94 45 188 101 401 281 190
51% 49% 59% 47% 57% 48% 82% 8%
40% 43% 36% 38% 36% 41% 8% 88%
7% 2% 2% 8% 4% 7% 7% 1%
2% 6% 2% 6% 2% 5% 3% 3%
155 94 45 188 101 401 281 190
Conducted for WBUR by
More information, including full question wording, available at WBUR.org Page 38 of 48

Massachusetts Statewide Poll of 502 Likely Voters
in November 2014 General ElectionField Dates: June 27-29, 2014
OVERAL
L
Overall
UNWEIGHTED COUNT Unweighted count 502
Great deal / fair amount 43%
Not too much / none at all 51%
Don't Know / Refused 6%
Total 502
Agree 41%
Disagree 33%
Both / neither / depends (not
read)
5%
Don't Know / Refused 21%
Total 502
Agree 46%
Disagree 26%
Both / neither / depends (not
read)
5%
Don't Know / Refused 22%
Total 502
Net positive, providing thousands
of new, high paying jobs, and
major economic benefits
49%
Net negative, driving out local
businesses, and bringing spikes
in crime, gambling addiction, and
other problems
40%
Both / neither / depends (not
read)
6%
Don't Know / Refused 4%
Total 502
… How much confidence do you have in the Gaming
Commission to conduct the process fairly and
ethically?
Would you agree or disagree that most of the
business people involved in the proposed casino
developments have conducted themselves honestly
and ethically?
Would you agree or disagree that most of the public
officials from towns where casinos will be located have
conducted themselves honestly and ethically?
... Which is closer to your own point of view?
Very /
somewh
at closely
Not too /
not at all
closely
Great
deal / fair
amount
Not too
much /
none at
all
Net
positive
Net
negative
303 198 224 249 247 203
HOW CLOSELY
FOLLOWING
CASINOS
CONFIDENCE IN
GAMING
COMMISSION
VIEW OF
CASINOS
42% 46% 100% 0% 56% 28%
53% 47% 0% 100% 38% 69%
5% 7% 0% 0% 5% 4%
300 201 218 255 248 201
44% 38% 62% 26% 60% 24%
34% 30% 18% 48% 21% 47%
4% 7% 4% 6% 4% 6%
17% 25% 16% 20% 15% 23%
300 201 218 255 248 201
47% 46% 64% 33% 63% 30%
30% 20% 15% 38% 18% 37%
5% 6% 4% 7% 6% 6%
18% 28% 17% 22% 12% 27%
300 201 218 255 248 201
53% 45% 64% 37% 100% 0%
38% 42% 25% 54% 0% 100%
6% 7% 7% 5% 0% 0%
3% 7% 3% 4% 0% 0%
300 201 218 255 248 201
Conducted for WBUR by
More information, including full question wording, available at WBUR.org Page 39 of 48

Massachusetts Statewide Poll of 502 Likely Voters
in November 2014 General ElectionField Dates: June 27-29, 2014
OVERAL
L
Overall
UNWEIGHTED COUNT Unweighted count 502
Great deal / fair amount 43%
Not too much / none at all 51%
Don't Know / Refused 6%
Total 502
Agree 41%
Disagree 33%
Both / neither / depends (not
read)
5%
Don't Know / Refused 21%
Total 502
Agree 46%
Disagree 26%
Both / neither / depends (not
read)
5%
Don't Know / Refused 22%
Total 502
Net positive, providing thousands
of new, high paying jobs, and
major economic benefits
49%
Net negative, driving out local
businesses, and bringing spikes
in crime, gambling addiction, and
other problems
40%
Both / neither / depends (not
read)
6%
Don't Know / Refused 4%
Total 502
… How much confidence do you have in the Gaming
Commission to conduct the process fairly and
ethically?
Would you agree or disagree that most of the
business people involved in the proposed casino
developments have conducted themselves honestly
and ethically?
Would you agree or disagree that most of the public
officials from towns where casinos will be located have
conducted themselves honestly and ethically?
... Which is closer to your own point of view?
Western
/ Central
MA
Southeas
t MA
Outer
Boston
Suburbs
Boston /
Inner
Suburbs
127 62 165 129
REGIONS
51% 53% 37% 43%
45% 42% 59% 49%
4% 6% 4% 9%
128 58 184 113
42% 52% 39% 41%
30% 20% 35% 38%
7% 1% 7% 3%
21% 27% 19% 19%
128 58 184 113
54% 48% 44% 44%
20% 28% 26% 30%
4% 5% 8% 4%
22% 19% 22% 22%
128 58 184 113
50% 54% 54% 42%
39% 34% 37% 46%
8% 4% 4% 9%
3% 8% 5% 3%
128 58 184 113
Conducted for WBUR by
More information, including full question wording, available at WBUR.org Page 40 of 48

Massachusetts Statewide Poll of 502 Likely Voters
in November 2014 General ElectionField Dates: June 27-29, 2014
OVERAL
L
Overall
Democra
t
Republic
an
Unenroll
ed /
Other Male Female
UNWEIGHTED COUNT Unweighted count 502 190 61 251 238 264
PARTY REGISTRATION GENDER
Yes 47% 45% 44% 49% 49% 45%
No 53% 55% 56% 51% 51% 55%
Don't Know / Refused % 0% 0% % % 0%
Total 502 181 60 261 243 259
Connecticut 61% 56% 60% 64% 62% 59%
Rhode Island 11% 10% 12% 12% 10% 13%
New York 3% 6% 0% 1% 0% 5%
Las Vegas 15% 16% 18% 14% 18% 12%
Somewhere else 10% 12% 11% 8% 9% 10%
Don't Know / Refused % 0% 0% 1% 1% 0%
Total 234 81 26 127 118 116
Did you visit a casino in __________ or somewhere
else?
Have you visited a casino in the last 3 years?
Conducted for WBUR by
More information, including full question wording, available at WBUR.org Page 41 of 48

Massachusetts Statewide Poll of 502 Likely Voters
in November 2014 General ElectionField Dates: June 27-29, 2014
OVERAL
L
Overall
UNWEIGHTED COUNT Unweighted count 502
Yes 47%
No 53%
Don't Know / Refused %
Total 502
Connecticut 61%
Rhode Island 11%
New York 3%
Las Vegas 15%
Somewhere else 10%
Don't Know / Refused %
Total 234
Did you visit a casino in __________ or somewhere
else?
Have you visited a casino in the last 3 years?
18 to 29 30 to 44 45 to 59 60+
Men age
18-49
Women
age 18-
49
Men age
50+
Women
age 50+
63 122 169 148 113 112 125 152
AGE CATEGORIES AGE AND GENDER
55% 50% 46% 43% 50% 50% 48% 41%
45% 50% 54% 57% 50% 50% 52% 59%
0% 0% 0% 1% 0% 0% 1% 0%
60 131 166 146 109 120 134 139
55% 60% 61% 64% 63% 58% 61% 60%
16% 7% 11% 15% 7% 12% 12% 15%
4% 6% 0% 1% 0% 9% 0% 2%
16% 21% 17% 7% 24% 14% 14% 9%
9% 7% 11% 11% 6% 7% 12% 14%
0% 0% 0% 1% 0% 0% 1% 0%
32 65 75 62 54 61 65 55
Conducted for WBUR by
More information, including full question wording, available at WBUR.org Page 42 of 48

Massachusetts Statewide Poll of 502 Likely Voters
in November 2014 General ElectionField Dates: June 27-29, 2014
OVERAL
L
Overall
UNWEIGHTED COUNT Unweighted count 502
Yes 47%
No 53%
Don't Know / Refused %
Total 502
Connecticut 61%
Rhode Island 11%
New York 3%
Las Vegas 15%
Somewhere else 10%
Don't Know / Refused %
Total 234
Did you visit a casino in __________ or somewhere
else?
Have you visited a casino in the last 3 years?
White /
Caucasia
n All others
High
School or
less
Some
college,
no
degree
College
graduate
(BA/BS)
Advance
d degree
430 62 102 137 172 88
EDUCATION LEVELRACE
45% 60% 45% 53% 47% 42%
55% 40% 54% 47% 53% 58%
% 0% 1% 0% 0% 0%
429 63 90 144 159 105
61% 56% 62% 59% 56% 72%
12% 12% 24% 9% 12% 3%
1% 10% 0% 5% 3% 0%
16% 15% 2% 17% 20% 16%
10% 7% 10% 10% 9% 9%
% 0% 2% 0% 0% 0%
191 38 41 76 73 44
Conducted for WBUR by
More information, including full question wording, available at WBUR.org Page 43 of 48

Massachusetts Statewide Poll of 502 Likely Voters
in November 2014 General ElectionField Dates: June 27-29, 2014
OVERAL
L
Overall
UNWEIGHTED COUNT Unweighted count 502
Yes 47%
No 53%
Don't Know / Refused %
Total 502
Connecticut 61%
Rhode Island 11%
New York 3%
Las Vegas 15%
Somewhere else 10%
Don't Know / Refused %
Total 234
Did you visit a casino in __________ or somewhere
else?
Have you visited a casino in the last 3 years?
Less
than
$25k $25-$75k
$75-
$150k
More
than
$150k
Charlie
Baker
Martha
Coakley
Independ
ent
candidat
e
Don't
know /
other
40 130 157 75 139 210 30 112
INCOME RANGES
GOV HORSERACE - BAKER V
COAKLEY
39% 45% 53% 47% 48% 46% 43% 50%
61% 54% 47% 53% 52% 54% 57% 50%
0% 1% 0% 0% 0% % 0% 0%
37 126 161 79 142 207 29 113
49% 68% 61% 50% 58% 60% 54% 63%
21% 15% 7% 10% 13% 11% 5% 13%
25% 2% 2% 0% 2% 4% 0% 2%
5% 6% 16% 31% 13% 16% 41% 12%
0% 7% 13% 9% 14% 8% 0% 9%
0% 1% 0% 0% 0% 1% 0% 0%
14 57 85 37 67 95 13 55
Conducted for WBUR by
More information, including full question wording, available at WBUR.org Page 44 of 48

Massachusetts Statewide Poll of 502 Likely Voters
in November 2014 General ElectionField Dates: June 27-29, 2014
OVERAL
L
Overall
UNWEIGHTED COUNT Unweighted count 502
Yes 47%
No 53%
Don't Know / Refused %
Total 502
Connecticut 61%
Rhode Island 11%
New York 3%
Las Vegas 15%
Somewhere else 10%
Don't Know / Refused %
Total 234
Did you visit a casino in __________ or somewhere
else?
Have you visited a casino in the last 3 years?
Charlie
Baker
Steve
Grossma
n
Independ
ent
candidat
e
Don't
know /
other
150 145 45 150
GOV HORSERACE - BAKER V
GROSSMAN
47% 47% 52% 46%
53% 53% 48% 53%
0% 0% 0% 1%
153 142 45 151
62% 57% 54% 65%
9% 13% 16% 12%
4% 3% 0% 2%
12% 20% 25% 11%
13% 8% 5% 9%
0% 0% 0% 1%
71 67 24 69
Conducted for WBUR by
More information, including full question wording, available at WBUR.org Page 45 of 48

Massachusetts Statewide Poll of 502 Likely Voters
in November 2014 General ElectionField Dates: June 27-29, 2014
OVERAL
L
Overall
UNWEIGHTED COUNT Unweighted count 502
Yes 47%
No 53%
Don't Know / Refused %
Total 502
Connecticut 61%
Rhode Island 11%
New York 3%
Las Vegas 15%
Somewhere else 10%
Don't Know / Refused %
Total 234
Did you visit a casino in __________ or somewhere
else?
Have you visited a casino in the last 3 years?
Charlie
Baker
Don
Berwick
Independ
ent
candidat
e
Don't
know /
other
VOTES
FOR 1+
INDY
VOTES
FOR NO
INDY Approve
Disappro
ve
154 95 45 189 101 401 280 191
APPROVE OF
CASINOS?
GOV HORSERACE - BAKER V
BERWICK
VOTES FOR AN
INDEPENDENT IN
ANY MATCHUP
51% 47% 50% 46% 53% 46% 61% 30%
49% 53% 50% 53% 47% 54% 38% 70%
0% 0% 0% % 0% % % 0%
155 94 45 188 101 401 281 190
58% 71% 49% 62% 61% 61% 64% 52%
12% 12% 13% 11% 13% 11% 11% 13%
3% 0% 0% 3% 4% 2% 4% 0%
13% 13% 29% 15% 16% 15% 12% 25%
14% 5% 8% 9% 6% 11% 9% 9%
0% 0% 0% 1% 0% % 1% 0%
78 44 23 86 54 181 170 57
Conducted for WBUR by
More information, including full question wording, available at WBUR.org Page 46 of 48

Massachusetts Statewide Poll of 502 Likely Voters
in November 2014 General ElectionField Dates: June 27-29, 2014
OVERAL
L
Overall
UNWEIGHTED COUNT Unweighted count 502
Yes 47%
No 53%
Don't Know / Refused %
Total 502
Connecticut 61%
Rhode Island 11%
New York 3%
Las Vegas 15%
Somewhere else 10%
Don't Know / Refused %
Total 234
Did you visit a casino in __________ or somewhere
else?
Have you visited a casino in the last 3 years?
Very /
somewh
at closely
Not too /
not at all
closely
Great
deal / fair
amount
Not too
much /
none at
all
Net
positive
Net
negative
303 198 224 249 247 203
HOW CLOSELY
FOLLOWING
CASINOS
CONFIDENCE IN
GAMING
COMMISSION
VIEW OF
CASINOS
53% 38% 53% 42% 61% 31%
47% 62% 46% 58% 39% 69%
% 0% % 0% % 0%
300 201 218 255 248 201
62% 59% 62% 58% 68% 50%
11% 12% 11% 11% 11% 13%
1% 7% 2% 3% 3% 2%
16% 14% 18% 13% 10% 25%
10% 7% 6% 15% 8% 10%
1% 0% 1% 0% 1% 0%
158 75 116 106 149 63
Conducted for WBUR by
More information, including full question wording, available at WBUR.org Page 47 of 48

Massachusetts Statewide Poll of 502 Likely Voters
in November 2014 General ElectionField Dates: June 27-29, 2014
OVERAL
L
Overall
UNWEIGHTED COUNT Unweighted count 502
Yes 47%
No 53%
Don't Know / Refused %
Total 502
Connecticut 61%
Rhode Island 11%
New York 3%
Las Vegas 15%
Somewhere else 10%
Don't Know / Refused %
Total 234
Did you visit a casino in __________ or somewhere
else?
Have you visited a casino in the last 3 years?
Western
/ Central
MA
Southeas
t MA
Outer
Boston
Suburbs
Boston /
Inner
Suburbs
127 62 165 129
REGIONS
50% 50% 49% 43%
50% 50% 51% 57%
1% 0% 0% 0%
128 58 184 113
68% 51% 67% 46%
8% 36% 8% 8%
0% 0% 3% 7%
13% 3% 13% 27%
10% 9% 9% 12%
1% 0% 0% 0%
64 27 90 49
Conducted for WBUR by
More information, including full question wording, available at WBUR.org Page 48 of 48