7. ijans - applied =- the impact fdi on the economic sectors in turkey country
DESCRIPTION
The relationship between investment and development of close relations in economic thought, foreign investment have been associated by the development of international trade, and helped to spread and increasing rates emergence transnational corporations National Furthermore mergers and acquisitions across borders, including the purchase of foreign investors Government Organizations that have been privatized, Has used the most of the world foreign capital to modernize and develop its production facilities and other components of the national economy, and foreign investment played an important role in economic development projects for the host countries if they have done these countries to choose their projects and their foreign partners, Investing can close the gap of resources and capabilities that are not available in the receiving countries, The research problem in that Economics sectors be affected by a lot of factors that affect one way or another by and by certain of these factors is not economic, so there are major factors leading to development and growth to the desired goal final namely economic well-being and these important factors is foreign direct investment (FDI) The orientation of the plan drawn about the problems and economic critical points, it leads to the activation of the entire economy,The research aims to targets several of them estimate general trends for each indicator and then process the data to make it distributed naturally using functions transfers Johnson three SL, SU, SB, as well as estimate the econometrics models represent the relationship between foreign direct investment as an independent variable economic indicators for Turkey country.TRANSCRIPT
[email protected] .iaset.uswww
THE IMPACT FDI ON THE ECONOMIC SECTORS IN TURKEY CO UNTRY
(AN ECONOMETRICS STUDY BY USE JOHNSON METHOD FOR
TRANSFORMATION DATA)
ADNAN DAWOOD M. AL-EDARY & WISAM NEAMAH JAAFAR
Faculty of Administration & Economics Faculty of Administration & Economics,
Economics Department, Iraq
ABSTRACT
The relationship between investment and development of close relations in economic thought, foreign investment
have been associated by the development of international trade, and helped to spread and increasing rates emergence
transnational corporations National Furthermore mergers and acquisitions across borders, including the purchase of foreign
investors Government Organizations that have been privatized, Has used the most of the world foreign capital to
modernize and develop its production facilities and other components of the national economy, and foreign investment
played an important role in economic development projects for the host countries if they have done these countries to
choose their projects and their foreign partners, Investing can close the gap of resources and capabilities that are not
available in the receiving countries, The research problem in that Economics sectors be affected by a lot of factors that
affect one way or another by and by certain of these factors is not economic, so there are major factors leading to
development and growth to the desired goal final namely economic well-being and these important factors is foreign direct
investment (FDI) The orientation of the plan drawn about the problems and economic critical points, it leads to the
activation of the entire economy,The research aims to targets several of them estimate general trends for each indicator and
then process the data to make it distributed naturally using functions transfers Johnson three SL, SU, SB, as well as
estimate the econometrics models represent the relationship between foreign direct investment as an independent variable
economic indicators for Turkey country.
KEYWORDS: International Economics, Economic Policies, Econometrics
INTRODUCTION
The relationship between investment and development of close relations in economic thought, foreign investment
have been associated by the development of international trade, and helped to spread and increasing rates emergence
transnational corporations National Furthermore mergers and acquisitions across borders, including the purchase of foreign
investors Government Organizations that have been privatized, Has used the most of the world foreign capital to
modernize and develop its production facilities and other components of the national economy, and foreign investment
played an important role in economic development projects for the host countries if they have done these countries to
choose their projects and their foreign partners, Investing can close the gap of resources and capabilities that are not
available in the receiving countries, and expanding the investor base in the country, and through the participation of local
capital and therefore a positive impact on the balance of payments and increasing exports and substitution of locally
produced goods store imported goods, Add to expand the quality of local industries and also convey this investment
International Journal of Applied and Natural Sciences (IJANS) ISSN(P): 2319-4014; ISSN(E): 2319-4022 Vol. 4, Issue 3, May 2015, 51-64 © IASET

52 Adnan Dawood M. Al-Edary & Wisam Neamah Jaafar
Impact Factor (JCC): 2.9459 NAAS Rating: 2.74
advanced methods of management, training and production, marketing and transportation technology and indigenization
and its contribution to the creation of more jobs and give the National Labor technical and managerial skills of modern
directly leading to improved performance level national employment.
The research problem in that Economics sectors be affected by a lot of factors that affect one way or another by
and by certain of these factors is not economic, so there are major factors leading to development and growth to the desired
goal final namely economic well-being and these important factors is foreign direct investment (FDI) The orientation of
the plan drawn about the problems and economic critical points, it leads to the activation of the entire economy,The
research aims to targets several of them estimate general trends for each indicator and then process the data to make it
distributed naturally using functions transfers Johnson three SL, SU, SB, as well as estimate the econometrics models
represent the relationship between foreign direct investment as an independent variable economic indicators for Turkey
country.
In the field of foreign direct investment published many researchers effects of foreign investment on economic
growth and on economic development and sustainable development, and this research has indicated (Kiyoshi Kojima
1978)[7] on the role of foreign direct investment and its impact on the economy, Publishing (M. TalhaAtik and Hung
Tran2008)[10] research titled (FDI in Developing countries the case of Ericsson in Mexico and Vietnam) analyzed the role
of investment in economic development, and Publishing (Sung-Hoon Lim 2008)[16] on the role of foreign direct
investment on foreign trade in Korea and entitled (Foreign Direct Investment Policy and Incentives, Korea
Trade-Investment, Promotion Agency (KOTRA)),And published researcher (Tun, wai and wang 1982)[17] paper entitled
(Determinants of private investment in Developing countries), research in this topic for determinants of investment in
developing countries and stressed the role of private investment objective role of foreign direct investment, and published
(European Commission research in 2006)[3] research titled (study on FDI and regional development), and published
researcher (Edward graham 1995)[2] discussed the role of foreign direct investment in the global economy, other
researchers publishing about the role of sustainable development of the economy and the role of foreign direct investment,
The researchers (Meadows, D, H L., and Meadows 1972)[8] research entitled (on the determinants of growth and its
factors), and the researcher (Jonathan M. Harris 2000)[6] published a book shows basic principle sustainable development
and the role of foreign direct investment, & Publishing many researchers (Pearce D. W, and others 1989)[12] paper entitled
(Blueprint for green Economy, Earth scan) and identified the role of the environment in economic development and
pollution factors that limit the operations of development and economic growth.
Foreign Direct Investment (Concepts, Theories)
Economic literature distinguished between two types of foreign investment, foreign direct investment and
portfolio investment in the Securities and called indirect foreign investment, Has been known FDI definitions multiple
ones «It is an establishment of new projects and the expansion of existing projects, whether wholly owned foreign investor
or to owning shares of a company with the acquisition of the right to manage the project and control it is accompanied by
investment mentioned transmission technology, resources and skills carry out integrated productivity in the host
country[9]. As defined by the United Nations Conference on Trade and Development (UNCTAD) as the process of
recruitment of foreign funds is a national asset capital fixed in host countries certain and involves long-term relationship
reflecting the benefit of a foreign investor shall have the right to manage its assets and control of his country or country of
residence, which is where it may be investor individual or company or institution [18], And defined by the WTO that

The Impact FDI on the Economic Sectors in Turkey Country (An Econometrics 53 Study by Use Johnson Method for Transformation Data)
[email protected] .iaset.uswww
investment happening when the investor is stable in the country « Home country» own origin is in another country « Host
country» with a mechanism has in the management of that asset [14], as defined by (Gilles Bertin, 1970) that the
investment that requires control (supervision) on the project, and this investment takes the form of establishment of the
investor alone equal participation or unequal, and it also takes the form of repurchase all or part of an existing project.
Theoretical Explanations for FDI
Classical Theory
Classical analysis is characterized by a set of factors from which: advocacy for freedom and non-interference of
the state, and full competition in the market, and the absence of any obstacles in the movement of capital, and production
elements [1]. Among the pioneers classical school David Ricardo (who founded in 1817 the theory of comparative
advantage) [15], who sees "the transfer of capital to be part of the country which is characterized by productivity high
capital into the country, which is characterized by productivity capital and low "and that the main reason for the movement
of capital is for the purpose of profit by taking advantage of differences in interest rate ratios that result from variation
capital in each country [11]. Thus the continuity of this movement (of capital) to reach the end, becomes marginal
productivity of capital equal countries then to stop the movement, allowing the emergence of inequality new returns, which
is noted on this theory that the disparity between the returns between countries that is allowing owners capital investment
abroad in the case of equal returns, they do not expect to get any movement of capital across countries, then the capital
moves from one country to another in response to differences in the marginal productivity of capital and thus the direction
of motion of the country is characterized by an abundance of capitalto another issecure relative, but this theory contradicts
the fact that the bulk of direct investment moves within the walls of the more developed areas of the world capitalist
system, as converging levels marginal productivity of capital.
Theory Heckscher - Ohlin 1933
After criticism of the classical theory in non-clarified the reasons that lead to the difference in the relative costs
continued studies in the interpretation of those reasons, as Heckscher - Ohlin relative difference in expenditures is not a
sufficient condition for the establishment of the international exchange and added to two factors:
• Factor differences in the relative abundance of factors of production between countries.
• Factor difference in the prices of factors of production between countries.
Hence Heckscher - Ohlin believes that the disparity in costs is primarily due to the difference in states with
respect to the availability of natural resources, State concerned to export some factors of production available to it and
import those factors that scarcity where [4], and to explain this theory of foreign direct investment based on the principle of
specialization, as each country specializes in the production and export of products, which is characterized by the relative
plenty of factors of production and imported goods that do not enjoy relative plenty of factors of production.
Monopolistic Advantage Theory [13]
Adopt this theory on the assumption of internationalization in the interpretation of the causes that lead
multinationals to resort to foreign direct investment and focus of this theory on the idea that multinational corporations
have the capabilities and potential private not enjoyed by local companies, as well as the inability of local companies to get
those features, It is noteworthy that these features make foreign companies get higher returns from local companies and
those competitive advantages any production company specific commodity distinct companies cannot local or other

54 Adnan Dawood M. Al-Edary & Wisam Neamah Jaafar
Impact Factor (JCC): 2.9459 NAAS Rating: 2.74
competitors be produced because of the information gap or trademark protection or marketing skills or lower unit costs due
to production volume great, or administrative excellence and taxation.
Data Scrubbing
The data from the states sample must be characterized randomly and distribution of natural, but actual practice
shows estimates where defects several failed statistical tests and containment models problems econometrics and such as
multicollinearity and autocorrelation and the problem of Hetroscadicity and data in mostly all States of this kind and thus
cannot be we get the estimation and clear and pure models that pass all econometrics and statistical tests and this is a
problem facing researchers, but (Johnson) Find functions and transfers know Johnson transfers and here's how to hold
them.
Johnson Transfers
In 1949 derived Johnson system functions that were flexible and cover enough for multiple types of data and was
this system practically and theoretically great benefit of giving the ability to transform this data from non-normal
distribution to the normal distribution as the data that was taken for estimation is non-normal distribution and thus Johnson
had transfers to these condensed using functions gave the high flexibility of the data as it became distributed naturally.
Johnson Transfers System
Of continuous random variable X be distributed is not known or unknown and this makes it impossible to get
significant results from it, so Johnson makes three transfers they are in the following :
� = � + ��( − �ג
) Where:
f= transformation function.
Z=standard normal random variable.
� ��� = �ℎ ��� � ������. ג = �� ��� � �����, � = ��� ����� � �����
Johnson assumed that δ> 0 and γ> 0 that the first transfer to Johnson defines natural as to logarithm system refers
to the symbol distributional ��and thus function takes the following form:
� = � + ��� − �ג
! , > � = �∗ + ���( − �), > �
And SL includes transfer Natural logarithm Group.
The distribution system specified bounded distribution and symbolized by Johnson indicated �$ identified Johnson
as the function following:
� = � + ��� − �� + ג − ! , ξ < < ג
As well as the distribution system set includes all the curves specified distributions, and distributions can be
determined with a low and a high or a combination of both, and this system of distributions is a group that includes gamma

The Impact FDI on the Economic Sectors in Turkey Country (An Econometrics 55 Study by Use Johnson Method for Transformation Data)
[email protected] .iaset.uswww
distributions or distributions beta, and so on.
The non-specific distributions system and Johnson code symbol �&has formulated and identified Johnson as the
following:
� = � + ����ℎ'( ) − �ג
! + *( − �ג
)+ + 1}.( +/ 0 , −∞ < < ∞
= � + ����ℎ'((( − (ג/(�Thus, the curves non-specific distributions system includes t cover as well as natural distributions and between
them [5].
Johnson transfer format for the three functions
For the purpose of showing the differences between real data and the transferred data will be included data values
between the real values and the values of format transfers Johnson sample countries and also comes:
FDI Transfer
To organize real data and transfer format Johnson will start the independent variable, which represents foreign
direct investment, as follows:
Table 1: Showing the True Values and Johnson Transform Values by Natural Logarithm Formula 23 Real FDI Value (US $) Transformation of FDI Value (SL)
8.10000E+08 -0.37446 8.44000E+08 -0.32787 6.36000E+08 -0.95359 6.08000E+08 -1.76482 8.85000E+08 -0.27982 7.22000E+08 -0.54509 8.05000E+08 -0.38196 9.40000E+08 -0.22543 7.83000E+08 -0.41738 9.82000E+08 -0.18962 3.35200E+09 0.41153 1.08200E+09 -0.11832 1.70200E+09 0.13383 2.78500E+09 0.34160 1.00310E+10 0.78439 2.01850E+10 1.00544 2.20470E+10 1.03291 1.95040E+10 0.99474 8.41100E+09 0.72737 9.03800E+09 0.75073
Source:1- www.worldbank .org/data/dataquery.html 2- http://www.imf.org/external/index.htm
3- The researcher estimated the Johnsons transformation by using the Minitab -14 Demo

56
Impact Factor (JCC): 2.9459
Source: by use the data from www.
Figure
Johnson transfer formula shows that values
the hypothesis theory of random variable and can be viewed at the results in the figure above, which created the best
transfer formula Johnson transfers as a function of transfer logarithmic normal and hence the forthcoming tests cannot
attach them because results in the accompanying graph.
Dependent Variables
Economic Indicators
• The agricultural sector added value variable in GDP (%)
Johnson transfers shows that the best transfer is limited transfer function organized transferred data and real as in
the following table:
Table 2: Showing the
Real Value Value Added
15.804015.563216.074916.025816.289417.39461413.582511.538011.31239.948411.707711.391510.919210.79629.52438.67648.6076
Adnan Dawood M. Al
www.worldbank .org/data/dataquery.html and the Minitab
Figure 1: Shows the Johnson Transformation for FDI
Johnson transfer formula shows that values foreign direct investment was not distributed naturally according to
the hypothesis theory of random variable and can be viewed at the results in the figure above, which created the best
transfers as a function of transfer logarithmic normal and hence the forthcoming tests cannot
attach them because results in the accompanying graph.
The agricultural sector added value variable in GDP (%)
ransfers shows that the best transfer is limited transfer function organized transferred data and real as in
the True Values and Estimated Values by Using Format
Value of Agriculture, Value Added (% of GDP)
Transformation of Agriculture, Value Added (% of GDP)
15.8040 0.70214 15.5632 0.63242 16.0749 0.79040 16.0258 0.77347 16.2894 0.87064 17.3946 1.98000 14.9656 0.48273 13.5825 0.19947 11.5380 -0.19306 11.3123 -0.24127 9.9484 -0.60766 11.7077 -0.15799 11.3915 -0.22412 10.9192 -0.33089 10.7962 -0.36080 9.5243 -0.78064 8.6764 -1.66348 8.6076 -1.98000
Adnan Dawood M. Al-Edary & Wisam Neamah Jaafar
NAAS Rating: 2.74
the Minitab-14 Demo program.
foreign direct investment was not distributed naturally according to
the hypothesis theory of random variable and can be viewed at the results in the figure above, which created the best
transfers as a function of transfer logarithmic normal and hence the forthcoming tests cannot
ransfers shows that the best transfer is limited transfer function organized transferred data and real as in
Format Johnson
Transformation of Agriculture,
The Impact FDI on the Economic Sectors in Turkey Country (An EconometricsStudy by Use Johnson Method for Transformation Data)
.iaset.uswww
9.34769.5995
Source: 1-www.2- http://www.imf.org/external/index.htm3-The Demo
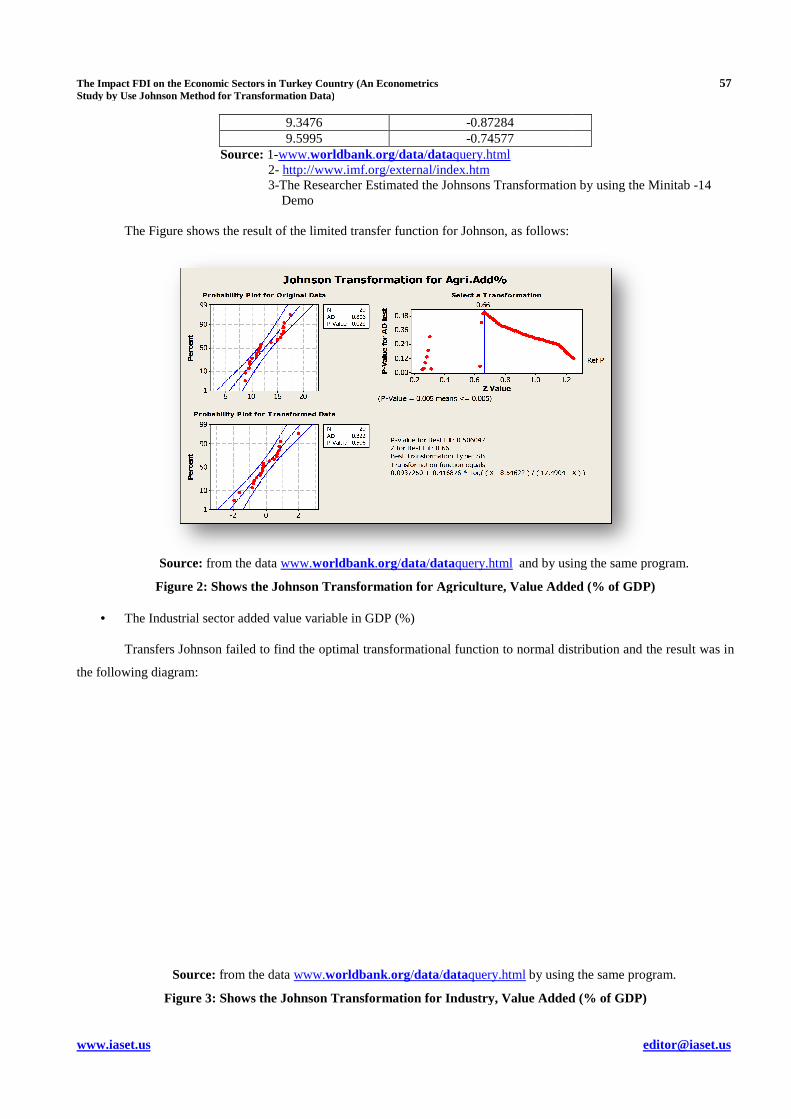
The Figure shows the result of the limited transfer function for Johnson, as follows:
Source: from the data www.
Figure 2: Shows the Johnson Transformation for Agriculture,
• The Industrial sector added value variable in GDP (%)
Transfers Johnson failed to find the optimal transformational function to normal distribution and the result was in
the following diagram:
Source: from the data
Figure 3: Shows the Johnson Transformation for Industry,
on the Economic Sectors in Turkey Country (An Econometrics Study by Use Johnson Method for Transformation Data)
9.3476 -0.87284 9.5995 -0.74577
www.worldbank .org/data/dataquery.html http://www.imf.org/external/index.htm The Researcher Estimated the Johnsons Transformation Demo
The Figure shows the result of the limited transfer function for Johnson, as follows:
www.worldbank .org/data/dataquery.html and by using the same program.
the Johnson Transformation for Agriculture, Value Added
The Industrial sector added value variable in GDP (%)
Transfers Johnson failed to find the optimal transformational function to normal distribution and the result was in
from the data www.worldbank .org/data/dataquery.html by using the same program.
the Johnson Transformation for Industry, Value Added
57
Transformation by using the Minitab -14
and by using the same program.
Value Added (% of GDP)
Transfers Johnson failed to find the optimal transformational function to normal distribution and the result was in
by using the same program.
Value Added (% of GDP)

58
Impact Factor (JCC): 2.9459
• The Services sector added value variable in GDP (%)
Transfers Johnson showing that transfer optimization is the limited transfer function SB converted data is
organized and real in the following table:
Table 3: Showing the
Real Value Value Added
51.503052.051952.827650.725150.473951.006453.180850.874755.136457.211159.816559.619659.990260.563660.693461.802963.066363.705564.710563.7501
Source: 1- www.2- http://www.imf.org/external/index.htm3- The researcher estimated the Johnsons transformation by us Demo
The following Figure shows the following results Johnson limited transfer function
Source: From the Data
Figure 4: Shows the Johnson Transformation for Services, etc.,
Adnan Dawood M. Al
ices sector added value variable in GDP (%)
Transfers Johnson showing that transfer optimization is the limited transfer function SB converted data is
organized and real in the following table:
the True Values and Estimated Values by Using Johnson
Value of Services, etc., Value Added (% of GDP)
Transformation of Services, etc., Value Added (% of GDP)
51.5030 -0.78043 52.0519 -0.59737 52.8276 -0.41511 50.7251 -1.32430 50.4739 -2.12240 51.0064 -1.04547 53.1808 -0.34789 50.8747 -1.15407 55.1364 -0.05834 57.2111 0.18516 59.8165 0.48421 59.6196 0.46017 59.9902 0.50578 60.5636 0.58000 60.6934 0.59758 61.8029 0.76488 63.0663 1.02610 63.7055 1.22949 64.7105 2.23562 63.7501 1.24743 www.worldbank .org/data/dataquery.html http://www.imf.org/external/index.htm The researcher estimated the Johnsons transformation by usDemo
The following Figure shows the following results Johnson limited transfer function
Data in www.worldbank .org/data/dataquery.html by using the
the Johnson Transformation for Services, etc., Value Added
Adnan Dawood M. Al-Edary & Wisam Neamah Jaafar
NAAS Rating: 2.74
Transfers Johnson showing that transfer optimization is the limited transfer function SB converted data is
Johnson Format
Transformation of Services, etc., (% of GDP)
The researcher estimated the Johnsons transformation by using the Minitab -14
by using the Same Program
Value Added (% of GDP)
The Impact FDI on the Economic Sectors in Turkey Country (An Econometrics 59 Study by Use Johnson Method for Transformation Data)
[email protected] .iaset.uswww
The Model
Models value added as a percentage of GDP to the sectors of agriculture, industry and services.
Formulation of the model
Researcher relies on a linear model as the best solution to reach the impact of FDI on development and growth in
Islamic economies and which takes the following form:
4� = 5 + 6� + 7� Yi = Dependent variable (i=1,2,3,……….,n).
Xi = independent variable.
α = intercept.
Β = slope.
And can estimate this model by the ordinary least squares method.
The theoretical prediction of signal parameter:
Expected researcher supposed that the impact of FDI is positive in its effects on all dependent variables.
The Estimation
1 - Estimate the impact of FDI on the added value of the agricultural sector in GDP
Estimates are organized in the following table:
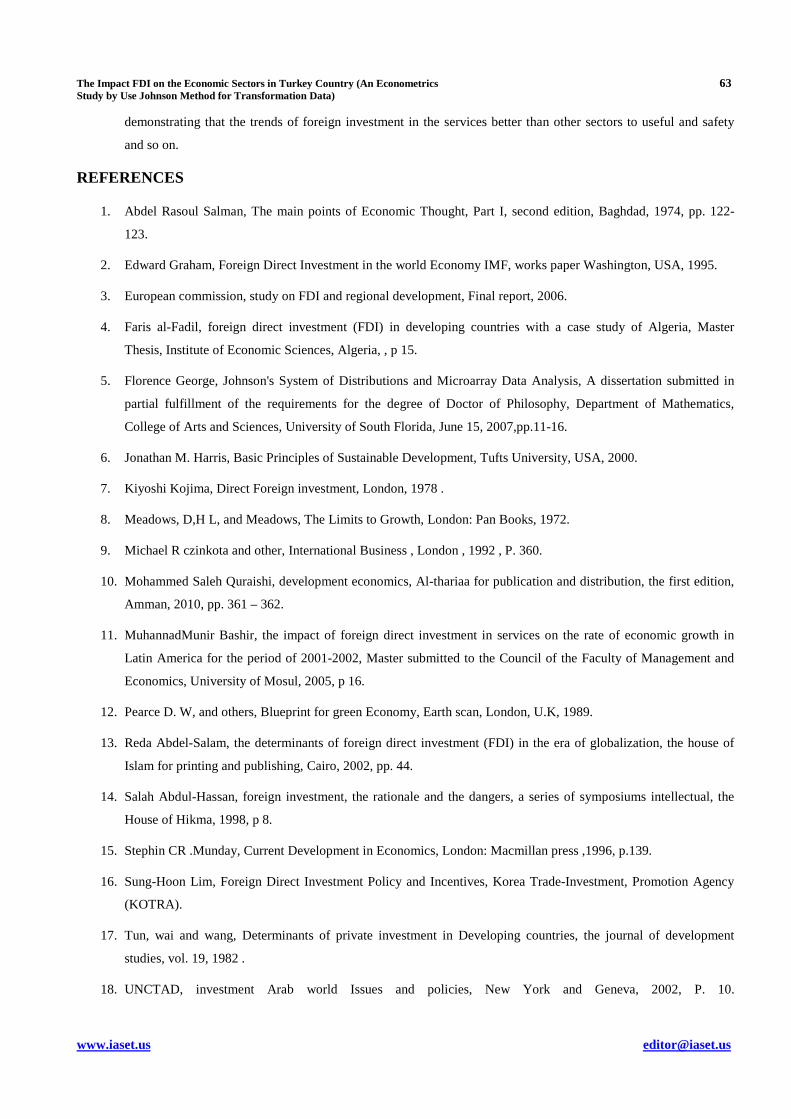
Table 4: Showing the Estimation of three Models to the Impact of FDI on the Added Value of the Agricultural Sector in GDP
Models
Parameters
Regression Model by Using the Real Data
Regression Model by UsingohnsonsJ
Transformation data for FDI Only
Regression Model by UsingohnsonsJ
Transformation Data for Both Variables
Constant T
13.9669 (23.19)(% 12.5560 (34.61)(%
-0.0557 (−0.44)?@? FDI T
-0.00000000012 (−4.18)(% -3.3959 (−6.67)(%
-1.0157 (−5.66)(% SE 2.15196 1.62115 0.570757 D+ 49.2% 71.2% 64.1% r 70% 84% 80%
F(2,20) (17.44)(% (44.45)(% (32.07)(% D.W (0.341226)@EFG% (1.14606)HIFJII?(% (1.41424)K?(%
Source: from the real data and by using Johnsons transformation and the Minitab -14 Demo program.
Of estimate shows that models the second and third transfers Johnson for FDI only and variables, respectively, but
the second model transfers Johnson investment variable did not pass the test D.W and therefore the researcher based on the
third model because the model passes statistical tests and the best to represent the economic relationship but estimated
model shows the reference investment variable negative signal which indicates that the impact of investment opposite
effect in the value added in the agricultural sectorMay be justified by researcher partly due to real data and justification
second due to agricultural investment not to exceeding the value added in GDP as the foreign direct investment has

60 Adnan Dawood M. Al-Edary & Wisam Neamah Jaafar
Impact Factor (JCC): 2.9459 NAAS Rating: 2.74
exhausted part most of the added value of the agricultural sector of the Turkish account native country and thus appeared
passivity, and graphs represent models estimated and can be compared between behavior of the regression line in the third
model compared other two models.
Source: The data from a www.worldbank .org/data/dataquery.html by using Minitab 14-Demo.
Figure 5: Shows the Trends Curves Models Estimate the Adoption of Real Data and Transfer Johnson Transfers to the Impact of FDI on the Added Value of the Agricultural Sector in GDP.
2-Estimate the impact of FDI on the value-added of the industrial sector in GDP.
Transfers Johnson failed to find the optimal distribution function to the variable value added of the industrial
sector and so it will be scale models are limited on the two regression models, as follows:
Table 5: Showing Regression Models to Estimate the Impact of FDI on the Value-Added of the Industrial Sector as a Percentage of GDP
Models
Parameters
Regression Model by Using the Real Data
Regression Model by UsingohnsonsJ
Transformation Data for FDI Only
Constant T
31.5804 (35.67)(% 30.4908 (76.43)(%
FDI T
-0.00000000012 (−3.30)(% -2.6390 (−4.71)(%
SE 2.10202 1.78254 D+ 37.7% 55.2% r 61% 74%
F(2,20) (10.91)(% (22.20)(% D.W (0.806345)@EFG% (1.4.567)K?(%
Source: from the real data and by using Johnsons transformation and the Minitab -14 Demo program.
Limited estimate on the two models, one real-time data and other transfers Johnson variable FDI and showing the
form last ability is greater than the estimation first since passed all statistical tests and econometrics and reference
parameter investment also appeared signal negative and thus return researcher for the reasons mentioned in advance and
showing diagrams ability regression line estimate compared the first model.
J-Sl-FDI
Ag
ri.A
dd
%
1.00.50.0-0.5-1.0-1.5-2.0
20.0
17.5
15.0
12.5
10.0
S 1.62115
R-Sq 71.2%
R-Sq(adj) 69.6%
The Estimation by Johnsons transformation for FDI onlyAgri.Add% = 12.56 - 3.396 J-Sl-FDI
FDI
Ag
ri.A
dd
%
2.5000E+102.0000E+101.5000E+101.0000E+1050000000000
17
16
15
14
13
12
11
10
9
8
S 2.15196
R-Sq 49.2%
R-Sq(adj) 46.4%
The Estimation by real data for both variablesAgri.Add% = 13.97 - 0.000000 FDI

The Impact FDI on the Economic Sectors in Turkey Country (An Econometrics 61 Study by Use Johnson Method for Transformation Data)
[email protected] .iaset.uswww
Source: real data from a table 2 by using Minitab 14-Demo.
Figure 6: Shows the Trends Curves Models Estimate the Adoption of Real Data and Transferred Johnson Transfers to the Impact of FDI on the Added Value of the Industrial Sector in GDP
3 - Estimate the impact of FDI on the value-added services
It was estimating three models and organized in the following table:
Table 6: Showing Regression Models to Estimate the Impact of FDI on the Added Value of the Service Sector as a Percentage of GDP
Models Parameters Regression Model by
Using the Real Data
Regression Model by UsingohnsonsJ
Transformation Data for FDI Only
Regression Model by UsingohnsonsJ
Transformation Data for Both Variables
Constant T
54.453 (52.05)(% 56.9532 (92.48)(%
0.0401 (0.26)?@? FDI T
0.0000000045 (4.26)(% 6.0349 (6.98)(%
1.1074 (5.11)(% SE 3.73745 2.75159 0.689205 D+ 50.2% 73% 59.2% r 70% 85% 77%
F(2,20) (18.17)(% (48.72)(% (26.15)(% D.W (0.475635)@EFG% (1.38141)K?(% (1.77354)K?(%
Source: from the real data and by using Johnsons transformation and the Minitab -14 Demo program.
Seen from the estimate of the three models that the best estimate represents the economic relationship between
investment and the added value of the service sector is the third model transfers Johnson both variables of which represents
the added value and the independent variable that represents the investment that they are the parameter investment
significant on the level of significance of 1% and significant model as well as on the same level and passes the model test
D.W and free from the problem of autocorrelation between residuals random and relationship investment value added
positive relationship which shows that the impact of foreign investment affects positively on the sector of services
demonstrating that the trends of foreign investment in the services better than other sectors to useful and safety and so on.
The following graphs show estimate the direction of the regression line optimization as the third form of the best lines.
J-Sl-FDI
Ind
us
t.A
dd
%
1.00.50.0-0.5-1.0-1.5-2.0
35.0
32.5
30.0
27.5
25.0
S 1.78254
R-Sq 55.2%
R-Sq(adj) 52.7%
The Estimation by Johnson transformation for FDI onlyIndust.Add% = 30.49 - 2.639 J-Sl-FDI
FDI
Ind
us
t.A
dd
%
2.5000E+102.0000E+101.5000E+101.0000E+1050000000000
35.0
32.5
30.0
27.5
25.0
S 2.10202
R-Sq 37.7%
R-Sq(adj) 34.3%
The Estimation by real data both variablesIndust.Add% = 31.58 - 0.000000 FDI

62 Adnan Dawood M. Al-Edary & Wisam Neamah Jaafar
Impact Factor (JCC): 2.9459 NAAS Rating: 2.74
Source: The data from www.worldbank .org/data/dataquery.html by using Minitab
14-Demo
Figure 7: Shows the Trends Curves Models Estimate the Adoption of Real Data and Transfer Johnson Transfers to the Impact of FDI on the Added Value of the Services Sector in GDP
THE CONCLUSIONS
• It turned out that data from the official institutions of the United Nations organizations in mostly non-distributed
naturally means that irregular because the data sent by States to these organizations may be weighted or modified
on the way they really are and to show these countries as an economy a developing or to improve image economic
and social development of States.
• Produced a transfers Johnson on a lot of variables that annexation of research and representing economic
indicators were not distributed in mostly non-distributed naturally and this causes problems exist record when
estimate.
• The estimate of the impact of investment on the service sector moreinfluential than the agriculture and industry
sectors.that the impact of investment opposite effect in the value added in the agricultural sectorMay be justified
by researcher partly due to real data and justification second due to agricultural investment not to exceeding the
value added in GDP as the foreign direct investment has exhausted part most of the added value of the agricultural
sector of the Turkish account native country and thus appeared passivity, and the Industrial sectoralso appeared
signal negative and thus return researcher for the reasons mentioned in advance ,the service sector are positive
relationship which shows that the impact of foreign investment affects positively on the sector of services
J-Sl-FDI
Se
rv.A
dd
%
1.00.50.0-0.5-1.0-1.5-2.0
65
60
55
50
45
S 2.75159
R-Sq 73.0%
R-Sq(adj) 71.5%
The Estimation by Johnsons transformation for FDI onlyServ.Add% = 56.95 + 6.035 J-Sl-FDI
FDI
Se
rv.A
dd
%
2.5000E+102.0000E+101.5000E+101.0000E+1050000000000
66
64
62
60
58
56
54
52
50
S 3.73745
R-Sq 50.2%
R-Sq(adj) 47.5%
The Estimation by real data for both variablesServ.Add% = 54.45 + 0.000000 FDI
J-Sl-FDI
J-Ser.
Add
1.00.50.0-0.5-1.0-1.5-2.0
2
1
0
-1
-2
S 0.689205
R-Sq 59.2%
R-Sq(adj) 57.0%
The Estimation by Johnsons transformation for both variablesJ-Ser.Add = 0.0401 + 1.107 J-Sl-FDI
The Impact FDI on the Economic Sectors in Turkey Country (An Econometrics 63 Study by Use Johnson Method for Transformation Data)
[email protected] .iaset.uswww
demonstrating that the trends of foreign investment in the services better than other sectors to useful and safety
and so on.
REFERENCES
1. Abdel Rasoul Salman, The main points of Economic Thought, Part I, second edition, Baghdad, 1974, pp. 122-
123.
2. Edward Graham, Foreign Direct Investment in the world Economy IMF, works paper Washington, USA, 1995.
3. European commission, study on FDI and regional development, Final report, 2006.
4. Faris al-Fadil, foreign direct investment (FDI) in developing countries with a case study of Algeria, Master
Thesis, Institute of Economic Sciences, Algeria, , p 15.
5. Florence George, Johnson's System of Distributions and Microarray Data Analysis, A dissertation submitted in
partial fulfillment of the requirements for the degree of Doctor of Philosophy, Department of Mathematics,
College of Arts and Sciences, University of South Florida, June 15, 2007,pp.11-16.
6. Jonathan M. Harris, Basic Principles of Sustainable Development, Tufts University, USA, 2000.
7. Kiyoshi Kojima, Direct Foreign investment, London, 1978 .
8. Meadows, D,H L, and Meadows, The Limits to Growth, London: Pan Books, 1972.
9. Michael R czinkota and other, International Business , London , 1992 , P. 360.
10. Mohammed Saleh Quraishi, development economics, Al-thariaa for publication and distribution, the first edition,
Amman, 2010, pp. 361 – 362.
11. MuhannadMunir Bashir, the impact of foreign direct investment in services on the rate of economic growth in
Latin America for the period of 2001-2002, Master submitted to the Council of the Faculty of Management and
Economics, University of Mosul, 2005, p 16.
12. Pearce D. W, and others, Blueprint for green Economy, Earth scan, London, U.K, 1989.
13. Reda Abdel-Salam, the determinants of foreign direct investment (FDI) in the era of globalization, the house of
Islam for printing and publishing, Cairo, 2002, pp. 44.
14. Salah Abdul-Hassan, foreign investment, the rationale and the dangers, a series of symposiums intellectual, the
House of Hikma, 1998, p 8.
15. Stephin CR .Munday, Current Development in Economics, London: Macmillan press ,1996, p.139.
16. Sung-Hoon Lim, Foreign Direct Investment Policy and Incentives, Korea Trade-Investment, Promotion Agency
(KOTRA).
17. Tun, wai and wang, Determinants of private investment in Developing countries, the journal of development
studies, vol. 19, 1982 .
18. UNCTAD, investment Arab world Issues and policies, New York and Geneva, 2002, P. 10.
