6th annual rmb morgan stanley banks showcase - personal · 6th annual rmb morgan stanley banks...
TRANSCRIPT
6th Annual RMB Morgan Stanley Banks showcase
CIB revenue opportunities
29 May 2017
2
-2
-
2
4
6
8
02 04 06 08 10 12 14 16 18 20
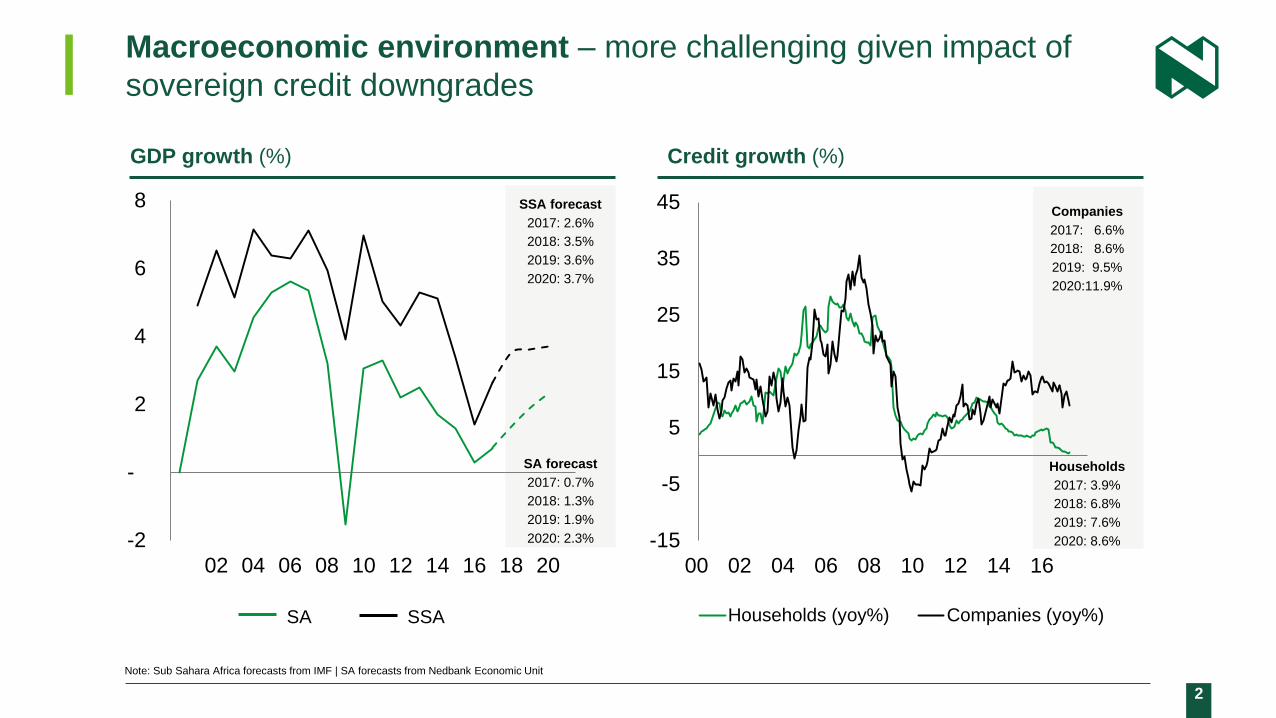
SSA forecast
2017: 2.6%
2018: 3.5%
2019: 3.6%
2020: 3.7%
SA forecast
2017: 0.7%
2018: 1.3%
2019: 1.9%
2020: 2.3%
Macroeconomic environment – more challenging given impact of
sovereign credit downgrades
GDP growth (%)
SA SSA
Note: Sub Sahara Africa forecasts from IMF | SA forecasts from Nedbank Economic Unit
Credit growth (%)
Companies
2017: 6.6%
2018: 8.6%
2019: 9.5%
2020:11.9%
Households
2017: 3.9%
2018: 6.8%
2019: 7.6%
2020: 8.6% -15
-5
5
15
25
35
45
00 02 04 06 08 10 12 14 16
Households (yoy%) Companies (yoy%)
3
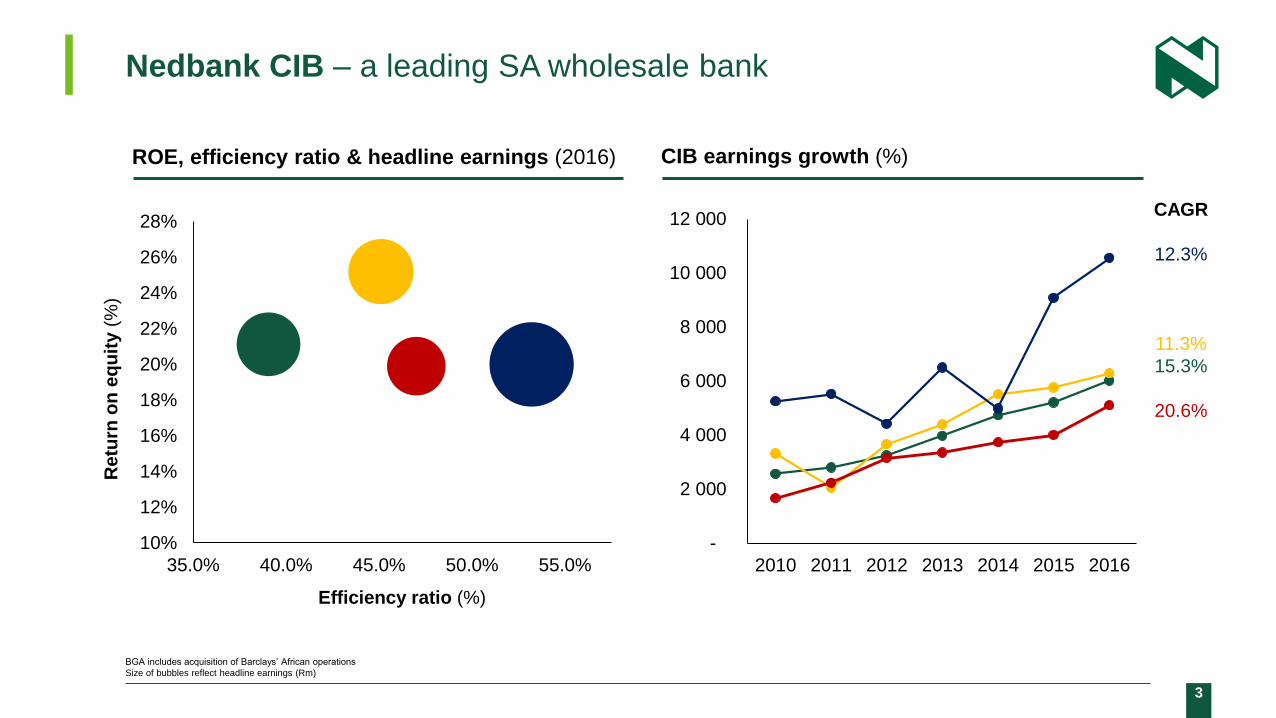
ROE, efficiency ratio & headline earnings (2016)
Nedbank CIB – a leading SA wholesale bank
CIB earnings growth (%)
10%
12%
14%
16%
18%
20%
22%
24%
26%
28%
35.0% 40.0% 45.0% 50.0% 55.0%
Re
turn
on
eq
uit
y (
%)
Efficiency ratio (%)
-
2 000
4 000
6 000
8 000
10 000
12 000
2010 2011 2012 2013 2014 2015 2016
CAGR
12.3%
11.3%
15.3%
20.6%
BGA includes acquisition of Barclays’ African operations
Size of bubbles reflect headline earnings (Rm)
4
Nedbank CIB – a leading SA wholesale bank
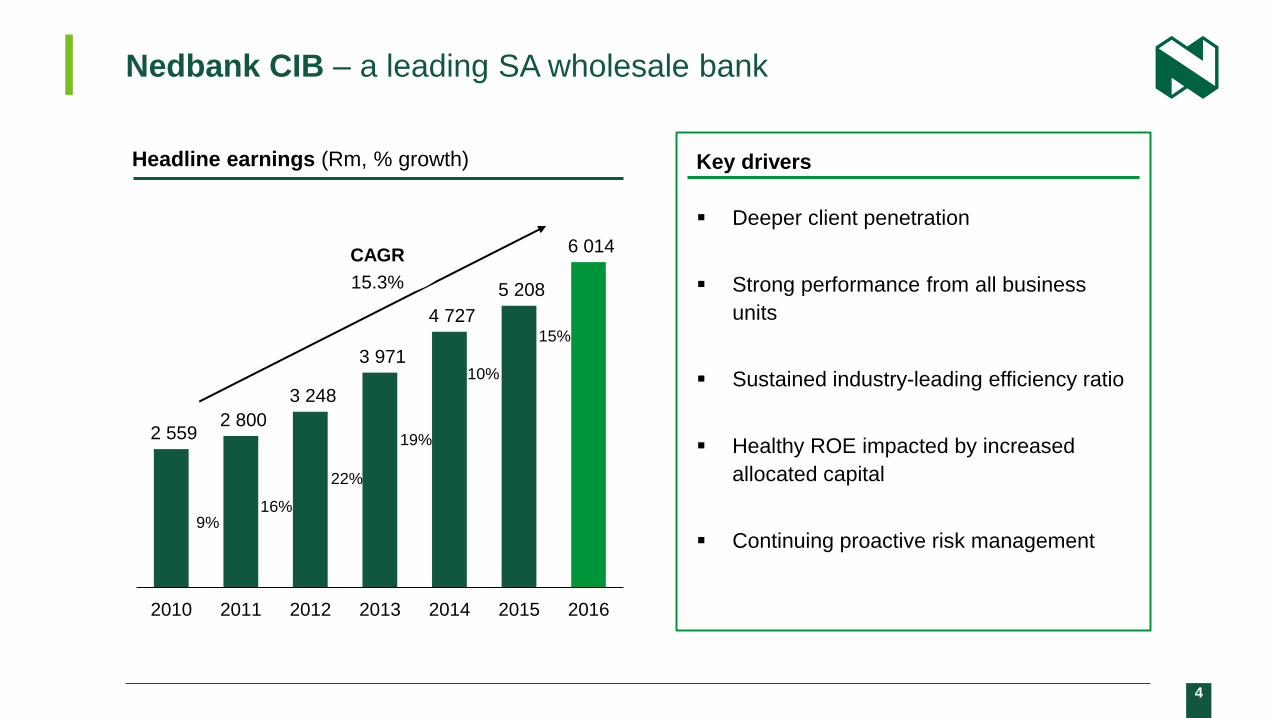
Key drivers
Deeper client penetration
Strong performance from all business
units
Sustained industry-leading efficiency ratio
Healthy ROE impacted by increased
allocated capital
Continuing proactive risk management
2 559 2 800
3 248
3 971
4 727
5 208
6 014
2010 2011 2012 2013 2014 2015 2016
16%
22%
19%
10%
15%
9%
CAGR
15.3%
Headline earnings (Rm, % growth)
5
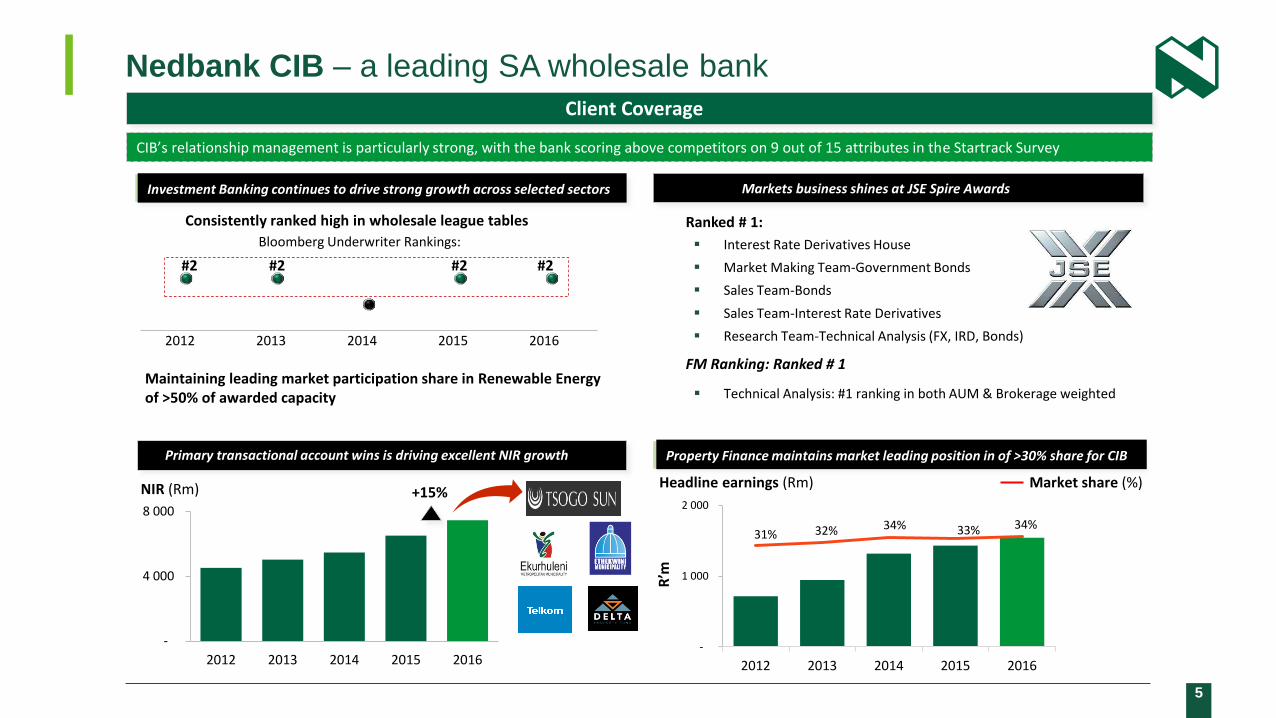
Nedbank CIB – a leading SA wholesale bank
Markets business shines at JSE Spire Awards Investment Banking continues to drive strong growth across selected sectors
Consistently ranked high in wholesale league tables
Maintaining leading market participation share in Renewable Energy of >50% of awarded capacity
2011.5 2012 2012.5 2013 2013.5 2014 2014.5 2015 2015.5 2016 2016.5
Bloomberg Underwriter Rankings:
#2 #2 #2 #2
2012 2013 2014 2015 2016
Primary transactional account wins is driving excellent NIR growth
-
4 000
8 000
2012 2013 2014 2015 2016
+15% NIR (Rm)
CIB’s relationship management is particularly strong, with the bank scoring above competitors on 9 out of 15 attributes in the Startrack Survey
Client Coverage
Property Finance maintains market leading position in of >30% share for CIB
31% 32% 34% 33% 34%
-5.00%
5.00%
15.00%
25.00%
35.00%
45.00%
-
1 000
2 000
2012 2013 2014 2015 2016R’m
Interest Rate Derivatives House
Market Making Team-Government Bonds
Sales Team-Bonds
Sales Team-Interest Rate Derivatives
Research Team-Technical Analysis (FX, IRD, Bonds)
Ranked # 1:
FM Ranking: Ranked # 1
Technical Analysis: #1 ranking in both AUM & Brokerage weighted
Headline earnings (Rm) Market share (%)
6
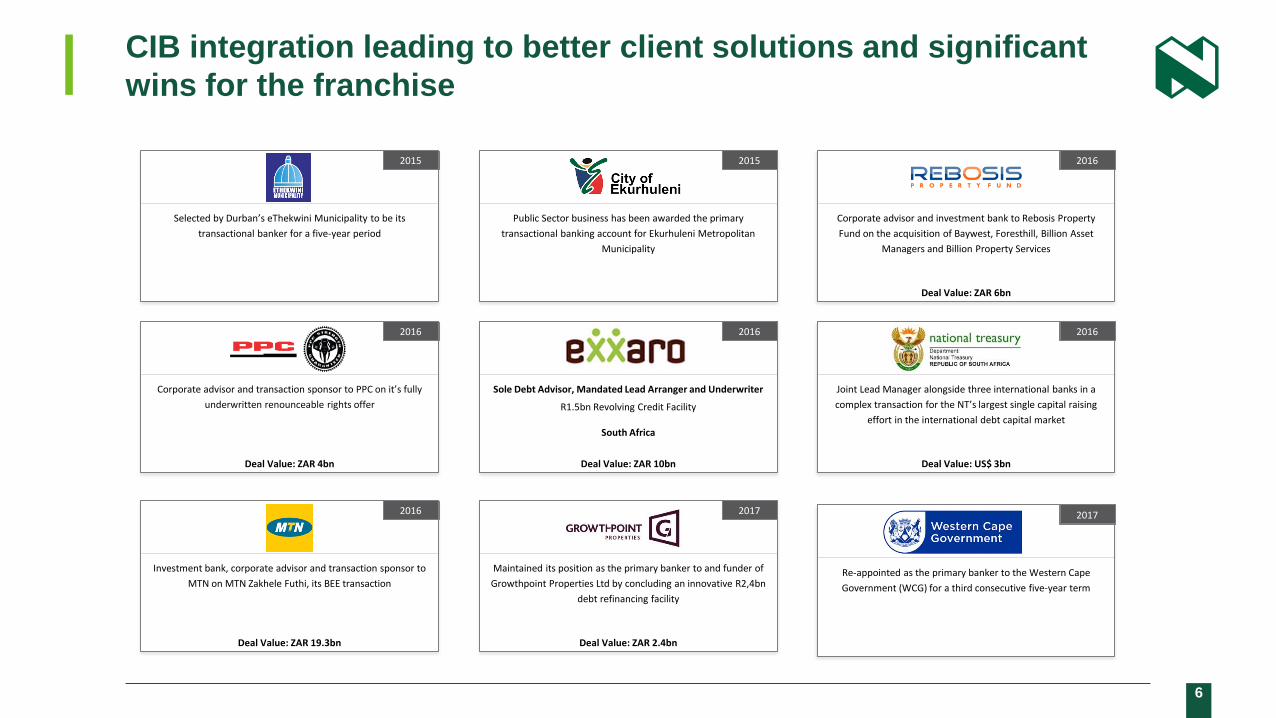
CIB integration leading to better client solutions and significant
wins for the franchise
2013 2016
Deal Value: ZAR 19.3bn
Investment bank, corporate advisor and transaction sponsor to
MTN on MTN Zakhele Futhi, its BEE transaction
2013 2016
Deal Value: ZAR 6bn
Corporate advisor and investment bank to Rebosis Property
Fund on the acquisition of Baywest, Foresthill, Billion Asset
Managers and Billion Property Services
2013 2016
Deal Value: ZAR 4bn
Corporate advisor and transaction sponsor to PPC on it’s fully
underwritten renounceable rights offer
2013 2016
Deal Value: ZAR 10bn
Sole Debt Advisor, Mandated Lead Arranger and Underwriter
R1.5bn Revolving Credit Facility
South Africa
2013 2016
Deal Value: US$ 3bn
Joint Lead Manager alongside three international banks in a
complex transaction for the NT’s largest single capital raising
effort in the international debt capital market
2013 2015
Public Sector business has been awarded the primary
transactional banking account for Ekurhuleni Metropolitan
Municipality
2013 2015
Selected by Durban’s eThekwini Municipality to be its
transactional banker for a five-year period
2013 2017
Deal Value: ZAR 2.4bn
Maintained its position as the primary banker to and funder of
Growthpoint Properties Ltd by concluding an innovative R2,4bn
debt refinancing facility
2013 2017
Re-appointed as the primary banker to the Western Cape
Government (WCG) for a third consecutive five-year term

7 NEDBANK GROUP LIMITED – Annual Results '16 AR
28
%
32
%
24
%
20
%
52
%
35
%
52
%
45
%
72
%
68
%
76
%
80
%
48
%
65
%
48
%
55
%
NII NIR Impairments Expenses Headlineearnings
Capital Advances Deposits
CIB Rest of Group
Nedbank CIB contribution to Nedbank Group (2016)
Nedbank CIB – a key driver of group profitability

8
Advances – good historic pipeline conversion
Average loans & advances (Rbn)
Investment Banking converting strong pipeline in
strategic sectors
Margins maintained despite competition for high-
quality assets & additional regulatory costs
Quality of investment-grade book improved
(to 73% of book from 68% in 2015)
Active risk management across distressed
sectors
Key drivers (2016 YE)
1 Total banking defined as Investment banking & client coverage combined.
-
50
100
150
200
250
300
350
2012 2013 2014 2015 2016
Total banking Total property finance Other1
10%

9
NIR – growth across all categories
Key drivers (2016 YE)
Integrated business enabling:
− stronger client relationships
− deeper client penetration
− transactional banking client gains
Trading-income growth from increased trading activity
driven by increased market volatility & dealflow
Successful primary transactional account wins of top−
tier clients contributes to excellent fee & commission
growth
NIR (Rm)
16%
19%
+14.5%
6 508
7 453
2012 2013 2014 2015 2016
Trading income Fees & comms
Private equity & other
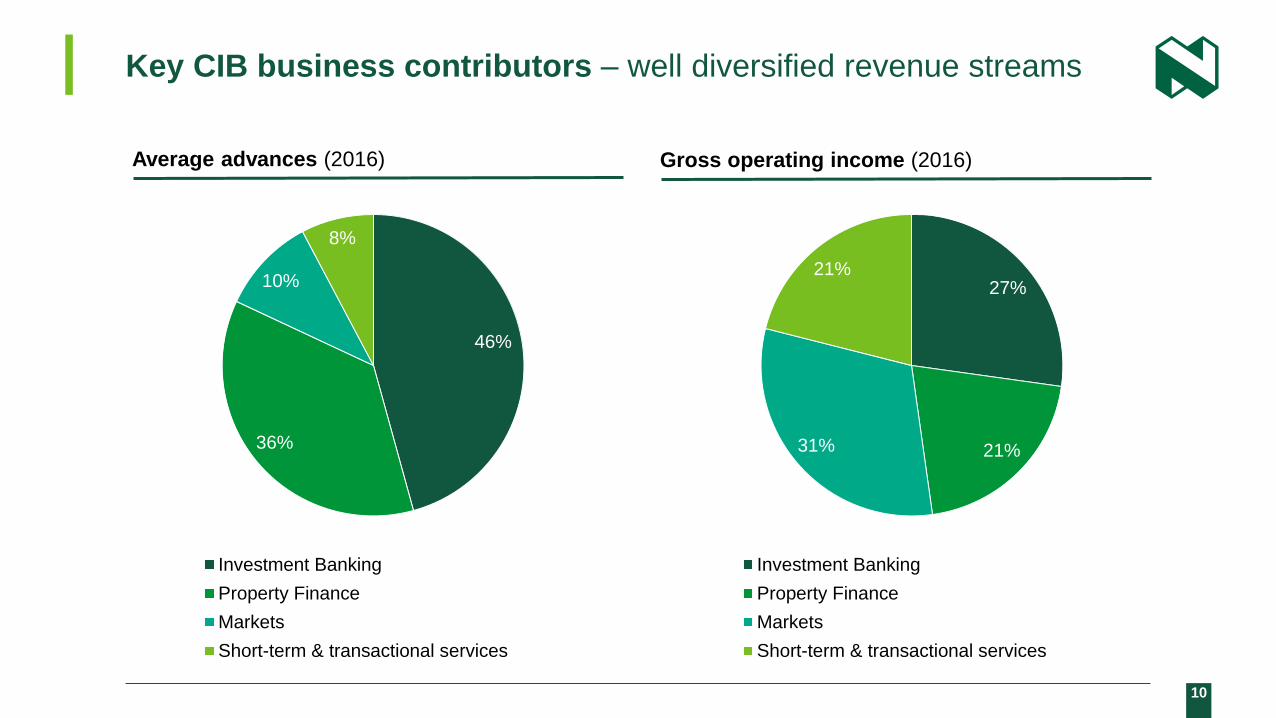
10
46%
36%
10%
8%
Investment Banking
Property Finance
Markets
Short-term & transactional services
Average advances (2016)
Key CIB business contributors – well diversified revenue streams
Gross operating income (2016)
27%
21% 31%
21%
Investment Banking
Property Finance
Markets
Short-term & transactional services

11
Investment banking – well positioned when business confidence
improves
Average loans & advances (Rbn)
Converting strong pipeline in strategic sectors,
but delays given economic & political concerns
Active risk management across distressed
sectors
Rest of Africa continues to remain a focus area
SA corporates delaying investment
Key drivers
1 Investment banking & client coverage combined.
-
40
80
120
160
200
2012 2013 2014 2015 2016
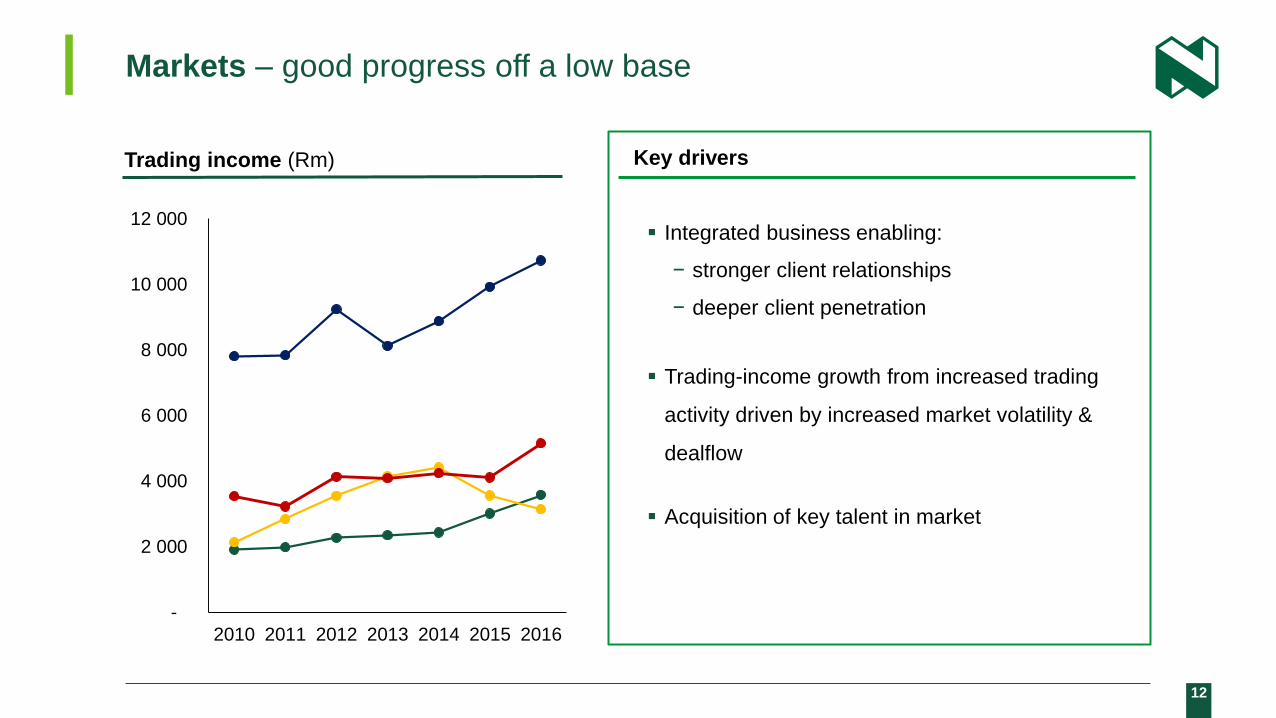
12
Markets – good progress off a low base
Trading income (Rm)
-
2 000
4 000
6 000
8 000
10 000
12 000
2010 2011 2012 2013 2014 2015 2016
Integrated business enabling:
− stronger client relationships
− deeper client penetration
Trading-income growth from increased trading
activity driven by increased market volatility &
dealflow
Acquisition of key talent in market
Key drivers

13
Commercial Property Finance – leveraging our leadership position
Group CPF market share (2010 - 2016)
Leverage leadership position – access to major
deals (good risk profile)
Cross sell opportunities – hedging, transactional
Re-building the private equity book
Leverage relationship & expertise to expand into
rest of Africa
Key drivers
0%
5%
10%
15%
20%
25%
30%
35%
40%
45%
NED FSR BGA SBK
2012 2013 2014 2015 2016
1: Source - MSCI Survey of total commercial property market including asset managers, bonds & other non-banking exposures)
10 – 15% market share of
total commercial property¹

14
Client initiative
Grow transactional
banking & deposits
People
Rest of Africa
Strengthen client relationships
Enhance cross-sell
2020 targets
Leading Markets business in
SA
Maintain leading role in
Property & Renewables
Increase market share through
primary banking wins
Deepen advisory led franchise
Improve NIR / Advances
Focus on maintaining leading
efficiency ratio
Strategic growth drivers
Strategic portfolio tilt
Scale & efficiency
Focus on innovative transactional &
liquidity solutions
Selectively grow into Africa utilising our
deep sector expertise
Roll out a number of differentiated &
selective growth strategies
Aggressive attrition management
Changing the way business is done
Enhance our human capital offering
through a comprehensive People strategy

15
Client centricity - providing a single client offering through improved
cross-sell of products
New Client
Intelligence Platform
that will allow CIB to
optimally serve our
clients Executive EySightTM

16
Transactional services – business model has adapted to a dynamic
& evolving banking landscape
Historically, there was a limited focus
on transactional banking
Transactional services became a key
Nedbank CIB pillar
TS now faces a commoditised and
competitive environment
Client requirements relatively simple
Limited focus on wholesale banking
products outside of lending
Limited investment in transactional
banking capabilities
Late 90’s
to early
2000’s
Client requirements evolved
Clients multi-banked with a strong
focus on product and service offerings
Significant investment to enhance
products & plug product gaps
Transactional services aligned with the
Group’s strategy of NIR growth
Early
2000s to
mid 2010’s
Client’s seek differentiators, e.g. VAS,
enhanced client experience
Dynamic regulatory environment
(Basel III and liquidity implications)
Focus on addressing the working
capital requirements of our clients
Investing in initiatives to combat the
threat of non-banking & FinTech
competitors
Looking
ahead

17
Transactional services – key factors drive the client decision
making process in selecting their primary bank
Factors contributing to a winning TS franchise Market-leading
Source: KPI Research: 2016 Business Electronic Banking and Corporate & Business Banking Tracking Study, TMS Research: Criteria Impacting Bank Selection – Importance vs. Performance.
Product features and functionality
Pricing and value for money
Ecosystem for working capital
Sophistication of electronic banking
Risk appetite for working capital
Ability to understand client’s business needs
Quality of personnel
Ability to cross-sell
Integration of platforms and systems
Brand reputation
Service levels
Relationship with banker/primary contact
Competitiveness of TS franchises
Nedbank viewed as a market-leading
corporate transactional bank
Nedbank has continually improved its
position across all key factors since 2013
Market-
leading
Trailing
Nedbank
2013
Nedbank
current
Trailing
Competitor
Bank
Competitor
Bank
Competitor
Bank
We have made significant strides towards positioning
ourselves as a market leading TS franchise

18
Transactional services – our strong performance to date has been
supported by 5 key strategic initiatives
CIB Transactional Services NIR trajectory
Holistic working capital client view
Focussed liability acquisition
Integrated banking platform
Product & channel
innovation
Growth in primary banked clients
2012 2013 2014 2015 2016
11% CAGR
Growth supported by
our strategic initiatives

19
Rest of Africa
Bank of China & Nedbank
Completed six client-facing
transactions over the last year
across multiple sectors.
Continue to work together to
deliver innovative solutions for
their clients in Africa and Asia
CIB deals completed
in Rest of Africa
20
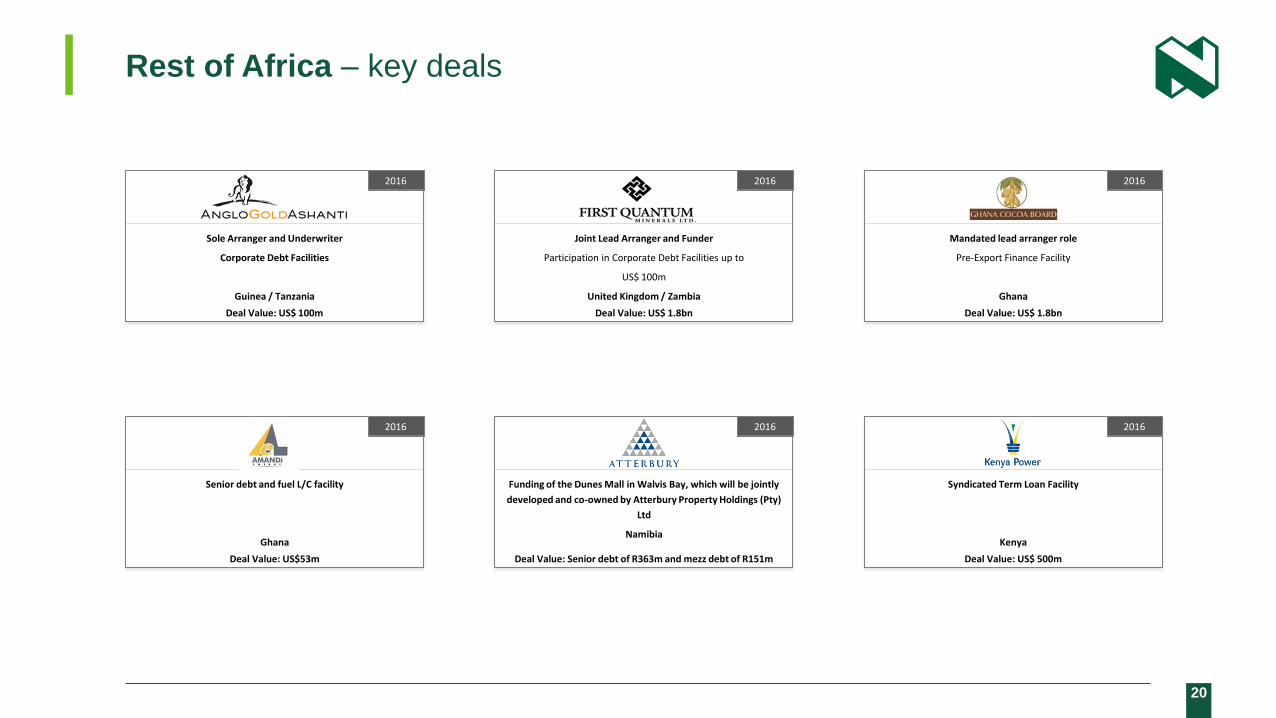
Rest of Africa – key deals
2013 2016
Deal Value: US$ 100m
Sole Arranger and Underwriter
Corporate Debt Facilities
Guinea / Tanzania
2013 2016
Deal Value: Senior debt of R363m and mezz debt of R151m
Funding of the Dunes Mall in Walvis Bay, which will be jointly
developed and co-owned by Atterbury Property Holdings (Pty)
Ltd
Namibia
2013 2016
Deal Value: US$ 1.8bn
Joint Lead Arranger and Funder
Participation in Corporate Debt Facilities up to
US$ 100m
United Kingdom / Zambia
2013 2016
Deal Value: US$ 1.8bn
Mandated lead arranger role
Pre-Export Finance Facility
Ghana
2013 2016
Deal Value: US$53m
Senior debt and fuel L/C facility
Ghana
2013 2016
Deal Value: US$ 500m
Syndicated Term Loan Facility
Kenya

21
Outlook for CIB revenue opportunities
Current environment – drawdowns slow, repayments & limited levels of new investment
Continued focus on deeper client penetration
Embedding client intelligence platforms to enhance our value proposition
Growing transactional & deposits – a key focus areas
Continued commitment to expanding our Africa presence
Proactively acquiring & retaining top talent at all levels
Continue to leverage franchise to unlock revenue growth opportunities in Markets
business
Increasing focus on expense growth in challenging growth environment
22 AR
Contact us
Disclaimer
Nedbank Group has acted in good faith and has made every reasonable effort to ensure the accuracy and completeness of the information contained in this
document, including all information that may be defined as 'forward-looking statements' within the meaning of United States securities legislation.
Forward-looking statements may be identified by words such as ‘believe’, 'anticipate', 'expect', 'plan', 'estimate', 'intend', 'project', 'target', 'predict' and 'hope'.
Forward-looking statements are not statements of fact, but statements by the management of Nedbank Group based on its current estimates, projections,
expectations, beliefs and assumptions regarding the group's future performance.
No assurance can be given that forward-looking statements will prove to be correct and undue reliance should not be placed on such statements.
The risks and uncertainties inherent in the forward-looking statements contained in this document include, but are not limited to: changes to IFRS and the
interpretations, applications and practices subject thereto as they apply to past, present and future periods; domestic and international business and market
conditions such as exchange rate and interest rate movements; changes in the domestic and international regulatory and legislative environments; changes to
domestic and international operational, social, economic and political risks; and the effects of both current and future litigation.
Nedbank Group does not undertake to update any forward-looking statements contained in this document and does not assume responsibility for any loss or
damage whatsoever and howsoever arising as a result of the reliance by any party thereon, including, but not limited to, loss of earnings, profits, or consequential
loss or damage.
Nedbank Group
nedbankgroup.co.za
Nedbank Group Limited
Tel: +27 (0) 11 294 4444
Physical address
135 Rivonia Road
Sandown
2196
South Africa
Nedbank Investor Relations
Head of Investor Relations
Alfred Visagie
Direct tel: +27 (0) 11 295 6249
Cell: +27 (0) 82 855 4692
Email: [email protected]
Investor Relations Consultant
Penny Him Lok
Direct tel: +27 (0)11 295 6549
Email: [email protected]