636 developing and assessing concepts wnigting: …
TRANSCRIPT

,AD-A193 636 DEVELOPING AND ASSESSING CONCEPTS FOR FUTURE US AY 'WNIGTING: A PROGRESS REPORT(U) RAND CORP SANTAMONICA CA P J RNOAP66RN-2630-A
UNCLASSIFIED NDRS3-66-C-665:9 EOAR 9RN/ F/G 15/6 H

MN;ROCOPV RESOLUtIM TEST CHAMl
mw qw w q- M - - -
4, ._ _____ ___A6

A A*
ITI0 Rssbplp wiAm~s.&~ Onub foCPW
* S.Any m~i~g:A gsssAhof
RA*90 4 smm
* *t
RAND
.,S.,
?4-T
'k. ' ..
TheBAN Pbliaton wi 7b Rpor i th pincpa puliatin ocuen
C" an -mn~tRN' ajrrsac npad ia eerhrsls
Th ADNt eprsohrotpt fpnoedrsac o gnrldsr
butkwL Pubicaion ofTeRN oprtoIo o ee elc h
n~~~isam~ ~ ~ or poice oftesosr fRN eerh
Published byTRN vprto
170 Ko tet4..Bx23.Sat oia A9423
UX

UNCLASSIFIEDSaCuRITY CLASSIFICATION Op Twins PAGE ("hon Dt 80,01,040'
REPORT DOCUMENTATION PAGE BVR OP9IGFR-- ma NUA1M a. GOV-T ACC. INN.3 ACIECIPIENSCA TAGNUSEW
N-2630-A S Y9O CSIT&P0C OCC4. TITLC food Sumste) YEFRPRTIPPO OE
Deve loping and Assessing Concept; for Future- InterimU.S. Army Warfighting: A Progress Report 4. pearFommilo Oo. REPORT puM*E90
?.~S CUUN~ONTRAC 00 GRANT MIUMUENVI,
Philip J. Romero MDA903-86-C-0059
S. p90m1ORuW~to ORGA141ZATION NAME AND ADDRESS 10. PROGRAM CLZMEN T. PROJ CCT. T ASKAREA 6 WORK UNIT N6UMGCAl
The LAND Corporation1700 Main StreetSanta Monica, CA 90406 ______________
It. CONTROLLING OFFICE NAMVE AND LOORESS Is. REPORT DATE
Office of the Deputy Chief of Staff, Logistics April 1988Headquarters United States Army 13 NMUER OF PAGES
Washington, DC 20310 41I&. MONITORING4 AGENiCY NAMEC 6 A000RESS(II difleutt hern CentWiald 0184e) WS. SECURITV CLASS. (of thg. 'opoif)
Unclassified
14. 0ISTI8UTION STATEMENT (of thi. Rhpeow)
Approved for Public Release; Distribution Unlimited
M? OISTIuTION STATEMENT (of the abstract ufiffed In BWook it iffeet "M Rt
No Restrictions
(t K EY wOIRDS (contiuean powteo sideo f neioommy and idenfyI by Week nIANIO)
-Military Doctrine Materiel,Army Planning, Operations Research,Models,
20ADSTRAC T (Continuan revrs sooaide#$S necessary andi dentify by &Joe* ammo)
See reverse side %
DID I pr~f"7 1473 UNCLASSIFIEDSECURITY CLASSIFICATION OF TNIS PAGE 'Who" 0.1. Euaee..i)

JOL A" I .. F I - a - ' u ' ' .. . .. ........ ....
%4CuV TV CLASIUPICAION OF TIS PAGOI(WIh OOa
The U.S. Army's concept-based requirementssystem stipulates that future materielrequirements should be based on a conceptof warfighting that has undergone extensiveanalysis and refinement. This Note reportson the progress of an ongoing RAND effortto develop a method to help systematize andstreamline the process of designingconcepts. RAND's model will provide afirst-order estimate of the forces andresrces needed to met specified theatersuccess goals for alternative conceptdesigns. The model is meant to be flexibleand fast-running, in order to serve as atool for the exploration of new conceptideas. Analysts using the model will beable to experiment with variations inoperational policy, examine the payoffs ofimproved technical performance, and conductsensitivity analysis to identify robustconcepts.K
61N
UrNCLASS I Pl nSI[CURITY CL.AZItCAIC01oN oIr halS fGl me efff~m
Wl lot

A RAND NOTE N-2630-A
Developing and Assessing Concepts for FutureU.S. Army Warfighting: A Progress Report
Philip J. Romero
April 1988
Prepared forThe United States Army
DTICfELECTE fMAY 25 1988D
RADAPPROVED FOR PUBLIC RELEASES DISTRIBUTION UNLIMITED

- iii -
PREFACE
The Arroyo Center's "Future Warfighting Concepts and Technologies"
project is aimed at developing improved methods for designing and
evaluating Army warfighting concepts and forecasting the technical
capabilities of future weapons systems. Two of the project's tasks are:
to develop a framework for systematically developing new concepts
(sponsored by the Deputy Chief of Staff for Doctrine. U.S. Army Training
and Doctrine Command) and to design a method for exploring concept ideas
and assessing their performance quantitatively (sponsored by the
Commander, TRADOC Analysis Center). This Note reports on RAND's
progress in performing the latter task, namely, developing an aggregate,
theater-level model that will serve as a tool in the design and
evaluation of new warfighting concepts. When completed, it is
anticipated that the model will be used by the TRADOC Analysis Center as
a screening tool in an ongoing study of the Army 21 operational concept,
and by RAND as one starting point for its efforts to design improved
procedures for the development of future concepts.
This Note should be of interest to specialists in doctrine and
operations analysis, and to those involved in military policy analysis
methods. The work reported here was performed in the Applied Technology
Program of the Arroyo Center.
The Arroyo Center
The Arroyo Center is the U.S. Army's Federally Funded Research and
Development Center for studies and analysis operated by The RAND
Corporation. The Arroyo Center provides the Army with objective,
independent analytic research on major policy and management concerns,
emphasizing mid- to long-term problems. Its research is carried out in &I
five programs: Policy and Strategy; Force Development and Employment; flReadiness and Sustainability; Manpower, Training, and Performance; and td ,
Applied Technology. .
DitributIozU/ _
/ AvailabilitY Codes{Aval an/or"Diat specil
D1
OWNS -: '-6 - OM' '" "

- iv -
Army Regulation 5-21 contains basic policy for the conduct of the
Arroyo Center. The Army provides continuing guidance and oversight
through the Arroyo Center Policy Committee, which is co-chaired by the
Vice Chief of Staff and by the Assistant Secretary for Research,
Development, and Acquisition. Arroyo Center work is performed under
contract MDA903-86-C-0059.
The Arroyo Center is housed in RAND's Army Research Division. The
RAND Corporation is a private, nonprofit institution that conducts
analytic research on a wide range of public policy matters affecting the
nation's security and welfare.
Stephen N. Drezner is Vice President for the Army Research Division
and Director of the Arroyo Center. Those interested in further
information concerning the Arroyo Center should contact his office
directly:
Stephen M. Drezner
The RAND Corporation
1700 Main Street
P.O. Box 2138
Santa Monica, California 90406-2138
Telephone: (213) 393-0411
S
S, VO0
SWI
s 4% -p.

"V
EXECUTIVE SUMMARY
This Note reports on the progress of an ongoing RAND effort to
build a tool that will assist in systematizing and streamlining the
development of future Army warfighting concepts. In our view, the
process of developing concepts is hampered because of the absence of a
framework that can describe a concept's important characteristics
rigorously, and where possible, do so in quantitative terms. The
evaluation and refinement of concepts, particularly those for relatively
distant futures (10 or more years), are similarly impeded because (1)
there can be a wide variety of versions of a particular concept, all of
which may require study, and (2) our uncertainty about the future
mandates that each version be examined under a range of possible future
conditions. RAND's warfighting concept screening model will permit
concept developers and analysts to quickly explore and appraise a large
number of concepts under a wide range of assumptions. To achieve
this, the model incorporates three features:
a generalized (but quantitative) activity-oriented description
of "operational policy," that can describe a wide range of
concepts by varying policy variables;
" an aggregated treatment of operations in a theater that uses
hierarchical "proxy variables" to represent subordinate
components;
" calculations that use simple equations organized in a"spreadsheet" format on a personal computer, allowing analysts
to instantaneously observe the effect on outputs of changes in
inputs.
The model produces estimates of the amounts of resources--combat
and support units, consumables, and personnel--that would be needed by-f -44
any specified concept to achieve a minimum level of success in a combat
theater. When analysts can project the amounts likely to be available,
then concepts can be "screened" based upon their resource needs. VNV

-vi-
Theater success criteria and the size of the threat determine the
number of threat units that must be destroyed within some maximum time
period or by some penetration distance. Each of six types of units
(three combat, one headquarters, and two support) must engage in a set
of activities in order to participate in the destruction of a threat
unit. These activities together are referred to as the unit's duty
cycle. Different warfighting concepts can be represented by
constraining activities in the duty cycle. Within these constraints,
the equations in the model calculate the amount of time each unit would
take to perform each of its activities; based upon the time required,
requirements for other resources are also estimated. The equations are
deliberately based upon simple relationships derived from classical
combat theory, simple geometry, or common sense. The resources required
per destroyed Red unit can be cumulated for all Red units that require
destruction to produce an estimate of the total forces, supply units,
and consumables needed.
Besides screening concepts based upon resource needs, the model
also permits analysts to examine the leverage that could be gained from
alternative performance improvements (such as technologies that could
improve mobility vs. those supporting lethality). Because the elements
included are of necessity highly aggregated, there cannot be a one-
to-one relationship between model inputs and "real-world" attributes.
For instance, improved mobility could result from better engines,
lighter chassis, or entirely new types of vehicles, all of which are
reflected in the "proxy" of unit movement rates. Although the model
cannot estimate the payoff of specific system improvements, it can point
out general tradeoffs among classes of capability improvements, and in
particular, note how the payoffs of technical improvements differ for
different warfighting concepts. ..4.
The immediate use of the model will be in a study of the Army 21
concept under way at the TRADOC Analysis Center (TRAC). The model has
been designed to accommodate a wide range of alternative warfighting
concepts. When TRAC receives the model in the Summer of 1987, they will
be able to use it to further define the Army 21 concept and screen
through its many possible versions. At the same time, RAND continues
VIM0

-vii 0
efforts to develop a more systematic framework for concept development.
RAND will use the model experimentally to explore alternative concepts
and to appraise the advantages and limitations of its use as a device to
increase the rigor and the efficiency of the concept development
process.
r,. I1.4

- ix -
ACKNOWLEDGMENTS
Several people inside and outside the Arroyo Center have provided
valuable assistance to the project. James Hewitt participated in
countless hours of blackboard sessions, patiently helping the author
think aloud. James Bigelow and Bruce Goeller helped articulate the need
for an automated, aggregate method for "screening" warfighting concepts.
Finally, Colonel James Pittman, USA, the project's action officer at
TRAC, has been generous with his time and insight and has supported the
necessary compromises in detail that kept the complexity of the model
within practical limits.
N .
%
%
0
-X% %
.% e
-.0
. •
% ';
-xi -
CONTENTS
PREFACE ........................................................... iii
EXECUTIVE SUMMARY ................................................ v
ACKNOWLEDGMENTS .................................................. ix
FIGURES .......................................................... x iii
Section
I. INTRODUCTION ............................................. 1
II. THE NEED FOR A DESIGN/SCREENING METHOD IN THE EVALUATION OFWARFIGHTING CONCEPTS ...................................... .. 4
An Unspecified Concept .................................... 4Technology and Force Structure Policy Choices ............. 6Uncertainty About Future Conditions ....................... 7
III. MODELING APPROACH AND OPERATION ........................... 10
IV. USES FOR MOSCOW ............................................ 17
Policy Analysis Example: Identifying Promising TacticalForce Ratios For Blue Attacks ........................... 18
Sensitivity Analysis Example: How the Payoff From aTechnological Improvement Varies Across DifferentVersions of a Warfighting Concept ....................... 20
V. PROGRESS TO DATE AND FUTURE WORK ON THE SCREENING MODEL INSUPPORT OF TRAC ARMY 21 STUDY ............................. 23
VI. FUTURE WORK TO SUPPORT THE DEVELOPMENT OF WARFIGHTINGCONCEPTS .................................................. 25
A Framework for Systematically Describing and ComparingConcepts . ................................................ 25 M ,
A Tool for Exploring and Refining New Concepts ............ 27
U
" '.

-xii-
Appendix
A. AN OVERVIEW OF THE CONCEPT SCREENING MODEL....................29 7W
B. SOME MOSCOW VITAL STATISTICS.................................39
BIBLIOGRAPHY ..................................................... 41
SEEM -w~l

-xiii-
FIGURES
1. Methodological challenges to the analysis of Army 21 .... 5
2. "oPrediction" vs. "needs" theater modeling approaches .... 11
3. MOSCOW modeling approach.................................... 13
4. Information flow in MOSCOW.................................. 14
5. A CCF duty cycle............................................ 16
6. Swarm activity ............................................. 18
7. Total CCFs required in a 45-day campaign......................19
8. Components of total cycle time...............................21
9. Payoff of higher mobility................................... 22
r, C Cr "r M
P.1

I. INTRODUCTION
A frequently expressed concern of military long-range planners is
that the specifications for weapons systems used by the research and
development community typically are rarely based upon any coherent,
internally consistent concept of how the system might be used in wartime
(especially in combined operations with other systems). Often systems
designs end up responding to the requirements of the particular Army
functional area or branch that will be the system's principal user,
without sufficient attention paid to the system's employment in combined
operations. Thus, while the design of each weapon in the force may be
optimized in terms of its particular measures of performance and its own
concept of operations, there can be no assurance that their combined
performance is all it can be unless there is some common framework--
i.e., some integrated view of the roles and missions of each system on
the battlefield--that coordinates the individual components.
The Army's chosen policy to attempt to establish a common framework
from the top down is the Concept-Based Requirements System (CBRS).* It
stipulates that a concept of operations is a necessary prerequisite to
the development of force structure or materiel requirements.
Furthermore, CBRS specifies that an overarching or "umbrella"
operational concept, which describes in broad terms the sequence of
operations of Army forces, should define component roles and missions so
as to guide its subordinate mission-area concepts.
The design of any concept of operations involves two fundamental
tasks:
A forecast of the conditions under which Army forces might have
to fight, including elements over which the U.S. Army has no
control (such as threat forces) or incomplete control (such as
the performance of future U.S. weapons).
'CBRS is described in TRADOC Regulation 11-15, "Concept BasedRequirements System." The role of operational concepts in the combat Sdevelopments process is described in TRADOC Regulation 11-16,"Development and Management of Operational Concepts."

-2-
* A judgment on which of a vast array of possible concepts are
preferred.
Both of these tasks can be extraordinarily difficult to accomplish. The
time required to develop, acquire, and field a major weapons system can
frequently exceed ten years, and fielded systems can easily remain in
the force for 20 years more. Since the time horizon of the forecast
must be in excess of 20 years, there is bound to be great uncertainty
about future conditions. Some concepts that perform quite well under
one set of plausible future conditions may do poorly under others. A
common approach to the treatment of uncertainty is sensitivity analysis.
Several analyses are conducted, varying the assumed value of one or more
uncertain factors to assess their effects on the outcome. Since it is
highly unlikely that any single concept will perform the "best" across
all plausible assumptions, the best that can probably be expected is to
choose a concept that does "tolerably well" across a fairly wide range
of plausible conditions. If the process of producing the judgment
includes a quantitative component, it is likely to be fairly time-
consuming and expensive.
This Note reports on the progress of an ongoing RAND effort to
develop a model to assist in systematizing and streamlining the concept
design process. The modeling effort is one of three tasks of the
RAND/Arroyo Center's "Future Warfighting Concepts and Technologies"
project, jointly sponsored by the Deputy Chief of Staff for Doctrine,
Training and Doctrine Command (TRADOC); the Commander, Laboratory
Command, Army Materiel Command; and the Commander, TRADOC Analysis
Center (TRAC).
The modeling task has both an immediate and a farther-reaching
objective. Pursuant to the principles of CBRS, in the early 1980s the
Army initiated an effort to develop an "umbrella" operational concept ,
for the early 21st century (2005 to 2025), currently known as Army 21.2
The concept calls for U.S. (hereafter, "Blue") units to operate
2The most recent unclassified description of the Army 21 concept iscontained in U.S. Army Training and Doctrine Command (TRADOC), Army 21 0Interim Operational Concept, First Edition, Second Coordinating Draft,June 1985.
W.

3-
independently, sometimes deep in the enemy's (hereafter, "Red's") rear
area, engaging in offensive operations to attrit, disrupt, and
eventually defeat Red ground forces. As mandated by CBRS, the interim
concept that was produced in 1985 is scheduled to undergo an extensive
quantitative evaluation by the TRADOC Analysis Center. The first use of
the model outlined in this Note will be to support the refinement of the
Army 21 concept that is integral to TRAC's evaluation. Sections II
through V describe RAND's progress to date on the model in terms
pertinent to its anticipated use in TRAC's evaluation.
While precipitated by the Army 21 evaluation study, the model's
broader purpose is to serve as a tool to assist concept designers in
exploring new concept ideas in a more systematic and efficient manner.
Section VI illustrates areas where we feel that the model, though
initiated with the Army 21 concept in mind, is sufficiently general to
reflect a range of concepts. Section VI also describes our preliminary
thoughts on the use of this approach in the design of new concepts.
Finally, App. A defines the key input variables and performs an
illustrative calculation, and App. B summarizes the key attributes of
the model.
MAP 110

-4 -
II. THE NEED FOR A DESIGN/SCREENING METHODIN THE EVALUATION OF WARFIGHTING CONCEPTS
RAND's most recent involvement in warfighting concept evaluation
began in December 1985, when two weeks of working sessions were held
with staff members from TRAC/Fort Leavenworth to assist them in
developing a plan for their study of the Army 21 concept. While the
method described in this Note uses the Army 21 concept for illustration,
it is equally applicable to other future concepts. From the outset,
TRAC's intent was to make its study as rigorous and quantitative as
possible. These approaches are considered TRAC's strengths, and the
analysts were skeptical of the value to the Army of a predominantly
qualitative evaluation. The study plan embodied a recognition that
several methodological challenges, listed in Fig. 1, had to be faced
squarely.
AN UNSPECIFIED CONCEPT
The interim operational concept describes a sequence of operations
by Army combat units, but remains silent regarding some aspects that are
crucial to a quantitative analysis. For example, the concept states
that some Blue units will operate under dispersed conditions in the
enemy's rear area, then mass to attack a chosen target, before
disengaging and dispersing to reduce their vulnerability. Unspecified
are:
0* What fraction of Blue forces operate offensively in the enemy
rear, and what fraction operate defensively in his path?
* What force ratio does Blue desire to achieve when he masses?
* How much Red attrition does Blue wish to achieve in each
attack, or how long should his attack last before he breaks
off?
0 What mix of direct and indirect fire does Blue use in his
attacks?'
'The Army 21 concept also includes a number of assumptionsregarding improvements in the technical performance of Blue equipment;

Challenge Implication
Concept not fully specified Need to design concept versionsthen evaluate
Versions can mix a wide range of Need to be able to examinecomponents (forces vs. operations tradeoffs among componentsvs. technology)
Time horizon far in future Need extensive sensitivity analysisto find robust versions
0 CONSEQUENCES:- Problem too big and "'squishy" for traditional, detailed
combat assessment models. Need to design and evaluatemany concept versions.
- Methods must be "inexpensive" but insightful.
Fig. 1 -- Methodological challenges to the analysis of Army 21
Noting these omissions does no discredit to the designers of the
concept, since these are hard questions and any answer given in the
absence of analysis would be highly arbitrary.2 However, in their
several of them are controversial. Such assumed capabilities will alsobe indirectly influenced by doctrine. They must be treated as uncertainin sensitivity analyses.
2Such specifics would have been arbitrary, but not without value.Eventually they must be provided to give the evaluation a set of Sstarting inputs. In our observation, the concept designers have beenreluctant to describe their concept in these kinds of quantifiableterms. It may be due to a fear that an "off-the-cuff" answer will takeon exaggerated importance when used by analysts from anotherorganization. Nevertheless, for a quantitative analysis to beperformed, these starting points must come from somewhere. They will be S
0

-6-
absence it is a misnomer to refer to the operational concept as if it
were a unitary, fully-defined entity. Rather, there are many possible
versions of the concept. The TRAC study is therefore less an evaluation
of a single concept than it is a search among many potential versions of
the concept to nominate the "superior" versions. Since the differing
versions are not specified in the concept document, TRAC will need to
design them. TRAC must identify the important design variables (such as
the example questions on p. 4) and vary them over a sensible range to
produce an "envelope" of different possible versions, distinguishing
among, as in the example questions above, offense/defense mixes,
policies governing initiation and termination of engagements with enemy
units, and various uses of combined arms.
TECHNOLOGY AND FORCE STRUCTURE POLICY CHOICES
While the design variables used in the concept study should
emphasize operational policy (that is, how the theater commander chooses
to use a fixed set of resources), they should not neglect force
structure and technology. A smaller number of more capable combat units
may be able to perform the same job as a less capable larger force.
More important, operational policy is shaped by available technology and
force structure. It would probably not make sense, for instance, to try
to execute a version of the warfighting concept that required combat
units to frequently move great distances across the theater to maintain
an intense pace of operations if technology only allows moderate rates
of movement. Thus the "envelope" will include mixes of technological
and force structure policy as well as operational policy. j
,
produced by the analysts responsible for the evaluation if no superiorsource is forthcoming. TRAC is maintaining the involvement of theconcept designers on several of the study's working groups, so thattheir insight into the concept will be reflected in the study inputs.The study proponent is the Concept Developments Directorate of theTRADOC Combined Arms Concept Development Activity, which wrote Army 21.
* 0
M R
L -ft. . . . . . . VP 11
ENEM
-7-
UNCERTAINTY ABOUT FUTURE CONDITIONS
Since the concept is intended to apply to the 2005-2025 period, use
of a "best estimate" scenario would ignore our large uncertainty about
conditions so far in the future. That uncertainty can be taken into
account only by defining ranges around our "most likely estimates"--
such as a "best case" and a "worst case" estimate--for each of the
variables outside the Blue commander's control (including the
performance of Blue systems). Thus there are three combined scenarios:
when all variables are set to "most likely" values, to "best case," and
to "worst case" assumptions. In practice, there will be
interdependencies among the variables that should make the size of the
scenario space much larger still. Furthermore, techniques that may be
effective in one theater of operations (e.g. Central Europe) might
perform differently in another; if the concept is intended for multiple
environments, then they too should be varied. To assess how robust any
version of the concept is will entail evaluating it throughout the
scenario space.
Taken together, these requirements pose a tremendous challenge to
the study. Instead of one policy to be evaluated in one scenario, there
will be many concept versions, each of which could be analyzed under
many scenarios. Any reader who is familiar with the high-resolution
combat analysis methods used in traditional Army studies will recognize
that it would be impossible to employ them to evaluate such an enormous
set of cases. Resource constraints simply prohibit it.
One element of TRAC's approach has been to organize the study in a
series of stages.3 At each stage, the versions of the concept under
consideration are subject to increasingly rigorous tests, and only those
that succeed pass along to the next stage. Since the analyses at each
stage grow in their depth and complexity, this "filtering" process
serves to reduce the caseload of concept versions. In this way, the
3The TRAC methodology is outlined in Jeffrey Karhohs, PeggyFratzel, and Philip Romero, "Evaluating Future Concepts," a paperpresented to the 25th Annual Army Operations Research Symposium, 8-9October 1986. The published proceedings of this symposium are
forthcoming.

-8-
greatest analytic resources are expended on the most promising versions
of the concept. In the early stages a spanning set of concept versions
will be considered, but necessarily only at a low level of resolution.
Those that fail the early tests are filtered out. In later stages, as
the analysis becomes more detailed or considers a wider range of
scenarios, it need be applied only to the versions that survive the
tests in earlier stages.
RAND identified two crucial tasks that needed to be performed in
the early stages of the TRAC study:
A systematic, internally consistent method of describing
concept versions was needed. This framework must: (a)
incorporate most of the important differences among alternative
versions; (b) be expressible quantitatively, so that the
different versions could be modeled; and (c) be general enough
so that ultimately other concepts quite different from Army 21
could also be described and compared.' We refer to the use of
such a framework to develop concepts as the concept design
stage.
* Once a set of concept versions is described, a method will be
needed for conducting a first-order assessment of the likely
performance of each concept version. RAND refers to the use of
such a method as the screening stage of the analysis.,
Screening techniques such as simple rules of thumb or cost-
benefit estimates have been employed in the past, but the
complexity of operational concepts ruled out such
simplifications. A screening method must be highly efficient
4This framework should at a minimum be capable of capturing theArmy's current doctrine (AirLand Battle), so that the performance of adoctrinal base case can be assessed. The Army 21 concept should becompared to that base case to determine not only whether the concept is"good enough," but whether it is desirable--that is, improves on currentdoctrine. One of the later stages of TRAC's study entails such acomparison of different concepts.
5RAND's nomenclature departs somewhat from the actual terms used inthe TRAC study to preserve generality. However, it is consistent withthe essence of TRAC's study plan.
_ ______0
.MA
-9-
since there would at the early stage of the study be a large
number of possible versions; the TRAC study plan anticipated -
making frequent refinements in the design of the concept. This
implied that (a) the screening technique should be an
automated, closed-form, deterministic model of some kind
(probably not a large simulation) and (b) the model should not
be designed to produce more than a crude, low-resolution, first-
order estimate of the performance of each concept--just enough
to allow TRAC to distinguish the promising candidates from the
unpromising ones.
RAND's principal task in the TRAC study is to build and deliver a
simple, fast-running model that assists analysts in exploring
alternative concept designs, and provides a first-order performance
estimate to permit immediate screening among them, based upon their"1cost" in resources needed to satisfy specified theater objectives.
RAND's modeling effort has used TRAC information on Southwest Asia
(since this is the first theater that will be examined in the TRAC
study), but the model is intended to be readily adaptable to other
theaters.
V• %
0
is -
"p" 4- % .i

-10- 0
III. MODELING APPROACH AND OPERATION
Figure 2 illustrates the differences between our "needs" approach
and the more typical "prediction" model. In a "prediction" model, the
forces that Blue and Red are expected to have available in the theater
are specified as inputs, along with parameters describing the
performance of those forces and the policy governing their operations %
(of which doctrine is a component). Such a model produces an estimate
of the outcome of combat between the two forces (such as movement of the
Forward Line of Own Troops (FLOT)). The analyst compares the predicted
outcome to some success criterion to establish if the specified force
and doctrine performed sufficiently.
In a "needs" model, the outcome of the battle required for success
is specified as an input, and the model estimates the amounts of various
resources (such as combat units) needed to meet the success requirement.
Concepts are screened by comparing the amounts of resources they need
against the amounts that can be expected to be available.
Our modeling approach has emphasized maximizing the model's
efficiency and ease of use after it is transferred to TRAC. Because the
screening model will be required to consider very large numbers of
concepts, it is imperative, in our view, that it is kept as simple as
possible. Furthermore, since the principal responsibility for screening
will remain with TRAC analysts, and not with RAND, excess complexity
would undercut the model's usefulness.
For these reasons, we have deliberately adopted a highly aggregated
structure, using a system of simple simultaneous equations, with 0
aggregated variables used to represent multiple subordinate elements.'
Similarly, we chose to build a "needs" model because we felt that
screening based on resource needs would be less ambiguous and more
efficient than screening based on combat outcome. Finally and most
importantly, the model is being designed to run on a commercially
'When aggregate variables are used in a simple model as asubstitute for more detailed components, we refer to them as "proxy"i0variables.
I 7e A F05, PIJ .~ ~PP P
5j~
5s~~' - '%d 'I

OUTCOME PREDICTION INEEDS ESTIMATION
PLCOTEPOLICY OTHERVAIBE I E ARIABLES V RIANEES
BLUE BLUE SC(IIARISSEtA UCS LESEBEFOC PEUBMREThREAT RTRAPRGMAETRA
MODEL
::.OTCOM U....JINPTS
Fig. - Preitin vs "neds theate moeigapoce
Figur 3 outl iine ou ne"tetr modeling approach.Temdl il esme
the number of units required for each of six unit types:
* Three types of close combat units (known as Heavy, Medium, and
Light Close Combat Forces, or CCFs, in the Army 21 document);
2 The model is named the Method of Screening Concepts of Warfare, or A
MOSCOW.

12 -
* Higher-echelon units that perform command and control functions
and can provide fire support to the close combat units (Land
Battle Forces, or LBFs, in Army 21); 7
* Mobile units that supply the close combat forces (Close Combat
Support Forces, or CCSFs); and
Units that supply the headquarters and its subordinate elements
(Land Battle Support Forces, or LBSFs).
It will also estimate the quantities of resources consumed in the
categories shown. For any concept version that is specified, the model
will calculate the forces, supply units, and resources needed to keep
the starting force at full strength. The analyst can screen by
comparing the amounts needed with the quantities that are projected to
be available.
We have adopted an activity-oriented approach to estimating
resource requirements (including time). First, we have identified the
activities that each unit performs in the course of its mission. (The
CCF and LBF missions are to attack or to defend for a specified period
of time or to impose a specified amount of attrition on the enemy. CCSF
and LBSF missions are to transfer supplies to the CCF and LBF
respectively.) We refer to the set of activities as the "duty cycle"
for a particular type of unit with a particular mission. Duty cycles
are defined for each type of unit. For each type of duty cycle, we have
developed equations that estimate the average amount of time required to
perform each of the unit's activities. (Figure 5 below graphically
represents an Army 21 duty cycle.)
In keeping with our emphasis on transparency and parsimony, the 0
relationships are deliberately kept simple, sometimes relying on
established simple formulations, and often upon geometry or common
sense, using the simplest form that seems to have the properties
desired. For example, calculation of the resources required to move a
unit is based on one-dimensional or two-dimensional geometry, whereas
the resources required to engage in combat with enemy units are based on
a slightly modified version of Lanchester's square law equation
(although users will be able to vary its parameters).
WfR/ %* %~ #%
-13-
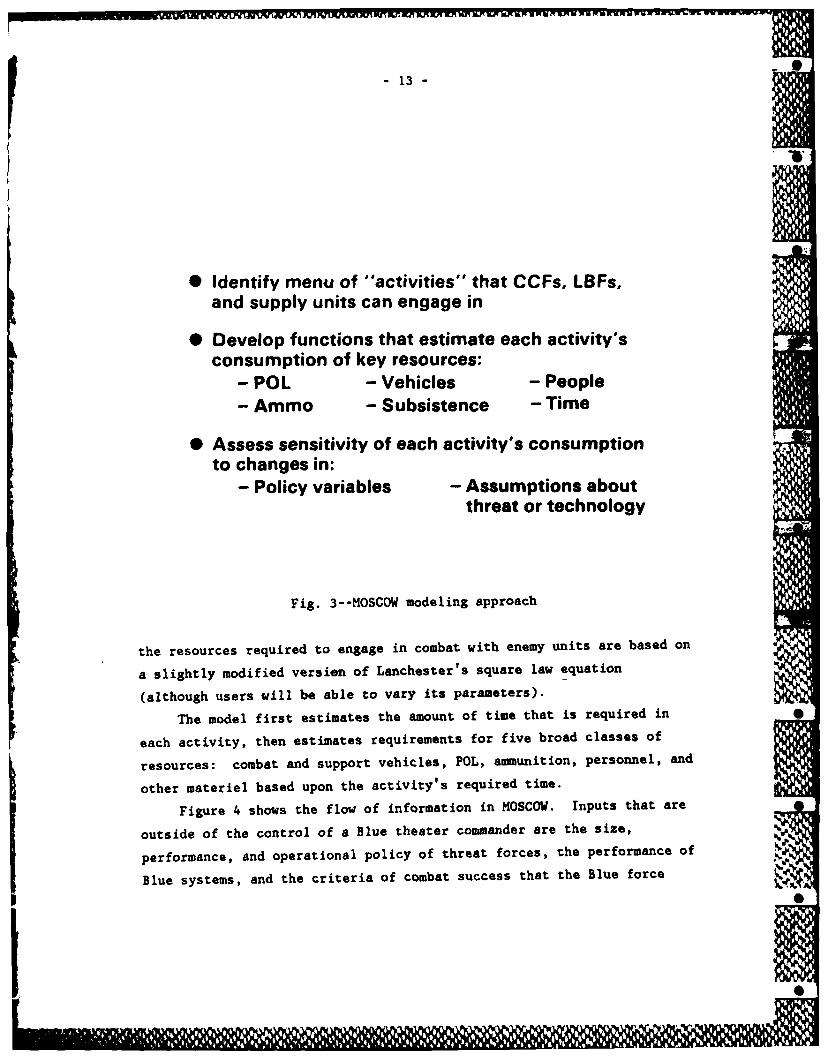
*0 Identify menu of "activities" that CCFs, LBFs,and supply units can engage in
* Develop functions that estimate each activity'sconsumption of key resources:
- POL - Vehicles - People
- Ammo - Subsistence - Time
* Assess sensitivity of each activity's consumptionto changes in:
- Policy variables - Assumptions aboutthreat or technology
Fig. 3--MOSCOW modeling approach
the resources required to engage in combat with enemy units are based on
a slightly modified versien of Lanchester's square law equation
(although users will be able to vary its parameters).
The model first estimates the amount of time that is required in
each activity, then estimates requirements for five broad classes of
resources: combat and support vehicles, POL, ammunition, personnel, and
other materiel based upon the activity's required time.
Figure 4 shows the flow of information in MOSCOW. Inputs that are
outside of the control of a Blue theater commander are the size,
performance, and operational policy of threat forces, the performance of
Blue systems, and the criteria of combat success that the Blue force
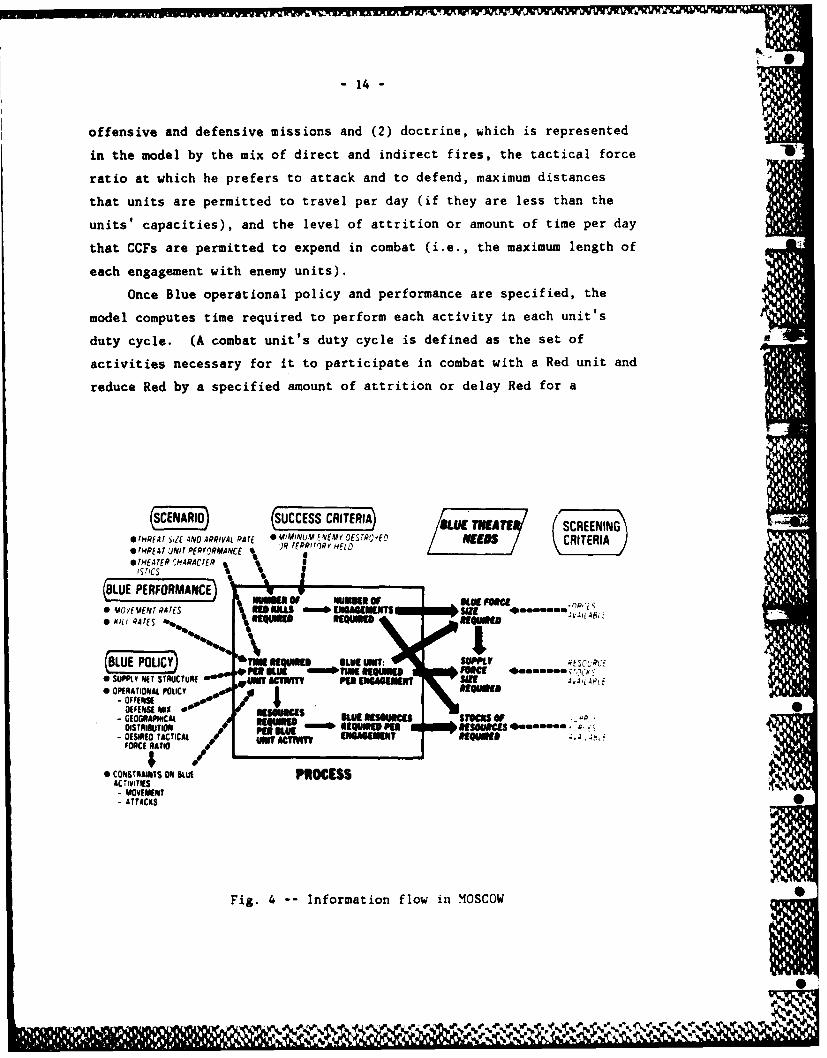
-14 -
offensive and defensive missions and (2) doctrine, which is represented
in the model by the mix of direct and indirect fires, the tactical force5
ratio at which he prefers to attack and to defend, maximum distances
that units are permitted to travel per day (if they are less than the
units' capacities), and the level of attrition or amount of time per day
that CCFs are permitted to expend in combat (i.e., the maximum length of
each engagement with enemy units).
Once Blue operational policy and performance are specified, the
model computes time required to perform each activity in each unit's
duty cycle. (A combat unit's duty cycle is defined as the set of
activities necessary for it to participate in combat with a Red unit and
reduce Red by a specified amount of attrition or delay Red for a
RIO CSS CERIEA 11 7V (' NING*tIHRFAf ,1E-.ND ARRIVAL RAtE *4E&Iu VAYO~Rt~ N E S CRITERIA)*TrHPEA T VJNIT PEPFOR4IAN Il I R FERO' Tr~ HEIL)
.Al lR(I.IRACrER I
(BLUE PERFODRMANCE* UOVEVENT RATES nto "Ls=0 EWSA"IT il 4mwn
" l NrS4%%1 \fUw E~l 41
BLUE POLICY *MR UQuuum BLUE UNT: 51pi V fSLP
"E OPUSIOIA Polic 000 00 tO FUICE-OPF ptii , #1
MEENE PA * 0g ~~ssn- GEOGRAAI DSIC BU 9OI TN
DISTRIBUTION * E01 -1111 411UPIP PE IEMICIS 40mn.- 0151110 TACTICAL * E llK IFKIII
$ONCE RATIO *W CI I
* CONSTRAINTS 01I IU PROCESSACTIVITIES
MIOVEMENT
Fig. 4 -- Information flow in MOSCOW
Ir o d* C W
61~~~ '11 1, 1 wII- % l

- 15 -
specified length of time. A support unit's duty cycle is the set of
activities necessary to load cargo, deliver it to a recipient, and
return to its base or depot.) Based upon the time required for each
activity, the model computes the resources required for each activity,
and combines them to estimate requirements for the cycle. Similarly,
times required per activity are combined to compute time for the cycle.
The reciprocal of a unit's total time of cycle is the expected amount of
Red attrition inflicted by each Blue unit per day.
The success criteria determine the total amount of attrition Blue
must impose on Red or the maximum distance that Red can be permitted to
penetrate (or both); specified Red force size determines the number of
engagements necessary to succeed. Comparing the average number of Red
units that must be destroyed per day and the average number that are
destroyed per Blue unit per day determines the number of Blue units
required. Since we specify by assumption that the supply force and its
cargo are required to keep Blue resupplied, the required number of Blue
combat units determines the required supply force and the quantities of
physical resources needed. Each of these needs can then be compared by
the analyst with the amounts expected to be available. If a need
exceeds the expected supply, the operational policy (i.e., version of
warfighting concept) tested can be considered to "cost" too much and is
provisionally screened out.
However, some deficiencies are more important than others, so the
screening requires some judgment on the part of the analyst. Also, the
forecasts of expected supplies are themselves uncertain, so concepts
that are only marginally too "costly" should not necessarily be screened
out immediately. Put colloquially, "When in doubt, don't leave it out."
Additionally, the particular resource constraints that are exceeded can
provide valuable information to the analyst--they may suggest potential
concept refinements or tradeoffs. For instance, if a version needs
substantially fewer CCFs than are available but too many supply units,
these two types of units can be traded off; if resources are assumed to
be reallocated to permit fewer CCFs but more supply units, the concept
might become successful.
L11

16 -
Figure 5 illustrates the set of activities in which a close combat
unit must engage in order to attack a Red target.3 The sum of the
resources required by these activities represents the total amount
needed to perform one duty cycle for its particular mission.
Basic mission: Offensive strikes against Red combat units
readyTotal time of cycleposition Time (scan)
+ Time (swarm)arm + Time (strike)
Replenish (2-dimensional + Time (scatter and move to replenish)
tr,,,snj + Time (replenish)+ Time (move to ready position)
/ Strike
Scatter and
move toreplenishment
site
Fig. 5 -- A CCF duty cycle
3The names of the activities are based on the unclassified conceptdescription, which has been superseded by changes in wording in laterdrafts. Some additional activities were identified by RAND. In thecurrent draft the names have changed, but to our knowledge the basicfunctions performed by the activities have not. Since the original %names have the advantages of simplicity and mnemonic ease, we haveretained them in this Note. Different warfighting concepts might use 0different names, but we expect that those shown here would be theminimum necessary for virtually all concepts. The final version of themodel will incorporate a more extensive set of activities, with neutraltitles applicable to any concept. 1,is

17-
IV. USES FOR MOSCOW
Figure 6 illustrates one of the resource requirements relationships
for an activity in a particular duty cycle. In this case, it is the
time required to "swarm"--to approach within weapons range of the enemy.
The right-hand diagram indicates our rectangular representation of the
zone or theater. (Average Blue and Red movement rates are calculated
based on the distribution of general terrain types in the theater, to
reflect average trafficability.) Blue units are distributed within the
theater according to the theater strategy chosen; for this example, they
have been distributed uniformly.
One way of distinguishing among versions of a warfighting concept
is the tactical force ratio at which Blue chooses to attack Red. To
achieve a higher force ratio, Blue must mass units brought from greater
distances, which increases the average time that a unit spends swarming.
The overlapping circles illustrate this. For specified Blue and Red
movement rates, a decision to mass a fairly low force ratio would
require moving only those forces in the circle whose center (the point
where Blue intercepts Red) is I (The radius of that circle determines
the time required to swarm.) A higher desired force ratio would mandate
bringing in all the forces in the larger circle, permitting Red to
penetrate to 1 and so forth.
The time required to swarm is based on the radius of the circle
whose area includes the number of Blue units needed to achieve the
desired tactical force ratio (although the usable force ratio will be
limited by Red's maximum permissible penetration before interception). S
For this reason, time to swarm increases in proportion to the square
root of force ratio, as shown on the left side of Fig. 6. Note that
there is a price to be paid for higher force ratios: it permits Red to
penetrate further before he is attacked (to 12 instead pf II). If there
were a requirement set by theater strategy or by higher authority to
ensure that Red be attacked no later than a particular time or depth of
penetration, that requirement could constrain the set of acceptable
tactical force ratios, and thus the set of potentially promising concept
versions. a'
Ir VrIr 6a
zt,

- 18 -
Time (swarm) f (Blue movement rate, Red movement rate,desired tactical force ratio, penetration beforeinterception)
Time Zone
"depth"
Desired tactical force ratio Zone "width"
Fig. 6 -- Swarm activity
POLICY ANALYSIS EXAMPLE: IDENTIFYING PROMISING
TACTICAL FORCE RATIOS FOR BLUE ATTACKS
If the mix (although not-the number) of Blue forces is specified,
then the time required to perform each activity can be summed to
determine the time needed per Red unit killed--or, more important, its
inverse, the average number of Red units killed per day per Blue unit.
Once the size of the threat is specified, the number of CCFs required to
achieve a given level of combat success can be calculated. For the
example shown in Fig. 7, the success requirement was set at "destroy Red
units at the same average rate as they arrive"--that is, do not permit V,
any Red units to transit the theater without being destroyed. In Fig.
7, differing concept versions are again reflected as different tactical
V 101

-19- 0
300~Total required
CCF$Ia CCF* required
01
Ave r e raf pr ange w e
Fig. 7 -- Total CCFs required in a 45-day campaign
force ratios at which Blue chooses to attack Red. As can be seen, an
increase in the desired tactical force ratio for the most part increases
the required number of CCFs (although there are actually some savings
when the force ratio first increases above 1:1). However, higher
Blue-Red force ratios will reduce Blue's casualties in each engagement.
If the length of the campaign can be specified--based, for instance, on
the availability of Red strategic reserves--then the total requirement
for Blue replacements (in CCF equivalents) can also be estimated.' The
total force requirement is the sum of the CCFs needed initially plus
'A 45-day campaign was the length used in the first scenario TRACprepared for its Army 21 study.
0
'.1'~1* 11~ k' ' Z ''r%~*q ~ ~O~z kOk". &&M

-20- 0
replacements. The most promising versions of the concept in this
example seem to include a Blue to Red tactical force ratio of
approximately 2:1 or 3:1.2 The feasibility of these versions could be
established if the analyst had a projection of the number of CCFs that
would be available in the theater.
SENSITIVITY ANALYSIS EXAMPLE: HOW THE PAYOFF FROM ATECHNOLOGICAL IMPROVEMENT VARIES ACROSS DIFFERENT VERSIONSOF A WARFIGHTING CONCEPT
As was mentioned earlier, uncertainty about the future obliges the
analyst to perform a sensitivity analysis to determine the robustness of
a concept's performance as assumptions about future conditions are
changed. Since TRAC intends to continuously refine the concept during
its study, sensitivity analysis will illuminate areas for improvement
and assist the analyst in sorting high-payoff vs. low-payoff
improvements. Figures 8 and 9 illustrate the use of the model as a tool
to help set priorities among alternative improvements, either in the
concept or (in the case shown) in system performance.
Figure 8 shows how the distribution of times required by the
several activities in the CCF's duty cycle is affected by different
concept versions, represented here by the desired tactical force ratio.3
The total represents the time required by a Blue CCF to participate in
the destruction of one Red unit in direct-fire combat. (We can vary the
mix of direct and indirect fire in the model.) At low force ratios, the
striking activity--the actual combat engagement itself--comprises the
majority of the cycle. As the force ratio increases, the relative
amount of time required to attack reduces, but the three activities
involving movement (Move to Replenish, Swarm, and Move to Ready
2This figure and others that display resource requirements wereproduced by an early experimental version of the model, using arbitraryinput data to explore general relationships. The reader should not drawany conclusions concerning actual numbers of CCFs required. Theexamples are provided for illustrative purposes only.
'Tactical force ratio is currently defined as the ratio of combatpower in an engagement, to include numbers of weapons platforms andtheir lethality.
.0

-21
Replenish.9 2 ''''''. .+ : : : I jOMove to )
9 . H. . . Replenish.8 % . %
.7 ..... Swarm
Fractionof .6 . ......
total .5 -Move to
cycle . . Reedytime Position
.3
.1 0 Strike
1 2 3 4 6 6 7
Force ratio
Fig. 8--Components of total cycle time
Position) all increase and eventually dominate the duty cycle.' An
analyst interested in setting priorities among possible performance
improvements (for instance, alternative technologies) would infer that
priorities will differ depending upon the concept. The figure suggests
that performance improvements pertaining to the strike phase of
operations would have the highest payoff under versions of the concept
involving low tactical Oorce ratios; at high force ratios the highest
payoff would seem to come from improvements in movement. @,,
'The absolute amounts of time also increase, although the increaseis not reflected on Fig. 8. Strike time reduces as force ratio o.6
increases in accordance with Lanchester's law. Movement time increasesbecause in two dimensions the radius of the circle around the targetenemy unit increases in proportion to the square root of force ratio.
e%_~~~ V NN.- V *.N
%

-22- -
Figure 9 displays the effects of changes in Blue's average mobility
on CCF requirements. These changes could result from lighter vehicles,
improved drive trains, or entirely different vehicle designs (e.g.,
terrain effects vehicles). The horizontal axis shows the average
movement rate (in kilometers per day) of a Blue CCF. The vertical axis
shows the number of CCFs required to meet the combat success criteria
employed for Fig. 7. Each curve indicates the number of CCFs required
by a particular version of the concept as a function of Blue movement
rate. These results are consistent with the inferences we made based on
Fig. 8. A concept version that entailed a relatively low Blue to Red
tactical force ratio (such as 2:1 or 3:1) would see little payoff from
even a threefold improvement in mobility from 50 to 150 kilometers per
day, whereas for a different version involving a higher force ratio
(such as 5:1 or 7:1) the payoff would be substantial. Since the lower
force ratio concept versions require fewer CCFs, mobility improvements
might be seen as of lower potential payoff than some technology
alternative that improved performance in the strike activity, such as
improved lethality or reduced vulnerability.
300-V
CCFs"
rqi 0 Aarae
Blue/Redtomce ratio
Wo enlgagemenft
7:15:13:1.
100 , Is0 100 10
Average daily movement rate (kin/day)
Fig. 9 -- Payoff of higher mobility
P Vs%.. J'........... ...... ~ ' ~V V

m
23-
V. PROGRESS TO DATE AND FUTURE WORK ON THE SCREENING MODELIN SUPPORT OF TRAC ARMY 21 STUDY
The initial, exploratory model that was used to generate the
illustrative examples used in this Note included only one type of Blue
unit (CCF) performing only one type of mission; time was the only
resource whose requirements were computed. The version coded in
December 1986 includes several types of CCFs that can either attack or
defend, as well as headquarters units and a rudimentary supply network.
Additionally, the model treats Red in somewhat more detail than before
(although still much less than Blue, to limit the model's complexity)
and includes parameters intended to allow the analyst to crudely
represent the effects of air operations, terrain, weather, and imperfect
C 31. For a specified success criterion, the model will estimate the
number needed of each of six types of Blue units: heavy, medium, and
light CCFs, LBFs, and two types of supply units; and will estimate the
total quantities of vehicles, POL, ammunition, personnel, and
sustainment needed to keep the units resupplied.
Once the model is completed and debugged, it will be possible to
run a number of excursions quite quickly. These excursions should be
designed to explore tradeoffs among various components of the concept
(such as varying the mix of attacking and defending CCFs, or varying the
force mix), with emphasis on potential improvements in performance
through changes in operational policy and changes in technology. We
anticipate that these excursions will provide useful information to the
working groups that TRAC has established to suggest possible operational
or technological priorities. Conversely, the model's input formats will
impose new responsibilities on the working groups to generate and refine
the "guesstimate" data used in our early illustrative runs.
The first phase of the TRAC study concentrated on "visualizing" the
Army 21 concept through map exercises in order to identify the important
policy variables that define the essential components of the concept and
distinguish among its many different versions.' The second phase of the
'RAND engaged in a similar "visualization" process in parallel with NTRAC to develop the screening model, using an early version forexploratory purposes.
L e 1 % 4~ V
0
e 01. r- - r-rn %
- 24 -
study will quantitatively evaluate "promising" versions of the concept
to assess their "viability" in a Southwest Asia scenario. RAND's model
will be used in this phase to screen concept versions, with reduced but
frequent use thereafter as possible improvements in operations, force
structure, or technology are identified and the concept is refined.
RAND demonstrated and briefed the model to TRAC in January 1987. An
interim version of the model was delivered to TRAC in the spring of
1987. A final report, including the final model and documentation, will
be produced in late 1987.
S
PI,
M .

- 25 -
Vl. FUTURE WORK TO SUPPORT THE DEVELOPMENT
OF WARFIGHTING CONCEPTS
We chose an activity-oriented modeling approach in MOSCOW because
we believed that it offered the potential to represent a wide range of
alternative warfighting concepts. For example, something as different---
from Army 21 as static warfare could be represented by constraining the
movement-related activities in the duty cycle to very low values.
Similarly, different theater strategies can be reflected, albeit quite
abstractly, by changing the geographical distribution of Blue units
(including distributions that reflect cross-border operations) and by
varying the mix of units with defensive and offensive missions.
Furthermore, our emphasis on parsimony, and the use of a spreadsheet
format, should limit the cost of "tailoring" the model for any specific
concept or theater.'
The motivation for our inclusion of this flexibility goes beyond
simply broadening its scope as a screening tool in the warfighting
concept evaluation studies that are mandated by the CBRS. It is our
belief, although only a tentative one at present, that this model could
be a useful tool for concept development. It has the potential to
contribute in two areas, as discussed below.
A FRAMEWORK FOR SYSTEMATICALLY DESCRIBING AND COMPARING
CONCEPTS
In the discussion of the special methodological challenges faced by
the TRAC Army 21 study (Fig. 1), the first challenge mentioned was the
degree to which the concept was underspecified in comparison with what
is necessary for a quantitative evaluation. Indeed, substantial time
'We acknowledge that the flexibility of our modeling approachcreates the risk that different users might modify different assumptions ,or input values in different ways, to the point where their "tailored"versions become difficult to compare. The Army analytic community'straditional solution is to use only models that have been "signed off" ".'%by the necessary authority, imposing a uniformity that negates the valueof "tailoring." A better solution in this instance is a clear inputstructure and a high standard of documentation, of both the originalmodel as well as later customized versions.
.. "%~

- 26 -
and resources are being spent by TRAC and other study participants to
develop a coherent picture of Army 21 with sufficient definition to be "
susceptible to analysis. The lack of a format for rigorously describing
the concept has impeded communications between the concept developers
and evaluators, and even among the concept developers themselves.
Because the process of building a model obliged us to be specific
about what in our view are the essential elements of the Army 21 concept
(that can be quantitatively described), the model--and specifically, the
model's operational policy inputs--provides an explicit format for
characterizing any version of the concept. Its generality also allows
description of very different concepts in the same terms. The framework
is a prerequisite for quantitative analysis of any concept, but it also
could facilitate systematic qualitative comparisons, hence the design of
new concepts. The simple existence of a common vocabulary would
simplify comparisons of concept ideas, and offer the structure needed to
make the creative process of concept development more systematic.
The framework employed in this model has both advantages and
disadvantages. That it is relatively general and parsimonious allows
concepts to be described by a fairly small number of policy variables
(currently about twenty), and still capture a diverse range. However,
the price paid for that simplicity and flexibility is that some of the
descriptive policy variables are rather abstract proxies for several
more tangible subordinate attributes, and represent average policies
over the whole Blue force (or all of one type of unit) in lieu of
describing a policy for every element. The lack of a one-to-one
correspondence between "real-world" elements of a concept and the .
model's variables may trouble many concept designers, especially those
less sensitive to the necessity imposed by finite time and resources to
make compromises in the amount of detail in the analysis. We feel
confident that these compromises could not be avoided if we were to S
provide a screening tool that would be useful to TRAC's large and
ambitious analysis. We anticipate that any attempt to systematically
describe concepts using a common framework would out of practical
necessity require similar simplifications. 5
S % OP . . . . . . . . . o ° q .' . .%

JMW WAWNU3WUJRJINJU M
- 27 -
A TOOL FOR EXPLORING AND REFINING NEW CONCEPTS
A warfighting concept is a complex, "squishy" policy with many
component variables, and the boundary between its design and its
analysis becomes highly artificial. For instance, one of the TRAC
study's goals is to "refine" the concept, which is arguably more of a
"development" than an "evaluation" task. A fast-running, fairly easy to
use model that can distinguish among concept versions and show the
effects of design changes could be a powerful tool in the development of
new concept ideas as well. Concept designers would be forced to be
explicit about elements of their design that they might not have
considered, and could rapidly gain insights into its strengths and
weaknesses to point the way to refinements. Such a model could thus be
a valuable exploratory tool. 2 It would also mandate closer coordination
between concept designers and analysts in the early stages of the
development process. This would, in our opinion, both increase the
definition of warfighting concepts and significantly streamline the task
of fulfilling the mandates of the CBRS.
This preliminary assessment of the value of the model (or one much
like it) to the design of new warfighting concepts cannot be affirmed
nor contradicted without further experience. To that end, RAND will be
attempting an experiment during 1987. Another task of the "Future
Warfighting Concepts and Technologies" project is to develop a framework
for systematically designing future warfighting concepts. We hope to
draw upon the framework used in this model as a starting point for that
effort. As the model is completed and then refined, it will be used in
the project's exploration of new concept alternatives. If the model
proves as useful as we expect, it should emerge as a tool of substantial
power and flexibility. If not, it will have failed under the most
2The relative speed with which concept versions may be exploredmight encourage analysts to adopt the mistaken belief that the screeningmodel can be used to optimize the design of a concept. We make no suchclaim. Any quantitative model of warfare must make too manysimplifications to be trusted to generate an "optimum." This isespecially true of the screening model; elements omitted or summarizedfor the sake of speed, flexibility, and transparency might haveunforeseen importance in certain concepts or under certain assumptions.

- 28 -
favorable of circumstances, with a clear diagnosis as to its
limitations. Our hope is that the end product will be a methodology for
developing and refining concepts that can improve the scope, rigor, and
efficiency of the concept development and evaluation process.
!p
0D

- 29 -
Appendix A
AN OVERVIEW OF THE CONCEPT SCREENING MODEL
INTRODUCTION
This appendix provides a technical overview of the concept
screening model, known as the Method of Screening Concepts of Warfare,
or MOSCOW. MOSCOW is a spreadsheet-based tool designed to be used for
either of two purposes: (1) as a screening aid in the early stage of a
concept study to reduce the number of concept variations to be examined
later by other, more detailed assessment tools, or (2) as a design aid
to help concept developers to organize their concept ideas and gain a
first-order appreciation of the resource needs of each idea.
As MOSCOW is still being developed, this appendix cannot provide
exhaustive or detailed documentation; rather, the model overview
discusses the most important input variables designed to capture
warfighting concepts.
GENERAL ANALYTIC APPROACH
MOSCOW is, in effect, a requirements model. It evaluates the
efficacy of a warfighting concept by estimating the resources that would
be needed for Blue forces to successfully complete their designated
mission, within the operational boundaries of the concept. The model
determines whether the resources needed exceed the maximum amounts
available that are specified by the analyst.
Each run of fOSCOW pertains to one "zone," which is essentially one- 0
dimensional. Red forces enter in single formation, moving through the
zone to its opposite side, with Blue forces distributed uniformly within
a subset of the zone that the analyst can specify. For highly
aggregated screening, the zone could represent the entire theater. More
typically, a zone will represent all or part of one operational axis of
advance. (Deployment of Blue forces in depth can be reflected by
setting up several zones in sequence.) If a higher degree of
geographical discrimination is required (to represent non-uniform 0
deployments across the width of the operational axis, for instance),
00

-30-
several parallel zones can be constructed. Typically, the Blue and Red
units will be of division size (although they can be of any size the
analyst desires) and the zone will be on the order of 100-300 km across
and anywhere from 10 to 1500 km long.
The analyst first specifies the characteristics of the zone
(length, width, and distribution of terrain). Next he sets Blue's
mission objectives: generally they are to impose a specified amount of
attrition on Red by the time Red forces reach a specified phaseline.
The proportions of Blue units assigned to offensive missions (which
impose high Red casualties per engagement but do not delay their
movement for long) and defensive missions (which do the opposite) are
set. Finally, the analyst can set the levels on a variety of variables
which capture "operational policy," such as the mix of Blue units'
movement in alternate formations, the tactical force ratio at which
units will attack, the amount of attrition that they attempt to impose
in each engagement, and the priority given to several types of target
units.
Additionally, the analyst can change the assumed characteristics of
Blue and Red units (their movement rates, firing rates, etc.) and
assumptions about the relative cohesiveness and agility of the two
forces.
INPUTS
Inputs are of several types: exogenous conditions, such as the
characteristics of the zone and its terrain; Blue mission requirements
and operational policy; Blue and Red unit characteristics; resource
consumption parameters; calibration parameters; and "budgets" of
available resources.
Zone Characteristics
ZONLGTH and ZONWDTH specify the length and width of the zone. A
table indicates the effects on defense strength, movement, and target
acquisition for each of a number of terrain types (currently 10, but it
could be any number). The "average" multipliers are calculated based
upon the distribution of terrain types in the zone.

- 31 -
Blue Mission Requirements
The Blue force in the zone is required to destroy a fixed number or
percentage of Red invaders (ARRTOT, or total arrivals, minus MAXREDSURV,
or maximum permissible surviving Red units) by the time they reach some
maximum permissible penetration depth (MAXPEN). For example, a main
defensive force might desire to destroy 75 percent of the invading Red
units without losing more than 33 percent of the defended territory,
while in a different zone a covering force might be willing to settle
for 10 percent Red attrition and would be willing to give up the entire
zone.
Blue and Red Force Mix
The model can represent three different types of Blue and Red
maneuver units--light, medium, and heavy. The analyst specifies the
mixture of those three types in the force (%CCL, %CCM, %CCH).' For Blue,
only the proportions of each unit type are specified (since MOSCOW will
calculate the actual number needed); for Red, the number of RCL, RCM,
and RCH are entered, yielding a total number of arriving divisions
(ARRTOT).
Blue Operational Policy
There are several subcategories of operational policy.
Cross-Country ffovement Policy. Each type of unit can move in either
of two formations: Administrative (A or ADM), which maximizes speed but
is relatively vulnerable when attacked, and Battle (B or BATT), which
has the opposite characteristics. The average movement rate for each
type of unit (e.g., CCL-MAVG) will reflect the fraction of its movement
time in each formation the analyst specifies. Basic movement rates are
(for CCLs) CCL-MA and CCL-MB; the proportions are %ADM and %BATT.
'MOSCOW currently uses unit designators that parallel those in theArmy 21 concept. Blue units are close combat forces, or CCFs. RedUnits are designated RCFs. The final version will probably use moregeneral designations.
Irk

- 32 -
Unit Assignment Policy. Each of the three types of maneuver units
can be assigned a mixture of offensive and defensive missions. The
proportions (CCL-%.A and CCL-%D) reflect the distribution of time that
units of this type devote to offensive vs. defensive missions.
Engagement Initiation and Termination Policy. Blue units assigned
attack missions will do so whenever they can achieve a desired tactical
force ratio (TFR/A). In pursuing the engagement they will impose a
specified amount of attrition on Red (RATR/CYC-BA [Blue attack]). (Red
may wish to break off the engagement sooner, so the actual length of the
engagement will depend upon Blue's ability to maintain the tactical
initiative [BLUAGTY, see below)). Blue units whose mission is defensive
cannot choose when to initiate an engagement, but they can choose when
they would like it to end, again expressed in terms of Red attrition
(RATR/CYC-BD).
Operations While Engaged. These portions of the model are being
revised and the parameters have not yet been fully identified.
Generally speaking, it will be possible to specify the levels of several
parameters that will represent tactics very abstractly. For example:
Blue can choose the fraction of each type of a unit's vehicles that will
fire in direct or indirect fire mode (.DF and MIF). It will be possible
to specify the frequency with which Blue vehicles move during an
engagement. Blue can set the rate at which his vehicles fire
(FTONS/VDF, tons fired per vehicle per day when employing direct fire,
and FTONS/VIF, in indirect fire); setting it below the maximum will
lengthen an engagement and increase casualties but reduce the rate at
which the supply net must provide ammunition to any particular unit.
Unit Characteristics
In addition to those mentioned above, there are several other
parameters that affect unit capabilities. The rate at which a Blue unit
can destroy vehicles in an enemy unit during an engagement (e.g.,
CCL-KILL) is based on the firing rate per vehicle (see above), the hit
rate per ton of ammo fired (HITS/TON), and the rate of kills per hit
(KPH). These parameters can differ for direct and indirect fire, so the
average is weighted by their proportions (MDF and %IF). These
111, 11 1 . ; I; I I'M 11111 0

33 o
parameters assume "proving ground" conditions, and are degraded by Blue
C-3 and Intelligence error rates, and Red's ability to deceive Blue
targeteers (causing fire to be misallocated to nonexistent or worthless
targets). They are further degraded by terrain conditions and Red's
ability to conceal targets, which reduce the "availability" of Red
targets to Blue gunners, and finally by the hardness of Red vehicles.
The calculations of attrition in engagements use a standard
Lanchester square law formulation. Each Blue and Red unit has a nominal
strength per vehicle (analogous to a weapon unit value) and a rate at
which enemy vehicles in an average enemy unit can be destroyed. To the
units' kill rates are added any supporting fire or close air support.
Since each engagement lasts a specified length of time (determined by
the amount of attrition Blue wants to impose and Red is willing to
accept before breaking off), Red attrition is determined, and the
Lanchester equation calculates the length of the engagement and the
amount of Blue attrition suffered.
Two other parameters will affect the length or the number of
engagements in the campaign. First, the breakpoints of Blue and Red
(REDBKPT and BLUBKPT) may constrain the length of an engagement below
that "preferred" by one side or the other. Second, a "Blue initiative"
parameter (currently designated BLUAGTY) determines when, on average,
engagements are broken off if one side attempts to end it sooner than
the other side desires.
Additionally, the size and composition of each unit and its
vehicles can be specified. VEH/CCL indicates the number of combat
vehicles in the unit; PERS/CCL indicates its personnel strength;
TONS/VE!i specifies the weight of each vehicle, and similar parameters
determine each vehicle's basic load. Very crude organizational changes
could be represented by changing the size of the unit, the
characteristics of its vehicles, or by constraining the proportion of
the unit capable of firing in direct vs. indirect fire mode.
%

-34-
Resource Consumption Coefficients
For each type of unit, MOSCOW calculates the amount of time and
resources it needs to perform the "cycle" of activities pursuant to its
mission. Thus there are duty (or engagement) cycles for attacking and
defending heavy, medium, and light combat units, and defending duty
cycles for headquarters and supply units. Operational policy and unit
capabilities will affect the time spent by each unit in its various
activities.
The centerpiece of the duty cycle is the engagement itself, but in
order for a unit to participate in that engagement it must also partake
of a number of "overhead" activities, such as cross-country movement,
surveillance, resting, resupply, and waiting for instructions. An
equation in MOSCOW estimates the average time each type of unit will
need to perform each activity. For instance, the time required for the
move-to-within-weapons-range activity is a function of the tactical
force ratio that Blue wishes to achieve on attack (TFR/A) and the unit's
rate of movement (CCL-MAVG). The time spent in the engagement is a
function of the tactical force ratio, Red and Blue kill rates, and the
amount of attrition that Blue wishes to impose on Red per engagement.
These are fairly complicated equations, based as they are on the two-
dimensional geometry of movement around the theater or the Lanchester
equations, respectively.
Most of the resource consumption equations are very simple. For
example, the time spent resting is simply a specified fraction of total
time spent in the field. If the unit as a whole needs to rest an
average of 12 hours out of every day, this fraction would be 1/2; eight
per day would make it 1/3, and so forth. In another example, time spent
resupplying is a simple linear function of the amount of material
resupplied (i.e., the amount consumed in the other activities of the
cycle) and a loading rate.
Once time required for each activity is calculated, the amounts of
other items required per activity are similarly estimated. For
instance, the unit's vehicles will suffer a certain rate of breakdowns
(currently .5 percent) per day of movement. That rate is a "resource
consumption coefficient" which multiplies the move-to-weapons-range time
to0
- 35 -
to determine the number of vehicles lost during this activity. In
combat, the amount of ammunition consumed is the firing rate per day
(see above), plus that ammo lost due to attrition. There is a table of
coefficients to calculate the amounts of vehicles, personnel, POL,
ammunition, and other materiel consumed per day of each activity. When
combined they provide an estimate of the tons of total cargo needed to
keep the unit resupplied. While the analyst can set these coefficients
to different values for each type of unit, for much analysis it may be
more efficient to simply set them at average values for all units.
The sum of the amounts of time required to perform each activity is
the "total cycle time," or the amount of time it is unavailable for
other assignments. If in the engagement activity the Blue unit had
killed or destroyed one Red unit, then its average kill rate per day
would be the reciprocal of the total cycle time.
Calibration Parameters
Finally, there are some inputs that have no natural interpretation
but are necessary to produce the desired behavior in the model's
equations. For instance, the time a unit spends waiting for orders is a
function of the span of control of its superordinate headquarters--
the assumption behind the equation is that as headquarters have more
units to keep track of, each unit will on average spend more time
waiting for the headquarters to give it new orders. The value of the
coefficient of this equation should be set at whatever seems to
reproduce real-world behavior (whether drawn from historical data,
exercises, or intuition). In this example, the units of the coefficient
would be "minutes delay per subordinate unit," which is hardly an
intuitive formulation. These equations can be readily changed if some
better formulation is later identified.
OUTPUTS AND MAXIMUM AVAILABLE RESOURCES
Given a specified threat and a Blue requirement to destroy a
specified number of threat units before they cross a phaseline, MOSCOW
will estimate the number of Blue units needed (operating under a
specified concept of operations). It will also estimate the amount of
replacement materiel needed to keep the units at full strength. Based
%0

- 36 -
on these judgments, MOSCOW will estimate the number of headquarters and
supply units needed, their materiel requirements, and the strategic lift
needed to keep the zone resupplied.
While the maneuver unit and materiel requirement calculations are
considerable (and one is outlined below), most of the other calculations
are rather simple. For instance, the analyst can specify the span of
control of Blue HQ units, as well as their command "radius" (the maximum
distance at which they can exercise effective command). Once the number
of maneuver units and the size of the area of operations are
established, the model will calculate the number of HQs needed under
both the span of control and the "radius" rule and take whichever number
is larger. Similarly, supply units can carry a specified amount of
cargo (in tons), which degrades with distance. Once the cargo
requirements of the maneuver units and their average distance from
supply bases are established, the number of supply units can be
estimated.
Finally, the amounts of replacement vehicles, personnel, POL, etc.
required by each type of unit are summed to produce zone-wide
requirements for replacements and materiel and for strategic lift to
bring it in.
The analyst can enter a maximum amount of each resource projected
to be available. MOSCOW then compares each estimated need with its
budget to determine if the warfighting concept exercised performs its
mission within acceptable "costs." The most salient constraints are
probably: (1) the initial number of maneuver units; (2) replacements (in
unit-equivalents); (3) vehicle and personnel casualties; and (4) lift.
For time horizons where the force mix is constrained, ceilings on
specific unit types (such as supply units) might also be important.
A HIGHLY SIMPLIFIED ILLUSTRATION
In this example, we will assume that there is only one type of Blue
and Red unit (with equal strengths); that terrain has no effect; and
that Blue and Red's strategy can be adequately represented within a
single zone. Further, Blue's policy will call for Blue units to destroy
one-half of one Red unit per engagement (after taking Red and Blue's
breakpoint into account).
A 3U1 411111 1 JIV'
-37- S
Each Blue attack will be at a 4:1 force ratio. All Blue units are
assigned attack missions (*CCF/A = 1.00). We will outline how MOSCOW
estimates the number of maneuver units needed, ignoring other types of
units and materiel.
1. Theater characteristics: Assume the zone is the operational
axis in Western Iran running from the Soviet border to the mouth of the
Persian Gulf, or approximately 1500 km by road. Since it is mountainous
terrain, units will be effectively deployed only on or very near roads.
Zone length (ZONLGTH) is 1500 km; zone width (ZONWDTH) is 100 km (since
there are multiple roads).
2. Threat characteristics: The first echelon of the Red Front
will enter Iran with 20 divisions (ARRTOT), of equal strength and
characteristics as Blue's units. Threat will move (after accounting for
terrain and delays imposed by Blue's attacks and air interdiction) at a
rate of 50 km per day (RCF-MAVG).
3. Blue mission requirements: Blue must destroy 75 percent of the
invading Red force, or 15 Red divisions (NAXREDSURV = 20 - 15 = 5) by
the time Red has transited the Zagros (MAXPEN = 1200 km).
4. Assume that Blue is distributed uniformly in the area from the
Zagros north to the Soviet border, and that each Blue unit's total time
of cycle is two days (the resource requirement equations for each
activity would actually calculate this in MOSCOW).
5. Required kills calculations:
MAXTIME (Time available for Blue to complete mission) =
1200 km/50 km/day = 24 days.
KILLRATEREQ (Average number of Red divisions that must be killed per day) =
15 divisions/24 days = .625 divisions/day.
6. Kill rate per Blue unit calculations:
KILLRATE/CCF = .5 divisions killed per cycle/(2 days per cycle * 4
CCFs per engagement) = .0625 divisions killed/day/CCF.
7. Number of Blue units needed to complete mission:
CCF - REQ= (KILLRATEREQ)/(KILLRATE/CCF) = .625/.0625 = 10 CCF$ needed.
i

-38-
This need would then be compared to the estimate of available CCFs
to determine if the tested concept was viable.
CONCLUSION
This is a screening model, so its essence is quite simple. Most of
the growth in its size and complexity that has occurred over the past
six months has been due to the increased number of unit types that are
explicitly represented and to the designer's recognition of additional,
previously unrecognized, interdependencies among its component
variables. (Many of the model's equations, while fairly simple, appear
long because they must calculate average results over several types of
units in several different formations or modes.)
While it would be possible to represent geography and strategy in
greater detail, simply by dividing the area of operations into a larger
number of zones, the cost of doing so is a proliferation in the number
of runs necessary to perform the analysis of any single concept. Since
even well-articulated concepts are open to a fair degree of
interpretation, it will be necessary to explore a fairly extensive"space" to evaluate and refine any one concept. That is why MOSCOW was
designed to be highly aggregated and based on a spreadsheet.
An analytic strategy that compromises between the natural desire
for geographical verisimilitude vs. the need for analytic efficiency
might be to run MOSCOW representing the entire theater as a single zone,
disaggregating only when those less promising concepts could be rejected
(or when geography was essential to a particular concept). Although the
spreadsheet format might be adequately efficient to make disaggregation
less time-consuming than some other models, it will inevitably be
somewhat cumbersome and should be used only when required to adequately
reflect a warfighting concept.
N0

- 39 -
Appendix B
SOME MOSCOW VITAL STATISTICS
Configuration: Lotus 1-2-3 Spreadsheet on IBM-compatible personalcomputer.
Approximate size: 50 x 150 cells (approx. 60 kbytes).
Run time: Approximately 15 seconds (to recalculate the worksheetabout eight times).
Typical zone size: One operational axis or corps sector,approximately 100 km wide by 20-1500 km deep.
Typical time period covered by a run: Determined by Red movementrate; anywhere from 1 to 60 days.
Unit sizes: Could be any size; typically division for Red;division/brigade for Blue.
Red distribution: Advance on broad front through zone.
Blue distribution: Uniform within any subset of zone (fullwidth x specified length).
Cobat resolution: Lanchester square law; based on unit strengths,kill rates based on weapon, C-3I, terrain parameters.
Outputs (required resources to meet mission objectives): Maneuverunits (3 types x two assignments); HQ units (2 types); supplyunits (2 types); replacements in maneuver unit-equivalentsas well as vehicles, personnel, POL, ammunition, other;strategic lift required to deliver replacements (in tons/day).
NIS-V

- 41 -
BIBLIOGRAPHY
Department of the Army, Headquarters, U.S. Army Training and DoctrineCommand, Concept-Based Requirements System, TRADOC Regulation 11-15,August 1986.
__, Development and Management of Operational Concepts, TRADOCRegulation 11-16, undated.
Dupuy, Trevor, Numbers, Predictions, and War, London: MacDonald andJones, 1979.
Karhohs, Jeffrey, Peggy Fratzel, and Philip Romero, "Evaluating FutureConcepts," paper presented at XXVth Army Operations ResearchSymposium, Ft. Lee, Virginia, October 1986.
Levine, Robert, et al., A Survey of NATO Defense Concepts, The RANDCorporation, N-1871-AF, 1982.
Romjue, John L., From Active Defense to Airland Battle: The Developmentof Army Doctrine 1973-1982, U.S. Army Training and Doctrine CommandHistorical Office, June 1984.
Stockfish, Jacob, Models, Data, and War: A Critique of the Study ofConventional Forces, The RAND Corporation, R-1526-PR, 1975.
Walker, Warren, Use of Screening in Policy Analysis, The RANDCorporation, P-6932-1, 1985.
and M. A. Veen, Screening Tactics in Water Management Policy, TheRAND Corporation, P-7155-1, 1986.
- , Policy Analysis of Water Management for the Netherlands: Vol.II, Screening of Technical and Managerial Tactics, The RANDCorporation, N-1500/2-NETH, 1981.
Weiner, Milton, Analyzing Alternative Concepts for the Defense of NATO,The RAND Corporation, P-7032, 1984.
U.S. Army, Operations, Field Manual 100-5, August 1982.
U.S. Army TRADOC Analysis Center, Draft Project Plan for Army 21 ConceptStudy, June 1986.
U.S. Army Training and Doctrine Command, Army 21 Interim OperationalConcept, First Edition, Second Coordinating Draft, June 1985. Latereditions are classified.
'O'
6
P1
- w w w w V V V V V V V 0t U