6.3.36 plaice ( pleuronectes platessa ) in subarea 4 … › sites › pub › publication reports...
TRANSCRIPT

ICES Advice on fishing opportunities, catch, and effort Greater North Sea and Celtic Seas ecoregions Published 30 June 2016 Version 2: 11 November 2016
ICES Advice 2016, Book 6 1
6.3.36 Plaice (Pleuronectes platessa) in Subarea 4 (North Sea) and Subdivision 3.a.20 (Skagerrak)
ICES stock advice ICES advises that when the MSY approach is applied, catches in 2017 should be no more than 158 201 tonnes in Subarea 4 and Subdivision 3.a.20 combined. Since this stock is only partially under the EU landing obligation, ICES is not in a position to advise on landings corresponding to the advised catch. Stock development over time The combined North Sea and Skagerrak stock is well above MSY Btrigger, has increased in the past ten years, and has been at a record high for the last five years. Recruitment has been around the long-term average since the mid-1990s. In recent years, fishing mortality (F) has been estimated at around FMSY.
Figure 6.3.36.1 Plaice in Subarea 4 and Subdivision 3.a.20 combined. Summary of stock assessment.

Published 30 June 2016 ICES Advice on fishing opportunities, catch, and effort
2 ICES Advice 2016, Book 6
Stock and exploitation status Table 6.3.36.1 Plaice in Subarea 4 and Subdivision 3.a.20. State of the stock and fishery relative to reference points.
Fishing pressure Stock size 2013 2014 2015 2014 2015 2016 Maximum sustainable yield FMSY Appropriate MSY
Btrigger Above trigger
Precautionary approach
Fpa, Flim
Harvested sustainably Bpa, Blim
Full reproductive capacity
Management plan* FMGT - - - Not applicable SSBMGT - - - Not applicable
Catch options Following a review of the stock structure of plaice in the North Sea and the Skagerrak, the two areas were combined into one assessment in 2015. Table 6.3.36.2 Plaice in Subarea 4 and Subdivision 3.a.20. The basis for the catch options.
Variable Value Source Notes F ages 2–6 (2016) 0.17 ICES (2016a) Exploitation pattern average 2013–2015, rescaled to 2015 SSB (2017) 1033466 ICES (2016a) Short-term forecast (STF), tonnes Rage1 (2016) 907736 ICES (2016a) RCT3, thousands Rage1 (2017) 980962 ICES (2016a) Geometric mean (GM, 1957–2013), thousands Total catch (2016) 151362 ICES (2016a) Tonnes Commercial landings (2016) 109282 ICES (2016a) Tonnes Discards (2016) 42090 ICES (2016a) Average discard rate by age 2013–2015 in numbers
* Version 2: The management plan is not agreed and associated symbols have been removed in this version.

ICES Advice on fishing opportunities, catch, and effort Published 30 June 2016
ICES Advice 2016, Book 6 3
Table 6.3.36.3 Plaice in Subarea 4 and Subdivision 3.a.20. The catch options. All weights are in tonnes.
Rationale Total catch
(2017)
Wanted catch
(2017) *,**
Unwanted catch (2017)
*,**
Basis Ftotal
ages 2–6 (2017)
Fwanted ages 2-6 (2017)
Funwanted ages 2-3 (2017)
SSB (2018)
% SSB change
***
% TAC change wanted catch^
MSY approach 158201 121523 36678 FMSY 0.19 0.10 0.18 1065323 3 −15
Management plan (MP) 214738 165142 49596 TAC + 15% 0.265 0.14 0.24 1008386 −2 15
Precautionary approach 339247 261819 77428 Fpa 0.45 0.23 0.41 883590 −15 82
Zero catch 0 0 0 F = 0 0 0 0 1227002 19 −100
Other options
131471 100957 30514 F2016 × 0.90 0.16 0.08 0.14 1090093 6 −29 144932 111309 33623 F2016 0.17 0.09 0.16 1078707 4 −22 158975 122119 36856 F2016 × 1.10 0.19 0.10 0.18 1064542 3 −15 186687 143480 43207 Stable TAC 0.23 0.12 0.21 1036616 0 0 239611 184384 55227 FMP 0.3 0.15 0.28 983389 −5 28 272174 209628 62546 F2016 × 2 0.35 0.18 0.32 950711 −8 46
1018728 815440 203288 SSB > Bpa 2.75 1.41 2.54 230000 −78 465 443689 343667 100022 Flim 0.63 0.32 0.58 779638 −25 139 1098815 886406 212409 SSB > Blim 3.57 1.83 3.29 160000 −85 514 1018728 815440 203288 SSB > MSY Btrigger 2.75 1.41 2.54 230000 −78 465 Mixed fisheries options –differences with calculations above can occur because of the different methodology used (ICES, 2016b)†
Maximum 262508 A 0.3453 921565 -11 Minimum 90697 B 0.1083 1094476 6
Cod 140887 C 0.1727 1043814 1 SQ effort 172413 D 0.2151 1012053 -2
Value 151464 E 0.1868 1033153 0 * “Wanted” and “unwanted” catch are used to described fish that would be landed and discarded in the absence of the EU landing obligation, based on average discard rate estimates for 2013–2015. ** Wanted catch of plaice in Subarea 4 and Subdivision 3.a.20, calculated as the projected total stock wanted catch less the wanted catch
of plaice from Subarea 4 taken in Division 7.d. The subtracted value (934 t) is estimated based on the plaice catch advice for Division 7.d for 2016, using the recent 10-year average (2006–2015) proportion of plaice from Subarea 4 in the annual plaice landings in Division 7.d. Similarly, 652 t of unwanted catch of plaice from Subarea 4 are projected to be taken in Division 7.d. These are removed from the unwanted catch. TAC change restrictions of 15% are applied after subtracting the Division 7.d catches.
*** SSB 2018 relative to SSB 2017. ^ Wanted catch 2017 relative to TAC 2016, ignoring that large mesh trawlers (TR1 and BT1) with low discard rates are under landing
obligation since 2016. Mixed-fisheries assumptions (note: ”fleet’s stock share” is used to describe the share of the fishing opportunities for each particular fleet, which has been calculated based on the single-stock advice for 2017 and the historical proportion of the stock landings taken by the fleet): A. Maximum scenario: Each fleet stops fishing when its last stock share is exhausted. B. Minimum scenario: Each fleet stops fishing when its first stock share is exhausted. C. Cod scenario: Each fleet stops fishing when its cod stock share is exhausted. D. SQ (status quo) effort scenario: The effort of each fleet in 2016 and 2017 is as in 2015. E. Value scenario: The effort of each fleet is equal to the weighted average of the efforts required to catch the fleet’s quota share of each of the stocks, where the weights are the relative catch values of each stock in the fleet’s portfolio.
† Version 2: Mixed-fisheries considerations as part of this advice added

Published 30 June 2016 ICES Advice on fishing opportunities, catch, and effort
4 ICES Advice 2016, Book 6
Basis of the advice Table 6.3.36.4 Plaice in Subarea 4 and Subdivision 3.a.20. The basis of the advice.
Advice basis MSY approach
Management plan *
There is an management plan (EU management plan (EU, 2007) for North Sea plaice and sole that does not cover the current stock area for this stock. ICES evaluated the plan (ICES, 2010) and found it to be precautionary for the North Sea component. However, the management plan is not agreed because the parties and ICES was requested to provide advice based on the MSY approach and to include the management plan as a catch option.
*Version 2: Updated description of management plans Quality of the assessment
Figure 6.3.36.2 Plaice in Subarea 4 and Subdivision 3.a.20. Historical assessment results (final-year recruitment estimates included). Note that the scale shift in SSB is due to the addition of Skagerrak to the stock definition in 2015.
Issues relevant for the advice The North Sea and Skagerrak are now combined in one stock area. The long-term management plan for North Sea plaice and sole, which was evaluated by ICES to be in accordance with the precautionary approach, is not used by ICES in 2016 as the basis for the advice for plaice. The European Commission has informed ICES that agreement has not been reached between the EU and Norway on a method to split the joint advice between the North Sea and Skagerrak. Therefore, advice is provided based on the MSY approach. However, using the EU multiannual plan based on plaice in the North Sea does not raise immediate concerns, given the status of the combined stock. When the new management plan for plaice is developed it should, as the current management plan, take the mixed fisheries of plaice and sole into account. A large proportion of the catch in the western Skagerrak is considered to originate from the North Sea component of the stock, mainly in the summer on mixed feeding aggregations. There are also local plaice components resident in the Skagerrak. These cannot be easily distinguished and assessed separately. There does not appear to be much mixing of the combined stock with these local components in eastern Skagerrak. The status of these components is unknown and catches should not increase in the eastern Skagerrak to avoid local depletion. Results from a North Sea mixed-fisheries analysis are presented in ICES (2016b). For 2017, assuming a strictly implemented discard ban (corresponding to the “Minimum” scenario), haddock would be the most limiting stock (assuming that the full

ICES Advice on fishing opportunities, catch, and effort Published 30 June 2016
ICES Advice 2016, Book 6 5
advised catch is taken), constraining 36 out of 41 fleet segments (corresponding to 91% of the 2015 kW days of effort). Cod and eastern Channel sole would be limiting for fleets, corresponding to 5% and 4% of the 2015 effort, respectively. Conversely, in the “Maximum” scenario with Nephrops managed by separate TACs for the individual functional units (FUs), Nephrops would be considered the least limiting stocks in many FUs. Nephrops in FU 33, FU 5, FU 32, FU 7, and FU Others would be the least limiting stocks for fleets in these FUs, representing 32%, 16%, 10%, 4%, and 17% of the 2015 effort, respectively. Eastern Channel plaice and saithe would be least limiting for other fleet segments, representing 12% and 9% of the 2015 effort, respectively. Results for the North Sea plaice stock are also included as additional rows in the catch options table of this advice sheet. Reference points Table 6.3.36.5 Plaice in Subarea 4 and Subdivision 3.a.20. Reference points, values, and their technical basis. Reference points are based
on the North Sea stock only (apart from FMSY). Framework Reference point Value Technical basis Source
MSY approach MSY Btrigger 230000 t Default to value of Bpa FMSY 0.19 Combined stock ICES (2014)
Precautionary approach
Blim 160000 t Bloss = 160000 t, the lowest observed biomass in 1997 as assessed in 2004 ICES (2004)
Bpa 230000 t 1.44 × Blim ICES (2004)
Flim 0.63 The F that in equilibrium will maintain the stock above Blim with a 50% probability ICES (2016a)
Fpa 0.45 Fpa = Flim × exp(−1.645σF); σF = 0.20 ICES (2016a)
Management plan SSBMP 230000 t Stage one: Article 2 EU management
plan (EU, 2007)
FMP 0.30 Stage two: Article 4.2 – FMSY constrained to F ≥ 0.3 EU management plan (EU, 2007)
Basis of the assessment Table 6.3.36.6 Plaice in Subarea 4 and Subdivision 3.a.20. The basis of the assessment.
ICES stock data category 1 (ICES, 2016c) Assessment type Age-based analytical assessment (XSA; ICES, 2015a) that uses catches in the model and in the forecast.
Input data
Commercial catch, ages and length frequencies from port and observer sampling. Three survey indices (combined BTS (BTS-Tridens and BTS-Isis; 1996–2015), BTS-Isis (1985–1995), and the SNS (split into two series, SNS1 1984–1999, SNS2 2000–2015)). Maturity-at-age assumed constant; natural mortality-at-age assumed constant at 0.1.
Discards and bycatch Included in the assessment, data series from the majority of the fleet. Discard information in 2015 was available for 72% of the the landings in the North Sea and for 80% in the Skagerrak. 74% of the overall discards estimation in the North Sea come from the observations.
Indicators IBTS and commercial cpue indicators in the Skagerrak
Other information
Catch information, landings since 1984, and discards since 2002 for plaice from Subdivision 3.a.20 (Skagerrak) are now added to plaice for Subarea 4 (North Sea). The SNS survey was split into two time-series, 1984–1999 and 2000–2015. The Skagerrak stock component was benchmarked in 2015 (ICES, 2015b).
Working groups Working Group on the Assessment of Demersal Stocks in the North Sea and Skagerrak (WGNSSK) and Working Group on Mixed Fisheries Advice (WGMIXFISH-ADVICE)

Published 30 June 2016 ICES Advice on fishing opportunities, catch, and effort
6 ICES Advice 2016, Book 6
Information from stakeholders The cumulative index of perceptions of the abundance of plaice (Figure 6.3.36.3) increased in all areas during the last decade (Napier, 2014). No new information has been provided for 2015.
Figure 6.3.36.3 Plaice in Subarea 4 and Subdivision 3.a.20. Cumulative time-series of index of perceptions of abundance of plaice by
roundfish sampling area from the Fishers' North Sea Stock Survey (Napier, 2014; see page 14 for an explanation of the index).

ICES Advice on fishing opportunities, catch, and effort Published 30 June 2016
ICES Advice 2016, Book 6 7
History of the advice, catch, and management Table 6.3.36.7a Plaice in Subarea 4. History of ICES advice, the agreed TAC, and ICES estimates of landings. All weights are in thousand
tonnes.
Year ICES advice
Predicted landings
corresp. to advice
Predicted catch corresp.
to advice Agreed TAC Official
landings ICES
landings ICES
discards
1987 F< F(84); TAC 120 150 131 154 191 1988 70% of F(85); TAC 150 175 138 154 156 1989 Reduce F; Buffer SSB < 175 185 152 170 108 1990 Status quo F; TAC 171 180 156 156 71 1991 No increase in F; TAC 169 175 144 148 81 1992 No long-term gains in increasing F -* 175 123 125 57 1993 No long-term gains in increasing F 170 * 175 115 117 35 1994 No long-term gains in increasing F -* 165 110 110 24 1995 Significant reduction in F 87 ** 115 96 98 22 1996 Reduction in F of 40% 61 81 80 82 52 1997 Reduction in F of 20% 80 91 *** 82 83 100 1998 Fish at F = 0.3 82 87 70 72 104 1999 Fish at F = 0.3 106 102 79 81 71 2000 Fish at F = 0.3 95 97 84 81 44 2001 Fish at F = 0.26 78 78 80 82 100 2002 F< Fpa < 77 77 70 70 54 2003 Fish at F = 0.23 60 73 66 67 77 2004 Recovery plan - 61 61 61 54 2005 Rebuild the SSB above Bpa in 2006 35 59 55 56 54 2006 Rebuild the SSB above Bpa in 2007 48 57 56 58 62 2007 Rebuild the SSB above Bpa in 2008 < 32 50 49 50 39 2008 Rebuild the SSB above Bpa in 2009 < 35 49 48 49 44 2009 Limit total landings to 55 500 t < 55.5 55.5 NA 55 44 2010 Limit total landings to 63 825 t < 63.8 63.8 51 61 45 2011 See scenarios < 64.2 73.4 66 67 40 2012 Apply first stage of the management plan < 84.410 84.4 71 74 59 2013 Apply first stage of the management plan < 97.070 97.1 79 79 39 2014 Apply first stage of the management plan < 111.631 111.6 69 71 52
2015 (November update) Apply second stage of the management plan < 128.376 179.301 128.376 75 75 49
2016 Apply second stage of the management plan - ≤ 216.345^ 131.714 2017 MSY approach - ≤ 158 201
* Catch at status quo F. ** Catch at 20% reduction in F. *** After revision from 77 000 t. ^ As of 2016 the advice is for the combined North Sea and Skagerrak stocks. NA = not available.

Published 30 June 2016 ICES Advice on fishing opportunities, catch, and effort
8 ICES Advice 2016, Book 6
Table 6.3.36.7b Plaice in Subdivision 3.a.20 (Skagerrak). History of ICES advice, the agreed TAC, and ICES estimates of landings. All weights are in thousand tonnes. Advice until 2012 was given for Skagerrak and Kattegat combined. For 2016 the Skagerrak component has been merged with plaice in Subarea 4.
Year ICES advice
Predicted landings
corresp. to advice
Predicted catch corresp.
to advice Agreed TAC ICES
landings ICES
discards
1992 TAC 14 11.2 9.6 1993 Precautionary TAC - 11.2 9.9 1994 If required, precautionary TAC - 11.2 9.6 1995 If required, precautionary TAC - 11.2 9.4 1996 If required, precautionary TAC - 11.2 8 1997 No advice - 11.2 7.8 1998 No increase in F from the present level 11.9 11.2 6.4 1999 No increase in F from the present level 11 11.2 7 2000 F < Fpa 11.8 11.2 7 2001 F < Fpa 9.4 9.4 9.2 2002 F < Fpa 8.51 6.42 7.1 0.574 2003 F < Fpa 18.4 10.4 7.1 1.437 2004 F < Fpa 3 9.5 8 2.873 2005 F < Fpa < 9.5 7.6 6.1 2.081 2006 No increase in F < 9.6 7.6 8.4 2.243 2007 Maintain current TAC < 9.6 8.5 7.6 2.862 2008 No increase in catch < 9.4 9.3 8.3 1.043 2009 Same advice as last year < 9.4 9.3 6.5 0.610 2010 Same advice as last year < 9.4 9.3 8.7 0.842 2011 Last three years’ average landings (2007–2009) < 8.0 7.9 8.2 1.040 2012 Reduce catch - 7.9 7.6 0.846
2013 Increase catch by 7% – protect Eastern component < 8.4 9.142 6.824 1.161
2014 Increase catch by 7% – protect Eastern component < 8.972 < 10.196 10.056 8.981 1.022
2015 Decrease catch (2012–2013) by 13% – protect Eastern component ≤ 6.287 ≤ 7.232 10.056 9.804 0.676
2016* - - - 11.766 * As of 2016 the advice is for the combined North Sea and Skagerrak stocks. History of catch and landings Table 6.3.36.8 Plaice in Subarea 4 and Subdivision 3.a.20. Catch distribution by fleet in 2015 as estimated by ICES.
Catch (2015) Landings Discards
134.875 kt 65% beam trawl 30% trawl 5% other gears
50.108 kt 84.767 kt

ICES Advice on fishing opportunities, catch, and effort Published 30 June 2016
ICES Advice 2016, Book 6 9
Table 6.3.36.9a Plaice in Subarea 4. History of commercial catch and landings; both the official and ICES estimated values are presented by area for each country participating in the fishery. NS = North Sea, SK = Skagerrak.
Year
Belg
ium
N
S
Denm
ark
NS
Fran
ce
NS
Ger
man
y N
S
Net
herla
nds
NS
Nor
way
N
S
Swed
en
NS
UK NS
Oth
ers
NS
Total (ICES estimate)
NS
Landings (official) NS
Landings SK (ICES
estimates) Landings (NS+SK) Discards (NS+SK) Landings SK
(official)*
1980 7005 27057 711 4319 39782 15 7 23032 139951 101928 10510 150461 31080 - 1981 6346 22026 586 3449 40049 18 3 21519 139697 93996 8501 148198 33031 1982 6755 24532 1046 3626 41208 17 6 20740 154546 97930 8073 162619 49127 1983 9716 18749 1185 2397 51328 15 22 17400 144030 100812 7130 151160 74483 1984 11393 22154 604 2485 61478 16 13 16853 156149 114996 7921 165772 70816 1985 9965 28236 1010 2197 90950 23 18 15912 159838 148311 10095 171838 60549 1986 7232 26332 751 1809 74447 21 16 17294 165347 127902 11378 178878 129953 1987 8554 21597 1580 1794 76612 12 7 20638 153670 130794 12503 168759 190524 15694 1988 11527 20259 1773 2566 77724 21 2 24497 43 154475 138412 10820 168552 156423 12858 1989 10939 23481 2037 5341 84173 321 12 26104 169818 152408 5997 178891 107793 7710 1990 13940 26474 1339 8747 78204 1756 169 25632 156240 156261 10048 169453 71225 12078 1991 14328 24356 508 7926 67945 560 103 27839 148003 143565 6679 157277 80935 8685 1992 12006 20891 537 6818 51064 836 53 31277 125190 123482 9554 136727 57049 11823 1993 10814 16452 603 6895 48552 827 7 31128 117113 115278 9854 128506 35016 11407 1994 7951 17056 407 5697 50289 524 6 27749 110392 109679 9551 121925 23785 11334 1995 7093 13358 442 6329 44263 527 3 24395 98356 96410 9380 109348 21828 10766 1996 5765 11776 379 4780 35419 917 5 20992 81673 80033 8003 91386 52049 10517 1997 5223 13940 254 4159 34143 1620 10 22134 83048 81483 7814 92958 100145 10292 1998 5592 10087 489 2773 30541 965 2 19915 1 71534 70365 6449 79810 103751 8431 1999 6160 13468 624 3144 37513 643 4 17061 80662 78617 7049 89726 70976 8719 2000 7260 13408 547 4310 35030 883 3 20710 81150 82151 6989 90754 44311 8826 2001 6369 13797 429 4739 33290 1926 3 19147 81847 79700 9231 92912 100309 11653 2002 4859 12552 548 3927 29081 1996 2 16740 70217 69705 7102 79178 55099 8789 2003 4570 13742 343 3800 27353 1967 2 13892 66489 65669 7143 74722 79275 9110 2004 4314 12123 231 3649 23662 1744 1 15284 61436 61008 8033 70511 57478 9090 2005 3396 11385 112 3379 22271 1660 0 12705 55700 54908 6099 62796 56250 6764 2006 3487 11907 132 3599 22764 1614 0 12429 57943 55933 8345 67143 64160 9565 2007 3866 8128 144 2643 21465 1224 4 11557 - 49744 49031 7621 58576 42373 8747 2008 3396 8229 125 3138 20312 1051 20 11411 48875 47682 8356 58336 46993 8657 2009 3474 N/A* N/A* 2931 29142 1116 1 13143 - 54973 N/A* 6514 62360 45902 6748 2010 3699 435 383 3601 26689 1089 5 14765 - 60674 50666 8700 70340 46570 9057 2011 4466 11634 344 3812 29272 1223 3 15169 - 67386 65923 8218 76507 41593 8251 2012 4862 12245 281 3742 32201 1022 5 16888 - 73830 71246 7680 82018 59914 7611 2013 6462 13650 249 4903 33537 843 3 19334 - 78905 78982 6812 86222 40025 6911 2014 7105 12004 276 4203 29309 577 5 17370 - 70847 69179 9213 80686 52937 9004 2015 5522 14401 223 5171 32074 169 7 17240 - 74963 74807 9804 84611 50108 ** 9804
*Official landings available for Subdivision 3.a.20. **Version 2: Corrected value

Published 30 June 2016 ICES Advice on fishing opportunities, catch, and effort
10 ICES Advice 2016, Book 6
Table 6.3.36.9b Plaice in Subdivision 3.a.20. ICES estimated landings for each country participating in the fishery. Year Denmark Sweden Germany Belgium Norway Netherlands Total
1972 5095 70 3 5168
1973 3871 80 6 3957
1974 3429 70 5 3504
1975 4888 77 6 4971
1976 9251 51 717 6 10025
1977 12855 142 846 6 13849
1978 13383 94 371 9 13857
1979 11045 67 763 9 11884
1980 9514 71 914 11 10510
1981 8115 110 263 13 8501
1982 7789 146 127 11 8073
1983 6828 155 133 14 7130
1984 7560 311 27 22 7920
1985 9646 296 136 18 10096
1986 10645 202 505 26 11378
1987 11327 241 907 27 12502
1988 9782 281 716 41 10820
1989 5414 320 230 33 5997
1990 8729 779 471 69 10048
1991 5809 472 15 315 68 6679
1992 8514 381 16 537 106 9554
1993 9125 287 37 326 79 9854
1994 8783 315 37 325 91 9551
1995 8468 337 48 302 224 9379
1996 7304 260 11 428 8003
1997 7306 244 14 249 7813
1998 6132 208 11 98 6449
1999 6473 233 7 336 7049
2000 6680 230 5 67 6982
2001 9045 125 61 9231
2002 6773 141 3 164 3 7084

ICES Advice on fishing opportunities, catch, and effort Published 30 June 2016
ICES Advice 2016, Book 6 11
Year Denmark Sweden Germany Belgium Norway Netherlands Total
2003 5079 143 8 385 1484 7098
2004 5999 545 67 111 1288 8011
2005 4684 554 14 9 823 6084
2006 6563 366 21 352 1059 8361
2007 5656 281 21 166 1503 7626
2008 7163 220 17 117 775 8292
2009 5828 92 13 62 506 6500
2010 7101 127 13 103 1331 8676
2011 7746 179 13 230 15 8183
2012 7338 155 12 136 10 7651
2013 6326 160 10 138 181 6815
2014 7484 240 46 48 506 8981
2015 7808 274 14 69 1639 9804

ICES Advice on fishing opportunities, catch, and effort Published 30 June 2016
ICES Advice 2016, Book 6 12
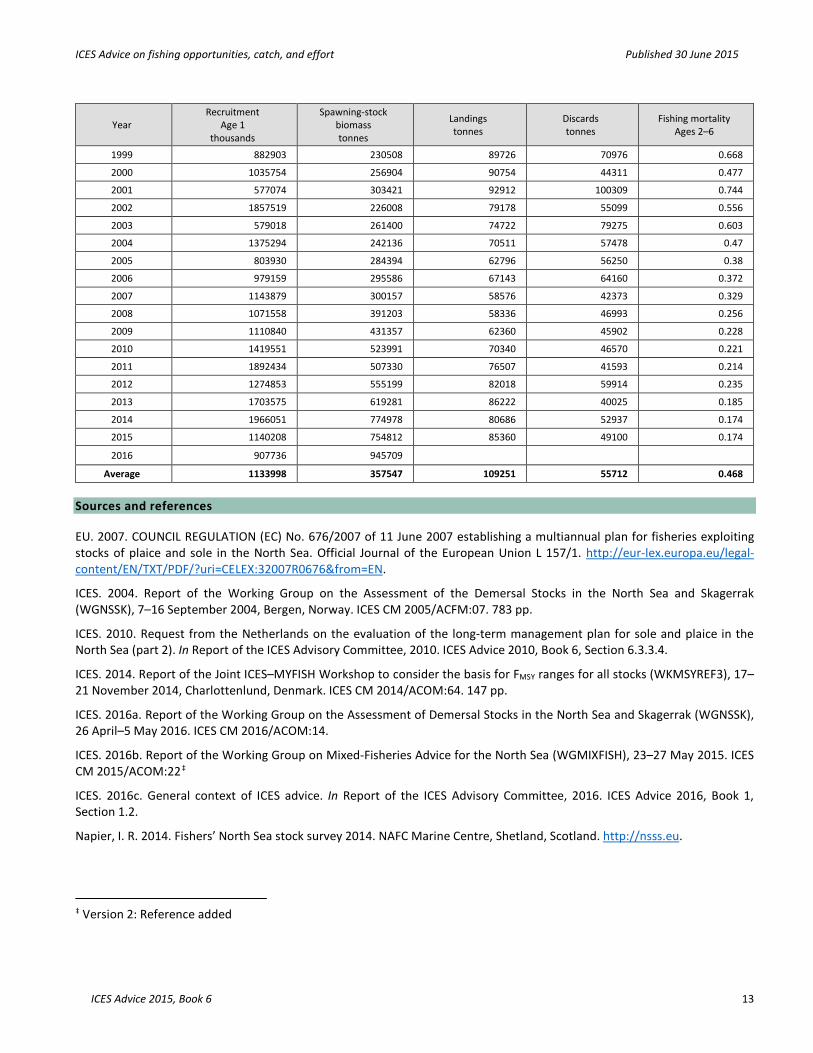
Summary of the assessment Table 6.3.36.10 Plaice in Division 4 and Subdivision 3.a.20. Assessment summary. Weights are in tonnes.
Year Recruitment
Age 1 thousands
Spawning-stock biomass tonnes
Landings tonnes
Discards tonnes
Fishing mortality Ages 2–6
1957 460518 274522 70563 7880 0.284 1958 700350 285276 73354 14837 0.331 1959 864891 290983 79300 29864 0.37 1960 760716 300102 87541 29793 0.368 1961 866067 313758 85984 32490 0.35 1962 593498 373171 87472 37903 0.379 1963 694671 359434 107118 41258 0.422 1964 2254825 353366 110540 37031 0.464 1965 701920 330960 97143 43080 0.383 1966 594050 360172 101834 64718 0.395 1967 407196 416311 108819 54546 0.425 1968 438895 404080 111534 27987 0.335 1969 658811 372570 121651 21169 0.353 1970 664223 330537 130342 29640 0.46 1971 420332 315802 113944 22995 0.379 1972 374301 319302 122843 19632 0.406 1973 1320356 269028 130429 13354 0.47 1974 1136000 276144 112540 44945 0.492 1975 864714 288327 108536 86699 0.576 1976 691691 302097 113670 53247 0.424 1977 990829 308977 119188 57501 0.513 1978 920713 296206 113984 45655 0.455 1979 905430 294824 145347 67935 0.663 1980 1148883 274888 140764 31080 0.554 1981 901574 264149 141233 33031 0.539 1982 2111275 265691 156153 49127 0.588 1983 1368338 325094 145779 74483 0.558 1984 1299663 346524 165772 70816 0.57 1985 1880989 377342 171838 60549 0.51 1986 4797263 408832 178878 129953 0.644 1987 1979144 481620 168759 190524 0.704 1988 1830953 411146 168552 156423 0.701 1989 1250820 429704 178891 107793 0.613 1990 1084035 393180 169453 71225 0.573 1991 959797 365941 157277 80935 0.618 1992 811532 308734 136727 57049 0.615 1993 565366 273504 128506 35016 0.6 1994 480910 251627 121925 23785 0.577 1995 1197928 236939 109348 21828 0.614 1996 1339279 209525 91386 52049 0.624 1997 2212118 234011 92958 100145 0.772 1998 813659 254039 79810 103751 0.683
ICES Advice on fishing opportunities, catch, and effort Published 30 June 2015
ICES Advice 2015, Book 6 13
Year Recruitment
Age 1 thousands
Spawning-stock biomass tonnes
Landings tonnes
Discards tonnes
Fishing mortality Ages 2–6
1999 882903 230508 89726 70976 0.668 2000 1035754 256904 90754 44311 0.477 2001 577074 303421 92912 100309 0.744 2002 1857519 226008 79178 55099 0.556 2003 579018 261400 74722 79275 0.603 2004 1375294 242136 70511 57478 0.47 2005 803930 284394 62796 56250 0.38 2006 979159 295586 67143 64160 0.372 2007 1143879 300157 58576 42373 0.329 2008 1071558 391203 58336 46993 0.256 2009 1110840 431357 62360 45902 0.228 2010 1419551 523991 70340 46570 0.221 2011 1892434 507330 76507 41593 0.214 2012 1274853 555199 82018 59914 0.235 2013 1703575 619281 86222 40025 0.185 2014 1966051 774978 80686 52937 0.174 2015 1140208 754812 85360 49100 0.174
2016 907736 945709
Average 1133998 357547 109251 55712 0.468 Sources and references EU. 2007. COUNCIL REGULATION (EC) No. 676/2007 of 11 June 2007 establishing a multiannual plan for fisheries exploiting stocks of plaice and sole in the North Sea. Official Journal of the European Union L 157/1. http://eur-lex.europa.eu/legal-content/EN/TXT/PDF/?uri=CELEX:32007R0676&from=EN.
ICES. 2004. Report of the Working Group on the Assessment of the Demersal Stocks in the North Sea and Skagerrak (WGNSSK), 7–16 September 2004, Bergen, Norway. ICES CM 2005/ACFM:07. 783 pp.
ICES. 2010. Request from the Netherlands on the evaluation of the long-term management plan for sole and plaice in the North Sea (part 2). In Report of the ICES Advisory Committee, 2010. ICES Advice 2010, Book 6, Section 6.3.3.4.
ICES. 2014. Report of the Joint ICES–MYFISH Workshop to consider the basis for FMSY ranges for all stocks (WKMSYREF3), 17–21 November 2014, Charlottenlund, Denmark. ICES CM 2014/ACOM:64. 147 pp.
ICES. 2016a. Report of the Working Group on the Assessment of Demersal Stocks in the North Sea and Skagerrak (WGNSSK), 26 April–5 May 2016. ICES CM 2016/ACOM:14.
ICES. 2016b. Report of the Working Group on Mixed-Fisheries Advice for the North Sea (WGMIXFISH), 23–27 May 2015. ICES CM 2015/ACOM:22‡
ICES. 2016c. General context of ICES advice. In Report of the ICES Advisory Committee, 2016. ICES Advice 2016, Book 1, Section 1.2.
Napier, I. R. 2014. Fishers’ North Sea stock survey 2014. NAFC Marine Centre, Shetland, Scotland. http://nsss.eu.
‡ Version 2: Reference added

Published 30 June 2016 ICES Advice on fishing opportunities, catch, and effort
14 ICES Advice 2016, Book 6
Ulrich, C., Hemmer-Hansen, J., Boje, J., Christensen, A., Hüssy, K., and Clausen, L. A. W. In press. Variability and connectivity of plaice populations from the Eastern North Sea to the Baltic Sea, Part II. Biological evidence of population mixing. Journal of Sea Research.