6.3.15 (update) advice november 2014 ecoregion north sea … reports/advice/2014... ·...
TRANSCRIPT
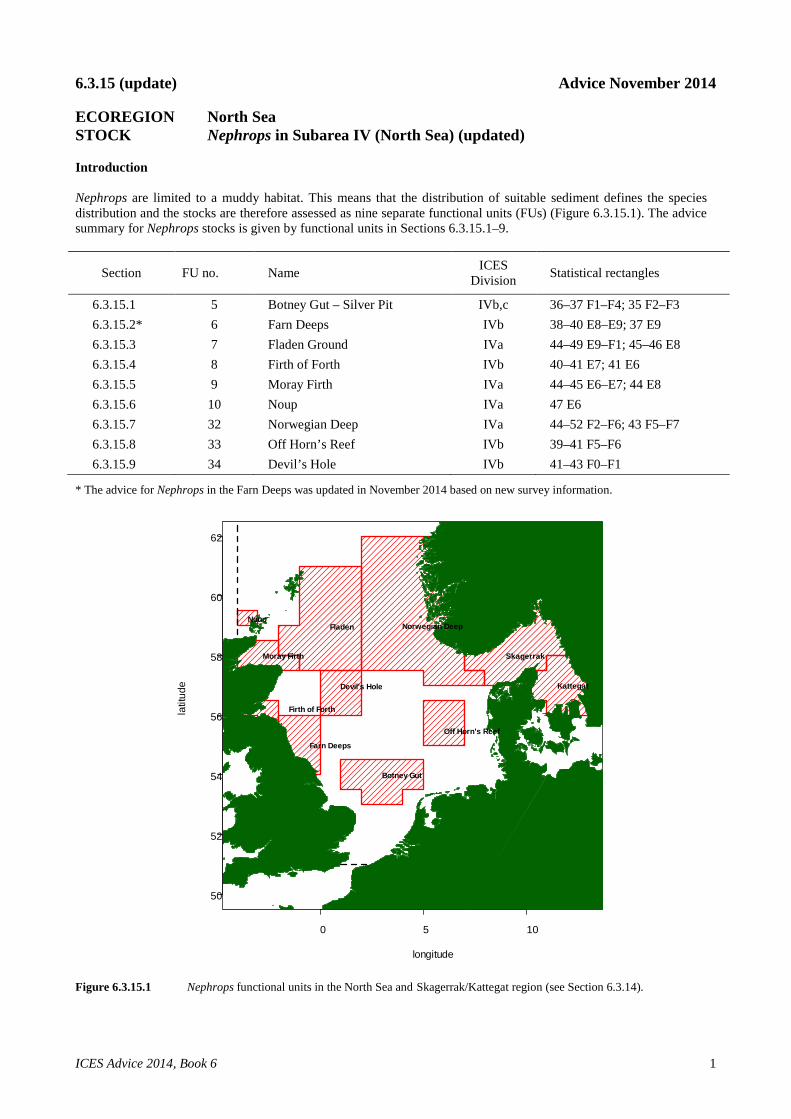
6.3.15 (update) Advice November 2014 ECOREGION North Sea STOCK Nephrops in Subarea IV (North Sea) (updated) Introduction Nephrops are limited to a muddy habitat. This means that the distribution of suitable sediment defines the species distribution and the stocks are therefore assessed as nine separate functional units (FUs) (Figure 6.3.15.1). The advice summary for Nephrops stocks is given by functional units in Sections 6.3.15.1–9.
Section FU no. Name ICES Division Statistical rectangles
6.3.15.1 5 Botney Gut – Silver Pit IVb,c 36–37 F1–F4; 35 F2–F3 6.3.15.2* 6 Farn Deeps IVb 38–40 E8–E9; 37 E9 6.3.15.3 7 Fladen Ground IVa 44–49 E9–F1; 45–46 E8 6.3.15.4 8 Firth of Forth IVb 40–41 E7; 41 E6 6.3.15.5 9 Moray Firth IVa 44–45 E6–E7; 44 E8 6.3.15.6 10 Noup IVa 47 E6 6.3.15.7 32 Norwegian Deep IVa 44–52 F2–F6; 43 F5–F7 6.3.15.8 33 Off Horn’s Reef IVb 39–41 F5–F6 6.3.15.9 34 Devil’s Hole IVb 41–43 F0–F1
* The advice for Nephrops in the Farn Deeps was updated in November 2014 based on new survey information.
0 5 10
50
52
54
56
58
60
62
longitude
latit
ude
Fladen
Moray Firth
Noup
Firth of Forth
Devil's Hole
Farn Deeps
Norwegian Deep
Botney Gut
Off Horn's Reef
Skagerrak
Kattegat
Figure 6.3.15.1 Nephrops functional units in the North Sea and Skagerrak/Kattegat region (see Section 6.3.14).
ICES Advice 2014, Book 6 1
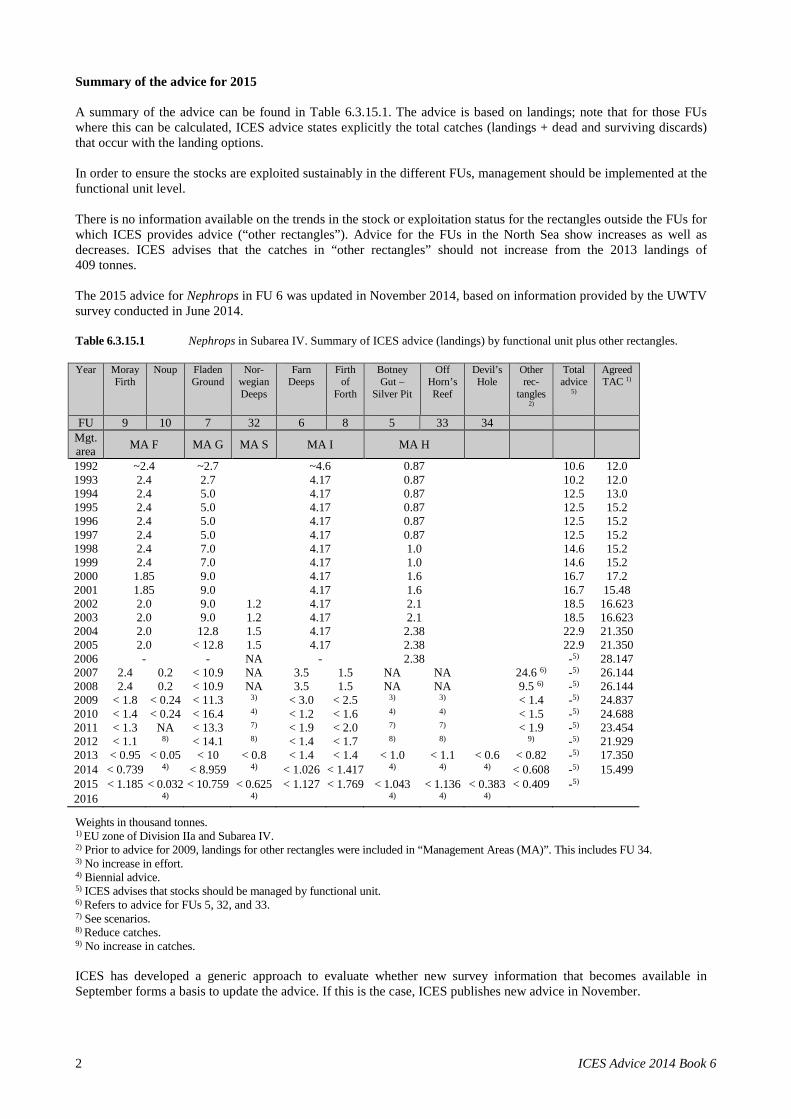
Summary of the advice for 2015 A summary of the advice can be found in Table 6.3.15.1. The advice is based on landings; note that for those FUs where this can be calculated, ICES advice states explicitly the total catches (landings + dead and surviving discards) that occur with the landing options. In order to ensure the stocks are exploited sustainably in the different FUs, management should be implemented at the functional unit level. There is no information available on the trends in the stock or exploitation status for the rectangles outside the FUs for which ICES provides advice (“other rectangles”). Advice for the FUs in the North Sea show increases as well as decreases. ICES advises that the catches in “other rectangles” should not increase from the 2013 landings of 409 tonnes. The 2015 advice for Nephrops in FU 6 was updated in November 2014, based on information provided by the UWTV survey conducted in June 2014. Table 6.3.15.1 Nephrops in Subarea IV. Summary of ICES advice (landings) by functional unit plus other rectangles. Year Moray
Firth Noup
Fladen Ground
Nor-wegian Deeps
Farn Deeps
Firth of
Forth
Botney Gut –
Silver Pit
Off Horn’s Reef
Devil’s Hole
Other rec-
tangles 2)
Total advice
5)
Agreed TAC 1)
FU 9 10 7 32 6 8 5 33 34 Mgt. area MA F MA G MA S MA I MA H
1992 ~2.4 ~2.7 ~4.6 0.87 10.6 12.0 1993 2.4 2.7 4.17 0.87 10.2 12.0 1994 2.4 5.0 4.17 0.87 12.5 13.0 1995 2.4 5.0 4.17 0.87 12.5 15.2 1996 2.4 5.0 4.17 0.87 12.5 15.2 1997 2.4 5.0 4.17 0.87 12.5 15.2 1998 2.4 7.0 4.17 1.0 14.6 15.2 1999 2.4 7.0 4.17 1.0 14.6 15.2 2000 1.85 9.0 4.17 1.6 16.7 17.2 2001 1.85 9.0 4.17 1.6 16.7 15.48 2002 2.0 9.0 1.2 4.17 2.1 18.5 16.623 2003 2.0 9.0 1.2 4.17 2.1 18.5 16.623 2004 2.0 12.8 1.5 4.17 2.38 22.9 21.350 2005 2.0 < 12.8 1.5 4.17 2.38 22.9 21.350 2006 - - NA - 2.38 -5) 28.147 2007 2.4 0.2 < 10.9 NA 3.5 1.5 NA NA 24.6 6) -5) 26.144 2008 2.4 0.2 < 10.9 NA 3.5 1.5 NA NA 9.5 6) -5) 26.144 2009 < 1.8 < 0.24 < 11.3 3) < 3.0 < 2.5 3) 3) < 1.4 -5) 24.837 2010 < 1.4 < 0.24 < 16.4 4) < 1.2 < 1.6 4) 4) < 1.5 -5) 24.688 2011 < 1.3 NA < 13.3 7) < 1.9 < 2.0 7) 7) < 1.9 -5) 23.454 2012 < 1.1 8) < 14.1 8) < 1.4 < 1.7 8) 8) 9) -5) 21.929 2013 < 0.95 < 0.05 < 10 < 0.8 < 1.4 < 1.4 < 1.0 < 1.1 < 0.6 < 0.82 -5) 17.350 2014 < 0.739 4) < 8.959 4) < 1.026 < 1.417 4) 4) 4) < 0.608 -5) 15.499 2015 < 1.185 < 0.032 < 10.759 < 0.625 < 1.127 < 1.769 < 1.043 < 1.136 < 0.383 < 0.409 -5) 2016 4) 4) 4) 4) 4)
Weights in thousand tonnes. 1) EU zone of Division IIa and Subarea IV. 2) Prior to advice for 2009, landings for other rectangles were included in “Management Areas (MA)”. This includes FU 34. 3) No increase in effort. 4) Biennial advice. 5) ICES advises that stocks should be managed by functional unit. 6) Refers to advice for FUs 5, 32, and 33. 7) See scenarios. 8) Reduce catches. 9) No increase in catches. ICES has developed a generic approach to evaluate whether new survey information that becomes available in September forms a basis to update the advice. If this is the case, ICES publishes new advice in November.
2 ICES Advice 2014 Book 6

Mixed-fisheries advice Mixed-fisheries advice informs managers of the consequences of setting TACs for single species which are exploited in a mixed fishery (ICES, 2014c). In contrast to single-species advice there is no single recommendation because no management objectives have been defined for mixed fisheries. Mixed-fisheries forecasts explore a range of scenarios which provide insight on the overall balance between the various single-species TACs. Major differences between the outcomes of the various scenarios indicate a potential for underestimating or overestimating the advised landings corresponding to the single-species advice. The results provide an indication of which species are globally limiting for the North Sea fisheries as a whole, but may not necessarily reflect the actual constraints on individual fishers. Assuming fishing patterns and catchability in 2014 and 2015 are unchanged from those in 2013, cod and Nephrops in FU 6 are the limiting species (73% and 27%, respectively) for the effort of fleets in the North Sea demersal fisheries in 2015. The current single-stock Nephrops advice for each of the functional units (with the exception of FU 6) leads to catches of cod which are potentially higher than allowed by the cod management plan, i.e. if the cod management plan is strictly enforced catches of Nephrops would be lower than allowed in the single-stock advice. The mixed fisheries projections have not been updated in November. The revised advice for haddock, whiting, Nephrops in FU6, plaice and sole, based on the new survey information, does not change the general perception of which stocks are more likely to limit the North Sea fisheries in 2015. Table 6.3.15.2 Nephrops in Subarea IV. Landings of Nephrops according to single-stock advice and under different mixed-
fisheries scenarios (ICES, 2014c).
Moray Firth
Noup
Fladen Ground
Nor-wegian Deeps
Farn Deeps
Firth of Forth
Botney Gut –Silver Pit
Off Horn’s Reef
Devil’s Hole
Other rec-tangles 2)
FU 9 10 7 32 6 8 5 33 34 Single-stock advice < 1.185 < 0.032 < 10.759 < 0.625 < 1.127 < 1.769 < 1.043 < 1.136 < 0.383 < 0.409
Mixed-fisheries scenarios – not updated in November Maximum 2.215 0.064 10.758 1.247 11.215 5.234 2.082 2.267 0.764 0.816 Minimum 0.205 0.006 0.867 0.108 0.999 0.484 0.181 0.197 0.066 0.071 Cod MP 0.363 0.010 1.572 0.197 1.819 0.881 0.328 0.357 0.120 0.129 SQ effort 0.684 0.019 2.961 0.370 3.425 1.660 0.618 0.673 0.227 0.242 Effort 0.216 0.006 0.904 0.124 1.252 0.552 0.207 0.225 0.076 0.081
Weights in thousand tonnes. Mixed fisheries assumptions: A. Maximum scenario: Fleets stop fishing when the last quota is exhausted. B. Minimum scenario: Fleets stop fishing when the first quota is exhausted. C. Cod management plan scenario: Fleets stop fishing when the cod quota is exhausted. D. SQ effort scenario: Effort in 2014 and 2015 as in 2013. E. Effort management scenario: Effort reductions according to cod and flatfish management plans.
Biology Nephrops is limited to a muddy habitat, and requires sediment with a silt and clay content of 10–100% to excavate its burrows. This means that the distribution of suitable sediment defines the species distribution. Adult Nephrops only undertake very small-scale movements (a few 100 m), but larval transfer may occur between separate mud patches in some areas. Catches typically consist of a lower proportion of females than males due to the lower burrow emergence (resulting in lower catchability) of females during the egg bearing. Environmental influence on the stock Cod has been identified as a major predator of Nephrops in some areas. The generally low level of cod in the North Sea is likely to have resulted in reduced predation. Multispecies models applied in the past to the exploitation of Irish Sea stocks indicated that management strategies which lead to an increase in the cod stock are associated with a reduction in Nephrops abundance. Therefore it may be expected that Nephrops stocks in the North Sea will decrease when cod recovers.
ICES Advice 2014, Book 6 3

Effects of the fisheries on the ecosystem Trawling for Nephrops results in bycatch and discards of other species, including cod, haddock, and whiting. Mesh sizes of 80 mm (in some areas 80–99 mm) are the ones most used in the Nephrops fisheries and the resulting proportion of discarded fish can be high. Initiatives are in place to reduce discarding (see below Factors affecting the fisheries and the stock). Mortality of Nephrops after discarding is considered to be high. The high mud content and soft nature of Nephrops grounds means that trawling readily marks the seabed, with trawl marks remaining visible for some time. Burrowing fauna can be seen re-emerging from freshly trawled grounds, implying that there is some resilience to trawling. Additional considerations Advice considerations The overriding management consideration for these stocks is that management should be at the functional unit (FU) rather than the ICES subarea level. Management at the functional unit level should provide the controls to ensure that catch opportunities and effort are compatible and in line with the scale of the resources in each of the stocks defined by the functional units. Functional unit TAC management is therefore only one way of managing the fisheries and other approaches may also deliver the required safeguards. Current management of Nephrops in Subarea IV (both in terms of TACs and effort) does not provide adequate safeguards to ensure that local effort is sufficiently limited to avoid depletion of resources in functional units. In the current situation vessels are free to move between grounds, allowing effort to develop on some grounds in a largely uncontrolled way and this has historically resulted in inappropriate harvest rates from some parts. This is a particular problem in the Farn Deeps where increased vessel activity from other parts of the UK occurred, resulting in low stock levels. MSY approach No precautionary reference points have been defined for Nephrops. Under the ICES MSY approach, exploitation rates that are likely to generate high long-term yield (and low probability of stock overfishing) have been explored and proposed for each functional unit. Owing to the way Nephrops are assessed, it is not possible to estimate FMSY directly and hence proxies for FMSY are determined. Three candidates for FMSY are F0.1, F35%SPR, and Fmax. There may be strong differences in relative exploitation rates between the sexes in many stocks. To account for this values for each of the candidates have been determined for males, females, and the two sexes combined. The appropriate FMSY candidate has been selected for each functional unit independently according to the perception of stock resilience, factors affecting recruitment, population density, knowledge of biological parameters, and the nature of the fishery (relative exploitation of the sexes and historical harvest rate vs. stock status). A decision-making framework based on the table below was used in the selection of preliminary stock-specific FMSY proxies (ICES, 2010). These proxies may be modified following further data exploration and analysis. The combined-sex FMSY proxy should be considered appropriate if the resulting percentage of virgin spawner-per-recruit for males or females does not fall below 20%. When this does happen a more conservative sex-specific FMSY proxy should be picked instead of the combined proxy.
Burrow density (average burrows m−2) Low Medium High < 0.3 0.3–0.8 >0.8 Observed harvest rate or landings compared to stock status (historical performance)
> Fmax F35%SPR Fmax Fmax Fmax–F0.1 F0.1 F35%SPR Fmax < F0.1 F0.1 F0.1 F35%SPR Unknown F0.1 F35%SPR F35%SPR
Stock size estimates Variable F0.1 F0.1 F35%SPR Stable F0.1 F35%SPR Fmax
Knowledge of biological parameters
Poor F0.1 F0.1 F35%SPR Good F35%SPR F35%SPR Fmax
Fishery history Stable spatially and temporally F35%SPR F35%SPR Fmax Sporadic F0.1 F0.1 F35%SPR Developing F0.1 F35%SPR F35%SPR
The proposed preliminary MSY Btrigger values were set at the lowest observed UWTV abundance, unless the stock has shown signs of stress at higher abundance (in which case a higher value is used).
4 ICES Advice 2014 Book 6
Impacts of fisheries on the ecosystem The immediate survival rate of discarded trawl-caught Nephrops is highly variable and depends on many factors, including tow duration, catch composition, air temperature, and post-capture handling. There are no recent estimates for the fisheries in Subarea IV, but estimates from studies conducted in other areas range from 20-40% in the West of Scotland (Wileman et al., 1999) to 45–65% in the Bay of Biscay (Méhault et al., 2011). The type of ground the Nephrops are returned to will affect their longer-term survival, as Nephrops have specific sediment requirements for the construction of burrows. The probability of being returned to suitable habitat will therefore depend upon the fishery practice and the spatial structure of the particular grounds. Large, more homogeneous grounds like Fladen (FU 7) are more likely to have a higher survival rate when compared to discarding on patchier grounds like Devil’s Hole (FU 34) or Botney Gut (FU 5). The length of the trip undertaken will also affect discard survival; in boats on day-trips some of the sorting process will be undertaken whilst steaming back to port and, therefore, discards from the latter hauls are unlikely to return to suitable sediment. Understanding and experience of the individual fisheries are, therefore, used in combination with the estimates from the published studies to derive FU-specific discard survival rates. In general, catches of cod in the Nephrops fisheries have been relatively low, particularly in recent years in inshore grounds of Subarea IV, but can vary amongst functional units. However, it is important that emerging year classes of cod should not be subjected to high discard mortality. The capture of juvenile fish or other species such as whiting and haddock is also a problem in some of the functional units and discarding of these is a problem in some years. This problem is being addressed with the use of more selective gear, and efforts are already being made in Scotland through the Conservation Credits scheme, requiring vessels targeting Nephrops to use gear with larger square-meshed panels (up to 200 mm) or other highly selective gear (HSG) devices. Subject to evaluation of the effectiveness of these measures, further action may be required to reduce discards. Cod has been identified as a major predator of Nephrops in some areas. The generally low level of cod in the North Sea has resulted in reduced predation by cod. Multispecies models applied in the past to the exploitation of Irish Sea stocks indicated that management strategies which lead to an increase in the cod stock are associated with a reduction in Nephrops abundance. Therefore it may be expected that Nephrops stocks in the North Sea will decrease when cod recovers. Factors affecting the fisheries and the stock The implementation of the “buyers and sellers” regulations in the UK in 2006 considerably tightened up the levels of reporting for Nephrops, and the landings figures since then are considered to be more reliable. Recent increases in landings and lpue may result from the increase in reporting levels and do not necessarily reflect changes to the stock. A ban on the use of multitrawl gears (three or more trawls) for all Scottish boats was introduced in April 2008, limiting the expansion of effective effort. Effort restrictions in the EU were introduced in 2003 (annexes to the annual TAC regulations) for the protection of the North Sea cod stock. In addition, a long-term plan for the recovery of cod stocks was adopted in 2008 (Council Regulation (EC) No. 1342/2008). In 2009, the effort management programme switched from a days-at-sea to a kW-day system (Council Regulation (EC) No. 43/2009), in which different amounts of kW-days are allocated within each area by Member Country to different groups of vessels, depending on gear and mesh size. Effort ceilings are updated annually. However, for 2013, the European Council decided upon a roll-over of the effort level of 2012 into 2013 and 2014 for both the cod and the sole/plaice management plans. Overall nominal effort (kW-days) by EU demersal trawls, seines, beam trawls, gill/trammelnets, and longlines (all mesh sizes included) in the North Sea, Skagerrak, and Eastern Channel had been substantially reduced since the implementation of the two successive effort management plans in 2003 and 2008 (−38% between 2003 and 2013, −17% between 2008 and 2013). Following the introduction of days-at-sea regulations in 2003, there was a substantial switch from the larger mesh (>100 mm, TR1) gear to the smaller mesh (70–99 mm, TR2) gear. Subsequently, effort by TR1 has been relatively stable, whereas effort in TR2 and in small-meshed beam trawl (80–120 mm, BT2) has shown a pronounced decline (0%, −52%, and −52%, respectively, between 2004 and 2013). Gill- and trammelnet fisheries have remained stable (ICES, 2014c). Effort in large-meshed beam trawl (≥120 mm, BT1) has increased significantly in 2012 and 2013 after a decade of continuous decline. Nominal effort reported by Norway has increased since 2011 due to the generalization of electronic logbooks. The Scottish industry operates under the Conservation Credits scheme and has implemented improved selectivity measures in gears which target Nephrops as well as real-time closures with a view to reducing unwanted bycatch of cod and other species. Since 2010 a number of vessels are reported to be using large square-meshed panels (of up to 160 mm). In 2012 most vessels operating in Division IVa and the Farn Deeps fish exclusively with specified highly
ICES Advice 2014, Book 6 5
selective gears (that have been shown to reduce cod catches by 60% by weight) or have installed 200 mm square mesh panels. Data and methods Assessments of the Nephrops functional units of Subarea IV utilized a number of approaches, including underwater TV (UWTV) surveys, length composition information, and basic fishery data such as landings and effort. Owing to uncertainties in the accuracy of historical landings and to inaccurate effort figures in some fisheries, increasing attention is paid to survey information and size composition data as an indicator of stock status. For those stocks without UWTV surveys, assessment is made on the basis of ICES approach to data-limited Nephrops stocks. Biennial advice for these stocks is given for 2015 and 2016. In 2009 there were important developments in the methodology to assess the status of Nephrops stocks. The use of UWTV surveys has enabled the development of fishery-independent indicators of abundance. STECF (2005) suggested that a combination of an absolute abundance estimate from an UWTV survey and a harvest rate based on F0.1 from a combined-sex length cohort analysis (LCA) and the mean weight and selection pattern from the commercial fishery, could be used to calculate appropriate landings. The approach has been further developed and evaluated by ICES workshops in 2007 and 2009 (ICES, 2007, 2009). The 2009 workshop addressed concerns raised regarding factors which could potentially bias the UWTV survey results. Major sources of bias were quantified for each survey and an overall bias correction factor derived which, when applied to the estimates of abundance from the UWTV survey, allows them to be treated as absolute abundance levels. In particular the workshop concluded that the burrows of Nephrops detected in the UWTV surveys are considerably smaller than the sizes of the Nephrops taken by the fishery. Therefore, the abundance estimates used to calculate the harvest ratios presented in the 2009 advice include a component of the stock that is too small to be exploited by the fishery. This has resulted in calculated harvest ratios appearing to have decreased in the current advice compared to previous estimates of harvest ratios. In essence, this is a scaling issue, not a change in exploitation rate. The previous proportion corresponding to fishing at F0.1 was in the range of 15–20%, whereas the revised values from the benchmark in 2009 are in the range of 8–10%. At the Nephrops benchmark meeting in February 2013 (ICES, 2013), stocks in FUs 6, 32, and 34 were examined. For FU 6 new maturity estimates were presented along with a more detailed analysis concerning the possibility of sperm limitation in depleted stocks. For FU 32 available data sources were investigated, but the assessment was not changed. For FU 34, a detailed analysis of spatial distribution of the fishing grounds was presented, leading to an improved methodology for UWTV determination of the abundance in this FU. Information from the fishing industry Results of the 2013 North Sea fishers’ stock survey were not available. Uncertainties in assessment and forecast For moderate exploitation rates the UWTV assessment provides an adequate basis for predicting catches. ICES has worked to reduce uncertainty and increase precision in the interpretation of survey data. There is a gap of at least 12 months (more commonly 18 months) between the survey and the start of the TAC year. It is assumed that the stock is stable during this period (i.e. recruitment and growth balance mortality). The effect of this assumption on realized harvest rates has not been investigated. The UWTV survey does not cover the complete spatial distribution of the stock, covering six of nine functional units and not the area outside the functional units. The area covered by the UWTV survey accounts for around 75% of the North Sea Nephrops landings in 2013. Landings from outside the FUs accounted for 4.4% of total landings in 2012. Vessel monitoring system (VMS) data for vessels >15 meters are being successfully used to match survey and fishery areas. The harvest ratios equivalent to FMSY proxies are based on yield-per-recruit analyses from length cohort analyses. These analyses utilize average length–frequency data, discarding rates, and mean weight taken over a three-year period. The benchmark in 2009 used data from 2005–2007 and changes in selection, discarding rates, and mean weights appear to have occurred since then. Consequently the harvest rates used as FMSY proxies are reconsidered every year for FUs assessed annually and updated where significant change in fishing practice is observed to have occurred.
6 ICES Advice 2014 Book 6

For data-limited stocks (FUs 5, 10, 32, 33, and 34) a number of assumptions are made on densities (assumed densities from neighbouring areas, or using old, exploratory survey results) which increases the uncertainty in the advice. Therefore, ICES uses a conservative boundary for harvest rates which is below the range of estimated FMSY for data-rich stocks. Sources ICES. 2007. Workshop on the Use of UWTV Surveys for Determining Abundance in Nephrops Stocks throughout
European Waters (WKNEPHTV). ICES CM 2007/ACFM:14. ICES. 2009. Report of the Benchmark Workshop on Nephrops (WKNEPH), 2–6 March 2009, Aberdeen, UK. ICES
CM 2009/ACOM:33. ICES. 2010. Report of the Working Group on the Assessment of Demersal Stocks in the North Sea and Skagerrak
(WGNSSK), 5–11 May 2010. ICES CM 2010/ACOM:13. ICES. 2013. Benchmark Workshop on Nephrops Stocks (WKNEPH), 25 February–1 March 2013, Lysekil, Sweden.
ICES CM 2013/ACOM:45. ICES. 2014a. Advice basis. In Report of the ICES Advisory Committee, 2014. ICES Advice 2014, Book 1, Section
1.2. ICES. 2014b. Report of the Working Group on the Assessment of Demersal Stocks in the North Sea and Skagerrak
(WGNSSK), 30 April–7 May 2014. ICES CM 2014/ACOM:13. ICES. 2014c. Report of the Working Group on Mixed-Fisheries Advice for the North Sea (WGMIXFISH), 26–30
May 2014. ICES CM 2014/ACOM:22. Méhault, S., Morandeau, F., and Fifas, S. 2011. Discarded Nephrops survival after trawling. Working document for
ICES Nephrops working group. IFREMER report of project PRESPO. 15 pp. Morizur, Y. 1982. Estimation de la mortalité pour quelque stocks de langoustine, Nephrops norvegicus. ICES CM
1982/K:10. STECF. 2005. Commission Staff Working Paper. 21st Report of the Scientific, Technical and Economic Committee
for Fisheries (Second Plenary Meeting). Brussels, 7–11 November 2005. Wileman, D. A., Sangster, G. I., Breen, M., Ulmestrand, M., Soldal, A. V., and Harris, R. R. 1999. Roundfish and
Nephrops survival after escape from commercial fishing gear. Final report to the EC (FAIR-CT95-0753), Brussels.
ICES Advice 2014, Book 6 7

Table 6.3.15.3 Nephrops in Subarea IV. Official landings (tonnes) of Nephrops, as reported to ICES by functional unit plus other rectangles. Note that for 2012 and 2013 official statistics were not complete and ICES estimates were used.
Year FU 5 FU 6 FU 7 FU 8 FU 9 FU 10 FU 32 FU 33 FU
34*** Other ** Total
1981 1073 372 1007 1416 35 76 3979 1982 2524 421 1195 1119 19 157 5435 1983 2078 693 1724 941 16 101 5553 1984 1479 646 2134 1169 111 88 5627 1985 2027 1147 1968 2081 22 139 7384 1986 2015 1543 2263 2143 67 23 204 8258 1987 2191 1695 1675 1992 45 5 195 7798 1988 2495 1575 2529 1959 76 2 364 9000 1989 3098 2299 1888 2576 84 28 233 10206 1990 2498 2540 1931 2037 218 26 222 9472 1991 862 2063 4223 1405 1520 197 85 560 10915 1992 612 1473 3363 1756 1591 188 106 401 9490 1993 721 3030 3492 2368 1809 376 339 160 44 434 12773 1994 503 3683 4568 1850 1537 494 755 137 129 703 14359 1995 869 2569 6419 1762 1279 279 489 164 132 844 14806 1996 679 2483 5210 1687 1451 345 952 77 129 808 13821 1997 1149 2189 6170 2193 1447 317 760 276 100 662 15263 1998 1111 2177 5136 2144 1032 256 836 350 88 694 13824 1999 1244 2391 6518 2207 1009 278 1119 724 202 988 16680 2000 1121 2178 5570 1785 1539 274 1084 597 184 900 15232 2001 1443 2574 5542 1527 1401 177 1190 791 271 1268 16184 2002 1231 1954 7245 1340 1132 403 1170 861 343 1383 17062 2003 1144 2245 6294 1127 1080 336 1089 929 675 1390 16309 2004 1070 2153 8730 1657 1333 228 922 1268 488 1224 19073 2005 1099 3094 10684 1989 1605 165 1089 1050 378 1120 22273 2006 974 4903 10791 2458 1805 133 1028 1288 448 1249 25077 2007 1294 2966 11911 2651 1843 153 755 1467 717 1637 25394 2008 963 1218 12239 2450 1515 172 675 1444 937 1673 23286 2009 728 2703 13327 2663 1067 87 477 1163 1305 2367 25887 2010 959 1443 12968 1950 1063 39 407 806 865 709 21209 2011 1053 2070 7559 1889 1391 68 395 1191 432 1166 17214
2012 1240 2460 4415 2129 866 13 310 1084 597 608 13722
2013* 1050 2982 2959 1501 655 15 191 946 121 409 10829
* Provisional. ** Includes landings from Division IIIa until 2010. *** Separate landings for Devil’s Hole only available since the 2010 assessment.
8 ICES Advice 2014 Book 6

6.3.15.1 Advice June 2014 ECOREGION North Sea STOCK Nephrops in Botney Gut–Silver Pit (FU 5) Advice for 2015 and 2016 ICES advises on the basis of ICES approach to data-limited stocks that catches should be no more than 1159 t. If discard rates do not change from the assumed rate of 25%, this implies landings of no more than 1043 t. To protect the stock in this functional unit, management should be implemented at the functional unit level. State of the stock
Fishing pressure 2011–2013
MSY (FMSY) Unknown Precautionary approach (Fpa, Flim) Unknown
Qualitative evaluation Below possible reference points
Stock size 2011–2013
MSY (Btrigger) Unknown Precautionary approach (Bpa, Blim) Unknown
Qualitative evaluation Above poss. reference points
Figure 6.3.15.1.1 Nephrops, Botney Gut–Silver Pit (FU 5): Official landings by country (tonnes). The state of this stock is unknown. Preliminary stock surveys (2010 and 2012) indicate relatively high density compared to neighbouring FUs, which, when compared to estimated landing numbers imply harvest rates considerably below those associated with MSY for other North Sea Nephrops stocks. Management plans No specific management objectives are known to ICES.
ICES Advice 2014, Book 6 9
The fisheries The Nephrops fisheries in the Botney Gut are solely bottom trawl fisheries. For many years Belgium was the only country exploiting Nephrops in this area. Since 2005 the Netherlands and the UK have become the most important exploiters of this stock, taking around 80% of the total international landings. Quality considerations The advice is based on a calculation of potential landing options and harvest rates, given the known surface area of Nephrops habitat and assumed densities of the functional unit. The methods applied to derive quantitative advice for data-limited stocks are expected to evolve as they are further developed and validated. Scientific basis
Stock data category 4.1.4 (ICES, 2014a). Assessment type Data-limited method for Nephrops. Input data Commercial catches (international landings and length frequencies from Dutch catch
sampling); one survey index (UWTV estimates of density per m2 in 2010, 2012, and 2013); habitat extent from VMS analysis and sediment maps.
Discards and bycatch Used to provide advice, but not included in the assessment. Discard rates and individual weights for this stock are unknown. Values from neighbouring Nephrops stocks were applied to generate the total catch advice.
Indicators None. Other information None. Working group Working Group on the Assessment of Demersal Stocks in the North Sea and Skagerrak
(WGNSSK).
10 ICES Advice 2014 Book 6
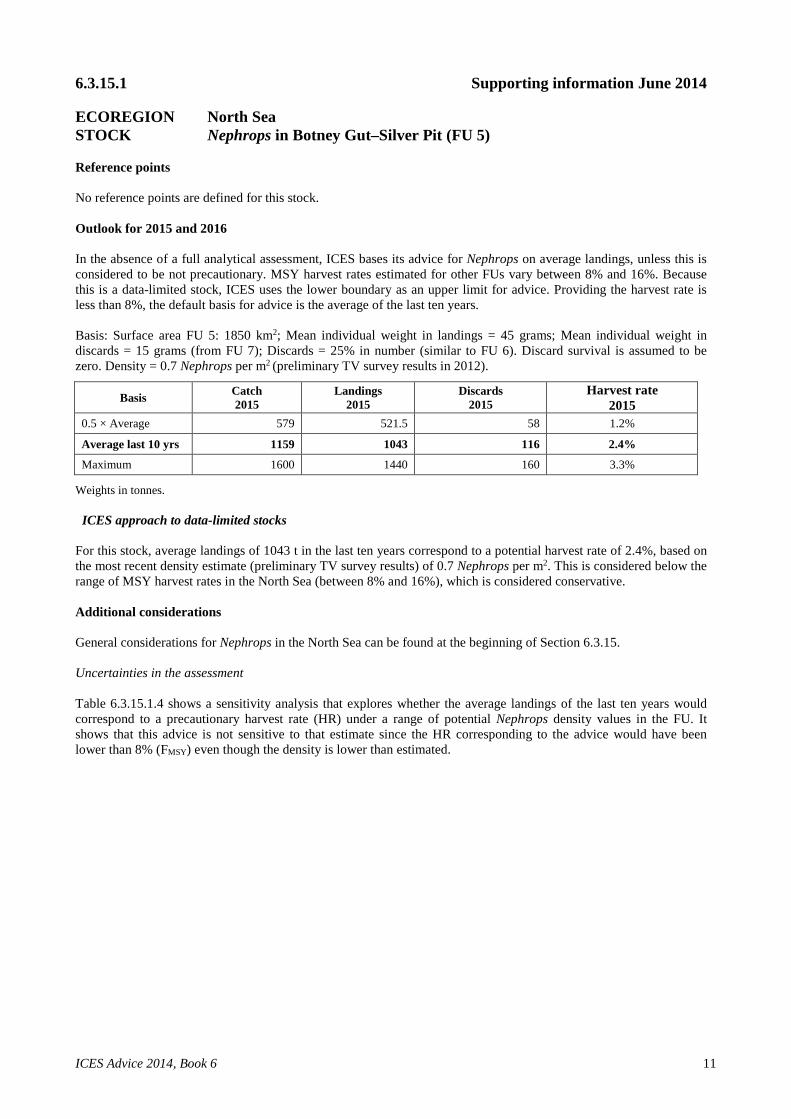
6.3.15.1 Supporting information June 2014 ECOREGION North Sea STOCK Nephrops in Botney Gut–Silver Pit (FU 5) Reference points No reference points are defined for this stock. Outlook for 2015 and 2016 In the absence of a full analytical assessment, ICES bases its advice for Nephrops on average landings, unless this is considered to be not precautionary. MSY harvest rates estimated for other FUs vary between 8% and 16%. Because this is a data-limited stock, ICES uses the lower boundary as an upper limit for advice. Providing the harvest rate is less than 8%, the default basis for advice is the average of the last ten years. Basis: Surface area FU 5: 1850 km2; Mean individual weight in landings = 45 grams; Mean individual weight in discards = 15 grams (from FU 7); Discards = 25% in number (similar to FU 6). Discard survival is assumed to be zero. Density = 0.7 Nephrops per m2 (preliminary TV survey results in 2012).
Basis Catch 2015
Landings 2015
Discards 2015
Harvest rate 2015
0.5 × Average 579 521.5 58 1.2%
Average last 10 yrs 1159 1043 116 2.4%
Maximum 1600 1440 160 3.3%
Weights in tonnes. ICES approach to data-limited stocks For this stock, average landings of 1043 t in the last ten years correspond to a potential harvest rate of 2.4%, based on the most recent density estimate (preliminary TV survey results) of 0.7 Nephrops per m2. This is considered below the range of MSY harvest rates in the North Sea (between 8% and 16%), which is considered conservative. Additional considerations General considerations for Nephrops in the North Sea can be found at the beginning of Section 6.3.15. Uncertainties in the assessment Table 6.3.15.1.4 shows a sensitivity analysis that explores whether the average landings of the last ten years would correspond to a precautionary harvest rate (HR) under a range of potential Nephrops density values in the FU. It shows that this advice is not sensitive to that estimate since the HR corresponding to the advice would have been lower than 8% (FMSY) even though the density is lower than estimated.
ICES Advice 2014, Book 6 11
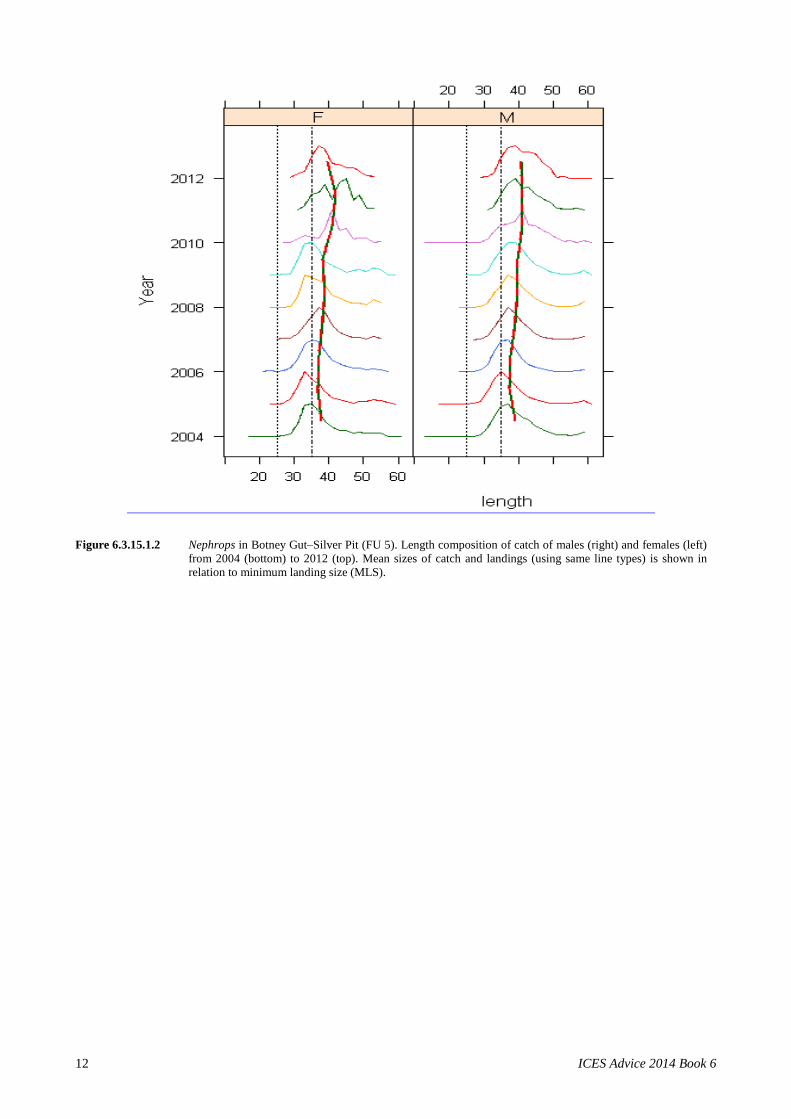
Figure 6.3.15.1.2 Nephrops in Botney Gut–Silver Pit (FU 5). Length composition of catch of males (right) and females (left) from 2004 (bottom) to 2012 (top). Mean sizes of catch and landings (using same line types) is shown in relation to minimum landing size (MLS).
12 ICES Advice 2014 Book 6

Table 6.3.15.1.1 Nephrops in Botney Gut–Silver Pit (FU 5). ICES advice and landings.
Year ICES advice Recommended landings
ICES landingsa
1991 0.9 1992 0.87 0.6 1993 0.87 0.7 1994 0.87 0.5 1995 0.87 0.9 1996 0.87 0.7 1997 0.87 1.1 1998 1.0 1.1 1999 1.0 1.2 2000 1.6 1.1 2001 1.6 1.4 2002 2.1 1.2 2003 2.1 1.1 2004 2.38 1.1 2005 2.38 1.1 2006 2.38b 1.0 2007 No increase in effort - 1.3 2008 No new advice, same as for 2007 - 0.9 2009 No increase in effort - 0.7 2010 No new advice, same as for 2009 - 1.0 2011 See scenarios - 1.0 2012 Reduce catches - 2013 Average landings (last 10 years) < 1.0 2014 Same catch advice as for 2013 < 1.0 2015 Average landings (last 10 years) < 1.043 2016 No new advice, same as for 2015 < 1.043
Weights in thousand tonnes. a Does not include discards. b Includes Off Horn’s Reef FU 33.
ICES Advice 2014, Book 6 13

Table 6.3.15.1.2 Nephrops in Botney Gut–Silver Pit (FU 5). ICES landings per country (tonnes).
Belgium Denmark Netherlands Germany UK Total**
1991 682 176 na 4 862
1992 571 22 na 19 612
1993 694 20 na 7 721
1994 494 0 na 9 503
1995 641 77 148 3 869
1996 266 41 317 55 679
1997 486 67 540 56 1149
1998 372 88 584 39 28 1111
1999 436 53 538 59 158 1244
2000 366 83 402 52 218 1121
2001 353 145 553 114 278 1443
2002 281 94 617 88 151 1231
2003 265 36 661 24 158 1144
2004 171 39 646 16 198 1070
2005 109 87 654 51 198 1099
2006 77 24 444 99 330 974
2007 75 3 464 201 551 1294
2008 49 29 268 108 509 963
2009 52 3 288 98 287 728
2010 48 5 354 140 411 959
2011 60 18 480 145 350 1053
2012 129 0 497 121 493 1240
2013* 142 1 447 168 292 1050
* Provisional. ** Totals for 1991–1994, excluding landings by the Netherlands. na = not available.
Table 6.3.15.1.3 Nephrops in Botney Gut–Silver Pit (FU 5). Results of preliminary UWTV surveys.
Year Stations Season Mean density burrows/m²
2010 - - - 2012 42 Autumn 0.7
Table 6.3.15.1.4 Nephrops in Botney Gut–Silver Pit (FU 5). Sensitivity analysis of harvest rates for a range of potential
densities.
Range of potential densities (Nephrops per m2)
Basis Catch landings discards 0.05 0.1 0.2 0.3 0.4 0.5 0.6 0.7* 0.8
0.5 × Average 579 521.5 58 16.7% 8.4% 4.2% 2.8% 2.1% 1.7% 1.4% 1.2% 1.0% Average last 10 years 1159 1043 116 33.4% 16.7% 8.4% 5.6% 4.2% 3.3% 2.8% 2.4% 2.1%
Maximum 1600 1440 160 46.1% 23.1% 11.5% 7.7% 5.8% 4.6% 3.8% 3.3% 2.9%
Weights in tonnes. Shaded areas indicate harvest rates >range of North Sea FMSY proxies of 8%–16%. * Most recent density estimate (preliminary TV survey results in 2012).
14 ICES Advice 2014 Book 6

6.3.15.2 (update) Advice November 2014 ECOREGION North Sea STOCK Nephrops in Farn Deeps (FU 6) (updated) Please note: The present advice replaces the advice given for this stock in June 2014. Advice for 2015 ICES advises on the basis of the MSY approach that if no discard ban is in place in 2015, landings should be no more than 1127 t, assuming that discard rates do not change from the average of the last three years (2011–2013) and that a fixed proportion of discards survive. In order to ensure the stock in this FU is exploited sustainably, management should be implemented at the functional unit level. Stock status
Fishing pressure 2011 2012 2013
MSY (FMSY) Above Precautionary approach (Fpa, Flim) Undefined
Stock size 2012 2013 2014
MSY (Btrigger) Below trigger Precautionary approach (Bpa, Blim) Undefined
Figure 6.3.15.2.1 Nephrops in Farn Deeps (FU 6). Long-term trends in catches, harvest rate, and UWTV abundance (used as
F and SSB proxies). Dashed green lines show proxies for MSY Btrigger and FMSY. For the UWTV abundance calculation a geostatistical method has been determined from 2007 onwards (red line).
The stock size has declined since 2005 and has been fluctuating near MSY Btrigger since 2007. Harvest rates have been above FMSY for all years except 2008. Management plans No specific management objectives are known to ICES.
ICES Advice 2014, Book 6 15
The fisheries Nephrops in FU 6 are predominantly caught in trawl fisheries using meshes in the 80–99 mm category. A small amount of creeling takes place. Increases in the numbers of vessels using twin-rig and multi-rig gears observed in this area are likely to have increased the effective fishing power per kW hour.
Catch distribution Total dead removals (2013) = 3431 t, of which 87% were landings (almost entirely taken in demersal trawl fisheries, either a directed Nephrops or a mixed Nephrops/demersal fishery) and 13% dead discards in weight.
Quality considerations Market sampling misses portions of the tailed category of landings which tend to be smaller individuals; the market sampling data may thus be biased towards larger sizes. Therefore the assessment only uses data from samples of the full unsorted catch when estimating the size composition of removals. Improvements in the recording of position (GPS) for the underwater TV survey from 2007 permits a more accurate estimate of absolute abundance than previously possible. Prior to this date there is a potential upward bias in the absolute estimate due to underestimation of the distance covered by the survey. The TV surveys in 2013 and 2014 were moved from October to June. Almost no directed fishery takes place between May and September so there is not expected to be any significant impact in the change of survey timing on stock abundance estimation. Scientific basis
Stock data category 1 (ICES, 2014a). Assessment type Underwater TV survey linked to yield-per-recruit analysis from length data. Input data One survey index (UWTV); Length–frequency data from the fishery. Commercial
catches (international landings and length frequencies from English catch sampling), one survey index (FU6 UWTV). Maturity data from commercial catch sampling. Natural mortalities from Morizur (1982).
Discards and bycatch Included in the assessment since 2000, data series from the majority of the fleet/ main fleets (covering 87% of the landings).
Indicators Sex ratio, length frequencies. Other information Latest benchmark was performed in 2013 (ICES, 2013). The advice was updated in
November 2014 based on information provided by the UWTV survey conducted in June 2014.
Working group Working Group on the Assessment of Demersal Stocks in the North Sea and Skagerrak WGNSSK.
16 ICES Advice 2014 Book 6

6.3.15.2 (update) Supporting information November 2013 ECOREGION North Sea STOCK Nephrops in Farn Deeps (FU 6) (updated) Reference points
Type Value Technical basis MSY approach
MSY Btrigger 858 million UWTV survey index at start of current decline (2007) FMSY Harvest rate 8.1%. Equivalent to F35%SPR males in 2011.
Precautionary approach
Not defined.
(Last changed in 2013) Harvest rate reference points (2013):
Male Female Combined Fmax 11.6 % 21.6 % 15.3 % F0.1 7.1% 14.0 % 8.7 % F35%SPR 8.1 % 15.2 % 11.1 %
For this functional unit (FU) the exploitation rate on males is usually considerably higher than on females and there is evidence of sperm-limitation following harvest rates in the region of 20%. There is evidence to suggest that in both 2006 and 2010 mature females have not been able to successfully mate and therefore a larger male spawning potential is desirable. To this effect the harvest rate equivalent to fishing at F35%SPR for males is suggested as a proxy for FMSY (F35%SPR, males = 8.1%). New size-at-maturity data were analyzed at the 2013 benchmark meeting, leading to revisions in the harvest rate reference points. Outlook for 2015 Basis: F2011–2013 = average harvest rate over 2011–2013 = 16.5%; Absolute survey abundance index 2015 = 755 (2014 index); Mean individual weight in landings (2011–2013) = 27.3 g; Mean individual weight in discards (2011–2013) = 10.3 g.
Basis Total
catches* Landings Dead
discards** Surviving discards**
Harvest rate
L+DD+SD L DD SD for L+DD MSY approach 1281 1127 131 23 7.1%
FMSY 1455 1280 149 26 8.1%
F2011–2013 2957 2601 303 53 16.5%
Other options 358 315 37 6 2%
717 631 73 13 4%
1255 1104 129 23 7%
1793 1577 184 32 10%
2151 1892 220 39 12%
2509 2207 257 45 14%
Weights in tonnes. * Total catches are the landings including dead and surviving discards. ** The total discard rate is assumed to be 26.61% of the catches (in number, average of the last three years (2011–2013)); discard
survival is assumed to be 15% (ICES, 2013). MSY approach Following the ICES MSY approach implies a harvest rate of 7.1%, which is below FMSY because biomass is below MSY Btrigger (FMSY × [SSB2015/MSY Btrigger = 8.1 × (755/858)]). Considering that no discard ban is in place in 2015, this results in landings of no more than 1127 t, assuming that discard rates do not change from the average of the last three years (2011–2013) and assuming a discard survival of 15%.
ICES Advice 2014, Book 6 17
Additional considerations General considerations for Nephrops in the North Sea can be found at the beginning of Section 6.3.15. Mixed fisheries In mixed-fisheries projections the “Minimum” scenario (where fishing is assumed to stop when the catch for any one of the stocks considered meets the single-stock advice) estimates that the Nephrops stock in FU 6 is one of the main limiting species for 2015, together with cod. Declines in abundance in other FUs (i.e. Firth of Forth and the Fladen grounds) may increase the risk of higher effort being deployed in this FU which would be inadvisable, given the current low level of the stock. The stock has shown signs of overexploitation in recent years, with an unbalanced sex ratio leading to poor recruitment. Without suitable controls on the movement of effort between functional units there is nothing to prevent the effort in 2015 from increasing and moving the observed harvest ratios even further beyond the level of FMSY. Comparison of the basis of previous assessment and advice The basis for the assessment has not changed from last year. The basis for the advice this year is the same as last year: the MSY approach. The advice for 2015 was updated in November, based on information provided by the UWTV survey conducted in June 2014.
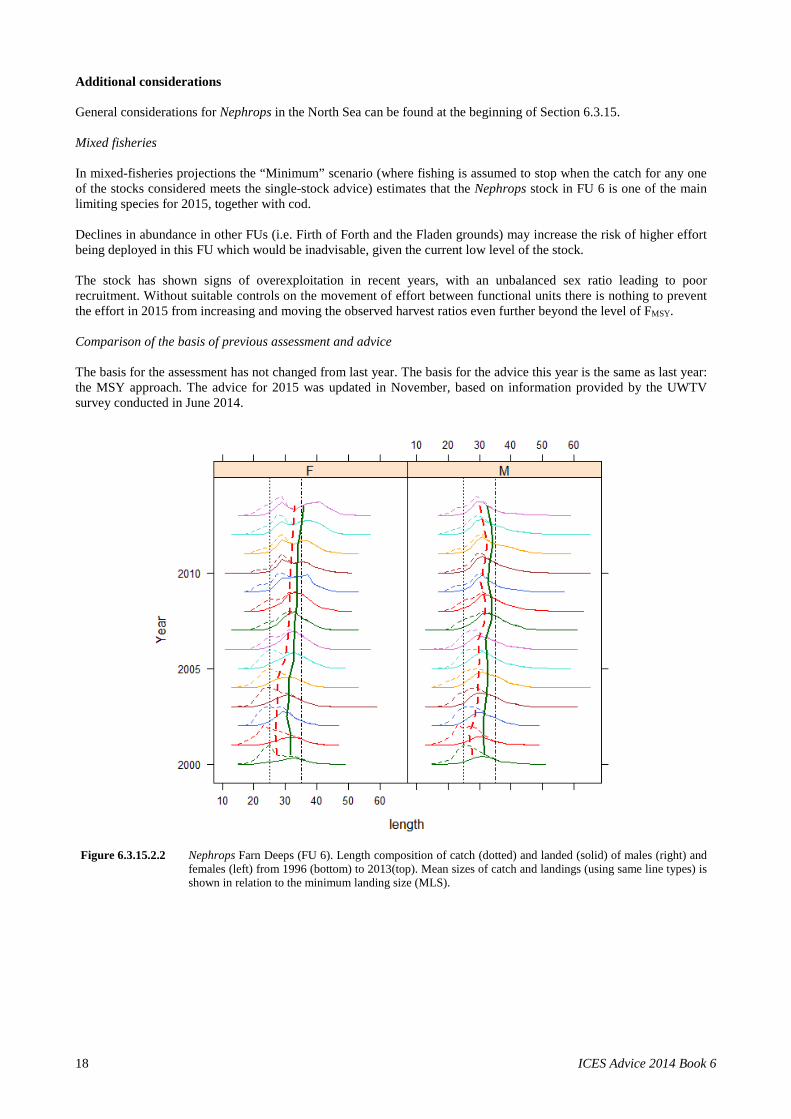
Figure 6.3.15.2.2 Nephrops Farn Deeps (FU 6). Length composition of catch (dotted) and landed (solid) of males (right) and
females (left) from 1996 (bottom) to 2013(top). Mean sizes of catch and landings (using same line types) is shown in relation to the minimum landing size (MLS).
18 ICES Advice 2014 Book 6
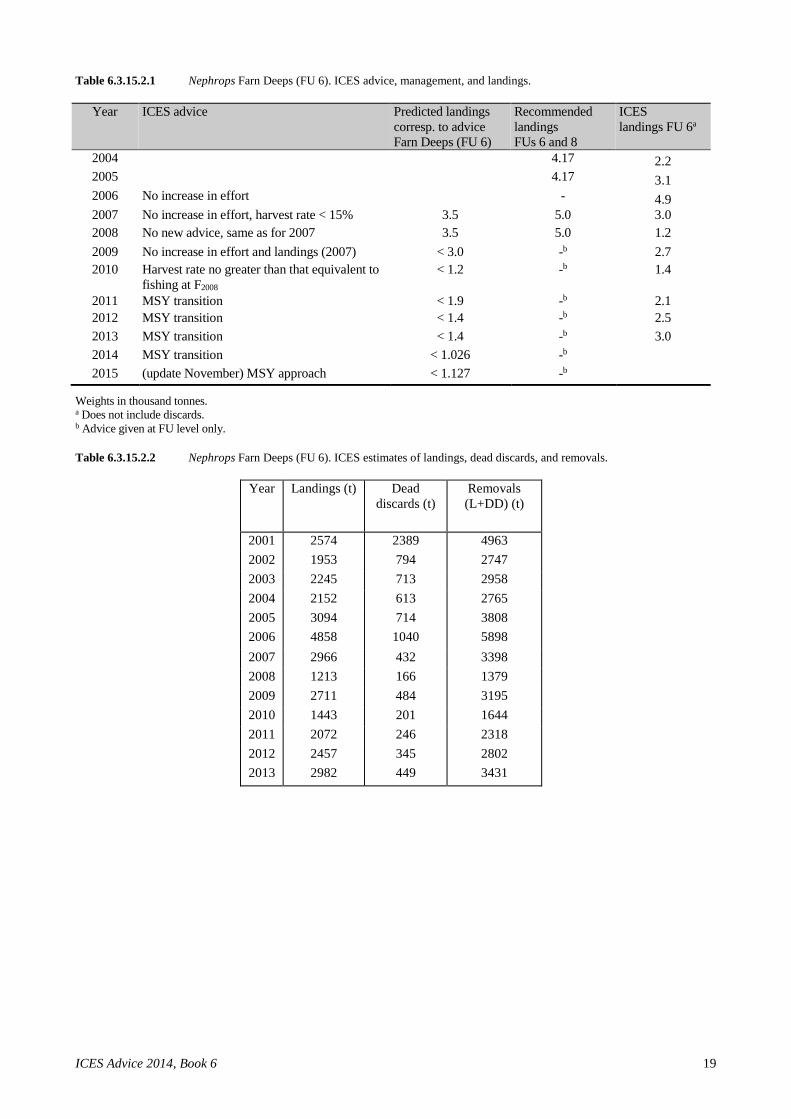
Table 6.3.15.2.1 Nephrops Farn Deeps (FU 6). ICES advice, management, and landings.
Year ICES advice Predicted landings corresp. to advice Farn Deeps (FU 6)
Recommended landings FUs 6 and 8
ICES landings FU 6a
2004 4.17 2.2 2005 4.17 3.1 2006 No increase in effort - 4.9 2007 No increase in effort, harvest rate < 15% 3.5 5.0 3.0 2008 No new advice, same as for 2007 3.5 5.0 1.2 2009 No increase in effort and landings (2007) < 3.0 -b 2.7 2010 Harvest rate no greater than that equivalent to
fishing at F2008 < 1.2 -b 1.4
2011 MSY transition < 1.9 -b 2.1 2012 MSY transition < 1.4 -b 2.5 2013 MSY transition < 1.4 -b 3.0 2014 MSY transition < 1.026 -b 2015 (update November) MSY approach < 1.127 -b
Weights in thousand tonnes. a Does not include discards. b Advice given at FU level only. Table 6.3.15.2.2 Nephrops Farn Deeps (FU 6). ICES estimates of landings, dead discards, and removals.
Year Landings (t) Dead discards (t)
Removals (L+DD) (t)
2001 2574 2389 4963 2002 1953 794 2747 2003 2245 713 2958 2004 2152 613 2765 2005 3094 714 3808 2006 4858 1040 5898 2007 2966 432 3398 2008 1213 166 1379 2009 2711 484 3195 2010 1443 201 1644 2011 2072 246 2318 2012 2457 345 2802 2013 2982 449 3431
ICES Advice 2014, Book 6 19
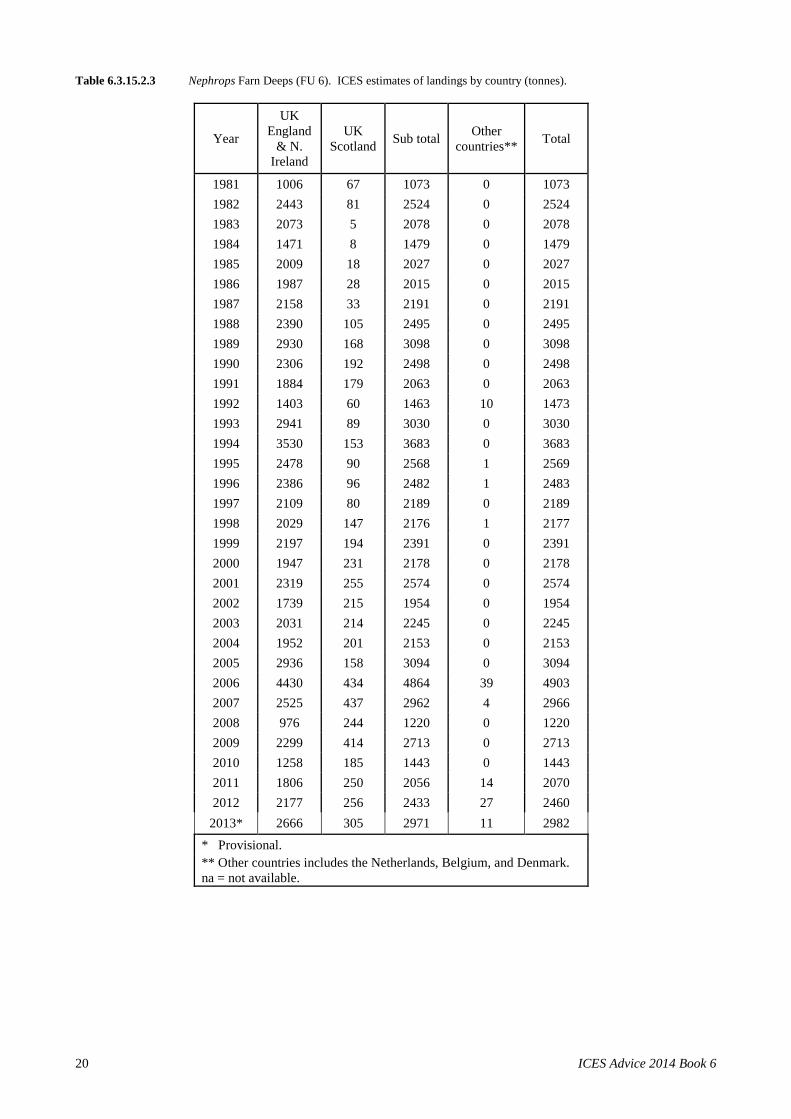
Table 6.3.15.2.3 Nephrops Farn Deeps (FU 6). ICES estimates of landings by country (tonnes).
Year
UK England
& N. Ireland
UK Scotland Sub total Other
countries** Total
1981 1006 67 1073 0 1073 1982 2443 81 2524 0 2524 1983 2073 5 2078 0 2078 1984 1471 8 1479 0 1479 1985 2009 18 2027 0 2027 1986 1987 28 2015 0 2015 1987 2158 33 2191 0 2191 1988 2390 105 2495 0 2495 1989 2930 168 3098 0 3098 1990 2306 192 2498 0 2498 1991 1884 179 2063 0 2063 1992 1403 60 1463 10 1473 1993 2941 89 3030 0 3030 1994 3530 153 3683 0 3683 1995 2478 90 2568 1 2569 1996 2386 96 2482 1 2483 1997 2109 80 2189 0 2189 1998 2029 147 2176 1 2177 1999 2197 194 2391 0 2391 2000 1947 231 2178 0 2178 2001 2319 255 2574 0 2574 2002 1739 215 1954 0 1954 2003 2031 214 2245 0 2245 2004 1952 201 2153 0 2153 2005 2936 158 3094 0 3094 2006 4430 434 4864 39 4903 2007 2525 437 2962 4 2966 2008 976 244 1220 0 1220 2009 2299 414 2713 0 2713 2010 1258 185 1443 0 1443 2011 1806 250 2056 14 2070 2012 2177 256 2433 27 2460
2013* 2666 305 2971 11 2982
* Provisional. ** Other countries includes the Netherlands, Belgium, and Denmark. na = not available.
20 ICES Advice 2014 Book 6
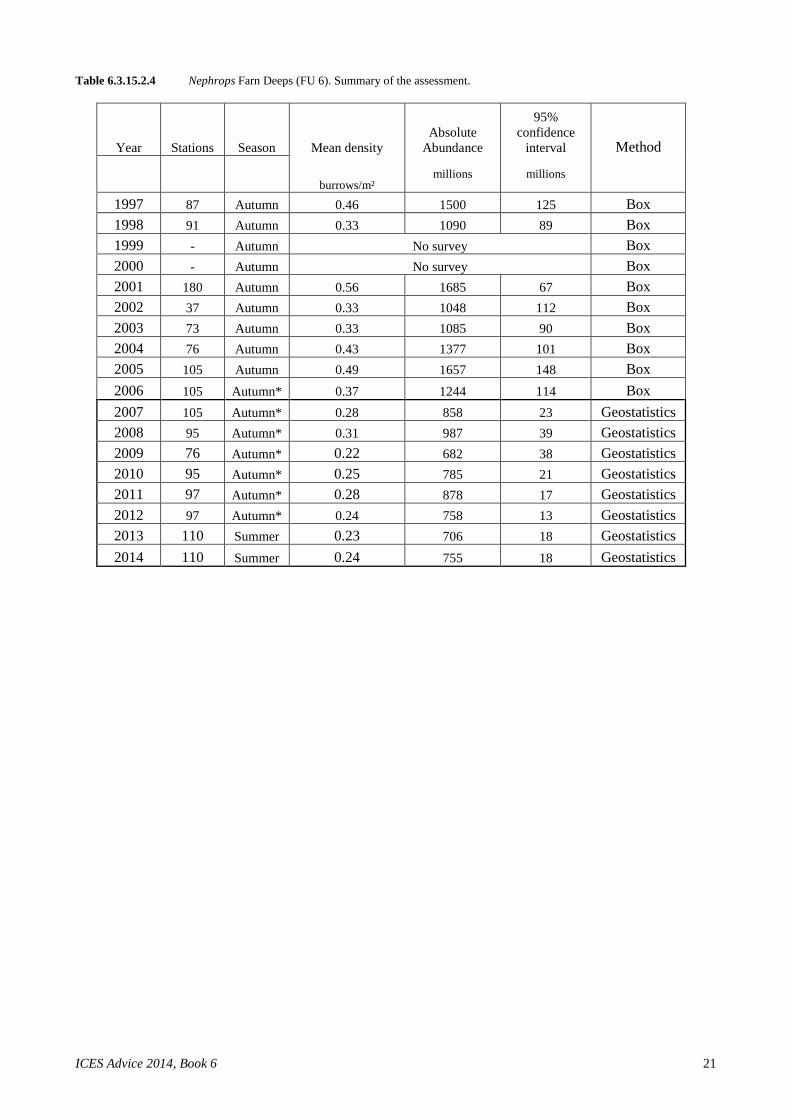
Table 6.3.15.2.4 Nephrops Farn Deeps (FU 6). Summary of the assessment.
Year Stations Season Mean density Absolute
Abundance
95% confidence
interval Method
burrows/m²
millions millions
1997 87 Autumn 0.46 1500 125 Box 1998 91 Autumn 0.33 1090 89 Box 1999 - Autumn No survey Box 2000 - Autumn No survey Box 2001 180 Autumn 0.56 1685 67 Box 2002 37 Autumn 0.33 1048 112 Box 2003 73 Autumn 0.33 1085 90 Box 2004 76 Autumn 0.43 1377 101 Box 2005 105 Autumn 0.49 1657 148 Box 2006 105 Autumn* 0.37 1244 114 Box 2007 105 Autumn* 0.28 858 23 Geostatistics 2008 95 Autumn* 0.31 987 39 Geostatistics 2009 76 Autumn* 0.22 682 38 Geostatistics 2010 95 Autumn* 0.25 785 21 Geostatistics 2011 97 Autumn* 0.28 878 17 Geostatistics 2012 97 Autumn* 0.24 758 13 Geostatistics 2013 110 Summer 0.23 706 18 Geostatistics 2014 110 Summer 0.24 755 18 Geostatistics
ICES Advice 2014, Book 6 21
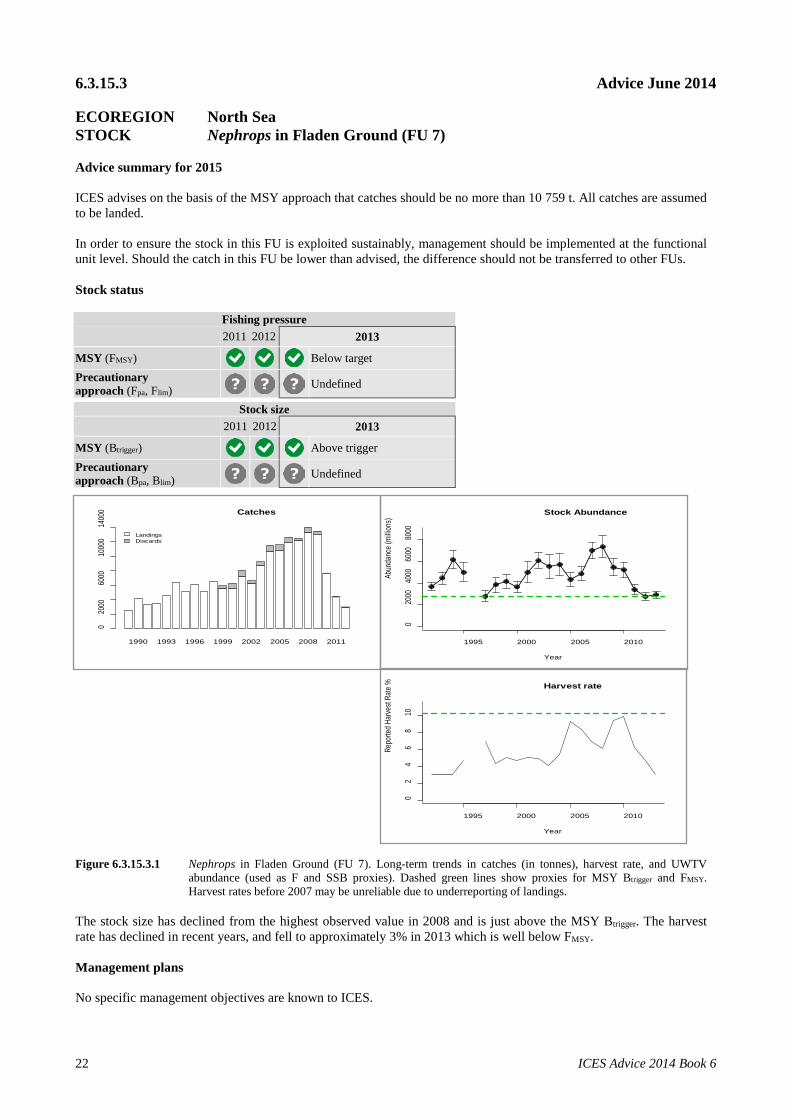
6.3.15.3 Advice June 2014 ECOREGION North Sea STOCK Nephrops in Fladen Ground (FU 7) Advice summary for 2015 ICES advises on the basis of the MSY approach that catches should be no more than 10 759 t. All catches are assumed to be landed. In order to ensure the stock in this FU is exploited sustainably, management should be implemented at the functional unit level. Should the catch in this FU be lower than advised, the difference should not be transferred to other FUs. Stock status
Fishing pressure 2011 2012 2013
MSY (FMSY) Below target Precautionary approach (Fpa, Flim) Undefined
Stock size 2011 2012 2013
MSY (Btrigger) Above trigger Precautionary approach (Bpa, Blim) Undefined
Figure 6.3.15.3.1 Nephrops in Fladen Ground (FU 7). Long-term trends in catches (in tonnes), harvest rate, and UWTV abundance (used as F and SSB proxies). Dashed green lines show proxies for MSY Btrigger and FMSY. Harvest rates before 2007 may be unreliable due to underreporting of landings.
The stock size has declined from the highest observed value in 2008 and is just above the MSY Btrigger. The harvest rate has declined in recent years, and fell to approximately 3% in 2013 which is well below FMSY. Management plans No specific management objectives are known to ICES.
1995 2000 2005 2010
02
46
810
Harvest rate
Year
Repo
rted H
arve
st Ra
te %
1995 2000 2005 2010
020
0040
0060
0080
00
Stock Abundance
Year
Abun
danc
e (mi
llions
)
1990 1993 1996 1999 2002 2005 2008 2011
Catches
020
0060
0010
000
1400
0
LandingsDiscards
22 ICES Advice 2014 Book 6
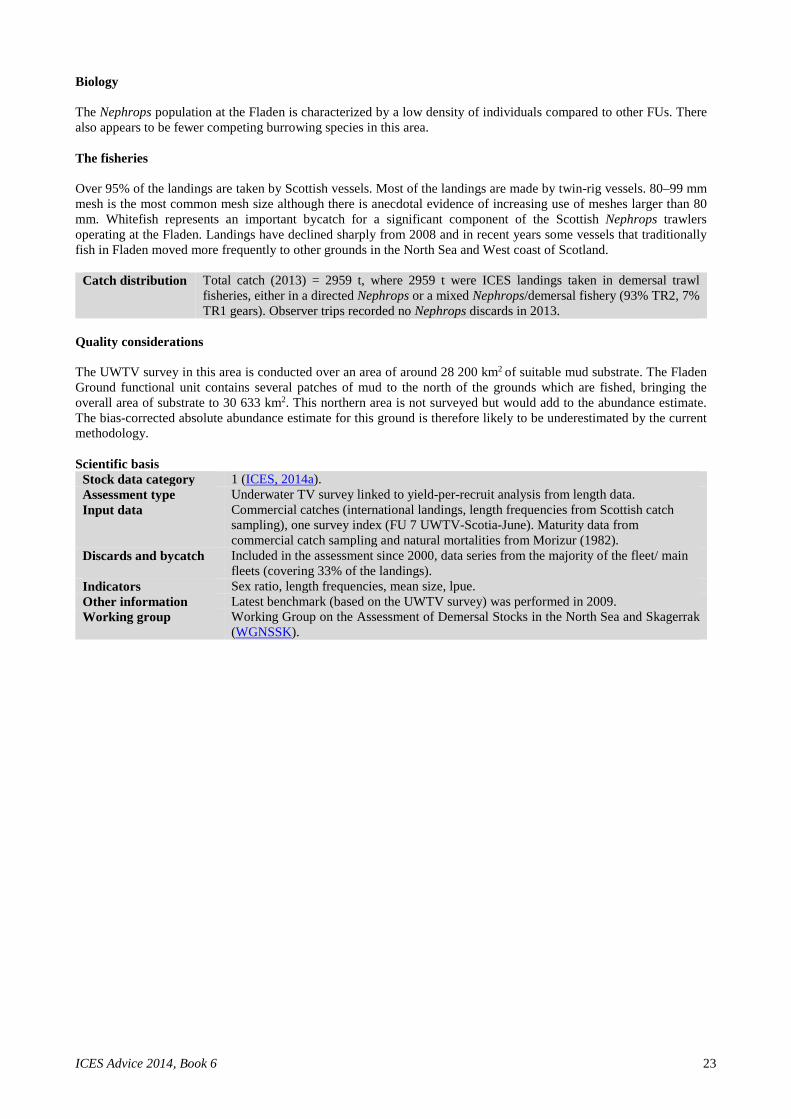
Biology The Nephrops population at the Fladen is characterized by a low density of individuals compared to other FUs. There also appears to be fewer competing burrowing species in this area. The fisheries Over 95% of the landings are taken by Scottish vessels. Most of the landings are made by twin-rig vessels. 80–99 mm mesh is the most common mesh size although there is anecdotal evidence of increasing use of meshes larger than 80 mm. Whitefish represents an important bycatch for a significant component of the Scottish Nephrops trawlers operating at the Fladen. Landings have declined sharply from 2008 and in recent years some vessels that traditionally fish in Fladen moved more frequently to other grounds in the North Sea and West coast of Scotland.
Catch distribution Total catch (2013) = 2959 t, where 2959 t were ICES landings taken in demersal trawl fisheries, either in a directed Nephrops or a mixed Nephrops/demersal fishery (93% TR2, 7% TR1 gears). Observer trips recorded no Nephrops discards in 2013.
Quality considerations The UWTV survey in this area is conducted over an area of around 28 200 km2 of suitable mud substrate. The Fladen Ground functional unit contains several patches of mud to the north of the grounds which are fished, bringing the overall area of substrate to 30 633 km2. This northern area is not surveyed but would add to the abundance estimate. The bias-corrected absolute abundance estimate for this ground is therefore likely to be underestimated by the current methodology. Scientific basis
Stock data category 1 (ICES, 2014a). Assessment type Underwater TV survey linked to yield-per-recruit analysis from length data. Input data Commercial catches (international landings, length frequencies from Scottish catch
sampling), one survey index (FU 7 UWTV-Scotia-June). Maturity data from commercial catch sampling and natural mortalities from Morizur (1982).
Discards and bycatch Included in the assessment since 2000, data series from the majority of the fleet/ main fleets (covering 33% of the landings).
Indicators Sex ratio, length frequencies, mean size, lpue. Other information Latest benchmark (based on the UWTV survey) was performed in 2009. Working group Working Group on the Assessment of Demersal Stocks in the North Sea and Skagerrak
(WGNSSK).
ICES Advice 2014, Book 6 23
6.3.15.3 Supporting information June 2014 ECOREGION North Sea STOCK Nephrops in Fladen Ground (FU 7) Reference points
Type Value Technical basis
MSY approach
MSY Btrigger 2767 million individuals.
Lowest observed UWTV survey estimate of abundance (1992–2010).
FMSY Harvest rate 10.3%. Equivalent to the F0.1 for combined sexes in 2011. FMSY proxy based on length-based Y/R.
Precautionary approach
Not defined.
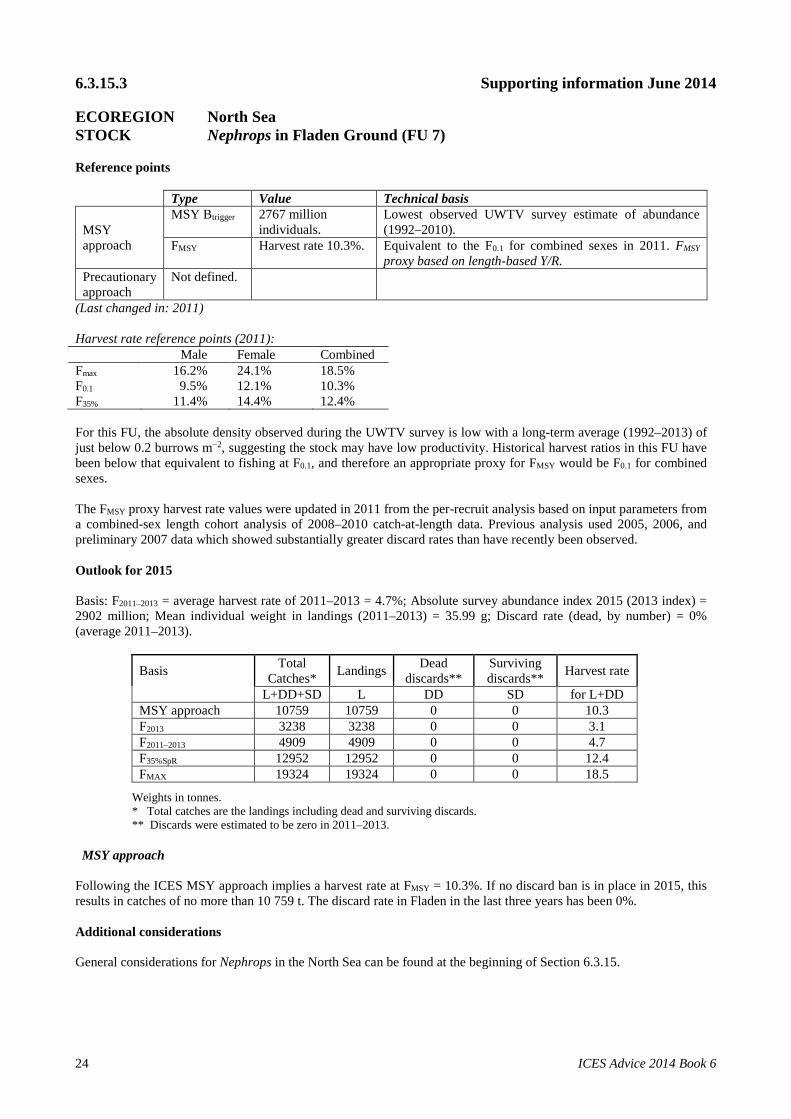
(Last changed in: 2011) Harvest rate reference points (2011): Male Female Combined Fmax 16.2% 24.1% 18.5% F0.1 9.5% 12.1% 10.3% F35% 11.4% 14.4% 12.4% For this FU, the absolute density observed during the UWTV survey is low with a long-term average (1992–2013) of just below 0.2 burrows m−2, suggesting the stock may have low productivity. Historical harvest ratios in this FU have been below that equivalent to fishing at F0.1, and therefore an appropriate proxy for FMSY would be F0.1 for combined sexes. The FMSY proxy harvest rate values were updated in 2011 from the per-recruit analysis based on input parameters from a combined-sex length cohort analysis of 2008–2010 catch-at-length data. Previous analysis used 2005, 2006, and preliminary 2007 data which showed substantially greater discard rates than have recently been observed. Outlook for 2015 Basis: F2011–2013 = average harvest rate of 2011–2013 = 4.7%; Absolute survey abundance index 2015 (2013 index) = 2902 million; Mean individual weight in landings (2011–2013) = 35.99 g; Discard rate (dead, by number) = 0% (average 2011–2013).
Basis Total Catches* Landings Dead
discards** Surviving discards** Harvest rate
L+DD+SD L DD SD for L+DD MSY approach 10759 10759 0 0 10.3 F2013 3238 3238 0 0 3.1 F2011–2013 4909 4909 0 0 4.7 F35%SpR 12952 12952 0 0 12.4 FMAX 19324 19324 0 0 18.5
Weights in tonnes. * Total catches are the landings including dead and surviving discards. ** Discards were estimated to be zero in 2011–2013.
MSY approach
Following the ICES MSY approach implies a harvest rate at FMSY = 10.3%. If no discard ban is in place in 2015, this results in catches of no more than 10 759 t. The discard rate in Fladen in the last three years has been 0%. Additional considerations General considerations for Nephrops in the North Sea can be found at the beginning of Section 6.3.15.
24 ICES Advice 2014 Book 6

Advice considerations ICES notes that this advice implies a threefold increase in harvest rate, while the stock size has shown a steady decline since 2008. Catches have been declining the last three years and are well below the advised landings for this area. In order to ensure the stock in this FU is exploited sustainably, and other FUs do not suffer from displacement from unused catch options from this FU, management should be implemented at the functional unit level. Management considerations In the Fladen area the Nephrops stock is restricted to a generally continuous area of muddy sediments extending from 57°30’N to 60°N, and from 1°W to 1°30’E, with other smaller patches to the north. The Fladen is one of the largest known Nephrops grounds; fishing activity can shift spatially so that effort can vary on parts of the ground. Mixed fisheries In the mixed-fisheries projections’ maximum scenario (“Maximum”, where fishing stops when all stocks considered have been caught up to the ICES single-stock advice) the Nephrops stock in FU 7 is one of the least limiting stocks. The advice for FU 7 has not been restrictive to landings from the area since 2010. Should the catch in this FU be lower than advised, the difference should not be transferred to other FUs where this would cause local overfishing. The effects of regulations The minimum landing size for Nephrops in the North Sea is 25 mm carapace length. Discarding of both undersize and poor quality Nephrops sometimes takes place at a low rate in this FU. Values have fallen in recent years, from about 10% in the early 2000s to around 5% by number in the period covered by the Y/R analysis (2008–2010); in 2011–2013 there were zero discards of Nephrops. Discard rates in this FU have historically been low compared to other North Sea functional units because of the generally larger size of Nephrops found at the Fladen Ground. Changes in fishing technology and fishing patterns In the early years of the fishery, effort was primarily directed to a region that could be reached within 12 hours’ steaming from ports along the northeast coast of Scotland. In recent years, logbook information and VMS show that vessels are fishing more widely over the ground, including to the farther easterly and northerly edges of the extensive mud area. The reduction in the discard rate since 2000 could be caused partly by increased retention of small individuals (lower mean sizes of the < 35 mm component of the landings for part of the time-series) or by an increase in mesh size. This could also be caused by reduced recruitment, but there is no information to validate this. Uncertainties in assessment and forecast The population has not been well-studied and biological parameters such as growth are considered particularly uncertain. The UWTV survey is conducted over the main part of the ground, representing an area of around 28 200 km2 of suitable mud substrate (the largest ground in Europe). The Fladen functional unit contains several patches of mud to the north of the ground which are fished, bringing the overall area of substrate to 30 633 km2. This area is not surveyed but would add to the abundance estimate. The absolute abundance estimate for this ground is therefore likely to be underestimated by the current methodology. Comparison of the basis of previous assessment and advice The basis for the assessment has not changed from last year. The basis for the advice this year is the same as last year: the MSY approach.
ICES Advice 2014, Book 6 25
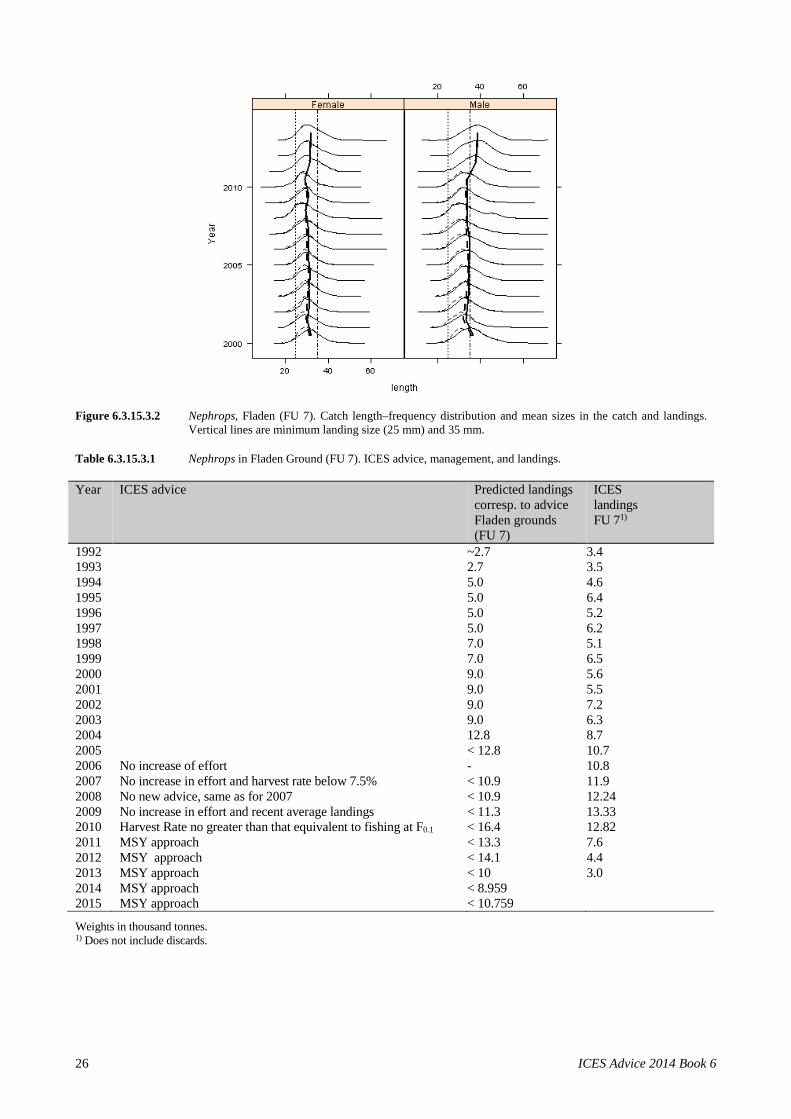
Figure 6.3.15.3.2 Nephrops, Fladen (FU 7). Catch length–frequency distribution and mean sizes in the catch and landings.
Vertical lines are minimum landing size (25 mm) and 35 mm. Table 6.3.15.3.1 Nephrops in Fladen Ground (FU 7). ICES advice, management, and landings. Year ICES advice Predicted landings
corresp. to advice Fladen grounds (FU 7)
ICES landings FU 71)
1992 ~2.7 3.4 1993 2.7 3.5 1994 5.0 4.6 1995 5.0 6.4 1996 5.0 5.2 1997 5.0 6.2 1998 7.0 5.1 1999 7.0 6.5 2000 9.0 5.6 2001 9.0 5.5 2002 9.0 7.2 2003 9.0 6.3 2004 12.8 8.7 2005 < 12.8 10.7 2006 No increase of effort - 10.8 2007 No increase in effort and harvest rate below 7.5% < 10.9 11.9 2008 No new advice, same as for 2007 < 10.9 12.24 2009 No increase in effort and recent average landings < 11.3 13.33 2010 Harvest Rate no greater than that equivalent to fishing at F0.1 < 16.4 12.82 2011 MSY approach < 13.3 7.6 2012 MSY approach < 14.1 4.4 2013 MSY approach < 10 3.0 2014 MSY approach < 8.959 2015 MSY approach < 10.759
Weights in thousand tonnes. 1) Does not include discards.
26 ICES Advice 2014 Book 6

Table 6.3.15.3.2 Nephrops in Fladen Ground (FU 7). Official landings by country (tonnes), as reported to ICES.
Year UK Scotland Other
Nephrops Other Creel Sub-total Denmark countries Total
trawl trawl *
1981 304 68 0 372 0 0 372 1982 381 40 0 421 0 0 421 1983 588 105 0 693 0 0 693 1984 552 94 0 646 0 0 646 1985 1020 120 0 1140 7 0 1147 1986 1401 92 0 1493 50 0 1543 1987 1023 349 0 1372 323 0 1695 1988 1309 185 0 1494 81 0 1575 1989 1724 410 0 2134 165 0 2299 1990 1703 598 0 2301 236 3 2540 1991 3021 772 0 3793 424 6 4223 1992 1809 1164 0 2973 359 31 3363 1993 2031 1234 0 3265 224 3 3492 1994 1816 2356 0 4172 390 6 4568 1995 3568 2389 19 5976 439 4 6419 1996 2338 2578 7 4923 286 1 5210 1997 2712 3221 0 5933 235 2 6170 1998 2290 2673 0 4963 173 0 5136 1999 2860 3546 0 6406 96 16 6518 2000 2916 2546 0 5462 103 5 5570 2001 3540 1936 0 5476 64 2 5542 2002 4511 2546 0 7057 173 15 7245 2003 4175 2033 0 6208 82 4 6294 2004 7274 1319 1 8594 136 0 8730 2005 8849 1508 5 10362 321 1 10684 2006 9470 1026 1 10497 283 11 10791 2007 11055 734 0 11789 119 3 11911 2008 11432 666 0 12098 133 8 12239 2009 12688 499 0 13187 130 10 13327 2010 12544 288 0 12832 124 12 12968 2011 7367 128 0 7495 64 < 0.5 7559 2012 4257 81 0 4338 75 2 4415
2013* 2745 201 0 2946 5 8 2959
* Provisional. **Other countries includes Belgium, Norway, and UK (England). na = not available.
ICES Advice 2014, Book 6 27

Table 6.3.15.3.3 Nephrops in Fladen (FU 7). Results of the 1992–2013 UWTV surveys (abundances and confidence interval).
Year Stations
Abundance Mean density
95% confidence
interval
millions burrows/m2 millions
1992 69 3661 0.13 376 1993 74 4450 0.16 569 1994 59 6170 0.22 814 1995 61 4987 0.18 896 1996 No survey 1997 56 2767 0.10 510 1998 60 3838 0.13 717 1999 62 4146 0.15 649 2000 68 3628 0.13 491 2001 50 4981 0.17 970 2002 54 6087 0.21 757 2003 55 5547 0.20 1076 2004 52 5725 0.20 1030 2005 72 4325 0.16 662 2006 69 4862 0.17 619 2007 82 7017 0.25 730 2008 74 7360 0.26 1019 2009 59 5457 0.19 772 2010 67 5224 0.19 710 2011 73 3382 0.12 435 2012 70 2748 0.10 392
2013 71 2902 0.10 336 Table 6.3.15.3.4 Nephrops in Fladen (FU 7). Adjusted TV survey abundance, landings, total discard rate (proportion by
number), dead discard rate (by number), and estimated harvest rate.
year Adjusted
abundance (millions)
Harvest ratio
Landings numbers
Discards numbers
Removals numbers
Landings (tonnes)
Discards (tonnes)
Discard rate
Mean individual weight in landings
Mean individual weight in discards
Dead discard
rate
2003 5547 4.1 209 24 226 6294 349 10.1 30.15 14.83 7.8
2004 5725 5.4 282 34 307 8730 506 10.6 30.98 15.06 8.2
2005 4325 9.3 368 46 403 10684 823 11.2 29.05 17.74 8.6
2006 4862 8.4 369 54 409 10791 798 12.7 29.25 14.87 9.8
2007 7017 7 447 55 488 11911 747 10.9 26.63 13.67 8.4
2008 7360 6.1 434 18 448 12239 257 3.9 28.18 14.54 3
2009 5457 9.4 473 51 511 13327 707 9.7 28.2 13.85 7.5
2010 5224 9.9 492 34 517 12968 560 6.5 26.38 16.44 4.9
2011 3382 6.2 209 0 209 7559 0 0 36.17 NA 0
2012 2748 4.7 128 0 128 4415 0 0 36.91 NA 0
2013 2902 3.1 89 0 89 2959 0 0 34.9 NA 0
28 ICES Advice 2014 Book 6

6.3.15.4 Advice June 2014 ECOREGION North Sea STOCK Nephrops in Firth of Forth (FU 8) Advice for 2015 ICES advises on the basis of the MSY approach that if no discard ban is in place in 2015, landings should be no more than 1769 t, assuming that discard rates do not change from the average of the last three years (2011–2013) and a fixed proportion of discards survive. In order to ensure the stock in this FU is exploited sustainably, management should be implemented at the functional unit level. Stock status
Fishing pressure 2011 2012 2013
MSY (FMSY) Below target Precautionary approach (Fpa, Flim) Undefined
Stock size 2011 2012 2013
MSY (Btrigger) Above trigger Precautionary approach (Bpa, Blim) Undefined
Figure 6.3.15.4.1 Nephrops in Firth of Forth (FU 8). Long-term trends in catches (in tonnes), harvest rate, and UWTV
abundance (used as F and SSB proxies). Dashed green lines show proxies for FMSY and MSY Btrigger. Harvest rates before 2007 may be unreliable due to underreporting of landings.
The stock size is well above the MSY Btrigger level. The harvest rate decreased in 2013 to 15.6% and is now below FMSY. Management plans No specific management objectives are known to ICES.
1995 2000 2005 2010
010
2030
4050
Harvest rate
Year
Repo
rted H
arve
st Ra
te %
1995 2000 2005 2010
020
060
010
00
Stock Abundance
Year
Abun
danc
e (mi
llions
)
1981 1985 1989 1993 1997 2001 2005 2009 2013
Catches
010
0020
0030
00
LandingsDiscards
ICES Advice 2014, Book 6 29

Biology The population of Nephrops in the Firth of Forth appears to consist of a high density of small individuals in comparison to other FUs. The fisheries The Nephrops fishery in the Firth of Forth is dominated by UK (Scotland) vessels, with low landings reported by other UK nations. Nephrops discard rates are higher than in a number of other areas but the rates have declined to 25% by number and 14% by weight (average 2011–2013).
Catch distribution Total catch (2013) = 1802 t, where 1501 t were ICES landings almost entirely taken in demersal trawl fisheries, either a directed Nephrops or a mixed Nephrops/demersal fishery (96% TR2, 4% creel gears), and 301 t are discards in weight.
Scientific basis
Stock data category 1 (ICES, 2014a). Assessment type Underwater TV survey linked to yield-per-recruit analysis from length data. Input data Commercial catches (international landings, length frequencies from Scottish catch
sampling), one survey index (FU 8 UWTV). Maturity data from commercial catch sampling, natural mortalities from Morizur (1982).
Discards and bycatch Included in the assessment since 1990, data series from the majority of the fleet/ main fleets (covering 95% of the landings).
Indicators Sex ratio, length frequencies, mean size, lpue. Other information Latest benchmark (on use of UWTV survey) was performed in 2009. Working group Working Group on the Assessment of Demersal Stocks in the North Sea and Skagerrak
(WGNSSK).
30 ICES Advice 2014 Book 6

6.3.15.4 Supporting information June 2014 ECOREGION North Sea STOCK Nephrops in Firth of Forth (FU 8) Reference points
Type Value Technical basis
MSY approach
MSY Btrigger 292 million individuals.
Lowest observed UWTV survey estimate of abundance (1993–2010).
FMSY Harvest rate 16.3%. Equivalent to Fmax for combined sexes in 2011. FMSY proxy based on length-based Y/R.
Precautionary approach
Not defined.
(Last changed in: 2011) Harvest rate reference points (2011):
Male Female Combined Fmax 12.7% 26.7% 16.3% F0.1 7.7% 15.2% 9.4% F35% 9.4% 18.3% 12.7%
For this FU, the absolute density observed during the UWTV survey is relatively high (average of ~ 0.8 burrows m−2). A long time-series of relatively stable landings (average reported landings ~ 2000 tonnes), well above those predicted by currently fishing at Fmax while the stock abundance has been stable, suggest a productive stock. It is suggested that Fmax for combined sexes is chosen as the FMSY proxy. The FMSY proxy harvest rate values were updated in 2011 on the basis of per-recruit analysis, based on input parameters from a combined-sex length cohort analysis of 2008–2010 catch-at-length data. Previous analysis used 2005, 2006, and preliminary 2007 data, which showed greater discard rates than those observed recently. Outlook for 2015 Basis: F2011–2013 = average harvest rate of 2011–2013 = 20.8%; Absolute survey abundance index 2015 (2013 index) = 668 million; Mean individual weight in landings (2011–2013) = 20.24 g; Discard rate (dead, by number) = 19.7% (average 2011–2013); Mean individual weight in discards (2011–2013) = 9.83 g.
Basis Total catches* Landings Dead
discards** Surviving discards** Harvest rate
L+DD+SD L DD SD for L+DD MSY approach 2050 1769 211 70 16.3 F0.1 1183 1020 122 41 9.4 F35%SpR 1598 1378 165 55 12.7 F2013 1962 1693 202 67 15.6 F2011–2013 2616 2257 269 90 20.8
Weights in tonnes. * Total catches are the landings including dead and surviving discards. ** Total discard rate is assumed to be 24.7% of the catches (in number, last three years’ average, 2011–2013), discard survival is
assumed 25% (ICES, 2009). MSY approach Following the ICES MSY approach implies a harvest rate at FMSY = 16.3%. Considering that no discard ban is in place in 2015, this results in landings of no more than 1769 t, assuming that discard rates do not change from the average of the last three years (2011–2013) and a discard survival rate of 25%. Additional considerations General considerations for Nephrops in the North Sea can be found at the beginning of Section 6.3.15.
ICES Advice 2014, Book 6 31

Factors affecting the fisheries and the stock Landings from the Firth of Forth fishery are predominantly reported from Scotland, with very small contributions from England. The area is periodically visited by vessels from other parts of the UK. The Firth of Forth is close inshore and is of small geographic size so that any significant increase of effort could rapidly lead to overexploitation. Catches of marketable bycatch fish are small from this area and there are few other species in the area for vessels to target. Estimated discarding rates of Nephrops are 27% by number in the Firth of Forth in 2013. This arises from the use of mainly small-meshed (80 mm) nets and the population size structure, which appears to arise from slower growth. Local markets for small whole Nephrops are seasonally important. The effects of regulations The minimum landing size for Nephrops in the North Sea is 25 mm carapace length. The apparent small size of Nephrops in this area results in higher discard rates than in some other areas around Scotland. Changes in fishing technology and fishing patterns The Firth of Forth resident fleet contains numerous small boats which are generally restricted to more sheltered inshore waters. There are, however, observations of shifts of Nephrops fishing by larger vessels from the fleet to grounds such as the Devil’s Hole (FU 34). Comparison of the basis of previous assessment and advice The basis for the assessment has not changed from last year. The basis for the advice this year is the same as last year: the MSY approach.
Figure 6.3.15.4.2 Nephrops in Firth of Forth (FU 8). Catch length–frequency distribution and mean sizes in the catch and
landings. Vertical lines are minimum landing size (25 mm) and 35 mm.
32 ICES Advice 2014 Book 6
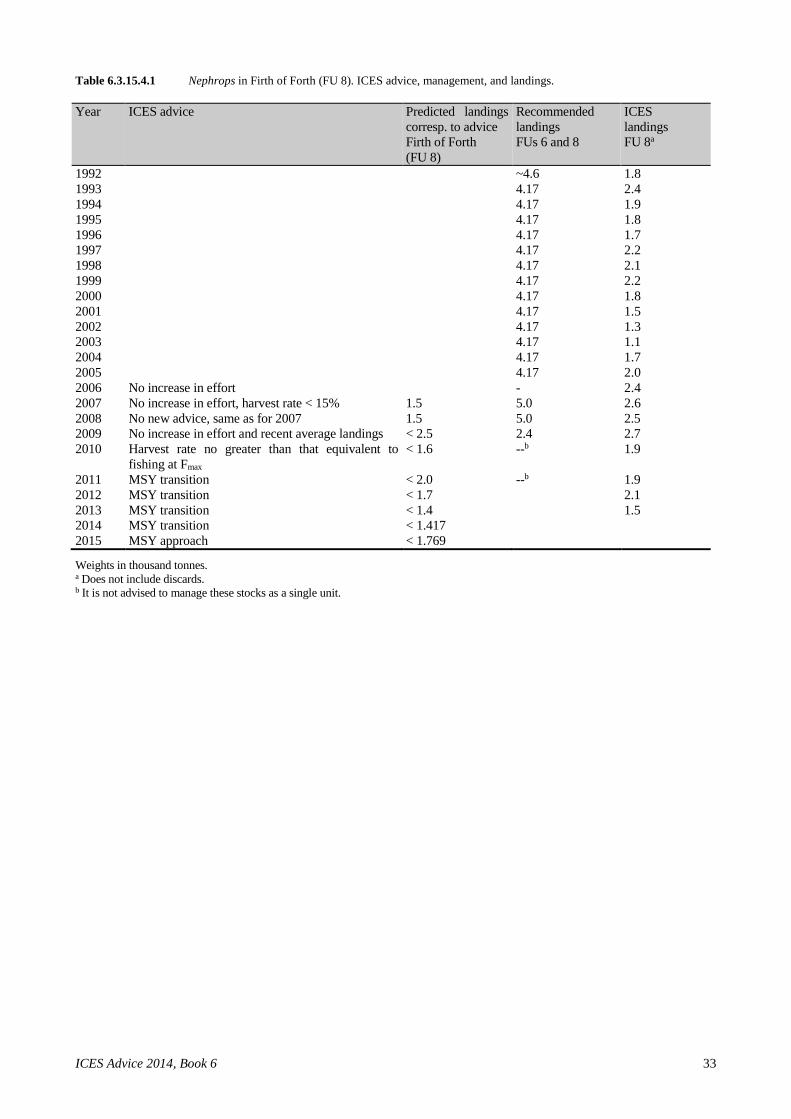
Table 6.3.15.4.1 Nephrops in Firth of Forth (FU 8). ICES advice, management, and landings. Year ICES advice Predicted landings
corresp. to advice Firth of Forth (FU 8)
Recommended landings FUs 6 and 8
ICES landings FU 8a
1992 ~4.6 1.8 1993 4.17 2.4 1994 4.17 1.9 1995 4.17 1.8 1996 4.17 1.7 1997 4.17 2.2 1998 4.17 2.1 1999 4.17 2.2 2000 4.17 1.8 2001 4.17 1.5 2002 4.17 1.3 2003 4.17 1.1 2004 4.17 1.7 2005 4.17 2.0 2006 No increase in effort - 2.4 2007 No increase in effort, harvest rate < 15% 1.5 5.0 2.6 2008 No new advice, same as for 2007 1.5 5.0 2.5 2009 No increase in effort and recent average landings < 2.5 2.4 2.7 2010 Harvest rate no greater than that equivalent to
fishing at Fmax < 1.6 --b 1.9
2011 MSY transition < 2.0 --b 1.9 2012 MSY transition < 1.7 2.1 2013 MSY transition < 1.4 1.5 2014 MSY transition < 1.417 2015 MSY approach < 1.769
Weights in thousand tonnes. a Does not include discards. b It is not advised to manage these stocks as a single unit.
ICES Advice 2014, Book 6 33

Table 6.3.15.4.2 Nephrops in Firth of Forth (FU 8). Official landings by country (tonnes), as reported to ICES.
UK Scotland UK
Total ** Year Nephrops trawl
Other Creel Sub-total
(E, W & NI)
trawl 1981 947 60 0 1007 0 1007 1982 1138 57 0 1195 0 1195 1983 1681 43 0 1724 0 1724 1984 2078 56 0 2134 0 2134 1985 1907 61 0 1968 0 1968 1986 2204 59 0 2263 0 2263 1987 1583 90 2 1675 0 1675 1988 2455 74 0 2529 0 2529 1989 1834 53 0 1887 1 1888 1990 1900 30 0 1930 1 1931 1991 1362 43 0 1405 0 1405 1992 1715 41 0 1756 0 1756 1993 2349 17 0 2366 2 2368 1994 1827 17 0 1844 6 1850 1995 1707 53 0 1760 2 1762 1996 1621 66 0 1687 0 1687 1997 2136 55 0 2191 2 2193 1998 2105 37 0 2142 2 2144 1999 2193 10 1 2204 3 2207 2000 1775 9 0 1784 1 1785 2001 1484 34 0 1518 9 1527 2002 1302 31 1 1334 6 1340 2003 1116 8 0 1124 3 1127 2004 1650 4 0 1654 3 1657 2005 1974 0 4 1978 11 1989 2006 2438 3 12 2453 5 2458 2007 2627 10 7 2644 7 2651 2008 2435 2 8 2445 5 2450 2009 2620 8 26 2654 9 2663 2010 1923 5 13 1941 9 1950 2011 1789 6 89 1884 5 1889 2012 1944 17 126 2087 42 2129
2013* 1429 3 57 1489 12 1501 * Provisional. ** There are no landings by other countries from this FU. na = not available.
34 ICES Advice 2014 Book 6

Table 6.3.15.4.3 Nephrops in Firth of Forth (FU 8): Results of the TV surveys (abundance and confidence interval).
Year Stations Mean
density Abundance 95% conf.
interval
burrows/m² millions millions
1993 37 0.61 555 142 1994 30 0.49 448 78 1995 no survey 1996 27 0.41 375 88 1997 no survey 1998 32 0.32 292 81 1999 49 0.51 463 78 2000 53 0.48 443 70 2001 46 0.46 419 79 2002 41 0.56 508 119 2003 36 0.84 767 138 2004 37 0.69 630 141 2005 54 0.78 710 143 2006 43 0.91 827 125 2007 49 0.76 692 132 2008 38 0.97 881 297 2009 45 0.80 732 142 2010 39 0.75 682 147 2011 45 0.58 533 87 2012 66 0.57 522 64 2013 51 0.73 668 125
Table 6.3.15.4.4 Nephrops in Firth of Forth (FU 8): Adjusted TV survey abundance, landings, total discard rate (proportion
by number), dead discard rate (by number), and estimated harvest rate.
year Adjusted
abundance (millions)
Harvest ratio
Landings numbers
Discards numbers
Removals numbers
Landings (tonnes)
Discards (tonnes)
Discard rate
Mean individual weight in landings
Mean individual weight in discards
Dead discard
rate
2003 767 12.4 51 59 95 1127 546 53.9 22.31 9.25 46.7
2004 630 16.4 74 40 103 1657 406 34.9 22.45 10.25 28.7
2005 710 19.4 89 65 138 1989 602 42.1 22.33 9.28 35.3
2006 827 26.7 115 142 221 2458 1510 55.2 21.43 10.67 48.1
2007 692 22.9 126 43 159 2651 614 25.3 20.97 14.34 20.3
2008 881 21.1 142 58 186 2450 796 29.1 17.23 13.65 23.5
2009 732 26 137 71 190 2663 573 34.1 19.41 8.09 27.9
2010 682 19.2 99 43 131 1950 407 30.2 19.76 9.55 24.5
2011 533 22.1 100 24 118 1889 231 19.5 19.75 9.56 15.3
2012 522 24.6 100 38 129 2129 379 27.2 21.66 10.1 21.9
2013 668 15.6 81 31 104 1501 301 27.4 19.3 9.82 22
ICES Advice 2014, Book 6 35

6.3.15.5 Advice June 2014 ECOREGION North Sea STOCK Nephrops in Moray Firth (FU 9) Advice for 2015 ICES advises on the basis of the MSY approach that if no discard ban is in place in 2015, landings should be no more than 1185 t, assuming that discard rates do not change from the average of the last three years (2011–2013) and that a fixed proportion of discards survive. In order to ensure the stock in this FU is exploited sustainably, management should be implemented at the functional unit level. Stock status
Fishing pressure 2011 2012 2013
MSY (FMSY) Below target Precautionary approach (Fpa, Flim) Undefined
Stock size 2011 2012 2013
MSY (Btrigger) Above trigger Precautionary approach (Bpa, Blim) Undefined
Figure 6.3.15.5.1 Nephrops in Moray Firth (FU 9). Long-term trends in catches (tonnes), harvest rate, and UWTV abundance
(used as F and SSB proxies). Dashed green lines show proxies for FMSY and MSY Btrigger. Harvest rates before 2007 may be unreliable due to underreporting of landings.
The stock declined in 2007–2012 but increased again in 2013. The harvest rate decreased in 2013 to 5.8% and is now below FMSY. Management plans No specific management objectives are known to ICES.
1995 2000 2005 2010
05
1015
2025
30
Harvest rate
Year
Repo
rted H
arve
st Ra
te %
1995 2000 2005 2010
020
040
060
080
0
Stock Abundance
Year
Abun
danc
e (mi
llions
)
1981 1985 1989 1993 1997 2001 2005 2009 2013
Catches
050
010
0015
0020
0025
00
LandingsDiscards
36 ICES Advice 2014 Book 6

The fisheries The Moray Firth Nephrops fishery is essentially a Scottish fishery, with only occasional landings made by vessels from elsewhere in the UK. Vessels typically conduct day trips from the nearby ports along the Moray Firth coast. In 2012 and 2013 an increasing number of larger vessels from Peterhead/Fraserburgh visited the Moray Firth grounds. At the end of 2012, a new voluntary code of conduct for Nephrops trawlers (Moray Firth Prawn Agreement) was agreed amongst fishers for the Inner Moray Firth so as to protect the viability of smaller vessels based in the area. The agreement proposes that an area in the most westerly part of the Moray Firth be reserved for vessels under 300 HP, with a further small area reserved for vessels under 400 HP.
Catch distribution Total catch (2013) = 665 t, where 655 t were ICES landings almost entirely taken in demersal trawl fisheries, either in a directed Nephrops or a mixed Nephrops/demersal fishery (94% TR2, 5% TR1, 1% creel gears), and 10 t are discards in weight.
Scientific basis
Stock data category 1 (see ICES, 2014a). Assessment type Underwater TV survey linked to yield-per-recruit analysis from length data. Input data Commercial catches (international landings, length frequencies from Scottish catch
sampling); one survey index (UWTV-Alba na mara-August); Maturity data from (commercial catch surveys); Natural mortalities from Morizur (1982).
Discards and bycatch Included in the assessment since 1990, data series from the majority of the fleet/ main fleets (covering 80% of the landings).
Indicators Sex ratio, length frequencies, mean size, lpue Other information Latest benchmark was performed in 2009. Working group Working Group on the Assessment of Demersal Stocks in the North Sea and Skagerrak
(WGNSSK).
ICES Advice 2014, Book 6 37
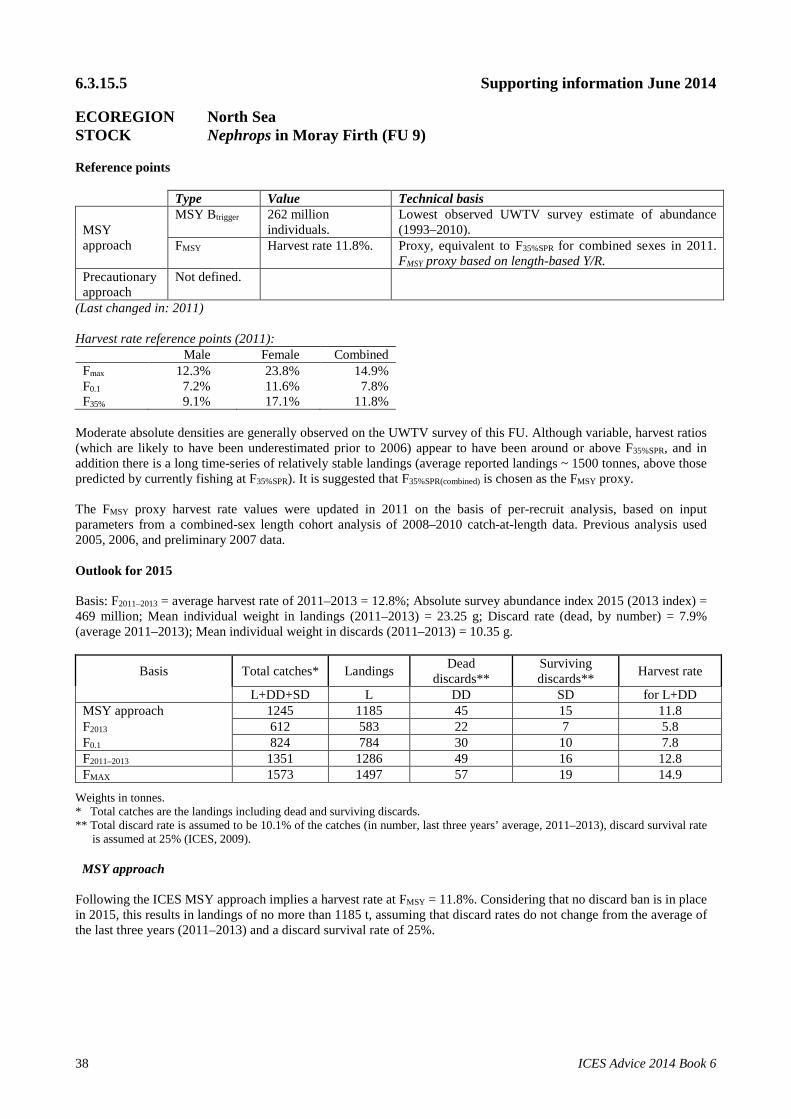
6.3.15.5 Supporting information June 2014 ECOREGION North Sea STOCK Nephrops in Moray Firth (FU 9) Reference points
Type Value Technical basis
MSY approach
MSY Btrigger 262 million individuals.
Lowest observed UWTV survey estimate of abundance (1993–2010).
FMSY Harvest rate 11.8%. Proxy, equivalent to F35%SPR for combined sexes in 2011. FMSY proxy based on length-based Y/R.
Precautionary approach
Not defined.
(Last changed in: 2011) Harvest rate reference points (2011):
Male Female Combined Fmax 12.3% 23.8% 14.9% F0.1 7.2% 11.6% 7.8% F35% 9.1% 17.1% 11.8%
Moderate absolute densities are generally observed on the UWTV survey of this FU. Although variable, harvest ratios (which are likely to have been underestimated prior to 2006) appear to have been around or above F35%SPR, and in addition there is a long time-series of relatively stable landings (average reported landings ~ 1500 tonnes, above those predicted by currently fishing at F35%SPR). It is suggested that F35%SPR(combined) is chosen as the FMSY proxy. The FMSY proxy harvest rate values were updated in 2011 on the basis of per-recruit analysis, based on input parameters from a combined-sex length cohort analysis of 2008–2010 catch-at-length data. Previous analysis used 2005, 2006, and preliminary 2007 data. Outlook for 2015 Basis: F2011–2013 = average harvest rate of 2011–2013 = 12.8%; Absolute survey abundance index 2015 (2013 index) = 469 million; Mean individual weight in landings (2011–2013) = 23.25 g; Discard rate (dead, by number) = 7.9% (average 2011–2013); Mean individual weight in discards (2011–2013) = 10.35 g.
Basis Total catches* Landings Dead discards**
Surviving discards** Harvest rate
L+DD+SD L DD SD for L+DD MSY approach 1245 1185 45 15 11.8 F2013 612 583 22 7 5.8 F0.1 824 784 30 10 7.8 F2011–2013 1351 1286 49 16 12.8 FMAX 1573 1497 57 19 14.9
Weights in tonnes. * Total catches are the landings including dead and surviving discards. ** Total discard rate is assumed to be 10.1% of the catches (in number, last three years’ average, 2011–2013), discard survival rate
is assumed at 25% (ICES, 2009). MSY approach Following the ICES MSY approach implies a harvest rate at FMSY = 11.8%. Considering that no discard ban is in place in 2015, this results in landings of no more than 1185 t, assuming that discard rates do not change from the average of the last three years (2011–2013) and a discard survival rate of 25%.
38 ICES Advice 2014 Book 6
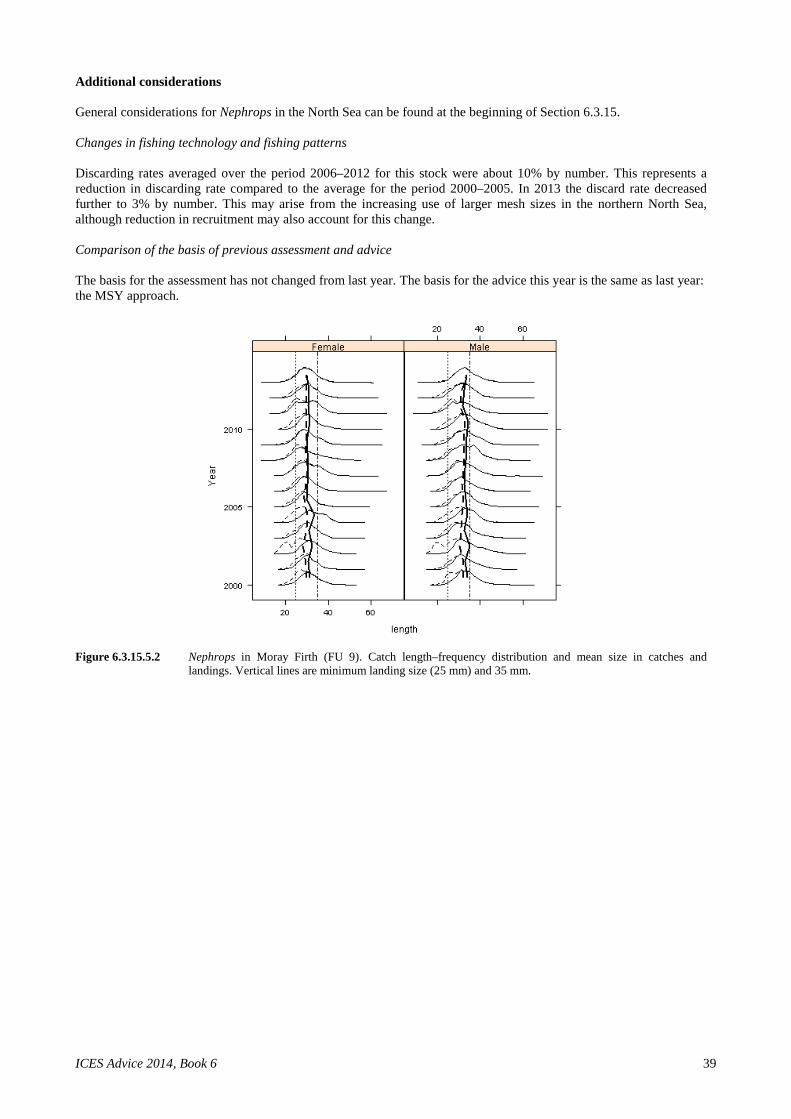
Additional considerations General considerations for Nephrops in the North Sea can be found at the beginning of Section 6.3.15. Changes in fishing technology and fishing patterns Discarding rates averaged over the period 2006–2012 for this stock were about 10% by number. This represents a reduction in discarding rate compared to the average for the period 2000–2005. In 2013 the discard rate decreased further to 3% by number. This may arise from the increasing use of larger mesh sizes in the northern North Sea, although reduction in recruitment may also account for this change. Comparison of the basis of previous assessment and advice The basis for the assessment has not changed from last year. The basis for the advice this year is the same as last year: the MSY approach.
Figure 6.3.15.5.2 Nephrops in Moray Firth (FU 9). Catch length–frequency distribution and mean size in catches and
landings. Vertical lines are minimum landing size (25 mm) and 35 mm.
ICES Advice 2014, Book 6 39
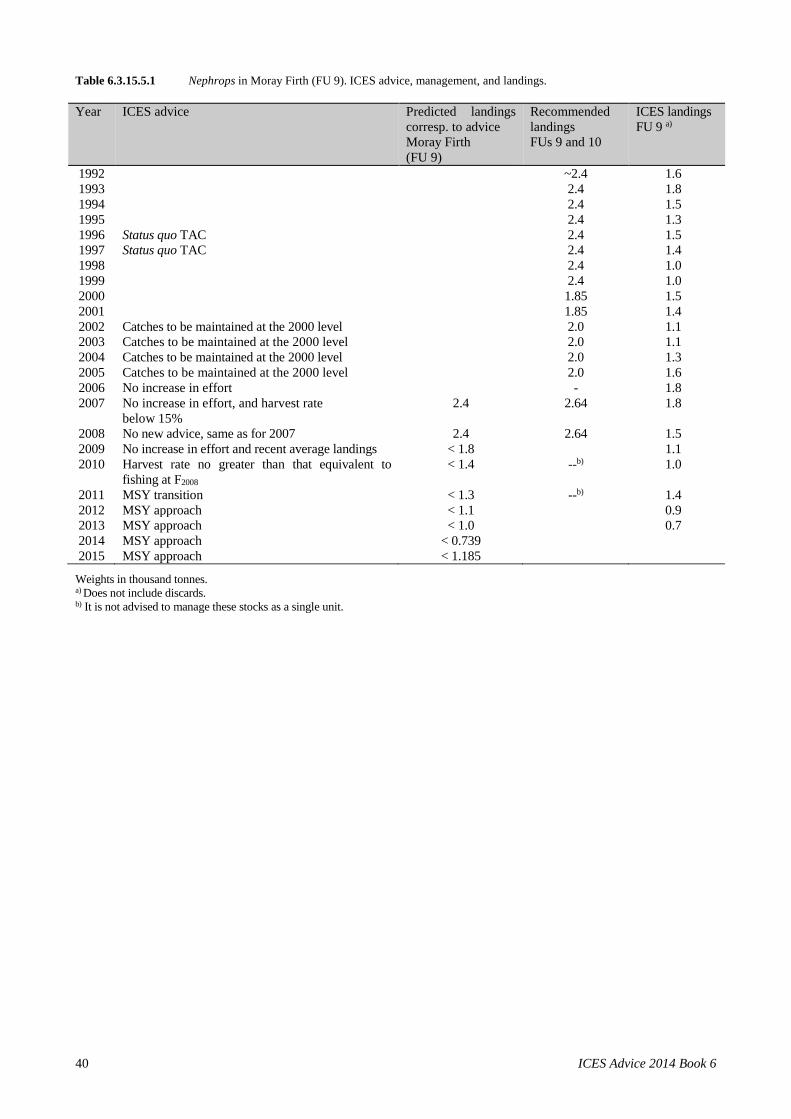
Table 6.3.15.5.1 Nephrops in Moray Firth (FU 9). ICES advice, management, and landings. Year ICES advice Predicted landings
corresp. to advice Moray Firth (FU 9)
Recommended landings FUs 9 and 10
ICES landings FU 9 a)
1992 ~2.4 1.6 1993 2.4 1.8 1994 2.4 1.5 1995 2.4 1.3 1996 Status quo TAC 2.4 1.5 1997 Status quo TAC 2.4 1.4 1998 2.4 1.0 1999 2.4 1.0 2000 1.85 1.5 2001 1.85 1.4 2002 Catches to be maintained at the 2000 level 2.0 1.1 2003 Catches to be maintained at the 2000 level 2.0 1.1 2004 Catches to be maintained at the 2000 level 2.0 1.3 2005 Catches to be maintained at the 2000 level 2.0 1.6 2006 No increase in effort - 1.8 2007 No increase in effort, and harvest rate
below 15% 2.4 2.64 1.8
2008 No new advice, same as for 2007 2.4 2.64 1.5 2009 No increase in effort and recent average landings < 1.8 1.1 2010 Harvest rate no greater than that equivalent to
fishing at F2008 < 1.4 --b) 1.0
2011 MSY transition < 1.3 --b) 1.4 2012 MSY approach < 1.1 0.9 2013 MSY approach < 1.0 0.7 2014 MSY approach < 0.739 2015 MSY approach < 1.185
Weights in thousand tonnes. a) Does not include discards. b) It is not advised to manage these stocks as a single unit.
40 ICES Advice 2014 Book 6
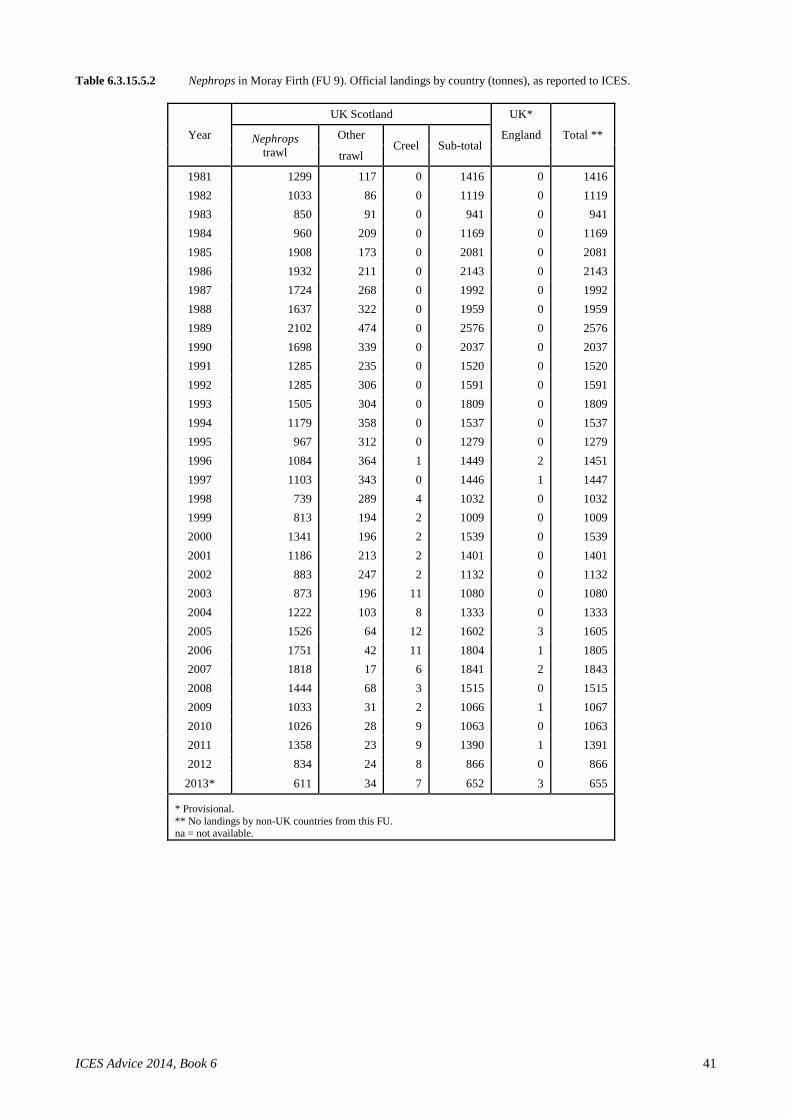
Table 6.3.15.5.2 Nephrops in Moray Firth (FU 9). Official landings by country (tonnes), as reported to ICES.
UK Scotland UK*
Total ** Year Nephrops trawl
Other Creel Sub-total
England
trawl 1981 1299 117 0 1416 0 1416 1982 1033 86 0 1119 0 1119 1983 850 91 0 941 0 941 1984 960 209 0 1169 0 1169 1985 1908 173 0 2081 0 2081 1986 1932 211 0 2143 0 2143 1987 1724 268 0 1992 0 1992 1988 1637 322 0 1959 0 1959 1989 2102 474 0 2576 0 2576 1990 1698 339 0 2037 0 2037 1991 1285 235 0 1520 0 1520 1992 1285 306 0 1591 0 1591 1993 1505 304 0 1809 0 1809 1994 1179 358 0 1537 0 1537 1995 967 312 0 1279 0 1279 1996 1084 364 1 1449 2 1451 1997 1103 343 0 1446 1 1447 1998 739 289 4 1032 0 1032 1999 813 194 2 1009 0 1009 2000 1341 196 2 1539 0 1539 2001 1186 213 2 1401 0 1401 2002 883 247 2 1132 0 1132 2003 873 196 11 1080 0 1080 2004 1222 103 8 1333 0 1333 2005 1526 64 12 1602 3 1605 2006 1751 42 11 1804 1 1805 2007 1818 17 6 1841 2 1843 2008 1444 68 3 1515 0 1515 2009 1033 31 2 1066 1 1067 2010 1026 28 9 1063 0 1063 2011 1358 23 9 1390 1 1391 2012 834 24 8 866 0 866
2013* 611 34 7 652 3 655
* Provisional. ** No landings by non-UK countries from this FU. na = not available.
ICES Advice 2014, Book 6 41
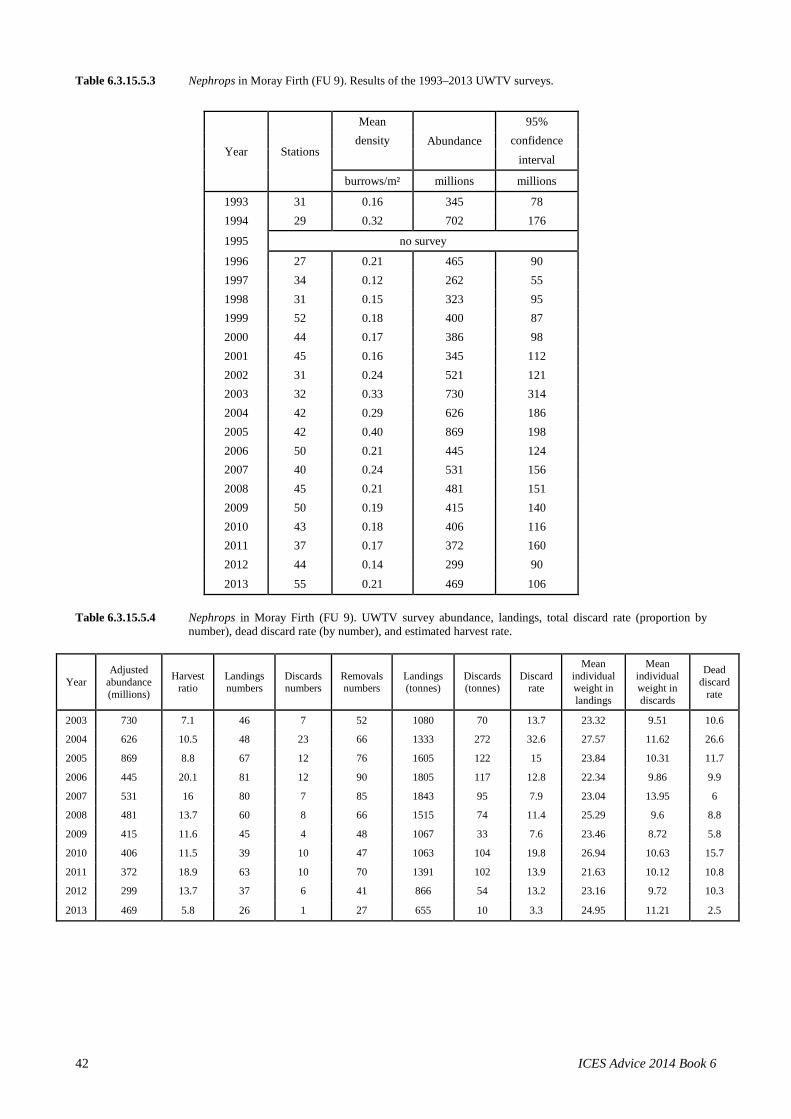
Table 6.3.15.5.3 Nephrops in Moray Firth (FU 9). Results of the 1993–2013 UWTV surveys.
Year Stations
Mean Abundance
95% density confidence
interval
burrows/m² millions millions
1993 31 0.16 345 78 1994 29 0.32 702 176
1995 no survey
1996 27 0.21 465 90 1997 34 0.12 262 55 1998 31 0.15 323 95 1999 52 0.18 400 87 2000 44 0.17 386 98 2001 45 0.16 345 112 2002 31 0.24 521 121 2003 32 0.33 730 314 2004 42 0.29 626 186 2005 42 0.40 869 198 2006 50 0.21 445 124 2007 40 0.24 531 156 2008 45 0.21 481 151 2009 50 0.19 415 140 2010 43 0.18 406 116 2011 37 0.17 372 160 2012 44 0.14 299 90 2013 55 0.21 469 106
Table 6.3.15.5.4 Nephrops in Moray Firth (FU 9). UWTV survey abundance, landings, total discard rate (proportion by
number), dead discard rate (by number), and estimated harvest rate.
Year Adjusted
abundance (millions)
Harvest ratio
Landings numbers
Discards numbers
Removals numbers
Landings (tonnes)
Discards (tonnes)
Discard rate
Mean individual weight in landings
Mean individual weight in discards
Dead discard
rate
2003 730 7.1 46 7 52 1080 70 13.7 23.32 9.51 10.6
2004 626 10.5 48 23 66 1333 272 32.6 27.57 11.62 26.6
2005 869 8.8 67 12 76 1605 122 15 23.84 10.31 11.7
2006 445 20.1 81 12 90 1805 117 12.8 22.34 9.86 9.9
2007 531 16 80 7 85 1843 95 7.9 23.04 13.95 6
2008 481 13.7 60 8 66 1515 74 11.4 25.29 9.6 8.8
2009 415 11.6 45 4 48 1067 33 7.6 23.46 8.72 5.8
2010 406 11.5 39 10 47 1063 104 19.8 26.94 10.63 15.7
2011 372 18.9 63 10 70 1391 102 13.9 21.63 10.12 10.8
2012 299 13.7 37 6 41 866 54 13.2 23.16 9.72 10.3
2013 469 5.8 26 1 27 655 10 3.3 24.95 11.21 2.5
42 ICES Advice 2014 Book 6

6.3.15.6 Advice June 2014 ECOREGION North Sea STOCK Nephrops in Noup (FU 10) Advice for 2015 and 2016 ICES advises on the basis of the ICES approach for data-limited stocks that catches should be no more than 33 t. If discard rates do not change from the assumed rate of 7.9%, this implies landings of no more than 32 t. To protect the stock in this functional unit (FU), management should be implemented at the functional unit level. Stock status
Fishing pressure 2011–2013
MSY (FMSY) Unknown Precautionary approach (Fpa,Flim) Unknown
Qualitative evaluation Below possible reference points
Stock size 2011–2013
MSY (Btrigger) Unknown Precautionary approach (Bpa,Blim) Unknown
Figure 6.3.15.6.1 Nephrops in Noup (FU 10). Landings (tonnes). The state of the stock is unknown. UWTV surveys in FU 10 have been conducted sporadically and indicated that the density is relatively low (0.1 Nephrops m−2). Landings in FU 10 are at a historical minimum, suggesting harvest rates below those associated with MSY for other North Sea Nephrops stocks. Management plans No specific management objectives are known to ICES.
1981 1985 1989 1993 1997 2001 2005 2009 2013
Landings
010
020
030
040
0
ICES Advice 2014, Book 6 43

The fisheries The Nephrops fishery at the Noup is prosecuted by only a few vessels that visit the ground at times and landings are less than 1% of the North Sea total. In recent years most Nephrops landings from Noup were made by TR1 vessels targeting whitefish. There is no discard information for this fishery.
Catch distribution Total catch (2013) is unknown. ICES landings = 20 t, almost entirely taken in demersal trawl fisheries. Discards are known to take place but cannot be quantified for this area.
Quality considerations The time-series of UWTV survey data is incomplete and no survey has been conducted since 2007. There are no reliable effort data for this FU and therefore no resulting lpue. The advice is based on a calculation of potential landing options and harvest rates, given the known surface area of Nephrops habitat and assumed densities of the functional unit. The methods applied to derive quantitative advice for data-limited stocks are expected to evolve as they are further developed and validated. Scientific basis
Stock data category 4.1.4 (see ICES, 2014a). Assessment type Data-limited approach for Nephrops. Input data Habitat extent, mean size, occasional UWTV surveys (incomplete time-series 1994,
1999, 2006, 2007). Commercial catches not included in the assessment but available for monitoring (international landings, length frequencies from Scottish catch sampling). One survey index (UWTV survey – limited time-series).
Discards and bycatch Used to provide advice, but not included in the assessment. Discard rates and individual weights for this stock are unknown. Values from neighbouring Nephrops stocks were applied to generate the total catch advice.
Indicators Mean size, commercial lpue. Other information None. Working group Working Group on the Assessment of Demersal Stocks in the North Sea and Skagerrak
(WGNSSK).
44 ICES Advice 2014 Book 6
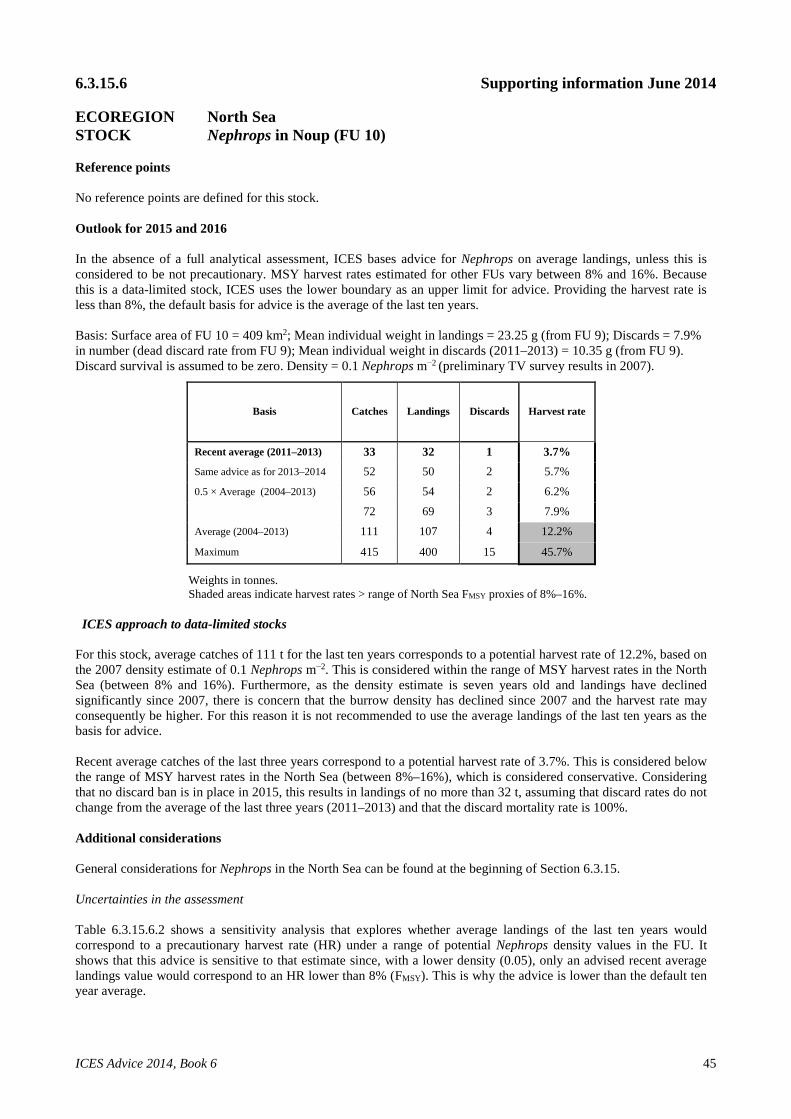
6.3.15.6 Supporting information June 2014 ECOREGION North Sea STOCK Nephrops in Noup (FU 10) Reference points No reference points are defined for this stock. Outlook for 2015 and 2016 In the absence of a full analytical assessment, ICES bases advice for Nephrops on average landings, unless this is considered to be not precautionary. MSY harvest rates estimated for other FUs vary between 8% and 16%. Because this is a data-limited stock, ICES uses the lower boundary as an upper limit for advice. Providing the harvest rate is less than 8%, the default basis for advice is the average of the last ten years. Basis: Surface area of FU 10 = 409 km2; Mean individual weight in landings = 23.25 g (from FU 9); Discards = 7.9% in number (dead discard rate from FU 9); Mean individual weight in discards (2011–2013) = 10.35 g (from FU 9). Discard survival is assumed to be zero. Density = 0.1 Nephrops m−2 (preliminary TV survey results in 2007).
Basis Catches Landings Discards Harvest rate
Recent average (2011–2013) 33 32 1 3.7% Same advice as for 2013–2014 52 50 2 5.7%
0.5 × Average (2004–2013) 56 54 2 6.2%
72 69 3 7.9%
Average (2004–2013) 111 107 4 12.2%
Maximum 415 400 15 45.7%
Weights in tonnes. Shaded areas indicate harvest rates > range of North Sea FMSY proxies of 8%–16%.
ICES approach to data-limited stocks For this stock, average catches of 111 t for the last ten years corresponds to a potential harvest rate of 12.2%, based on the 2007 density estimate of 0.1 Nephrops m−2. This is considered within the range of MSY harvest rates in the North Sea (between 8% and 16%). Furthermore, as the density estimate is seven years old and landings have declined significantly since 2007, there is concern that the burrow density has declined since 2007 and the harvest rate may consequently be higher. For this reason it is not recommended to use the average landings of the last ten years as the basis for advice. Recent average catches of the last three years correspond to a potential harvest rate of 3.7%. This is considered below the range of MSY harvest rates in the North Sea (between 8%–16%), which is considered conservative. Considering that no discard ban is in place in 2015, this results in landings of no more than 32 t, assuming that discard rates do not change from the average of the last three years (2011–2013) and that the discard mortality rate is 100%. Additional considerations General considerations for Nephrops in the North Sea can be found at the beginning of Section 6.3.15. Uncertainties in the assessment Table 6.3.15.6.2 shows a sensitivity analysis that explores whether average landings of the last ten years would correspond to a precautionary harvest rate (HR) under a range of potential Nephrops density values in the FU. It shows that this advice is sensitive to that estimate since, with a lower density (0.05), only an advised recent average landings value would correspond to an HR lower than 8% (FMSY). This is why the advice is lower than the default ten year average.
ICES Advice 2014, Book 6 45
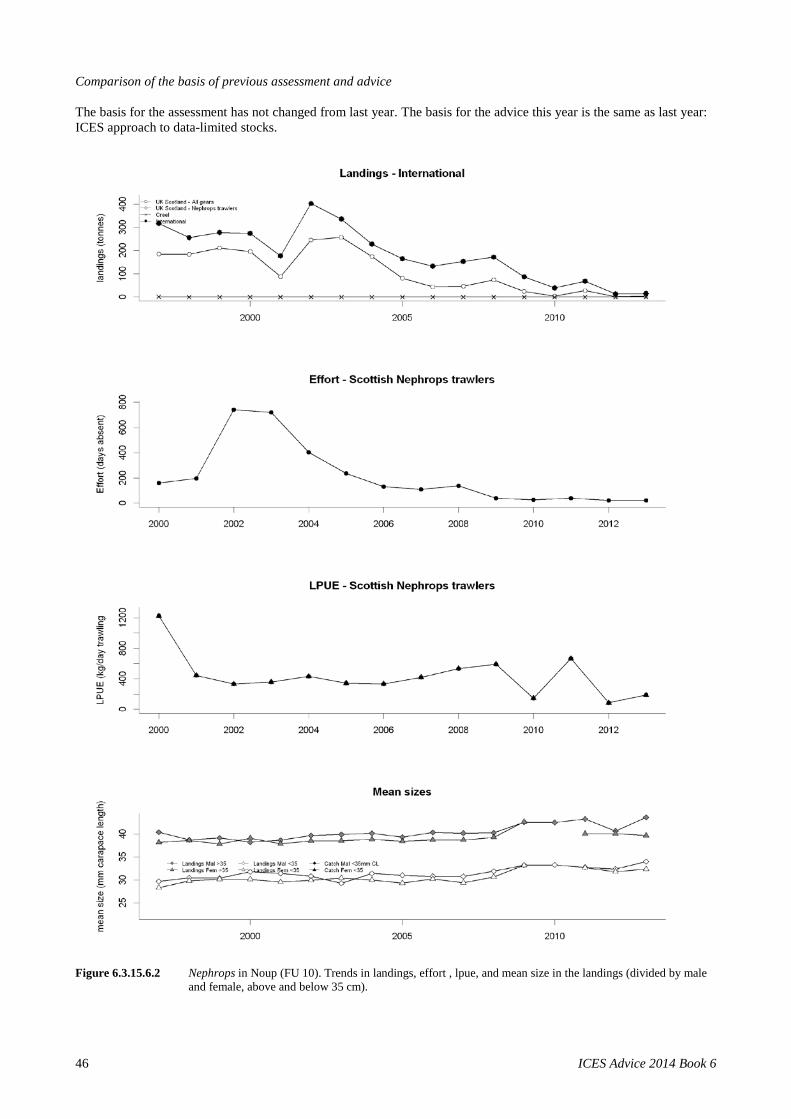
Comparison of the basis of previous assessment and advice The basis for the assessment has not changed from last year. The basis for the advice this year is the same as last year: ICES approach to data-limited stocks.
Figure 6.3.15.6.2 Nephrops in Noup (FU 10). Trends in landings, effort , lpue, and mean size in the landings (divided by male
and female, above and below 35 cm).
46 ICES Advice 2014 Book 6
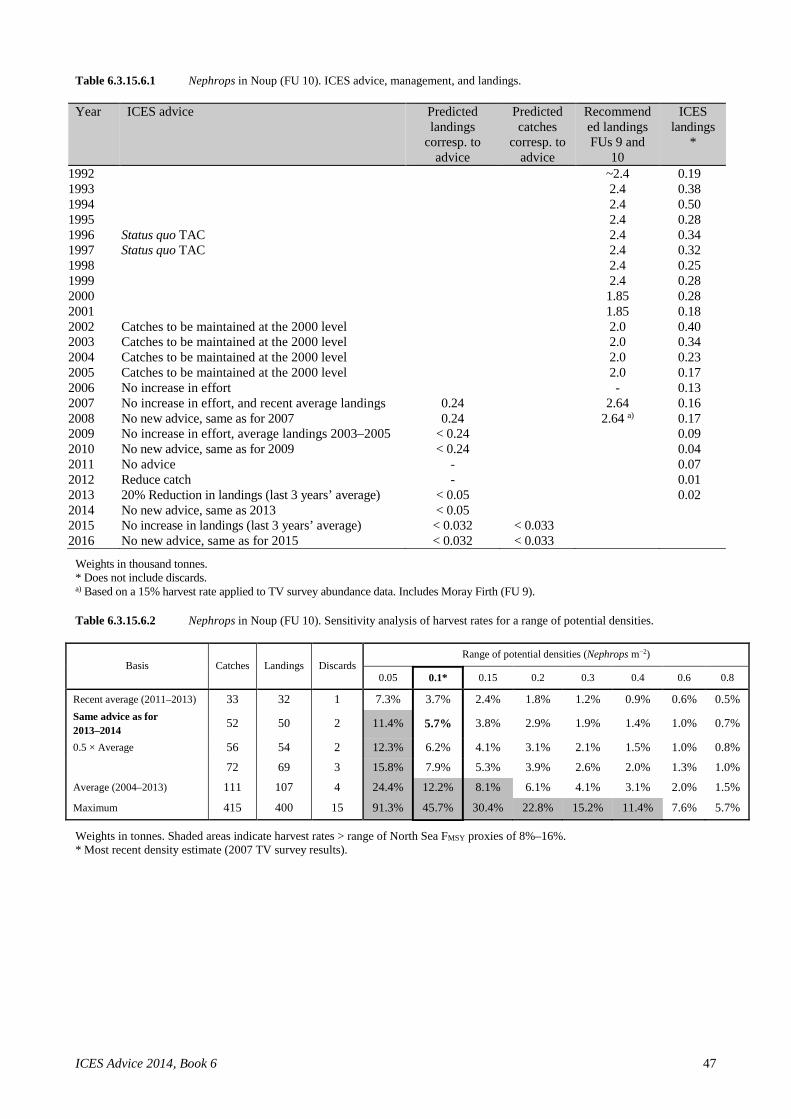
Table 6.3.15.6.1 Nephrops in Noup (FU 10). ICES advice, management, and landings. Year ICES advice Predicted
landings corresp. to
advice
Predicted catches
corresp. to advice
Recommended landings FUs 9 and
10
ICES landings
*
1992 ~2.4 0.19 1993 2.4 0.38 1994 2.4 0.50 1995 2.4 0.28 1996 Status quo TAC 2.4 0.34 1997 Status quo TAC 2.4 0.32 1998 2.4 0.25 1999 2.4 0.28 2000 1.85 0.28 2001 1.85 0.18 2002 Catches to be maintained at the 2000 level 2.0 0.40 2003 Catches to be maintained at the 2000 level 2.0 0.34 2004 Catches to be maintained at the 2000 level 2.0 0.23 2005 Catches to be maintained at the 2000 level 2.0 0.17 2006 No increase in effort - 0.13 2007 No increase in effort, and recent average landings 0.24 2.64 0.16 2008 No new advice, same as for 2007 0.24 2.64 a) 0.17 2009 No increase in effort, average landings 2003–2005 < 0.24 0.09 2010 No new advice, same as for 2009 < 0.24 0.04 2011 No advice - 0.07 2012 Reduce catch - 0.01 2013 20% Reduction in landings (last 3 years’ average) < 0.05 0.02 2014 No new advice, same as 2013 < 0.05 2015 No increase in landings (last 3 years’ average) < 0.032 < 0.033 2016 No new advice, same as for 2015 < 0.032 < 0.033
Weights in thousand tonnes. * Does not include discards. a) Based on a 15% harvest rate applied to TV survey abundance data. Includes Moray Firth (FU 9). Table 6.3.15.6.2 Nephrops in Noup (FU 10). Sensitivity analysis of harvest rates for a range of potential densities.
Basis Catches Landings Discards Range of potential densities (Nephrops m−2)
0.05 0.1* 0.15 0.2 0.3 0.4 0.6 0.8
Recent average (2011–2013) 33 32 1 7.3% 3.7% 2.4% 1.8% 1.2% 0.9% 0.6% 0.5% Same advice as for 2013–2014 52 50 2 11.4% 5.7% 3.8% 2.9% 1.9% 1.4% 1.0% 0.7%
0.5 × Average 56 54 2 12.3% 6.2% 4.1% 3.1% 2.1% 1.5% 1.0% 0.8% 72 69 3 15.8% 7.9% 5.3% 3.9% 2.6% 2.0% 1.3% 1.0% Average (2004–2013) 111 107 4 24.4% 12.2% 8.1% 6.1% 4.1% 3.1% 2.0% 1.5%
Maximum 415 400 15 91.3% 45.7% 30.4% 22.8% 15.2% 11.4% 7.6% 5.7%
Weights in tonnes. Shaded areas indicate harvest rates > range of North Sea FMSY proxies of 8%–16%. * Most recent density estimate (2007 TV survey results).
ICES Advice 2014, Book 6 47

6.3.15.7 Advice June 2014 ECOREGION North Sea STOCK Nephrops in the Norwegian Deep (FU 32) Advice for 2015 and 2016 ICES advises on the basis of the data-limited approach but cannot quantify the resulting catches. The implied landings should be no more than 625 t. For the stock in this functional unit (FU), management is implemented at the functional unit level. State of the stock
Fishing pressure) 2011–2013
MSY (FMSY) Unknown Precautionary approach (Fpa,Flim) Unknown
Qualitative evaluation below possible ref. points
Stock size 2011–2013
MSY (Btrigger) Unknown Precautionary approach (Bpa,Blim) Unknown
Figure 6.3.15.7.1 Nephrops, Norwegian Deep (FU 32). ICES estimated landings (tonnes). The state of this stock is unknown. Based on the assumed low density (based on lowest observed density at FU 7, Fladen Ground), harvest rates are considered low for this stock. Management plans No specific management objectives are known to ICES.
0
200
400
600
800
1000
1200
1400
1980 1985 1990 1995 2000 2005 2010
Land
ings
(t)
International landings
Landings
48 ICES Advice 2014 Book 6
Biology In the Norwegian Deep the Nephrops stock inhabits a single continuous area of muddy sediment extending from 57 to 62˚N. The fisheries Nephrops in FU 32 are caught in 120 mm trawls (mixed fishery), as bycatch in shrimp trawls, and in creels. The stock is fished by Danish and Norwegian fishers, where the Danish vessels take the majority of landings (67% in 2013). Danish fishers only exploit the western part of the stock, indicating that only part of the stock is exploited at present. Sediment maps for this area indicate that there are possibilities for the fishery to expand into new grounds, which have scarcely been fished to date. The recreational fishery for Nephrops along the Norwegian coast has increased in recent years. The extent of this fishery is being investigated through interviews.
Catch distribution Total catch (2013) = unknown, 191 t were official landings (76% trawls and 24% creels). Discards are known to take place but are only quantified for part of the fisheries (35% in weight, 67% of the landings covered).
Effects of the fisheries on the ecosystem Large-meshed trawls (120 mm) as implemented in the Norwegian Deep result in few discards of Nephrops below the minimum landing size (MLS). Quality considerations The advice is based on a calculation of potential landing options and harvest rates, given the known surface area of Nephrops habitat and assumed densities of the functional unit. The methods applied to derive quantitative advice for data-limited stocks are expected to evolve as they are further developed and validated. Scientific basis
Stock data category 4.1.4 (ICES, 2014a). Assessment type Data-limited approach for Nephrops. Input data Commercial catches (international landings, Danish discards, and length frequencies
from catch sampling). One commercial index (Danish lpue). Discards and bycatch Discards are known to take place but are only quantified for part of the fisheries
(discards in 2013 are 35% in weight, 67% of the landings covered). Indicators Length frequency in catches. Other information Benchmarked in 2013 (ICES, 2013). Next benchmark is planned for 2016. Working group report Working Group on the Assessment of Demersal Stocks in the North Sea and Skagerrak
(WGNSSK).
ICES Advice 2014, Book 6 49

6.3.15.7 Supporting information June 2014 ECOREGION North Sea STOCK Nephrops in the Norwegian Deep (FU 32) Reference points No reference points are defined for this stock. Outlook for 2015 and 2016 In the absence of a full analytical assessment, ICES bases its advice for Nephrops on average landings, unless this is considered to be not precautionary. MSY harvest rates estimated for other FUs vary between 8% and 16%. Because this is a data-limited stock, ICES uses the lower boundary as an upper limit for advice. Providing the harvest rate is less than 8%, the default basis for advice is the average of the last ten years. Basis: Surface area of FU 32 = 55 500 km2; Mean individual weight in Danish catches in 2013 = 41 g; Discards (from Danish catches 2009–2013) = 33 % in number; Density = 0.2 Nephrops m−2 (from FU 7)*.
Basis Landings Harvest rate
0.5 × Average 313 0.1%
Average (2004–2013) 625 0.2%
Maximum 1190 0.3%
Weights in tonnes. * A density of 0.2 m−2 is among the lowest observed densities in the North Sea in FU 7 (Fladen). ICES approach to data-limited stocks In the absence of information from this functional unit, the advice is based on an assumed low density of 0.2 Nephrops m−2, corresponding to the lowest observed density in the North Sea (FU 7, Fladen Ground). Even though the discards are unknown, the last ten years’ average landings (625 t) would imply a harvest rate below the range of MSY harvest rates in the North Sea (between 8% and 16%), even if a high discard rate is assumed, which is considered conservative. ICES cannot quantify the resulting catches. The implied landings should be no more than 625 t. Discards are known to take place for part of the fleet but this does not cover all the fisheries and is therefore considered an underestimate of total discarding. Additional considerations General considerations for Nephrops in the North Sea can be found at the beginning of Section 6.3.15. Factors affecting the fisheries and the stock The stock is mainly exploited by Danish vessels (67–82% of the landings in the last five years). During the last 12 years landings have decreased from approximately 1200 t to approximately 200 t. This is due to a decrease in Danish effort and is explained by economic reasons. Regulations and their effects The EU fisheries are managed by a separate TAC for this area, which for 2006–2008 was 1300 t, but decreased to 1200 t in 2009–2012, and further to 1000 t in 2013–2014. The TAC has not been taken the last seven years. The minimum legal size is 40 mm carapace length (CL). Discarding of Nephrops is not prohibited. The Norwegian logbook data (bottom trawls and shrimp trawls) prior to 2010 are considered unsuitable for lpue analyses. The Norwegian logbook system was changed in 2011 when electronic logbooks became compulsory for all vessels ≥15 m length. This provides consistent data for part of the fleet, but as a large portion of the Norwegian fleet landing Nephrops in FU 32 consists of vessels < 15 m, logbook data will continue to be limited.
50 ICES Advice 2014 Book 6

Uncertainties in the assessment The main uncertainty in the assessment is the unknown density and the assumption of a low density similar to the Fladen Ground (FU 7) (Table 6.3.15.7.3). This is especially relevant since the habitable surface area in this FU is very high. Discards for part of the fishery are unquantified. A new landings per unit effort index (lpue, in kg kW-day−1 as opposed to the former kg day−1) shows a stepwise decreasing trend (Figure 6.3.15.7.2). However, due to changes in management regulations in 2002 and 2007 it is not known whether this decrease in lpue is due only to regulation changes or if it also to some degree reflects stock changes. Comparison of the basis of previous assessment and advice The basis for the assessment has not changed from last year. The basis for the advice this year is the same as last year: ICES approach to data-limited stocks.
Figure 6.3.15.7.2 Nephrops, Norwegian Deep (FU 32). The Danish lpue (new index in kg kW-day−1 and old index in kg
day−1) as a stock size indicator. It is not possible to determine the exact cause of this decrease in lpue. It could be related to changes in management or to stock changes.
Figure 6.3.15.7.3 Nephrops in the Norwegian Deep (FU 32). Annual length–frequency distributions in Danish catches.
0
50
100
150
200
250
300
350
0
100
200
300
400
500
600
1980 1985 1990 1995 2000 2005 2010
LPUE
(kg/
day)
LPUE
(kg/
kW d
ay '1
000)
LPUE - Danish trawlers
New LPUE (kg/kW days '1000)New LPUE - mean 1994-2013 Old LPUE (kg/day)
Stock Size Indicator
ICES Advice 2014, Book 6 51
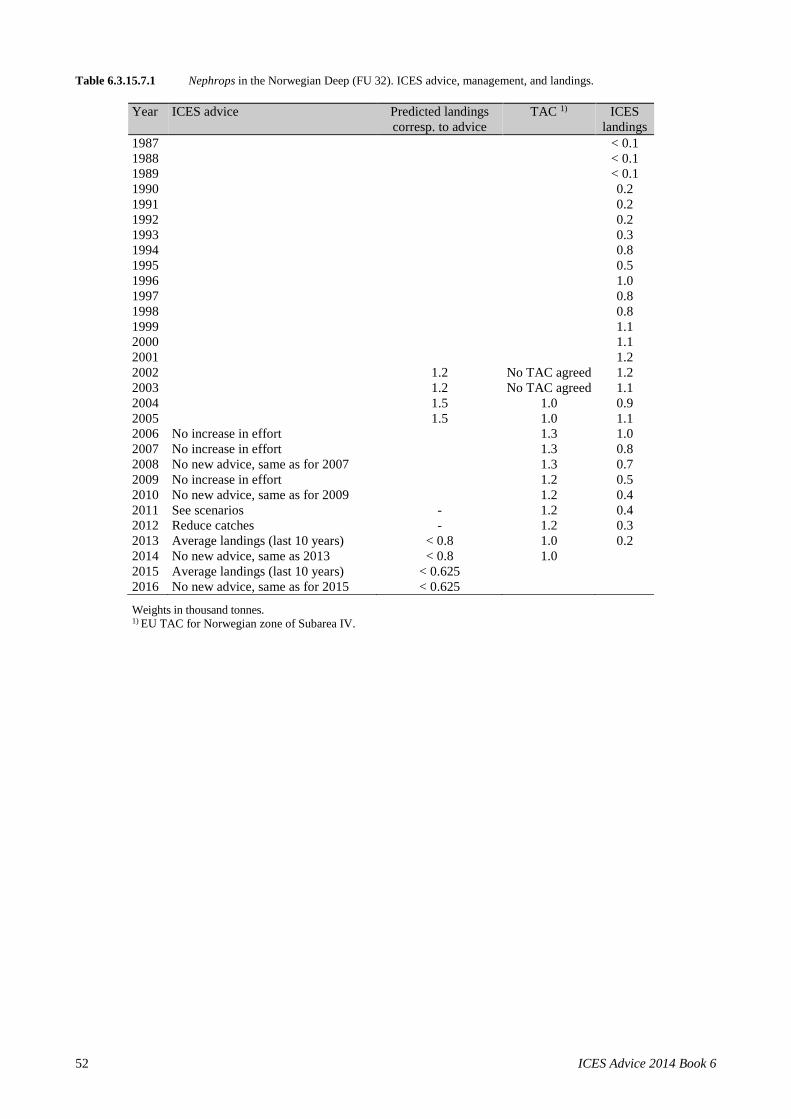
Table 6.3.15.7.1 Nephrops in the Norwegian Deep (FU 32). ICES advice, management, and landings.
Year ICES advice Predicted landings corresp. to advice
TAC 1)
ICES landings
1987 < 0.1 1988 < 0.1 1989 < 0.1 1990 0.2 1991 0.2 1992 0.2 1993 0.3 1994 0.8 1995 0.5 1996 1.0 1997 0.8 1998 0.8 1999 1.1 2000 1.1 2001 1.2 2002 1.2 No TAC agreed 1.2 2003 1.2 No TAC agreed 1.1 2004 1.5 1.0 0.9 2005 1.5 1.0 1.1 2006 No increase in effort 1.3 1.0 2007 No increase in effort 1.3 0.8 2008 No new advice, same as for 2007 1.3 0.7 2009 No increase in effort 1.2 0.5 2010 No new advice, same as for 2009 1.2 0.4 2011 See scenarios - 1.2 0.4 2012 Reduce catches - 1.2 0.3 2013 Average landings (last 10 years) < 0.8 1.0 0.2 2014 No new advice, same as 2013 < 0.8 1.0 2015 Average landings (last 10 years) < 0.625 2016 No new advice, same as for 2015 < 0.625
Weights in thousand tonnes. 1) EU TAC for Norwegian zone of Subarea IV.
52 ICES Advice 2014 Book 6

Table 6.3.15.7.2 Nephrops in the Norwegian Deep (FU 32). International landings, TAC (EU) and Danish lpue.
Year Denmark Danish discards Norway
Sweden UK Netherlands Total TAC Danish lpue dead live Trawl Creel Sub-total
1993 220 102 1 103 16 339 230
1994 584 161 0 161 10 755 396
1995 418 68 1 69 2 489 403
1996 868 73 1 74 10 952 484
1997 689 56 8 64 7 760 343
1998 743 88 1 89 4 836 487
1999 972 119 15 134 13 1119 420
2000 871 143 0 143 37 34 1085 324
2001 1026 72 13 85 26 53 1190 282
2002 1043 42 21 63 13 52 1171 323
2003 996 145 48 68 11 79 1 14 1090 282
2004 835 200 67 72 8 80 1 6 922 1000 335
2005 979 272 91 89 13 102 2 6 1089 1000 349
2006 939 126 42 62 19 81 1 7 5 1033 1300 307
2007 652 64 21 77 20 97 5 1 755 1300 364
2008 505 112 30 142 24 4 675 1300 318
2009 331 29 10 107 31 138 2 6 477 1200 243
2010 282 36 12 82 41 123 1 1 407 1200 244
2011 322 29 40 69 1 3 395 1200 280
2012 234 35 12 25 50 75 1 0 310 1200 258
2013* 128 51 17 18 45 63 0 0 191 1000 152
2014 1000
* Provisional. Table 6.3.15.7.3 Nephrops in the Norwegian Deep (FU 32). Sensitivity analysis of harvest rates for a range of potential
densities.
Range of potential densities (Nephrops m−2)
Basis Landings (tonnes) 0.05 0.1 0.2* 0.3 0.4 0.5 0.6 0.7 0.8
0.5 × Average 313 0.4% 0.2% 0.1% 0.1% 0.0% 0.0% 0.0% 0.0% 0.0% Average (2004–2013) 625 0.7% 0.4% 0.2% 0.1% 0.1% 0.1% 0.1% 0.1% 0.0%
Maximum 1190 1.4% 0.7% 0.3% 0.2% 0.2% 0.1% 0.1% 0.1% 0.1%
* A density of 0.2 m−2 is among the lowest observed densities in the North Sea in FU 7 (Fladen).
ICES Advice 2014, Book 6 53

6.3.15.8 Advice June 2014 ECOREGION North Sea STOCK Nephrops off Horn’s Reef (FU 33) Advice for 2015 and 2016 ICES advises on the basis of the data-limited approach, but cannot quantify the resulting catches. The implied landings should be no more than 1136 t. In order to ensure the stock in this FU is exploited sustainably, management should be implemented at the functional unit level. State of the stock
Fishing pressure 2011–2013
MSY (FMSY) Unknown Precautionary approach (Fpa,Flim) Unknown
Stock size 2011–2013
MSY (Btrigger) Unknown Precautionary approach (Bpa,Blim) Unknown
Figure 6.3.15.8.1 Nephrops off Horn’s Reef (FU 33). Long-term trends in landings by country (in tonnes). The state of this stock is unknown. Based on the assumed low density (based on lowest observed density at FU 7 (Fladen Ground), harvest rates are considered low for this stock. Management plans No specific management objectives are known to ICES.
Landings by country
54 ICES Advice 2014 Book 6
The fisheries The Nephrops fisheries in the Horn’s Reef area are bottom trawl fisheries. Total landings peaked in 2007. For several years Denmark was the only country exploiting Nephrops in FU 33, accounting for more than 90% of total landings up to 2005. However, in recent years Germany, the Netherlands, and Belgium have expanded their share of exploitation of this stock.
Catch distribution Total catch (2013) = unknown, estimated landings = 946 t (100% trawls). Discards are known to take place but are only quantified for part of the fisheries (34% in weight, 33% of the landings covered).
Quality considerations Assessment data are sparse for this FU. As catches from the Danish fisheries after 2005 only account for a small proportion of the catch, lpue figures from the Danish fisheries after 2005 must be viewed cautiously as stock indicators. The advice is based on a calculation of potential landing options and harvest rates, given the known surface area of Nephrops habitat and assumed densities of the functional unit. The methods applied to derive quantitative advice for data-limited stocks are expected to evolve as they are further developed and validated. Scientific basis
Stock data category 4.1.4 (ICES, 2014a). Assessment type Data-limited approach for Nephrops. Input data Commercial catches (international landings, and length frequencies from catch
sampling). Discards and bycatch Discards are known to take place but are only quantified for part of the fisheries
(discards are 34% in weight, 33% of the landings covered). Indicators None. Other information None. Working group Working Group on the Assessment of Demersal Stocks in the North Sea and Skagerrak
WGNSSK.
ICES Advice 2014, Book 6 55
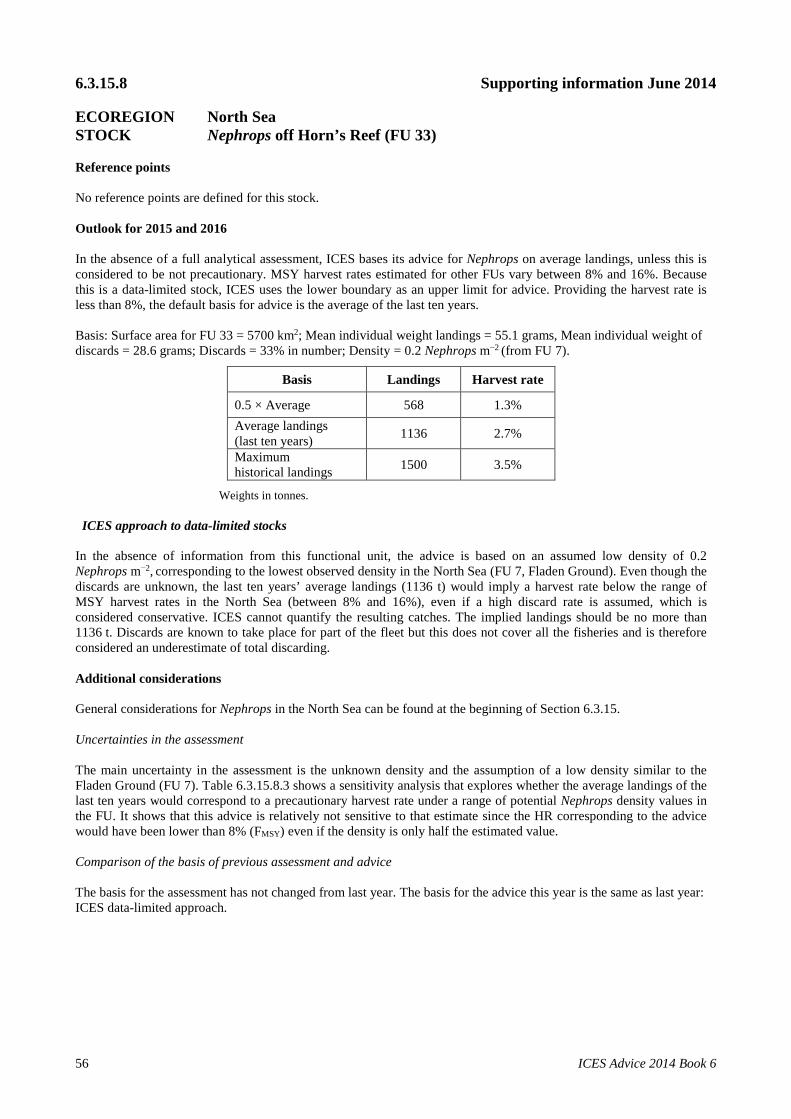
6.3.15.8 Supporting information June 2014 ECOREGION North Sea STOCK Nephrops off Horn’s Reef (FU 33) Reference points No reference points are defined for this stock. Outlook for 2015 and 2016 In the absence of a full analytical assessment, ICES bases its advice for Nephrops on average landings, unless this is considered to be not precautionary. MSY harvest rates estimated for other FUs vary between 8% and 16%. Because this is a data-limited stock, ICES uses the lower boundary as an upper limit for advice. Providing the harvest rate is less than 8%, the default basis for advice is the average of the last ten years. Basis: Surface area for FU 33 = 5700 km2; Mean individual weight landings = 55.1 grams, Mean individual weight of discards = 28.6 grams; Discards = 33% in number; Density = 0.2 Nephrops m−2 (from FU 7).
Basis Landings Harvest rate
0.5 × Average 568 1.3% Average landings (last ten years) 1136 2.7%
Maximum historical landings 1500 3.5%
Weights in tonnes. ICES approach to data-limited stocks In the absence of information from this functional unit, the advice is based on an assumed low density of 0.2 Nephrops m−2, corresponding to the lowest observed density in the North Sea (FU 7, Fladen Ground). Even though the discards are unknown, the last ten years’ average landings (1136 t) would imply a harvest rate below the range of MSY harvest rates in the North Sea (between 8% and 16%), even if a high discard rate is assumed, which is considered conservative. ICES cannot quantify the resulting catches. The implied landings should be no more than 1136 t. Discards are known to take place for part of the fleet but this does not cover all the fisheries and is therefore considered an underestimate of total discarding. Additional considerations General considerations for Nephrops in the North Sea can be found at the beginning of Section 6.3.15. Uncertainties in the assessment The main uncertainty in the assessment is the unknown density and the assumption of a low density similar to the Fladen Ground (FU 7). Table 6.3.15.8.3 shows a sensitivity analysis that explores whether the average landings of the last ten years would correspond to a precautionary harvest rate under a range of potential Nephrops density values in the FU. It shows that this advice is relatively not sensitive to that estimate since the HR corresponding to the advice would have been lower than 8% (FMSY) even if the density is only half the estimated value. Comparison of the basis of previous assessment and advice The basis for the assessment has not changed from last year. The basis for the advice this year is the same as last year: ICES data-limited approach.
56 ICES Advice 2014 Book 6
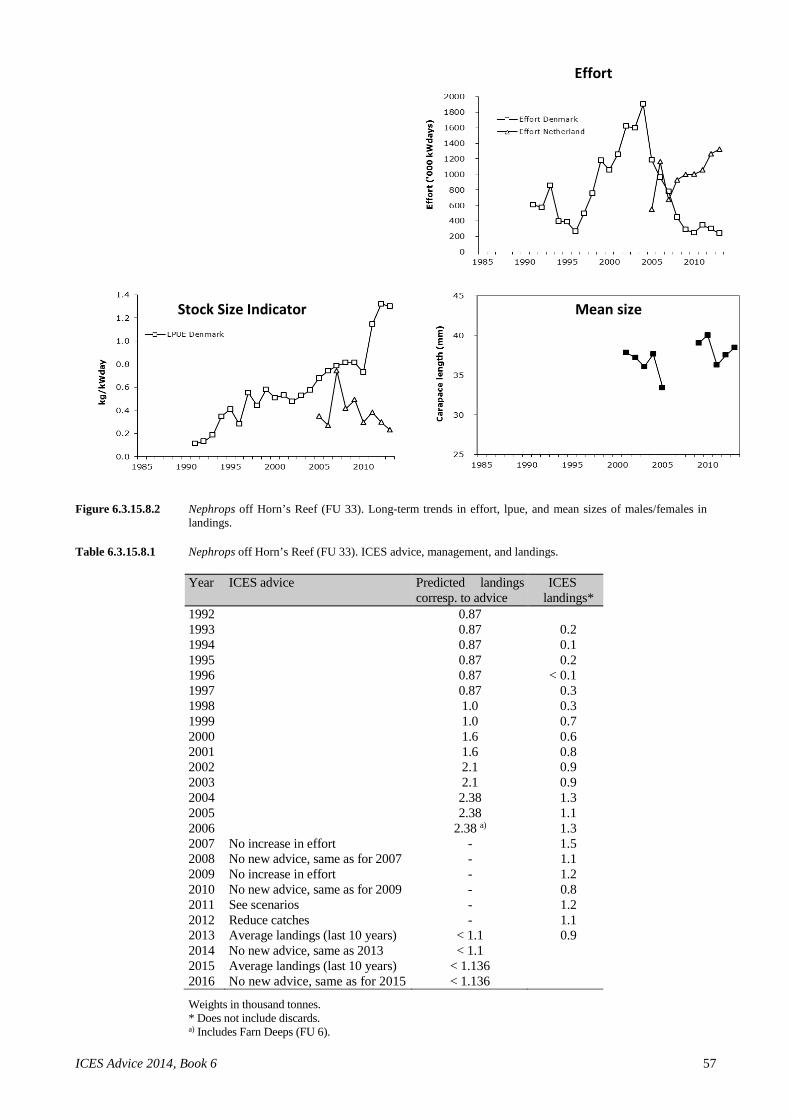
Figure 6.3.15.8.2 Nephrops off Horn’s Reef (FU 33). Long-term trends in effort, lpue, and mean sizes of males/females in
landings. Table 6.3.15.8.1 Nephrops off Horn’s Reef (FU 33). ICES advice, management, and landings.
Year ICES advice Predicted landings corresp. to advice
ICES landings*
1992 0.87 1993 0.87 0.2 1994 0.87 0.1 1995 0.87 0.2 1996 0.87 < 0.1 1997 0.87 0.3 1998 1.0 0.3 1999 1.0 0.7 2000 1.6 0.6 2001 1.6 0.8 2002 2.1 0.9 2003 2.1 0.9 2004 2.38 1.3 2005 2.38 1.1 2006 2.38 a) 1.3 2007 No increase in effort - 1.5 2008 No new advice, same as for 2007 - 1.1 2009 No increase in effort - 1.2 2010 No new advice, same as for 2009 - 0.8 2011 See scenarios - 1.2 2012 Reduce catches - 1.1 2013 Average landings (last 10 years) < 1.1 0.9 2014 No new advice, same as 2013 < 1.1 2015 Average landings (last 10 years) < 1.136 2016 No new advice, same as for 2015 < 1.136
Weights in thousand tonnes. * Does not include discards. a) Includes Farn Deeps (FU 6).
Effort
Mean size Stock Size Indicator
ICES Advice 2014, Book 6 57

Table 6.3.15.8.2 Nephrops off Horn’s Reef (FU 33). ICES estimates of landings per country (tonnes).
Belgium Denmark Germany Netherlands UK Total ** 1993 0 159 na 1 160 1994 0 137 na 0 137 1995 3 158 3 1 164 1996 1 74 2 0 77 1997 0 274 2 0 276 1998 4 333 8 12 1 350 1999 22 683 14 12 6 724 2000 13 537 12 39 9 597 2001 52 667 11 61 + 791 2002 21 772 13 51 4 861 2003 15 842 4 67 1 929 2004 37 1097 24 109 1 1268 2005 16 803 31 191 9 1050 2006 97 710 151 314 15 1288 2007 118 610 201 496 42 1467 2008 130 362 160 386 58 1096 2009 121 231 150 491 170 1163 2010 56 180 206 295 69 806 2011 163 396 202 403 28 1191 2012 181 394 132 376 2 1084 2013* 156 310 174 304 2 946
* Provisional. ** Totals for 1993–1994 do not include landings by the Netherlands. na = not available.
Table 6.3.15.8.3 Nephrops off Horn’s Reef (FU 33). Sensitivity analysis of harvest rates for a range of potential densities.
Range of potential densities (Nephrops m−2)
Basis Landings 0.05 0.1 0.2* 0.3 0.4 0.5 0.6 0.7 0.8
0.5 × Average 568 5.4% 2.7% 1.3% 0.9% 0.7% 0.5% 0.4% 0.4% 0.3% Average landings (last ten years) 1136 10.8% 5.4% 2.7% 1.8% 1.3% 1.1% 0.9% 0.8% 0.7%
Maximum historical landings 1467 13.9% 7.0% 3.5% 2.3% 1.7% 1.4% 1.2% 1.0% 0.9%
Weights in tonnes. * A density of 0.2 m−2 is typical of the lowest observed density in the North Sea in FU 7 (Fladen). Shaded areas indicate harvest rates > range of North Sea FMSY proxies of 8%–16%.
58 ICES Advice 2014 Book 6
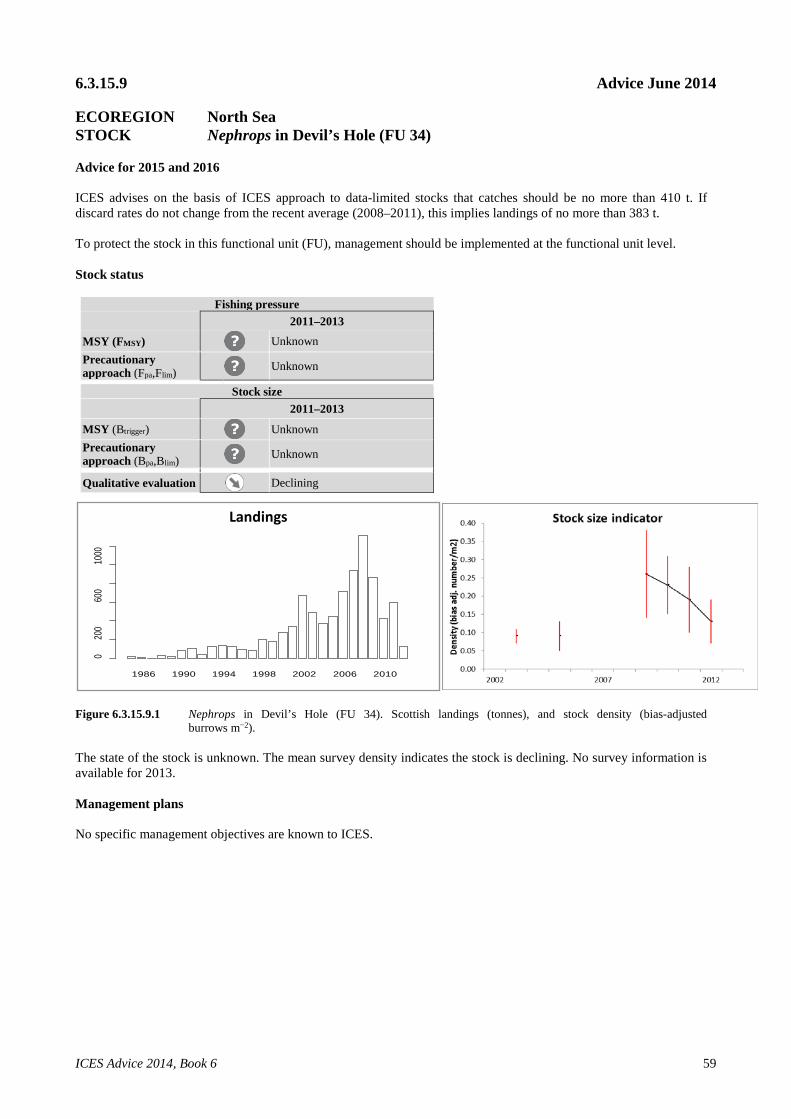
6.3.15.9 Advice June 2014 ECOREGION North Sea STOCK Nephrops in Devil’s Hole (FU 34) Advice for 2015 and 2016 ICES advises on the basis of ICES approach to data-limited stocks that catches should be no more than 410 t. If discard rates do not change from the recent average (2008–2011), this implies landings of no more than 383 t. To protect the stock in this functional unit (FU), management should be implemented at the functional unit level. Stock status
Fishing pressure 2011–2013
MSY (FMSY) Unknown Precautionary approach (Fpa,Flim) Unknown
Stock size 2011–2013
MSY (Btrigger) Unknown Precautionary approach (Bpa,Blim) Unknown
Qualitative evaluation Declining Figure 6.3.15.9.1 Nephrops in Devil’s Hole (FU 34). Scottish landings (tonnes), and stock density (bias-adjusted
burrows m−2). The state of the stock is unknown. The mean survey density indicates the stock is declining. No survey information is available for 2013. Management plans No specific management objectives are known to ICES.
1986 1990 1994 1998 2002 2006 2010
Landings
020
060
010
00
Landings
ICES Advice 2014, Book 6 59
The fisheries The Nephrops fishery at Devil’s Hole is prosecuted by around twenty vessels on a regular basis. There is no discard information for this fishery. International landings are only available for the last four years. Anecdotal reports indicate that most of the landings have been made by Scottish vessels. In 2013, effort in FU 34 decreased as the poor fishery in Fladen continued and fewer vessels were reported to be operating in the offshore grounds.
Catch distribution Total catch (2013) = unknown, official landings = 121 t (100% trawls). Discards are known to take place but cannot be quantified for 2013.
Quality considerations The time-series of UWTV survey data is incomplete. Surveys were conducted in 2003, 2005, and 2009–2012. The advice is based on a calculation of potential landing options and harvest rates, given the known surface area of Nephrops habitat and assumed densities of the functional unit. The surface area is based on an estimate of area derived from Scottish VMS data from Scottish Nephrops vessels from 2006–2009. The area of ground shown in geological charts is significantly larger than this and landings have been made from these areas – therefore the area should be regarded as a minimum estimate and the harvest rate could well be lower than implied by the analysis. The methods applied to derive quantitative advice for data-limited stocks are expected to evolve as they are further developed and validated. Scientific basis
Stock data category 4.1.4 (ICES, 2014a). Assessment type Data-limited method for Nephrops. Input data Commercial catches (international landings, length frequencies from Scottish catch
sampling 2006–2011), habitat extent, mean size, one survey index (occasional UWTV surveys).
Discards and bycatch Used to provide advice but not included in the assessment. Discard rates estimated for 2008–2011 were used to calculate discards in 2012 and 2013.
Indicators Landings per unit effort. Other information Latest benchmark was performed in 2013. Working group Working Group on the Assessment of Demersal Stocks in the North Sea and Skagerrak
(WGNSSK).
60 ICES Advice 2014 Book 6

6.3.15.9 Supporting information June 2014 ECOREGION North Sea STOCK Nephrops in Devil’s Hole (FU 34) Reference points No reference points are defined for this stock. Outlook for 2015 and 2016 In the absence of a full analytical assessment, ICES bases advice for Nephrops on average landings, unless this is considered to be not precautionary. MSY harvest rates estimated for other FUs vary between 8% and 16%. Because this is a data-limited stock, ICES uses the lower boundary as an upper limit for advice. Providing the harvest rate is less than 8%, the default basis for advice is the average of the last ten years. Basis: Surface area of FU 34 = 1753 km2; Mean individual weight in landings = 31.76 g; Discards = 12.9% in number (average 2008–2011); Mean individual weight in discards (2011–2013) = 14.94 g (from FU 7); Discard survival is assumed to be zero; Density = 0.15 Nephrops m−2 (from results of TV survey in 2012).
Basis Catches Landings Discards Harvest
rate 0.5 × Average (2004–2013) 337 315 22 4.3% Recent average (2011–2013) 410 383 27 5.3% 2012 advice −20% 513 480 33 6.6% 2012 advice −15% 546 510 36 7.0% 615 575 40 7.9% Average (2004–2013) 673 629 44 8.6% Maximum 1396 1305 91 17.9%
Weights in tonnes. Shaded areas indicate harvest rates > range of North Sea FMSY proxies of 8%–16%.
ICES approach to data-limited stocks For this stock, average catches of 673 t for the last ten years correspond to a potential harvest rate of 8.6 %, based on the 2012 density estimate of 0.15 Nephrops m−2. This is considered within the range of MSY harvest rates in the North Sea (between 8% and 16%). For this reason it is not recommended to use the average landings of the last ten years as the basis for advice. Recent average catches of the last three years correspond to a potential harvest rate of 5.3%. This is considered below the range of MSY harvest rates in the North Sea (between 8% and 16%), which is considered conservative. Considering that no discard ban is in place in 2015, this results in landings of no more than 383 t, assuming that discard rates do not change from the recent average (2008–2011) and a discard mortality of 100 %. Additional considerations General considerations for Nephrops in the North Sea can be found at the beginning of Section 6.3.15. Available international landings data are presently available from 2010. The recent average landings (2011–2013) are based on international landings. The Scottish landings series is available for a longer time-series and comprises most of the fishing activity that has taken place at Devil’s Hole – this has been used in the calculation of the ten-year average. No survey information is available for 2013, which makes it impossible to provide an analytical assessment for this stock at the present time.
ICES Advice 2014, Book 6 61

Uncertainties in the assessment No UWTV survey was conducted in 2013. The density of Nephrops is considered to be the same as last year (0.15 individuals m−2). Table 6.3.15.9.4 shows a sensitivity analysis that explores whether the average landings of the last ten years would correspond to a precautionary harvest rate (HR) under a range of potential Nephrops density values in the FU. It shows that this advice is sensitive to that estimate since, with a lower density (0.05), only an advised recent average landings value would correspond to an HR lower than 8% (FMSY). This is why the advice is lower than the default ten-year average. Comparison of the basis of previous assessment and advice The basis for the assessment has not changed from last year. The basis for the advice this year is the same as last year: ICES approach to data-limited stocks.
Figure 6.3.15.9.2 Nephrops in Devil’s Hole (FU 34). Trends in effort (in fishing days) and landings per unit effort (kg day−1). Table 6.3.15.9.1 Nephrops in Devil’s Hole (FU 34). ICES advice, management, and landings.
Year ICES advice Predicted landings corresp. to advice
ICES landings 1)
2009 No separate advice 1.3 2010 No separate advice 0.76 2011 No separate advice 0.43 2012 No separate advice - 0.59 2013 Average landings (last 10 years) < 0.6 0.12 2014 No new advice, same as 2013 < 0.6 2015 Recent average landings (last 3 years) < 0.383 2016 No new advice, same as for 2015 < 0.383
Weights in thousand tonnes. 1) Provisional international landings, only available from 2009. Does not include discards.
2000 2002 2004 2006 2008 2010 2012
050
010
0015
0020
00
Effort
Year
Effor
t (day
s)
2000 2002 2004 2006 2008 2010 2012
200
400
600
800
1200
LPUE
Year
LPUE
(kg/d
ays)
Effort
62 ICES Advice 2014 Book 6
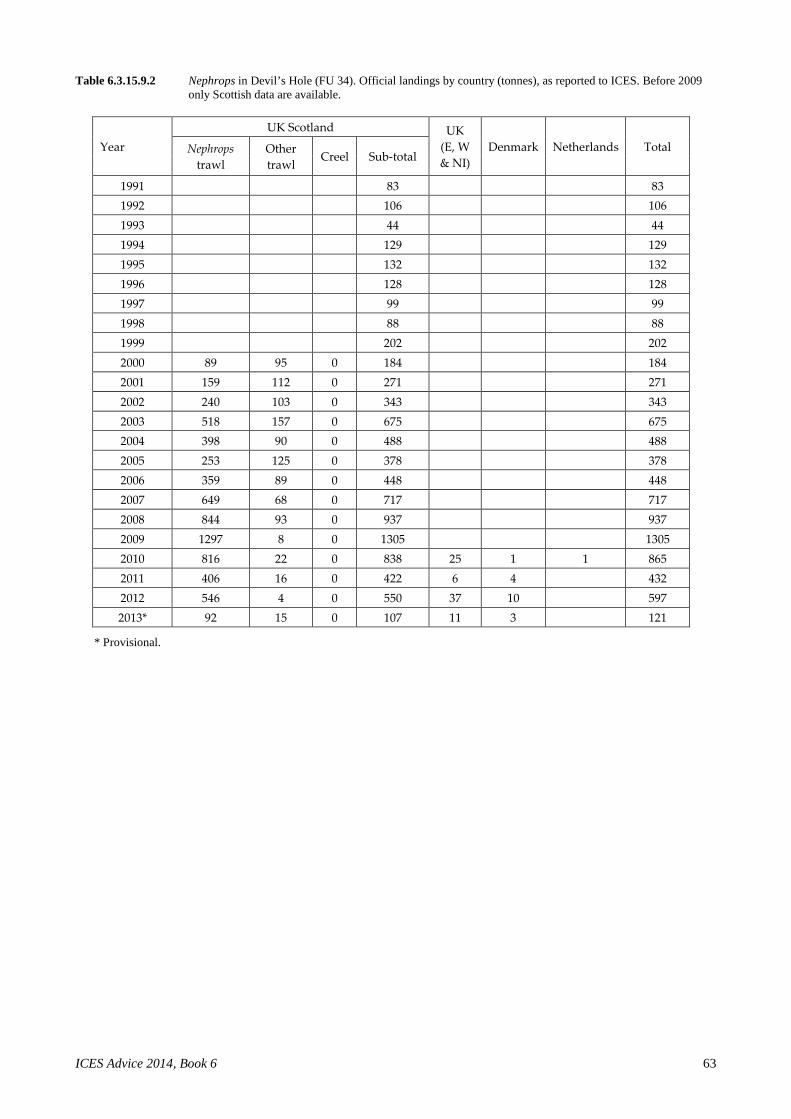
Table 6.3.15.9.2 Nephrops in Devil’s Hole (FU 34). Official landings by country (tonnes), as reported to ICES. Before 2009 only Scottish data are available.
UK Scotland UK
(E, W & NI)
Denmark Netherlands Total Year Nephrops trawl
Other trawl
Creel Sub-total
1991 83 83 1992 106 106 1993 44 44 1994 129 129 1995 132 132 1996 128 128 1997 99 99 1998 88 88 1999 202 202 2000 89 95 0 184 184 2001 159 112 0 271 271 2002 240 103 0 343 343 2003 518 157 0 675 675 2004 398 90 0 488 488 2005 253 125 0 378 378 2006 359 89 0 448 448 2007 649 68 0 717 717 2008 844 93 0 937 937 2009 1297 8 0 1305 1305 2010 816 22 0 838 25 1 1 865 2011 406 16 0 422 6 4 432 2012 546 4 0 550 37 10 597 2013* 92 15 0 107 11 3 121
* Provisional.
ICES Advice 2014, Book 6 63

Table 6.3.15.9.3 Nephrops in Devil’s Hole (FU 34). Stock density estimates (results of the 2003, 2005, and 2009–2012 surveys (adjusted for bias = 1.40)), and landings, effort (days fishing), and lpue (kg day−1) for UK bottom trawlers landing in Scotland and fishing Nephrops with codend mesh sizes of 70 mm or above, 2000–2013.
Year Stock density estimates Landings per unit effort
Stations
Mean density
(burrows m−2)
95% confidence
interval (burrows m−2)
Landings (tonnes)
Effort (fishing days)
Lpue (kg day−1)
2000 184 3.4 54.1 2001 271 3.1 87.4 2002 343 2.0 171.5
2003 20 0.09 0.02 675 2.6 259.6
2004 no survey 488 1.6 305.0
2005 29 0.09 0.04 378 1.5 252.0
2006 no survey 448 1.4 320.0
2007 no survey 717 1.8 398.3
2008 no survey 937 1.7 551.2
2009 14 0.26 0.12 1305 1.9 686.8
2010 20 0.23 0.08 838 1.5 558.7
2011 15 0.19 0.09 422 1.0 422.0
2012 16 0.13 0.06 550 1.3 423.1
2013* 107 0.4 267.5
* Provisional. Table 6.3.15.9.4 Nephrops in Devil’s Hole (FU 34). Sensitivity analysis of harvest rates for a range of potential densities.
Basis Catches Landings Discards Range of potential densities (Nephrops m−2)
0.05 0.1 0.15* 0.2 0.3 0.4 0.6 0.8
0.5 × Average (2004–2013)
337 315 22 13.0% 6.5% 4.3% 3.2% 2.2% 1.6% 1.1% 0.8%
Recent average (2011–2013) 410 383 27 15.8% 7.9% 5.3% 3.9% 2.6% 2.0% 1.3% 1.0%
2012 advice −20% 513 480 33 19.8% 9.9% 6.6% 4.9% 3.3% 2.5% 1.6% 1.2%
2012 advice −15% 546 510 36 21.0% 10.5% 7.0% 5.3% 3.5% 2.6% 1.8% 1.3%
615 575 40 23.7% 11.9% 7.9% 5.9% 4.0% 3.0% 2.0% 1.5% Average (2004–2013)
673 629 44 25.9% 13.0% 8.6% 6.5% 4.3% 3.2% 2.2% 1.6%
Maximum 1396 1305 91 53.8% 26.9% 17.9% 13.5% 9.0% 6.7% 4.5% 3.4%
Weights in tonnes. Shaded areas indicate harvest rates > range of North Sea FMSY proxies of 8%–16%. * Most recent density estimate (2012 preliminary TV survey results).
64 ICES Advice 2014 Book 6