6.003: signal processing spring 2020 · 1 6.003: signal processing signal processing overview of...
TRANSCRIPT

6.003: Signal Processing Spring 2020
1
6.003: Signal Processing
Signal Processing
• Overview of Subject
• Signals: Definitions, Examples, and Operations
• Time and Frequency Representations
• Fourier Series
February 4, 2020
6.003: Signal Processing
Signals are functions that contain and convey information.
Examples:
• the MP3 representation of a sound
• the JPEG representation of a picture
• an MRI image of a brain
Signal Processing develops the use of signals as abstractions:
• identifying signals in physical, mathematical, computation contexts,
• analyzing signals to understand the information they contain, and
• manipulating signals to modify and/or extract information.
6.003: Signal Processing
Signal Processing is widely used in science and engineering to ...
• model some aspect of the world,
• analyze the model, and
• interpret results to gain a new or better understanding.
model result
world new understanding
make model
analyze
(math, computation)
interpret results
Signal Processing provides a common language across disciplines.
Classical analyses use a variety of maths, especially calculus. We will also
use computation to solve real-world problems that are difficult or impos-
sible to solve analytically.
→ strengthens ties to the real world
Course Mechanics
Schedule
Lecture: Tue. and Thu. 2-3pm in 32-141
Recitation: Tue. and Thu. 3-4pm in 24-121 or 26-328
Office Hours: Tue. and Thu. 4-5pm in 24-121 or 26-328
Wed. and Thu. 7-9pm in 36-144
Sun. 4-6pm (room TBD)
Homework – issued Tuesdays, due following Tuesday at noon
• Drills: focus on facts, definitions, and simple concepts
− online with immediate feedback (not graded)
• Problems: focus on developing problem solving skills
– pencil and paper problems taken from previous exams
– simple computational extensions to real-world data
– completely specified, unambiguous, self-contained
• Labs: focus on applications of 6.003 to authentic problems
– more open-ended, multiple approaches, multiple solutions
– deepen understanding and demonstrate wide applicability
– issued Tuesday, required check-in Thursday, due following Tuesday
Two Midterms and a Final Exam
Signals
Signals are functions that are used to convey information.
– may have 1 or 2 or 3 or even more independent variables
t
sou
nd
pre
ssu
re(t
)
x
y brightness (x, y)
Signals
Signals are functions that are used to convey information.
– dependent variable can be a scalar or a vector
x
yscalar: brightness
at each point (x, y)
x
y
vector: (red,green,blue)at each point (x, y)

6.003: Signal Processing Spring 2020
2
Signals
Signals are functions that are used to convey information.
– dependent variable can be real, imaginary, or complex-valued
t
x(t) = ej2πt = cos 2πt +j sin 2πt
1
0
−1
1 2
Signals
Signals are functions that are used to convey information.
– continuous domain versus discrete domain
t
x(t)
0 0.1 0.2 0.3 0.4 0.5n
x[n]
0 2 4 6 8 10
Signals from physical systems are often of continuous domain:
• continuous time – measured in seconds
• continuous spatial coordinates – measured in meters
Computations usually manipulate functions of discrete domain:
• discrete time – measured in samples
• discrete spatial coordinates – measured in samples
Relating continuous and discrete representations enables application of
computational methods to solve problems that are intrinsically continuous.
Signals
Sampling: converting CT signals to DT
t
x(t)
0T 2T 4T 6T 8T 10Tn
x[n] = x(nT )
0 2 4 6 8 10
T = sampling interval
Important for computational manipulation of physical data.
• digital representations of audio signals (as in MP3)
• digital representations of images (as in JPEG)
Signals
Reconstruction: converting DT signals to CT
zero-order hold
n
x[n]
0 2 4 6 8 10t
x(t)
0 2T 4T 6T 8T 10T
T = sampling interval
commonly used in audio output devices
Signals
Reconstruction: converting DT signals to CT
piecewise linear
n
x[n]
0 2 4 6 8 10t
x(t)
0 2T 4T 6T 8T 10T
T = sampling interval
commonly used in rendering images
Signals
Periodic signals consist of repeated cycles (periods).
t
x(t) = x(t+ T )
0 T
periodic
t
x(t)
0
aperiodic
n
x[n] = x[n+N ]
0 Nn
x[n]
0
Useful for modeling periodic or nearly-periodic systems
• planetary motions
• vibrating strings

6.003: Signal Processing Spring 2020
3
Signals
Right-sided signals are zero before some starting time.
Left-sided signals are zero after some ending time.
right-sided left-sided
t
x(t)
0 Tst
x(t)
0Te
n
x[n]
0 Ns
n
x[n]
0Ne
Useful for modeling systems that have a well-defined starting point:
• piano note
• striking a cymbal
Signals
Signals can be symmetric or antisymmetric about time zero.
symmetric antisymmetric
t
x(t) = x(−t)
0
t
x(t) = −x(−t)
n
x[n] = x[−n]
0
n
x[n] = −x[−n]
0
Check Yourself
Computer generated speech (by Robert Donovan)
t
f(t)
Listen to the following four manipulated signals:
f1(t), f2(t), f3(t), f4(t).
How many of the following relations are true?
• f1(t) = f(2t)• f2(t) = −f(t)• f3(t) = f(2t)• f4(t) = 1
3f(t)
Musical Sounds as Signals
Signals are functions that are used to convey information.
Example: a musical sound can be represented as a function of time.
t [seconds]
pressure
Although this time function is a complete description of the sound, it does
not expose many of the important properties of the sound.
Musical Sounds as Signals
Even though these sounds have the same pitch, they sound different.
t
piano
t
cello
t
bassoon
t
oboe
t
horn
t
altosax
t
violin
1262 sec.
It’s not clear how the differences relate to properties of the signals.
(audio clips from from http://theremin.music.uiowa.edu)
Musical Signals as Sums of Sinusoids
One way to characterize differences between these signals is express each
as a sum of sinusoids.
f(t) =∞∑k=0
(ck cos kωot+ dk sin kωot)
2πωo
t
cos(
0t)
2πωo
t
sin(0t)
2πωo
t
cos(ωot)
2πωo
t
sin(ω
ot)
2πωo
t
cos(
2ωot)
...2πωo
t
sin(2ωot)
...
Since these sounds are (nearly) periodic, the frequencies of the dominant
sinusoids are (nearly) integer multiples of a fundamental frequency ωo.
6.003: Signal Processing Spring 2020
4
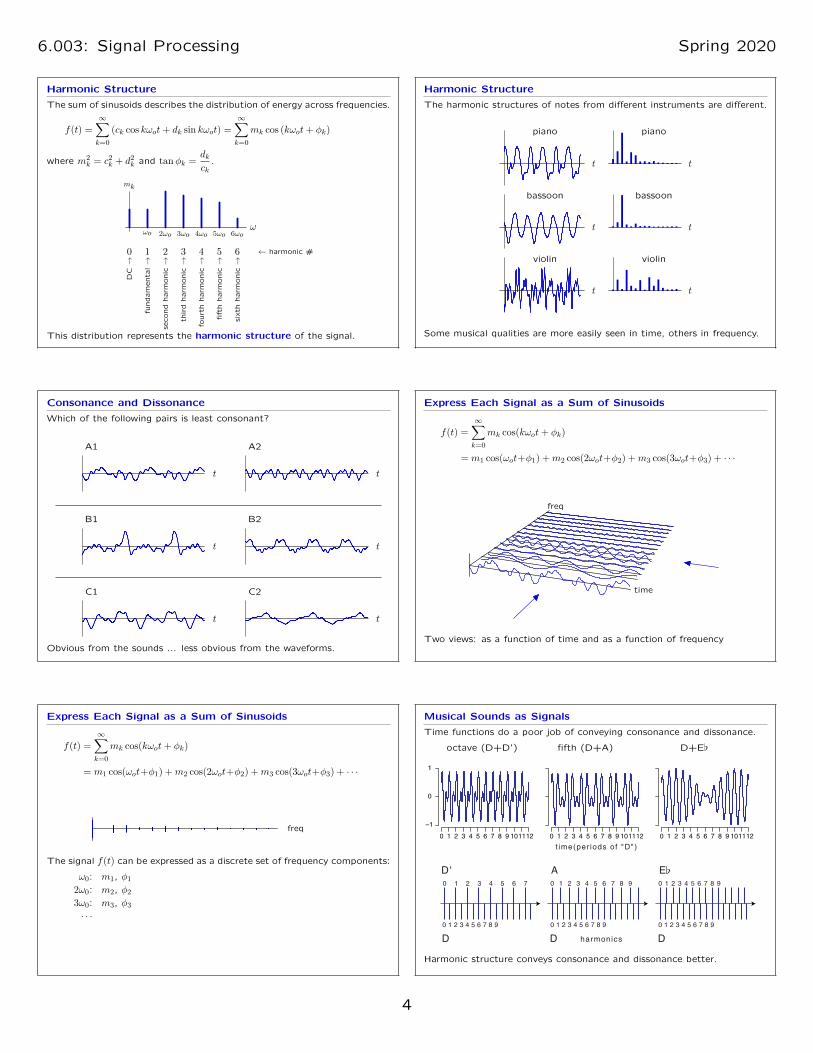
Harmonic Structure
The sum of sinusoids describes the distribution of energy across frequencies.
f(t) =∞∑k=0
(ck cos kωot+ dk sin kωot) =∞∑k=0
mk cos (kωot+ φk)
where m2k = c2
k + d2k and tanφk = dk
ck.
ωωo 2ωo 3ωo 4ωo 5ωo 6ωo
mk
0 1 2 3 4 5 6 ← harmonic #
DC→
fun
da
me
nta
l→
sec
on
dh
arm
on
ic→
thir
dh
arm
on
ic→
fou
rth
harm
on
ic→
fift
hh
arm
on
ic→
six
thh
arm
on
ic→
This distribution represents the harmonic structure of the signal.
Harmonic Structure
The harmonic structures of notes from different instruments are different.
t
piano
t
piano
t
bassoon
t
bassoon
t
violin
t
violin
Some musical qualities are more easily seen in time, others in frequency.
Consonance and Dissonance
Which of the following pairs is least consonant?
A1
t
A2
t
B1
t
B2
t
C1
t
C2
t
Obvious from the sounds ... less obvious from the waveforms.
Express Each Signal as a Sum of Sinusoids
f(t) =∞∑k=0
mk cos(kωot+ φk)
= m1 cos(ωot+φ1) +m2 cos(2ωot+φ2) +m3 cos(3ωot+φ3) + · · ·
time
freq
Two views: as a function of time and as a function of frequency
Express Each Signal as a Sum of Sinusoids
f(t) =∞∑k=0
mk cos(kωot+ φk)
= m1 cos(ωot+φ1) +m2 cos(2ωot+φ2) +m3 cos(3ωot+φ3) + · · ·
freq
The signal f(t) can be expressed as a discrete set of frequency components:
ω0: m1, φ12ω0: m2, φ23ω0: m3, φ3· · ·
Musical Sounds as Signals
Time functions do a poor job of conveying consonance and dissonance.
octave (D+D’) fifth (D+A) D+E[
t ime(per iods of "D")
harmonics
0 1 2 3 4 5 6 7 8 9 101112 0 1 2 3 4 5 6 7 8 9 101112 0 1 2 3 4 5 6 7 8 9 101112
–1
0
1
D
D'
D
A
D
E
0 1 2 3 4 5 6 7 8 9
0 1 2 3 4 5 6 7 8 9 0 1 2 3 4 5 6 7 8 9
0 1 2 3 4 5 6 7 8 9 0 1 2 3 4 5 6 7 8 9
0 1 2 3 4 5 6 7
Harmonic structure conveys consonance and dissonance better.

6.003: Signal Processing Spring 2020
5
Fourier Representations of Signals
Fourier series are sums of harmonically related sinusoids.
f(t) =∞∑k=0
(ck cos(kωot) + dk sin(kωot))
where ωo = 2π/T represents the fundamental frequency.
Basis functions:
2πωo
t
cos(
0t)
2πωo
t
sin(0t)
2πωo
t
cos(ωot)
2πωo
tsin
(ωot)
2πωo
t
cos(
2ωot)
...2πωo
t
sin(2ωot)
...
Q1: Under what conditions can we write f(t) as a Fourier series?
Q2: How do we find the coefficients ck and dk.
Fourier Representations of Signals
Under what conditions can we write f(t) as a Fourier series?
Fourier series can only represent periodic signals.
Definition: a signal f(t) is periodic in T if
f(t) = f(t+T )for all t.
Note: if a signal is periodic in T it is also periodic in 2T , 3T , ...
The smallest positive number To for which f(t) = f(t + To) for all t is
sometimes called the fundamental period.
If a signal does not satisfy f(t) = f(t+T ) for any value of T , then the signal
is aperiodic.
Fourier Representations of Signals
Fourier series can only represent periodic signals.
ωωo 2ωo 3ωo 4ωo 5ωo 6ωo
T= 2πωo
t
T= 2πωo
t
All harmonics of ωo (cos(kωot) or sin(kωot)) are periodic in T = 2π/ωo.→ all sums of such signals are periodic in T = 2π/ωo.→ Fourier series can only represent periodic signals.
Calculating Fourier Coefficients
How do we find the coefficients ck and dk for all k?
Key idea: simplify by integrating over the period T of the fundamental.
Start with the general form:
f(t) = f(t+T ) = c0 +∞∑k=1
(ck cos(kωot) + dk sin(kωot))
Integrate both sides over T :∫ T
0f(t) dt =
∫ T
0c0 dt+
∫ T
0
( ∞∑k=1
(ck cos(kωot) + dk sin(kωot)))dt
= Tc0 +∞∑k=1
(ck
∫ T
0cos(kωot) dt+ dk
∫ T
0sin(kωot) dt
)= Tc0
All but the first term integrates to zero, leaving
c0 = 1T
∫ T
0f(t) dt.
This k=0 term represents the average (“DC”) value.
Calculating Fourier Coefficients
Isolate the cl term by multiplying both sides by cos(lωot) before integrating.
f(t) = f(t+T ) = c0 +∞∑k=1
(ck cos(kωot) + dk sin(kωot))
∫ T
0f(t) cos(lωot) dt =
∫ T
0c0 cos(lωot) dt
+∞∑k=1
∫ T
0ck
(12 cos((k−l)ωot) + 1
2 cos((k+l)ωot))dt
+∞∑k=1
∫ T
0dk
(12 sin((k−l)ωot) + 1
2 sin((k+l)ωot))dt
0
T2 cl 0
0 0
If k = l, then sin((k−l)ωot = 0 and the integral is 0.
All of the other dk terms are harmonic sinusoids that integrate to 0.
The only non-zero term on the right side is T2 cl.
We can solve to get an expression for cl as
cl = 2T
∫ T
0f(t) cos(lωot) dt
Calculating Fourier Coefficients
Analogous reasoning allows us to calculate the dk coefficients, but this time
multiplying by sin(lωot) before integrating.
f(t) = f(t+T ) = c0 +∞∑k=1
(ck cos(kωot) + dk sin(kωot))
∫ T
0f(t) sin(lωot) dt =
∫ T
0c0 sin(lωot) dt
+∞∑k=1
∫ T
0ck cos(kωot) sin(lωot) dt
+∞∑k=1
∫ T
0dk sin(kωot) sin(lωot) dt
A single term remains after integrating, allowing us to solve for dl as
dl = 2T
∫ T
0f(t) sin(lωot) dt

6.003: Signal Processing Spring 2020
6
Calculating Fourier Coefficients
Summarizing . . .
If f(t) is expressed as a Fourier series
f(t) = f(t+T ) = c0 +∞∑k=1
(ck cos(kωot) + dk sin(kωot))
the Fourier coefficients are given by
c0 = 1T
∫Tf(t) dt
ck = 2T
∫Tf(t) cos(kωot) dt; k = 1, 2, 3, . . .
dk = 2T
∫Tf(t) sin(kωot) dt; k = 1, 2, 3, . . .
Example of Analysis
Find the Fourier series coefficients for the following triangle wave:
t
f(t) = f(t+2)
0 1 2−1−2
1
T = 2
ωo = 2πT
= π
c0 = 1T
∫ T
0f(t) dt = 1
2
∫ 2
0f(t)dt = 1
2
ck = 2T
∫ T/2
−T/2f(t) cos 2πkt
Tdt = 2
∫ 1
0t cos(πkt) dt =
{− 4π2k2 k odd
0 k = 2, 4, 6, . . .
dk = 0 (by symmetry)
Example of Synthesis
Generate f(t) from the Fourier coefficients in the previous slide.
Start with the Fourier coefficients
f(t) = c0 −∞∑k=1
(ck cos(kωot) + dk sin(kωot)) = 12 −
∞∑k = 1k odd
4π2k2 cos(kπt)
f(t) = 12 −
1∑k = 1k odd
4π2k2 cos(kπt)
t
f(t)
0 1 2−1−2
Example of Synthesis
Generate f(t) from the Fourier coefficients in the previous slide.
Start with the Fourier coefficients
f(t) = c0 −∞∑k=1
(ck cos(kωot) + dk sin(kωot)) = 12 −
∞∑k = 1k odd
4π2k2 cos(kπt)
f(t) = 12 −
3∑k = 1k odd
4π2k2 cos(kπt)
t
f(t)
0 1 2−1−2
Example of Synthesis
Generate f(t) from the Fourier coefficients in the previous slide.
Start with the Fourier coefficients
f(t) = c0 −∞∑k=1
(ck cos(kωot) + dk sin(kωot)) = 12 −
∞∑k = 1k odd
4π2k2 cos(kπt)
f(t) = 12 −
99∑k = 1k odd
4π2k2 cos(kπt)
t
f(t)
0 1 2−1−2
The synthesized function approaches original as number of terms increases.
Two Views of the Same Signal
The harmonic expansion provides an alternative view of the signal.
f(t) =∞∑k=0
(ck cos(kωot) + dk sin(kωot)) =∞∑k=0
mk cos(kωot+φk)
We can view the musical signal as
• a function of time f(t), or
• as a sum of harmonics with amplitudes mk and phase angles φk.
Both views are useful. For example,
• the peak sound pressure is more easily seen in f(t), while
• consonance is more easily analyzed by comparing harmonics.
This type of harmonic analysis is an example of Fourier Analysis,
which is a major theme of this subject.
Next Time: understanding Fourier series and their properties.