6 june 2017 expose/materi public expose... · bisnis obat resep prescription business bisnis...
TRANSCRIPT

PUBLIC EXPOSE PT Darya-Varia Laboratoria Tbk
6 June 2017

PUBLIC EXPOSE PT Darya-Varia Laboratoria Tbk
6 June 2017

Topics
1. Market Overview
2. DVL at Glance
3. DVL Business Overview FY 2016
4. DVL Performance 1st Q 2017

Market Overview

Indonesia Economy IndicatorsGrowth Improvement & Low Inflation
REAL GDP GROWTH INFLATION

Indonesia Economy IndicatorsRupiah Strengthening in 2016

Indonesia Economy IndicatorsCountry With High Consumer Confidence Index

Pharmaceutical Industry Growth
Source: QuintilesIMS – Report February 2017Indonesia Quarterly Pharma Market Update Q4 2016
Market grew mainly driven by generics, while branded Ethical and OTC product growth are single digit


Bisnis Obat ResepPrescription Business
Bisnis Consumer HealthConsumer Health Business
Bisnis Export & Toll Manufacturing
Export & Toll Manufacturing Business
BISNIS UTAMAMAIN BUSINESS STREAMS

Production Facilities
Gunung Putri, Bogor(Soft Capsule, Liquid, Cosmetic)
Citeureup, Bogor(Sterile & Solid)

DVL Highlights

Dexketoprofen
Dipitenz
Omeprazole Sodium Dextofen
Burnazin Plus
IAL System
New Product Launch - PRESCRIPTION

Medical Science Center
• Journal for doctors• Webinar• 9 MSCs in 6 big cities- RSUD dr. Soetomo, Surabaya- RS Hasan Sadikin, Bandung- RS Adam Malik, Medan- Rs Wahidin S, Makassar- RS M. Hoesni, Palembang- RSPAD Gatot Soebroto, Jakarta- RS Kanker Dharmais, Jakarta- RS Fatmawati, Jakarta- RS Harapan Kita, Jakarta

New Product Launch - CONSUMER HEALTH

Communication ProgramConsumer Health
Above-the-Line Advertising
TVC, Radio Talk Show, Print Ad
Below-the-Line Advertising
Educational Forum, Sponsored Events
On-Line Advertising
Social Media Marketing, Brand Website
In-Store Advertising
SPG, Point-of-Sale Merchandising & Display

DVL Business Overview FY 2016
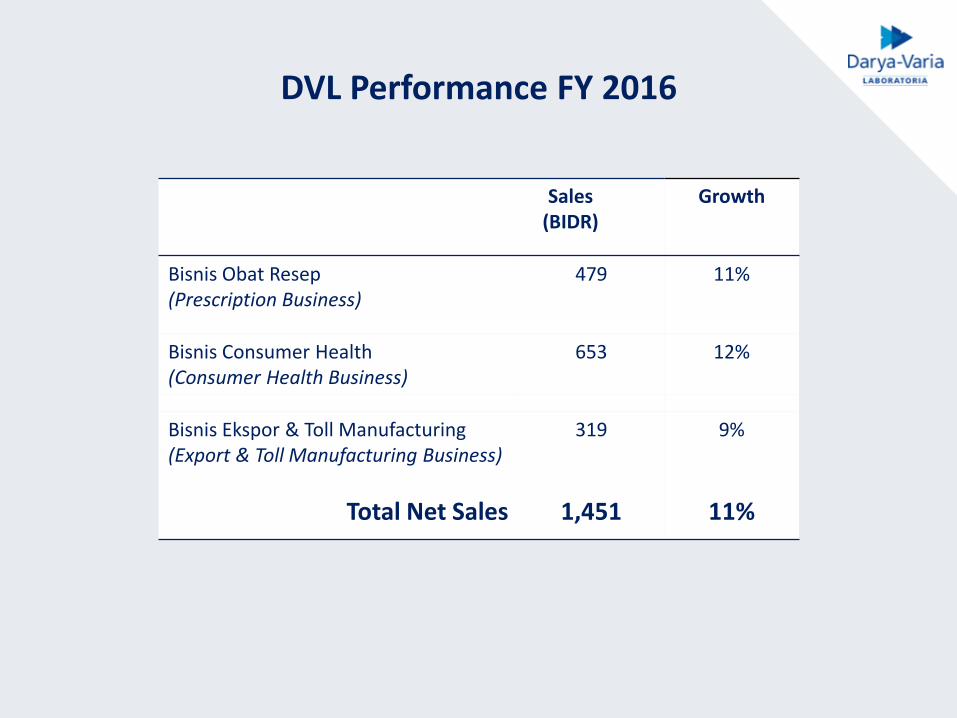
DVL Performance FY 2016
Sales(BIDR)
Growth
Bisnis Obat Resep(Prescription Business)
479 11%
Bisnis Consumer Health(Consumer Health Business)
653 12%
Bisnis Ekspor & Toll Manufacturing(Export & Toll Manufacturing Business)
319 9%
Total Net Sales 1,451 11%

LAPORAN LABA RUGISTATEMENT OF PROFIT OR LOSS
FY 2016
Uraian(dalam miliar Rupiah)
2016 2015% Pertumbuhan
% GrowthDescription
(in billion Rupiah)
Laba Bruto 801 678 18% Gross Income
Laba Usaha 204 127 61% Operating Income
Laba Bersih 152 108 41% Net Income
Marjin Laba Bersih 10% 8% Net Income Margin
Laba bersih per saham(Rupiah penuh)
136 97 40%Net Income per Share (full rupiah)

Uraian(dalam miliar Rupiah)
2016 2015Increase/
(Decrease)Description
(in billion Rupiah)
Jumlah Aset 1,531 1,376 11% Total Assets
Aset Lancar 1,069 1,044 2% Current Assets
Jumlah Liabilitas 452 403 12% Total Liabilities
Liabilitas Jangka Pendek 374 296 26% Current Liabilities
Jumlah Ekuitas 1,080 974 11% Equity
LAPORAN POSISI KEUANGANSTATEMENT OF FINANCIAL POSITION
FY 2016

LAPORAN ARUS KASSTATEMENT OF CASH FLOWS
FY 2016
Uraian(dalam miliar Rupiah)
2016 2015Increase/Decrease
Description (in billion Rupiah)
Arus kas dari aktivitasoperasional
187 214 (12%) Cash flows from operations
Arus kas untuk aktivitas investasi
(197) (39) 405%Cash flows used in investing activities
Arus kas untuk aktivitas pendanaan
(39) (78) (50%)Cash flows used in financing activities

PEMBAYARAN DIVIDENDIVIDEND PAYMENT
FY 2013-2016
Financial Year
Ru
pia
h p
er S
har
e

DVL Performance 1st Q 2017

DVL Performance Q1 2017
Sales(BIDR)
Growth
Bisnis Obat Resep(Prescription Business)
156 14%
Bisnis Consumer Health(Consumer Health Business)
176 6%
Bisnis Ekspor & Toll Manufacturing(Export & Toll Manufacturing Business)
66 (14%)
Total Net Sales 398 5%

LAPORAN LABA RUGISTATEMENT OF PROFIT OR LOSS
Q1 2017
Uraian(dalam miliar Rupiah)
Q1 2017 Q1 2016% Pertumbuhan
% GrowthDescription
(in billion Rupiah)
Laba Bruto 248 207 20% Gross Income
Laba Usaha 106 70 51% Operating Income
Laba Bersih 84 57 47% Net Income
Marjin Laba Bersih 21% 15% Net Income Margin
Laba bersih per saham(Rupiah penuh)
75 5147% Net Income per Share
(full rupiah)

Uraian(dalam miliar Rupiah)
Q1 2017 Q4 2016Increase/
(Decrease)Description
(in billion Rupiah)
Jumlah Aset 1,721 1,531 12% Total Assets
Aset Lancar 1,266 1,069 18% Current Assets
Jumlah Liabilitas 559 452 24% Total Liabilities
Liabilitas Jangka Pendek 477 374 28% Current Liabilities
Jumlah Ekuitas 1,161 1,080 8% Equity
LAPORAN POSISI KEUANGANSTATEMENT OF FINANCIAL POSITION
Q1 2017

LAPORAN ARUS KASSTATEMENT OF CASH FLOWS
Q1 2017
Uraian(dalam miliar Rupiah)
Q1 2017 Q1 2016Increase/Decrease
Description (in billion Rupiah)
Arus kas dari aktivitasoperasional
71 52 38%Cash flows from operations
Arus kas untuk aktivitas investasi
(6) (8) 24%Cash flows used in investing activities
Arus kas untuk aktivitas pendanaan
- - -Cash flows used in financing activities

