6 employment of youth, older persons, women and … labor situation in japan and its analysis:...
TRANSCRIPT

Labor Situation in Japan and Its Analysis: General Overview 2015/201648
Youth Employment
Present Situation and Future OutlookUp until the early 1990s, Japan was known as a
country where the transition from school to work was smooth and youth unemployment was low. This was ascribed not only to vigorous demand for labor, but also to the practice among firms of hiring young workers on the basis of their trainability and the existence of well-developed support for high school graduates to smooth the path from school to work.
In the latter half of the 1990s, however, the situation changed dramatically. For over 10 years starting in the mid-1990s, the labor market for young people continued to decline, as did the ratio of young people becoming permanent employees upon graduation (Figure II-22).
For male high school graduates, 82.6% of those finishing high school in 1986-90 became permanent employees, but this ratio progressively declined, to 61.8% among the youngest group surveyed. The situation is worse for women, with 72.7% of those finishing high school in 1986-90 being hired as permanent employees, but only about half doing so today. The change is not as pronounced among university graduates, but 90.5% of men leaving university in 1990-94 were hired as permanent employees, falling to around 70% today. The least substantial drop was among women completing university, with 78.9% becoming permanent employees in 1990-94 compared to around 70% today. This information implies that the status of female university graduates in the Japanese labor market has risen in relative terms.
The demand for younger workers fell after the financial crisis of 2008, but since 2013 there is an ongoing trend toward recovery of demand for new graduates.
Movements in Youth Unemployment RatesThe Japanese youth unemployment rate was low
in the 1980s, but surged in the late 1990s, and has been rising and falling in line with economic cycles (Figure II-23).
Polarization of the Labor MarketLet us examine career patterns among younger
workers based on the results of the JILPT’s quadrat analysis of the Employment Status Survey conducted by the Ministry of Internal Affairs and Communications (MIC) in October 2012 (Table II-24). In the case of men, “settled permanent employees” (those who became permanent employees immediately after leaving education, have not changed jobs and were permanent employees at the time of the survey), accounted for 34.5% of high school graduates and 61.7% of university graduates; “permanent employees who have changed jobs” (those who became permanent employees immediately after leaving education, have experience of changing jobs and becoming permanent employees at another company, and were permanent employees at the time of the survey), accounted for 15.0% of high school graduates and 11.2% of university graduates; “formerly atypical permanent employees” (those
who were formerly atypical but are now permanent employees) accounted for 3.2% of high school graduates and 1.1% of university graduates; “permanent employees from another type” (those
who were in the “other type” category immediately after leaving education, but were permanent employees at the time of the survey) accounted for 8.6% of high school graduates and 3.6% of university graduates. In addition, “consistently atypical” (those who were in atypical employment, unemployed or without an occupation, or self-employed or employed in the family business immediately after leaving education and who were still in atypical employment at the time of the survey) accounted for 15.2% of high
6 Employment of Youth, Older Persons, Women and Foreign Workers

Labor Situation in Japan and Its Analysis: General Overview 2015/2016 49
Chapter II Labor Market
school graduates and 9.8% of university graduates; and 5.7% of high school graduates and 3.2% of university graduates followed the pattern of “from permanent employee to atypical” (those who were hired as permanent employees upon leaving school, but later went into atypical employment).
With large corporations in Japan maintaining the customary practice of hiring new graduates en masse once a year, it is generally believed that young people who fail to be hired as permanent employees immediately after graduation have few chances to become permanent employees thereafter. During periods of economic recovery, there is an overall increase in workers transitioning from atypical to permanent employment, but according to the Third Survey on the Working Style of Young People, which the JILPT administered to approximately 2,000 young
people in Tokyo in 2011, working conditions were poor for those who later became permanent employees, relative to those who had originally been hired as permanent employees.
Trends in Japan’s NEET ClassJapan’s NEETs̶young people Not in Education,
Employment, or Training̶are defined as young persons aged 15 to 34 who are not enrolled in education, are single, are not homemakers or carers, and are not seeking employment. According to the Ministry of Internal Affairs and Communications’ (MIC) Employment Status Survey, their numbers fell to 560,000 in 2012 from a peak of 650,000 in 2002 when the economy was stagnant. However, they rose to 3.0% as a percentage of the young population (aged 15-34).
Figure II-22 Change in Percentage of First-time Workers Hired as Permanent Employees
20
100
FemaleMale40
60
80
18-1
9 ye
ars o
ldGr
adua
ted
in 2
011-
2012
20-2
4 ye
ars o
ldGr
adua
ted
in 2
006-
1010
25-2
9 ye
ars o
ldGr
adua
ted
in 2
001-
2005
30-3
4 ye
ars o
ldGr
adua
ted
in 1
996-
2000
35-3
9 ye
ars o
ldGr
adua
ted
in 1
991-
1995
40-4
4 ye
ars o
ldGr
adua
ted
in 1
986-
1990
82.6
61.8 64.4 62.6
71.178.7
45.8
72.7
51.0 49.655.7
68.2
20
100
FemaleMale40
60
80 71.8
70.2
81.1
78.3
90.5
82.187.1
71.8 73.778.9
22-2
4 ye
ars o
ldGr
adua
ted
in 2
010-
2012
25-2
9 ye
ars o
ldGr
adua
ted
in 2
005-
2009
30-3
4 ye
ars o
ldGr
adua
ted
in 2
000-
2004
35-3
9 ye
ars o
ldGr
adua
ted
in 1
995-
1999
40-4
4 ye
ars o
ldGr
adua
ted
in 1
990-
1994
(%)(%)1) High school graduates 2) University graduates
Source: Japan Institute for Labour Policy and Training, Research Material Series No.144, Youth Employment Status and Current Situation of Careers and Vocational Ability Development (2): From the 2012 Employment Status Survey
Note: Excluding students enrolled in school or for whom “attending school is main activity”

Labor Situation in Japan and Its Analysis: General Overview 2015/201650
Source: Statistics Bureau of Ministry of Internal Affairs and Communications, Labour Force Survey
Figure II-23 Status of Employment of 15-to 24-year-olds
0.0
4.0
2.0
6.0
8.0
10.0
12.0
14.0
(Year)1980 1982 1984 1986 1988 1990 1992 1994 1996 1998 2000 2002 2004 2006 2008 2010 2012 2014
(%)
15-19 year olds25-29 year olds 30-34 year olds
20-24 year olds
Table II-24 Status of Employment of 25-to 29-year-old Male
High school graduates University graduatesRegular employees fixation 34.5 61.7 Regular employees turnover 15.0 11.2 Regular (temporary atypical) 3.2 1.1 Other to regular 8.6 3.6 Continuously atypical 15.2 9.8 Regular to atypical 5.7 3.2 Self-employed, family business 3.2 1.2 Without occupation 12.2 6.8 No response/ unknown 2.3 1.3 Total 100.0 100.0
Source: Japan Institute for Labour Policy and Training, Current Status of Youth Employment, Careers and Occupational Skills Development 2- from Employment Status Survey FY2012 , Data Series No.144

Labor Situation in Japan and Its Analysis: General Overview 2015/2016 51
Chapter II Labor Market
Employment of Older Persons
Relatively Stable Trends of Employment of Older Persons
In line with the Act on Stabilization of Employment of Older Persons, “older persons” are defined in Japan as persons aged 55 or above, and we use the same definition in this section to outline the employment situation of older people divided into three age groups: 55- to 59-year olds, 60- to 64-year-olds, and the 65-and-over age group.
If we look at changes in the labor force participation rate so as to ascertain the level of labor supply accounted for by older persons, in the 55-59 age group, the figures for men are at the lower end of the 90% range and are more or less stable, although showing some weakness; on the other hand, the figures for women have been increasing over the long
term, reaching the upper half of the 60% range in recent years. Among persons aged 60-64, figures for men had been declining but reversed themselves and climbed between 2007 and 2009, staying more or less flat since then. The numbers for women had been virtually flat at around 40%, but have been on an upward trend since 2007. In the 65-and-over age group, the figures for both men and women had been demonstrating a downward trend since the latter half of the 1990s, but this decline appears to have stopped in recent years. The proportion of employed persons in each group (i.e., the employment rate) has exhibited a similar trend.
As far as one can see from these movements, it can be said that in recent years, the employment situation for older persons has been strong, centering on those in their early 60s.
Source: Statistics Bureau of Ministry of Internal Affairs and Communications, Labour Force SurveyNote: The figure for 2011 has been published as a complementary estimate to supplement missing data due to the Great East Japan Earthquake.
Figure II-25 Labor Force Participation Rates among Older Age Groups, 1988-2008
0
20
10
40
30
60
50
90
80
70
100
(Year)1988 89 90 91 92 93 94 95 96 97 98 99 2000 01 02 03 04 05 06 07 08 09 10 11 12 13 14
(%)
Male aged 55-59 Female aged 60-64 Male aged 65 and over All aged 65 and over Female aged 65 and over
All aged 55-59 Male aged 60-64Female aged 55-59 All aged 60-64

Labor Situation in Japan and Its Analysis: General Overview 2015/201652
Looking at the overall unemployment rate for older persons, during the moderate but prolonged economic recovery, the unemployment rate for all age groups had been decreasing, having peaked in 2002 and 2003. The rate rose again from 2008 to 2010 amid a harsh economic climate, but thereafter returned to a decrease. Compared to the overall average for all age groups (3.6% in 2014), only figures for men aged 60-64 are significantly higher, (4.3% in 2014) while for the other segments of the older demographic, unemployment percentages were lower than the overall average. The average for both men and women aged 60-64, which had stayed above the overall average, fell below it at 3.5% in 2014.
In addition, if we look at developments in the labor force participation rate and the unemployment rate, the decline in the labor force participation rate among men aged 60-64 that has been seen since the latter half of the 1990s can be said to have been due to a lack of employment opportunities, something that clearly reflects how poor the employment situation is for this age group. There has been some discussion of the maturity of the pension system as a factor behind the decline, but this factor is not seen as particularly strong and has had hardly any impact in recent years. The high level of employment motivation among older persons in Japan (particularly men) is thought to be basically unchanged.
Source: Statistics Bureau of Ministry of Internal Affairs and Communications, Labour Force SurveyNote: The figure for 2011 has been published as a complementary estimate to supplement missing data due to the Great East Japan Earthquake.
Figure II-26 Unemployment Rates among Older Age Groups
0
2
4
6
10
8
12(%)
(Year)1988 89 90 91 92 93 94 95 96 97 98 99 2000 01 02 03 04 05 06 07 08 09 10 11 12 13 14
Male aged 55-59 Female aged 60-64 All ages
All aged 55-59 Male aged 60-64Female aged 55-59
All aged 60-64
Relative Stability against Backdrop of Various Policy Responses
Older persons in Japan have traditionally faced more severe employment conditions than other age groups. In around 1985, for example, the unemployment rate for 55- to 59-year old males
(3.9% in 1985) was considerably higher than the rate for all age groups (2.6%). Since the 1990s, however, it has been lower.
The main factors affecting the employment of older persons in Japan are the mandatory retirement system employed by firms and the age at which

Labor Situation in Japan and Its Analysis: General Overview 2015/2016 53
Chapter II Labor Market
mandatory retirement is set. For a considerable period following World War II it was set at 55, at which age workers encountered major changes in the employment environment. The mandatory retirement age was subsequently gradually raised from the 1970s to the early 1980s, and the revision of the Act on Stabilization of Employment of Older Persons in 1985 prohibited the establishment of a mandatory retirement age of less than 60. This had a considerable impact, leading to a relative decline in the unemployment rate among 55- to 59-year-olds. Following an amendment to the Act in 2006, moreover, companies were obliged to permit continued employment until age 65 if the worker so desired. This is thought to have boosted the labor force ratio and curbed the rise in the unemployment rate for the 60-64 age group from 2007 onwards. With additional legal reforms, exceptions to the obligation to permit continued employment, which
had been allowed in certain cases, were abolished, strengthening employers’ obligation to ensure stable employment through the age of 65.
Firms also often used to impose an age limit in the thirties or early forties at the latest when advertising job openings, and a breakdown of the job openings ratio in each age group (calculating by dividing the number of job openings by the number of job applicants) shows that while the ratio used to be considerably lower for older persons, the prohibition by law from 2002 of age discrimination in job advertisements and hiring has, as a rule, made it impossible for employers to impose age limits. Accordingly, the job openings ratio of older persons has ceased to decline in recent years.
As described above, generally speaking, policy measures aimed at stabilization of employment for older persons (especially those aged 60-64) can be said to be functioning effectively.
Source: Ministry of Health, Labour and Welfare, Report on Employment Service
Figure II-27 Profile of Active Job Opening Ratios by Age Group
0
2.00
1.00
4.00
3.00
5.00
8.00
7.00
6.00
9.00
(Age)Total 19 or under 20-24 25-29 30-34 35-39 40-44 45-49 50-54 55-59 60-64 65+
(Ratio)
199220022007200920122014

Labor Situation in Japan and Its Analysis: General Overview 2015/201654
Job-hunting Difficulties of Older PersonsWhile the job situation of older persons has on the
whole been stable and measures on the employment front have yielded results, it needs to be borne in mind that this concerns mainly those who were already in permanent employment when they entered old age. Those who lost positions of permanent employment as economic difficulties were encountered in entering old age or who had to temporarily leave the workforce for health reasons, on the other hand, face severe employment conditions. Employment of older persons is quite stable provided that they remain at the same firm or in the same business group. When they enter the open labor market, however, they are placed at an extremely disadvantageous position. Even though age restrictions on job offers have been eliminated, the continued difficulty of finding employment remains a major problem. The proportion of 60- to 64-year-olds without gainful employment according to data for 2012 (Employment Status Survey) is 17.5% points higher than among 55- to 59-year-olds. While this percentage has fallen from where it stood in 2002 (23.4% points higher) thanks to implementation of the above-described measures to stabilize
employment for older persons, it has scarcely changed since 2007 (when it was 17.4% points higher). Nearly 20% of Japan’s population is without employment, and it should be assumed that not all of them are simply enjoying a happy retirement.
The Baby Boom Generation Hits 60, and Then 65
Japan’s largest baby boom generation following World War II was that born between 1947 and 1949. The members of this large cohort were expected to be entering their sixties from 2007, and in 2006 the Act on the Stabilization of Employment of Older Persons was revised to make it mandatory for firms to continue to employ workers up to the age of 65. Firms complied well with this, continuing to employ workers aged 60 to 64 mainly as “shokutaku employees (entrusted employees)” on short-term contracts, and there was no large exodus of older workers from the workforce in 2007 or 2008. However, from 2012 the baby boomers progressively entered their late sixties, and from now on it will be necessary to monitor employment trends for those aged 65 and over.

Labor Situation in Japan and Its Analysis: General Overview 2015/2016 55
Chapter II Labor Market
Employment of Women
Women Trending at around 40% of the Workforce
Even as Japan’s workforce has begun shrinking in recent years, the number of women employed has been growing, and over the past few years women have consistently made up approximately 40% of the labor force. The total working population declined
from 67.66 million in 2000 to 65.77 million in 2013, but in 2013 the number of women in the workforce was the highest ever at 23.29 million (See Figure Ⅱ-28). This is influenced by changes in the industrial structure. For example, while employment in the construction and manufacturing industries has steeply declined, it has increased in the healthcare and welfare sectors, where female workers are more numerous (Figure II-29).
Source: Ministry of Internal Affairs and Communications, Labour Force SurveyNote: Figures for 2011 include supplementary estimates (based on the 2010 national population census) to make up for data missing as a result of the
Great East Japan Earthquake.
Figure II-28 Trends in Numbers in Employment and the Ratio of Women in the Total Workforce
0 0
4,000
3,000
2,000
1,000
5,000
6,000
7,000
8,000 45(%)(10,000 people)
40
35
30
25
20
15
10
5
20132012*20112010200920082007200620052000199519901985
2,367
5,963
39.7
2,593
6,384
2,701
6,666
40.6 40.5
2,753
6,766
40.7
2,750
6,650
41.4
2,759
6,657
41.4
2,763
6,669
41.4
2,762
6,650
41.5
2,771
6,617
41.9
2,768
6,590
42.0
2,768
6,591
42.1
2,766
6,555
42.2
2,804
6,577
42.6
Total number of employees (left-hand scale)Proportion of women in the total number of employees (right-hand scale)
Number of female employees (left-hand scale)
(Year)

Labor Situation in Japan and Its Analysis: General Overview 2015/201656
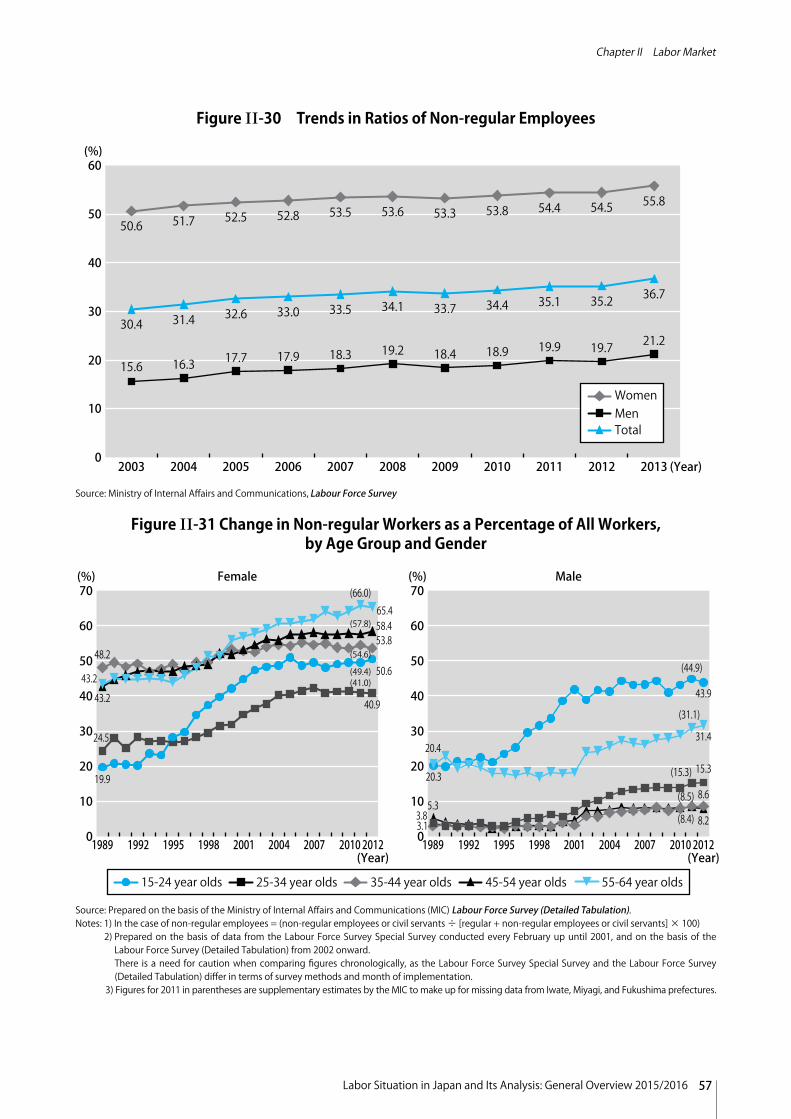
Significant Gender Gap in the Non-regular Ratio
Turning next to types of employment, the ratio of non-regular employment is in a gradually increasing trend for both men and women. However, while the non-regular ratio for men is around 20%, for women it is more than 50%, revealing a considerable disparity between the two.
Examining the non-regular employee demographic by gender and age group, we find that among men the largest percentage is among the 15-24 age group at
43.9%, with the 55- to 64-year-old group at 31.4%. Meanwhile, the smallest percentage is among 35- to 44-year-olds at 8.2%, followed by 45-54 at 8.6%. Among the 25-34 age group, 15.3% are non-regular employees. Among women aged 55 to 64, the percentage was 65.4%, and among those aged 45 to 54 it was 58.4%. The lowest percentage was 40.9%, for the 25-34 age group, followed by 15-24 at 50.6% and 35-44 at 53.8%.
Source: Compiled from Ministry of Internal Affairs and Communications, Labour Force Survey (Basic Tabulation)Notes: 1) Figures in brackets represent the increase or decrease in the number of employees in the industry in question in 2002–2012 (total for men and
women). 2) Services and Public Service do not include numbers classified under other industries.
Figure II-29 Change in Numbers Employed by Gender and Industry (2002-2012)
(13)
(173)
(-4) (-2)
(-93)
(-131)
(-2)
(26) (18)
(-6)(-2)
(11) (4) (10) (6)(20)
(236)
(-29)
(88)
(7)
-150
-100
-50
0
50
100
150
200
250(10,000 people)
Men
Non-agricultural Industries
Women
Fish
erie
s
Min
ing
and
qua
rryi
ng o
f sto
ne a
nd g
rave
l
Cons
truc
tion
Man
ufac
turin
g
Elec
tric
ity, g
as,
hea
t sup
ply
and
wat
erIn
form
atio
n an
d c
omm
unic
atio
ns
Tran
spor
t and
pos
tal s
ervi
ces
Who
lesa
le a
nd re
tail
trad
e
Fina
nce
and
insu
ranc
e
Real
est
ate
and
goo
ds re
ntal
and
leas
ing
Scie
ntifi
c re
sear
ch, p
rofe
ssio
nal
and
tech
nica
l ser
vice
sAc
com
mod
atio
ns,
food
and
bev
erag
e se
rvic
esLi
ving
-rel
ated
and
per
sona
l se
rvic
es a
nd a
mus
emen
t ser
vice
s
Educ
atio
n, le
arni
ng su
ppor
t
Med
ical
hea
lthca
re a
nd w
elfa
re
Com
poun
d se
rvic
es
Serv
ices
Publ
ic se
rvic
e
All i
ndus
trie
s
Agric
ultu
re a
nd fo
rest
ry
Labor Situation in Japan and Its Analysis: General Overview 2015/2016 57
Chapter II Labor Market
(Year)2013201220112010200920082007200620052003 2004
WomenMenTotal
0
10
20
40
30
50
60(%)
50.652.5 52.8 53.5 53.6 53.3 53.8 54.4 54.5 55.8
30.432.6 33.0 33.5 34.1 33.7 34.4 35.1 35.2 36.7
15.6
51.7
31.4
16.3 17.7 17.9 18.3 19.2 18.4 18.9 19.9 19.7 21.2
Figure II-30 Trends in Ratios of Non-regular Employees
Source: Ministry of Internal Affairs and Communications, Labour Force Survey
Source: Prepared on the basis of the Ministry of Internal Affairs and Communications (MIC) Labour Force Survey (Detailed Tabulation).Notes: 1) In the case of non-regular employees = (non-regular employees or civil servants ÷ [regular + non-regular employees or civil servants] × 100) 2) Prepared on the basis of data from the Labour Force Survey Special Survey conducted every February up until 2001, and on the basis of the
Labour Force Survey (Detailed Tabulation) from 2002 onward. There is a need for caution when comparing figures chronologically, as the Labour Force Survey Special Survey and the Labour Force Survey
(Detailed Tabulation) differ in terms of survey methods and month of implementation. 3) Figures for 2011 in parentheses are supplementary estimates by the MIC to make up for missing data from Iwate, Miyagi, and Fukushima prefectures.
Figure II-31 Change in Non-regular Workers as a Percentage of All Workers, by Age Group and Gender
0
30
20
10
40
50
60
70
(Year)
Female Male
20121989 1992 1995 1998 2001 2004 2007 2010(Year)20121989 1992
19.9
24.5
43.2
43.2
48.2
1995 1998 2001 2004 2007 2010
(%)
0
30
20
10
40
50
60
70(%)
15-24 year olds 35-44 year olds 45-54 year olds 55-64 year olds25-34 year olds
40.9
50.6
53.858.465.4
(66.0)
(57.8)
(54.6)
(49.4)(41.0)
8.2
8.6
15.3
31.4
43.9
(44.9)
(31.1)
(8.4)
(8.5)
(15.3)20.3
20.4
5.33.83.1

Labor Situation in Japan and Its Analysis: General Overview 2015/201658
Changes in the M-shaped Curve Due to Later Marriage and Childbirth, etc.
The labor force ratio of women by age group forms an M-shaped curve bottoming in the 30s. The reason given for this is that women often interrupt their employment for marriage, childbirth and childcare during this period. But if we compare the figures for 1985 and 2014, the M-shaped curve is
shallower and the bottom of the curve has moved to the right in 2014 (Figure II-33). This results from an increased rate of labor force participation by unmarried women, as well as later marriage and childbirth. However, the rate of continued employment at around the birth of the first child has hardly changed at all (Figure II-34).
Gender-based Wage Gap in a Long-term Shrinking Trend
The disparity between men and women in contractual wages is in a long-term shrinking trend. A gap still remains, however, with wages for women only around 70% of those for men.
Source: Ministry of Health, Labour and Welfare, Basic Survey on Wage Structure Notes: 1) “Ordinary workers” are regular employees other than “part-time workers”. 2) “Full employee” and “Full-time staff” are descriptions applied by different businesses.
Figure II-32 Trends in Gender Disparity in Contractual Wages (Men’s Contractual Wage = 100)
55
60
65
70
75
80
(Year)'85 '90 '91 '92 '93 '94 '95 '96 '97 '98 '99 '00 '01 '02 '03 '04 '05 '06 '07 '08 '09 '10 '11 '12 '13
(%)
68.7 69.070.0
70.6
72.6 72.173.3 73.4 74.0
59.6 60.2
60.761.5
61.6
62.0
62.5
62.8
63.163.9
64.665.5
65.366.5
66.867.6
65.9 65.966.9
67.8
69.8 69.370.6 70.9 71.3
Regular workers among general workersGeneral workers

Labor Situation in Japan and Its Analysis: General Overview 2015/2016 59
Chapter II Labor Market
Source: Ministry of Internal Affairs and Communications, Labour Force SurveyNote: Labor force ratio: The ratio of the working population (persons in employment + fully unemployed) to the general population
Figure II-33 Trends in the Labor Force Ratio of Women by Age Group
0
10
30
20
50
40
80
70
60
90(%)
15.6
70.3
79
70.1 69.673.1
76.1 74.9
66.5
47.4
20141985 13.8
16.6
71.9
54.1 50.6 60.0
67.9 68.1
61.0
51.0
38.5
15.5
(Age)15-19 20-24 25-29 30-34 35-39 40-44 45-49 50-54 55-59 60-64 65+
Source: National Institute of Population and Social Security Research, Basic Survey on Childbirth Trends
Figure II-34 Continued Employment Rate around Birth of First Child
0 (Year)
(%)3.1
35.5
37.4
18.3
5.7
20
40
60
80
100
1985-1989 1990-1994 1995-1999Birth year of first child
2000-2004 2005-2009
UnknownUnemployed before pregnancy
Resignation for childbirthContinued employment(without child care leave)
Continued employment(with child care leave)
3.4
34.6
37.7
16.3
8.1
3.8
32.8
39.3
13.0
11.2
4.1
28.5
40.6
11.9
14.8
5.2
24.1
43.9
9.7
17.1

Labor Situation in Japan and Its Analysis: General Overview 2015/201660
Increase in Dual Income Households, Little Time for Housework and Childcare Time by Men“Dual income households” have increased in
recent years, outstripping households consisting of an employed male and wife not in employment (so-called “full-time housewife households”) since 1997
(Figure II-35). Behind this are thought to lie changing awareness of social advancement by women, changing economic circumstances, and other factors. However, time spent on housework and childcare by men in homes with preschool children is still only about 1 hour per day, a low level in international terms (Figure II-36).
500
600
700
900
800
1,100
1,000
1,200
1,114
1,082
1,096
1,038
1,054
952 952933
946930897888
903 915 930
955937
921889
912916890
894
870
875
863
854
851825
831
797
787
745
614645
664708721722 720
748 771 783823
877
914929 943
908 927
949 956929 942 951 951 949
961
988
977
1,013
1,011995
1,0121,054
1,065
(Year)1980 '82 '84 '86 '88 '90 '92 '94 '96 '98 2000 '02 '04 '06 '08 '10 '12
Single Income HouseholdsDouble Income Households
(10,000 households)
Figure II-35 Trends in Number of Dual-income & Other Households
Sources: From 1980 to 2001, Ministry of Internal Affairs and Communications, Special Survey of the Labour Force Survey (each February, but March in 1980 and 1982); for 2002 onwards, Labour Force Survey (Detailed Tabulation) (annual averages)
Notes: 1) “Households with employed male and wife not in employment” are households in which the husband is employed in a non-agricultural industry and the wife is a person not in employment (non-working population and fully unemployed).
2) “Dual income households of persons in employment” are households in which both husband and wife are employed in non-agricultural industries.

Labor Situation in Japan and Its Analysis: General Overview 2015/2016 61
Chapter II Labor Market
Japan
USA
France
Sweden
0 : 37
1 : 05
0 : 40
1 : 07
0 : 29
2 : 08
1 : 50
2 : 14
1 : 06
3 : 13
2 : 30
3 : 21
Of which, total time spent on raising childrenOther housework-related time
Figure II-36 Housework and Childcare Time by Husbands in Couples with Preschool Children (per Day)
Sources: Eurostat “How Europeans Spend Their Time Every Life of Women and Men” (2004)Bureau of Labor Statistics of the U.S. “America Time-Use Survey Summary” (2006)Ministry of Internal Affairs and Communications “Survey on Time Use and Leisure Activities” (2011)

Labor Situation in Japan and Its Analysis: General Overview 2015/201662
66.8
20.8
18.9
4.4
14.0
18.3
7.3
16.5
5.7
4.9
7.9
17.5
17.7
19.8
6.5
28.6
32.9
2.6
6.4
18.2
8.6
7.9
0 10 20 30 40 50 60 70 80 90 100
Lawyer
Pharmacist**
Dentist**
Doctor**
Researcher
★University lecturer or more senior position
★High school vice-principal or more senior position
Agricultural committee member*
★Head of residents' association
Prefectural governor
Prefectural assembly member
Judge
★Member of an advisory body for the national government
★Civil servant in the national government (Class I examination administrative classification)
★government inspector
Diet member (upper house)
Diet member (lower house)
(%)
★Employee in a position equivalent to department head or more senior position in the main office of a prefectural
government
★Manager (position equivalent to department head) in a private-sector company (100 people or more)
Journalist (Japan Newspaper Publishers and Editors Association)
★Manager (position equivalent to section head) in a private-sector company (100 people or more)
★Civil servant in the national government in a position equivalent to department or office head or more senior
position in the main office of a ministry*
Figure II-37 Ratio of Women in “Leadership Positions” in Various Sectors
Source: From the “Survey on Women’s Participation in Policy Decision Making” (December 2012), with some information updated. In principle, data are from 2012, but * indicates 2011 data and ** indicates 2010 data.
Notes: 1) ★ indicates items or grouped items adopted as performance targets in the 3rd Basic Plan on Gender Equality. 2) Under “Head of Residents’ Association”, the villages of Kawauchi, Katsurao and Iitate in Fukushima Prefecture have been removed from the ag-
gregation, as they were not surveyed in 2012 owing the impact of the Great East Japan Earthquake.
Women’s Activity Internationally Low; Challenge to Meet Government Targets
The Japanese government has set a target of raising the ratio of women in “leadership positions” to “30% by 2020”. Currently, however, that level is a
distant prospect (Figure II-37). With a view to
meeting this target, the challenge from now on will be to implement measures aimed at promoting women’s participation, such as practicable positive action, together with reforming the awareness and behavior of women themselves by presenting role models, educating, etc.
Labor Situation in Japan and Its Analysis: General Overview 2015/2016 63
Chapter II Labor Market
Hiring and Employment of Foreign Nationals
Japanese Policy on Foreign Nationals: Past and Present
History of Policy on Foreign NationalsThe following is a summary of trends over the last
60 years in the history of Japan’s policy on foreign nationals. In 1950, the Immigration Agency was set up in the Ministry of Foreign Affairs, in 1951 the “Immigration Control Order” was enacted, and in
1952 the Alien Registration Act was enacted and brought into effect. At that time, the main focus of policy regarding foreign nationals was on Japan’s “Zainichi” permanent ethnic Korean and Chinese
residents. In the mid-1960s, industry began to call for “unskilled labor” to be allowed into the country due
to labor shortages. Set against this, the verbal understanding was that, under the First Basic Employment Measures Plan (1967), foreign workers should not be allowed into the country. This principle was maintained in the Second Basic Employment Measures Plan (1973) and the Third Basic Employment Measures Plan (1976). In the late 1970s, there were rising numbers of refugees from Indochina, female foreign workers from Southeast Asia, second and third generation descendants of displaced Japanese who remained in China following World War II, and Europeans and North Americans coming to Japan for business. When the yen appreciated following the Plaza Accord in 1985, a stream of Japanese companies expanded overseas, principally in Southeast Asia, and one of the repercussions of this was to generate concern about the “hollowing out of industry” in Japan. It was around that time that there occurred a rise in “Nikkei” immigrants (emigrants from Japan and their descendants) from South America and foreign workers from Asian countries who in practice came to Japan to find work.
The Sixth Basic Employment Measures Plan (1988) divided foreign workers into “professional and technical workers” and “unskilled workers”. The policy adopted regarding these two categories was to allow immigration of professional and technical
workers as far as possible, but to accept unskilled workers with caution. In line with this policy, the Immigration Control and Refugee Recognition Act was revised in 1989. The revisions entered effect in 1990, in which year the “trainee” status of residence was introduced. In response to the Second Report of the Third Special Advisory Council on Enforcement of Administrative Reform, the “foreign worker skills training system” was established in 1993 and the system of residence status by which foreigners are allowed to live in Japan was further developed.
With the Japanese economy mired in deflation following the collapse of the “bubble” in the late 1990s, Japanese manufacturers continued to transplant their production operations to other countries. Overseas, the Chinese economy surged to prominence and international competition intensified. During this period, an increasing number of Nikkei and other foreign nationals took up non-regular employment. Due in part to the easing of requirements for obtaining permission for permanent residence in 1998, foreign workers who initially came to Japan as temporary “guest workers” increasingly began to settle long term.
As more foreign nationals settled permanently, the number of young foreigners also increased. With this, problems of foreign workers entered a new phase, involving not only employment and labor but also domestic and other social problems (such as non-attendance at school).
In 2007, the Employment Countermeasures Act was amended, with provisions obliging the government to take action. For example, the government was to promote the employment of foreign nationals in specialist technical fields, take steps to promote appropriate employment management of foreign workers and reemployment of those leaving their jobs, take measures to prevent illegal employment of foreign nationals, and improve employment management of foreign nationals by employers.
The simultaneous global recession in the autumn of 2008 also left a deep mark on the employment of foreign workers. Unemployed foreign nationals visited Hello Work (Employment Service Centers) in search of work, but very few could find any. Some of

Labor Situation in Japan and Its Analysis: General Overview 2015/201664
foreign nationals who were not enrolled in social security or unemployment insurance were thus unprotected by social safety nets and fell into livelihood difficulties. Some turned to NPOs and other organizations for support.
In 2009 the Immigration Control and Refugee Recognition Act was amended, and “technical intern training” was established as a new status of residence. In July 2012, the Act was again amended, along with other legislation. With this, the Alien Registration Act was abolished and a new system of residence management was introduced.
With the expansion of overseas ventures and international transactions, meanwhile, cultivating and securing global human resources had become a matter of urgency for corporate concerns. The number of companies hiring foreign students and those hiring foreign personnel from abroad is gradually increasing. Since May 2012, highly skilled foreign professionals have enjoyed preferential immigration treatment based on a points system, as part of a government drive to encourage the acceptance of such personnel.
The 2014 Japan Revitalization Strategy calls for utilization of highly skilled foreign professionals, utilization of foreign human resources in the construction and shipbuilding sectors, revision of the Technical Intern Training Program, acceptance into Japan of non-Japanese employees of overseas subsidiaries in the manufacturing industry, job-seeking support for international students who have obtained national nursing care certifications, and employment of foreign nationals to assist with housework. Care is to be taken to prevent confusion of policies on acceptance of foreign personnel with immigration policies, and the related issues to be weighed comprehensively while ensuring formation of consensus among Japanese citizens.
The 2015 Indus t r i a l Compet i t iveness Enhancement Action Plan calls for further development of a framework for acceptance of highly skilled foreign professionals, a thorough overhaul of the Technical Intern Training Program, and examination of new employment programs in fields where there are urgent human resource needs, as well as accelerated promotion of National Strategic Economic Growth Areas.
The Framework of System of Residence Status in Japan
The framework of Japan’s current system of residence status will be explained here. The system consists of residence statuses associated with activities, and others based on the individual’s personal situation. The statuses of residence associated with activities include the following: diplomat, official, professor, artist, religious activities, journalist, business manager, legal/accounting services, medical services, researcher, instructor, engineer/ specialist in humanities/international services, intra-company transferee, entertainer, skilled labor, technical intern training, cultural activities, short-term visitor, student, trainee, dependent, designated activities, and highly skilled professional. Of these statuses, those from “diplomat” to “technical intern training” permit profit-earning activities. Also, foreign nationals granted the “designated activities” status of residence may engage in profit-earning activity outside their status, but only if permitted to undertake that specific activity. Foreign nationals with one of the statuses from cultural activities to dependent cannot engage in profit-earning activities, but they are able to engage in specific profit-earning activities if they have received permission to engage in such activities in specific areas outside their residence status. The statuses of residence deriving from the individual’s personal situation include permanent resident, spouse or child of Japanese national, spouse or child of permanent resident, and long-term resident. Holders of these categories of status may engage in any kind of employment activity, regardless of whether it is unskilled or highly skilled.
Present Situation regarding Foreign Workers in Japan
First, let us confirm the number of foreign nationals in Japan. Unfortunately, the amendment to the Immigration Control Act and the abolition of the Alien Registration Act in 2012 make it impossible to compare with numbers of registered foreign nationals up to 2011. Here, therefore, “mid-to long-term residents”1 and “special permanent residents” will be given as figures from 2012, based on Ministry of

Labor Situation in Japan and Its Analysis: General Overview 2015/2016 65
Chapter II Labor Market
Justice statistics.In terms of foreign residents’ national or regional
affiliation (see Figure II-38, the total number of resident foreign nationals stands at 2,172,892. Of these Chinese nationals account for 30.2% of the total at 656,403, followed in order of population by the Koreas, the Philippines, Brazil, Vietnam, and the United States. Compared to figures from the end of 2014, there have been slight declines in number of residents from the Koreas (down 0.7%), Brazil (down 1.4%), and Peru (0.4%), but significant increases in number of residents from Vietnam (up 25.0%), Nepal
(14.3%), and Taiwan (12.5%).As for the change in numbers of mid-to long-term
residents by status of residence (Figure II-39), there were 1,818,601 mid-to long-term residents and 354,291 special permanent residents, up 2.6% compared to the end of 2014.
In terms of category of visa, compared to the end of 2014 there was an increase in the number of residents engaged in medical services, designated activities, technical intern training, entertainers, and college students.
1 “Mid-to long-term residents” are foreign nationals residing in Japan for the mid- to long-term with a residence status under
the Immigration Control Act, who do not correspond to any of (1) to (6) below.(1) Persons granted permission to stay for 3 months or less(2) Persons granted “Temporary Visitor” status(3) Persons granted “Diplomat” or “Official” status(4) Persons recognized by Ministry of Justice ordinance as equivalent to those in (1) to (3) above (staff of the Japanese office
of the Association of East Asian Relations and the Permanent General Mission of Palestine in Japan who have “Designated Activities” status, and their families)
(5) Special permanent residents(6) Persons with no resident status (Source: Immigration Bureau, Ministry of Justice)
Source: Compiled from Immigration Bureau, Ministry of Justice, Numbers of Foreign Residents as of June 30, 2015
Figure II-38 Change in Numbers of Foreign Residents by Nation or Region
0.0
50.0
100.0
150.0
200.0
250.0
(Year)20152014201320122011201020092008200720062005200420032002
(10,000 persons)
ChinaIndonesia Nepal Taiwan Others
North and South Korea
North andSouthKorea
Phillippines
Phillippines
Brazil
Brazil
Viet Nam
Viet Nam
Peru United States Thailand
2.04.5 4.72.5
40.9
61.1
15.4
26.4
15.0
44.5
59.9
16.7
27.0
2.3 4.74.7 2.6
15.6
47.1
59.4
17.8
28.1
2.54.94.82.8
16.3
50.2
58.6
16.4
29.8
2.85.24.83.0
17.0
54.7
58.7
17.1
30.9
3.25.45.03.2
17.9
59.4
58.3
18.3
31.4
3.65.5
5.13.5
18.6
64.4
58.1
19.3
30.9
4.15.6
5.23.7
19.4
67.1
57.2
19.8
26.5
4.05.5
5.13.8
19.7
67.8
56.1
20.0
22.9
4.15.2
5.03.8
19.6
66.9
54.2
20.3
20.9
4.45.1
4.94.1
19.3
China65.3
53.0
20.3
19.1
5.24.84.0
Others22.0
PeruU.S.
Thailand
64.9
52.0
20.9
18.1
7.24.94.9 5.04.1
23.0
65.5
50.1
21.8
17.5
10.04.8
5.14.3
24.8
65.6
49.8
22.4
17.3
12.54.8
5.14.4
26.0

Labor Situation in Japan and Its Analysis: General Overview 2015/201666
Source: Compiled from Immigration Bureau, Ministry of Justice, Numbers of Foreign Residents as of June 30, 2015
Figure II-39 Trends in Numbers of Mid- to Long-term Foreign Residents by Status of Residence
End of2008
End of2009
End of2010
End of2011
End of2012
End of2013
End of2014
June of2015
0
20
40
60
80
100
120
140
160
180
200(10,000 persons)
Permanent residentCollege studentLong-term residentSpouse or child of Japanese nationalTechnical intern traineeDependent
Specialists in humanities/international resident
Skilled labor
Spouse or child of permanentresident
Designated activitiesIntra-company transfereeInvestor/ business managerInstructorProfessorReligious activitiesCultural activitiesResearcherTraineeEntertainerArtistMedical servicesJournalistLegal/ accounting servicesHighly skilled professional
49.2
18.0
25.8
24.5
10.8
12.0
12.2
53.3
19.3
22.2
22.2
11.5
12.0
13.1
56.5
20.2
19.5
19.6
10.0
11.9
11.5
7.2
59.8
18.9
17.8
18.2
14.2
11.9
11.0
62.5
18.1
16.5
16.2
15.1
12.1
11.2
65.5
19.3
16.0
15.1
15.5
12.2
11.5
67.7
21.5
16.0
14.5
16.8
12.6
12.3
Permanentresident
Permanentresident68.9
CollegestudentCollegestudent22.6
Long-termresident
Long-termresident16.0
Spouse or childof Japanese national
Spouse or childof Japanese national
14.2
Technicalintern trainee
Technicalintern trainee
18.1
DependentDependent12.8
Specialists in humanities/international resident
Specialists in humanities/international resident
13.3

Labor Situation in Japan and Its Analysis: General Overview 2015/2016 67
Chapter II Labor Market
Distribution of Foreigners by RegionSome inconsistency is seen in numbers of foreign
nationals, depending on the prefecture. Figure II-41 shows numbers of foreign workers by prefecture and status of residence, according to the Ministry of Health, Labour and Welfare’s “Summary of Notifications on ‘The Employment Status of Foreign Workers”. As the figure reveals, 1) when we examine the distribution of foreign nationals by prefecture, they are more markedly distributed in the Kanto,
Tokai and Kinki regions, and 2) statuses of residence differ in composition from prefecture to prefecture. For example, Tokyo has the largest number of foreign workers, but those with residence statuses in specialist / technical fields or activities outside residence status (overseas study) account for a relatively high ratio. On the other hand, foreign nationals in Shizuoka, Aichi and other prefectures have a relatively high ratio of residence statuses based on the individual’s personal situation.
Source: Compiled from Ministry of Health, Labour and Welfare, Summary of Notification on “The Employment Status of Foreign Workers” (as of Oct. 31, 2014)
Figure II-40 Numbers of Foreign Workers by Prefecture and Status of Residence
(1,000 persons)
Hokkaido
Aomori
Iwate
Miy
agi
Akita
Yamagata
Fukushim
a
Ibara
gi
Tochig
i
Gunma
Saitam
a
Chiba
Tokyo
Kanagawa
Niigata
Toyama
Ishik
awa
Fukui
Yamanash
i
NaganoGifu
Shizuoka
AichiM
ie
Shiga
Kyoto
Osaka
HyogoNara
Wakayam
a
Tottori
Shimane
Okayama
Hirosh
ima
Yamaguch
i
Tokushim
a
Kagawa
Ehime
Kochi
FukuokaSaga
Nagasaki
Kumam
otoOita
Miy
azaki
Kagoshim
a
Okinaw
a0
20
40
60
80
100
120
140
160
180
200
Specialist/ Technical fieldsDesignated activitiesTechnical intern trainingActivities outside residence statusStatus of residence based on personal situation
Unknown

Labor Situation in Japan and Its Analysis: General Overview 2015/201668
Companies’ Employment Management of Foreign Workers
Hiring Policies and Reasons for Employing Foreign Workers
What kind of policies do Japanese companies have with regard to hiring foreign workers? In a questionnaire survey conducted by JILPT, around two-thirds of respondents said they “Have no plans” to hire foreign workers, in terms either of employment type or of job content (Figure II-41,
Figure II-42).Meanwhile, in business establishments with
experience of hiring foreign nationals, Japanese language ability is given greater priority than specialist knowledge or skills and previous professional record when hiring foreign nationals, regardless of the type of employment (Figure II-43). Work-related instructions and orders are given in Japanese, so having some level of Japanese ability is a precondition for employing foreigners.
Source: Japan Institute for Labour Policy and Training, Survey Concerning Industry and Personnel Utilization After the Simultaneous Worldwide Recession (2010)
Figure II-41 Foreign Worker Employment Policy by Employment Type(n=2252, Multiple Answers)
0
20
40
60
80(%)
7.8
14.8
6.1 2.8
67.2
8.7
66.2
33.6
7.8
1.3
18.3
3.2
11.6
43.6
5.8 10.6
35.7
6.5
Employed aspermanent employee
Employed as non-permanent employee(part timer, side-job
worker, etc.)
Employed as adispatched worker or
independentcontractor
Other forms ofemployment
No plans to employ No response
Foreigners Youth Older persons

Labor Situation in Japan and Its Analysis: General Overview 2015/2016 69
Chapter II Labor Market
Source: Japan Institute for Labour Policy and Training, Survey Concerning Industry and Personnel Utilization After the Simultaneous Worldwide Recession (2010)
Figure II-42 Foreign Worker Employment Policy by Job Content (n=2252, Multiple Answers)
Foreigners Youth Older persons
0
20
40
60
80(%)
7.5
1.4 2.6 7.5
0.6 3.3
65.3
10.6
41.7
14.3
21.7
40.7
4.5 4.9
17.5
3.6
22.1
12.5 9.2
15.8
4.2
12.8
34.8
7.5 2.1
9.6 9.2 10.2
23.6
16.2
Employed in a professional or
technical position
Employed in a managerial
position
Employed in a clerical position
Employed in a sales-related
position
Employed in a security or
service-related position
Employed in a production
process-related position
Employed in other positions
Will not hire foreigners
No responseEmployed in a transport or
communications-related position

Labor Situation in Japan and Its Analysis: General Overview 2015/201670
Employment Management of Highly Skilled Foreign Professionals
As with companies in other countries, Japanese companies are increasingly hiring and using highly skilled foreign professionals. In many cases, Japanese companies hire these highly skilled foreign professionals as foreign students, just as they do with Japanese students. Companies deploy various initiatives for using highly skilled foreign
professionals after hiring them (Figure II-44). For example, when hiring highly skilled foreign professionals to tap into the abilities unique to foreign nationals, they may assign foreign employees to overseas related divisions, or train them as overseas secondment personnel, and so on. In some cases, however, foreign employees are subject to more or less the same human resource management as Japanese employees.
Source: Japan Institute for Labour Policy and Training, Survey Concerning Industry and Personnel Utilization After the Simultaneous Worldwide Recession (2010)
Figure II-43 Hiring Conditions by Employment Type (n=2252, Multiple Answers)
0
20
10
30
40
50
60
70(%)
64.5
13.1
37.6
42.5
23.2
4.17.9
56.1
37.4
63.4
1.1
58.6
2.5
21.5
41.8
18.4
5.7 6.2
61.5
51
58.3
1.8
48.3
6.7
32.627.8
14.6
5.32.2
47.5
41.3
49.2
2
57.9
47.8
1.9
16.7
26.4
9.3 6.33.7
53.5 51.9 51.3
2.4
54.1
Common sense, businessmanners
Editorial background
Specialist knowledge &
skills
Work history to
date (experience)
Qualifications needed
for the job
Salary Frequency of job changes
Personality Adaptability to the
workplace
Willingness,positivity
Others Japaneselanguage
(foreigners only)
Japanese regular employee hiring conditionsForeign regular employee hiring conditions Foreign non-regular employee hiring conditions
Japanese non-regular employee hiring conditions

Labor Situation in Japan and Its Analysis: General Overview 2015/2016 71
Chapter II Labor Market
Employment Management of Foreign Workers in Manufacturing
A distinguishing feature of employment of foreign workers in Japan is their greater use in manufacturing than in professional and technical fields. In particular, there are many places of business that utilize foreign workers via indirect hiring, and the number of foreign workers working via the indirect hiring system is growing. Here, we will focus on Nikkei workers and the technical intern training program.
[Nikkei Workers]Most foreign workers employed in production
processes are employed indirectly as dispatched or subcontracted workers. Nikkei workers were increasingly employed directly by contractors, or else hired from their countries of origin via brokers and
travel agencies. However, in recent years contractors have increasingly recruited and employed Nikkei workers already in Japan. This recruiting is often carried out through help-wanted ads in Portuguese- or Spanish-language newspapers published in Japan, on the Internet, or through word of mouth or person-to-person introductions.
Nikkei workers normally used to come to Japan for a temporary stint of employment as “guest workers” for several years after their arrival. Now, however, migrant workers are increasingly settling in Japan. This trend has been accompanied by a rise in the number of female workers. The reduction in 1998 of the minimum period of residence required to qualify for permanent residence from 20 years to 10 years has also contributed to this trend.
Source: Japan Institute for Labour Policy and Training, Survey on Acceptance and Use of Highly Skilled Foreign Professionals by Companies (2013)
Figure II-44 Efforts by Companies to Encourage Establishment and Activity by Highly Skilled Foreign Professionals (n=263, Multiple Answers)
0
10
20
30
40
50(%)
Staff allocation and tra
ining
based on language ability
Development of consultatio
n system
Staff allocation and tra
ining based on expertise
Clarification of w
ork duties
Perform
ance-oriented systems o
f evaluation and co
nditions
Understanding of other cu
ltures
Smoother communica
tion
Support for liv
ing environments
Multi-language versio
ns of documents,
etc.
Implementing tra
ining
Increased ratio
of foreign employees
Allocation under st
aff with experience of w
orking abroad
Work-life balance
Preparing vario
us career co
urses
Others
None in particular
45.6
31.3
27.2 26.2
20.419.0
16.013.6
11.9
8.26.1 5.4
3.41.7
20.4
1.4

Labor Situation in Japan and Its Analysis: General Overview 2015/201672
Common clients of temporary labor agencies and work contractors are manufacturers in the automotive business, subcontractors in the consumer electronics and electronic parts industries, and food plants (producing prepared foods for convenience stores, etc.). Such work does not require a high level of skill, and is often simple and repetitive. Client companies also do not require advanced skills of Nikkei workers.
Employment support is being offered so that Nikkei workers can find work not only in manufacturing, but also in long-term nursing care or other healthcare and welfare professions. However, there are challenges in that Nikkei workers’ Japanese language proficiency is often not at the level sought by employers.
As a consequence of bringing over their families and settling, Nikkei workers’ patterns of work are gradually changing. There are even Nikkei workers who buy houses in Japan, and it is said that they can be classified into those who become settled in Japan and those who move away. However, under the current system, the rate of enrollment in employment insurance and health insurance is low. When coming to Japan with their whole families, problems occur because they may be prevented from living a stable home life due to overtime and night work, or they may have children who do not attend school.
[Technical Interns]Japan seeks to make international contributions by
accepting foreign nationals, often from developing countries, for a limited period of time to undergo OJT and learn technical skills that can be transferred to their home countries. This program was launched in 1993, and has existed in its current format since 2010. Currently, technical interns work under an employment contract with an enterprise and are protected by the same labor laws and regulations as ordinary workers, except for during a training period immediately following arrival in Japan.
Today, there are about 180,000 technical interns in Japan. By country and region of origin, approximately 60% of them are from China, although the number from Vietnam has been on the rise in recent years. Fields where technical interns are often placed include textiles and apparel, machining and
metalworking, and food manufacture, but an increasing number are engaged in construction or agriculture as well. Over 50% of the enterprises accepting interns are very small companies with less than 10 employees.
The training provided under the systems of training and technical internships for foreign nationals includes training in quality control and production control, and the results are becoming apparent. For example, some trainees and technical interns have gone on to become forepersons and assistance managers at Japanese companies in their own countries or have formed their own startups after completing their training.
However, the Technical Intern Training Program has suffered from problems including:1. The program has the stated objective of
transferring skills and technology from Japan to other countries. In reality, however, it has become a source of inexpensive labor for small and mid-sized companies unable to secure enough personnel.
2. Training is often not conducted according to plan, or wages not paid as required.
3. Brokers intervene in the process and demand payment of deposits, or interns include fugitives.To address such problems, steps were taken to
strengthen the protection of technical interns through 2009 amendments to the Immigration Control Act and other legislation. In this way, attempts are being made to optimize systems of training and technical internships through measures for the protection of technical interns, a robust response against rogue organizations, etc., and optimizing dispatching agencies, among other action.
As of October 31, 2015, the technical internship program is currently being overhauled with the prerequisite that management and oversight will be strengthened. Key points of the overhaul are: 1) Arrangements are to be formulated between governments (or authorities), which are to cooperate on weeding out rogue organizations, to prevent cases of circumvention of intergovernmental arrangements and participation by illegitimate dispatching agencies who demand security deposits, etc. 2) Supervisory bodies are to be licensed, trainers registered, and

Labor Situation in Japan and Its Analysis: General Overview 2015/2016 73
Chapter II Labor Market
training implementation programs authorized so as to ensure accountability among supervisory bodies and training organizations and sufficient implementation of the training promised, 3) To address the fact that JITCO (the Japan International Training Cooperation Organization) is inspecting and instructing participating enterprises without legal authority, a new overseas technical internship agency is to be established to process reports from supervisory bodies and conduct inspections, etc. 4) An office accepting reports, etc. from trainees, including whistleblowers, is to be opened and human rights violators, etc. penalized, so as to reinforce the inadequate system of protections for interns, and 5) To address the inadequacy of oversight, enforcement, and cooperation among presiding ministries, prefectural governments, etc., these bodies are to request cooperation from one another based on the applicable laws, and set up regional bureaus to carry out auditing and enforcement and strengthen partnerships among various parties to the training program.
In addition, incentives for outstanding supervisory bodies are being considered, including extension of the internship period or repeated implementation of internship programs, increase in the number of interns admitted, and expansion of the scope of eligible occupations for interns.
Issues in Employment Management of Foreign Workers
Employing foreign workers entails all kinds of issues at every stage of the employment process, from recruitment and hiring to education in health and safety, social insurance, human resource management (placement, education and training, and evaluation and treatment), and severance.1. Hiring: The various issues encountered at the
recruitment and hiring stage include the involvement of brokers, hiring discrimination, and the need to properly confirm workers’ status of residence.
2. Regarding equality of treatment after hiring, the Labour Standards Act applies to foreign as well as Japanese workers. There must therefore be no discrimination in terms of working conditions such
as wages and working hours.3. Care must be taken to ensure that education in
health and safety matters is understood by foreign workers. There may occur cases where foreign workers have insufficient Japanese ability or are unable to understand the content of safety education. Concrete explanations and guidance are therefore required to enable them to understand.
4. Foreign workers’ low rate of enrolment in employment insurance and health insurance has been a long-standing problem. The proportion of Nikkei workers not enrolled in health insurance is estimated to be anywhere between 15% and 60%. Similarly, 65% to 90% are not enrolled in pension insurance. People who are not enrolled in health insurance have to bear the full cost of medical treatment out of pocket, and may even be unable to receive appropriate treatment when in poor health. Non-enrollment can also lead to non-payment of medical expenses when treatment is received. Non-enrollment in the pension system also means that workers face possible poverty in old age.
5. Critics note that foreign workers in indirect employment have few opportunities for skills development.
6. As a result of the impact of the simultaneous worldwide recession that occurred in the autumn of 2008, many foreign workers became unemployed due to being made redundant or having their employment contracts terminated; in such cases, workers received little or not support from enterprises in finding other employment. Moreover, the social safety net did not function adequately for foreign workers.
Looking at it this way, there are issues relating to the employment of foreign workers that can be dealt with through rules by which employers should abide. Companies therefore need to manage their foreign workers properly according to the demands of each stage of employment, from recruiting and hiring to severance.