6 annals of the icrp · 56 models that have been used previously. ... summary of the database...
TRANSCRIPT

DRAFT REPORT FOR CONSULTATION: DO NOT REFERENCE
1
ICRP ref 4838-4528-4881 1 20 September 2012 2
3 4 5 6
Annals of the ICRP 7
8
ICRP PUBLICATION XXX 9 10
11
Occupational Intakes of Radionuclides 12
Part 3 13
14 15 16 17 18 19 20 21 22 23 24
25 26 27 28
29 30 31 32
33 34
35 36 DRAFT DOCUMENT 37 38 Information in this consultation document is preliminary. The document should not be cited in any published material in 39 advance of final approval for publication by the Commission of ICRP. 40
41

DRAFT REPORT FOR CONSULTATION: DO NOT REFERENCE
2
42
Occupational Intakes of Radionuclides 43
Part 3 44
45
46
ICRP Publication XXX 47
48
Approved by the Commission in XXX 49
50
Abstract- The 2007 Recommendations (Publication 103, ICRP, 2007) introduced changes to 51 the radiation and tissue weighting factors used in calculation of effective dose. In addition, 52 Publication 103 clarified the need for separate calculation of equivalent dose to males and 53 females and sex-averaging in the calculation of effective dose (ICRP, 2007) and adopted the 54 use of reference anatomical computational phantoms, in place of the composite mathematical 55 models that have been used previously. 56
These substantial changes implied a revision of the dose coefficients for internal exposure, 57 published previously in the Publication 30 series (ICRP, 1979, 1980, 1981, 1988b). This 58 work was performed by Committee 2 and its Task Groups INDOS and DOCAL. 59
This report is the third in a series of documents replacing the Publication 30 series and 60 Publication 68 (ICRP, 1994b) and providing revised dose coefficients for occupational 61 intakes of radionuclides (OIR) by inhalation and ingestion. It provides data on individual 62 elements and their radioisotopes, including biokinetic data and models, dose coefficients and 63 data for bioassay interpretation. Electronic disks accompanying this series give extensive 64 additional information. 65
This third report in the series provides the above data for the following elements : 66 Ruthenium (Ru), Antimony (Sb), Tellurium (Te), Iodine (I), Caesium (Cs), Barium (Ba), 67 Iridium (Ir), Lead (Pb), Bismuth (Bi), Polonium (Po), Radon (Rn), Radium (Ra), Thorium 68 (Th) and Uranium (U). 69
The current version, posted for public consultation, contains only the biokinetic data and 70 the models. An exception is made for Radon, where some preliminary dose coeffcients are 71 provided for information only. 72
The total set of dose coefficients and data for bioassay interpretation will be included in 73 the final version. 74 © 201X ICRP. Published by Elsevier Ltd. 75 76 Keywords: Occupational exposure, Internal Dose Assessment, Biokinetic and Dosimetric 77 models, Bioassays interpretation. 78
79
DRAFT REPORT FOR CONSULTATION: DO NOT REFERENCE
3
80 CONTENTS 81
PREFACE .................................................................................................................................. 7 82
1. INTRODUCTION ............................................................................................................... 9 83
2. RUTHENIUM (Z = 44) ..................................................................................................... 12 84 2.1. CHEMICAL FORMS IN THE WORKPLACE ........................................................................ 12 85 2.2. ROUTES OF INTAKE ..................................................................................................... 12 86
2.2.1. INHALATION ........................................................................................................ 12 87 2.2.2. INGESTION ........................................................................................................... 19 88 2.2.3. SYSTEMIC DISTRIBUTION, RETENTION AND EXCRETION ...................................... 20 89
2.2.3.1. Summary of the database ............................................................................ 20 90 2.2.3.2. Biokinetic model for systemic ruthenium ................................................... 22 91 2.2.3.3. Treatment of radioactive progeny ............................................................... 25 92
2.3. INDIVIDUAL MONITORING ............................................................................................ 26 93
3. ANTIMONY (Z = 51) ....................................................................................................... 29 94 3.1. CHEMICAL FORMS IN THE WORKPLACE....................................................................... 29 95 3.2. ROUTES OF INTAKE ..................................................................................................... 29 96
3.2.1. INHALATION ........................................................................................................ 29 97 3.2.2. INGESTION ........................................................................................................... 32 98 3.2.3. SYSTEMIC DISTRIBUTION, RETENTION AND EXCRETION ...................................... 33 99
3.2.3.1. Summary of the database ............................................................................ 33 100 3.2.3.2. Biokinetic model for systemic antimony .................................................... 38 101 3.2.3.3. Treatment of radioactive progeny ............................................................... 41 102
3.3. INDIVIDUAL MONITORING ............................................................................................ 42 103
4. TELLURIUM (Z = 52) ...................................................................................................... 46 104 4.1. CHEMICAL FORMS IN THE WORKPLACE....................................................................... 46 105 4.2. ROUTES OF INTAKE ..................................................................................................... 46 106
4.2.1. INHALATION ........................................................................................................ 46 107 4.2.2. INGESTION ........................................................................................................... 49 108 4.2.3. SYSTEMIC DISTRIBUTION, RETENTION AND EXCRETION ...................................... 50 109
4.2.3.1. Summary of the database ............................................................................ 50 110 4.2.3.2. Biokinetic model for systemic tellurium ..................................................... 54 111 4.2.3.3. Treatment of radioactive progeny ............................................................... 56 112
4.3. INDIVIDUAL MONITORING ............................................................................................ 58 113
5. IODINE (Z = 53) ............................................................................................................... 61 114 5.1. CHEMICAL FORMS IN THE WORKPLACE....................................................................... 61 115 5.2. ROUTES OF INTAKE ..................................................................................................... 61 116
5.2.1. INHALATION ........................................................................................................ 61 117 5.2.2. INGESTION ........................................................................................................... 65 118 5.2.3. SYSTEMIC DISTRIBUTION, RETENTION AND EXCRETION ...................................... 66 119
5.2.3.1. Summary of the database ............................................................................ 66 120 5.2.3.2. Biokinetic model for systemic iodine ......................................................... 72 121 5.2.3.3. Treatment of radioactive progeny ............................................................... 79 122

DRAFT REPORT FOR CONSULTATION: DO NOT REFERENCE
4
5.3. INDIVIDUAL MONITORING ............................................................................................ 80 123
6. CAESIUM (Z = 55) ........................................................................................................... 90 124 6.1. CHEMICAL FORMS IN THE WORKPLACE....................................................................... 90 125 6.2. ROUTES OF INTAKE ..................................................................................................... 90 126
6.2.1. INHALATION ........................................................................................................ 90 127 6.2.2. INGESTION ........................................................................................................... 94 128 6.2.3. SYSTEMIC DISTRIBUTION, RETENTION AND EXCRETION ...................................... 95 129
6.2.3.1. Summary of database .................................................................................. 95 130 6.2.3.2. Biokinetic model for systemic caesium ...................................................... 96 131 6.2.3.3. Treatment of radioactive progeny ............................................................. 102 132 6.2.3.4. Differences with gender ............................................................................ 104 133
6.3. INDIVIDUAL MONITORING .......................................................................................... 104 134
7. BARIUM (Z = 56) ........................................................................................................... 110 135 7.1. CHEMICAL FORMS IN THE WORKPLACE..................................................................... 110 136 7.2. ROUTES OF INTAKE ................................................................................................... 110 137
7.2.1. INHALATION ...................................................................................................... 110 138 7.2.2. INGESTION ......................................................................................................... 113 139 7.2.3. SYSTEMIC DISTRIBUTION, RETENTION AND EXCRETION .................................... 114 140
7.2.3.1. Summary of the database .......................................................................... 114 141 7.2.3.2. Biokinetic model for systemic barium ...................................................... 114 142 7.2.3.3. Treatment of radioactive progeny ............................................................. 119 143
7.3. INDIVIDUAL MONITORING .......................................................................................... 119 144
8. IRIDIUM (Z = 77) ........................................................................................................... 123 145 8.1. CHEMICAL FORMS IN THE WORKPLACE..................................................................... 123 146 8.2. ROUTES OF INTAKE ................................................................................................... 123 147
8.2.1. INHALATION ...................................................................................................... 123 148 8.2.2. INGESTION ......................................................................................................... 126 149 8.2.3. SYSTEMIC DISTRIBUTION, RETENTION AND EXCRETION .................................... 126 150
8.2.3.1. Summary of the database .......................................................................... 126 151 8.2.3.2. Biokinetic model for systemic iridium ...................................................... 128 152 8.2.3.3. Treatment of radioactive progeny ............................................................. 131 153
8.3. INDIVIDUAL MONITORING .......................................................................................... 133 154
9. LEAD (Z = 82) ................................................................................................................ 136 155 9.1. CHEMICAL FORMS IN THE WORKPLACE..................................................................... 136 156 9.2. ROUTES OF INTAKE ................................................................................................... 136 157
9.2.1. INHALATION ...................................................................................................... 136 158 9.2.2. INGESTION ......................................................................................................... 149 159 9.2.3. SYSTEMIC DISTRIBUTION, RETENTION AND EXCRETION .................................... 150 160
9.2.3.1. Summary of the database .......................................................................... 150 161 9.2.3.2. Biokinetic model for systemic lead ........................................................... 152 162 9.2.3.3. Treatment of radioactive progeny ............................................................. 155 163
9.3. INDIVIDUAL MONITORING .......................................................................................... 159 164
10. BISMUTH (Z = 83) ....................................................................................................... 167 165

DRAFT REPORT FOR CONSULTATION: DO NOT REFERENCE
5
10.1. CHEMICAL FORMS IN THE WORKPLACE .................................................................... 167 166 10.2. ROUTES OF INTAKE .................................................................................................. 167 167
10.2.1. INHALATION ..................................................................................................... 167 168 10.2.2. INGESTION ....................................................................................................... 172 169 10.2.3. SYSTEMIC DISTRIBUTION, RETENTION AND EXCRETION .................................. 173 170
10.2.3.1. Summary of the database ........................................................................ 173 171 10.2.3.2. Systemic model ....................................................................................... 176 172 10.2.3.3. Treatment of radioactive progeny ........................................................... 178 173
10.3. INDIVIDUAL MONITORING ........................................................................................ 178 174
11. POLONIUM (Z = 84) .................................................................................................... 182 175 11.1. CHEMICAL FORMS IN THE WORKPLACE .................................................................... 182 176 11.2. ROUTES OF INTAKE .................................................................................................. 182 177
11.2.1. INHALATION ..................................................................................................... 182 178 11.2.2. INGESTION ....................................................................................................... 191 179 11.2.3. SYSTEMIC DISTRIBUTION, RETENTION AND EXCRETION .................................. 191 180
11.2.3.1. Summary of the database ........................................................................ 191 181 11.2.3.2. Biokinetic model for systemic polonium ................................................ 194 182 11.2.3.3. Treatment of radioactive progeny ........................................................... 199 183
11.3. INDIVIDUAL MONITORING ........................................................................................ 200 184
12. RADON (Z = 86) ........................................................................................................... 204 185 12.1. CHEMICAL FORMS IN THE WORKPLACE .................................................................... 204 186 12.2. SPECIAL QUANTITIES AND UNITS .............................................................................. 207 187 12.3. EXTERNAL DOSE ...................................................................................................... 210 188 12.4. ROUTES OF INTAKE .................................................................................................. 210 189
12.4.1. INHALATION ..................................................................................................... 210 190 12.4.2. INGESTION ....................................................................................................... 224 191 12.4.3. BIOKINETIC MODEL FOR RADON GAS ................................................................ 224 192
12.4.3.1. Summary of the database ........................................................................ 225 193 12.4.3.2. Biokinetic model for systemic radon....................................................... 228 194 12.4.3.3. Treatment of radioactive progeny ........................................................... 232 195
12.5. DOSIMETRY ............................................................................................................. 235 196 12.5.1. CALCULATION OF DOSE CONVERSION FACTOR ARISING FROM THE INHALATION OF 197
RADON PROGENY. .................................................................................................................... 235 198 12.5.2. INHALATION OF RADON GAS ............................................................................. 238 199 12.5.3. INGESTION OF RADON ....................................................................................... 238 200 12.5.4. USE OF DOSE COEFFICIENTS FOR RADON-222 AND RADON-220 AND THEIR SHORT 201
LIVED DECAY PRODUCTS ......................................................................................................... 238 202
13. RADIUM (Z = 88) ......................................................................................................... 246 203 13.1. CHEMICAL FORMS IN THE WORKPLACE ................................................................... 246 204 13.2. ROUTES OF INTAKE .................................................................................................. 246 205
13.2.1. INHALATION ..................................................................................................... 246 206 13.2.2. INGESTION ....................................................................................................... 249 207 13.2.3. SYSTEMIC DISTRIBUTION, RETENTION AND EXCRETION .................................. 250 208
13.2.3.1. Biokinetic database ................................................................................. 250 209 13.2.3.2. Biokinetic model for systemic radium .................................................... 250 210

DRAFT REPORT FOR CONSULTATION: DO NOT REFERENCE
6
13.2.3.3. Treatment of radioactive progeny ........................................................... 254 211 13.3. INDIVIDUAL MONITORING ....................................................................................... 258 212
14. THORIUM (Z = 90) ....................................................................................................... 262 213 14.1. CHEMICAL FORMS IN THE WORKPLACE ................................................................... 262 214 14.2. ROUTES OF INTAKE .................................................................................................. 262 215
14.2.1. INHALATION ..................................................................................................... 262 216 14.2.2. INGESTION ....................................................................................................... 276 217 14.2.3. SYSTEMIC DISTRIBUTION, RETENTION AND EXCRETION ................................... 277 218
14.2.3.1. Summary of the database ........................................................................ 277 219 14.2.3.2. Biokinetic model for systemic thorium ................................................... 279 220 14.2.3.3. Treatment of radioactive progeny ........................................................... 282 221
14.3. INDIVIDUAL MONITORING ........................................................................................ 283 222
15. URANIUM (Z = 92) ...................................................................................................... 290 223 15.1. CHEMICAL FORMS IN THE WORKPLACE .................................................................... 290 224 15.2. ROUTES OF INTAKE .................................................................................................. 290 225
15.2.1. INHALATION ..................................................................................................... 290 226 15.2.2. INGESTION ....................................................................................................... 303 227
15.3. SYSTEMIC DISTRIBUTION, RETENTION AND EXCRETION .......................................... 304 228 15.3.1. SUMMARY OF THE DATABASE .......................................................................... 304 229 15.3.2. BIOKINETIC MODEL FOR SYSTEMIC URANIUM ................................................... 307 230 15.3.3. TREATMENT OF RADIOACTIVE PROGENY .......................................................... 312 231
15.4. INDIVIDUAL MONITORING ........................................................................................ 313 232 233
234

DRAFT REPORT FOR CONSULTATION: DO NOT REFERENCE
7
235 PREFACE 236
237 The 2007 Recommendations (Publication 103, ICRP, 2007) introduced changes to the 238
radiation weighting factors used in the calculation of equivalent dose to organs and tissues 239 and also changes to the tissue weighting factors used in the calculation of effective dose. In 240 addition, an important development was the adoption of reference anatomical computational 241 phantoms, in place of the composite mathematical models that have been used for all 242 previous calculations of organ doses. Publication 103 also clarified the need for separate 243 calculation of equivalent dose to males and females and sex-averaging in the calculation of 244 effective dose (ICRP, 2007). 245
These changes implied a revision of the dose coefficients initially provided in the 246 Publication 30 series (ICRP, 1979, 1980, 1981, 1988b). This work was performed by 247 Committee 2 and its Task Groups INDOS and DOCAL. 248
This report is the third in a series of documents replacing the Publication 30 series and 249 Publication 68 (ICRP, 1994b) and providing revised dose coefficients for occupational 250 intakes of radionuclides (OIR) by inhalation and ingestion. It provides also radionuclide-251 specific information for the design and planning of monitoring programmes and retrospective 252 assessment of occupational internal doses, replacing Publications 54 and 78 (ICRP, 1988a, 253 1997b). 254
The first report of this OIR series included chapters describing the control of occupational 255 exposures, biokinetic and dosimetric models, monitoring methods, monitoring programmes 256 and retrospective dose assessment. 257
The following reports provide data on individual elements and their radioisotopes, 258 including biokinetic data and models, dose coefficients and data for bioassay interpretation. 259 Electronic disks accompanying this series give extensive additional information. 260
The second report in the series provided data for the following elements : Hydrogen (H), 261 Carbon (C), Phosphorus (P), Sulphur (S), Calcium (Ca), Iron (Fe), Cobalt (Co), Zinc (Zn), 262 Strontium (Sr), Yttrium (Y), Zirconium (Zr), Niobium (Nb), Molybdenum (Mo) and 263 Technetium (Tc). 264
This third report provides the data for the following elements: Ruthenium (Ru), Antimony 265 (Sb), Tellurium (Te), Iodine (I), Caesium (Cs), Barium (Ba), Iridium (Ir), Lead (Pb), Bismuth 266 (Bi), Polonium (Po), Radon (Rn), Radium (Ra), Thorium (Th) and Uranium (U). 267
Subsequent reports will provide data for the other elements. 268 The current version, posted for public consultation, contains only the biokinetic data and 269
the models. An exception is made for Radon, where some preliminary dose coeffcients are 270 provided for information only. 271
The total set of dose coefficients and data for bioassay interpretation will be included in 272 the final version. 273 274
The membership of the Task Group on Internal Dosimetry (INDOS) at the time of the 275 completion of this report was: 276 277 Members: 278 F Paquet (Chair) G Etherington J L Lipsztein 279 E Ansoborlo A Giussani D Melo 280 M R Bailey R A Guilmette 281

DRAFT REPORT FOR CONSULTATION: DO NOT REFERENCE
8
E J A Blanchardon J D Harrison 282 H Doerfel R W Leggett 283 284 Corresponding Members: 285 A Bouville A Luciani D Whillans 286 C-M Castellani D Newton 287 R Cruz-Suarez D Nosske 288 C Hurtgen D M Taylor 289 290
The membership of the Task Group on Dose Calculations (DOCAL) at the time of the 291 completion of this report was: 292 293 Members: 294 W E Bolch (Chair) A Endo N Ishigure 295 M Zankl V Berkovski T P Fell 296 D Nosske L Bertelli N E Hertel 297 N Petoussi-Henss K F Eckerman J G S Hunt 298 M Pelliccioni 299 300 Corresponding Members: 301 A Birchall H Schlattl 302 G Gualdrini M Stabin 303 D Jokisch R Tanner 304 C Lee X G Xu 305 306
The membership of Committee 2 was: 307 308 (2009-2013) 309 H-G Menzel (Chair) W E Bolch J D Harrison 310 F Paquet M R Bailey R Cox 311 N Ishigure N Petoussi-Henss M Balonov 312 G Dietze R W Leggett A S Pradhan 313 D Bartlett K F Eckerman J L Lipsztein 314 V Berkovski A Endo J Ma 315 316
317

DRAFT REPORT FOR CONSULTATION: DO NOT REFERENCE
9
318 1. INTRODUCTION 319
320 (1) The present report is Part 3 of a report series aimed at providing revised dose 321
coefficients for occupational intakes of radionuclides (OIR) by inhalation and ingestion. It 322 also presents radionuclide-specific information for the design and planning of monitoring 323 programmes and retrospective assessment of occupational internal doses. 324
(2) This report series replaces the Publication 30 series (ICRP, 1979, 1980, 1981, 325 1988b), Publications 54, 68 and 78 (ICRP, 1988a, 1994b, 1997). The revised dose 326 coefficients, dose per unit content values and reference bioassay functions have been 327 calculated using the Publication 100 (ICRP, 2006) Human Alimentary Tract Model (HATM) 328 and a revision of the Publication 66 (ICRP, 1994a) Human Respiratory Tract Model (HRTM) 329 which takes account of more recent data. The revisions made to the HRTM are described in 330 Part 1 of this report series. In addition, information is provided in this report series on 331 absorption to blood following inhalation and ingestion of different chemical forms of 332 elements and their radioisotopes, in those cases for which it is currently judged that the data 333 are sufficient to make specific recommendations. Revisions have been made to many models 334 for the systemic biokinetics of radionuclides, making them more physiologically realistic 335 representations of uptake and retention in organs and tissues and of excretion. 336
(3) The dose coefficients and dose per unit content values presented in this report series 337 1 are given for a Reference Worker with an average breathing rate of 1.2 m3 h-1 during an 8 h 338 working day. These data are provided for a range of physico-chemical forms for each 339 radionuclide and for a range of aerosol particle size distributions. Data for ingestion and 340 injection (i.e. direct entry to the blood) are provided to allow the interpretation of bioassay 341 data for cases of inadvertent ingestion (e.g. of material on contaminated skin) or rapid 342 absorption through intact or damaged skin (injection). 343
(4) Data are presented in a standard format for each element and its radioisotopes. Each 344 element section provides information on chemical forms encountered in the workplace; 345 principal radioisotopes, their physical half-lives and decay modes; reviews of data on 346 inhalation, ingestion and systemic biokinetics; the structure and parameter values for the 347 systemic biokinetic model; and information on the interpretation of individual monitoring 348 data. Each section in the printed documents also includes tables of: 349 350
• Dose coefficients (committed effective dose, Sv, per Bq intake) for inhalation of 5 351 µm AMAD aerosols with the default absorption Types appropriate for the 352 element, for all relevant radioisotopes; 353
• Principal emissions of selected radioisotopes; 354
• Measurement techniques, detection limits typically achieved in a practical 355 monitoring programme, and improved detection limits that could be achieved by 356 suitable choice of measurement parameter values, for selected radioisotopes; 357
• Committed effective dose (Sv) per unit measurement (Bq) for an acute intake by 358 inhalation of a 5 µm AMAD aerosol with the default absorption Types appropriate 359
1 The current version, posted for public consultation, contains only the biokinetic data and the models. An exception is made for Radon, where some preliminary dose coeffcients are provided for information only. The total set of dose coefficients and data for bioassay interpretation will be included in the final version

DRAFT REPORT FOR CONSULTATION: DO NOT REFERENCE
10
for the element, for selected radioisotopes; 360
• Bioassay data (i.e. whole body and/or organ retention, and daily urinary and faecal 361 excretion, Bq per Bq intake), at various times after an acute intake by inhalation of 362 a 5 µm AMAD aerosol with the default absorption Types appropriate for the 363 element; 364
365 (5) Bioassay data are also presented graphically. 366 (6) In cases for which sufficient information is available (principally for actinide 367
elements), lung absorption is specified for different chemical forms and dose coefficients and 368 bioassay data are calculated accordingly. 369
(7) The full data set of this report is provided on electronic disk. This disk contains in 370 addition to the printed document: 371
372 Dose coefficients 373 • Committed equivalent dose coefficients for organs and tissues, for males and 374
females; 375
• Dose coefficients for all chemical forms considered; 376
• Dose coefficients for an inhaled aerosol with particle sizes ranging from an 377 AMTD of 0.001 µm to an AMAD of 20 µm; 378
• Dose coefficients for intake by ingestion, with the default fA values appropriate for 379 the element, for all relevant radioisotopes; 380
• Dose coefficients for radioisotopes not given in the printed reports in this series. 381
382
Bioassay data 383
• Committed effective dose (Sv) per unit measurement (Bq) for an acute intake by 384 inhalation of an aerosol with particle sizes ranging from an AMTD of 0.001 µm to 385 an AMAD of 20 µm; 386
• Committed effective dose (Sv) per unit measurement (Bq) for an acute intake by 387 ingestion, with default fA values appropriate for the element; 388
• Bioassay data (i.e. whole body and/or organ retention, and daily urinary and faecal 389 excretion, Bq per Bq intake), for an acute intake by inhalation of an aerosol with 390 particle sizes ranging from an AMTD of 0.001 µm to an AMAD of 20 µm; 391
• Similar bioassay data for an acute intake by ingestion 392
• Figures giving measured activity content per unit dose (Bq Sv–1) in selected body 393 tissues, urine (daily excretion) or faeces (daily excretion), at various times after 394 intake by inhalation or ingestion. These data can also be used to facilitate 395 decisions about the design of monitoring programmes and the extent of the 396 assessment required, as described in Chapter 5 of OIR Part 1. 397
398 399
(8) The list of elements included in Part 3 is: Ruthenium (Ru), Antimony (Sb), 400 Tellurium (Te), Iodine (I), Caesium (Cs), Barium (Ba), Iridium (Ir), Lead (Pb), Bismuth (Bi), 401
DRAFT REPORT FOR CONSULTATION: DO NOT REFERENCE
11
Polonium (Po), Radon (Rn), Radium (Ra), Thorium (Th) and Uranium (U). 402 403
References 404 405 ICRP, 1979. Limits for intake of radionuclides by workers. ICRP Publication 30, Part 1. Ann. ICRP 406
2(3/4). 407 ICRP, 1980. Limits for intakes of radionuclides by workers. ICRP Publication 30, Part 2. Ann. ICRP 408
4(3/4). 409 ICRP, 1981. Limits for intakes of radionuclides by workers. ICRP Publication 30, Part 3. Ann. ICRP 410
6 (2/3). 411 ICRP, 1988a. Individual monitoring for intakes of radionuclides by workers: design and 412
interpretation. ICRP Publication 54, Ann. ICRP 19 (1-3). 413 ICRP, 1988b. Limits for intakes of radionuclides by workers: An Addendum. ICRP Publication 30, 414
Part 4. Ann. ICRP 19 (4). 415 ICRP, 1994a. Human respiratory tract model for radiological protection. ICRP Publication 66. Ann. 416
ICRP 24 (1-3). 417 ICRP, 1994b. Dose coefficients for intake of radionuclides by workers. ICRP Publication 68. Ann. 418
ICRP 24 (4). 419 ICRP, 1997. Individual monitoring for internal exposure of workers – Replacement of ICRP 420
Publication 54. ICRP Publication 78. Ann. ICRP 27 (3/4). 421 ICRP, 2006. Human alimentary tract model for radiological protection. ICRP Publication 100. Ann. 422
ICRP 36 (1-2). 423 ICRP, 2007. The 2007 Recommendations of the International Commission on Radiological 424
Protection. ICRP Publication 103. Ann. ICRP 37 (2-4). 425 426

DRAFT REPORT FOR CONSULTATION: DO NOT REFERENCE
12
427 2. RUTHENIUM (Z = 44) 428
429 2.1. Chemical forms in the workplace 430 431
(9) Ruthenium is a transition metal which may exist in various oxidation states from II 432 to VIII. It is assumed that oxidation states (III) and (IV) are the most stable, while in strongly 433 oxidation conditions the oxo-anion RuO4
2- is very stable. Ruthenium may be encountered in 434 industry in a variety of chemical and physical forms, such as oxides (RuO2 and RuO4 (vapour 435 state)), halides, sulphides and different cyanides. 436
(10) Ruthenium-103 is produced in the nuclear industry as a fission product. At the 437 Chernobyl accident, ruthenium became volatile during the fire and was found in metallic 438 form, hundreds of kilometres away from the plant (Pollanen, 1997). 439 440
Table 2-1. Isotopes of ruthenium addressed in this report 441 442 Isotope Physical half-life Decay mode Ru-94 51.8 m EC, B+ Ru-95 1.643 h EC, B+ Ru-97 2.9 d EC Ru-103 39.26 d B- Ru-105 4.44 h B- Ru-106a 373.59 d B- a Data for these radionuclides are given in the printed copy of this report. Data for other radionuclides are 443
given on accompanying electronic disk. 444 445 2.2. Routes of Intake 446 447 2.2.1. Inhalation 448 449 Absorption Types and parameter values 450
(11) Some information is available on the behaviour of inhaled ruthenium in man 451 following accidental intakes as an oxide or in irradiated fuel fragments. Information is 452 available from experimental studies of ruthenium as tetroxide, chloride, citrate, dioxide, and 453 irradiated uranium dioxide. 454
(12) Absorption parameter values and Types, and associated fA values for gas and vapour 455 forms of ruthenium are given in Table 2-2 and for particulate forms in Table 2-3. Exposures 456 to gas and vapour forms of ruthenium are relatively unusual compared to exposures to 457 particulate forms, and therefore it is proposed here that particulate form is assumed in the 458 absence of information (ICRP, 2002). 459 460 Gases and vapours 461 462 Ruthenium tetroxide (RuO4) 463
(13) Ruthenium tetroxide (melting point 26°C, boiling point 40°C) has a high vapour 464 pressure at room temperature and is thought to have been involved in several human 465 inhalation incidents (Snipes and Kanapilly, 1983). It is very reactive, and converts to 466 ruthenium dioxide in contact with organic or other reactive surfaces. 467
(14) Snipes et al. (1977) carried out pilot experiments in which the biokinetics of 103Ru 468

DRAFT REPORT FOR CONSULTATION: DO NOT REFERENCE
13
were followed for ~2 weeks after inhalation of 103RuO4 by dogs and rats. In both species 469 initial deposition was primarily in the nasopharyngeal region (NP, broadly equivalent to the 470 extrathoracic airways) and tracheobronchial region (TB, equivalent to the bronchial and 471 bronchiolar regions). Clearance was rapid and mainly fecal: ~85% of the initial body burden 472 (IBB) was retained with a half-time of ~1 day, and the rest with a half-time of ~1 week. At 473 the end of the study most of the 103Ru retained in the body in dogs was in the lungs, but in rats 474 was associated with the nasal turbinates. 475
(15) Runkle et al. (1980) followed the biokinetics of 106Ru for 112 days after inhalation of 476 106RuO4 by rats. Complementary experiments were conducted to measure absorption of 106Ru 477 following gavage of 106RuO4 or 106RuO2: fractional absorption was estimated to be ~0.01 for 478 both. The overall pattern following inhalation was similar to that observed by Snipes et al. 479 (1977): 85%, 13.8% and 1.2% IBB were retained with biological half-times of 0.6, 4 and 69 480 days, respectively. Initial deposition was mainly in the NP and TB regions. After the first 481 week most of the 106Ru retained was associated with the nasal turbinates and head skin, with 482 little systemic uptake. Although most of the 106Ru deposited in the turbinates cleared within a 483 few days, ~2% was retained with a half-time of ~70 days. As discussed below, bound state 484 parameter values for ruthenium of fb = 0.05 and sb = 0.1 d–1 were chosen here. Assuming 485 these values, dissolution parameter values fitted here for 106RuO4 inhaled by rats (with 486 regional deposition of 99.8% ET and 0.2% AI) were: fr = 0.92, sr = 0.35 d–1 and ss = 0.01 d–1. 487
(16) Snipes (1981) followed the biokinetics of 106Ru for 512 days after inhalation of 488 106RuO4 by dogs. In a complementary experiment the biokinetics of 106Ru were followed for 5 489 days after ingestion of 106RuO2 by dogs: fractional absorption was estimated to be ~0.005. 490 The overall pattern after inhalation was similar to that observed by Snipes et al. (1977), but 491 clearance was even faster: 90%, 0.7% and 0.3% IBB were retained with effective half-times 492 of 1.2, 14 and 170 days, respectively. Again, initial deposition was primarily in the NP and 493 TB regions. The respiratory tract and pelt contained the highest levels of 106Ru with relatively 494 little systemic uptake. The NP region contained a high proportion of the body content of 495 106Ru at all times. The trachea, larynx and lung contained similar amounts of 106Ru at 512 496 days after exposure, reflecting long-term retention of some of the initial deposit in all regions 497 of the respiratory tract. Autoradiographs showed that the 106Ru dispersion in the turbinates 498 and lymph nodes was relatively uniform: only single tracks were observed with no indications 499 of focal accumulation. The long-term retention of a fraction of the 106Ru in the conducting 500 airways, from which most particles are cleared rapidly, and the uniform dispersion shown in 501 the autoradiographs, provide strong evidence for a bound fraction for ruthenium. Based on 502 the results of this study, bound state parameter values for ruthenium of fb = 0.05 and 503 sb = 0.1 d–1 were chosen here. Assuming these values, dissolution parameter values fitted 504 here for 106RuO4 inhaled by dogs (with regional deposition of 35% ET1; 35% ET2; 17% BB 505 and 0.02% AI) were: fr = 0.4, sr = 10 d–1 and ss = 0.001 d–1. 506
(17) Snipes and Kanapilly (1983) pointed out that incidents involving a release of RuO4 507 into room air might produce complex exposure atmospheres, with components including 508 RuO4 vapour, ultrafine particles formed by self-nucleation of RuO2, molecular RuO4 or RuO2 509 adsorbed on or attached to particles in the air. Such complex mixtures of vapour and particles 510 could yield deposition and dose patterns different from those of RuO4 vapour or of a simple 511 particulate aerosol. To provide data to assist in assessing doses from such exposures, Snipes 512 and Kanapilly (1983) followed the biokinetics of 106Ru for 112 days after inhalation by rats of 513 106RuO4 mixed with an aerosol of fused aluminosilicate particles (FAP, 0.69 µm diameter.) 514 Particle size analysis and the initial deposition pattern indicated that most of the 106Ru in the 515 exposure chamber was in the form of molecular RuO4, with ~25% associated with particles 516

DRAFT REPORT FOR CONSULTATION: DO NOT REFERENCE
14
~0.1 µm diameter, and <5% associated with the FAP. It was estimated that 60% IBB 517 deposited in the upper respiratory tract, 10% in the TB region, 12% in the AI region and 18% 518 was external contamination, mainly on the nares and head skin. Clearance was rapid and 519 mainly via the alimentary tract to faeces: 92% and 8% IBB were retained with effective half-520 times of 0.7 and 30 days, respectively. Clearance of 106Ru from the AI region had an effective 521 half-time of ~30 days and was predominantly by dissolution. As discussed below, bound state 522 parameter values for ruthenium of fb = 0.05 and sb = 0.1 d–1 were chosen here. Assuming 523 these values, dissolution parameter values fitted here (with regional deposition of 87% ET2 524 and 13% AI) were: fr = 0.9, sr = 0.5 d–1 and ss = 0.001 d–1. These are similar to those assessed 525 for RuO4 alone. The main difference is in the higher lung deposition. 526
(18) A worker accidentally inhaled 103RuO4 vapour while performing experiments in 527 which 103Ru was distilled from a neutron-irradiated 235U sample (Webber and Harvey, 1976). 528 External measurements made from 8 to 36 days after the incident indicated that inhaled 529 activity was retained primarily in the region of the nose and mouth. Activity was also detected 530 in the lower abdominal area. There was no evidence of concentration of activity in other 531 tissues. The half-time for biological removal from the body was ~15 d. There is insufficient 532 information available to assess parameter values from the reported measurements, but the 533 observations are consistent with parameter values fr = 0.4 and ss = 0.001 d–1 derived above 534 from experimental studies. 535
(19) In two other human exposure incidents (Pusch 1968; Howells et al., 1977) it was 536 suspected that the released activity was RuO4, but that it was converted at least in part to 537 particulate forms of ruthenium, notably RuO2, during mixing and interacting with room air 538 (Snipes and Kanapilly, 1983). In both cases the ruthenium was only detected in the chest. 539 Details are given below in the ruthenium dioxide section. 540
(20) Based on the experimental studies, dissolution parameter values used here for RuO4 541 are: fr = 0.5, sr = 1 d–1 and ss = 0.001 d–1, with bound state parameter values for ruthenium of 542 fb = 0.05 and sb = 0.1 d–1 (consistent with assignment to default Type M) and fA = 0.01. 543 Regional deposition of 40% ET1; 40% ET2; 12% BB; 7% bb and 1% AI is assumed here, 544 based on 106RuO4 inhaled by dogs. 545
(21) However, the study by Snipes and Kanapilly (1983) and the accidental exposures 546 suggest that mixing with the ambient aerosol could lead to greater lung deposition of RuO4 547 and conversion to RuO2 before intake. For prospective assessments of potential releases of 548 RuO4 it is therefore proposed that the exposure is to 50% RuO4 vapour and 50% RuO2 549 particulate (5 µm AMAD aerosol). For retrospective assessment it should be recognised that a 550 wide range of mixtures is possible. 551 552 Particulate aerosols 553 554 Ruthenium chloride 555
(22) Thompson et al. (1958) measured excretion of 106Ru for 60 days after administration 556 of ruthenium chloride to rats by intratracheal instillation, and the tissue distribution at the end 557 of the experiment. They estimated that cumulative urinary excretion accounted for ~29% of 558 the initial lung deposit (ILD), cumulative faecal excretion ~66%, activity in the respiratory 559 tract ~2%, and activity in systemic tissues ~3% of the administered amount. Excretion in 560 faeces exceeded that in urine for about 15 days, and was much higher than following 561 intravenous or intraperitoneal injection. This suggests that much of the activity deposited in 562 the lung was cleared by particle transport to the alimentary tract before it could be absorbed, 563 i.e. that sr <100 d–1. However, ~10% ILD was excreted in urine in the first few days, 564
DRAFT REPORT FOR CONSULTATION: DO NOT REFERENCE
15
suggesting that sr >1 d–1. 565 (23) Burykina (1969) followed the lung retention of 106Ru for 75 days after administration 566
of ruthenium chloride to rats by intratracheal instillation. Although there was some rapid 567 clearance from the lungs ~10% ILD remained in the lungs at 75 d. As discussed below, bound 568 state parameter values for ruthenium of fb = 0.05 and sb = 0.1 d–1 are used here. Assuming 569 these values, dissolution parameter values fitted here were: fr = 0.8, sr = 4 d-1 and ss = 0.007 d–570 1, consistent with assignment to Type M. 571
(24) Dobryakova (1970) followed the biokinetics of 106Ru for 14 days after administration 572 of ruthenium chloride to rats by intratracheal instillation. There was rapid absorption from the 573 lungs: ~50% of the ILD was absorbed at 30 minutes and ~70% ILD at 1 day. Subsequent 574 clearance was slower and excretion mainly faecal, with ~6% ILD remaining in the lungs at 14 575 d. As discussed below, bound state parameter values for ruthenium of fb = 0.05 and sb = 0.1 d–576 1 are used here. Assuming these values, dissolution parameter values fitted here were: fr = 577 0.8, sr = 10 d–1 and ss = 0.1 d–1, consistent with assignment to Type F. 578
(25) Although specific parameter values for ruthenium chloride based on in vivo data are 579 available, they are not adopted here, because inhalation exposure to it is unlikely. Instead, 580 ruthenium chloride is assigned to Type F. 581 582 Ruthenium oxalate 583
(26) Newton and Latven (1971) followed the biokinetics of 106Ru for 16 days after 584 inhalation by a dog of 106Ru oxalate, heat-treated at 100°C. (Other dogs inhaled 106Ru oxalate 585 aerosols heat-treated at 500°C or 1000°C, which was thought to convert most of the 106Ru to 586 106RuO2: see below). In a complementary experiment fractional absorption of 106Ru from the 587 alimentary tract after administration of the same material by gavage to a dog was estimated to 588 be ~0.2. Following inhalation, clearance was rapid: 73% IBB was excreted in the first 4 days, 589 and the rest with a half-time of 14 days. At 16 days, 40% of the retained 103Ru was in the 590 lungs, (~10% ILD) suggesting either Type F or Type M behaviour. The rest was widely 591 distributed. However, 4% was associated with the nasal turbinates: a much larger fraction 592 than after inhalation of particles treated at higher temperatures (~0.1%), and suggesting 593 retention of a bound fraction. 594
(27) Newton et al. (1975, 1976) followed the biokinetics of 106Ru for 365 days after 595 inhalation by hamsters of 106Ru oxalate aerosols heat-treated at 27°C, 300°C, 600°C or 596 1100°C. It was considered that at 27°C and 300°C mixed aerosols were formed which 597 contained ruthenium oxalate and degradation products, but at 600°C or 1100°C most of the 598 106Ru was converted to 106RuO2: see below. In dissolution tests in vitro (synthetic serum 599 ultrafiltrate at 37°C) ~38% and ~33% dissolved from aerosol samples formed at 27°C and 600 300°C, respectively, mainly in the first day, suggesting fr ~0.3, and sr >10 d–1. At 8 days after 601 inhalation of aerosol formed at 27°C, ~30% of the retained 106Ru was in the lungs, with ~5% 602 in the skeleton and ~20% in soft tissues. For the particles formed at 300°C, lung retention was 603 somewhat higher and systemic uptake lower. For both aerosols, ~7% was in the skull, and 604 was attributed to retention of 106Ru in the NP region. As discussed below, bound state 605 parameter values for ruthenium of fb = 0.05 and sb = 0.1 d–1 are used here. Assuming these 606 values, dissolution parameter values fitted here for the aerosol formed at 27°C were: fr = 0.36, 607 sr = 37 d–1 and ss = 0.1 d–1, consistent with assignment to Type F; and for the aerosol formed 608 at 300°C, fr = 0.28, sr = 34 d–1 and ss = 0.008 d–1, consistent with assignment to Type M. 609
(28) Although specific parameter values for ruthenium oxalate based on in vivo data are 610 available, they are not adopted here, because inhalation exposure to it is unlikely. Instead, 611 ruthenium oxalate is assigned to Type F. 612
DRAFT REPORT FOR CONSULTATION: DO NOT REFERENCE
16
613 Ruthenium citrate 614
(29) Boecker and Harris (1969) followed the biokinetics of 106Ru for 512 days after 615 inhalation of 106Ru citrate by dogs. Whole-body retention was represented by a four-616 component exponential function: 80%, 13%, 4% and 3% IBB were retained with effective 617 half-times of 0.6, 11, 53 and 280 days, respectively. The large amounts excreted in the first 618 few days, in both urine and faeces, suggest that much of the activity deposited in the 619 respiratory tract was absorbed rapidly, at a rate similar to particle transport from the upper 620 airways to the alimentary tract. Subsequent excretion was mainly to urine. Soon after 621 exposure, the lungs contained about 40% IBB, and this decreased to ~4% IBB after 16 days. 622 There was wide distribution of the 106Ru retained in the body, but the concentration in lungs 623 remained higher than in other tissues. The authors suggested that hydrolysis of the polyvalent 624 ruthenium might have caused the long-term lung retention. As discussed below, bound state 625 parameter values for ruthenium of fb = 0.05 and sb = 0.1 d–1 are used here. Assuming these 626 values, dissolution parameter values fitted here were: fr = 0.8, sr = 0.3 d–1 and ss = 0.005 d–1, 627 consistent with assignment to Type M. Although specific parameter values for ruthenium 628 citrate based on in vivo data are available, they are not adopted here, because inhalation 629 exposure to it is unlikely. Instead, ruthenium citrate is assigned to Type M. 630 631 Ruthenium dioxide (RuO2) 632
(30) Bair et al. (1961) followed the biokinetics of 106Ru for 490 days after inhalation of 633 106RuO2 aerosols by mice. Clearance was initially rapid: ~95% IBB cleared within a few 634 days. After the first day the lungs contained more 106Ru than any other tissue. Lung retention 635 was fit by a 3-component exponential function with 83%, 15% and 2% ILD retained with 636 biological half-times of 7, 28 and 230 days. It was estimated that the ILD was ~25% IBB. 637 Systemic uptake (bone and muscle) accounted for ~1% IBB at 1 day, and decreased slowly 638 thereafter. As discussed below, bound state parameter values for ruthenium of fb = 0.05 and 639 sb = 0.1 d–1 are used here. Assuming these values, dissolution parameter values fitted here 640 were: fr ~0.3, sr ~10 d–1 and ss ~0.001 d–1, consistent with assignment to Type M. 641
(31) Burykina (1962) measured the tissue distribution of 103Ru at times up 11 days after 642 administration of 103RuO2 to rats by intratracheal instillation. There were very low activities 643 measured in systemic tissues, <0.01% ILD in total, indicating Type S behaviour. 644
(32) Stuart and Gaven (1970) followed the biokinetics of 106Ru for 39 months after 645 inhalation of 106RuO2 by dogs. The 106RuO2 was avidly retained in the lungs. After the early 646 clearance phases, whole body retention was fit by a single exponential function with 647 biological half-times in the range 5 - 9 years. From 7 to 39 months >98% of retained 106Ru 648 was in the lungs or associated lymph nodes. As discussed below, bound state parameter 649 values for ruthenium of fb = 0.05 and sb = 0.1 d–1 are used here. Assuming these values, 650 dissolution parameter values fitted here were: fr = 0.0005, sr = 100 d–1 and ss = 0.0004 d–1, 651 consistent with assignment to Type S. 652
(33) As outlined above, Newton and Latven (1971) followed the biokinetics of 106Ru for 653 16 days after inhalation by a dog of 106Ru oxalate aerosols heat-treated at 500°C or 1000°C, 654 which was thought to convert most of the 106Ru to 106RuO2. In complementary experiments 655 fractional absorption of 106Ru from the alimentary tract after administration of the same 656 materials by gavage to dogs were estimated to be ~0.02 and 0.003. Following inhalation, 657 ~50% IBB was excreted in the first few days, and the rest with a half-time of ~40 and ~300 658 days, respectively. At 16 days after inhalation of aerosol formed at 1000°C, 97% of the 659 retained 103Ru was in the lungs, with ~2% in the skeleton and soft tissues combined, 660

DRAFT REPORT FOR CONSULTATION: DO NOT REFERENCE
17
suggesting either Type M or Type S behaviour. For the particles formed at 500°C, lung 661 retention was somewhat lower and systemic uptake higher. 662
(34) As outlined above, Newton et al. (1975, 1976) followed the biokinetics of 106Ru for 663 365 days after inhalation by hamsters of 106Ru oxalate aerosols heat-treated at 600°C or 664 1100°C. In dissolution tests in vitro (synthetic serum ultrafiltrate at 37°C for 20 days) 665 dissolution was negligible. At 365 days after inhalation of aerosol formed at 1100°C, ~84% 666 of the retained 106Ru was in the lungs, with ~1% in the skeleton and ~1% in soft tissues. For 667 the particles formed at 600°C, lung retention was somewhat lower and systemic uptake 668 higher. As discussed below, bound state parameter values for ruthenium of fb = 0.05 and 669 sb = 0.1 d–1 are used here. Assuming these values, dissolution parameter values fitted here 670 were: fr = 0.001, sr = 100 d–1 and ss = 0.003 d–1, for the aerosol formed at 1100°C; and fr = 671 0.001, sr = 100 d–1 and ss = 0.0045 d–1, for the aerosol formed at 600°C, consistent with 672 assignment to Type M. 673
(35) Five workers were monitored for several months following acute inhalation of 106Ru, 674 thought to be in the form of RuO2 (Hesp and Coote, 1970). In vivo chest counts were started 675 3–13 days after intake and continued up to 377 days. Measurements of urinary 106Ru were 676 started 15–22 days after intake and continued up to 354 days after intake. Long-term retention 677 of 106RuO2 occurred in the chest, presumably in lungs and lymph nodes. The biological half-678 time for chest retention averaged 206 days (range 174–428 days). A similar average half-time 679 was indicated by urinary data. On average, daily loss in urine was equivalent to about 44% of 680 daily biological removal from the chest. The other 56% presumably was lost in faeces or 681 retained in systemic tissues. As discussed below, bound state parameter values for ruthenium 682 of fb = 0.05 and sb = 0.1 d–1 are used here. Assuming these values, dissolution parameter 683 values fitted here were: fr = 0.001, sr = 100 d–1 and ss = 0.002 d–1, consistent with assignment 684 to Type M. 685
(36) As noted in the section on ruthenium tetroxide above, in two reported incidents it 686 was suspected that RuO4 was released into the environment but converted to RuO2 by 687 interaction with the ambient aerosol. 688
(37) Seven persons were monitored by external counting following accidental inhalation 689 of 103Ru (Pusch 1968). Drops of water containing fission products of 235U had been 690 accidentally spread on a laboratory floor, and 103Ru in the droplets apparently became 691 airborne and spread throughout the building. The chemical form of airborne 103Ru was not 692 determined but may have been a mixture of 103RuO4 vapour and particulate 103Ru, possibly 693 RuO2 formed by interaction of 103RuO4 with the ambient aerosol through processes described 694 by Snipes and Kanapilly (1983). Ruthenium was not detected in any organ other than the 695 lungs. Measurements of retention in the chest were started 3 days after exposure and 696 continued for 1-4 months. The biological half-time averaged ~80 days (range 64 to 93 days). 697 Urinary excretion accounted for ~20% of urinary plus faecal losses in the early days after 698 exposure, suggesting Type M behaviour. 699
(38) Thirty-five workers were exposed for 10-15 minutes to airborne 106Ru while working 700 in a building where nuclear fuel was reprocessed (Howells et al., 1977). The released activity 701 appeared to have been 106RuO4, but this presumably was converted in part to particulate forms 702 of 106Ru during mixing and interacting with room air (Snipes and Kanapilly, 1983). Later 703 analysis of samples from the contaminated building indicated that the ruthenium was in an 704 oxide form (Howells et al., 1977). Immediately after the incident, individuals were monitored 705 by external counting. Localization (longitudinal and lateral scanning) began within 8 days and 706 indicated that the observed 106Ru was retained in the lungs, with no significant translocation 707 to other body organs. Measurements of chest activities were made on 11 workers for 3 years. 708

DRAFT REPORT FOR CONSULTATION: DO NOT REFERENCE
18
Biological half-times estimated for seven workers were in the range 625-3500 days. They 709 were not determined for the other three, because their fitted effective half-times equalled or 710 exceeded the physical half-life of 106Ru. The apparent increase in lung content was attributed 711 to redistribution of activity to sites with higher counting efficiency. The long biological half-712 times are consistent with the hypothesis that the deposited 106Ru had been converted to 713 106RuO2, and suggest Type S behaviour. 714
(39) Based on these studies ruthenium dioxide is assigned to default Type S. 715 716 Irradiated fuel fragments 717
(40) Rundo (1965) measured mixed fission products in vivo from 6 to 864 days after 718 suspected accidental inhalation of irradiated uranium by a worker. Measurements indicated 719 that the activity was mainly located in the lungs. Biological clearance of 103Ru could not be 720 measured, suggesting a half-time >230 days, and Type M or S behaviour of the ruthenium 721 present. 722
(41) Mirell and Blahd (1989) made whole-body measurements of activity on seven people 723 from about two weeks to several months after exposure to the initial Chernobyl reactor 724 accident plume in Kiev, Ukraine. Biological retention half-times were similar for different 725 radionuclides (45 days for 103Ru) and different from those expected for systemic retention, 726 indicating that they were trapped in particles and metabolically inert, thus indicating Type M 727 rather than Type F behaviour. 728
(42) The in vitro dissolution of samples of particles released from the Chernobyl accident 729 was measured for up to 60 d (Cuddihy et al., 1989). For all radionuclides, including 103Ru and 730 106Ru, 10% dissolved in a few hours, and the rest with a half-time of 160 d. Hence fr = 0.1, sr 731 ~10 d–1, and ss = 0.004 d–1, consistent with assignment to Type M. 732
(43) Lang et al, (1994) followed the biokinetics of 95Zr, 95Nb, 103Ru, and 141Ce for 3 733 months after intratracheal instillation of neutron-irradiated UO2 particles into rats. For the 734 103Ru the amounts in kidney and bone were <1% ILD. It was assessed here that fr ~0.01, and 735 ss ~ 0.005 d–1, suggesting Type M or S behaviour. 736
(44) Based on these studies ruthenium associated with irradiated fuel fragments is 737 assigned to default Type M. 738 739 Rapid dissolution rate for ruthenium 740
(45) Following deposition in the respiratory tract of the most soluble forms studied 741 (chloride, oxalate and citrate), a rapid phase of dissolution was observed. Analysis here 742 suggested values of sr of the order of 10-100 d–1, but it was considered that there was 743 insufficient information to select a rapid dissolution rate, sr, for ruthenium different from the 744 general default value of 100 d–1, which is applied here to all Type F forms of ruthenium. 745 746 Extent of binding of ruthenium to the respiratory tract 747
(46) Following deposition in the respiratory tract of the most soluble forms studied 748 (citrate, chloride and oxalate), a rapid phase of dissolution was observed, but was incomplete. 749 The strongest evidence that the retention was at least partly due to binding to respiratory tract 750 tissues, rather than transformation to relatively insoluble particles, comes from studies of 751 inhaled RuO4. Long-term retention of a fraction of the ruthenium was observed throughout 752 the respiratory tract, but notably in the ET and conducting airways, from which most particles 753 are cleared rapidly. Autoradiographs showed that the ruthenium dispersion in the turbinates 754 and lymph nodes was relatively uniform: only single tracks were observed with no indications 755 of focal accumulation, supporting the view that the ruthenium was in a bound rather than 756

DRAFT REPORT FOR CONSULTATION: DO NOT REFERENCE
19
particulate form. Based on the results of a study of 106RuO4 inhaled by dogs (Snipes, 1981), 757 bound state parameter values for ruthenium of fb = 0.05 and sb = 0.1 d–1 were chosen here. 758
(47) There is experimental evidence that ruthenium in soluble form deposited in the 759 conducting airways is retained in a bound state. It is therefore assumed here that these bound 760 state parameter values apply throughout the respiratory tract (ET2, BB, bb and AI regions). 761 762
Table 2-2. Deposition and absorption for gas and vapour compounds of ruthenium 763 764
Chemical form/origin
Percentage deposited (%)a Absorptionb Total ET1 ET2 BB bb AI
fr sr (d–1) ss (d–1) Absorption from the alimentary tract, fA
Ruthenium tetroxide
100b 40 40 12 7 1 0.5 1 0.001 0.01
a Percentage deposited refers to how much of the material in the inhaled air remains in the body after 765 exhalation. Almost all inhaled gas molecules contact airway surfaces, but usually return to the air unless they 766 dissolve in, or react with, the surface lining. 767
b It is assumed that for ruthenium the bound fraction fb is 0.05 with an uptake rate sb = 0.1 d–1. 768 769 Table 2-3. Absorption parameter values for inhaled particulate forms of ruthenium and for 770 ingested ruthenium 771 772
Inhaled particulate materials
Absorption parameter valuesa
Absorption from the alimentary tract, fA fr sr (d–1) ss (d–1)
Default parameter valuesb,c Absorption Type
Assigned forms
F Chloride, oxalate 1 30 – 0.05 M Citrate, all unspecified formsd 0.2 3 0.005 0.01 S Dioxide 0.01 3 1x10⁻⁴ 5x10⁻⁴ Ingested material All chemical forms 0.05 a It is assumed that for ruthenium the bound fraction fb is 0.05 with an uptake rate sb = 0.1 d–1, and that this 773
applies throughout the respiratory tract (ET2, BB, bb and AI regions). The values of sr for Type F, M and S 774 forms of ruthenium (30, 3 and 3 d–1, respectively) are the general default values. 775
b Materials (e.g. ruthenium chloride) are listed here where there is sufficient information to assign to a default 776 absorption Type, but not to give specific parameter values (see text). 777
c For inhaled material deposited in the respiratory tract and subsequent cleared by particle transport to the 778 alimentary tract, the default fA values for inhaled materials are applied: i.e. the product of fr for the absorption 779 Type and the fA value for ingested soluble forms of ruthenium (0.05). 780
d Default Type M is recommended for use in the absence of specific information, i.e. if the form is unknown, 781 or if the form is known but there is no information available on the absorption of that form from the 782 respiratory tract. 783
784 2.2.2. Ingestion 785 786
(48) Measurements of the urinary and faecal excretion of ruthenium by a male volunteer 787 after ingestion of chloro-complexes of Ru(III) and Ru(IV), Ru-contaminated clams or nitrosyl 788 Ru(III) suggested that absorption was about 0.01 and perhaps somewhat greater for nitrosyl 789 Ru(III) (Yamagata et al, 1969). Studies by Veronese et al. (2003) and Giussani et al. (2008) 790 used stable isotopes for the determination of the absorption and retention of ruthenium in five 791

DRAFT REPORT FOR CONSULTATION: DO NOT REFERENCE
20
human subjects. They obtained absorption values of (7.5±1.2)·10-3 for inorganic ruthenium 792 (poorly complexed ruthenium), 0.039±0.005 for Ru-citrate, and <0.04 for Ru-ascorbate. 793
(49) Results from a number of studies of the absorption of 106Ru administered as the 794 chloride to mice, rats, rabbits, guinea pigs, chickens, cats, dogs and monkeys, including 795 values for fasted animals, were in the range of 0.02 - 0.06 (Burykina, 1962; Thompson et al, 796 1958; Furchner et al, 1971; Bruce and Carr, 1961; Stara et al, 1971). Values for 106Ru 797 administered as the oxide to rats and rabbits were in the range of 0.003 - 0.03. Bruce and Carr 798 (1961), Bruce (1963) measured the absorption of Ru administered in the form of nitrosyl 799 derivatives. Both nitrato and nitro- complexes of nitrosyl Ru are formed during dissolution in 800 nitric acid in the reprocessing or U fuels. The nitro-complexes are probably more important 801 because they are more resistant to hydrolysis in neutral and alkaline conditions. Results 802 obtained for the nitrato-nitrosyl complex in rats and rabbits were 0.06 and 0.13, respectively. 803 A value of 0.04 was reported for the absorption of Ru administered to rats as a nitro-nitrosyl 804 (Bruce, 1963). Stara et al. (1971) estimated absorption of Ru in cats given nitrosyl Ru 805 compounds as between 0.1 and 0.15. Cantone et al. (1994) used stable isotopes to estimate 806 absorption in a rabbit as 0.06. 807
(50) In Publication 30 (ICRP, 1980), an absorption value of 0.05 was recommended for 808 all chemical forms of Ru. This value was adopted in Publication 56 (ICRP, 1989) for dietary 809 intakes. In this report, the default assumption is an fA of 0.05. 810 811 2.2.3. Systemic Distribution, Retention and Excretion 812 813 2.2.3.1. Summary of the database 814 815 Data for human subjects 816
(51) Whole-body retention of ruthenium was measured in a healthy adult male who 817 ingested different chemical forms of 103Ru (T1/2 = 39.3 d) or 106Ru (T1/2 = 373.6 d) on 818 different occasions (Yamagata et al., 1969, 1971). Data for 103Ru indicated two retention 819 components with biological half-times of 2.3 d and 30 d. The early component may have 820 reflected unabsorbed activity, including activity bound in the intestinal mucosa as observed in 821 laboratory animals after oral administration of ruthenium (Nelson et al., 1962; Bruce et al., 822 1962; Stara et al., 1971). The longer-term behavior of 103Ru in the subject could not be 823 determined due to the short radiological half-life. Results from a later study on the same 824 subject using 106Ru suggested a retention component with half-time of about 9 d and a second 825 component with half-life 32 d. At longer times, the estimated biological half-time lengthened 826 with the period of observation: 81 d based on observations in the period 40-80 d after intake, 827 122 d at 80-150 d after intake, 158 d at 150-350 d after intake, and 385 d at 350-660 d after 828 intake. 829
(52) Veronese, Giussani, and coworkers measured the rate of disappearance of the stable 830 isotope 101Ru from blood plasma and its rate of urinary excretion following intravenous 831 injection into healthy volunteers (Veronese et al., 2001, 2003, 2004; Giussani et al., 2008). 832 Solutions with different degrees of complexation of ruthenium with citrate were injected in 833 different experiments. In all cases there was an initial rapid distribution of ruthenium 834 between plasma and the interstitial fluids. The subsequent pattern of disappearance from 835 plasma depended on the form administered. A relatively fast component of clearance was 836 followed by a relatively slow phase, but the ratio of the size of the fast and slow components 837 varied with the degree of complexation of ruthenium in the injected solution. The 838 investigators concluded that the fast and slow components represented ruthenium complexed 839

DRAFT REPORT FOR CONSULTATION: DO NOT REFERENCE
21
with citrate and inorganic ruthenium, respectively. The half-times of the fast and slow 840 components of clearance were estimated as 17 +/- 2 min (mean +/- standard deviation) and 23 841 +/- 2 h, respectively. The fast component represented an estimated 82 +/- 2% of the total for 842 solutions with highly complexed ruthenium and 17 +/- 2% for solutions with the lowest 843 degree of complexation. Urinary excretion of ruthenium was rapid following injection of 844 highly complexed ruthenium, with more than 40% of the injected amount excreted in urine 845 during the first 12 h and up to 70% over the first 2 d. Total excretion amounted to less than 846 25% of the injected amount over the first 48 h after administration of the solution with the 847 lowest degree of complexation. 848 849 Data for laboratory animals 850
(53) Furchner et al. (1964, 1971) investigated the systemic biokinetics of 106Ru in mice, 851 rats, monkeys, and dogs receiving 106RuCl3 orally or by intraperitoneal or intravenous 852 injection. For each species, whole-body retention data from injection studies were fit by a 853 sum of four exponential terms. Short- and intermediate-term retention as represented by the 854 first three terms was broadly similar in the four species. Long-term retention represented 855 about 17% (14.7-18.7%) of the injected amount in all four species, but corresponding 856 biological half-times were more variable: about 750 d in mice, 500 d in rats, 200 d in 857 monkeys, and 1500 days in dogs. The large differences in derived long-term half-times may 858 have been due in part to the different lengths of observation periods, e.g. 276 d for monkeys 859 and 970 d for dogs, but this does not fully explain the differences. 860
(54) Boecker and Harris (1969) investigated the behavior of 106Ru in beagles after acute 861 inhalation of 106Ru citrate. By a few days after intake the systemic burden represented the 862 preponderance of total-body activity although the concentration of 106Ru in the lungs 863 exceeded that in other tissues throughout the 512-day study. A sum of four exponential terms 864 fit to whole-body retention data paralleled a retention curve determined earlier by Furchner et 865 al. (1964) for dogs receiving 106RuCl3 by intravenous injection. As determined in one of the 866 dogs in the inhalation study, losses by urinary and faecal excretion were roughly the same 867 over the first three days, but thereafter daily urinary excretion generally was 3-7 times greater 868 than daily faecal excretion. 869
(55) Cumulative urinary excretion over the first 3 d after intravenous or intraperitoneal 870 injection of 106RuCl3 into monkeys, dogs, rats, and mice was 21.6-29.0% of the injected 871 amount (Furchner et al., 1971). Cumulative faecal excretion was more variable, ranging from 872 4.1% in dogs to 18.7% in mice. The urinary to faecal excretion ratio over the first three days 873 was 2.6 in monkeys, 5.5 in dogs, 2.2 in rats, and 1.6 in mice. 874
(56) In guinea pigs receiving 106RuCl3 by subcutaneous injection, about two-thirds of the 875 injected ruthenium was excreted in urine and faeces over the first 47 d (Burykina, 1962). The 876 urinary to faecal excretion ratio during that period was 2.7. 877
(57) In rats, cumulative urinary excretion over the first 60 d accounted for 53.8% of the 878 administered amount after intravenous injection and 51.8% after intraperitoneal injection of 879 106Ru as chlorides (Thompson et al., 1958). The urinary to faecal excretion ratio during the 880 same period was 2.8 for intravenous injection and 2.4 for intraperitoneal injection. 881
(58) Compared with intravenous or intraperitoneal injection data for ruthenium chlorides, 882 higher rates of urinary and faecal excretion have been estimated for activity absorbed to blood 883 after inhalation of 106Ru as ruthenium tetroxide vapor (RuO4) by rats (Runkle et al. (1980) or 884 dogs (Snipes, 1981). The systemic distribution of retained 106Ru was broadly similar to that 885 determined in injection studies involving other forms of ruthenium. 886
(59) The time-dependent distribution of ruthenium in systemic tissues and fluids has been 887
DRAFT REPORT FOR CONSULTATION: DO NOT REFERENCE
22
studied in several animal species including mice, rats, rabbits, hamsters, guinea pigs, and 888 dogs (Durbin et al., 1957; Thompson et al., 1958; Durbin, 1960; Bair et al., 1961; Bruce and 889 Carr, 1961; Nelson et al., 1962; Burykina, 1962; Bruce, 1963; Seidel et al., 1963; Boecker 890 and Harris, 1969; Furchner et al., 1971; Newton et al., 1976; Runkle and Snipes, 1978; 891 Runkle et al., 1980; Snipes, 1981). A relatively high concentration of ruthenium in blood is 892 indicated in some studies (Burykina, 1962; Newton and Latven, 1971; Snipes, 1981). Liver 893 and kidneys are important repositories for ruthenium in the early days and weeks following its 894 absorption to blood. Bone has been identified as an important long-term repository for 895 ruthenium in some studies (Thompson et al., 1958; Bair et al., 1961; Burykina, 1962; Boecker 896 and Harris, 1969). Reported fractions of systemic activity in liver, kidneys, and bone at any 897 given time after intake are variable. For example, the liver contained roughly 6% of the 898 administered activity at 2 d after intraperitoneal injection of 106Ru as chloride into rats 899 (Furchner et al., 1971) but about 19-26% of the absorbed activity at 1-3 days after 900 subcutaneous injection of 106Ru as chloride into guinea pigs (Burykina, 1962). Muscle and 901 skin generally show much lower concentrations than liver and kidneys, particularly at early 902 times after uptake to blood, but usually contain much or most of the systemic activity due to 903 their large mass (Burykina, 1962; Boecker and Harris, 1969; Furchner et al., 1971). Nelson et 904 al. (1962) concluded from an autoradiographic study of mice given 103Ru chloride by 905 intravenous injection that the distribution pattern of ruthenium is determined to a large extent 906 by its elevated uptake and retention in connective tissues. 907
(60) Thompson et al. (1958) concluded from studies of rats administered 106Ru chlorides 908 by different modes that activity was retained more tenaciously in bone tissue than in visceral 909 organs of rats and that deposition was greater in bone of young growing rats than in older 910 animals. After oral administration of ruthenium as nitrosyl-trinitrate to rabbits, the 911 concentration of ruthenium in bone was not uniform but highest in the ends of bones, 912 apparently associated with higher deposition in areas of better blood supply and possibly bone 913 growth (Bruce and Carr, 1961). Nelson et al. (1962) found in an autoradiographic study on 914 mice given 103Ru chloride by intravenous injection that the concentration of 103Ru was low in 915 cortical bone but that the epiphyseal plates had significant early uptake and the periosteal 916 layer had marked activity throughout the 32-day period of observation. In relatively long-917 term studies, activity in bone usually has represented a substantial portion of the systemic 918 content of ruthenium at times remote from intake (Thompson et al., 1958; Bair et al., 1961; 919 Burykina, 1962; Boecker and Harris, 1969), but there are exceptions. For example, in a study 920 on rats, activity in bone was estimated to represent at most 8.4% of systemic activity during 921 the first 283 d after intraperitoneal injection of 106Ru as chloride (Furchner et al., 1971). By 922 contrast, in guinea pigs receiving 106Ru as chloride by subcutaneous injection, activity in bone 923 was estimated to represent about 40% of the systemic activity at 50 d after administration. At 924 128-512 d after inhalation of 106Ru as citrate by dogs, activity in the skeleton represented 925 nearly 30% of the systemic activity as estimated from data for muscle, pelt, liver, kidneys, 926 and gastrointestinal tract. 927 928 2.2.3.2. Biokinetic model for systemic ruthenium 929 930
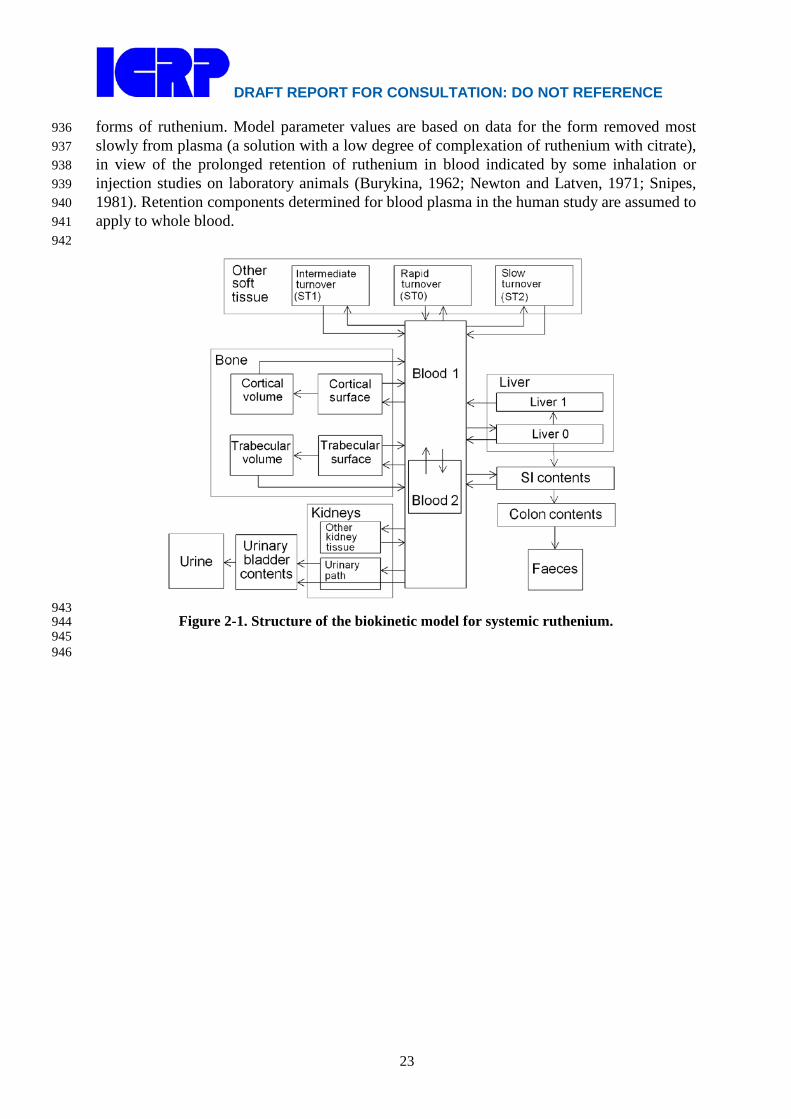
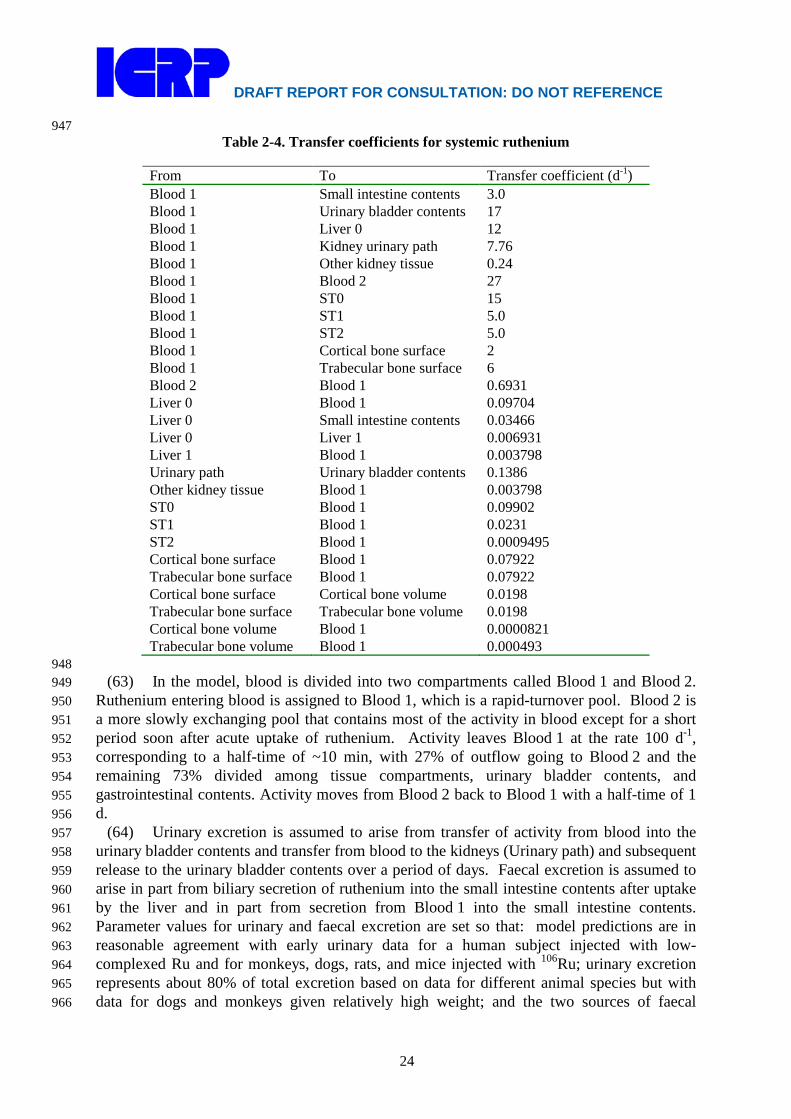
(61) The biokinetic model for systemic ruthenium is taken from a paper by Leggett 931 (2012). The model structure is shown in Figure 2-1. Transfer coefficients are listed in Table 932 2-4. 933
(62) The model for blood is based on data of Veronese et al. (2003, 2004) on the rate of 934 disappearance of ruthenium from blood plasma following intravenous injection of different 935
DRAFT REPORT FOR CONSULTATION: DO NOT REFERENCE
23
forms of ruthenium. Model parameter values are based on data for the form removed most 936 slowly from plasma (a solution with a low degree of complexation of ruthenium with citrate), 937 in view of the prolonged retention of ruthenium in blood indicated by some inhalation or 938 injection studies on laboratory animals (Burykina, 1962; Newton and Latven, 1971; Snipes, 939 1981). Retention components determined for blood plasma in the human study are assumed to 940 apply to whole blood. 941 942
943 Figure 2-1. Structure of the biokinetic model for systemic ruthenium. 944
945 946
DRAFT REPORT FOR CONSULTATION: DO NOT REFERENCE
24
947 Table 2-4. Transfer coefficients for systemic ruthenium
From To Transfer coefficient (d-1) Blood 1 Small intestine contents 3.0 Blood 1 Urinary bladder contents 17 Blood 1 Liver 0 12 Blood 1 Kidney urinary path 7.76 Blood 1 Other kidney tissue 0.24 Blood 1 Blood 2 27 Blood 1 ST0 15 Blood 1 ST1 5.0 Blood 1 ST2 5.0 Blood 1 Cortical bone surface 2 Blood 1 Trabecular bone surface 6 Blood 2 Blood 1 0.6931 Liver 0 Blood 1 0.09704 Liver 0 Small intestine contents 0.03466 Liver 0 Liver 1 0.006931 Liver 1 Blood 1 0.003798 Urinary path Urinary bladder contents 0.1386 Other kidney tissue Blood 1 0.003798 ST0 Blood 1 0.09902 ST1 Blood 1 0.0231 ST2 Blood 1 0.0009495 Cortical bone surface Blood 1 0.07922 Trabecular bone surface Blood 1 0.07922 Cortical bone surface Cortical bone volume 0.0198 Trabecular bone surface Trabecular bone volume 0.0198 Cortical bone volume Blood 1 0.0000821 Trabecular bone volume Blood 1 0.000493
948 (63) In the model, blood is divided into two compartments called Blood 1 and Blood 2. 949
Ruthenium entering blood is assigned to Blood 1, which is a rapid-turnover pool. Blood 2 is 950 a more slowly exchanging pool that contains most of the activity in blood except for a short 951 period soon after acute uptake of ruthenium. Activity leaves Blood 1 at the rate 100 d-1, 952 corresponding to a half-time of ~10 min, with 27% of outflow going to Blood 2 and the 953 remaining 73% divided among tissue compartments, urinary bladder contents, and 954 gastrointestinal contents. Activity moves from Blood 2 back to Blood 1 with a half-time of 1 955 d. 956
(64) Urinary excretion is assumed to arise from transfer of activity from blood into the 957 urinary bladder contents and transfer from blood to the kidneys (Urinary path) and subsequent 958 release to the urinary bladder contents over a period of days. Faecal excretion is assumed to 959 arise in part from biliary secretion of ruthenium into the small intestine contents after uptake 960 by the liver and in part from secretion from Blood 1 into the small intestine contents. 961 Parameter values for urinary and faecal excretion are set so that: model predictions are in 962 reasonable agreement with early urinary data for a human subject injected with low-963 complexed Ru and for monkeys, dogs, rats, and mice injected with 106Ru; urinary excretion 964 represents about 80% of total excretion based on data for different animal species but with 965 data for dogs and monkeys given relatively high weight; and the two sources of faecal 966
DRAFT REPORT FOR CONSULTATION: DO NOT REFERENCE
25
excretion contribute equally to endogenous faecal excretion of ruthenium, in the absence of 967 specific data on relative contributions of these sources. 968
(65) The distribution of ruthenium leaving blood is based to a large extent on the time-969 dependent distribution of ruthenium determined in laboratory animals, particularly dogs 970 because of the availability of relatively long-term data for dogs. In addition to the 27% of 971 outflow from Blood 1 assigned to Blood 2, outflow from Blood 1 is distributed as follows: 972 12% to Liver, 8% to Kidneys, 8% to Bone, 17% to the Urinary bladder contents, 3% to Small 973 intestine contents, and 25% to Other. Activity entering Liver is assigned to the rapid-turnover 974 liver compartment called Liver 0. Fractions 0.97 and 0.03 of activity entering Kidneys are 975 assigned to Urinary path and Other kidney tissue, respectively. Three-fourths of activity 976 entering bone is assigned to Trabecular bone surface and one-fourth to Cortical bone surface. 977 Activity entering Other (25% of outflow from Blood 1) is divided as follows: 15% to the 978 short-term retention compartment ST0; 5% to the intermediate-term compartment ST1, and 979 5% to the long-term retention compartment ST2. 980
(66) Biological half-times for compartments are set to reproduce different phases of loss 981 of ruthenium from the total body observed in laboratory animals and a human subject, and the 982 time-dependent distribution of systemic activity in dogs. Activity is removed from Liver 0 983 with a biological half-time of 5 d, with 25% going to the Small intestine contents (biliary 984 secretion), 5% to Liver 1, and 70% to Blood 1. Activity transfers from Liver 1 to Blood 1 985 with a half-time of 0.5 y. Activity transfers from Urinary path to Urinary bladder contents 986 with a half-time of 5 d and from Other kidney tissues to Blood 1 with a half-time of 0.5 y. 987 Activity in soft-tissue compartments ST0, ST1, and ST2 returns to Blood 1 with half-times of 988 7 d, 30 d, and 2 y, respectively. Activity leaves Cortical bone surface or Trabecular bone 989 surface with a half-time of 7 d, with 80% transferring to Blood 1 and 20% to the 990 corresponding bone volume compartment. Activity transfers from Cortical bone volume or 991 Trabecular bone volume to Blood 1 at the rate of bone turnover. 992
993 2.2.3.3. Treatment of radioactive progeny 994 995
(67) The radioactive progeny addressed in the derivation of dose coefficients for 996 ruthenium isotopes are all isotopes of rhodium or technetium. Rhodium and ruthenium have 997 similar chemical properties and appear from limited comparative data to have broadly similar 998 biokinetics in rats. Therefore, rhodium produced in systemic compartments by decay of 999 ruthenium is assigned the biokinetic model for ruthenium. Technetium atoms produced in a 1000 systemic compartment of the ruthenium model that is identifiable with a compartment of the 1001 characteristic model for technetium (i.e. the model applied in this report to technetium as a 1002 parent radionuclide) are assigned the characteristic model for technetium from their time of 1003 production. Technetium atoms produced in compartments of the ruthenium model that are 1004 ambiguous with regard to the characteristic model for technetium are assigned a transfer 1005 coefficient to the blood compartment of the technetium model, named Blood, and upon 1006 reaching Blood are assigned the characteristic model for technetium. For modeling 1007 convenience, the blood compartment of the technetium model is identified with the central 1008 blood compartment of the ruthenium model, named Blood 1. Technetium atoms produced in 1009 compartments of the liver, kidneys, or other soft tissues of the ruthenium model are assumed 1010 to transfer to Blood with a half-time of 1.6 d, the shortest removal half-time from other soft 1011 tissue in the technetium model. Technetium atoms produced in Blood 2 of the ruthenium 1012 model are assumed to transfer to Blood at the rate 1000 d-1, a default value used in this report 1013 to represent rapid biological removal. 1014

DRAFT REPORT FOR CONSULTATION: DO NOT REFERENCE
26
1015 2.3. Individual monitoring 1016 1017 106Ru 1018
(68) 106Ru is a beta emitter but it is by measured using the 0.512 and 0.622 MeV gamma 1019 rays from its short-lived daughter, 106Rh. Urine bioassay and/or Whole Body counting may be 1020 used to estimate the content of 106Ru internally deposited in the body. 1021 1022
Isotope Monitoring Technique
Method of Measurement
Typical Detection Limit
Achievable detection limit
106Ru Urine Bioassay γ-ray spectrometry of 106Rh
10 Bq/L 3 Bq/L
106Ru Whole Body Counting
γ-ray spectrometry of 106Rh
200 Bq 130 Bq
106Ru Lung Counting γ-ray spectrometry of 106Rh
42 Bq*
∗ Lung monitoring of 106Ru is not generally used in routine monitoring of workers. Monte Carlo program 1023 Visual Monte Carlo was used to simulate the photon emission, to calculate the calibration factor for the 1024 geometry and radionuclide, and to calculate the minimum detectable activity (MDA) in the lung. (Hunt et al, 1025 2012) 1026
1027 References 1028
1029 Bair, W.J., Willard, D.H., Temple, L.A., 1961. The behavior of inhaled 106RuO2 particles. Health 1030
Phys. 5:90-98. 1031 Boecker, B.B., Harris, A.M., 1969. Tissue distribution, excretion and dosimetry of inhaled 106Ru 1032
citrate in the beagle dog. In: Fission Product Inhalation Program Annual Report, 1968-1969. 1033 LF-41. pp. 111-116. Lovelace Foundation for Medical Education and Research, Albuquerque, 1034 New Mexico. Available from National Technical Information Service, Springfield, Virginia. 1035
Bruce, R.S., 1963. Some factors influencing the absorption, retention and elimination of ruthenium. 1036 In: Diagnosis and treatment of radioactive poisoning. Vienna:IAEA, pp. 207-244. 1037
Bruce, R.S., Carr, T.E.F., 1961. Studies in the metabolism of carrier-free radioruthenium - II. The 1038 uptake of nitrosyl-ruthenium complexes from the gastrointestinal tract. Reactor Science and 1039 Technology 14, 145-154. 1040
Bruce, R.S., Carr, T.E.F., Collins, M.E., 1962. Studies in the metabolism of carrier-free 1041 radioruthenium - III. The behavior of nitrosyl-ruthenium in the gastrointestinal tract. Health 1042 Phys. 8, 397-406. 1043
Burykina, L.N., 1969. On the problem of the toxicity of ruthenium-106 under repeated intratracheal 1044 administration to rats. In: Radioactive isotopes and the body, Moskalev, Yu. I., ed. Izdatel’stvo 1045 Medisina, Moscow. AEC-tr-7195, United States Atomic Energy Commission Division of 1046 Technical Information, pp. 388-396. 1047
Burykina, L.N., 1962. The metabolism of radioactive ruthenium in the organism of experimental 1048 animals. In: The Toxicology of Radioactive Substances, Vol. 1 (A.A. Letavel and E.P. 1049 Kurlyandsicaya, Eds.) pp 60-76. Pergamon Press, Oxford. 1050
Cantone, M.C., de Bartolo, D., Gambarini, G., Giussani, A., Ottolenghi, A., Pirola, L., Hansen, Ch., 1051 Roth, P., Werner, E., 1994. Proton nuclear activation in stable tracer technique for ruthenium 1052 metabolism studies. Nucl. Instrum. Methods Phys. Res., Sect. A. 353 (1-3), 440-443. 1053
Cuddihy, R.G., Finch, G.L., Newton, G.J., Hahn, F.F., Mewhinney, J.A., Rothenberg, S.J., Powers, 1054 D.A., 1989. Characteristics of radioactive particles released from the Chernobyl nuclear 1055 reactor. Environ. Sci. Technol. 23 (1), 89-95. 1056

DRAFT REPORT FOR CONSULTATION: DO NOT REFERENCE
27
Dobryakova, G.V., 1970. Dynamics of the removal of Te-127 and Ru-106 from rat lungs. In: 1057 Moskalev, Yu. I., Editor. Radioaktiv. Izotopy Vnesh. Srede Organizme. pp. 57-63. Moscow: 1058 Atomizdat. 1059
Durbin, P.W., 1960. Metabolic characteristics within a chemical family. Health Phys. 2:225-238. 1060 Durbin, P.W., Scott, K.G., Hamilton, J.G., 1957. Distribution of radioisotopes of some heavy metals 1061
in the rat. University of California (Berkely) Publ. Pharmocol. 3, 1-34. 1062 Furchner, J.E., Richmond, C.R., Drake, G.A., 1964. Ruthenium-106 in mice, rats, and dogs: 1063
Interspecies comparisons. LA-3132-MS, Los Alamos Scientific Laboratory, Los Alamos, NM, 1064 pp. 19-24. 1065
Furchner, J.E., Richmond, C.R., Drake, G.A., 1971. Comparative metabolism of radionuclides in 1066 mammal-VII. Retention of 106-Ru in the mouse, rat, monkey and dog. Health Phys. 21, 355-1067 365. 1068
Giussani, A., Cantone, M.C., Gerstmann, U., Greiter, M., Hertenberger, R., Höllriegl, V., Leopold, 1069 K., Veronese, I., Oeh, U., 2008. Biokinetics of ruthenium isotopes in humans and its 1070 dependence on chemical speciation. 12th International Congress of the International Radiation 1071 Protection Association, IRPA 12, Buenos Aires, Argentina, 19-24 October 2008 (Proceedings 1072 on CD). 1073
Hesp, R., Coote, J., 1970. Body radioactivity studies on a series of cases in which ruthenium-106 1074 oxide was inhaled. Health Safety Dep., U. K. At. Energy Auth., 1075 Sellafield/Seascale/Cumberland, Engl. U. K. At. Energy Auth., Prod. Group, PG Rep. No. 979 1076 W. 1077
Howells, H., Ward, F.A., Coulston, D.J., Woodhouse, J.A., 1977. In-vivo measurement and dosimetry 1078 of ruthenium-106 oxide in the lung. In: Proceedings of a symposium on the handling of 1079 radiation accidents. Vienna: International Atomic Energy Agency. IAEA-SM-215/54, pp. 83-1080 102. 1081
ICRP, 1980. International Commission on Radiological Protection. Limits on Intakes of 1082 Radionuclides for Workers. ICRP Publication 30, Pt.2. Pergamon Press, Oxford. Ann. ICRP 4, 1083 (3/4). 1084
ICRP, 1989. International Commission on Radiological Protection. Age-dependent Doses to 1085 Members of the Public from Intake of Radionuclides. Pt.1. ICRP Publication 56. Pergamon 1086 Press, Oxford. Ann. ICRP 20, (2). 1087
ICRP, 2002. Guide for the Practical Application of the ICRP Human Respiratory Tract Model. ICRP 1088 Supporting Guidance 3 Ann. ICRP, 32(1-2). 1089
Lang, S., Kosma, V.M., Kumlin, T., Halinen, A., Salonen, R.O., Servomaa, K., Rytomaa, T., 1090 Ruuskanen, J., 1994. Distribution and short-term effects of intratracheally instilled neutron-1091 irradiated UO2 particles in the rat. Environ. Res. 65 (1), 119-31. 1092
Mirell, S.G., Blahd, W.H., 1989. Biological retention of fission products from the Chernobyl plume. 1093 Health Phys. 57 (4), 649-52. 1094
Nelson, A., Ullberg, S., Kristoffersson, H., Ronnback, C., 1962. Distribution of radioruthenium in 1095 mice. Acta Radiol. 58, 53-360. 1096
Newton, G.J., Latven, R.K., 1971. Distribution and excretion in the beagle dog of 106Ru-Rh aerosols 1097 subjected to thermal degradation. In: Fission Product Inhalation Program Annual Report, 1970-1098 1971. LF-144. Albuquerque, NM: Lovelace Foundation, pp. 81-85. 1099
Newton, G.J., Servilla, P., Wagner, J., Boecker, B.B., 1975. Radiation dose patterns from 106Ru 1100 aerosols inhaled by Syrian hamsters. I. In: Inhalation Toxicology Research Institute Annual 1101 Report 1974-1975. LF-52. Albuquerque, NM: Lovelace Biomedical and Environmental 1102 Research Institute, pp. 75-78. 1103
Newton, G.J., Snipes, M.B., Boecker, B.B., Wagner, J.A., 1976. Radiation dose patterns from 106Ru 1104 aerosols inhaled by Syrian hamsters. II. Retention and distribution. In: Inhalation Toxicology 1105 Research Institute Annual Report 1975-1976. LF-56. Albuquerque, NM: Lovelace Biomedical 1106 and Environmental Research Institute, pp. 79-83. 1107
Pollanen, R., 1997. Highly radioactive ruthenium particles released from the Chernobyl accident: 1108
DRAFT REPORT FOR CONSULTATION: DO NOT REFERENCE
28
particle characteristics and radiological hazard. Radiat. Prot. Dosim. 71(1), 23-32 1109 Pusch, W.M., 1968. Determination of effective half-life of ruthenium-103 in man after inhalation. 1110
Health Phys. 15 (6), 515-17. 1111 Rundo, J., 1965. A case of accidental inhalation of irradiated uranium. Brit. J. Radiol. 38, 39–50. 1112 Runkle, G.E., Snipes, M.B., 1978. Dose patterns for 106RuO4 inhaled by Fischer-344 rats and beagle 1113
dogs. In: Inhalation Toxicology Research Institute Annual Report. LF-60. Albuquerque, NM: 1114 Lovelace Biomedical and Environmental Research Institute, pp. 55-60. 1115
Runkle, G.E., Snipes, M.B., McClellan, R.O., Cuddihy, R.G., 1980. Metabolism and dosimetry of 1116 inhaled 106RuO4 in Fischer-344 rats. Health Phys. 39, 543-553. 1117
Seidel, D., Catsch, A., Schweer, K.H., 1963. [Decorporation of radionuclides (studies on 1118 radioruthenium)] Strahlentherapie 122, 595-610. 1119
Snipes, M.B., 1981. Metabolism and dosimetry of ruthenium-106 inhaled as ruthenium-106 1120 tetraoxide by beagle dogs. Health Phys. 41 (2), 303-317. 1121
Snipes, M.B., Kanapilly, G.M., 1983. Retention and dosimetry of ruthenium-106 inhaled along with 1122 inert particles by Fischer-344 rats. Health Phys. 44 (4), 335-348. 1123
Snipes, M.B. Runkle, G.E., Sproul, S.M., 1977. Deposition, retention and dosimetry of inhaled 1124 ruthenium aerosols. In: Inhalation Toxicology Research Institute Annual Report, 1976-1977. 1125 LF-58, UC-48. Albuquerque, NM: Lovelace Biomedical and Environmental Research Institute, 1126 pp. 22-26. 1127
Stara, J.F., Nelson, N.S., Krieger, H.L., Kahn, B., 1971. Gastrointestinal absorption and tissue 1128 retention of radioruthenium. In: Skoryna, S. C., Waldron-Edward, D. Intestinal absorption of 1129 metal ions, trace elements and radionuclides. Oxford and New York: Pergamon Press, pp. 307-1130 318. 1131
Stuart, B.O., Gavin J.C., 1970. Long-term retention and translocation of inhaled 106Ru-106RhO2 in 1132 beagles. Pacific Northwest Lab. Report, BNWL-1050, 3.43-3.45. 1133
Thompson, R.C., Weeks, M.H., Hollis, L., Ballou, J.F., Oakley, W.D., 1958. Metabolism of 1134 radioruthenium in the rat. Am. J. Roentgen. 79, 1026-1044. 1135
Veronese, I., Cantone, M.C., Giussani, A., Maggioni, T., Birattari, C., Bonardi, M., Groppi, F., 1136 Garlaschelli, L., Werner, E., Roth, P., Höllriegl, V., Louvat, P., Felgenhauer, N., Zilker, Th., 1137 2003. Stable tracer investigations in humans for assessing the biokinetics of ruthenium and 1138 zirconium radionuclides. Rad. Prot. Dosim. 105, 209–212. 1139
Veronese, I., Giussani, A., Cantone, M.C., Birattari C., Bonardi M., Groppi, F., Höllriegl V., Roth, P., 1140 Werner, E., 2004. Influence of the chemical form on the plasma clearance of ruthenium in 1141 humans. App. Radiat. Isot. 60, 7-13. 1142
Veronese, I., Giussani, A., Cantone, M.C., De Bartolo, D., Roth, P., Werner, E., 2001. Kinetics of 1143 systemic ruthenium in human blood using a stable tracer. J. Radiol. Prot. 21:31-38. 1144
Webber, C. E., Harvey, J.W., 1976. Accidental human inhalation of ruthenium tetroxide. Health 1145 Phys. 30, 352-355. 1146
Yamagata, N., Iwashima, K., Iinuma, T.N., Watari, K., Nagai, T., 1969. Uptake and retention 1147 experiments of radioruthenium in man -I. Health Phys. 16, 159-166. 1148
Yamagata, N., Iwashima, K., Iinuma, T. A., Ishihara, T., Watari, K., 1971. Long-term retention of 1149 radioruthenium in man. Health Phys. 21:63. 1150
1151 1152
DRAFT REPORT FOR CONSULTATION: DO NOT REFERENCE
29
1153 3. Antimony (Z = 51) 1154
1155 3.1. Chemical Forms in the Workplace 1156 1157
(69) Antimony is a semi-metal or metalloid which mainly occurs in oxidation states III, 1158 IV and V. Antimony may be encountered in industry in a variety of chemical and physical 1159 forms, such as oxides, sulphides, chlorides, fluorides, tartrate and trihydride. It may also be 1160 encountered in two anionic forms which are (SbO2
-) and (SbO3-). 124Sb and 125Sb are fission 1161
products which may be associated with irradiated fuel or corrosion products. 125Sb also occurs 1162 as a neutron activation product of tin which may be present in reactor components containing 1163 zirconium. 1164 1165
Table 3-1. Isotopes of antimony addressed in this report 1166 1167
Isotope Physical half-life Decay mode Sb-115 32.1 m EC, B+ Sb-116 15.8 m EC, B+ Sb-116m 60.3 m EC, B+ Sb-117 2.80 h EC, B+ Sb-118m 5.00 h EC, B+ Sb-119 38.19 h EC Sb-120 15.89 m EC, B+ Sb-120m 5.76 d EC Sb-122 2.724 d B-, EC, B+ Sb-124a 60.20 d B- Sb-124n 20.2 m IT Sb-125a 2.759 y B- Sb-126 12.35 d B- Sb-126m 19.15 m B-, IT Sb-127 3.85 d B- Sb-128 9.01 h B- Sb-128m 10.4 m B-, IT Sb-129 4.40 h B- Sb-130 39.5 m B- Sb-131 23.03 m B- a Data for these radionuclides are given in the printed copy of this report. Data for other radionuclides are 1168
given on accompanying electronic disk. 1169 1170 3.2. Routes of Intake 1171 1172 3.2.1. Inhalation 1173 1174 Absorption Types and parameter values 1175 1176
(70) Information is available from experimental studies of antimony inhaled by laboratory 1177 animals as chloride, tartrate or oxide. Studies of workers occupationally exposed to stable 1178 antimony have been summarised by IARC (1989). Some information is also available on the 1179 behaviour of inhaled 125Sb in man. 1180
(71) Absorption parameter values and Types, and associated fA values for particulate 1181
DRAFT REPORT FOR CONSULTATION: DO NOT REFERENCE
30
forms of antimony are given in Table 3-2. 1182 1183 Antimony chloride 1184
(72) Djurić et al. (1962) followed the biokinetics of 124Sb after inhalation by rats of 1185 antimony chloride for 140 days. From the results, absorption parameter values calculated by 1186 the task group were fr ~ 1, and sr ~ 0.5 d–1. About 1% of the initial lung deposit (ILD) was 1187 retained in the lungs with a half-time of about 70 days, giving assignment to Type F. 1188 However, from about 2 weeks after intake the concentration of 124Sb in the blood was higher 1189 than that in the lungs, and hence the long-term lung retention observed may have been largely 1190 due to 124Sb in the blood. 1191 1192 Antimony tartrate 1193
(73) Felicetti et al. (1974b) followed the biokinetics of 124Sb after inhalation by hamsters 1194 of trivalent and pentavalent antimony tartrate aerosols (heat-treated at 100°C) for 32 days. In 1195 complementary experiments with the same materials, absorption in the GI tract was found to 1196 be only about 1%. In contrast, both forms showed similar, rapid absorption from the lungs: 1197 the authors noted that by 2 hours post exposure less than 1% of the initial body burden (IBB) 1198 remained in the lungs, indicating fr ~1, and sr >10 d–1. It was also noted that there was 1199 considerable faecal excretion and hence limited absorption in the upper respiratory tract, 1200 indicating sr <100 d–1. A central value for sr of 30 d–1 is adopted here. It was estimated here 1201 that about 1% of the of the ILD was retained in the lungs at 2 days and 0.1% ILD at 32 days, 1202 and calculated that fr ~0.99, and ss ~0.1 d–1, giving assignment to Type F. Although similar 1203 lung clearance was observed for the two forms, some differences in the systemic tissue 1204 distribution, e.g. between liver and skeleton, were noted. 1205
(74) Thomas et al. (1973) and Felicetti et al. (1974a) followed the biokinetics of 124Sb 1206 after inhalation, by mice and dogs respectively, of aerosols formed by heat-treating antimony 1207 tartrate droplets at various temperatures. For each aerosol, groups of mice were killed at 1208 intervals to 52 d, and one dog was killed at 32, 64 and 128 d. The chemical form of the 1209 antimony after heat treatment was not determined, but the aerosol treated at the lowest 1210 temperature (100°C) was referred to as tartrate. From the results in mice, it was estimated 1211 here that about 1% ILD was retained in the lungs at 2 days and 0.03% ILD at 32 days, and 1212 calculated that that fr ~0.99, and ss ~0.1 d–1 (as for the hamster study above). Insufficient 1213 information was given to estimate absorption parameter values in dogs, but at 32 d, 0.23% 1214 ILD was retained, giving assignment to Type F. 1215
(75) Although specific parameter values for antimony tartrate based on in vivo data are 1216 available, they are not adopted here, because inhalation exposure to it is unlikely. Instead, 1217 antimony tartrate is assigned to Type F. 1218 1219 Antimony oxides 1220
(76) Newton et al. (1994) measured the accumulation and retention of stable antimony 1221 trioxide (Sb2O3) in the lungs of rats during 13 weeks inhalation exposure and for 28 weeks 1222 after exposure. It was estimated here, from measurements in the group exposed to the lowest 1223 concentration (0.25 mg m–3), that the lung retention half-time was about 50 d, indicating Type 1224 M or S behaviour. 1225
(77) Groth et al. (1986) measured the accumulation of antimony in the lungs of rats after 1226 9 months of chronic inhalation exposure to stable Sb2O3. Concentrations in lungs were 1227 considerable higher than in any other tissue. It was estimated here that the lung retention half-1228 time was about 50 d, indicating Type M or S behaviour. 1229

DRAFT REPORT FOR CONSULTATION: DO NOT REFERENCE
31
(78) Rose and Jacobs (1969) followed whole-body retention of 124Sb for 300 d in one 1230 worker exposed to an aerosol, said to be oxide, resulting from activation of antimony 1231 contamination on a 60Co source. The authors assessed that during the period 10 d to 6 weeks, 1232 there was significant absorption and excretion in urine, but that subsequently the non-1233 transportable activity was retained in the lungs where it decreased only with the physical half-1234 life. This indicates that the overall behaviour might be Type M or S, but there is insufficient 1235 information to determine which. 1236
(79) Smelter workers exposed by inhalation to stable antimony trioxide and pentoxide 1237 showed a positive relationship between measured antimony lung content and period of 1238 employment such that there was about a tenfold increase for 40 y of employment (McCallum 1239 et al., 1971). This indicates that at least some of the material was retained in the lungs on a 1240 time-scale of years. Other workers with pulmonary changes related to exposure to antimony 1241 trioxide had measured urinary excretion of antimony in hundreds of μg/l both during and after 1242 employment (McCallum, 1963). This indicates that there is also significant absorption of 1243 antimony from the material in the lungs. Although the human data suggest possible Type M 1244 and S behaviour, the paucity of results do not provide a basis for firmer classification. 1245 1246 Antimony sulphide 1247
(80) Groth et al. (1986) measured the accumulation of antimony in the lungs of rats after 1248 9 months of chronic inhalation exposure to stable antimony ore concentrate, which is 1249 principally antimony trisulphide (stibnite) Sb2S3. Concentrations in lungs were considerable 1250 higher than in any other tissue. It was estimated here that the lung retention half-time was 1251 about 20 d, indicating Type M behaviour. Compared to rats exposed to oxide in a similar 1252 study (see above), the lung concentrations were lower, but concentrations in other tissues 1253 were similar, suggesting that the sulphide dissolved faster in the lungs than the oxide. 1254 1255 Other compounds 1256
(81) As noted above, Thomas et al. (1973) and Felicetti et al. (1974a) followed the 1257 biokinetics of 124Sb following inhalation, by mice and dogs respectively, of aerosols formed 1258 by heat-treating droplets of antimony tartrate aerosols at various temperatures. The chemical 1259 form of the antimony after heat treatment was not determined, but the higher temperatures, 1260 500°C and ~1,000°C, were expected to result in an oxide form (Felicetti et al, 1974a). From 1261 the results in mice, it was estimated here that for aerosols formed at both the higher 1262 temperatures (500°C and 1,100°C) ~5% ILD was retained in the lungs at 2 days and ~1% ILD 1263 at 32 days, and it was calculated that fr ~0.95, sr ~3 d–1, and ss ~0.03 d–1. Absorption was thus 1264 considerably slower than for the tartrate aerosols formed at 100°C, but still gave assignment 1265 to Type F. Insufficient information was given to estimate absorption parameter values in 1266 dogs, but at 32 d after inhalation of the aerosols formed at the higher temperatures (500°C and 1267 1,000°C), 25% and 5% ILD was retained in the lungs, giving assignment to Types M and F 1268 respectively. 1269
(82) Garg et al. (2003) followed whole-body retention of 125Sb for 200–2400 d in seven 1270 workers exposed to an aerosol (probably oxide) produced by saw-cutting of an irradiated 1271 zirconium alloy pressure tube. Detailed measurements indicated that most of the retained 1272 activity was in the lungs, even at a year after intake. The authors assessed that lung retention 1273 at 180 days after intake was 58-91% of the initial alveolar deposit (estimated from the lung 1274 content at 7 d after intake), giving assignment to Type S in each person. However, as the 1275 125Sb and parent tin were presumably minor constituents of the zirconium alloy, the particle 1276 matrix might well have been predominantly oxides of other metals (and/or the metals 1277

DRAFT REPORT FOR CONSULTATION: DO NOT REFERENCE
32
themselves), notably zirconium, which has a highly insoluble oxide (see zirconium section). 1278 1279 Rapid dissolution rate for antimony 1280
(83) Evidence from the antimony tartrate studies outlined above suggests a rapid 1281 dissolution rate of the order of 30 d–1, which is applied here to all Type F forms of antimony. 1282 1283 Extent of binding of antimony to the respiratory tract 1284
(84) Evidence from the antimony tartrate studies outlined above suggests that following 1285 the rapid phase of absorption only about 1% of the ILD clears relatively slowly from the 1286 lungs. There is no evidence available that clearance of this material is mainly by absorption to 1287 blood, as assumed for material in the ‘bound state’. It is therefore assumed that for antimony 1288 the bound state can be neglected, i.e. fb = 0.0. 1289
1290 Table 3-2. Absorption parameter values for inhaled and ingested antimony 1291
1292
Inhaled particulate materials
Absorption parameter valuesa
Absorption from the alimentary tract, fA fr sr (d–1) ss (d–1)
Default parameter valuesb,c Absorption Type
F Chloride, tartrate 1 30 – 0.05 M Trioxide, all unspecified
formsd 0.2 3 0.005 0.01
S — 0.01 3 1x10⁻⁴ 5x10⁻⁴ Ingested materials All forms 0.05
a It is assumed that for antimony the bound state can be neglected, i.e. fb = 0.0. The values of sr for Type F, M 1293 and S forms of antimony (30, 3 and 3 d–1, respectively) are the general default values. 1294
b Materials (e.g. antimony chloride) are generally listed here where there is sufficient information to assign to a 1295 default absorption Type, but not to give specific parameter values (see text). 1296
c For inhaled material deposited in the respiratory tract and subsequent cleared by particle transport to the 1297 alimentary tract, the default fA values for inhaled materials are applied: i.e. the product of fr for the absorption 1298 Type and the fA value for ingested soluble forms of antimony (0.05). 1299
d Default Type M is recommended for use in the absence of specific information, i.e. if the form is unknown, 1300 or if the form is known but there is no information available on the absorption of that form from the 1301 respiratory tract. 1302
1303 3.2.2. Ingestion 1304 1305
(85) No controlled studies on antimony absorption in humans have been carried out, 1306 though an accidental exposure to antimony-containing dust (Rose and Jacobs, 1969) 1307 demonstrated absorption to be less than 0.05. Results from experiments using female rhesus 1308 monkeys suggest that the absorption of Sb administered as tartar emetic (antimony potassium 1309 tartrate) was about 0.3 (Waitz et al, 1965) while comparable studies with rats gave lower 1310 values of about 0.05 for this compound (Moskalev, 1964). Most studies performed on 1311 different chemical forms of Sb(III) and Sb(V) indicated that intestinal absorption was not 1312 usually greater than 0.01 (Rose and Jacobs, 1969; Thomas et al, 1973; Felicetti et al, 1974b), 1313 whereas Gerber et al. (1982) found a value of 0.07 for Sb(III) in pregnant mice. Chertok and 1314

DRAFT REPORT FOR CONSULTATION: DO NOT REFERENCE
33
Lake (1970) reported that, for dogs fed with 122Sb in debris from a sub-surface nuclear test 1315 site, absorption was at least 0.04. Results obtained by Van Bruwaene et al. (1982) for the 1316 excretion of 124Sb after oral administration as the chloride, compared with data for 1317 intravenous injection, suggested absorption greater than 0.02. Inaba et al. (1984) administered 1318 125Sb to rats, either mixed with blood or biologically incorporated into blood cells and 1319 reported absorption of about 0.01 and 0.5, respectively. 1320
(86) In Publication 30 (ICRP, 1981), the recommended absorption values were 0.1 for 1321 antimony in tartar emetic and 0.01 for all other forms. In Publication 69 (ICRP, 1995), a 1322 value of 0.1 was applied to dietary intakes. Because of the variability of the data, a single fA 1323 value of 0.05 is recommended here for all situations where specific information is not 1324 available. 1325 1326 3.2.3. Systemic Distribution, Retention and Excretion 1327 1328 3.2.3.1. Summary of the database 1329 1330
(87) The biokinetics of antimony in the human body is not well characterized despite a 1331 long history of therapeutic use of stable antimony and a number of bioassay studies on 1332 workers exposed to known levels of stable antimony in air. Subjects administered antimony 1333 compounds for therapeutic purposes generally have received large masses of antimony 1334 compared with the estimated normal body content. It is uncertain whether the biokinetic data 1335 for these subjects reflect normal biokinetics of antimony, but comparative data for different 1336 masses of administered antimony do not reveal a mass effect on the excretion rate. 1337
(88) Antimony occurs in nature either in the trivalent or pentavalent state, with the 1338 trivalent state being the more common and more stable. Trivalent and pentavalent antimony 1339 initially show different biokinetics after entering the systemic circulation. For example, 1340 Sb(III) is excreted in urine at a lower rate and accumulated by red blood cells at a higher rate 1341 than Sb(V) in the first day or two after intravenous or intramuscular injection. There is 1342 evidence of some reduction of Sb(V) to Sb(III) in vivo and convergence of the systemic 1343 biokinetics of these two initial forms over time, but data on the rate and extent of conversion 1344 of Sb(V) to Sb(III) are inconsistent. 1345
(89) Information on the time dependent distribution of systemic antimony comes mainly 1346 from animal studies. Some species dependence in the behavior of antimony is indicated. For 1347 example, rats have shown much higher accumulation of antimony in red blood cells (RBC) 1348 than mice, dogs, or human subjects. The collective animal data indicate rapid early loss of 1349 absorbed or injected antimony in urine and concentration of much of the retained antimony in 1350 the liver, skeleton, and skin or pelt. The longest observed biological half-times for systemic 1351 antimony have varied from several days to a few months. Study periods generally have been 1352 too short to detect any small long-term component of retention. 1353 1354 Human subjects 1355
(90) Boyd and Roy (1929) compared the rate of excretion of antimony by patients 1356 following intravenous administration of Sb(III) as antimony sodium tartrate and Sb(V) as 1357 ethylstibamine. Following injection of Sb(III) about 2.5% of the antimony was excreted from 1358 0-24 h, 2% from 24-48 h, and 1% or less from 48-72 h. Following injection of Sb(V) about 1359 19% of the antimony was excreted in urine from 0-2.5 h, 41% from 0-24 h, 6% from 24-48 h, 1360 and 1.25% from 48-72 h. Thereafter, daily excretion remained at 1% or less through day 13 1361 following injection. Intramuscular injection of the Sb(V) compound produced a slightly 1362
DRAFT REPORT FOR CONSULTATION: DO NOT REFERENCE
34
lower excretion rate over the first two days than intravenous injection of the same compound. 1363 (91) Khalil (1931) examined urine, faeces, sweat, milk, and sputum as routes of excretion 1364
of antimony in subjects undergoing treatment with Sb(III) as antimony potassium tartrate or 1365 stibophen. Urine and faeces appeared to be the only significant routes of excretion. During 1366 the 45-d observation period about 45-50% of administered antimony was excreted in urine 1367 and about 3.5% was excreted in faeces. 1368
(92) Goodwin and Page (1943) measured urinary excretion of stable antimony by human 1369 subjects from 1-48 h after intravenous or intramuscular injection of Sb(III) as stibophen or 1370 intravenous injection of Sb(V) as sodium stibogluconate. Cumulative urinary excretion at 24 1371 and 48 h after injection of Sb(III) was 20.4 +/- 2.2% (mean +/- standard deviation) and 23.9 1372 +/- 3.6%, respectively, after intravenous injection and 24.0 +/- 9.9% and 26.5 +/- 12.0%, 1373 respectively, after intramuscular injection. A fivefold difference in the mass of antimony 1374 administered intravenously (42.5 mg versus 8.5 mg) had little if any effect on the excretion 1375 rate. Total urinary excretion of antimony over the first 48 h after administration of Sb(V) was 1376 83 +/- 6% of the injected amount. The portion of antimony excreted as Sb(III) after 1377 administration of Sb(V) was low and variable (1.1-7.6%) over the first 6 h but rose to 50-56% 1378 at 28-48 h, indicating gradual conversion of Sb(V) to S(III) in the body. 1379
(93) Following intravenous infusion of Sb tartar emetic (KSb(III) tartrate) to eight male 1380 African soldiers suffering from schistosomiasis, 21±4% (range 18-23%) of the dose was 1381 excreted in the urine within 72 h (Alves and Blair, 1946). 1382
(94) Bartter et al. (1947) investigated the biokinetics of Sb(III) in seven volunteers 1383 receiving 124Sb tartar emetic by intravenous injection. More than 90% of the injected activity 1384 was removed from blood within 30 min after injection. Thereafter the blood content declined 1385 much more gradually. During the first day urinary and faecal excretion averaged 10.5 +/- 1386 1.9% and 1.5 +/- 0.4%, respectively, of the administered amount. During the first five days 1387 urinary and faecal excretion averaged 21.2 +/- 4.6% and 4.4 +/- 1.3%, respectively. Urinary 1388 and faecal excretion of antimony measured in one subject over the first 27 d accounted for 1389 66% and 7%, respectively, of the administered amount. The removal half-time from the body 1390 in this subject was about 14 d between 1 and 27 days after injection. Based on 44 individual 1391 daily measurements of excreta from all seven subjects, the mean daily urinary to faecal 1392 excretion ratio was 6.8 (range 0.6-25.8). 1393
(95) Otto et al. (1947) determined antimony levels in blood plasma, red blood cells, and 1394 urine of 14 patients after intramuscular injection of trivalent antimony compounds 1395 (anthiolimine or monosodium antimony thioglycollate) or pentavalent antimony compounds 1396 (antimony sodium gluconate or ethylstibamine). Trivalent antimony showed five-fold higher 1397 concentrations in red blood cells than plasma within the first 24 h after injection. Pentavalent 1398 compounds showed much lower affinity than trivalent compounds for red blood cells. 1399 Average 24-h urinary excretion of antimony was lower for trivalent compounds (11.4% for 1400 anthiolimine and 8.1% for monosodium antimony thioglycollate) than pentavalent 1401 compounds (43% for antimony sodium gluconate and 17% for ethylstibamine). 1402
(96) Abdallah and Saif (1962) reported studies in which 25 male volunteers were given 1403 sodium 124Sb(III)-dimercaptosuccinate (124Sb-DMSA) by intramuscular or intravenous 1404 injection. Following intramuscular injection, cumulative excretion accounted for about 25% 1405 of administered 124Sb after 1 d, 50% after 15 d, and 68% after 32 d. Following intravenous 1406 injection, cumulative excretion accounted for about 35% of the administered 124Sb after 1 d 1407 and 63% after 4 d. External measurements indicated relatively high accumulation of activity 1408 in the liver. The liver content peaked about 2 d after injection. Two components of retention 1409 in the liver are indicated by a plot of the measurements. Approximately 80-85% of the peak 1410
DRAFT REPORT FOR CONSULTATION: DO NOT REFERENCE
35
content was removed with a half-time of a few days and the remaining 15-20% had a much 1411 longer retention time that could not be quantified over the relatively short observation period. 1412
(97) Taylor (1966) reported measurements of antimony in the urine of workers who had 1413 inhaled SbCl3. The data are too sparse to allow a detailed analysis but indicate rapid 1414 elimination of absorbed antimony in urine. 1415
(98) Rose and Jacobs (1969) reported a case of acute inhalation of a relatively insoluble 1416 form of 124Sb by a worker in a nuclear research facility. The intake could not be estimated 1417 with much accuracy by whole-body counting during the first day due to surface contamination 1418 of the worker’s body. During the first 10 d after intake the authors estimated total faecal 1419 excretion to be about 1000 times total urinary excretion of 124Sb. The rate of urinary 1420 excretion of 124Sb declined rapidly over the first few days after the incident. In the early 1421 weeks after the incident the effective half-life of 124Sb in the body was approximately 30 d, 1422 corresponding to a biological half-time of ~60 d. In later months the effective half-life was 1423 about the same as the radiological half-life of 124Sb (~60 d), indicating little biological 1424 removal of 124Sb from the body. The authors interpreted the data as indicating removal of 1425 “transportable material in the tissue” with an effective half-time of 30 d during the early 1426 weeks after the incident and much slower removal of non-transportable material from the 1427 lungs at later times. 1428
(99) Rees et al. (1980) measured the time-dependent concentrations of antimony in blood 1429 plasma and urine of human subjects following intravenous injection of Sb(V) as sodium 1430 stibogluconate. The data indicate three phases of removal of antimony from blood plasma, 1431 with half-times of 0.2 h (71%), 1.4 h (28%) and 6.9 h (1%). Following intramuscular 1432 injection the plasma clearance from 1 to 24 h appeared to be exponential with a biological 1433 half-time of ~2.5 h. The renal clearance rate of antimony approximated the glomerular 1434 filtration rate. More than 90% of administered antimony was excreted in urine in the first 8 h 1435 after intravenous or intramuscular injection. 1436
(100) Chulay et al. (1988) studied blood clearance of antimony in two patients given Sb(V) 1437 as sodium stibogluconate and three patients given Sb(V) as meglumine antimoniate. All 1438 patients were injected intramuscularly with 10 mg Sb/kg daily for 20 d. The two drugs 1439 showed similar biokinetics in blood, with peak blood concentrations appearing about 2 h after 1440 the initial injection. In both cases the blood content of antimony could be described by a 1441 three-term exponential model representing an initial absorption phase with a half-time of 0.85 1442 h followed by a rapid elimination phase with a mean half-time of 2 h and a slower phase with 1443 a mean half-time of 76 h. 1444
(101) Bailly et al. (1991) reported the case of a woman who attempted suicide by ingestion 1445 of an unknown amount of Sb(III) as antimony trisulphide (Sb2S3, stibnite). Only a small 1446 fraction of the intake was absorbed from the gastrointestinal tract. The concentration of 1447 antimony in blood was measured over a period of about 130 h after intake. The blood 1448 concentration peaked at ~4 h post intake and thereafter decreased bi-exponentially, with 1449 estimated biological half-times of ~2.6 h (60%) and 210 h (40%). The urinary excretion rate 1450 peaked about 20 h after intake and declined with a half-time of about 46 h over the next 6 d. 1451 The concentration of antimony in liver bile peaked about 3 h after intake and from 3-60 h 1452 decreased with a half-time of about 12 h. Interpretation of the data for this subject is 1453 complicated by the fact that efforts were made to remove antimony from the body by forced 1454 diuresis, repeated gastric lavage, and chelation therapy. 1455
(102) Bailly et al. (1991) studied the urinary excretion of antimony in 22 workers 1456 employed in the production of the Sb(V) compounds antimony pentoxide and sodium 1457 antimoniate. The rate of urinary excretion of antimony during an 8-h shift was highly 1458

DRAFT REPORT FOR CONSULTATION: DO NOT REFERENCE
36
correlated with the concentration of antimony in air during the same period, indicating 1459 absorption and rapid removal of a portion of inhaled antimony in urine. Exposure to airborne 1460 antimony at a concentration of 500 μg/m3 was estimated to lead to an increase in urinary 1461 antimony of 35 μg Sb/g creatinine during an 8-h shift. 1462
(103) Kentner et al. (1995) studied occupational exposure to two antimony compounds that 1463 occur in the production of lead batteries: Sb2O3 in the casting of grids, and SbH3 in the 1464 formation of lead plates. The concentration of antimony was measured in air in the grid-1465 casting area and formation area and in blood and urine of seven workers from the grid-casting 1466 area and 14 workers from the formation area. Comparisons of the concentrations of antimony 1467 in air and in blood and urine of the workers suggest similar biokinetics of the two forms of 1468 inhaled antimony. At the end of the work shifts the median concentration of antimony in air 1469 was 4.5 (1.18-6.6) μg Sb/m3 in the casting area and 12.4 (0.6-41.5) μg Sb/m3 in the formation 1470 area. The median blood concentrations in pre-shift samples was 2.6 (0.5-3.4) μg Sb/L for the 1471 casting area and 10.1 (0.5-17.9) μg Sb/L for the formation area. The average concentration of 1472 antimony in urine was 3.9 (2.8-5.6) μg Sb/g creatinine for the casting area and 15.2 (3.5-23.4) 1473 μg Sb/g creatinine for the formation area. 1474
(104) Luedersdorf et al. (1987) determined levels of antimony in blood and urine of 109 1475 workers exposed to the oxide of trivalent antimony (Sb2O3) in the glass-producing industry. 1476 Workers were divided into four groups with different tasks and different levels of exposure to 1477 antimony. The concentration ratio of antimony in urine (median value in μg/ml) to antimony 1478 in blood (median value in μg/ml) was 1.9 for all 109 workers and varied from 1.1 to 4.5 for 1479 the four groups. 1480
(105) Liao et al. (2004) determined levels of five metals including antimony in blood and 1481 urine of 103 optoelectronic workers. The concentration ratio of antimony in urine (median 1482 value in parts per billion) to antimony in blood (median value in parts per billion) was 2.5 for 1483 all 103 workers and varied from 2.2 to 4.7 for three different groups of workers with different 1484 tasks and levels of exposure. 1485
(106) The stable antimony content of human tissues has been determined in a number of 1486 occupationally or non-occupationally subjects (Smith, 1967; ICRP, 1975; Sumino et al., 1487 1975; Iyengar et al., 1978; Lindh et al., 1980; Gerhardsson et al., 1982; Coughtrey and 1488 Thorne, 1983). The reported contents of individual tissues as well as relative contents of 1489 different tissues are variable, but the data together with estimates of intake of antimony 1490 suggest the existence of long-term components of retention of antimony in bone and soft 1491 tissues. Coughtrey and Thorne (1983) estimated on the basis of reported tissue 1492 concentrations that bone typically contains about 55% of the total-body content of stable 1493 antimony. Newer data from Zhu et al. (2010) on the antimony content of tissues from 1494 Chinese males suggest a skeletal content of about 28% of the total body content. Data of 1495 Gehardsson et al. (1982) for deceased smelter workers indicate that the total antimony content 1496 of liver typically was an order of magnitude greater than that of the kidneys. This conclusion 1497 is reported by the data of Zhu et al. (2010) for Chinese males. 1498 1499 Animal studies 1500
(107) Goodwin and Page (1943) studied urinary excretion of antimony by mice following 1501 subcutaneous, intravenous, or intramuscular injection of one of three Sb(III) compounds 1502 (stibophen, KSb-tartrate, or anthiomaline) or one of five Sb(V)- compounds (NaSb-gluconate, 1503 stibamine glucoside, neostibosan, urea-stibamine, or stibacetin). For all compounds and all 1504 exposure routes, urinary excretion over the first 48 hours accounted for 50-82% of the 1505 administered antimony. 1506

DRAFT REPORT FOR CONSULTATION: DO NOT REFERENCE
37
(108) Brady et al. (1945) reported that in four dogs the urinary excretion of radioactive 1507 Sb(III) over 36 h after intravenous injection with Sb tartar emeric was 14±8% (range 4 -21%). 1508 The urinary excretion in one dog injected intravenously with Sb(III) as sodium antimonyl 1509 xylitol was 13.7% in 36 h. 1510
(109) At four days after intramuscular injection of rats with 122,124Sb as HSbO3, blood and 1511 bone contained 2% and 0.9%, respectively, of the injected activity (Durbin, 1960). The liver, 1512 kidneys, and muscle each contained 0.1% or less of the injected amount. Urinary excretion 1513 accounted for 96.5% of total excretion over the four-day period. 1514
(110) Djuric et al. (1962) studied the distribution and excretion of 124Sb in rats after 1515 inhalation of an aerosol of 124SbCl3 Two rabbits and one dog were administered intratracheal 1516 doses of the same compound for comparison. Rapid early loss from the rat lung was followed 1517 by slower loss with a half-time on the order of 100 d. The primary site of accumulation of 1518 absorbed 124Sb in rats was the red blood cells. Such high accumulation in red blood cells was 1519 not evident in the rabbits or dog. 1520
(111) Moskalev (1964) administered 124Sb tartrate emetic to rats by oral or intravenous 1521 administration of 124Sb. The liver and skeleton were found to be important repositories for 1522 antimony over the first 8 d following either route of administration, but the division of 1523 activity between these two organs depended strongly on the route of administration. 1524 Comparison with earlier results by the same author indicated that the distribution following 1525 intravenous administration also depended strongly on the physicochemical state of antimony 1526 in the initial solution. 1527
(112) In mice receiving 124Sb-KSb tartrate by intraperitoneal injection, about 80% of the 1528 administered amount was excreted the first day and 99% during the first three weeks 1529 (Rowland, 1968). The concentration of 124Sb in blood decreased by a factor of ~20 from 15 1530 min to 6 h after injection and by a factor of ~2 from 6 h to 24 h after injection. Loss of 1531 activity from the liver was slower than from the rest of the body but dropped to 0.5-1% of its 1532 peak value after 21 d. 1533
(113) Thomas et al. (1973) exposed three groups of mice to 124Sb aerosols in a system that 1534 yielded head-only exposures. The aerosols were produced from a starting solution of Sb 1535 tartrate but were formed at different temperatures for each group: 100, 500, or 1100 °C. The 1536 activity contained in the material formed at the lowest temperature cleared from the lungs 1537 soon after deposition and deposited primarily in bone, which was estimated to receive a much 1538 higher radiation dose than the lungs in this case. The activity in the material formed at the 1539 two higher temperatures was retained in the lungs for a longer period but gradually 1540 accumulated to a large extent in bone, although the lung was estimated to receive a much 1541 higher radiation dose than bone in this case. In all three groups the portion of the body burden 1542 found in the pelt excluding the head increased from ~7% at 1 d to ~25% at 52 d after 1543 exposure. 1544
(114) Felicitte et al. (1974a) investigated the biokinetics of trivalent and pentavalent 124Sb 1545 over 32 d following inhalation of relatively soluble aerosols by Syrian hamsters. Whole-body 1546 clearance of both aerosols occurred in two phases. More than 90% of the initial body burden 1547 was eliminated over the first 7 d after exposure. The remaining activity was eliminated with a 1548 biological half-time of about 16 d. No significant difference in excretion patterns was 1549 observed between the two aerosols. Systemic activity was found mainly in liver, skeleton, 1550 and skin (shaved pelt). Activity in liver generally was higher after inhalation of the trivalent 1551 then the pentavalent 124Sb, but the opposite pattern was seen for bone. In blood, 124Sb inhaled 1552 in the trivalent form was concentrated in the RBC at all sampling times, with maximum RBC 1553 concentration of 6-10 times the plasma concentrations at approximately 24 h after exposure. 1554

DRAFT REPORT FOR CONSULTATION: DO NOT REFERENCE
38
For activity inhaled in the pentavalent form, concentrations were greater in plasma than RBC 1555 in the early hours after exposure, but the RBC to plasma ratio converged over the first day to 1556 that seen for inhaled trivalent 124Sb. 1557
(115) Felicitte et al. (1974b) studied the biokinetics of inhaled 124Sb in groups of beagle 1558 dogs exposed to trivalent 124Sb aerosols formed at different temperatures (100, 500, or 1000 1559 °C). Particle sizes were 1.3, 1.0, and 0.3 μm AMAD, respectively, for aerosols formed at 1560 these three temperatures. Much of the activity inhaled in the aerosol generated at 100 °C 1561 cleared rapidly from the lungs and was excreted in urine at a high rate. Activity inhaled in the 1562 aerosols formed at higher temperatures was cleared more slowly from the lungs, and the 1563 urinary to faecal excretion rate was much lower at early times than for the aerosol formed at 1564 100 °C. For example, urinary excretion of 124Sb was at least 7 times as great as faecal 1565 excretion over the first 24 h following inhalation of the aerosol formed at 100 °C, compared 1566 with a urine to faeces ratio of about 0.4 over the same period for the aerosol formed at 500 1567 °C. From 1-32 d post exposure the urinary to faecal excretion ratio was not significantly 1568 different for the three aerosols. From 1-21 d post exposure the concentration of 124Sb in RBC 1569 was on average 6.7 times that in plasma. Average long-term biological half-lives for total-1570 body 124Sb were 100, 36 and 45 d for 124Sb inhaled in aerosols formed at 100, 500, and 1000 1571 °C, respectively. Systemic activity was found mainly in liver, skeleton, and pelt. 1572
(116) Van Bruwaene et al., (1982) studied the urinary and faecal excretion of inorganic 1573 124,125Sb by lactating cows after oral or intravenous administration. During a 70-d period after 1574 intravenous injection about 51% of the administered amount was excreted in the urine and 1575 2.4% was excreted in faeces. Almost 16% of the injected amount was found in tissues at 70 1576 d, but most of this was found in the heart and presumed to have resulted from deposition of 1577 antimony in blood vessels near the injection site as had been observed in an earlier animal 1578 study with antimony. Different systemic distributions were found for the two exposure routes. 1579 Excluding the deposit in the heart, activity retained at 70 d was found mainly in the liver 1580 (69% of the body burden), skeleton (7.1%), muscle (7.0%), skin (6.7%), and spleen (6.4%). 1581 At 102 days after oral administration the retained activity was found mainly in the skin (43% 1582 of the body burden), skeleton (30%), muscle (10%), and liver (7.3%). The high content of 1583 antimony in liver and spleen following intravenous injection may have been due to uptake 1584 and retention of colloidal antimony. 1585
(117) Bailly et al. (1991) studied the urinary and faecal excretion of Sb(III) by rats after 1586 intraperitoneal or intravenous injection of SbCl3. During the first day, urinary and faecal 1587 excretion accounted on average for about 8.6% and 31%, respectively, of antimony 1588 administered by intraperitoneal injection and 19% and 17%, respectively, of antimony 1589 administered intravenously. 1590 1591 3.2.3.2. Biokinetic model for systemic antimony 1592
1593 (118) The structure of the biokinetic model for systemic antimony is shown in Figure 3-1. 1594
Transfer coefficients are listed in Table 3-3. These coefficients are based on data for trivalent 1595 antimony, which has been studied more than pentavalent antimony and which is expected to 1596 be the more frequently encountered form of antimony. For radioisotopes of antimony 1597 entering the systemic circulation as pentavalent antimony, the model is expected to 1598 underestimate the initial rate of biological removal from the body and overestimate 1599 cumulative nuclear transformations in systemic tissues and fluids. 1600 1601 1602

DRAFT REPORT FOR CONSULTATION: DO NOT REFERENCE
39
1603 Figure 3-1. Structure of the biokinetic model for systemic antimony. 1604
1605

DRAFT REPORT FOR CONSULTATION: DO NOT REFERENCE
40
1606 1607
Table 3-3. Transfer coefficients for systemic antimony From To Transfer coefficient
(d-1) Plasma Small intestine contents 1.0 Plasma Urinary bladder contents 12 Plasma Liver 0 4.0 Plasma Kidneysa 0.3 Plasma RBC 1.25 Plasma ST0 75 Plasma ST1 4.35 Plasma ST2 0.1 Plasma Cortical bone surface 1.0 Plasma Trabecular bone surface 1.0 RBC Plasma 0.0693 Liver 0 Plasma 0.3235 Liver 0 Small intestine contents 0.1155 Liver 0 Liver 1 0.0231 Liver 1 Plasma 0.0347 Kidneys Plasma 0.231 ST0 Plasma 0.693 ST1 Plasma 0.0693 ST2 Plasma 0.0019 Cortical bone surface Plasma 0.03396 Trabecular bone surface Plasma 0.03396 Cortical bone surface Cortical bone volume 0.000693 Trabecular bone surface Trabecular bone volume 0.000693 Cortical bone volume Plasma 0.0000821 Trabecular bone volume Plasma 0.000493 aAssigned to “Other kidney tissue” in the generic model for bone-surface-seeking radionuclides.
1608 (119) It is assumed that antimony leaves blood plasma at the rate 100 d-1 (half-time of ~10 1609
min) with 75% moving to the fast-turnover soft-tissue compartment ST0, 1.25% to RBC, 1610 12% to the urinary bladder contents, 1% to the contents of the small intestine, 4% to liver 1611 (compartment Liver 0), 0.3% to kidneys, 2% to bone surfaces, 0.1% to the slow-turnover soft-1612 tissue compartment ST2, and the remaining 4.35% to the intermediate-term soft-tissue 1613 compartment ST1. Half of the activity deposited on bone surfaces is assigned to cortical bone 1614 and half to trabecular bone. The following removal half-times are assigned: 10 d from RBC 1615 to plasma, 1 d from ST0 to plasma; 10 d from ST1 to plasma; 1 y from ST2 to plasma; 1.5 d 1616 from Liver 0, with 25% moving to the small intestine contents in bile, 5% moving to the 1617 longer-term liver compartment Liver 1, and 70% returning to plasma; 20 d from Liver 1 to 1618 plasma; 3 d from kidneys to plasma; and 20 d from cortical or trabecular bone surface, with 1619 98% returning to plasma and 2% moving to the corresponding bone volume compartment. 1620 The transfer coefficients describing the rates of movement from the bone volume 1621 compartments to plasma are the generic turnover rates for cortical and trabecular bone. 1622
(120) The transfer coefficients listed in Table 3-3 yield the following predictions, which 1623 are reasonably consistent with the biokinetic database for antimony summarized above. 1624 There is an initially rapid disappearance of antimony from blood, with only ~15% of 1625 intravenously injected antimony remaining in blood at 30 min and <4% at 1 h after 1626
DRAFT REPORT FOR CONSULTATION: DO NOT REFERENCE
41
administration. This rapid phase is followed by a slow phase of disappearance from blood 1627 due to accumulation and slow release of antimony by RBC and return of antimony from 1628 extravascular spaces to blood. Over the next several days the blood content remains at about 1629 2-3% of the injected amount. The ratio of the concentration of antimony in RBC to that in 1630 blood plasma increases to about 5 during the first 24 h after intravenous injection and 1631 increases more gradually over the next few weeks. Antimony is removed from the body 1632 mainly in urine, with urinary losses representing approximately 17% of intravenously injected 1633 antimony after 24 h, 41% after 1 wk, 69% after 1 mo, and 86% after 1 y. The urinary to 1634 faecal excretion ratio based on cumulative excretion is about 7. At equilibrium the ratio of 1635 the concentration of antimony in urine to that in blood is about 2. Most (>75%) antimony 1636 transferred from blood plasma to extravascular spaces following acute input to plasma returns 1637 to plasma in the next few days. The liver initially has a higher concentration than other 1638 tissues, but most of the initial liver content is lost over several days. At times greater than 1639 about one month after intravenous injection the concentration of antimony in the skeleton 1640 exceeds that in the liver. About half the total body content remaining at 1 wk after 1641 intravenous injection is lost over the next 15 d; about half the content remaining at 1 mo is 1642 lost over the next 25 d; and about half the content remaining at 1 y is lost over the next 2 y. 1643 From 1 wk to 1 mo after intravenous injection the liver content accounts for 5-6% of total-1644 body antimony. The skeleton content as a fraction of total-body antimony increases from 1645 about 11% at 1 wk to about 27% at 1 mo. At equilibrium the skeleton contains about half of 1646 total-body antimony. Based on a constant input to blood of 2 μg of antimony per day from 1647 environmental sources (Coughtrey and Thorne, 1983), the model predicts a total-body content 1648 of 7 mg after 10,000 d. This is reasonably consistent with estimates of the total-body content 1649 based on tissue measurements (Coughtrey and Thorne, 1983). 1650 1651 3.2.3.3. Treatment of radioactive progeny 1652 1653
(121) Chain members addressed in the derivation of dose coefficients for antimony 1654 isotopes are isotopes of antimony, tellurium, iodine, or xenon. Isotopes of antimony, 1655 tellurium, or iodine produced in systemic compartments are assumed to follow the 1656 characteristic models for these elements (i.e. the models applied in this report to these 1657 elements as parent radionuclides) from their time of production, insofar as application of this 1658 assumption is straightforward. This assumption is sometimes ambiguous due to differences 1659 in model structures for the different elements. That is, the site of production of a radionuclide 1660 may not be clearly identifiable with a specific compartment in its characteristic model. In 1661 such cases a transfer rate from the site of production of the radionuclide to the central blood 1662 compartment in the radionuclide’s characteristic model has been assigned as described below. 1663 After reaching its central blood compartment, the radionuclide is assumed to behave as 1664 described by its characteristic model. 1665
(122) Tellurium atoms produced at soft-tissue sites in the antimony model that are 1666 ambiguous with regard to the characteristic model for tellurium (ST0, ST1, ST2, Liver 0, and 1667 Liver 1) are assumed to be transferred to the central blood compartment of that model 1668 (plasma) at the rate 0.0693 d-1 (half-time of 10 d). This is the rate of removal from all soft 1669 tissue compartments in the characteristic model for tellurium. Tellurium produced in RBC is 1670 assumed to transfer to plasma at the rate 1000 d-1 (a default rate representing rapid transfer 1671 between compartments). For modeling convenience, tellurium produced in the central blood 1672 compartment of the antimony model is assigned to the central blood compartment in the 1673 tellurium model. 1674

DRAFT REPORT FOR CONSULTATION: DO NOT REFERENCE
42
(123) Iodine atoms are produced at the following sites in the antimony or tellurium models 1675 that are not clearly identifiable with specific compartments of the characteristic model for 1676 iodine: blood compartments, liver compartments, kidneys, thyroid (in the tellurium model), 1677 compartments within “Other soft tissue”, and bone compartments. The following rates of 1678 transfer from these compartments to the blood iodide pool of the characteristic model for 1679 iodine are assigned: liver compartments or kidneys, 100 d-1 (the rate of loss from the liver 1680 iodide and kidney iodide compartments in the characteristic model for iodine); blood 1681 compartments (excluding central blood compartments, as indicated below) 1000 d-1; Other 1682 soft tissue or bone surface compartments, 330 d-1 (the highest transfer coefficient to blood in 1683 the characteristic model for iodine); thyroid, 36 d-1 (the transfer coefficient from the thyroid 1684 iodide pool to the blood iodide pool in the characteristic model for iodine); trabecular and 1685 cortical bone volume compartments, the reference rates of trabecular and cortical bone 1686 turnover. For modeling convenience, iodine atoms produced in the central blood pools of the 1687 antimony and tellurium models are assigned to the blood iodide pool in the characteristic 1688 model for iodine. 1689
(124) A generic biokinetic model is applied in this report to xenon isotopes produced by 1690 decay of a radionuclide in systemic compartments. Xenon produced in bone is assumed to 1691 transfer to blood at the rate 100 d-1 if produced in bone surface and 0.36 d-1 if produced in 1692 bone volume. These rates are taken from the model for radon introduced in ICRP Publication 1693 67 (1993) and applied in this report to radon produced in bone surface and non-exchangeable 1694 bone volume, respectively, by decay of a radium isotope. Xenon produced in a soft-tissue 1695 compartment is assumed to transfer to blood with a half-time of 20 min. Xenon produced in 1696 the central blood compartment in the model for antimony, tellurium, or iodine is assigned to 1697 the blood compartment of the xenon model. Xenon produced in any other blood compartment 1698 in the antimony, tellurium, or iodine model is assumed to be transferred to blood in the xenon 1699 model at the rate 1000 d-1. Xenon entering the blood compartment of the xenon model or 1700 produced in that compartment is assumed to be removed from the body (exhaled) at the rate 1701 1000 d-1. Recycling of xenon to tissues via arterial blood is not depicted explicitly in this 1702 model for xenon as a daughter radionuclide but is considered in the assignment of the half-1703 times in tissues. The model is intended to yield a conservative average residence time of 1704 xenon atoms in the body after their production in systemic pools. 1705
1706 3.3. Individual monitoring 1707 1708
(125) 124 Sb may be monitored through Whole Body Counting and/ or Urine bioassay. 1709 1710
Isotope Monitoring Technique
Method of Measurement
Typical Detection Limit
Achievable detection limit
124 Sb Urine Bioassay γ-ray spectrometry 1 Bq/L 0.02 Bq/L 124 Sb Lung
measurement γ-ray spectrometry 9Bq*
124 Sb Whole Body Counting
γ-ray spectrometry 30 Bq 12 Bq
∗ Lung monitoring of 124Sb is not generally used in routine monitoring of workers. Monte Carlo program Visual 1711 Monte Carlo was used to simulate the photon emission, to calculate the calibration factor for the geometry and 1712 radionuclide, and to calculate the minimum detectable activity (MDA) in the lung. (Hunt et al, 2012) 1713
1714 (126) 125 Sb may be monitored through Whole Body Counting and/ or Urine bioassay. 1715
DRAFT REPORT FOR CONSULTATION: DO NOT REFERENCE
43
1716 Isotope Monitoring
Technique Method of Measurement
Typical Detection Limit
Achievable detection limit
125 Sb Urine Bioassay γ-ray spectrometry 6 Bq/L 0.1 Bq/L 125 Sb Whole Body
Counting γ-ray spectrometry 100 Bq 40 Bq
1717 1718
References 1719 1720
Abdallah, A., Saif, M., 1962. Tracer studies with antimony-124 in man. In: Wolstenholme, G.E.W. 1721 and O’Connor, M. (Eds.) Bilharziasis. Churchill, London, pp. 287-309. 1722
Alves, W., Blair, D.M., 1946. Schistosomiasis. Intensive treatment with antimony. Lancet, 247, 9-12. 1723 Bailly, R., Lauwerys, R., Buchet, J.P., Mahieu P., Konings, J., 1991. Experimental and human studies 1724
on antimony metabolism: their relevance for the biological monitoring of workers exposed to 1725 inorganic antimony, Br. J. Ind. Med. 48, 93–97. 1726
Bartter, F.C., Cowie, D.B., Most, H., Ness, A.T., Forbush, S., 1947. The fate of radioactive tartar 1727 emetic administered to human subjects. 1. Blood concentrations and excretion following 1728 single and multiple intravenous injections. Amer. J. Trop. Med., 27, 403-416. 1729
Boyd, T.C., Roy, A.C., 1929. Observations on the excretion of antimony in the urine. Indian J. Med. 1730 Res., 17, 94-108. 1731
Brady, F.J., Lawton, A.H., Cowie, D.B., Andrews, H.L., Ness, A.T., Ogden, G.E., 1945. Localization 1732 of trivalent radioactive antimony following intravenous administration to dogs infected with 1733 dirofilaria immitis. Amer. J. Trop. Med., 25, 103-107. 1734
Brahmachari, U.N., Chaudhury, S.C., Das, J., Sen, P.B., 1924. Chemotherapy of antimonial 1735 compounds in Kala-azar infection. VIII. Quantitative studies in excretion of antimony (tartar 1736 emetic and urea stibamine). Ind. J. Med. Res., 11, 829-838. 1737
Chertok, R.J., Lake, S., 1970. Availability in the dog of radionuclides in nuclear debris from the 1738 Plowshare excavation Cabriolet. Health Phys., 19, 405-409. 1739
Chulay, J.D., Fleckenstein, L., Smith, D.H., 1988. Pharmacokinetics of antimony during treatment of 1740 visceral leishmaniasis with sodium stibogluconate or meglumine antimoniate. Trans. Roy. 1741 Soc. Trop. Med. Hyg., 82, 68. 1742
Coughtrey, P.J., Thorne, M.C., 1983. Antimony. In: Radionuclide distribution and transport in 1743 terrestrial and aquatic ecosystems, Vol. 3. Rotterdam, Balkema, A.A., pp. 263-304. 1744
Djuric, D., Thomas, R.G., Lie, R., 1962. The distribution and retention of trivalent antimony in the rat 1745 following inhalation. Int. Arch. Gewerbepathol. Gewerbehyg., 19, 529-545. 1746
Durbin, P.W., 1960. Metabolic characteristics within a chemical family. Health Phys., 2, 225-238. 1747 Felicetti, S.A., Thomas, R.G., McClellan, R.O., 1974a. Retention of inhaled antimony-124 in the 1748
beagle dog as a function of temperature of aerosol formation. Health Phys., 26, 525–531. 1749 Felicetti, S.A., Thomas, R.G., McClellan, R.O., 1974b Metabolism of two valence states of inhaled 1750
antimony in hamsters. Amer. Ind. Hyg. Assoc. J., 35, 292–300. 1751 Garg, S.P., Singh, I.S., Sharma, R.C., 2003. Long term lung retention studies of 125Sb aerosols in 1752
humans. Health Phys., 84(4), 457–468. 1753 Gerber, G.B., Maes, J., Eykens, B., 1982. Transfer of antimony and arsenic to the developing 1754
organism. Arch. Toxicol. 49, 159-168 1755 Gerhardsson, L., Brune, D., Nordberg, G.F., Wester, P.O., 1982. Antimony in lung, liver and kidney 1756
tissue from deceased smelter workers. Scand. J. Work Environ. Health 8(3), 201-8. 1757 Goodwin, L.G., Page, J.E., 1943. A study of the excretion of organic antimonials using a 1758
polarographic procedure. Biochem. J. 37, 198-209. 1759
DRAFT REPORT FOR CONSULTATION: DO NOT REFERENCE
44
Groth, D.H., Stettler, L.E., Burg, J.R. Busey, W.M., Grant, G.C., Wong, L.J., 1986. Carcinogenic 1760 effects of antimony trioxide and antimony ore concentrate in rats. Toxicol. Environ. Health 1761 18, 607–626. 1762
IARC, 1989. Antimony trioxide and antimony trisulfide. Volume 47, 291–305. IARC Monographs 1763 on the Evaluation of Carcinogenic Risks to Humans. IARC, Lyon, France. 1764
ICRP, 1975. Report of the Task Group on Reference Man, ICRP Publication 23. Pergamon Press, 1765 Oxford. 1766
ICRP, 1981. Limits on Intakes of Radionuclides for Workers. ICRP Publication 30, Part 3. Oxford. 1767 Ann. ICRP 6, (2/3). 1768
ICRP, 1993. Age-dependent Doses to Members of the Public from Intake of Radionuclides: Part 2, 1769 Ingestion dose coeffcients . ICRP Publication 67. Pergamon Press, Oxford. Ann. ICRP 23, 1770 (3/4). 1771
ICRP, 1995. Age-dependent Doses to Members of the Public from Intake of Radionuclides, Part 3, 1772 Ingestion dose coefficients, ICRP Publication 69. Ann. ICRP 25(1). 1773
Inaba, J., Nishimura, Y., Ichikawa, R., 1984. Studies on the metabolism of antimony-125 in the rat. 1774 NIRS-N-49 (National Institute of Radiological sciences, Chiba, Japan). pp.81-83. 1775
Iyengar, G.V., Kollmer, W.E., Bowen, H.J.M., 1978. The elemental composition of human tissues 1776 and body fluids: A complication of values for adults. Verlag Chemic, New York. 1777
Kentner, M., Leinemann, M., Schaller, K.H., Weltle, D., Lehnert, G., 1995. External and internal 1778 antimony exposure in starter battery production, Int. Arch. Occup. Environ. Health 67, 119–1779 123. 1780
Khalil, M.B., 1931. The specific treatment of human schistosomiasis (Bilharzias) with special 1781 reference to its application on a large scale. Arch. Schiffs Trop. Hyg. 35 (Supp. 2), 1-128. 1782
Liao, Y-H., Yu, H-S., Ho, C-K., Wu, M-T., Yang, C-Y., Chen, J-R., Chang, C-C., 2004. Biological 1783 Monitoring of Exposures to Aluminium, Gallium, Indium, Arsenic, and Antimony in 1784 Optoelectronic Industry Workers. J. Occ. Env. Med., 46(9), 931-936. 1785
Lindh, U., Brune, D., Nordberg, G., Wester, P., 1980. Levels of antimony, arsenic, cadmium, copper, 1786 lead, mercury, selenium, silver, tin and zinc in bone tissue of industrially exposed workers. 1787 Sci. Total Environ., 16, 109-116. 1788
Luedersdorf, R., Fuchs, A., Mayer, P., Skulsuksai, G., Schacke, G., 1987. Biological assessment of 1789 exposure to antimony and lead in the glass-producing industry. Int. Arch. Occup. Environ. 1790 Health., 59(5), 469-74. 1791
McCallum, R.I., 1963. The work of an occupational hygiene service in environmental control. Ann. 1792 Occup. Hyg., 6, 55–64. 1793
McCallum, R.I., Day, M.J., Underhill, J., Aird, E.G.A., 1971. Measurement of antimony oxide dust in 1794 humans lungs in vivo by X-ray spectrophotometry. Inhaled Particles III, Vol. 2, Proceedings 1795 of an International Symposium Organised by the British Occupational Hygiene Society, 1796 London, 14 – 23 September 1970, pp. 611–619, (Ed. Walton, W.H.) Unwin Brothers Limited, 1797 The Gresham Press, Old Woking, Surrey, England. 1798
Moskalev, Y., 1964. Experiments dealing with distribution of antimony-124 and tellurium-127. AEC-1799 tr-7590, pp.63-72. 1800
Newton, P.E., Bolte, H.F., Daly, I.W., Pillsbury, B.D., Terrill, J.B., Drew, R.T., Ben-Dyke, R., 1801 Sheldon, A.W., Rubin, L.F., 1994. Subchronic and chronic inhalation toxicity of antimony 1802 trioxide in the rat. Fund. Appl. Tox., 22, 561–576. 1803
Otto, G.F., Maren, T.H., Brown, H.W., 1947. Blood levels and excretion rates of antimony in persons 1804 receiving trivalent and pentavalent antimonials. Am. J. Hyg., 46, 193-211. 1805
Rees, P.H., Keating, M.I., Kager, P.A., Hockmeyer, W.T., 1980. Renal clearance of pentavalent 1806 antimony (sodium stibogluconate). Lancet 2, 226-229. 1807
Rose, E., Jacobs, H., 1969. Whole-body counter and bioassay results after an acute antimony-124 1808 exposure. In: Handling of Radiation Accidents, International Atomic Energy Agency, 1809 Vienna. IAEA-SM-119/30. pp. 589-600. 1810

DRAFT REPORT FOR CONSULTATION: DO NOT REFERENCE
45
Rowland, H.A.K., 1968. Stibokinetics III: Studies on mice with 124Sb-labelled potassium antimony 1811 tartrate. Tissue concentrations: Excretion. Trans. Roy. Soc. Trop. Med. Hyg., 62, 795-800. 1812
Smith, H., 1967. The distribution of antimony, arsenic, copper and zinc in human tissue. J. Forensic 1813 Sci. Society, 7, 97-102. 1814
Sumino, K., Hayakawa, K., Shibata, T., Kitamura, S., 1975b. Heavy metals in normal Japanese 1815 tissues. Arch. Environ. Health, 30, 487-494. 1816
Taylor, P.J., 1966. Acute intoxication from antimony trichloride. Brit. J. Indust. Med., 23, 318-321. 1817 Thomas, R.G., Felicetti, S.W., Luchino, R.V., McClellan, R.O., 1973. Retention patterns of antimony 1818
in mice following inhalation of particles formed at different temperatures. Proc. Soc. Exp. 1819 Biol. Med., 144, 544-550. 1820
Van Bruwaene, R., Gerber, G.B., Kirchmann, R., Colard, K., 1982. Metabolism of antimony-124 in 1821 lactating dairy cows. Health Phys., 43, 733-738. 1822
Waitz, J.A., Ober, R.E., Meisenhelder, J.E., Thompson, P.E., 1965. Physiological disposition of 1823 antimony after administration of 124Sb-labelled tartar emetic to rat, mice and monkeys, and 1824 the effects of tris (p-aminophenyl) carbonium pamoate on this distribution. Bull. WHO 33, 1825 537-546. 1826
Zhu, H., Wang, N., Zhang, Y., Wu, Q., Chen, R., Gao, J., Chang, P., Liu, Q., Fan, T., Li, J., Wang, J. 1827 2010. Element contents in organs and tissues of Chinese adult men. Health Phys., 98, 61-73. 1828
1829 1830
DRAFT REPORT FOR CONSULTATION: DO NOT REFERENCE
46
1831 4. Tellurium (Z = 52) 1832
1833 4.1. Chemical Forms in the Workplace 1834 1835
(127) Tellurium is a semi-metal or metalloid, which occurs mainly in oxidation states –II, 1836 II, IV and VI. Tellurium is in the same chemical series as sulphur and selenium and forms 1837 similar compounds. The two anionic forms are known as tellurates (TeO4
2- or TeO66-). 1838
(128) Tellurium may be encountered in industry in a variety of chemical forms, including 1839 elemental vapour or solid forms, oxides, chlorides, but also as tellurides. 1840
(129) Tellurium-132 is a fission product which is important in the first few days after a 1841 criticality accident. 1842 1843
Table 4-1. Isotopes of tellurium addressed in this report 1844 1845
Isotope Physical half-life Decay mode Te-114 15.2 m EC, B+ Te-116 2.49 h EC, B+ Te-117 62 m EC, B+ Te-118 6.00 d EC Te-119 16.05 h EC, B+ Te-119m 4.70 d EC, B+ Te-121 19.16 d EC Te-121m 154 d IT, EC Te-123 6.00E+14 y EC Te-123m 119.25 d IT Te-125m 57.40 d IT Te-127 9.35 h B- Te-127m 109 d IT, B- Te-129a 69.6 m B- Te-129m 33.6 d IT, B- Te-131a 25.0 m B- Te-131ma 30 h B-, IT Te-132a 3.204 d B- Te-133 12.5 m B- Te-133ma 55.4 m B-, IT Te-134 41.8 m B- a Data for these radionuclides are given in the printed copy of this report. Data for other radionuclides 1846
are given on accompanying electronic disk. 1847 1848 4.2. Routes of Intake 1849 1850 4.2.1. Inhalation 1851 1852
(130) A few experimental studies of the behaviour of radio-labelled tellurium (i.e. tracer 1853 level) following deposition in the respiratory tract have been identified in the literature. Some 1854 information is also available from measurements following inadvertent intakes of irradiated 1855 tellurium oxide, from studies of tellurium-132 inhaled by people after the Chernobyl accident, 1856 and from toxicology studies of stable tellurium compounds. 1857 1858

DRAFT REPORT FOR CONSULTATION: DO NOT REFERENCE
47
Classification of gases and vapours, absorption Types and parameter values 1859 (131) Absorption parameter values and Types, and associated fA values for gas and vapour 1860
forms of tellurium are given in Table 4-2 and for particulate forms in Table 4-3. Common 1861 forms of tellurium (e.g. dioxide) are solids at room temperature. Exposures to gas or vapour 1862 forms of tellurium are therefore probably relatively unusual compared to exposures to 1863 particulate forms, and it is therefore proposed here that particulate form should be assumed in 1864 the absence of specific information. 1865 1866 (a) Gases and vapours 1867 1868
(132) Accidental inhalation by two men of tellurium in the form of hexafluoride gas and 1869 possibly also tellurium esters was reported by Blackadder and Manderson (1975). However, 1870 the information reported related mainly to clinical signs and symptoms. Insufficient 1871 information is available to estimate the fraction deposited, or the rate of absorption. 1872 Tellurium in gas and vapour forms are assigned the default behaviour for gases and vapours: 1873 100% total deposition (20% ET2, 10% BB, 20% bb and 50% AI) and Type F absorption 1874 (Table 4-2). 1875 1876 (b) Particulate aerosols 1877 1878 Tellurium chloride 1879
(133) Dobryakova (1970) followed the biokinetics of 127Te for 14 days after administration 1880 of tellurium chloride to rats by intratracheal instillation. There was rapid absorption from the 1881 lungs, but the rate decreased with time. About 40% of the initial lung deposit (ILD) was 1882 absorbed at 30 minutes and 70% ILD at 1 day. Subsequent clearance was slow and mainly 1883 faecal, with about 6% ILD remaining in the lungs at 14 d. Parameter values estimated here 1884 were fr ~0.7, and sr of the order of 50 d–1, but decreasing with time, and assignment to Type F. 1885 1886 Elemental tellurium 1887
(134) Geary et al. (1978) investigated the toxicological effects up to 180 days after 1888 administration of tellurium to rats by intratracheal instillation. No quantitative information on 1889 the biokinetics was reported. However, pigmentation and effects in the lungs and other organs 1890 indicate that the tellurium was not absorbed rapidly and completely, but that significant 1891 absorption did take place, indicative of Type M rather than Type F or S behaviour. 1892 1893 Tellurium dioxide (TeO2) 1894
(135) Fehér (1976) followed whole-body retention of 123mTe for up to 45 days after 1895 intratracheal instillation of irradiated TeO2 into rats. The high thyroid uptake of 131I at 1 day 1896 indicated correspondingly rapid (Type F) dissolution of the TeO2 to release the 131I. 1897
(136) Fehér and Andrási (1977) followed whole-body retention of 123mTe for up to 95 days 1898 after intake by 10 workers accidentally contaminated with TeO2 irradiated for the production 1899 of 131I. Retention fit a two-component exponential function, with about 75% and 25% 1900 retained with effective half-times of about 12 and 70 days respectively. The authors 1901 interpreted the results on the basis that the retained activity was homogeneously distributed in 1902 the body, assuming rapid dissolution (Type F). 1903
(137) Geary et al. (1978) investigated the toxicological effects up to 180 days after 1904 administration of tellurium dioxide to rats by intratracheal instillation. No quantitative 1905 information on the biokinetics was reported. However, pigmentation and effects in the lungs 1906
DRAFT REPORT FOR CONSULTATION: DO NOT REFERENCE
48
and other organs indicate that the tellurium was not absorbed rapidly and completely, but that 1907 significant absorption did take place, indicative of Type M rather than Type F or S behaviour. 1908 1909 Cadmium telluride (CdTe) 1910
(138) As part of a toxicological study, Morgan et al. (1997) measured the concentrations of 1911 cadmium and tellurium in lungs and other tissues up to 28 days after administration of 1912 cadmium telluride to rats by intratracheal instillation. The lung concentrations of both 1913 elements at 28 days was about 30% of that at 1 day, and was accompanied by significant 1914 increases in concentrations in extrapulmonary tissues, giving assignment to Type M. 1915 1916 Unspecified compounds 1917
(139) Balonov et al. (2003) summarised the results of in vivo measurements made 4 – 8 1918 days after the Chernobyl accident on 65 people evacuated from Pripyat 1.5 d after the 1919 accident. Tellurium-132 activity was measurable in 56 persons, and in 28 of them with 1920 repeated lung measurements it declined with a half time of 2.5±0.2 d. Taking account of the 1921 132Te decay half-life of 3.3 d gives a lung clearance half time of about 10 d, and a 1922 corresponding clearance rate of 0.07 d–1. During the period of measurements the particle 1923 clearance rate from the lungs predicted by the HRTM is about 0.01 d–1, suggesting that most 1924 of the observed clearance is due to absorption to blood, at a rate (ss) of about 0.06 d–1. Since 1925 the lung measurements started a few days after intake, they do not on their own enable an 1926 estimate to be made of the fraction that dissolved rapidly. However, measurements were also 1927 made of 132I in the thyroid, which was considered to originate mainly from 132Te deposited the 1928 lungs. The mean ratio of 132I activity in thyroid to that of 132Te in lungs was 0.2, but with 1929 considerable variation between individuals (range 0.07 to 0.6) (Balonov et al, 2003). Analysis 1930 was carried out here to make an estimate of fr based on this ratio. It was assumed that sr = 100 1931 d–1 (default); ss = 0.06 d–1 (see above) and fA = fr * 0.3 (the default assumption for inhaled 1932 materials, see footnote c to Table 4-3, the fractional uptake in the alimentary tract value for 1933 ingested soluble forms of tellurium being 0.3). This gave a central estimate for fr of about 1934 0.3, but with a range similar to that of the ratio of 132I activity in thyroid to that of 132Te in 1935 lungs above. Thus the results are consistent with assignment to default Type M, although they 1936 indicate faster absorption than assumed by default. Given the uncertainties involved, specific 1937 parameter values are not recommended here for tellurium accidentally released from a nuclear 1938 reactor. 1939 1940 Rapid dissolution rate for tellurium 1941
(140) Evidence from the tellurium chloride study outlined above suggests a rapid 1942 dissolution rate of the order of 50 d–1, which is applied here to all forms of tellurium. 1943 1944 Extent of binding of tellurium to the respiratory tract 1945
(141) Evidence from the tellurium chloride study outlined above suggests that following 1946 the rapid phase of absorption about 6% of the ILD clears relatively slowly from the lungs. 1947 There is no evidence available that clearance of this material is mainly by absorption to blood, 1948 as assumed for material in the ‘bound state’. It is therefore assumed that for tellurium the 1949 bound state can be neglected, i.e. fb = 0.0. 1950
1951

DRAFT REPORT FOR CONSULTATION: DO NOT REFERENCE
49
1952 Table 4-2. Deposition and absorption for gas and vapour compounds of tellurium 1953
1954
Chemical form/origin Percentage deposited (%)a Absorption Total ET1 ET2 BB bb AI Type fA
All unspecified compounds 100b 0 20 10 20 50 F 0.3 a Percentage deposited refers to how much of the material in the inhaled air remains in the body after exhalation. 1955
Almost all inhaled gas molecules contact airway surfaces, but usually return to the air unless they dissolve in, or 1956 react with, the surface lining. The default distribution between regions is assumed: 20% ET2, 10% BB, 20% bb 1957 and 50% AI. 1958 1959 Table 4-3. Absorption parameter values for inhaled particulate forms of tellurium and 1960 for ingested tellurium 1961 1962
Inhaled particulate materials
Absorption parameter valuesa Absorption from the GI tract, fA fr sr (d–1) ss (d–1)
Default parameter valuesb,c Absorption Type
Assigned forms
F Tellurium chloride, tellurium dioxide
1 50 – 0.3
M Elemental tellurium, cadmium telluride, all unspecified formsd
0.1 50 0.005 0.03
S — 0.001 50 1x10⁻⁴ 3x10⁻⁴ Ingested materials All forms 0.3
a It is assumed that for tellurium the bound state can be neglected i.e. fb = 0. The values of sr for Type F, M and 1963 S forms of tellurium (50 d–1) are element-specific. 1964
b Materials (e.g. tellurium chloride) are listed here where there is sufficient information to assign to a default 1965 absorption Type, but not to give specific parameter values (see text). 1966
c For inhaled material deposited in the respiratory tract and subsequent cleared by particle transport to the 1967 alimentary tract, the default fA values for inhaled materials are applied: i.e. the product of fr for the absorption 1968 Type and the fA value for ingested soluble forms of tellurium (0.3). 1969
d Default Type M is recommended for use in the absence of specific information, i.e. if the form is unknown, 1970 or if the form is known but there is no information available on the absorption of that form from the 1971 respiratory tract. 1972
1973 4.2.2. Ingestion 1974 1975
(142) Kron et al. (1991) studied the renal excretion of stable tellurium by healthy 1976 volunteers after oral administration of Te as sodium tellurate (TeO3), sodium tellurite (TeO2) 1977 and metallic colloid. The calculated fractional absorption values were 0.23±0.09 in 4 1978 volunteers ingesting Na tellurate, 0.21 in a single volunteer ingesting tellurite, and 0.10±0.04 1979 in 3 volunteers ingesting metallic tellurium. Since the main chemical form of tellurium in 1980 fission products is sodium tellurite, Kron et al. (1991) proposed that a fractional absorption 1981 value of 0.25 should be applied for radiological protection purposes. 1982
(143) Experimental data from several animal species including rats, guinea pigs, rabbits, 1983 dogs, sheep and cows gave absorption values in the range 0.2 - 0.5 for water soluble tellurites 1984
DRAFT REPORT FOR CONSULTATION: DO NOT REFERENCE
50
(TeO2) and about 0.1 - 0.25 for tellurates (Barnes et al., 1955; Venugopal and Luckey, 1978; 1985 Hollins, 1969; De Meio and Henriques, 1947; Mullen and Stanley, 1974; Taylor, 1996). 1986 Chertok and Lake (1970) argued on the basis of absorption studies on dogs that tellurium 1987 radionuclides contained in nuclear debris might be unavailable for absorption across the 1988 intestinal wall. 1989
(144) In Publication 30 (ICRP, 1979), an absorption value of 0.2 was recommended. A 1990 value of 0.3 was adopted in Publication 67 (ICRP, 1993) for intakes in food. The data do not 1991 support the use of different values for workers and public and therefore an fA value of 0.3 is 1992 used here. 1993 1994 4.2.3. Systemic Distribution, Retention and Excretion 1995 1996 4.2.3.1. Summary of the database 1997 1998
(145) The biokinetics of tellurium in the human body is not well characterized. There are 1999 only a few data for human subjects, mainly bioassay measurements following accidental 2000 exposure in the workplace. A number of studies deal with the toxicological issues of 2001 tellurium incorporation and related side-effects, mainly the occurrence of a sour garlic odour 2002 on the breath and in the urine, sweat and excrement resulting from occupational exposure to 2003 tellurium. This odour seems to be due to the presence of tiny amounts of dimethyl telluride. 2004 2005 Summary of data for human subjects 2006
(146) Schroeder et al. (1967) estimated the content of tellurium in several human tissues 2007 and calculated that the total amount in the body was approximately 600 mg, which would 2008 make tellurium one of the most abundant trace elements in the body. The largest amount was 2009 found in bone (90%), with much lower amounts in muscle (3%), liver (1.2%) and probably in 2010 fat (3%). The amount found in kidney was approximately 3% of that in liver. The 2011 concentration in blood serum amounted to 1.07±0.12 mg⋅L-1 (i.e. 0.17%⋅L-1), and that in 2012 unwashed erythrocytes to 1.95 mg⋅L-1. However, the values for blood may be unreliable due 2013 to analytical problems (Nason and Schroeder, 1967) and were not confirmed by later studies. 2014 Van Montfort et al. (1979), for example, found concentrations in blood of unexposed subjects 2015 to range between 0.15 and 0.3 µg⋅L-1. 2016
(147) Fehér and Andrási (1977) presented the results of a study where an irradiated and 2017 cooled suspension of TeO2-131I was administered to two volunteers. The whole-body 2018 retention of tellurium in the first few days after administration was described with a bi-2019 exponential function with effective half-times of 0.7 d (75%) and 10 d (25%). These data are 2020 consistent with the whole-body retention measured in ten persons occupationally 2021 contaminated with radiotellurium. For these persons no information was available on fast 2022 clearance, due to the lack of measurements immediately after the accident, but measurements 2023 at later times allowed the determination of longer-term retention components with effective 2024 half lives of 11 d (75%) and 45 d. The combined findings of the experimental study and the 2025 follow-up of the occupationally exposures suggest that whole body retention can be described 2026 by a three-exponential function, with biological half lives of 0.7 d (70%), 12 d (23 %) and 72 2027 d (7 %). 2028
(148) Kron et al. (1991) studied urinary excretion in five healthy volunteers after oral 2029 administration of tellurium in different forms (altogether 12 investigations): tellurite 2030 (Na2TeO4), tellurate (Na2TeO3), metallic form, and intrinsically bound in cress (Lepidium 2031
DRAFT REPORT FOR CONSULTATION: DO NOT REFERENCE
51
sativum). Cress was consumed both with and without oil and vinegar dressing. The three-day 2032 urinary excretion varied between 3 and 25%. It was higher for tellurate (9 to 25%) than for 2033 tellurite (less than 8%) or metallic tellurium (4 to 9%). After ingestion of tellurium with cress, 2034 the amount excreted over three days ranged between 6 and 16%, and was reduced to 3% when 2035 dressing was added. For tellurate and metal tellurium most of the excretion occurred in the 2036 first 24 h after administration, whereas for cress and tellurite the excretion curve was delayed. 2037 For cress this delay presumably indicates a slower absorption of tellurium bound in organic 2038 matter as compared to the aqueous solutions. For tellurite the authors assumed a higher 2039 retention in the body for this compound as compared to tellurate as an explanation for the 2040 lower and slower excretion. 2041 2042 Summary of data from animal studies 2043
(149) DeMeio and Henriques (1947) administered radioactive tellurite to rabbits, rats and 2044 dogs and measured the tissue distribution (Table 4-4) and excretion pathways. In rabbits and 2045 rats elevated concentrations were measured in kidneys, spleen, heart and lungs, and lower 2046 concentrations were found in the liver. In rats the tissue concentrations dropped considerably 2047 after one hour. Concentrations in blood averaged 25±4%⋅L-1 at day 1 after intravenous 2048 injection in rabbits and 610±390%⋅L-1 in rats at thirty minutes after intraperitoneal 2049 administration. In dogs the values dropped from 21±12%⋅L-1 at 1 hour to 6.9±2.5%⋅L-1 at 1 2050 day. About 20 to 23% of tellurite injected intravenously into female dogs was excreted in the 2051 urine over 5-6 days, the greatest portion in the first two-three hours. Finally, the authors 2052 concluded that less than 1/1000th of the amount of radioactive tellurite injected into rabbits 2053 was excreted via the expired air during the 24 hr following administration. On the basis of the 2054 observed excretions, the authors argue that about 60% of tellurium injected into dogs 2055 remained in their body after 5-6 days. 2056 2057
Table 4-4. Distribution (%/organ) of radiotellurium activity following injectiona Organ Rabbitsb Ratsc Ratsd Kidney 11.6±3.2 6.14±1.90 0.33 Liver 6.6±1.3 6.43±0.60 0.33 Lung 1.4±0.5 0.73±0.12 0.02 Heart 0.66±0.38 0.46±0.15 0.02 Spleen 0.28±0.08 0.72±0.05 0.03 a From DeMeio and Henriques (1947). b Intravenous administration. Values are means for up to six animals each and refer to
about 1 day after administration. c Intraperitoneal administration. Values are means for up to three animals each and
refer to about 0.5 h after administration. d Intraperitoneal administration. Values are for only one animal and refer to about 1
day after administration. 2058
(150) Barnes et al. (1955) administered 132Te orally to rats and guinea pigs and determined 2059 the distribution of tellurium in the body at 3-4 days (Table 4-5). About 5.5% and 6.5% was 2060 excreted in the urine over 4 days by the guinea pigs and rats, respectively. Fecal excretion 2061 plus activity present in the gut amounted to about 93% in the guinea pigs and 80% in the rats. 2062 In further experiments, a tellurium solution was injected intravenously into rats, guinea pigs, 2063 mice and one rabbit to follow the blood kinetics and investigate the partition between whole 2064 blood and plasma. In general, retention in the blood of mice, guinea-pigs and the rabbit was 2065

DRAFT REPORT FOR CONSULTATION: DO NOT REFERENCE
52
low (at day 1, 0.5 % in the mice, about 1% in the guinea pigs and 3.2% in the rabbit), whereas 2066 in the rats blood retention ranged from 22 to 32%. The biological half-life in the rat was about 2067 seven days. Tellurium in the blood appeared to be contained completely in the plasma in 2068 guinea pigs and mice, and only a small portion was bound to the corpuscles in the rabbit. By 2069 contrast, tellurium activity in the blood of rats was significantly higher than in plasma, 2070 suggesting that the rat is unique in retaining tellurium within the red cells. Tellurium in the 2071 rabbit's plasma and in the rats' corpuscles was shown to be protein-bound. 2072 2073
Table 4-5. Distribution (%/organ) of 132Te activity following oral administrationa Organ Guinea pigs Rats Kidney 0.52±0.06 1.20±0.08 Liver 0.73±0.22 1.13±0.32 Skeleton 0.54±0.08 0.77±0.03 Pelt 0.29±0.02 0.80±0.21 Carcass 0.35±0.10 1.94±0.85 Thyroid 0.01±0.005 0.01±0.005 Blood removed 0.03±0.01 3.60±0.20 a From Barnes et al. (1955). Values are means for two animals each and refer to 3-4 days
after administration. 2074
(151) Casey et al. (1963) administered a mixture of radionuclides of tellurium and iodine 2075 to lactating sheep and found that the transfer to milk was very low (two to three orders of 2076 magnitude less than for iodine). Retained tellurium was found mainly in the liver, kidney, 2077 lungs. The highest concentration was found in the thyroid, but the total content of the thyroid 2078 was small due to its small mass. 2079
(152) Wright and Bell (1966) compared the metabolism of tellurium in sheep and swine. 2080 Five animals of each species were orally administered 127mTe as Na2TeO3 via a stomach tube, 2081 and five more animals received the same compound via injection into the jugular vein. The 2082 blood content of 127mTe in the sheep was very low (less than 0.25% of the administered dose) 2083 after oral administration. Intravenously injected tellurium was cleared readily from plasma 2084 (10% was retained after 2 hr and 2% after 5 d), and only a small portion was recovered in the 2085 cell fraction. In swine the peak concentration in whole blood occurred at approximately 30 2086 hours after oral administration, at which time nearly all the 127mTe was in the corpuscular 2087 fraction. Clearance of intravenously administered tellurium from plasma was similar to that 2088 observed in the sheep, but the corpuscular fraction rose with time (up to 3% at 5 d). The 2089 whole blood clearance after iv-administration could be described in terms of two components: 2090 a fast component with a biological half-time of about 10 h and a slower component with a 2091 half-time of several days. The total organ content at 5 days after intravenous administration is 2092 given in Table 4-6. No information was given about skeleton or thyroid. 2093 2094

DRAFT REPORT FOR CONSULTATION: DO NOT REFERENCE
53
Table 4-6. Distribution of 132Te 5 d after intravenous administration (% of administered activity) Organ Sheep Swine Kidney 7.14±0.27 2.08±0.33 Liver 7.95±0.47 7.08±0.33 Lung 1.38±0.02 1.48±0.13 Heart 0.81±0.35 0.29±0.04 Spleen 0.16±0.01 0.37±0.06 a From Wright and Bell (1966). Values presented are the average of five subjects each and
refer to 5 days after administration. 2095
(153) Sheep as well as swine excreted about 11% of the injected 127mTe in the faeces and 2096 34% in the urine over five days. About two-thirds of the urinary excretion occurred in the first 2097 24 h. After oral administration, sheep excreted 75% in the faeces and 20% in the urine. Swine 2098 excreted 70% in the faeces and 19% in the urine, mostly on the second day. 2099
(154) Hollins (1969) studied the metabolism of 127mTe as tellurous acid in rats. The whole 2100 body retention after intraperitoneal injection could be described as a bi-exponential function 2101 with half-times of 0.8 d (49%) and 13 d (51%), respectively. After oral administration 84% 2102 was retained with a half-time of 0.12 d, 11% with 0.8 d and 5% with 12 d. The half-times of 2103 the two longer retention terms were the same within the experimental errors as those observed 2104 after injection. The highest concentrations of tellurium were observed in the kidneys, blood, 2105 liver, spleen, femur and lung. Tellurium in blood was almost entirely bound to the protein 2106 content of the red blood cells. The tissues could be divided into three classes according to the 2107 retention half-time: lung, blood, liver and heart with a half-time of approximately 10 d; 2108 muscle, spleen, and kidney with a half-time of approximately 20 d; and femur (skeleton) with 2109 a half-time that was much longer than the duration of the experiment (200 d) and could 2110 therefore not be determined with much confidence. About 27% of the injected tellurium was 2111 excreted in urine during the first 24 h, and 6% was excreted in faeces. Less than 0.25% of the 2112 administered dose was eliminated in the breath in the first 24 h, despite a strong garlic odour. 2113
(155) A series of studies on rats were conducted in the years between 1960 and 1970 in the 2114 former USSR and Czechoslovakia. Their findings are summarized by a document of the 2115 Health Council of Netherlands (2002). After intravenous injection tellurium was found 2116 mainly in the liver (10 to 20%), muscle (around 10%) and skeleton (8 to 24%), and to a lesser 2117 extent in the kidneys (2.5-7%). Deposition patterns varied with time from administration, 2118 with skeleton being the organ with the greatest retention time. Urinary excretion amounted to 2119 14% of the iv dose on day 1 and 33% in the first week. 2120
(156) Agnew and Cheng (1971) investigated protein binding of tellurium in maternal and 2121 fetal tissues after intravenous injection of tellurous acid (H2TeO3) labelled with 127mTe into 2122 pregnant rats. Activity in whole blood was predominantly in the red cells at all times studied. 2123 The fraction in red cells increased from 65% after 15 minutes to about 95% after one week. 2124 By far the bulk of the activity in plasma was in a bound form. After 1 hr of circulation, less 2125 than 5% of the 127mTe was in unbound form, and only about 0.5% was unbound after one 2126 week. 2127
(157) Mullen and Stanley (1974) studied absorption, distribution and milk secretion of 2128 radiotellurium in dairy cows and calves. The transfer of tellurium to milk was very low (about 2129 0.25% of the orally administered activity in 13 days). Retained tellurium was found mainly in 2130 the liver, bone, and organs of the digestive/ruminal tract. Again, tellurium concentration in 2131
DRAFT REPORT FOR CONSULTATION: DO NOT REFERENCE
54
the thyroid was significant (about the same order as in the liver), but due to the tiny mass of 2132 this organ the total amount retained was negligible. 2133
(158) Valkonen and Savolainen (1985) administered tellurium in the form of TeCl4 in the 2134 drinking water of rats for up to 35 days. The tellurium concentration in liver remained 2135 constant with time but increased steadily in blood, kidney and brain. The concentration ratio 2136 liver : kidney was 4.1 after 7 days of administration and 2.1 after 35 days. The ratio liver : 2137 brain decreased from 8.1 to 1.8 in the same interval. 2138
(159) Morgan et al. (1997) administered cadmium telluride intra-tracheally to rats. After 2139 absorption of tellurium into the systemic circulation, significant concentrations were found in 2140 the spleen (maximum, 82.8±10.2 µg⋅g-1 tissue), kidney (maximum, 8.1±1.3 µg⋅g-1 tissue), 2141 liver (maximum, 8.8±0.6 µg⋅g-1 tissue), femur (maximum 3.5±0.5 µg⋅g-1 tissue) and blood 2142 (maximum, 5.3±0.2 µg⋅g-1 tissue). The maximum concentration was reached at day 14 after 2143 administration in all tissues except liver, where the maximum was reached at day 7. 2144 2145 4.2.3.2. Biokinetic model for systemic tellurium 2146 2147
(160) ICRP Publication 67 (1993) introduced a simple systemic model for tellurium based 2148 on findings in animal studies. That model assumed that 50% of tellurium entering blood goes 2149 directly to excretion with a half-time of 0.8 days; 25% is translocated to the skeleton, from 2150 which it is removed to excretion pathways with a half-time of 10,000 days; and the rest is 2151 divided between the kidneys (2.3%), thyroid (0.2%), and remaining tissues (22.5%), from 2152 which it is removed to excretion pathways with a biological half-time of 20 days. A urinary to 2153 faecal excretion ratio of 4:1 was assumed for systemic tellurium. 2154
(161) In this report the generic model structure for bone-surface-seeking radionuclides is 2155 applied to tellurium, with the introduction of the thyroid as a separate compartment primarily 2156 to enable the application of the model to tellurium radionuclides produced as progeny of 2157 radioiodine. Transfer coefficients of the model are listed in Table 4-6. These coefficients are 2158 based predominantly on human data with regard to whole body retention and urinary 2159 excretion and on animal data, mainly from studies with swine and guinea pigs, with regard to 2160 the organ distribution. 2161
(162) The compartment called Blood in the generic model structure is divided into two 2162 compartments: Blood 1, representing blood plasma, and Blood 2, representing red blood cells. 2163 It is assumed that tellurium leaves Blood 1 at the rate 1.16 d-1 (half-time of ~0.6 d) with 65% 2164 moving to the urinary bladder contents, 10.5% to Liver, 8.75% to Blood 2, 5.25% to Bone 2165 Surfaces (in the ratio 2:1 between trabecular and cortical), 3.5 % to Kidneys, 0.35% to 2166 Thyroid and the remaining 19 % to Soft-Tissue compartment ST. The following removal 2167 half-times are assigned: 10 d from Blood 2, Kidney, Thyroid and ST to Blood 1; 10 d from 2168 Liver to the small intestine contents (representing removal from the liver in bile); and 50 d 2169 from cortical or trabecular bone surface, with 98% returning to Blood 1 and 2% moving to the 2170 corresponding bone volume compartment. The transfer coefficients describing the rates of 2171 movement from the bone volume compartments to Blood 1 are the generic turnover rates for 2172 cortical and trabecular bone. 2173 2174

DRAFT REPORT FOR CONSULTATION: DO NOT REFERENCE
55
2175 2176
Figure 4-1. The systemic model for tellurium. 2177 2178
Table 4-7. Transfer coefficients for systemic tellurium From To Transfer coefficient (d-1) Blood 1 Urinary bladder contents 0.751 Blood 1 Kidneys 0.0404 Blood 1 Liver 0.1213 Blood 1 Blood 2 0.1011 Blood 1 ST 0.0768 Blood 1 Cortical bone surface 0.0202 Blood 1 Trabecular bone surface 0.0404 Blood 1 Thyroid 0.0040 Blood 2 Blood 1 0.0693 Liver Small intestine contents 0.0693 Thyroid Blood 1 0.0693 Kidneys Blood 1 0.0693 ST Blood 1 0.0693 Cortical bone surface Blood 1 0.0116 Trabecular bone surface Blood 1 0.0116 Cortical bone surface Cortical bone volume 0.0006931 Trabecular bone surface Trabecular bone volume 0.0006931 Cortical bone volume Blood 1 0.0000821 Trabecular bone volume Blood 1 0.000493
2179 (163) No explicit exhalation pathway was introduced in the model as the available studies 2180
indicate that, in spite of the persistent garlic odour experienced after tellurium incorporation, 2181 the amount exhaled is negligible. 2182
(164) The transfer coefficients listed in Table 4-7 yield the following predictions, which 2183 are reasonably consistent with the biokinetic database for tellurium summarized above. 2184 Urinary excretion of systemic tellurium is rapid and amounts to 45% in the first 24 h, 64% 2185 after 3 days, 71% after 10 d and 81% after 50 d. These values are in agreement with the 2186 urinary excretion observed by Kron et al. (1991) after oral administration of tellurium, taking 2187
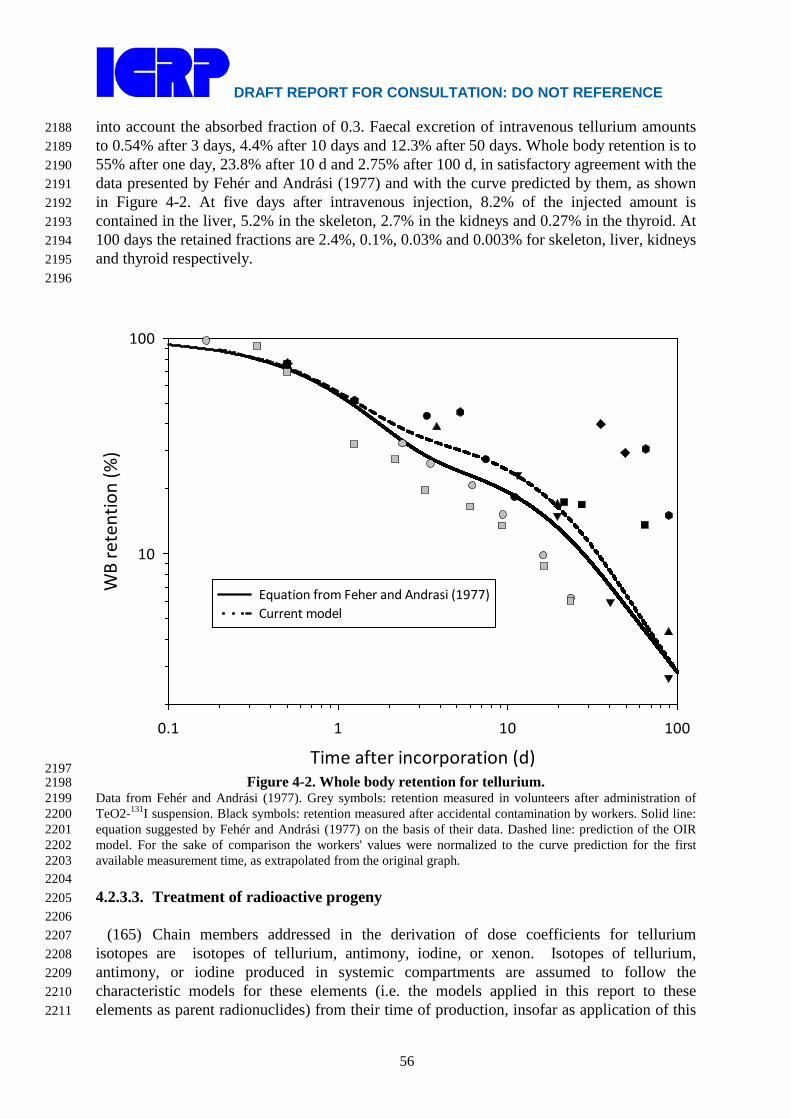
DRAFT REPORT FOR CONSULTATION: DO NOT REFERENCE
56
into account the absorbed fraction of 0.3. Faecal excretion of intravenous tellurium amounts 2188 to 0.54% after 3 days, 4.4% after 10 days and 12.3% after 50 days. Whole body retention is to 2189 55% after one day, 23.8% after 10 d and 2.75% after 100 d, in satisfactory agreement with the 2190 data presented by Fehér and Andrási (1977) and with the curve predicted by them, as shown 2191 in Figure 4-2. At five days after intravenous injection, 8.2% of the injected amount is 2192 contained in the liver, 5.2% in the skeleton, 2.7% in the kidneys and 0.27% in the thyroid. At 2193 100 days the retained fractions are 2.4%, 0.1%, 0.03% and 0.003% for skeleton, liver, kidneys 2194 and thyroid respectively. 2195 2196
Time after incorporation (d)0.1 1 10 100
WB
rete
ntio
n (%
)
10
100
Equation from Feher and Andrasi (1977)Current model
2197 Figure 4-2. Whole body retention for tellurium. 2198
Data from Fehér and Andrási (1977). Grey symbols: retention measured in volunteers after administration of 2199 TeO2-131I suspension. Black symbols: retention measured after accidental contamination by workers. Solid line: 2200 equation suggested by Fehér and Andrási (1977) on the basis of their data. Dashed line: prediction of the OIR 2201 model. For the sake of comparison the workers' values were normalized to the curve prediction for the first 2202 available measurement time, as extrapolated from the original graph. 2203 2204 4.2.3.3. Treatment of radioactive progeny 2205 2206
(165) Chain members addressed in the derivation of dose coefficients for tellurium 2207 isotopes are isotopes of tellurium, antimony, iodine, or xenon. Isotopes of tellurium, 2208 antimony, or iodine produced in systemic compartments are assumed to follow the 2209 characteristic models for these elements (i.e. the models applied in this report to these 2210 elements as parent radionuclides) from their time of production, insofar as application of this 2211
DRAFT REPORT FOR CONSULTATION: DO NOT REFERENCE
57
assumption is straightforward. In some cases, the site of production of antimony or iodine due 2212 to decay of a tellurium isotope may not be clearly identifiable with a specific compartment in 2213 its characteristic biokinetic model due to differences in model structures for the different 2214 elements. In such cases a transfer rate from the site of production of the radionuclide to the 2215 central blood compartment in the radionuclide’s characteristic model has been assigned as 2216 described below. After reaching its central blood compartment, the radionuclide is assumed to 2217 behave as described by its characteristic model. 2218
(166) Antimony atoms produced in soft-tissue compartments in the tellurium model that 2219 are ambiguous with regard to the characteristic model for antimony (specifically, Liver, 2220 Thyroid, and Other) are assumed to be transferred to the central blood compartment of that 2221 model (blood plasma) at the rate 0.693 d-1 (half-time of 1 d). This is the highest rate of 2222 removal from all soft tissue compartments in the characteristic model for antimony. 2223 Antimony produced in the compartment of the tellurium model called Blood 2, representing 2224 relatively long retention in blood, is assumed to transfer to plasma in the antimony model at 2225 the rate 1000 d-1 (a default rate representing rapid transfer between compartments). For 2226 modelling convenience, antimony produced in the central blood compartment of the tellurium 2227 model (Blood 1) is assigned to plasma in the antimony model. 2228
(167) Iodine atoms are produced at the following sites in the tellurium model that are not 2229 clearly identifiable with specific compartments of the characteristic model for iodine: 2230 compartments of blood, bone, liver, kidneys, thyroid, and other soft tissues (Other). The 2231 following rates of transfer from these sites to the blood iodide pool of the characteristic model 2232 for iodine are assigned: from compartments of liver or kidneys, 100 d-1 (the rate of loss from 2233 the liver iodide and kidney iodide compartments in the characteristic model for iodine); from 2234 compartments of blood (other than the central blood compartment), 1000 d-1; from 2235 compartments of other soft tissues or bone surface, 330 d-1 (the highest transfer coefficient to 2236 blood in the characteristic model for iodine); from thyroid, 36 d-1 (the transfer coefficient 2237 from the thyroid iodide pool to the blood iodide pool in the characteristic model for iodine); 2238 and from trabecular and cortical bone volume compartments, the reference rates of trabecular 2239 and cortical bone turnover. For modelling convenience, iodine produced in the central blood 2240 pool of the tellurium model is assigned to the blood iodide pool in the characteristic model 2241 for iodine. 2242
(168) A generic biokinetic model is applied in this report to xenon isotopes produced by 2243 decay of a radionuclide in systemic compartments. Xenon produced in bone is assumed to 2244 transfer to blood at the rate 100 d-1 if produced in bone surface and 0.36 d-1 if produced in 2245 bone volume. These rates are taken from the model for radon introduced in ICRP Publication 2246 67 (1993) and applied in this report to radon produced in bone surface and non-exchangeable 2247 bone volume, respectively, by decay of a radium isotope. Xenon produced in a soft-tissue 2248 compartment is assumed to transfer to blood with a half-time of 20 min. Xenon produced in 2249 the central blood compartment in the model for tellurium, antimony, or iodine is assigned to 2250 the blood compartment of the xenon model. Xenon produced in any other blood compartment 2251 in the tellurium, antimony, or iodine model is assumed to be transferred to blood in the xenon 2252 model at the rate 1000 d-1. Xenon entering the blood compartment of the xenon model or 2253 produced in that compartment is assumed to be removed from the body (exhaled) at the rate 2254 1000 d-1. Partial recycling of xenon to tissues via arterial blood is not depicted explicitly in 2255 this model for xenon as a daughter radionuclide but is considered in the assignment of the 2256 half-times in tissues. The model is intended to yield a conservative average residence time of 2257 xenon atoms in the body after their production in systemic pools. 2258 2259
DRAFT REPORT FOR CONSULTATION: DO NOT REFERENCE
58
4.3. Individual monitoring 2260 2261 129Te 2262
(169) 129Te is a γ emitter. Monitoring of 129Te may be accomplished through Whole Body 2263 Counting. Urine bioassay may also be used. Because of the short half-life measurements 2264 should be done soon after exposure, maximum of 3h after exposure. 2265 2266
Isotope Monitoring Technique
Method of Measurement
Typical Detection Limit
Achievable detection limit
129Te
Urine Bioassay γ-ray spectrometry 331 Bq/L
129Te
Whole Body Counting
γ-ray spectrometry 1070 Bq
2267 131Te 2268
(170) 131Te is a γ emitter. Monitoring of 131Te may be accomplished through Whole Body 2269 Counting, immediately after exposure (up to three hours). 2270 2271
Isotope Monitoring Technique
Method of Measurement
Typical Detection Limit
Achievable detection limit
129Te
Whole Body Counting
γ-ray spectrometry 428 Bq
2272 131mTe 2273
(171) 131mTe is a γ emitter. Monitoring of 131mTe may be accomplished through Whole 2274 Body Counting. Urine bioassays may also be used. Measurements should be done in a short 2275 period after exposure. 2276 2277
Isotope Monitoring Technique
Method of Measurement
Typical Detection Limit
Achievable detection limit
129Te
Urine Bioassay γ-ray spectrometry 1.4 Bq/L
129Te
Whole Body Counting
γ-ray spectrometry 395 Bq
2278 132Te 2279
(172) 132Te is a γ emitter. Monitoring of 131mTe may be done through Whole Body 2280 Counting. Urine bioassays are also used. 2281 2282
Isotope Monitoring Technique
Method of Measurement
Typical Detection Limit
Achievable detection limit
132Te
Urine Bioassay γ-ray spectrometry 0.5 Bq/L
132Te
Whole Body Counting
γ-ray spectrometry 100 Bq
DRAFT REPORT FOR CONSULTATION: DO NOT REFERENCE
59
2283 133mTe 2284
(173) 133mTe is a γ emitter. Monitoring of 133mTe may be accomplished through Whole 2285 Body Counting. Urine bioassays may also be used. Measurements should be done 2286 immediately after exposure (up to three hours). 2287 2288
Isotope Monitoring Technique
Method of Measurement
Typical Detection Limit
Achievable detection limit
133m Te
Urine Bioassay γ-ray spectrometry 114 Bq/L
133m Te
Whole Body Counting
γ-ray spectrometry 95 Bq
2289 References 2290
2291 Agnew, W.F., Cheng, J.T., 1971. Protein binding of tellurium-127m by maternal and fetal tissues of 2292
the rat. Toxicol. Appl. Pharmacol. 20, 346-356. 2293 Balonov, M., Kaidanovsky, G., Zvonova, I., Kovtun, A., Bouville, A., Luckyanov, N., Voillequé, P., 2294
2003. Contributions of short-lived radioiodines to thyroid doses received by evacuees from 2295 the Chernobyl area estimated using early in vivo activity measurements. Radiat. Prot. 2296 Dosim. 105 (1–5) 593–599. 2297
Barnes, D.W.H., Cook, G.B., Harrison, G.E., Loutit, J.F., Raymond, W.H.A., 1955. The metabolism 2298 of 132tellurium-iodine mixture in mammals. J. Nucl. Energy 1, 218-230. 2299
Blackadder, E.S., Manderson, W.G., 1975. Occupational absorption of tellurium: a report of two 2300 cases. Brit. J. Ind. Med. 32, 59–61. 2301
Casey, H.W., Case, A.C., McClellan, R.O., Bustad, L.K., 1963. Metabolism of Te132-I132 in lactating 2302 sheep. Health Phys. 9, 1223-1226. 2303
Chertok, R.J., Kake, S., 1970. Availability in the dog of radionuclides in nuclear debris from the 2304 Plowshare excavation cabriolet. Health Phys. 19, 405-409. 2305
DeMeio, R.H., Henriques, F.C., 1947. Excretion and distribution in tissues studied with a radioactive 2306 isotope. J. Biol. Chem. 169, 609-617. 2307
Dobryakova, G.V., 1970. Dynamics of the removal of Te-127 and Ru-106 from rat lungs. In: 2308 Moskalev, Yu. I., Editor. Radioaktiv. Izotopy Vnesh. Srede Organizme. pp. 57-63. Moscow: 2309 Atomizdat. 2310
Fehér, I. (1976) Investigations of the Internal Radiation Burdens. PhD Thesis (in Hungarian). 2311 Fehér, I. and Andrási, A. (1977) Study on internal contamination due to tellurium isotope mixture. 2312
Proc. 4th IRPA congress Vol 2. pp. 421-424. International Radiation Protection Association. 2313 Geary, D. L., Myers, R. C., Nachreiner, D. J. and Carpenter, C. P. (1978). Tellurium and tellurium 2314
dioxide: single endotracheal injection to rats. Am. Ind. Hyg. Assoc. J. 39, 100-109. 2315 Health Council of the Netherlands (2002). Committee on Updating of Occupational Exposure Limits. 2316
Tellurium and tellurium compounds (excluding TeF6); Health-based Reassessment of 2317 Administrative Occupational Exposure Limits. The Hague: Health Council of the 2318 Netherlands, 2000/15OSH/055. 2319
Hollins, J.G. (1969) The metabolism of tellurium in rats. Health Phys. 17, 497-505. 2320 ICRP (1979) International Commission on Radiological Protection. Limits on Intakes of 2321
Radionuclides for Workers. ICRP Publication 30, Pt.1. ICRP 2, (3/4), 85-87. 2322 ICRP (1993) International Commission on Radiological Protection. Age-dependent Doses to 2323
Members of the Public from Intake of Radionuclides. Pt.2. ICRP Publication 67. Ann. 2324 ICRP. 23, (3/4), 61-67. 2325
DRAFT REPORT FOR CONSULTATION: DO NOT REFERENCE
60
Kron, T., Hansen, Ch. and Werner, E. (1991) Renal excretion of tellurium after peroral 2326 administration of tellurium in different forms to healthy humans. J. Trace Elem. 2327 Electrolytes Health. Dis. 5, 239-244 2328
Morgan, D.L., Shines, C.J., Jeter, S.P., Blazka, M.E., Elwell, M.R., Wilson, R.E., Ward, S.M., Price, 2329 H.C., Moskowitz, P.D., 1997. Comparative pulmonary absorption, distribution, and toxicity 2330 of copper gallium diselenide, copper indium diselenide, and cadmium telluride in Sprague-2331 Dawley rats. Toxicology & Applied Pharmacology, 147, 399–410. 2332
Mullen, A.A., Stanley, R.E., 1974. Absorption, distribution and milk secretion of radionuclides by 2333 dairy cows. III. Radiotellurium. Health Phys. 27, 279-284. 2334
Nason, A.P., Schroeder, H.A., 1967. Abnormal trace elements in man: tellurium - Erratum. J. Chron. 2335 Dis. 20, 671. 2336
Schroeder, H.A., Buckman, J., Balassa, J.J., 1967. Abnormal trace elements in man: tellurium. J. 2337 Chron. Dis. 20, 147-161. 2338
Taylor, A., 1996. Biochemistry of tellurium. Biol. Trace Elem. Res. 55(3), 231-239. 2339 Valkonen ,S., Savolainen, H., 1985. Tellurium burden and neurochemical effects in moderate peroral 2340
exposure. Bull. Environ. Contam. Toxicol. 34, 170-174. 2341 van Montfort, PFE, Agterdenbos, J., Jütte, B.A.H.G., 1979. Determination of antimony and tellurium 2342
in human blood by microwave induced emission spectrometry. Anal. Chem. 51, 1553-1557. 2343 Venugopal, B., Luckey, T.D., 1978. Metal Toxicity ion Mammals. Vol. 2. Plenum Press, New York. 2344 Wright, P.L., Bell, M.C., 1966. Comparative metabolism of selenium and tellurium in sheep and 2345
swine. Am. J. Physiol. 20, 6-10. 2346 2347 2348
2349
DRAFT REPORT FOR CONSULTATION: DO NOT REFERENCE
61
2350 5. IODINE (Z = 53) 2351
2352 5.1. Chemical Forms in the Workplace 2353 2354
(174) Iodine is a volatile halogen existing mainly in oxidation states –I, 0 and V. The most 2355 common chemical forms of iodine in solution are the iodide (I-) and the iodate (IO3
-). Iodine 2356 may be encountered in industry in a variety of chemical and physical forms, including 2357 vapours and gases, organic compounds such as methyl and ethyl iodide, and particulate forms 2358 including metal-iodide (NaI, AgI). 2359
(175) 131I, 129I and 132I (from 132Te) are the three main iodine fission products that are 2360 released from reactor accidents and that are present in fragments of irradiated fuels. 123I and 2361 125I are used in medicine as tracers for imaging and evaluating the function of the thyroid, and 2362 131I is used in medicine for the treatment of thyroid cancer. 2363 2364
Table 5-1. Isotopes of iodine addressed in this report 2365 2366 Isotope Physical half-life Decay mode I-118 13.7 m EC, B+ I-119 19.1 m EC, B+ I-120 81.6 m EC, B+ I-120m 53 m EC, B+ I-121 2.12 h EC, B+ I-123 13.27 h EC I-124 4.176 d EC, B+ I-125a 59.40 d EC I-126 12.93 d EC, B+, B- I-128 24.99 m B-, EC, B+ I-129a 1.57E+7 y B- I-130 12.36 h B- I-131a 8.021 d B- I-132 2.295 h B- I-132m 1.387 h IT, B- I-133 20.8 h B- I-134 52.5 m B- I-135 6.57 h B-
a Data for these radionuclides are given in the printed copy of this report. Data for other radionuclides are 2367 given on accompanying electronic disk. 2368
2369 5.2. Routes of Intake 2370 2371 5.2.1. Inhalation 2372 2373 Absorption Types and Parameter Values 2374
(176) Detailed information on the behaviour of inhaled gases and vapours of iodine is 2375 available from studies in human volunteers. Hence, although information is also available 2376 from animal experiments, it is not reviewed here. Some information is available on inhaled 2377 particulate forms of iodine: as iodide from animal experiments; and associated with irradiated 2378 fuel fragments from human exposures. 2379
(177) Absorption parameter values and Types, and associated fA values for gas and vapour 2380

DRAFT REPORT FOR CONSULTATION: DO NOT REFERENCE
62
forms of iodine are given in Table 5-2 and for particulate forms in Table 5-3. Exposures to 2381 both gas/vapour forms and particulate forms of iodine are common, and it is therefore 2382 proposed here that in the absence of information 50% particulate; 50% gas/vapour should be 2383 assumed (ICRP, 2002a). 2384 2385 (a) Gases and vapours 2386 2387 Elemental iodine 2388
(178) Iodine in thyroid measurements were made up to about 4 months after intake on five 2389 workers who accidentally inhaled 125I vapours released from an open beaker (Bordell et al., 2390 1972). The thyroid activity fell by about 30% between the first two measurements (at 0.5 and 2391 4 days after the intake), suggesting that most of the absorption to blood had occurred by the 2392 time of the first measurement, and indicating Type F behaviour. 2393
(179) Detailed studies have been conducted in human volunteers of the deposition and 2394 subsequent biokinetics of iodine inhaled as vapour labelled with 132I (Morgan et al., 1968a; 2395 Black and Hounam, 1968). The results confirmed the rapid absorption seen previously in 2396 animal experiments. In the experiments conducted by Morgan et al. the iodine was inhaled 2397 through a mouthpiece. Respiratory tract deposition was almost complete, and the authors 2398 noted that this must be due to the high chemical reactivity of iodine, because it is only 2399 sparingly soluble in water. Measurements with collimated detectors showed high deposition 2400 in the oral pharynx, and transfer downwards, presumably to the stomach. From these and 2401 measurements of systemic activity it was inferred that much of the activity was swallowed 2402 and subsequently absorbed from the alimentary tract. The authors concluded that the main site 2403 of deposition was the oral pharynx, and while penetration to the trachea and bronchi could not 2404 be excluded, it was unlikely that iodine vapour reaches the alveoli. In the experiments 2405 conducted by Black and Hounam the iodine was drawn in through the nose and out through 2406 the mouth. Using a similar technique, Pattle (1961) reported negligible penetration of the nose 2407 and mouth by iodine vapour. However, Black and Hounam found that deposition was not 2408 complete (typically ~70%) and estimated that in normal breathing rather less than 50% of 2409 iodine vapour would be deposited in the "nasopharyngeal region" and the rest in the 2410 tracheobronchial region. Measurements of retention in different parts of the nasal passage 2411 were made with collimated detectors from 5 to 100 minutes after deposition. These showed 2412 that there was some deposition in the nasal vestibule (ET1), but the fraction deposited there 2413 was not estimated. They estimated a clearance half-time from the nasopharynx of about 30 2414 minutes, but this would not have included clearance during the first few minutes. 2415
(180) Analyses of the results of these human volunteer experiments were carried out by the 2416 Task Group to estimate the rate of absorption of iodine from respiratory tract to blood (sr) 2417 following its inhalation in elemental form. A compartment model was set up using the 2418 updated HRTM and the systemic model for iodine described below, and applied to estimate 2419 values of fractional regional deposition and sr using the reported measurements of 132I in the 2420 thyroid and urine. Some parameter values in the systemic model were normalised to the 2421 individual subject using reported measurements of 132I in the thyroid and urine following 2422 ingestion of 132I-labelled sodium iodide by the same subject. From the reported observations 2423 (see above) and for simplicity, it was assumed that deposition occurred only in ET2 and BB. It 2424 was found that the results were insensitive to the ratio of deposition between these regions 2425 and the assumption was made of 50% deposition in ET2 and 50% in BB. On that basis, the 2426 rate of absorption of iodine from respiratory tract to blood (sr) was estimated to be 2427 approximately 100 d–1. As described below, based on this assessment, and the results of 2428
DRAFT REPORT FOR CONSULTATION: DO NOT REFERENCE
63
studies in which iodine was deposited in the respiratory tract as sodium iodide and in a 2429 caesium chloride vector, a value of sr of 100 d–1 is applied here to Type F forms of iodine. 2430 Hence for elemental iodine it is assumed here that there is 100% deposition in the respiratory 2431 tract but in the upper airways (50% ET2 and 50% BB), with Type F absorption. 2432 2433 Methyl iodide (CH3I) 2434
(181) Detailed studies have been conducted in human volunteers of the deposition and 2435 subsequent biokinetics of iodine inhaled as CH3I (Morgan et al., 1967a,b; Morgan and 2436 Morgan, 1967). The amount retained varied from 50 to 90% (average 70%), increasing with 2437 decreasing number of breaths per minute. It was inferred that most of it deposited in the 2438 alveoli. Absorption to blood of the deposited activity was very rapid (estimated half-time 2439 about 5 seconds). Subsequent biokinetics were very similar to those of injected iodide, 2440 suggesting that the CH3I is rapidly metabolised. For methyl iodide it is therefore assumed 2441 here that there is 70% deposition in the respiratory tract (with default regional distribution, 2442 Table 5-2) and Type V absorption. 2443 2444 Ethyl iodide (C2H5I) 2445
(182) The retention of 132I-labelled ethyl iodide (C2H5I) inhaled by human volunteers was 2446 in the range 44 to 62%, slightly lower than the same group of subjects exposed to methyl 2447 iodide (53 to 81%) (Morgan et al, 1968b). Urinary excretion of 132I also occurred at a slower 2448 rate than that following inhalation of 132I-labelled methyl iodide. For ethyl iodide it is 2449 therefore assumed here that there is 60% deposition in the respiratory tract (with default 2450 regional distribution, Table 5-2) and Type V absorption. 2451 2452 (b) Particulate aerosols 2453 2454 Sodium iodide (NaI) 2455
(183) Iodine inhaled as sodium iodide is rapidly absorbed into blood. Thiéblemont et al. 2456 (1965a,b) studied excretion and thyroid uptake of 131I following inhalation of 131I-labelled NaI 2457 by rhesus monkeys, and noted that excretion was similar to that for intravenously injected 2458 131I. Perrault et al. (1967) investigated the absorption from the respiratory tract of 131I 2459 following inhalation of 131I-labelled NaI by rhesus monkeys. At 13 minutes after the end of a 2460 30-minute exposure, 82% of activity had been absorbed from the respiratory tract to blood. A 2461 compartment model fit by the authors to measurements of 131I in lung and blood gave a half-2462 time for absorption between 2.5 and 10 minutes, i.e. a rate of the order of 100 d–1. Dawson et 2463 al. (1985) measured absorption of 131I in isolated perfused rabbit lung exposed to an aerosol 2464 containing 125I-labelled NaI. They calculated a half-time for absorption of about 10 minutes, 2465 corresponding to a rate of ~100 d–1. Although specific parameter values for sodium iodide 2466 based on in vivo data are available, they are not adopted here. Instead, sodium iodide is 2467 assigned to Type F. However, the data are used as the basis for the default rapid dissolution 2468 rate for iodine. Hence specific parameter values for sodium iodide would be the same as 2469 default Type F iodine parameter values. 2470 2471 Caesium chloride vector 2472
(184) Thomas et al. (1970) followed the biokinetics of 131I for 70 days after inhalation of 2473 131I associated with caesium chloride vector aerosols by rats. Immediately after the 10-minute 2474 exposure the lung contained only about 1% of the initial body content. By 24 hours, there 2475 were high concentrations in thyroid and pelt. Whole-body retention to 70 days was similar to 2476

DRAFT REPORT FOR CONSULTATION: DO NOT REFERENCE
64
that in rats following intravenous injection of 131I. Thus absorption from lungs to blood was 2477 rapid, of the order of 100 d–1. The biokinetics of 131I were followed for 30 days after 2478 inhalation of 131I associated with caesium chloride vector aerosols by dogs (McClellan and 2479 Rupprecht, 1968). It was noted that the maximum thyroid uptake (as a fraction of initial body 2480 content) and the time after intake at which the maximum thyroid uptake was reached were 2481 very similar for inhaled, ingested, or intravenously injected 131I, which demonstrated the 2482 soluble nature of iodide in body fluids. Although specific parameter values for iodine in a 2483 caesium chloride vector based on in vivo data are available, they are not adopted here. 2484 Instead, it is assigned to Type F. However, the data are used as the basis for the default rapid 2485 dissolution rate for iodine. Hence specific parameter values would be the same as default 2486 Type F iodine parameter values. 2487 2488 Silver iodide (AgI) 2489
(185) Following inhalation of 131I-labelled silver iodide by mice and sheep (Bair, 1961; 2490 Willard and Bair, 1961), the 131I was rapidly absorbed from the lungs, even though silver 2491 iodide was studied because it is one of the most insoluble iodine compounds in water. Lung 2492 retention of 110mAg following inhalation of 110mAg-labelled silver iodide by dogs and rats 2493 (Morrow et al., 1968) was consistent with assignment to Type M (see silver section). 2494 However, Morrow et al. noted that during aerosolisation some conversion to silver oxide 2495 probably occurs. Hence it appears that the rapid absorption of 131I observed by Bair et al. is 2496 probably not inconsistent with the slow absorption of silver reported by Morrow et al., and 2497 iodine inhaled as silver iodide is assigned here to default Type F. 2498 2499 Irradiated fuel fragments 2500
(186) Mirell and Blahd (1989) made whole-body measurements of activity on seven people 2501 from about two weeks to several months after exposure to the initial Chernobyl reactor 2502 accident plume in Kiev, Ukraine. Biological retention half-times were similar for different 2503 radionuclides (23 days for 131I) and different from those expected for systemic retention, 2504 indicating that they were trapped in particles and metabolically inert, thus indicating Type M 2505 rather than Type F behaviour. 2506
(187) In view of the limited information available, these data are judged to be an 2507 insufficient basis to provide specific absorption parameter values. Considerable variability 2508 has been observed in the behaviour of caesium associated with irradiated fuel fragments (see 2509 caesium section), for which much more information is available. Since this is also likely to 2510 be the case for iodine, this form is not assigned specifically to a default Type here. 2511 2512 Default rapid dissolution rate for iodine 2513
(188) Studies with elemental iodine, sodium iodide, and iodine in a caesium chloride 2514 vector outlined above give values of sr of about 100 d–1, which is applied here to all Type F 2515 forms of iodine. 2516 2517 Extent of binding of iodine to the respiratory tract 2518
(189) Evidence from the various experimental studies outlined above suggests that there is 2519 probably little binding of iodine. It is therefore assumed that for iodine the bound state can be 2520 neglected, i.e. fb = 0.0. 2521 2522
2523

DRAFT REPORT FOR CONSULTATION: DO NOT REFERENCE
65
2524 Table 5-2. Deposition and absorption for gas and vapour forms of iodinea 2525
2526 Chemical form/origin
Fraction deposited (%)b Absorption Total ET1 ET2 BB bb AI Type fA
Elemental iodine, I2 100 0 50 50 0 0 F 1.0 Methyl iodide, CH3I 70c 0 14 7 14 35 V (d) Ethyl iodide, C2H5I 60c 0 12 6 12 30 V (d) Unspecifieda 100 0 50 50 0 0 F 1.0 a For iodine in unspecified gas or vapour form, the behaviour assumed is the same as that for elemental iodine: 2527
100% deposition (50% ET2 and 50% BB) with Type F absorption. 2528 b Fraction deposited refers to how much of the material in the inhaled air remains in the body after exhalation. 2529
Almost all inhaled gas molecules contact airway surfaces, but usually return to the air unless they dissolve in, 2530 or react with, the surface lining. 2531
c Since instantaneous absorption to blood (Type V) is assumed, calculations can be performed assuming direct 2532 injection into blood, and the regional deposition does not need to be considered. Nevertheless, for 2533 completeness, the deposits in each region are assumed to be distributed in the same proportions as in the 2534 default distribution for gases and vapours: 20% ET2, 10% BB, 20% bb and 50% AI. 2535
d Not applicable for absorption Type V, because all activity deposited in the respiratory tract is instantaneously 2536 absorbed. 2537
2538 Table 5-3. Absorption parameter values for inhaled particulate forms of iodine and for ingested 2539 iodine 2540 2541
Inhaled particulate materials
Absorption parameter valuesa
Absorption from the alimentary tract, fA fr sr (d–1) ss (d–1)
Default parameter valuesb,c Absorption Type
Assigned forms
F Sodium iodide; caesium chloride vector, silver iodide, all unspecified formsd
1 100 – 1
M — 0.2 3 0.005 0.2 S — 0.01 3 1x10⁻⁴ 0.01 Ingested materials All unspecified forms 1
a It is assumed that for iodine the bound state can be neglected i.e. fb = 0. The value of sr for Type F forms of 2542 iodine (100 d–1) is element-specific. The values for Types M and S (3 d–1) are the general default values. 2543
b Materials (e.g. sodium iodide) are generally listed here where there is sufficient information to assign to a 2544 default absorption Type, but not to give specific parameter values (see text). 2545
c For inhaled material deposited in the respiratory tract and subsequent cleared by particle transport to the 2546 alimentary tract, the default fA values for inhaled materials are applied: i.e. the product of fr for the absorption 2547 Type and the fA value for ingested soluble forms of iodine (1.0). 2548
d Default Type F is recommended for use in the absence of specific information, i.e. if the form is unknown, or 2549 if the form is known but there is no information available on the absorption of that form from the respiratory 2550 tract. 2551
2552 5.2.2. Ingestion 2553 2554
(190) The absorption of iodide from the gastrointestinal tract of humans is virtually 2555

DRAFT REPORT FOR CONSULTATION: DO NOT REFERENCE
66
complete with reported values of 0.9 and greater (Riggs, 1952; Willard and Bair, 1961; 2556 Wayne et al, 1964; Underwood, 1971). Keating and Albert (1949) reported a rate of 2557 absorption of about 5% min-1 in fasted individuals, with complete absorption within 2 hours. 2558 Iodide absorption depends, however, on the redox conditions in the gastrointestinal tract. 2559 Mechanistic studies indicate that some oxidizing agents such as chlorine-based disinfectants 2560 oxidize the basal iodide content of the gastrointestinal tract and decrease its bioavailability 2561 (Bercz et al., 1986). 2562
(191) For other chemical forms, absorption is less complete. Results obtained for iodine 2563 administered to humans as thyroxine suggested absorption of 0.80 - 0.85 (Wayne et al., 2564 1964). Similar experiments using 125Iodine incorporated in trypsin and given by direct 2565 introduction into the duodenum to one volunteer showed that significant amount of 2566 radioactivity appeared in blood within 4 minutes and increased to a maximum by 75 minutes. 2567 The total activity absorbed in this experiment was about 11% of the ingested activity (Lake-2568 Bakaar et al., 1980). By contrast, other studies performed on 9 healthy individuals with [131I]-2569 labelled trypsin showed absorption of about 0.78-0.98 with a peak of activity in the plasma 1 2570 hour after administration (Bohe et al., 1986). These authors showed that only free 131I is 2571 absorbed into the circulation, demonstrating a deiodinating mechanism in the intestine. This 2572 variability in iodine absorption between individuals may be partly explained by genetic 2573 polymorphism (Mithen, 2007). 2574
(192) Studies in animals have shown that in dogs, free iodine and iodate are converted to 2575 iodide prior to absorption (Cohn, 1932). High values of absorption (>0.7 – 1) have been 2576 reported for absorption of iodine and iodide in goats and cattle, as summarized by Coughtrey 2577 et al. (1983). 2578
(193) In Publication 30 (ICRP, 1979), an absorption value1 of 1 was recommended for all 2579 chemical forms of I. This value was adopted in Publication 56 (ICRP, 1989) for dietary 2580 intakes. An fA of 1 is used here for all forms. 2581 2582 5.2.3. Systemic Distribution, Retention and Excretion 2583 2584 5.2.3.1. Summary of the database 2585 2586 Iodine requirements in adult humans 2587
(194) Iodine is an essential component of the thyroid hormones thyroxine (T4) and 2588 triiodothyronine (T3), which regulate metabolic processes and are critical to growth and 2589 development (Utiger, 2001; BEST, 2005; Delange and Dunn, 2005). Several tens of 2590 micrograms of inorganic iodide are trapped daily by the adult human thyroid and used for 2591 synthesis of T4 and T3. T4 is produced only in the thyroid and represents >90% of the 2592 hormonal iodine secreted by the thyroid. About 20% of the circulating T3 is produced in the 2593 thyroid, and the rest is produced from T4 in extra-thyroidal tissues through a process 2594 involving removal of a single iodine atom from T4. T3 is more active than T4 and exerts most 2595 of the effects of the thyroid hormones in the body (Greenspan, 2004; BEST, 2005; Bianco and 2596 Larsen, 2005). 2597
(195) Iodine is largely recycled by the body after use of T4 and T3 by tissues, but the 2598 body’s supply must be supplemented with dietary iodine due to obligatory losses in excreta. 2599 The World Health Organization (WHO) recommends daily intake of 150 μg of iodine by 2600 adults and 200 μg during pregnancy and lactation to ensure adequate production of thyroid 2601 hormones and prevention of goiter and hypothyroidism (WHO, 2001; FAO/WHO, 2002). 2602 WHO defines dietary iodine intake of 50-99 µg d-1 (or 50-99 µg L-1 urine, assuming a daily 2603

DRAFT REPORT FOR CONSULTATION: DO NOT REFERENCE
67
urine volume of 1 L and ignoring losses along other excretion routes) as mild iodine 2604 deficiency, 20-49 µg d-1 as moderate iodine deficiency, and <20 µg d-1 as severe iodide 2605 deficiency. Extensive survey data on dietary and urinary iodine (Parr et al., 1992; O’Hare et 2606 al., 1998; Iyengar et al., 2004; WHO, 2004; Delange and Dunn, 2005; Caldwell et al., 2005) 2607 indicate that iodine intake is at or above recommended levels in much of the world but is 2608 mildly to severely deficient in many regions. Daily intake of iodine typically is 30-40% lower 2609 in women than in men (Oddie et al., 1970, Fisher et al., 1971; Milakovic et al., 2004, Bilek et 2610 al., 2005; Burman, 2006; CDC, 2008). The following reference values for dietary iodine are 2611 selected on the basis of worldwide survey data: 130 µg d-1 for women, 190 µg d-1 for men, 2612 and 160 µg d-1 as a gender-averaged value. 2613
(196) The following overview of the systemic biokinetics of iodine in adult humans was 2614 excerpted from a review by Leggett (2010). 2615 2616 Absorption and distribution of inorganic iodide 2617
(197) Iodine occurs in foods mainly as inorganic iodide. Other forms of iodine in foods 2618 are reduced to iodide in the alimentary tract before absorption (Cohn, 1932; WHO, 1989). 2619 Absorption is primarily from the small intestine but may occur to some extent from the 2620 stomach and other sites along the alimentary tract (Cohn, 1932; Riggs, 1952; Small et al., 2621 1961). Absorption is rapid and nearly complete in most cases. Keating and Albert (1949) 2622 estimated an absorption rate of about 5% min-1 in fasted individuals, with virtually complete 2623 absorption within 2 hours. Absorption was slower when iodide was ingested with food but was 2624 virtually complete after about 3 hours. More than 99% of iodine orally administered as 2625 potassium iodide was absorbed to blood in normal subjects (Oddie et al., 1964; Fisher et al., 2626 1965). 2627
(198) Absorbed iodide is distributed rapidly throughout the extracellular fluids (ECF). 2628 Most of the iodide that leaves blood is recycled to blood within 1-2 h and much of it is 2629 recycled within a few minutes (Riggs, 1952; Wayne et al., 1964; Hays and Solomon, 1965). 2630
(199) The iodide ion is largely excluded from most cells but rapidly traverses the red blood 2631 cell (RBC) membrane. Equilibration between plasma iodide and RBC iodide occurs in 2632 minutes. The concentration of iodide in RBC water is about the same as in plasma water, 2633 giving about two-thirds as much iodide in the total RBC as in an equal volume of plasma 2634 (Myant et al., 1950; Riggs, 1952). 2635
(200) A substantial portion of iodide entering blood is concentrated in the salivary glands 2636 and stomach wall by active transport. It is subsequently secreted into the alimentary tract 2637 contents in saliva and gastric juice and nearly completely reabsorbed to blood. As a central 2638 estimate the rate of clearance of plasma iodide in saliva plus gastric secretions is about 43 2639 ml/min (range, 36-49 ml/min) (Hays and Solomon, 1965; Harden and Alexander, 1968; 2640 Harden et al., 1969). The concentration of iodine in these secretions is on the order of 30 2641 times its concentration in plasma. There is a delay of about 20 min between uptake of iodine 2642 by the salivary glands and stomach wall and appearance in the stomach contents, and a delay 2643 of about 30 min between the peak concentration in plasma and the peak concentration in 2644 secretions into the alimentary tract (Riggs, 1952; Hays and Wegner, 1965). 2645
(201) The thyroid and kidneys are in competition for blood iodide and hence for the body’s 2646 supply of iodide due to the rapid recycling of total-body iodide through blood. Normally 2647 more than 90% of the loss of iodine from the body is due to renal clearance of iodide. Little 2648 inorganic iodide is lost in faeces. Sweat does not appear to be an important mode of loss of 2649 iodide except perhaps in hot climates or during intense exercise (Wayne et al., 1964; Smyth 2650 and Duntas, 2005). 2651
DRAFT REPORT FOR CONSULTATION: DO NOT REFERENCE
68
(202) Iodide in blood plasma is filtered by the kidneys at the glomerular filtration rate. 2652 About 70% of the filtered iodide is reabsorbed to blood, and the rest enters the urinary 2653 bladder contents and is excreted in urine (Bricker and Hlad, 1955; Vadstrup, 1993). Renal 2654 clearance expressed as the volume of plasma iodide or blood iodide cleared per unit time is 2655 nearly constant over a wide range of plasma concentrations for a given age and gender. As a 2656 central estimate, renal clearance is about 37 ml plasma/min for euthyroid adult males (Berson 2657 et al., 1952; Wayne et al., 1964; Hays and Solomon, 1965). Renal clearance of iodide 2658 expressed as plasma volumes per unit time appears to be about 25-30% lower on average in 2659 women than in men, but fractional loss of total-body iodide in urine per unit time is similar 2660 for men and women (Wayne et al., 1964; Oddie et al., 1966). 2661
(203) The concentration of radioiodide in the kidneys may exceed that in most 2662 extrathyroidal tissues for a brief period after acute input into blood. In rats the peak 2663 concentration in the kidneys occurred about 15 min after intravenous injection (Korolev, 2664 1969; Esposito, 1970), at which time the kidneys contained a few percent of the injected 2665 amount (Korolev, 1969). In rats and mice the concentration of radioiodine in the kidneys was 2666 similar to that of the salivary glands during the early hours after intravenous or intraperitoneal 2667 injection (Esposito, 1970; Dadachova et al., 2002). Data on laboratory animals generally 2668 indicate that the concentration of radioiodide in the kidneys declines rapidly and is not much 2669 greater than that of most other organs by a few hours after administration (Ruegamer, 1953; 2670 Ulmer et al., 1959; Moskalev and Yegorova, 1972). Using imaging data for 124I as a tracer 2671 for 131I in patients with thyroid cancer, Kolbert et al. (2007) estimated that the dose to kidneys 2672 from 131I was on average roughly half of the dose to the salivary glands. 2673
(204) Data on the extent of accumulation of inorganic radioiodide in the liver are variable. 2674 It appears from animal data that the liver typically accumulates a few percent of radioiodide 2675 soon after ingestion or intravenous administration but much less per gram of tissue than the 2676 kidneys (Willard and Bair, 1961; Korolev, 1969; Moskalev and Yegorova, 1972; Dadachova 2677 et al., 2002; Zuckier et al., 2004). 2678 2679 Behavior of iodide and organic iodine in the thyroid 2680
(205) The basic unit of cellular organization within the thyroid is the follicle, a spherical 2681 structure typically a few hundredths of a millimeter in diameter. Each follicle is composed of 2682 a single layer of epithelial cells enclosing a lumen filled with a viscous material called 2683 colloid. The colloid consists mainly of thyroglobulin, a protein synthesized by follicular cells 2684 and secreted into the lumen. Thyroglobulin serves as a matrix for production and storage of 2685 T4 and T3 (Kopp, 2005). 2686
(206) Iodide is actively transported from blood plasma into thyroid follicular cells at the 2687 plasma membrane. A normal thyroid can concentrate the iodide ion to 20-40 times its 2688 concentration in blood plasma. Some of the trapped iodide leaks back into blood, but most of 2689 it diffuses across the follicular cell and enters the follicular lumen where it is converted to 2690 organic iodine. 2691
(207) Berson and Yalow (1955) studied the kinetics of trapping and binding of 2692 intravenously injected 131I by the thyroid in 24 hyperthyroid and 3 euthyroid subjects, first 2693 with no inhibition of binding and later with administration of a drug that inhibited binding. 2694 They concluded that the rate of binding of trapped iodide is much greater than the rate of 2695 return of trapped iodide to blood. When iodide binding was blocked before administration of 2696 131I, activity in the thyroid reached a peak at times varying from several minutes to an hour or 2697 more after injection. In about 80% of the cases the rate of loss of trapped 131I from the 2698 blocked thyroid was in the range 0.015-0.047 min-1 (22-68 d-1). 2699
DRAFT REPORT FOR CONSULTATION: DO NOT REFERENCE
69
(208) Robertson et al. (1971) estimated the rate of binding of trapped iodide by the thyroid 2700 and the rate of return of trapped iodide to plasma (exit rate) in 15 hyperthyroid and 7 2701 euthyroid subjects by kinetic analysis of time-dependent plasma concentrations and thyroid 2702 accumulation of intravenously injected 131I. The estimated binding rate was significantly 2703 greater in hyperthyroid than in euthyroid subjects, but no significant difference was found in 2704 the exit rate in the two groups. The estimated mean exit rate (+/- standard deviation) for all 2705 22 subjects was 0.025 +/- 0.013 min-1 (36 +/- 19 d-1). Estimates of the binding rate averaged 2706 0.110 +/- 0.042 min-1 (160 +/- 60 d-1) in the hyperthyroid subjects and 0.066 +/- 0.039 min-1 2707 (95 +/- 56 d-1) in the euthyroid subjects. 2708
(209) Iodide is transported across the luminal membrane of the follicular cell into the 2709 lumen and oxidized at the cell-colloid interface. The neutral iodine atoms formed by 2710 oxidation of iodide are bound (organified) within the lumen to specific residues of the amino 2711 acid tyrosine. Some tyrosine residues gain one iodine atom, forming monoiodotyrosine (MIT) 2712 and others gain two iodine atoms, forming diiodotyrosine (DIT). T4 is formed within the 2713 lumen by the coupling of two DIT molecules and hence has four iodine atoms, and T3 is 2714 formed within the lumen by coupling of one MIT molecule to one DIT molecule and hence 2715 has three iodine atoms. The lumen typically contains 10-15 times more T4 than T3. 2716
(210) The thyroid adapts to prolonged reductions or increases in iodine intake by adjusting 2717 its rate of uptake of iodide from blood. Adaptation of thyroidal clearance of iodide to dietary 2718 intake results in an inverse relation between net 24-h thyroidal uptake of ingested radioiodine 2719 (U) and average 24-h urinary excretion of stable iodine (E). The uptake rate U also depends 2720 on the mass S of iodine secreted daily by the thyroid. Stanbury et al. (1954) derived the 2721 formula U=S/(S+E) or U=[1+(E/S)]-1, based on the assumption that daily accumulation of 2722 organic iodine by the thyroid is in mass balance with daily secretion S of hormonal iodine. 2723 They derived a central estimate for S of 57 μg d-1 from measurements of E and U in a 2724 relatively large study group, primarily young adult females, with generally low rates of 2725 urinary excretion of stable iodine and high incidence of goiter. The formula U=57/(57+E) is 2726 still widely used to estimate thyroidal uptake of radioiodine on the basis of urinary iodide 2727 (Ermans, 1993; O’Hare et al., 1998). 2728
(211) Zvonova (1989) compiled regional data on dietary intake or urinary excretion of 2729 stable iodine, thyroidal uptake of radioiodine, and mass of the thyroid in adult humans. Data 2730 were collected for populations in Argentina, West Germany, Russia, Denmark, Scotland, 2731 Hungary, West New Guinea, and seven regions in the U.S. Estimated dietary intake Y of 2732 stable iodine ranged from 5-10 μg d-1 in West New Guinea to 250-700 μg d-1 in some regions 2733 of the U.S. The mean fractional uptake of ingested radioiodine by the thyroid after 24 h (U) 2734 was estimated as 0.14-0.15 for populations with intake >400 μg d-1, 0.16-0.27 for intake of 2735 250-330 μg d-1, 0.41-0.45 for intake of 80-85 μg d-1, 0.54-0.59 for intake of 40-54 μg d-1, and 2736 about 0.9 for intake of 5-10 μg d-1. Zvonova derived the relation U = 85/(85+Y) or 2737 U=[1+(Y/85)]-1 based on an assumed balance of daily thyroidal accumulation of organic 2738 iodine and secretion S of hormonal iodine. The value S = 85 μg d-1 was derived by fitting the 2739 collected data for Y and U. 2740
(212) The formulas of Stanbury et al. (1954) and Zvonova (1989) are both broadly 2741 consistent with central estimates of thyroidal uptake of radioiodine in populations with 2742 dietary iodine up to a few hundred micrograms per day but substantially underestimate uptake 2743 in populations with iodine-rich diet. The underestimates apparently arise because the 2744 assumption of balance of thyroidal uptake and hormonal secretion of iodine is invalid at high 2745 levels of dietary stable iodine. The rate of accumulation of organic iodine by the thyroid and 2746 the rate of loss of iodine from the thyroid both appear to increase at high levels of iodine 2747
DRAFT REPORT FOR CONSULTATION: DO NOT REFERENCE
70
intake, but the mass of iodine secreted as thyroid hormones appears to remain unchanged 2748 (Koutras et al., 1964; Fisher et al., 1965; Ohtaki, 1967; Nagataki et al., 1967; Harrison, 1968; 2749 Fisher and Oddie, 1969a). 2750
(213) In adults with iodine sufficient diet the thyroid typically stores 5-15 mg of hormonal 2751 iodine (Riggs, 1952; Fisher and Oddie, 1969b; Hellstern et al., 1978; Handl et al., 1984; 2752 Shapiro et al., 1994; Hays, 2001). Estimates of the rate S of secretion of hormonal iodine by 2753 the thyroid (μg I d-1) in individual euthyroid adult humans range from less than 30 μg d-1 to 2754 more than 150 μg d-1 (Riggs, 1952; Berson and Yalow, 1954; Ingbar and Freinkel, 1955; 2755 Stanbury et al., 1954; Gregerman et al., 1962; Fisher et al., 1965; Fisher and Oddie, 1969a; 2756 Zvonova, 1989). Reference values for adults given in reviews and textbooks generally are in 2757 the range 55-85 μg d-1 (Riggs, 1952; Halnan, 1964; Fisher and Oddie, 1969a; Alexander et al., 2758 1971, DeGroot et al., 1971; Underwood, 1977; Zvonova, 1989). There is a decline of thyroid 2759 hormone secretion with increasing adult age, at least after the fifth or sixth decade 2760 (Gregerman et al., 1962; Fisher et al., 1965; Oddie et al., 1965; Herrmann et al., 1981; 2761 Mariotti, 1995; Sawin, 2005). The secretion rate appears to be about one-third lower on 2762 average in women than in men although there is some overlap is measurements for women 2763 and men (Ingbar and Freinkel, 1955; Fisher et al., 1965; Oddie et al., 1965). The following 2764 reference values of S for workers are based on collected data on thyroidal secretion of iodine 2765 as T4 for ages 18-65 y and the assumption that T4 represents 90% of total secretion of 2766 hormonal iodine: 52 μg d-1 for females, 76 μg d-1 for males, and 64 μg d-1 as a gender-2767 averaged value. 2768
(214) Fractional transfer of iodine from thyroid stores to blood per unit time depends on 2769 the size of current stores, the rate of secretion of thyroid hormones, and the extent of leakage 2770 of iodide from MIT and DIT deiodinated in follicular cells. For example, assuming first-2771 order kinetics and negligible leakage of iodide to blood, thyroidal stores of 5 mg and a 2772 secretion rate of hormonal iodine of 64 μg d-1 correspond to a half-time of about 54 d; stores 2773 of 10 mg and secretion of 76 mg correspond to a half-time of about 91 d; and stores of 15 mg 2774 and a secretion rate of 80 μg d-1 correspond to a half-time of about 130 d. Wellman et al. 2775 (1970) estimated a mean half-time of about 68 d based on data collected from several studies. 2776 In an extensive review of the literature Dunning and Schwartz (1981) determined a range of 2777 21-372 d and a mean of 85 d for adults. Long-term measurements on five workers acutely 2778 exposed to 125I vapor indicated an average biological half-time of about 130 d (Bordell et al, 2779 1972). A biological half-time of 90 d is adopted in this report as a reference value for adults. 2780 2781 Behavior of extrathyroidal T4 and T3 2782
(215) Upon secretion by the thyroid into blood, T4 and T3 are rapidly and almost 2783 completely bound to plasma proteins. Little if any enters the RBC. As a result of protein 2784 binding, clearance of organic iodine from the circulation is slower than removal of the iodide 2785 ion from the circulation. Reported concentrations of protein-bound iodine in blood plasma of 2786 euthyroid subjects generally are in the range 3-8 μg / 100 ml and cluster about 5-6 μg / 100 ml 2787 (Tucker and Keys, 1951; Oppenheimer et al., 1967; Nicoloff and Dowling, 1968; Pittman et 2788 al., 1971; Acland, 1971; Nicoloff et al., 1972). 2789
(216) A number of investigators have studied the kinetics of radio-labeled T4 after 2790 intravenous injection into human subjects (Riggs, 1952; Sterling et al., 1954; Ingbar and 2791 Freinkel, 1955; Sterling, 1958; Lennon et al., 1961; Gregerman et al., 1962; Cavalieri and 2792 Searle, 1966; Oppenheimer et al., 1967; Nicoloff and Dowling, 1968; Wartofsky et al., 1972; 2793 Chopra, 1976; Hays and McGuire, 1980). The removal half-time from blood plasma typically 2794 increases from about 1 h at 20-60 min after injection to about 1 wk at equilibrium. Early 2795

DRAFT REPORT FOR CONSULTATION: DO NOT REFERENCE
71
disappearance from plasma may represent mainly distribution throughout the extracellular 2796 fluids plus uptake by hepatocytes. The slower decline at later times may represent uptake by 2797 cells and binding to intracellular proteins throughout the body, reduction to inorganic iodide 2798 due to use of the hormones by cells, and biliary secretion followed by faecal excretion of part 2799 of the organic iodine entering the liver. External measurements together with liver biopsy 2800 data indicate that the liver accumulates roughly 35% (22-52%) of injected T4 during the first 2801 3-4 hours after administration and contains roughly 25% (14-40%) of extrathyroidal T4 at 2802 equilibrium (Cavalieri and Searle, 1966; Oppenheimer et al., 1967; Nicoloff and Dowling, 2803 1968, Hays and McGuire, 1980). 2804
(217) The kinetics of labeled T3 has been difficult to determine with much precision, in 2805 large part due to interference of iodoproteins generated by metabolism of the injected trace 2806 material (Nicoloff et al., 1972; Hays and McGuire, 1980). Human studies indicate high initial 2807 uptake of labeled T3 by the liver but a shorter retention time than T4 in the liver (Cavalieri et 2808 al., 1970). The liver content at equilibrium has been estimated as 5-21% of the total 2809 extrathyroidal T3 pool (Cavalieri et al., 1970; Hays, 1985). 2810
(218) A portion of T4 or T3 entering the liver is secreted into the small intestine in bile 2811 (Greenspan, 2004). The secreted form is poorly absorbed to blood and is largely excreted in 2812 faeces (Hays, 1985). This accounts for about one-fifth of the loss of organic iodine from 2813 extrathyroidal tissues, and reduction to iodide and return to the blood iodide pool accounts for 2814 the rest (Berson and Yalow, 1954; Ingbar and Freinkel, 1955; Hiss and Dowling, 1962; 2815 Choufoer et al., 1963; Anbar et al., 1965; Hays and Solomon, 1969; Pittman et al., 1971; 2816 Chopra, 1976). Endogenous faecal excretion of organic iodine can become a major source of 2817 loss of iodine during periods of low intake of iodine (Choufoer et al., 1963; Busnardo and 2818 Casson, 1965; Kirchgessner et al., 1999). 2819
(219) Animal studies indicate that the concentration of organic iodine in the kidneys is at 2820 least as high as that in the liver. For example, in rats receiving daily injections of 125I over a 2821 three-week period, the concentration of labeled T4 in kidneys was similar to that in the liver, 2822 about 7 times that in muscle, and more than twice that in heart (Winder and Heninger, 1971). 2823 The concentration of labeled T3 in kidneys was nearly twice that in the liver, 8-9 times that in 2824 muscle, and 4 times that in heart. 2825
(220) Most estimates of the mass of extrathyroidal organic iodine at equilibrium are in the 2826 range 500-1000 μg. Most estimates of the biological half-life of T4 in normal subjects are in 2827 the range 5-9 d (Sterling et al., 1954; Ingbar and Freinkel, 1955; Gregerman et al., 1962; 2828 Anbar et al., 1965; Oppenheimer et al., 1967; Nicoloff and Dowling, 1968; Wartofsky et al., 2829 1972; Chopra, 1976; Hays and McGuire, 1980; ICRP, 1987). The half-life of T3 is about 1 d 2830 (Pittman et al., 1971; Nicoloff et al., 1972; Inada et al., 1975; Chopra, 1976; Bianchi et al., 2831 1978; Hays and McGuire, 1980; BEST, 2005) and that of reverse T3 (rT3) is a few hours 2832 (Chopra, 1976). Extrathyroidal conversion of T4 to T3 or rT3 results, in effect, in an extension 2833 of the half-life of T4. Measurements on 73 euthyroid males of ages 18-91 y indicate that the 2834 rate of T4 production as well as its turnover rate, representing the combined rate of 2835 deiodination and faecal excretion, decrease with age starting some time before age 50 y 2836 (Gregerman et al., 1962). The half-life of labeled T4 was estimated as 6.6 d in young adult 2837 males and 8-9 d after the fifth decade of life (Gregerman et al., 1962). In 165 healthy subjects 2838 in the age range 18-86 y, measured rates of deiodination of T4 were similar in male and 2839 female subjects in the same age groups (Anbar et al., 1965). The half-time of deiodination of 2840 T4 increased with age from about 8 d in the third decade of life to about 13 in the sixth decade 2841 (Anbar et al., 1965). 2842
(221) Nicoloff and Dowling (1968) evaluated the extrathyroidal distribution of 131I-labeled 2843
DRAFT REPORT FOR CONSULTATION: DO NOT REFERENCE
72
T4 in a group of 13 normal subjects. They interpreted external measurements in terms of a 2844 four-compartment model representing blood plasma, extracellular fluid, and hepatic and 2845 extrahepatic cellular fluid spaces. Their results indicate that the liver cleared T4 considerably 2846 faster than extrahepatic tissues and contained about 14% of extrathyroidal T4 at equilibrium 2847 (Nicoloff and Dowling, 1968). Results of human studies by Oppenheimer et al. (1967) 2848 interpreted in terms of a two-compartment model suggest greater accumulation of T4 in the 2849 liver. 2850
(222) In rats receiving daily injections of 125I over a three-week period, the concentration 2851 of labeled T4 in kidneys was similar to that in the liver, about 7 times that in muscle, and 2852 more than twice that in heart (Winder and Heninger, 1971). The concentration of labeled T3 2853 in kidneys was nearly twice that in the liver, 8-9 times that in muscle, and 4 times that in 2854 heart. 2855 2856 5.2.3.2. Biokinetic model for systemic iodine 2857 2858 Previous models 2859
(223) A number of physiological systems models have been developed to describe 2860 quantitative aspects of the metabolism of iodine as an essential element in humans (Brownell, 2861 1951; Riggs, 1952; Oddie et al., 1955; Hays and Wegner, 1965; Berman et al., 1968; Nicoloff 2862 and Dowling, 1968; DeGroot et al., 1971; Alexander et al., 1971; McGuire and Hays, 1981; 2863 Bazin et al., 1981; Degon et al., 2008). A three-compartment biokinetic model of iodine 2864 developed by Riggs (1952) for applications in physiological and clinical studies has been used 2865 by the ICRP for many years as the basis of its biokinetic models for occupational or 2866 environmental intake of radioiodine. The ICRP model with parameter values applied to 2867 workers in recent reports (ICRP, 1994, 1997) is shown in Figure 5-1. The compartments and 2868 paths of transfer represent absorption of dietary iodine to blood as inorganic iodide; 2869 competition between thyroidal and renal clearance for circulating inorganic iodide; 2870 production, storage, and secretion of hormonal iodine by the thyroid; deiodination of most of 2871 the secreted hormonal iodine and recycling of inorganic iodide; and loss of the remainder of 2872 secreted hormonal iodine in faeces. 2873
(224) Variations of the Riggs model and some more detailed iodine models been 2874 developed for specific applications in radiation protection including: age-specific dosimetry 2875 of internally deposited radioiodine for application to environmental exposures (Stather and 2876 Greenhalgh, 1983; Johnson, 1987; ICRP, 1989); estimation of doses to patients from medical 2877 applications of radioiodine (MIRD, 1975; Robertson and Gorman, 1976; McGuire and Hays, 2878 1981; Hays, 1985; ICRP, 1987; Johannsson et al., 2003); dose to the embryo/fetus or nursing 2879 infant from intake of radioiodine by the mother (Berkovski, 1999a,b, 2002; ICRP, 2002b); 2880 and reduction of radioiodine dose by administration of potassium iodide (Adams and Bonnell, 2881 1962; Ramsden et al., 1967; Zanzonico and Becker, 2000). The model of Berkovski 2882 (1999a,b, 2002) for the pregnant or nursing mother and the model of Johannsson et al. (2003) 2883 designed for applications in nuclear medicine of provide relatively detailed descriptions of the 2884 early biokinetics of inorganic iodide to allow improved dosimetry of short-lived radioiodine. 2885

DRAFT REPORT FOR CONSULTATION: DO NOT REFERENCE
73
2886 Figure 5-1. Biokinetic model for iodine introduced by Riggs (1952) and widely used in 2887 radiation protection, with the ICRP’s current parameter values for workers (ICRP, 2888 1994, 1997). 2889 In recent ICRP documents the compartment “All inorganic iodide in body” is called “Blood”, the compartment 2890 “Organic iodine in thyroid” is called “Thyroid”, and the compartment “Organic iodine in rest of body” is called 2891 “Rest of body”. 2892 2893 Model used in this report 2894
(225) The model for systemic iodine used in this report is taken from a paper by Leggett 2895 (2010). The model describes the biokinetics of systemic iodine in terms of three subsystems: 2896 circulating (extrathyroidal) inorganic iodide; thyroidal iodine (trapping and organic binding of 2897 iodide, and synthesis, storage, and secretion of thyroid hormones); and extrathyroidal organic 2898 iodine. 2899
(226) The structure of the model including connections with the alimentary tract is shown 2900 in Figure 5-2. Baseline transfer coefficients for a male or female worker are listed in Table 2901 5-4. 2902

DRAFT REPORT FOR CONSULTATION: DO NOT REFERENCE
74
2903 2904
Figure 5-2. Structure of the biokinetic model for systemic iodine used in this report. 2905 2906
(227) The modeled behavior of extrathyroidal inorganic iodide is an extension of a model 2907 of Hays and Wegner (1965) based on bioassay and external measurements of 131I in young 2908 adult males during the first 3 h after intravenous injection. The present model adds 2909 compartments representing inorganic iodide in kidneys and liver and adjusts flow rates to 2910 account for differences in model structure and the size of the blood iodide pool compared 2911 with the model of Hays and Wegner. The following compartments are used to describe the 2912 behavior of extrathryoidal inorganic iodide: a compartment representing iodide in blood 2913 plasma plus RBC, treated as a well-mixed pool (Blood 1); Salivary glands; Stomach wall; 2914 Liver 1, representing iodide in the liver; Kidneys 1, representing iodide in kidneys; Other 1, 2915 representing rapidly exchangeable iodide in extracellular fluids of extrathyroidal tissues other 2916 than kidneys and liver; Other 2, representing slowly exchangeable iodide in extrathyroidal 2917 tissues other than kidneys and liver; and a series of compartments representing different 2918 segments of the alimentary tract as represented in the ICRP’s alimentary tract model (ICRP, 2919 2006). 2920
(228) The behavior of iodine in the thyroid is described in terms of two compartments 2921 representing inorganic iodide (Thyroid 1) and organic iodine (Thyroid 2). Thyroid 1 receives 2922 iodide from Blood 1, feeds iodide to Thyroid 2, and leaks some iodide back to Blood 1. 2923 Thyroid 2 converts iodide to organic iodine and transfers organic iodine into the blood 2924 organic iodine pool (Blood 2). An arrow representing leakage of activity from Thyroid 2 into 2925 Blood 1 is included for application of the model to subjects with unusually high dietary 2926 iodine, but the baseline transfer coefficient from Thyroid 2 to Blood 1 is set to zero. 2927

DRAFT REPORT FOR CONSULTATION: DO NOT REFERENCE
75
(229) The modeled behavior of extrathyroidal organic iodine is an extension of a model of 2928 extrathyroidal T4 kinetics developed by Nicoloff and Dowling (1968) from measurements of 2929 131I-labeled T4 in 13 healthy human subjects (7 women and 6 men). The present model adds a 2930 compartment representing organic iodine in the kidneys and assumed to have the same rate of 2931 exchange with blood plasma per gram of tissue as does the liver. The following compartments 2932 are used to describe the behavior of extrathyroidal organic iodine: Blood 2, representing 2933 thyroid hormones bound to plasma proteins; Liver 2, representing organic iodine in liver; 2934 Kidneys 2, representing organic iodine in kidneys; Other 3, representing rapidly exchangeable 2935 organic iodine in extracellular fluids of extrathyroidal tissues other than kidneys and liver; 2936 and Other 4, representing slowly exchangeable organic iodine in extrathyroidal tissues other 2937 than kidneys and liver. 2938
(230) The kidneys and liver are each divided into two compartments to address the 2939 different biokinetics of inorganic iodide and organic iodine. The kidneys are treated explicitly 2940 because they accumulate both inorganic iodide and hormonal iodine to a greater extent than 2941 most extrathyroidal tissues. The liver is treated explicitly mainly because it is an important 2942 repository for hormonal iodine. The iodide content of the liver is addressed for completeness. 2943
(231) Iodine is assumed to be removed from the body only through urinary and faecal 2944 excretion. Iodide moves to Urine after transfer from Blood 1 into Urinary bladder contents. 2945 This represents the net result of glomerular filtration of iodide, reabsorption of much of the 2946 filtered iodide to blood, and transfer of the remainder to the urinary bladder contents followed 2947 by excretion in urine. Organic iodine is excreted in faeces after transfer from Liver 2 to Right 2948 colon, representing the net result of secretion into the small intestine and transfer of 2949 unabsorbed organic iodine to the right colon followed by excretion in faeces. 2950
(232) Assuming that stable iodine intake and excretion are in balance, the transfer 2951 coefficient λ from Blood iodide to Thyroid iodide can be estimated in terms of the dietary 2952 stable iodine Y (μg d-1) and the rate S of secretion of stable iodine by the thyroid (μg d-1) 2953 (Leggett, 2010): 2954 2955
λ = 16.34 / [0.98(Y/S) – 0.2] d-1 (Eq. 5-1) 2956 2957
(233) Thus, λ depends on the ratio Y:S. For example, the ratio Y:S based on reference 2958 values for a male worker is Y: S = 190 μg d-1 : 76 μg d-1 = 2.5. The same ratio is derived 2959 from reference values for a female worker: Y: S = 130 μg d-1 : 52 μg d-1 = 2.5. The resulting 2960 transfer coefficient based on the above formula is 7.26 d-1. 2961
2962
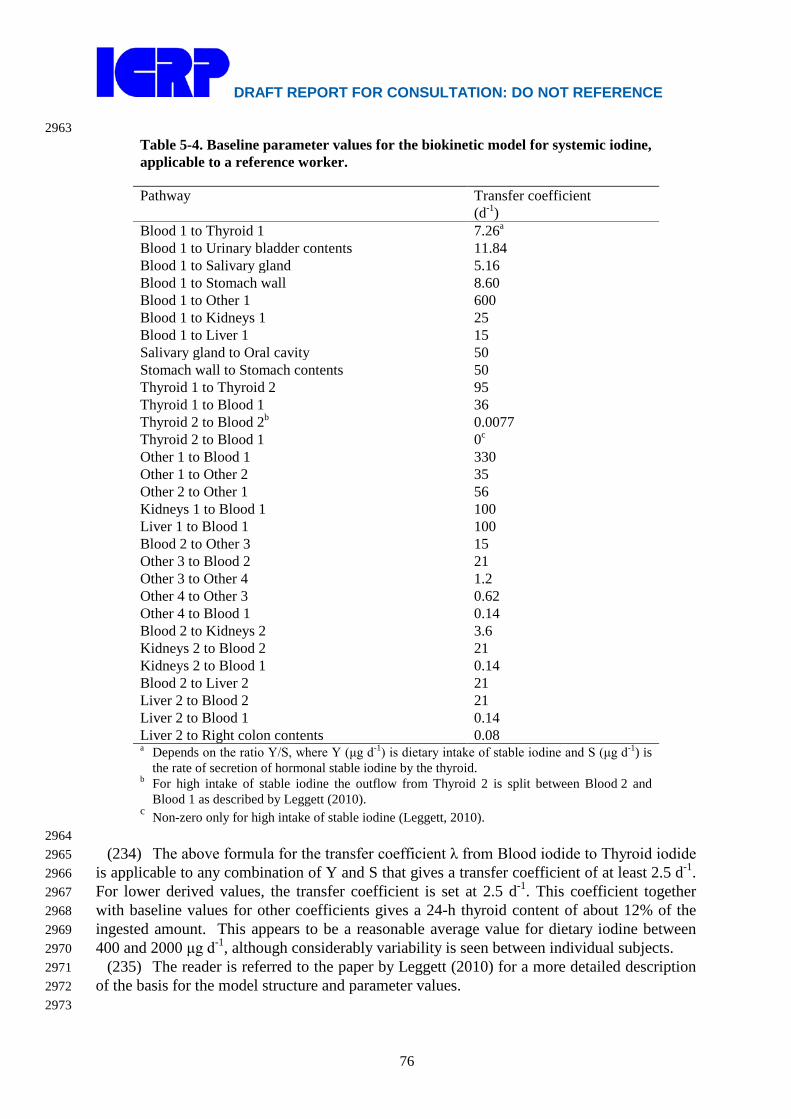
DRAFT REPORT FOR CONSULTATION: DO NOT REFERENCE
76
2963 Table 5-4. Baseline parameter values for the biokinetic model for systemic iodine, applicable to a reference worker. Pathway Transfer coefficient
(d-1) Blood 1 to Thyroid 1 7.26a Blood 1 to Urinary bladder contents 11.84 Blood 1 to Salivary gland 5.16 Blood 1 to Stomach wall 8.60 Blood 1 to Other 1 600 Blood 1 to Kidneys 1 25 Blood 1 to Liver 1 15 Salivary gland to Oral cavity 50 Stomach wall to Stomach contents 50 Thyroid 1 to Thyroid 2 95 Thyroid 1 to Blood 1 36 Thyroid 2 to Blood 2b 0.0077 Thyroid 2 to Blood 1 0c Other 1 to Blood 1 330 Other 1 to Other 2 35 Other 2 to Other 1 56 Kidneys 1 to Blood 1 100 Liver 1 to Blood 1 100 Blood 2 to Other 3 15 Other 3 to Blood 2 21 Other 3 to Other 4 1.2 Other 4 to Other 3 0.62 Other 4 to Blood 1 0.14 Blood 2 to Kidneys 2 3.6 Kidneys 2 to Blood 2 21 Kidneys 2 to Blood 1 0.14 Blood 2 to Liver 2 21 Liver 2 to Blood 2 21 Liver 2 to Blood 1 0.14 Liver 2 to Right colon contents 0.08 a Depends on the ratio Y/S, where Y (μg d-1) is dietary intake of stable iodine and S (μg d-1) is
the rate of secretion of hormonal stable iodine by the thyroid. b For high intake of stable iodine the outflow from Thyroid 2 is split between Blood 2 and
Blood 1 as described by Leggett (2010). c Non-zero only for high intake of stable iodine (Leggett, 2010).
2964 (234) The above formula for the transfer coefficient λ from Blood iodide to Thyroid iodide 2965
is applicable to any combination of Y and S that gives a transfer coefficient of at least 2.5 d-1. 2966 For lower derived values, the transfer coefficient is set at 2.5 d-1. This coefficient together 2967 with baseline values for other coefficients gives a 24-h thyroid content of about 12% of the 2968 ingested amount. This appears to be a reasonable average value for dietary iodine between 2969 400 and 2000 μg d-1, although considerably variability is seen between individual subjects. 2970
(235) The reader is referred to the paper by Leggett (2010) for a more detailed description 2971 of the basis for the model structure and parameter values. 2972 2973

DRAFT REPORT FOR CONSULTATION: DO NOT REFERENCE
77
Model predictions 2974 (236) In the following, predictions of time-dependent activities in tissues and fluids are 2975
based on the following transfer rates involving stomach and small intestine contents: 20.57 d-2976 1 from stomach contents to small intestine contents as a reference value for adult males for 2977 total diet (ICRP, 2006) ; 6 d-1 from small intestine contents to colon contents (ICRP, 2006); 2978 and 594 d-1 from small intestine contents to blood, representing 99% absorption assuming a 2979 competing transfer coefficient of 6 d-1 from small intestine contents to colon contents. 2980
(237) Figures 5-3 and 5-4 show observations (symbols) and model predictions (curves) of 2981 the distribution of radioiodine in the first few hours after intravenous injection into adult 2982 humans. The open circles in these figures represent means for nine healthy young adult males 2983 (Hays and Solomon, 1965); variability of measurements was reported as mean coefficients of 2984 variation, which were approximately 12% and 23% for blood plasma and thyroid, 2985 respectively. The close agreement in Figure 5-3 between predictions and the open circles is to 2986 be expected because the parameter values dominating model predictions in this case were 2987 based in part on these data. The triangles in Figure 5-3 represent median values determined 2988 from graphs of data for 5-13 individual euthyroid patients (Berson et al., 1952); individual 2989 measurements varied by less than 15% from the estimated medians. The plus signs in Figures 2990 5-3 and 5-4 were determined from graphs of mean values for 9-10 euthyroid subjects 2991 (Alexander et al., 1971); variability of measurements was not reported. The model predictions 2992 shown in Figure 5-3 are for total blood iodide. The comparison with observed values assumes 2993 equilibration between blood plasma and RBC water. 2994
(238) In Figure 5-4 the observations are compared with model-generated curves based on 2995 three different values of the transfer coefficient from blood to thyroid. This transfer 2996 coefficient is derived from Eq. 5-2 and depends on the ratio Y/S, where Y is dietary stable 2997 iodine (µg d-1) and S is daily secretion of hormonal iodine by the thyroid (µg d-1). Estimates 2998 of Y and S were not reported for the three study groups addressed in the figure. The group 2999 represented by plus signs (subjects of Alexander et al., 1971) was from a region with 3000 relatively low dietary iodine, suggesting a ratio Y/S less than the baseline value 2.5. The 3001 transfer coefficient based on the ratio Y/S = 2 yields reasonable agreement with thyroidal 3002 uptake data for that group as well as data for the healthy young adult male subjects of Hays 3003 and Solomon (1965). Short-term urinary data for the third group, represented by the single 3004 closed circle, indicate mean iodine intake on the order of 200 μg d-1, suggesting a ratio Y/S 3005 greater than the baseline value 2.5. The transfer coefficient based on the ratio Y/S = 3 is 3006 consistent with mean 2-hour thyroidal uptake for that group. 3007
(239) Model predictions of the percentage U of ingested radioiodine in the thyroid at 24 h 3008 after intake assuming no radioactive decay are compared in Figure 5-5 with observed values 3009 for subjects with different levels E of stable iodine in urine. Model predictions are based on 3010 the transfer coefficients in Table 5-1 except that the transfer coefficient from Blood 1 to 3011 Thyroid 1 was varied with E as described by Eq. 5-3 down to a minimum value of 2.5 d-1. 3012 For this comparison the value S was set at the gender-averaged reference value of 64 μg d-1. 3013
(240) The model with baseline parameter values predicts that the thyroid contains about 3014 29% of ingested or intravenously injected iodine at 24 h after intake, assuming no radioactive 3015 decay. The content of the thyroid is predicted to peak at about 30% of the ingested or injected 3016 amount during the period 24-48 h after intake. 3017 3018 3019 3020

DRAFT REPORT FOR CONSULTATION: DO NOT REFERENCE
78
3021 Figure 5-3. Model predictions of clearance of intravenously injected radioiodine from plasma 3022 compared with central values determined in three studies. 3023 3024
3025 Figure 5-4. Model predictions of thyroidal uptake of intravenously injected 131I compared with 3026 mean values of external measurements for three study groups. 3027 3028

DRAFT REPORT FOR CONSULTATION: DO NOT REFERENCE
79
3029 Figure 5-5. Model predictions and observations of 24-h uptake of radioiodine by thyroid (U) as 3030 a function of daily urinary excretion of stable iodine (E). After Leggett (2010). 3031 3032
(241) Model predictions of the equilibrium content of iodine in the thyroid, concentration 3033 of inorganic iodide and organic iodine in blood, and total extrathoracic contents of inorganic 3034 iodide and organic iodide are listed in Table 5-5 for different combinations of dietary iodine 3035 Y and thyroidal secretion rate S. The predicted values for each of these quantities based on 3036 reference values for dietary stable iodine Y and secretion rate of hormonal iodine S for 3037 women, total adult population, and men (see the first three columns of model predictions) are 3038 within the ranges of reported values for euthyroid subjects. For example, predictions of the 3039 mass of iodide in the thyroid at equilibrium are 6.00, 7.39, and 8.77 g, compared with typical 3040 values of 5-15 mg. Predictions of the concentration of organic iodine in blood plasma are 3041 3.9-5.8 μg/dl, compared with commonly reported values of 3-8 μg/dl. 3042 3043
Table 5-5. Model predictions of mass or concentration of iodine in tissues and fluids at equilibrium Quantity
Dietary iodine(μg d-1) / Thyroidal secretion of organic iodine (μg d-1) 130 / 52a 160 / 64a 190 / 76a 300 / 100b
Iodine in thyroid (μg) 6750 8310 9870 13,000 Iodide in blood plasma (μg dl-1) 0.22 0.27 0.32 0.51 Total extrathyroidal inorganic iodide (μg) 58 71 84 135 Organic iodine in blood plasma (μg dl-1) 4.3 5.2 6.2 8.2 Total extrathyroidal organic iodine (μg) 520 640 760 1000 a Baseline transfer coefficient describing thyroidal uptake (7.26 d-1) is applied because the ratio of
daily intake of iodine Y to daily thyroidal secretion S is 2.5. b Transfer coefficient from Blood iodide to Thyroid iodide is 5.96 d-1 based on Eq. 5-2.
3044 5.2.3.3. Treatment of radioactive progeny 3045 3046
(242) Chain members addressed in the derivation of dose coefficients for iodine isotopes 3047

DRAFT REPORT FOR CONSULTATION: DO NOT REFERENCE
80
are isotopes of iodine, tellurium, antimony, or xenon. Tellurium, antimony, or iodine atoms 3048 produced in systemic compartments are assumed to follow the characteristic models for these 3049 elements (i.e. the models applied in this report to these elements as parent radionuclides) from 3050 their time of production. The implementation of this assumption is not always 3051 straightforward. In some cases, the site of production of antimony or tellurium may not be 3052 clearly identifiable with a specific compartment in its characteristic biokinetic model due to 3053 differences in model structures for the different elements. In such cases a transfer rate from 3054 the site of production of the radionuclide to the central blood compartment in the 3055 radionuclide’s characteristic model has been assigned as described below. After reaching its 3056 central blood compartment, the radionuclide is assumed to behave as described by its 3057 characteristic model. 3058
(243) Tellurium atoms produced in the blood iodide compartment of the iodine model are 3059 assigned to the central blood compartment of the tellurium model. Tellurium atoms produced 3060 in the blood organic iodine compartment of the iodine model are assumed to transfer to the 3061 central blood compartment of the tellurium model at the rate 1000 d-1. Tellurium atoms 3062 produced at soft-tissue sites in the iodine model are assumed to transfer to the central blood 3063 compartment of the tellurium model at the rate 0.0693 d-1 (half-time of 10 d), which is the 3064 rate of removal from all soft tissue compartments in the characteristic model for tellurium. 3065
(244) Antimony produced in the blood iodide compartment of the characteristic model for 3066 iodine or the central blood compartment of the characteristic model for tellurium is assigned 3067 to the central blood compartment of the characteristic model for antimony. Antimony 3068 produced in another blood compartment of the iodine or tellurium model is assumed to 3069 transfer to the central blood compartment of the antimony model at the rate 1000 d-1. 3070 Antimony produced at any soft-tissue site in the iodine or tellurium model is assumed to 3071 transfer to the central blood compartment of the antimony model at the rate 0.693 d-1 (half-3072 time of 1 d), which is the highest rate of removal from all soft tissue compartments in the 3073 characteristic model for antimony. Antimony produced in a bone compartment of the 3074 tellurium model is assumed to behave as if entering that site as a parent radionuclide. 3075
(245) A generic biokinetic model is applied in this report to xenon isotopes produced by 3076 decay of radionuclides in systemic pools. Xenon produced in bone is assumed to transfer to 3077 blood at the rate 100 d-1 if produced in bone surface and 0.36 d-1 if produced in bone volume. 3078 These rates are taken from the model for radon introduced in ICRP Publication 67 (1993). 3079 Xenon produced in a soft-tissue compartment is assumed to transfer to blood with a half-time 3080 of 20 min. Xenon produced in the blood inorganic iodide compartment is assigned to the 3081 blood compartment of the xenon model. Xenon produced in the blood organic iodine 3082 compartment is assumed to transfer to blood in the xenon model at the rate 1000 d-1. Xenon 3083 entering the blood compartment of the xenon model or produced in that compartment is 3084 assumed to be exhaled at the rate 1000 d-1. 3085 3086 5.3. Individual monitoring 3087 3088 125 I 3089
(246) Thyroid monitoring is generally used for the monitoring of 125 I. The urinary 3090 excretion rate decreases rapidly with time following intake and so thyroid monitoring is to be 3091 preferred until the actual time of intake is known. 3092
(247) Ge detectors, in the thyroid counting configuration, should preferably be used 3093 because of the low energy photon emission from 125I. 3094 3095
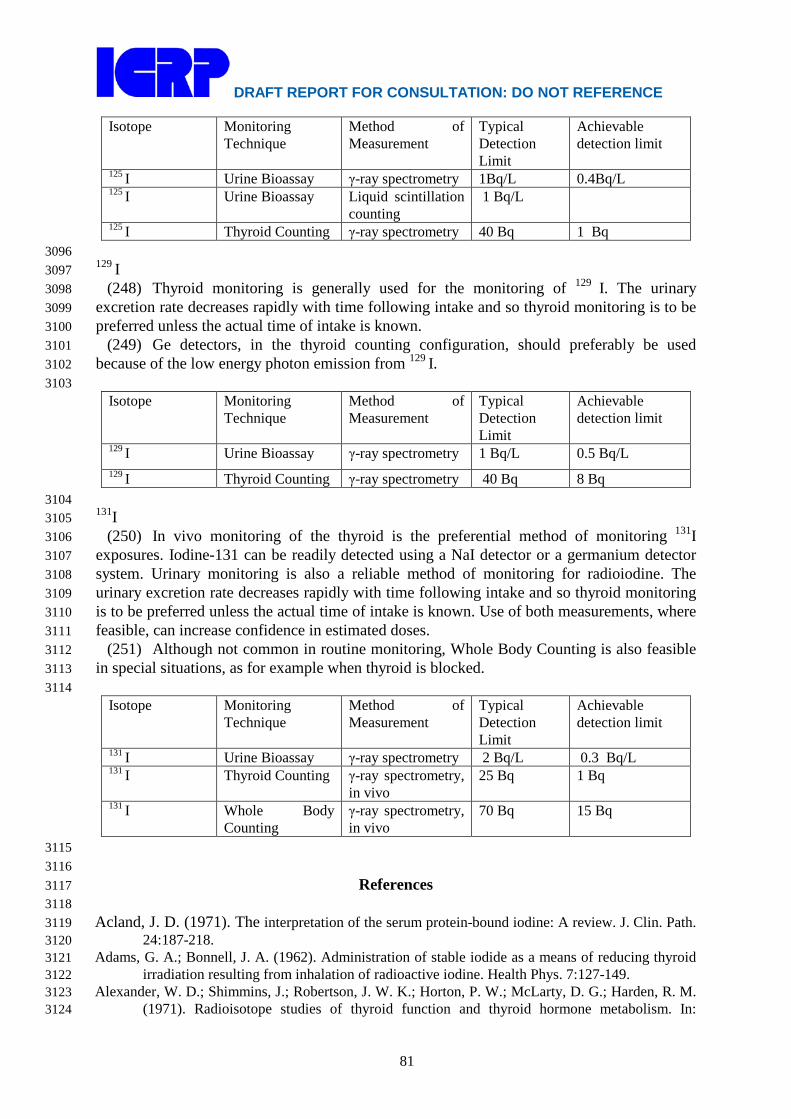
DRAFT REPORT FOR CONSULTATION: DO NOT REFERENCE
81
Isotope Monitoring Technique
Method of Measurement
Typical Detection Limit
Achievable detection limit
125 I Urine Bioassay γ-ray spectrometry 1Bq/L 0.4Bq/L 125 I Urine Bioassay Liquid scintillation
counting 1 Bq/L
125 I Thyroid Counting γ-ray spectrometry 40 Bq 1 Bq 3096 129 I 3097
(248) Thyroid monitoring is generally used for the monitoring of 129 I. The urinary 3098 excretion rate decreases rapidly with time following intake and so thyroid monitoring is to be 3099 preferred unless the actual time of intake is known. 3100
(249) Ge detectors, in the thyroid counting configuration, should preferably be used 3101 because of the low energy photon emission from 129 I. 3102 3103
Isotope Monitoring Technique
Method of Measurement
Typical Detection Limit
Achievable detection limit
129 I Urine Bioassay γ-ray spectrometry 1 Bq/L 0.5 Bq/L 129 I Thyroid Counting γ-ray spectrometry 40 Bq 8 Bq
3104 131I 3105
(250) In vivo monitoring of the thyroid is the preferential method of monitoring 131I 3106 exposures. Iodine-131 can be readily detected using a NaI detector or a germanium detector 3107 system. Urinary monitoring is also a reliable method of monitoring for radioiodine. The 3108 urinary excretion rate decreases rapidly with time following intake and so thyroid monitoring 3109 is to be preferred unless the actual time of intake is known. Use of both measurements, where 3110 feasible, can increase confidence in estimated doses. 3111
(251) Although not common in routine monitoring, Whole Body Counting is also feasible 3112 in special situations, as for example when thyroid is blocked. 3113
3114 Isotope Monitoring
Technique Method of Measurement
Typical Detection Limit
Achievable detection limit
131 I Urine Bioassay γ-ray spectrometry 2 Bq/L 0.3 Bq/L 131 I Thyroid Counting γ-ray spectrometry,
in vivo 25 Bq 1 Bq
131 I Whole Body Counting
γ-ray spectrometry, in vivo
70 Bq 15 Bq
3115 3116
References 3117 3118
Acland, J. D. (1971). The interpretation of the serum protein-bound iodine: A review. J. Clin. Path. 3119 24:187-218. 3120
Adams, G. A.; Bonnell, J. A. (1962). Administration of stable iodide as a means of reducing thyroid 3121 irradiation resulting from inhalation of radioactive iodine. Health Phys. 7:127-149. 3122
Alexander, W. D.; Shimmins, J.; Robertson, J. W. K.; Horton, P. W.; McLarty, D. G.; Harden, R. M. 3123 (1971). Radioisotope studies of thyroid function and thyroid hormone metabolism. In: 3124
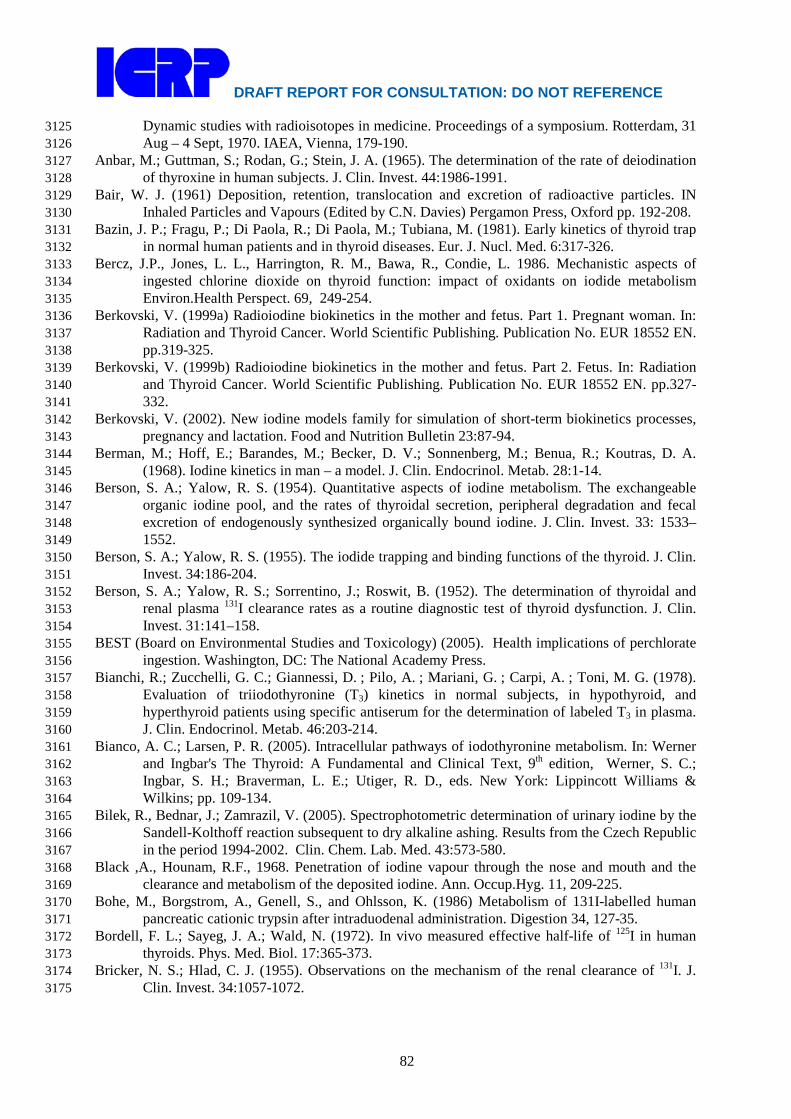
DRAFT REPORT FOR CONSULTATION: DO NOT REFERENCE
82
Dynamic studies with radioisotopes in medicine. Proceedings of a symposium. Rotterdam, 31 3125 Aug – 4 Sept, 1970. IAEA, Vienna, 179-190. 3126
Anbar, M.; Guttman, S.; Rodan, G.; Stein, J. A. (1965). The determination of the rate of deiodination 3127 of thyroxine in human subjects. J. Clin. Invest. 44:1986-1991. 3128
Bair, W. J. (1961) Deposition, retention, translocation and excretion of radioactive particles. IN 3129 Inhaled Particles and Vapours (Edited by C.N. Davies) Pergamon Press, Oxford pp. 192-208. 3130
Bazin, J. P.; Fragu, P.; Di Paola, R.; Di Paola, M.; Tubiana, M. (1981). Early kinetics of thyroid trap 3131 in normal human patients and in thyroid diseases. Eur. J. Nucl. Med. 6:317-326. 3132
Bercz, J.P., Jones, L. L., Harrington, R. M., Bawa, R., Condie, L. 1986. Mechanistic aspects of 3133 ingested chlorine dioxide on thyroid function: impact of oxidants on iodide metabolism 3134 Environ.Health Perspect. 69, 249-254. 3135
Berkovski, V. (1999a) Radioiodine biokinetics in the mother and fetus. Part 1. Pregnant woman. In: 3136 Radiation and Thyroid Cancer. World Scientific Publishing. Publication No. EUR 18552 EN. 3137 pp.319-325. 3138
Berkovski, V. (1999b) Radioiodine biokinetics in the mother and fetus. Part 2. Fetus. In: Radiation 3139 and Thyroid Cancer. World Scientific Publishing. Publication No. EUR 18552 EN. pp.327-3140 332. 3141
Berkovski, V. (2002). New iodine models family for simulation of short-term biokinetics processes, 3142 pregnancy and lactation. Food and Nutrition Bulletin 23:87-94. 3143
Berman, M.; Hoff, E.; Barandes, M.; Becker, D. V.; Sonnenberg, M.; Benua, R.; Koutras, D. A. 3144 (1968). Iodine kinetics in man – a model. J. Clin. Endocrinol. Metab. 28:1-14. 3145
Berson, S. A.; Yalow, R. S. (1954). Quantitative aspects of iodine metabolism. The exchangeable 3146 organic iodine pool, and the rates of thyroidal secretion, peripheral degradation and fecal 3147 excretion of endogenously synthesized organically bound iodine. J. Clin. Invest. 33: 1533–3148 1552. 3149
Berson, S. A.; Yalow, R. S. (1955). The iodide trapping and binding functions of the thyroid. J. Clin. 3150 Invest. 34:186-204. 3151
Berson, S. A.; Yalow, R. S.; Sorrentino, J.; Roswit, B. (1952). The determination of thyroidal and 3152 renal plasma 131I clearance rates as a routine diagnostic test of thyroid dysfunction. J. Clin. 3153 Invest. 31:141–158. 3154
BEST (Board on Environmental Studies and Toxicology) (2005). Health implications of perchlorate 3155 ingestion. Washington, DC: The National Academy Press. 3156
Bianchi, R.; Zucchelli, G. C.; Giannessi, D. ; Pilo, A. ; Mariani, G. ; Carpi, A. ; Toni, M. G. (1978). 3157 Evaluation of triiodothyronine (T3) kinetics in normal subjects, in hypothyroid, and 3158 hyperthyroid patients using specific antiserum for the determination of labeled T3 in plasma. 3159 J. Clin. Endocrinol. Metab. 46:203-214. 3160
Bianco, A. C.; Larsen, P. R. (2005). Intracellular pathways of iodothyronine metabolism. In: Werner 3161 and Ingbar's The Thyroid: A Fundamental and Clinical Text, 9th edition, Werner, S. C.; 3162 Ingbar, S. H.; Braverman, L. E.; Utiger, R. D., eds. New York: Lippincott Williams & 3163 Wilkins; pp. 109-134. 3164
Bilek, R., Bednar, J.; Zamrazil, V. (2005). Spectrophotometric determination of urinary iodine by the 3165 Sandell-Kolthoff reaction subsequent to dry alkaline ashing. Results from the Czech Republic 3166 in the period 1994-2002. Clin. Chem. Lab. Med. 43:573-580. 3167
Black ,A., Hounam, R.F., 1968. Penetration of iodine vapour through the nose and mouth and the 3168 clearance and metabolism of the deposited iodine. Ann. Occup.Hyg. 11, 209-225. 3169
Bohe, M., Borgstrom, A., Genell, S., and Ohlsson, K. (1986) Metabolism of 131I-labelled human 3170 pancreatic cationic trypsin after intraduodenal administration. Digestion 34, 127-35. 3171
Bordell, F. L.; Sayeg, J. A.; Wald, N. (1972). In vivo measured effective half-life of 125I in human 3172 thyroids. Phys. Med. Biol. 17:365-373. 3173
Bricker, N. S.; Hlad, C. J. (1955). Observations on the mechanism of the renal clearance of 131I. J. 3174 Clin. Invest. 34:1057-1072. 3175

DRAFT REPORT FOR CONSULTATION: DO NOT REFERENCE
83
Brownell, G. L. (1951). Analysis of techniques for the determination of thyroid function with 3176 radioiodine. J. Clin. Endocrinol. 11:1095-1105. 3177
Burman, K. D. (2006). Low iodine diets. In: L. Wartofsky and D. Van Nostrand, Thyroid Cancer, A 3178 comprehensive guide to clinical management, Second edition. Totowa, NJ: Human Press. pp. 3179 677-681. 3180
Busnardo, B.; Casson, F. (1965). Aspects of fecal iodine excretion in man. Acta. Isot. (Padova) 31:5-3181 13. 3182
Caldwell, K. L.; Jones, R.; Hollowell, J. G. (2005). Urinary iodine concentration: United States 3183 National Health and Nutrition Examination Survey 2001-2002. Thyroid 15:692-699. 3184
Cavalieri, R. R.; Searle, G. L. (1966). The kinetics of distribution between plasma and liver of 131I-3185 labeled L-thyroxine in man : Observations of subjects with normal and decreased serum 3186 thyroxine-binding globulin. J. Clin. Invest. 45: 939-949. 3187
Cavalieri, R. R.; Steinberg, M. ; Searle, G. L. (1970). The distribution kinetics of triiodothyronine: 3188 Studies of euthyroid subjects with decreased plasma thyroxine-binding globulin and patients 3189 with Graves' disease. J. Clin. Invest. 49:1041-1050. 3190
CDC (2008). U.S. Centers for Disease Control and Prevention: National report on biochemical 3191 indicators of diet and nutrition in the U.S. population 1999–2002. Available from: 3192 http://www.cdc.gov/nutritionreport/index.html. 3193
Chopra, I. J. (1976). An assessment of daily production and significance of thyroidal secretion of 3, 3194 3’,5’-triiodothyronine (reverse T3) in man. J. Clin. Invest. 58:32-40. 3195
Choufoer, J. C.; van Rhijn, M.; Kassenaar, A. A.; Querido, A. (1963). Endemic goiter in Western 3196 New Guinea: Iodine metabolism in goitrous and nongoitrous subjects. J. Clin. Endocrinol. 3197 Metab. 23:1203-1218. 3198
Cohn, B. N. E. (1932). Absorption of compound solution of iodine from the gastro-intestinal tract. 3199 Arch. Intern. Med. 49:950-956. 3200
Coughtrey, P., Jackson, D. and Thorne, M. (1983) Radionuclide distribution and transport in 3201 terrestrial and aquatic ecosystems. Vol. 3. A.A. Balkema, Rotterdam. pp.341-346. 3202
Dadachova, E.; Bouzahzah, B.; Zuckier, L. S.; Pestell, R. G. (2002). Rhenium-188 as an alternative to 3203 iodine-131 for treatment of breast tumors expressing the sodium/iodide symporter (NIS). 3204 Nucl. Med. Biol. 29:13-18. 3205
Dawson, C. A., Skebba, S. C., Lineham, J. H. and Bronikowski, T. A. (1985) Influence of pulmonary 3206 embolism on absorption of inhaled iodide-125. J. Appl. Physiol. 58, 1061-1068. 3207
Degon, M.; Chipkin, S.; Hollot, C. V.; Zoeller, T.; Chait, Y. (2008). A computational model of the 3208 human thyroid. Math Biosci. 212:22-53. 3209
DeGroot, L. J.; Decostre, P.; Phair, R. (1971). A mathematical model of human iodine metabolism. J. 3210 Clin. Endocr. 32:757-765. 3211
Delange, F. M.; Dunn, J. T. (2005). Iodine deficiency. In: Werner and Ingbar's The Thyroid: A 3212 Fundamental and Clinical Text, 9th edition, Werner, S. C.; Ingbar, S. H.; Braverman, L. E.; 3213 Utiger, R. D., eds. New York: Lippincott Williams & Wilkins; pp. 264-288. 3214
Dunning, D. E.; Schwarz, G. (1981).Variability of human thyroid characteristics and estimates of 3215 dose from ingested 131I. Health Phys. 40:661-675. 3216
Ermans, A. M. (1993). Iodine kinetics in iodine deficiency. In: Delange, F.; Dunn, J. T.; Glinoer, D., 3217 eds. Iodine deficiency in Europe: A continuing concern. New York: Plenum; pp. 51-56. 3218
Esposito, E. J. (1970). 131I concentration in submaxillary glands and other tissues of rats. J. Dent. Res. 3219 49:459. 3220
FAO/WHO (2002). Chapter 12. Iodine. In: Human vitamin and mineral requirements. Report of a 3221 joint FAO/WHO expert consultation. Bangkok, Thialand. Food and Agriculture Organization 3222 of the United Nations.World Health Organization. Update of March 12, 2002. pp. 181-194. 3223
Fisher, D. A.; Oddie, T. H. (1969a). Thyroidal radioiodine clearance and thyroid iodine 3224 accumulation: Contrast between random daily variation and population data. J. Clin. 3225 Endocrinol. Metab. 29:111-115. 3226
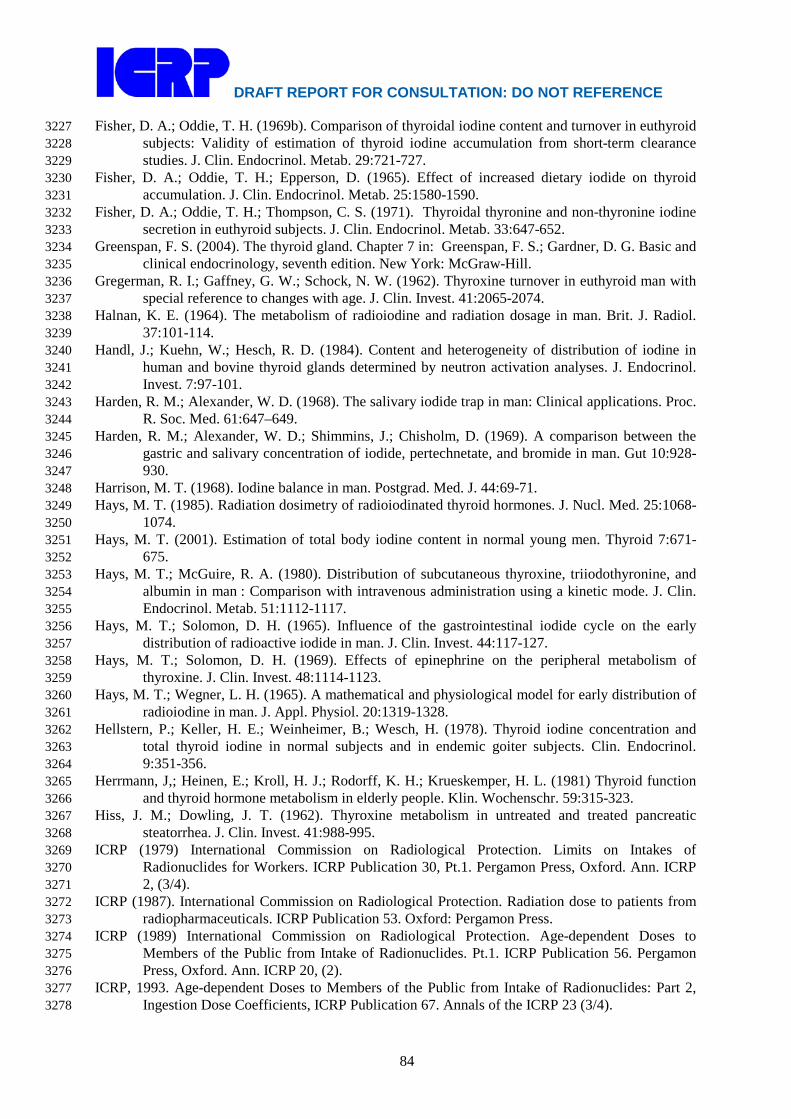
DRAFT REPORT FOR CONSULTATION: DO NOT REFERENCE
84
Fisher, D. A.; Oddie, T. H. (1969b). Comparison of thyroidal iodine content and turnover in euthyroid 3227 subjects: Validity of estimation of thyroid iodine accumulation from short-term clearance 3228 studies. J. Clin. Endocrinol. Metab. 29:721-727. 3229
Fisher, D. A.; Oddie, T. H.; Epperson, D. (1965). Effect of increased dietary iodide on thyroid 3230 accumulation. J. Clin. Endocrinol. Metab. 25:1580-1590. 3231
Fisher, D. A.; Oddie, T. H.; Thompson, C. S. (1971). Thyroidal thyronine and non-thyronine iodine 3232 secretion in euthyroid subjects. J. Clin. Endocrinol. Metab. 33:647-652. 3233
Greenspan, F. S. (2004). The thyroid gland. Chapter 7 in: Greenspan, F. S.; Gardner, D. G. Basic and 3234 clinical endocrinology, seventh edition. New York: McGraw-Hill. 3235
Gregerman, R. I.; Gaffney, G. W.; Schock, N. W. (1962). Thyroxine turnover in euthyroid man with 3236 special reference to changes with age. J. Clin. Invest. 41:2065-2074. 3237
Halnan, K. E. (1964). The metabolism of radioiodine and radiation dosage in man. Brit. J. Radiol. 3238 37:101-114. 3239
Handl, J.; Kuehn, W.; Hesch, R. D. (1984). Content and heterogeneity of distribution of iodine in 3240 human and bovine thyroid glands determined by neutron activation analyses. J. Endocrinol. 3241 Invest. 7:97-101. 3242
Harden, R. M.; Alexander, W. D. (1968). The salivary iodide trap in man: Clinical applications. Proc. 3243 R. Soc. Med. 61:647–649. 3244
Harden, R. M.; Alexander, W. D.; Shimmins, J.; Chisholm, D. (1969). A comparison between the 3245 gastric and salivary concentration of iodide, pertechnetate, and bromide in man. Gut 10:928-3246 930. 3247
Harrison, M. T. (1968). Iodine balance in man. Postgrad. Med. J. 44:69-71. 3248 Hays, M. T. (1985). Radiation dosimetry of radioiodinated thyroid hormones. J. Nucl. Med. 25:1068-3249
1074. 3250 Hays, M. T. (2001). Estimation of total body iodine content in normal young men. Thyroid 7:671-3251
675. 3252 Hays, M. T.; McGuire, R. A. (1980). Distribution of subcutaneous thyroxine, triiodothyronine, and 3253
albumin in man : Comparison with intravenous administration using a kinetic mode. J. Clin. 3254 Endocrinol. Metab. 51:1112-1117. 3255
Hays, M. T.; Solomon, D. H. (1965). Influence of the gastrointestinal iodide cycle on the early 3256 distribution of radioactive iodide in man. J. Clin. Invest. 44:117-127. 3257
Hays, M. T.; Solomon, D. H. (1969). Effects of epinephrine on the peripheral metabolism of 3258 thyroxine. J. Clin. Invest. 48:1114-1123. 3259
Hays, M. T.; Wegner, L. H. (1965). A mathematical and physiological model for early distribution of 3260 radioiodine in man. J. Appl. Physiol. 20:1319-1328. 3261
Hellstern, P.; Keller, H. E.; Weinheimer, B.; Wesch, H. (1978). Thyroid iodine concentration and 3262 total thyroid iodine in normal subjects and in endemic goiter subjects. Clin. Endocrinol. 3263 9:351-356. 3264
Herrmann, J,; Heinen, E.; Kroll, H. J.; Rodorff, K. H.; Krueskemper, H. L. (1981) Thyroid function 3265 and thyroid hormone metabolism in elderly people. Klin. Wochenschr. 59:315-323. 3266
Hiss, J. M.; Dowling, J. T. (1962). Thyroxine metabolism in untreated and treated pancreatic 3267 steatorrhea. J. Clin. Invest. 41:988-995. 3268
ICRP (1979) International Commission on Radiological Protection. Limits on Intakes of 3269 Radionuclides for Workers. ICRP Publication 30, Pt.1. Pergamon Press, Oxford. Ann. ICRP 3270 2, (3/4). 3271
ICRP (1987). International Commission on Radiological Protection. Radiation dose to patients from 3272 radiopharmaceuticals. ICRP Publication 53. Oxford: Pergamon Press. 3273
ICRP (1989) International Commission on Radiological Protection. Age-dependent Doses to 3274 Members of the Public from Intake of Radionuclides. Pt.1. ICRP Publication 56. Pergamon 3275 Press, Oxford. Ann. ICRP 20, (2). 3276
ICRP, 1993. Age-dependent Doses to Members of the Public from Intake of Radionuclides: Part 2, 3277 Ingestion Dose Coefficients, ICRP Publication 67. Annals of the ICRP 23 (3/4). 3278

DRAFT REPORT FOR CONSULTATION: DO NOT REFERENCE
85
ICRP (1994). International Commission on Radiological Protection. Dose coefficients for intakes of 3279 radionuclides by workers, ICRP Publication 68. Oxford: Pergamon Press. 3280
ICRP (1997). International Commission on Radiological Protection. Individual monitoring for 3281 internal exposure of workers. Replacement of ICRP Publication 54. ICRP Publication 78. 3282 Oxford: Pergamon Press. 3283
ICRP (2002a) Guide for the Practical Application of the ICRP Human Respiratory Tract Model. 3284 Supporting Guidance 3. Annals of the ICRP, 32(1-2). 3285
ICRP (2002b). International Commission on Radiological Protection. Basic anatomical and 3286 physiological data for use in radiological protection: Reference values. ICRP Publication 89. 3287 Oxford: Pergamon Press. 3288
ICRP (2006). International Commission on Radiological Protection. Human alimentary tract model 3289 for radiological protection. ICRP Publication 100. Oxford: Pergamon Press. 3290
Inada, M.; Kasagi, K.; Kurata, S.; Kazama, Y.; Takayama, H.; Torizuka, K.; Fukase, M.; Soma, T. 3291 (1975). Estimation of thyroxine and triiodothyronine distribution and of the conversion rate 3292 of thyroxine to triiodothyronine in man. J. Clin. Invest. 55:1337-1348. 3293
Ingbar, S. H.; Freinkel, N. (1955). Simultaneous estimation of rates of thyroxine degradation and 3294 thyroid hormone synthesis. J. Clin. Invest. 34:808-819. 3295
Iyengar, G. V.; Kawamura, H.; Dang, H. S.; Parr, R. M.; Wang, J.; Akhter, P.; Cho, S. Y.; Natera, E.; 3296 Miah, F. K.; Dojosubroto, J.; Nguyen, M. S. (2004). Dietary intakes of seven elements of 3297 importance in radiological protection by Asian population: Comparison with ICRP data. 3298 Health Phys. 86:557–564. 3299
Johansson, L.; Leide-Svegborn, S.; Mattsson, S.; Nosslin, B. (2003). Biokinetics of Iodide in Man: 3300 Refinement of Current ICRP Dosimetry Models. Cancer Biotherapy and 3301 Radiopharmaceuticals 18:445-450. 3302
Johnson, J. R. (1987). A review of age dependent radioiodine dosimetry. In: Gerber, G. B.; Metivier, 3303 H.; Smith, H., eds. Age-related factors in radionuclide metabolism and dosimetry. Dordrecht: 3304 Martinus Nijhoff Publishers; pp. 249-260. 3305
Keating, F. R., Jr.; Albert, A. (1949). The metabolism of iodine in man as disclosed with the use of 3306 radioiodine. Recent Progr. Hormone Research 4:429-481. 3307
Kirchgessner, M.; He, J.; Windisch, W. (1999). Homeostatic adjustments of iodine metabolism and 3308 tissue iodine to widely varying iodine supply in 125I labeled rats. J. Anim. Physiol. Anim. 3309 Nutr. 82:238-250. 3310
Kolbert, K. S.; Pentlow, K. S.; Pearson, J. R.; Sheikh, A.; Finn, R. D.; Humm, J. L.; Larson, S. M. 3311 (2007). Prediction of absorbed dose to normal organs in thyroid cancer patients treated with 3312 131I by use of 124I PET and 3-dimensional internal dosimetry. Software. J. Nucl. Med. 3313 48:143–149. 3314
Kopp, P. (2005). Thyroid hormone synthesis. In: Werner and Ingbar's The Thyroid: A Fundamental 3315 and Clinical Text, 9th edition, Werner, S. C.; Ingbar, S. H.; Braverman, L. E.; Utiger, R. D., 3316 eds. New York: Lippincott Williams & Wilkins; pp. 52-76. 3317
Korolev, G. K. (1969). Distribution of iodine-132 and tellurium-132 in the body of rats under 3318 intravenous administration. In: Moskalev, Yu. I., ed. Radioactive isotopes and the body. 3319 Izdatel’stvo Meditsina. AEC-tr-7195; pp. 175-185. 3320
Koutras, D. A.; Alexander, W. D.; Harden, R. M.; Wayne, E. (1964). Effect of small iodine 3321 supplements on thyroid function in normal individuals. J. Clin. Endocrinol. Metab. 24:857-3322 862. 3323
Lake-Bakaar, G., Rubio, C. E., McKavanagh, S., Potter, B. J., and Summerfield, J. A. (1980) 3324 Metabolism of 125I-labelled trypsin in man: evidence of recirculation. Gut 21, 580-6. 3325
Leggett, R. W. (2010). A physiological systems model for iodine for use in radiation protection. 3326 Radiation Research 174: 496-516. 3327
Lennon, E. J.; Engbring, N. H.; Engstrom, W. W. (1961). Studies of the rate of disappearance of 3328 labeled thyroxine from the intravascular compartment. Clin. Invest. 40:996-1005. 3329

DRAFT REPORT FOR CONSULTATION: DO NOT REFERENCE
86
Mariotti, S.; Franceschi, C.; Cossarizza, A.; Pinchera, A. (1995). The aging thyroid. Endocrine 3330 Reviews 16:686-715. 3331
McClellan, R. O. and Rupprecht, F. C. (Editors) (1968) Radioiodine metabolism in the beagle dog - 3332 The importance of age and mode of 131I exposure. Fission Product Inhalation Program 3333 Annual Report 1967-1968, LF-39, pp. 122-127. Lovelace Foundation for Medical Education 3334 and Research, Albuquerque, New Mexico. Available from National Technical Information 3335 Service, Springfield, Virginia. 3336
McGuire, R. A.; Hays, M. T. (1981). A kinetic model of human thyroid hormones and their 3337 conversion products. J. Clin. Endocrinol. Metab. 53:852-862. 3338
Milakovic, M.; Berg, G.; Nystro, E.; Lindstedt, G.; Gebre-Medhin, M. (2004). Urinary iodine and 3339 thyroid volume in a Swedish population. J. Internal Med. 255:610–614. 3340
MIRD (1975). MIRD dose estimate report no. 5. Summary of current radiation dose estimates to 3341 humans from 123I, 124I, 125I, 126I, 130I, 131I, and 132I as sodium iodide. J. Nucl. Med. 16:857-860. 3342
Mirell, S. G., Blahd, W. H. (1989). Biological retention of fission products from the Chernobyl 3343 plume. Health Phys. 57 (4), 649-52. 3344
Mithen, R. (2007) Effect of genotype on micronutrient absorption and metabolism: a review of iron, 3345 copper, iodine and selenium, and folates. Int J Vitam Nutr Res 77, 205-16. 3346
Morgan, A., Morgan D. J. and Black, A. (1968a) A study of the deposition translocation and 3347 excretion of radioiodine inhaled as iodine vapour. Health Phys., 15, 313-322. 3348
Morgan, A., Morgan, D. J. and Arkell, G. M. (1967b) A study of the retention and subsequent 3349 metabolism of inhaled methyl iodide. In: Inhaled Particles and Vapours II (C. N. Davies, 3350 Ed.) Pergamon Press, Oxford pp. 309-321. 3351
Morgan, A., Morgan, D. J., Evans, J. C. and Lister, B. A. J. (1967a) Studies on the retention and 3352 metabolism of inhaled methyl iodide - II. Metabolism of methyl iodide. Health Phys. 13, 3353 1067-1074. 3354
Morgan, D. J. and Morgan, A. (1967) Studies on the retention and metabolism of inhaled methyl 3355 iodide - I. Retention of inhaled methyl iodide. Health Phys. 13, 1055-1065. 3356
Morgan, D. J., Black, A., Mitchell, G. (1968b) Retention of inhaled ethyl iodide labeled with iodine-3357 132. Nature, 218 (5147), 1177-1178. 3358
Morrow, P. E., Gibb, F. R., Davies, H. and Fisher, M. (1968) Dust removal from the lung 3359 parenchyma: an investigation of clearance stimulants. Toxicol. Appl. Pharmacol. 12, 372-3360 396. 3361
Moskalev, Yu. I.; Yegorova, G. M. (1972). Distribution of iodine-131 in the rat organism following 3362 separate and combined exposure to this isotope and cobalt-60 gamma rays. In: Moskalev, Yu. 3363 I.; Kalistratova, V. S., eds. Biological effects of radiation from external and internal sources. 3364 Meditsina. AEC-tr-7457; pp. 116-122. 3365
Myant, N. B.; Corbett, B. D.; Honour, A. J.; Pochin, E. E. (1950). Distribution of radioiodide in man. 3366 Clin. Sci. 9:405-419; 1950. 3367
Nagataki, S.; Shizume, K.; Nakao, K. (1967). Thyroid function in chronic excess iodide ingestion: 3368 Comparison of thyroidal absolute iodine uptake and degradation of thyroxine in euthyroid 3369 Japanese subjects. J. Clin. Endocr. 27:638-647. 3370
Nicoloff, J. T.; Dowling, J. T. (1968). Estimation of thyroxine distribution in man. J. Clin. Invest. 3371 47:26-37. 3372
Nicoloff, J. T.; Low, J. C.; Dussault, J. H.; Fisher, D. A. (1972). Simultaneous measurement of 3373 thyroxine and triiodothyronine peripheral turnover kinetics in man. J. Clin. Invest. 51:473-3374 483. 3375 Oddie, T. H.; Meschan, I.; Wortham, J. (1955). Thyroid function assay with radioiodine. I. 3376 Physical basis of study of early phase of iodine metabolism and iodine uptake. J. Clin. Invest. 3377 34: 95–105. 3378
Oddie, T. H.; Fisher, D. A.; Epperson, D. (1965). Effect of exogenous thyroxine on thyroid 3379 accumulation and secretion in euthyroid subjects. J. Clin Endocrinol. Metab. 25:1196-1206. 3380

DRAFT REPORT FOR CONSULTATION: DO NOT REFERENCE
87
Oddie, T. H.; Fisher, D. A.; Long, J. M. (1964). Factors affecting the estimation of iodine entering the 3381 normal thyroid gland using short-term clearance studies. J. Clin Endocrinol. Metab. 24:924-3382 933. 3383
Oddie, T. H.; Fisher, D. A.; McConahey, W. M.; Thompson, C. S. (1970). Iodine intake in the United 3384 States: A reassessment. J. Clin Endocrinol. Metab. 30:659-665. 3385
Oddie, T. H.; Meade, J. H.; Fisher, D. A. (1966). An analysis of published data on thyroxine turnover 3386 in human subjects. J. Clin. Endocrinol. Metab. 26:425-436. 3387
O’Hare, N. J.; Murphy, D.; Malone, J. F. (1998). Thyroid dosimetry of adult European populations. 3388 Brit. J. Radiol. 71:535-543. 3389
Ohtaki, S.; Moriya, S.; Suzuki, H.; Horiuchi, Y. (1967). Nonhormonal iodine escape from the normal 3390 and abnormal thyroid gland. 3391
Oppenheimer, J. H.; Bernstein, G.; Hasen, J. (1967).Estimation of rapidly exchangeable cellular 3392 thyroxine from the plasma disappearance curves of simultaneously administered thyroxine-I-3393 131 and albumin-I-125. J. Clin. Invest. 46:762-777. 3394
Parr, R. M.; Crawley, H.; Abdulla, M; Iyengar, G. V.; Kumpulainen, J. (1992). Human dietary intakes 3395 of trace elements: A global literature survey mainly for the period 1970–91. Data listing and 3396 references. Report International Atomic Energy Agency (IAEA). Vienna: IAEA; IAEA-3397 HAHRES-12. 3398
Pattle, R. E. (1961) The retention of gases and particles in the human nose. IN Inhaled Particles and 3399 Vapours (Edited by Davies, C. N.) Pergamon Press, Oxford pp. 302-311. 3400
Perrault, G., Thiéblemont, P., Pasquier, C. and Marblé, G. (1967) Cinétique du passage du radioiode 3401 soluble à travers les épithéliums respiratoires, après inhalation. Health Phys. 13, 707-718. 3402
Pittman, C. S.; Chambers, J. B.; Read, V. H. (1971). The extrathyroidal conversion rate of thyroxine 3403 to triiodothyronine in normal man. J. Clin. Invest. 50:1187-1196. 3404
Ramsden, D.; Passant, F. H.; Peabody, C. O.; Speight, R. G. (1967). Radioiodine uptakes in the 3405 thyroid. Studies of the blocking and subsequent recovery of the gland following the 3406 administration of stable iodine. Health Phys. 13:633-646. 3407
Riggs, D.S. (1952) Quantitative aspects of iodine metabolism. Pharmacol. Rev. 4, 284-370. 3408 Robertson, J. S.; Gorman, C. A. (1976). Gonadal radiation dose and its genetic significance in 3409
radioiodine therapy of hyperthyroidism. J. Nucl. Med. 17:826-835. 3410 Robertson, J. W. K.; Shimmins, J.; Horton, P. W.; Lazarus, J. H.; Alexander, W. D. (1971). 3411
Determination of the rates of accumulation and loss of iodide and of protein binding of iodine 3412 in the human thyroid gland. In: Dynamic studies with radioisotopes in medicine. Proceedings 3413 of a symposium. Rotterdam, 31 Aug – 4 Sept, 1970. IAEA, Vienna, 199-210. 3414
Ruegamer, W. R. (1953). The kinetics of 131I metabolism in the dog and human. Arch. Biochem. 3415 Biophys. 47:119-136. 3416
Sawin, C. (2005). Age-related changes in thyroid secretion. In: Werner and Ingbar's The Thyroid: A 3417 Fundamental and Clinical Text, 9th edition, Werner, S. C.; Ingbar, S. H.; Braverman, L. E.; 3418 Utiger, R. D., eds. New York: Lippincott Williams & Wilkins; pp. 214-219. 3419
Shapiro, B.; Shulkin, B.; Gross, M.; Troncone, L. (1994). Thyroid imaging with 3420 radiopharmaceuticals. In: Troncone, L. Shapiro, B.; Satta, M.; Monaco, F. Thyroid Diseases. 3421 Basic Science, Pathology, Clinical and Laboratory Diagnoses. CRC Press: 274-292. 3422
Small, M. D.; Bezman, A.; Longarni, A. E.; Fennell, A.; Zamcheck, N. (1961). Absorption of 3423 potassium iodide from gastro-intestinal tract. Proc. Soc. Exp. Biol. Med. 106:450-452. 3424
Smyth, P. P. A.; Duntas, L. H. (2005). Iodine uptake and loss – Can frequent strenuous exercise 3425 induce iodine deficiency? Horm. Metab. Res. 37:555-558. 3426
Stanbury, J. B.; Brownell, G. L.; Riggs, D. L.; Perinetti, H.; Itoiz, J.; del Castillo, E. B. Endemic 3427 goiter. The adaptation of man to iodine deficiency. Cambridge, MA. Harvard University 3428 Press. 1954. 3429
Stather, J.W.; Greenhalgh, J.R. (1983). The metabolism of iodine in children and adults. National 3430 Radiological Protection Board report NRPB-R140. Chilton, Didcot, June 1983. 3431
DRAFT REPORT FOR CONSULTATION: DO NOT REFERENCE
88
Sterling, K. (1958). Radiothyroxine turnover studies in thyroid disease after therapy. J. Clin. Invest. 3432 37:1348-1356. 3433
Sterling, K.; Lashof, J. C.; Man, E. B. (1954). Disappearance from serum of I-131-labeled L-3434 thyroxine and L-triiodothyronine in euthyroid subjects. J Clin Invest. 33:1031–1035. 3435
Thiéblemont, P., Marblé, G., Perrault, G. and Pasquier, C. (1965a) Évaluation de la rétention 3436 respiratoire et de l'élimination du radioiode après contamination aérienne du singe. Int. J. 3437 Rad. Biol. 9, 219-231. 3438
Thiéblemont, P., Marblé, G., Perrault, G. and Pasquier, C. (1965b) Charge thyroïdienne en radioiode 3439 après contamination respiratoire du singe Macaccus rhesus. Int. J. Rad. Biol. 9, 233-240. 3440
3441 Thomas, R. L., Scott, J. K. and Chiffelle, T. L. (1970) Metabolism and toxicity of inhaled and 3442
injected 131I in the rat. Amer. Ind. Hyg. Assn. J. 31, 213-220. 3443 Tucker, R. G.; Keys, A. (1951). Concentration of serum protein-bound iodine in normal men. J. Clin. 3444
Invest. 30:869-873. 3445 Ulmer, D. D.; Perkins, L. B.; Kereiakes, J. G. (1959). Alterations in iodine-131 distribution in the rat 3446
after whole-body x-irradiation. Radiat. Res. 11:810-819. 3447 Underwood J. (1971). Iodine. In: Trace Elements in Human and Animal Nutrition. Academic Press, 3448
New York. 3449 Underwood, E.J. (1977). Iodine. In: Trace elements in human and animal nutrition, 4th edition, 3450
Academic Press, New York, Chapter 11. 3451 Utiger, R. D. (2001). Thyroid Diseases. In: Endocrinology and Metabolism, 4th edition, Felig, P.; 3452
Frohman, L. A., eds. New York: McGraw-Hill; pp. 259-348. 3453 Vadstrup S. (1993). Comparative aspects of iodine conservation in mammals. Comp. Biochem. 3454
Physiol. 106A:15-17. 3455 Wartofsky, L.; Martin, D.; Earll, J. M. (1972). Alterations in thyroid iodine release and the peripheral 3456
metabolism of thyroxine during acute falciparum malaria in man. J. Clin. Invest. 51:2215-3457 2232. 3458
Wayne, E. J.; Koutras, D. A.; Alexander, W. D. (1964). Clinical aspects of iodine metabolism. 3459 Philadelphia, PA: F. A. Davis Co. 3460
Wellman, H. N.; Kereiakes, J. G.; Branson, B. M. (1970). Total- and partial-body counting of 3461 children for radiopharmaceutical dosimetry data. In: Cloutier, R. J.; Edwards, C. L.; and 3462 Snyder, W. S., eds., Medical Radionuclides: Radiation Dose and Effects. U.S. Atomic 3463 Energy Commission, Oak Ridge, TN; pp. 133-156. 3464
WHO (1989). Iodine. In: Toxicological evaluation of certain food additives and contaminants. WHO 3465 Food Additives Series, No. 24. World Health Organization. Cambridge, UK: Cambridge 3466 University Press. No. 661 on INCHEM. Available online at 3467 http://www.inchem.org/documents/jecfa/jecmono/v024je11.htm. 3468
WHO (2001). Assessment of the iodine deficiency disorders and monitoring their elimination. Second 3469 edition. Joint publication of International Council for Control of Iodine Deficiency Disorders, 3470 United Nations Children’s Fund, and World Health Organization (WHO). WHO/NHD/01.1. 3471 Geneva: World Health Organization. 3472
WHO (2004). Iodine status worldwide. WHO global database on iodine deficiency. de Benoist, B.; 3473 Andersson, M.; Egli, I.; Takkouche, B.; Allen, H., eds. Geneva: Department of Nutrition for 3474 Health and Development, World Health Organization. 3475
Willard, D.H. and Bair, W.J. (1961) Behaviour of 131I following its inhalation as a vapour and as a 3476 particle. Acta Radiol. 55, 486-496. 3477
Winder, W. W.; Heninger, R. W. (1971). Effect of exercise on tissue levels of thyroid hormones in 3478 the rat. Am. J. Physiol. 221:1139-1143. 3479
Zanzonico, P. B.; Becker, D. V. (2000) Effects of time of administration and dietary iodine levels on 3480 potassium iodide (KI) blockade of thyroid irradiation by 131I from radioactive fallout. Health 3481 Phys. 78:660-667. 3482
DRAFT REPORT FOR CONSULTATION: DO NOT REFERENCE
89
Zuckier, L. S.; Dohan, O.; Li, Y.; Chang, C. J.; Carrasco, N. ; Dadachova, E. (2004). Kinetics of 3483 perrhenate uptake and comparative biodistribution of perrhenate, pertechnetate, and iodide by 3484 NaI symporter-expressing tissues in vivo. J. Nucl. Med. 45:500-507. 3485
Zvonova, I. A. (1989). Dietary intake of stable I and some aspects of radioiodine dosimetry. Health 3486 Phys. 57:471-475. 3487
3488

DRAFT REPORT FOR CONSULTATION: DO NOT REFERENCE
90
3489 6. CAESIUM (Z = 55) 3490
3491 6.1. Chemical Forms in the Workplace 3492 3493
(252) Caesium is an alkali metal only present in oxidation state I. It behaves similarly to 3494 potassium in the body. Caesium may be encountered in industry in a variety of chemical and 3495 physical forms, including soluble inorganic salts (chloride, nitrate) and less soluble sulphate. 3496 134Cs and 137Cs are important fission products and could also be encountered in relatively 3497 insoluble fragments of irradiated fuel. 137Cs is commonly used for medical applications as 3498 caesium chloride. 3499 3500
Table 6-1. Isotopes of caesium addressed in this report 3501 3502
Isotope Physical half-life Decay mode Cs-125 45 m EC, B+ Cs-127 6.25 h EC, B+ Cs-129 32.06 h EC, B+ Cs-130 29.21 m EC, B+, B- Cs-131 9.689 d EC Cs-132 6.479 d EC, B+, B- Cs-134a 2.064 y B-, EC Cs-134m 2.903 h IT Cs-135 2.3E+6 y B- Cs-135m 53 m IT Cs-136 13.167 d B- Cs-137a 30.167 y B- Cs-138 33.41 m B-
a Data for these radionuclides are given in the printed copy of this report. Data for other radionuclides 3503 are given on accompanying electronic disk. 3504
3505 6.2. Routes of Intake 3506 3507 6.2.1. Inhalation 3508 3509 Absorption Types and parameter values 3510
(253) There is some information on the behaviour of inhaled caesium in man following 3511 accidental intakes. Information is also available from experimental studies of caesium in ionic 3512 forms (chloride, nitrate), in irradiated fuel fragments and other contaminated dusts associated 3513 with nuclear facilities, and in fused aluminosilicate particles (FAP). 3514
(254) Absorption parameter values and Types, and associated fA values for particulate 3515 forms of caesium are given in Table 6-2. 3516 3517 Caesium chloride 3518
(255) Animal experiments have shown that caesium chloride (CsCl) is rapidly and 3519 completely absorbed from the respiratory tract following inhalation. Lie (1964) and Thomas 3520 (1969) observed that in mice, rats, and guinea pigs killed less than 20 minutes after a 10-3521 minute inhalation exposure to 137CsCl, nearly all the activity had left the lungs, suggesting an 3522 absorption rate corresponding to a time of the order of 10 minutes, i.e. sr ~ 100 d-1. Stara 3523
DRAFT REPORT FOR CONSULTATION: DO NOT REFERENCE
91
(1965) similarly observed that in guinea pigs killed 20 minutes after inhalation of 137CsCl, 3524 there had been rapid clearance from the lungs, and by 24 hours the biokinetics of 137Cs were 3525 indistinguishable from those following intraperitoneal injection. Morrow et al. (1968) 3526 measured a lung retention half time of 0.003 d (~4 minutes) following inhalation of 134CsCl 3527 by dogs, giving fr ~1 and sr = 200 d–1. Boecker (1969a) noted that following inhalation of 3528 137CsCl by dogs, the lung quickly became one of the tissues to exhibit a low concentration of 3529 137Cs. It was estimated by the Task group from the results of another study in which 137CsCl 3530 was inhaled by dogs (Boecker, 1969b) that lung retention at 32 days was <1% of the initial 3531 lung deposit (ILD). 3532
(256) Cuddihy and Ozog (1973) deposited 137CsCl directly onto the nasal membranes of 3533 Syrian hamsters and followed the biokinetics of the 137Cs for 4 hours. Analysis of the results 3534 here gave values of fr ~1.0 and sr ~6 d–1 (t½ ~ 2 hours), slower than in the other studies, 3535 possibly because of the experimental techniques used, including the anaesthetic or slower 3536 clearance from the nasal passage than from the lungs. Similar observations were made for 3537 strontium and barium chlorides which were also administered by Cuddihy and Ozog (see 3538 Strontium and Barium Sections). 3539
(257) Hölgye and Malý (2002) followed urinary excretion of 137Cs for 370 days after 3540 presumed accidental inhalation of the chloride by a worker. Analysis here showed that the 3541 results can be well fit assuming Type F absorption, i.e. that absorption from the lungs is rapid 3542 compared to transfer from systemic tissues to urine. 3543
(258) Based on the results of the experiments outlined above, specific absorption 3544 parameter values for caesium chloride were estimated here to be: fr = 1 and sr = 100 d-1 3545 (consistent with assignment to default Type F). However, although specific parameter values 3546 for caesium chloride based on in vivo data are available, they are not adopted separately here. 3547 The data are (with those for caesium nitrate) used as the basis for the default rapid dissolution 3548 rate for caesium. Hence specific parameter values for caesium chloride would be the same as 3549 default Type F caesium parameter values, and therefore caesium chloride is assigned to Type 3550 F instead. 3551 3552 Caesium nitrate 3553
(259) Lie (1964) obtained similar results following inhalation of caesium nitrate by rats as 3554 for caesium chloride, but few details were given. In rats killed immediately after a 10-minute 3555 inhalation exposure, nearly all the activity had left the lungs, suggesting an absorption rate 3556 corresponding to a time of the order of 10 minutes, i.e. sr ~ 100 d-1. In view of the few details 3557 given, these data are judged to be an insufficient basis to provide specific absorption 3558 parameter values and caesium nitrate is therefore assigned to Type F. 3559 3560 Caesium sulphate 3561
(260) Miller (1964) followed distribution and retention of 137Cs in two men following 3562 accidental intake (presumed to be inhalation) of caesium sulphate. The distribution along the 3563 body was unchanged between 9 and 285 days, implying that absorption from the lungs was 3564 complete before the first measurement on day 9, and indicating Type F behaviour. These data 3565 are judged to be an insufficient basis to provide specific absorption parameter values and 3566 caesium sulphate is therefore assigned to Type F. 3567 3568 Irradiated fuel fragments and other contaminated dusts associated with nuclear facilities. 3569
(261) Studies have been conducted of caesium associated with irradiated fuel fragments, 3570 including particles released from the Chernobyl accident, and other materials, more or less 3571

DRAFT REPORT FOR CONSULTATION: DO NOT REFERENCE
92
well defined, associated with various nuclear facilities. Such studies indicate that some of the 3572 caesium is rapidly absorbed (within days), but a fraction may be retained with the particle 3573 matrix and absorbed over a period of months or years. The results of most of these studies 3574 indicate Type M behaviour overall, but some indicate Type F and two, partial Type S 3575 behaviour. 3576 3577 Chernobyl 3578
(262) Mirell and Blahd (1989) made whole-body measurements of activity on seven people 3579 from about two weeks to several months after exposure to the initial Chernobyl reactor 3580 accident plume in Kiev, Ukraine. Biological retention half-times were similar for different 3581 radionuclides (34 days for 137Cs) and different from those expected for systemic retention, 3582 indicating that they were trapped in particles and metabolically inert, thus indicating Type M 3583 rather than Type F behaviour. 3584
(263) Kutkov (1998, 2000) reported that about 920 Chernobyl nuclear power plant workers 3585 involved in emergency operations on 26-27 April 1986 were examined by means of a 3586 semiconductor whole body counter. For 15 of these, who were examined more than five 3587 times in the period 40–800 days after the accident, the effective half-time of 137Cs retention in 3588 the body ranged from 230 to 590 days with a mean of 360 ± 30 days, much greater than 3589 expected for systemic 137Cs (about 110 days). With other information on the characteristics of 3590 nuclear fuel particles dispersed in the accident, it was inferred that radionuclides such as 137Cs 3591 were trapped in the uranium oxide matrix. Kutkov (1998) reported HRTM parameter values 3592 for Chernobyl nuclear fuel particles as: sp = 4 d-1, spt = 100 d-1, st = 0.002 d-1 (and f1 = 0.002), 3593 corresponding to fr = 0.04, sr = 104 d–1, and ss = 0.002 d–1, giving assignment to Type M. 3594 However, these reports only summarise the results and little information was given on how 3595 the parameter values were derived. 3596
(264) Cuddihy et al. (1989) measured the in vitro dissolution of samples of particles 3597 released from the Chernobyl accident for up to 60 days. For all radionuclides measured, 3598 including 137Cs, 10% dissolved in a few hours, and the rest with a half-time of 160 days. 3599 Hence fr = 0.1, sr ~10 d–1, and ss = 0.004 d–1, giving assignment to Type M. 3600
(265) Kutkov and Komaritskaya (1996) measured the in vitro leaching (for 122 days) of 3601 137Cs from particles taken from the Chernobyl Shelter. Results indicated fr ~ 0.3, sr ~0.04 d–1, 3602 and ss = 0.002 d–1, giving assignment to Type M. 3603
(266) To simulate particles produced in a reactor accident such as that at Chernobyl, Al 3604 Rayyes et al. (1993) prepared UO2 particles labelled with 134Cs by condensation. In distilled 3605 water, about 95% dissolved in a few hours, indicating Type F behaviour. However for 3606 particles ‘matured’ in 10% O2 + 90% CO2, about 40% remained after 21 days, indicating 3607 Type M behaviour. 3608 3609 Other workplace exposures 3610
(267) Hesp (1964) followed whole body retention of 137Cs for 300 days after accidental 3611 inhalation by a worker, and also reported measurements in urine, and in the chest. Analysis 3612 here showed that the results can be reasonably well fit assuming about 50% Type F and 50% 3613 Type M absorption, i. e., fr is about 0.5, but there is insufficient information to determine sr 3614 and ss (indicating assignment to Type M overall). 3615
(268) The results of a human study in which in vivo measurements were made for over 2 3616 years after accidental inhalation of irradiated uranium indicate Type F behaviour of the 3617 caesium present, although measurements of other radionuclides (95Zr-Nb, 103Ru, and 144Ce) 3618 indicated Type M or S behaviour (Rundo, 1965). 3619
DRAFT REPORT FOR CONSULTATION: DO NOT REFERENCE
93
(269) Raghavendran et al. (1978) followed whole body retention of 137Cs in 12 radiation 3620 workers at the Bhaba Atomic Research Centre for between 72 and 456 days. Results were 3621 consistent with retention of systemic caesium, indicating Type F behaviour (assuming intake 3622 by inhalation). 3623
(270) Froning et al. (2004) followed whole body retention of 137Cs for 16 years after 3624 accidental inhalation of high temperature reactor fuel element ash by a worker. Measurements 3625 showed that the longest-lived component was concentrated in the thoracic region, suggesting 3626 long term lung retention of a relatively insoluble component. The authors found that data up 3627 to about 2000 days could be well represented by assuming 77% Type F and 23% Type S. 3628 However, subsequent clearance was slower than predicted for default Type S. Analysis here2 3629 confirmed this assessment, which can be represented by fr = 0.77; sr = 100 d–1 and ss = 10–4. 3630 Application here of the updated HRTM, which assumes longer retention in the Alveolar-3631 Interstitial region than the original HRTM (see OIR Part 1, Section 3.2.2) gave a better fit to 3632 the measurements after 2000 days, but with a smaller 'insoluble' fraction retained, i.e. with a 3633 higher value of fr (~0.9). 3634
(271) Andrieu and Fatome (1979) studied the clearance of mixed fission and activation 3635 products in ~1 µm graphite particles following controlled inhalation by a volunteer; data over 3636 ~7 years imply partial Type S behaviour for the 137Cs component. 3637
(272) The biokinetics of 137Cs were followed for 6 months after intratracheal instillation 3638 into rats of a suspension of residues from a reactor fuel cooling pond (Stradling et al., 1989). 3639 Lung retention at 30 days was 2% ILD, giving assignment to Type F. However, insufficient 3640 information was published to enable derivation of absorption parameter values. 3641
(273) The biokinetics of 137Cs were followed for 6 months after intratracheal instillation 3642 into rats of a complex radionuclide bearing dust from the ventilation grid of the reactor fuel 3643 hall of a nuclear power plant (Stradling et al., 1996, 1997). Absorption parameter values: fr = 3644 0.82; sr = 2.7 d–1 and ss = 1.4 10–3 d–1 derived by ICRP (2002a, Section E4.4), are consistent 3645 with assignment to Type M. 3646
(274) Kotrappa et al. (1977) measured in vitro the fractions of several radionuclides that 3647 dissolved rapidly (within 6 hours) from air samples taken at five working areas in a nuclear 3648 power plant. For 134+137Cs the fraction was between 98% (consistent with Type F) and 38% 3649 (indicating possibly Type M behaviour). Dua et al. (1987) measured the in vitro dissolution 3650 of particles on an air sample from a reactor spent fuel bay for up to 200 days. For all 3651 radionuclides measured, including 137Cs, ~40% dissolved with a half-time of 1.2 days, and the 3652 rest with a half-time of 155 days. Hence fr = 0.4, sr ~0.6 d–1, and ss = 0.004 d–1, giving 3653 assignment to Type M. 3654
(275) Although specific absorption parameter values were derived from the results of one 3655 in vivo study, the results from others indicate that the biokinetics of caesium in the forms 3656 considered in this section are likely to vary markedly. Caesium associated with irradiated fuel 3657 fragments, and other unspecified contaminated dusts from nuclear facilities, is therefore 3658 assigned to Type M. 3659 3660 Fused aluminosilicate particles (FAP) 3661
(276) FAP or “fused clay” particles have been extensively used as relatively insoluble 3662 particles in inhalation studies, both of biokinetics and of radiation effects. A natural clay 3663 mineral is labelled by ion exchange, and the labelled clay particles heated to about 1100˚C, to 3664 form aluminosilicate glass microspheres in which the label is incorporated. It has been shown 3665
2 Data kindly provided by Dr M. Schläger, Forschungszentrum Jülich.
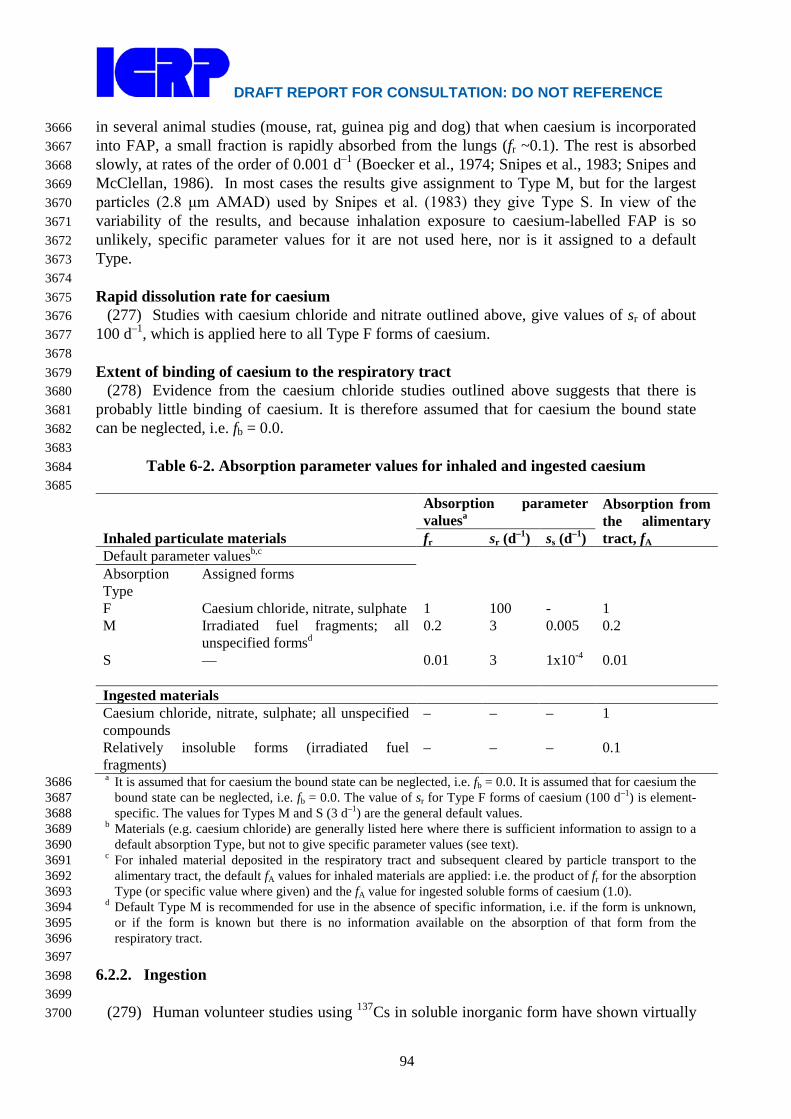
DRAFT REPORT FOR CONSULTATION: DO NOT REFERENCE
94
in several animal studies (mouse, rat, guinea pig and dog) that when caesium is incorporated 3666 into FAP, a small fraction is rapidly absorbed from the lungs (fr ~0.1). The rest is absorbed 3667 slowly, at rates of the order of 0.001 d–1 (Boecker et al., 1974; Snipes et al., 1983; Snipes and 3668 McClellan, 1986). In most cases the results give assignment to Type M, but for the largest 3669 particles (2.8 μm AMAD) used by Snipes et al. (1983) they give Type S. In view of the 3670 variability of the results, and because inhalation exposure to caesium-labelled FAP is so 3671 unlikely, specific parameter values for it are not used here, nor is it assigned to a default 3672 Type. 3673 3674 Rapid dissolution rate for caesium 3675
(277) Studies with caesium chloride and nitrate outlined above, give values of sr of about 3676 100 d–1, which is applied here to all Type F forms of caesium. 3677 3678 Extent of binding of caesium to the respiratory tract 3679
(278) Evidence from the caesium chloride studies outlined above suggests that there is 3680 probably little binding of caesium. It is therefore assumed that for caesium the bound state 3681 can be neglected, i.e. fb = 0.0. 3682 3683
Table 6-2. Absorption parameter values for inhaled and ingested caesium 3684 3685
Inhaled particulate materials
Absorption parameter valuesa
Absorption from the alimentary tract, fA fr sr (d–1) ss (d–1)
Default parameter valuesb,c Absorption Type
Assigned forms
F Caesium chloride, nitrate, sulphate 1 100 - 1 M Irradiated fuel fragments; all
unspecified formsd 0.2 3 0.005 0.2
S — 0.01 3 1x10⁻⁴ 0.01 Ingested materials Caesium chloride, nitrate, sulphate; all unspecified compounds
– – – 1
Relatively insoluble forms (irradiated fuel fragments)
– – – 0.1
a It is assumed that for caesium the bound state can be neglected, i.e. fb = 0.0. It is assumed that for caesium the 3686 bound state can be neglected, i.e. fb = 0.0. The value of sr for Type F forms of caesium (100 d–1) is element-3687 specific. The values for Types M and S (3 d–1) are the general default values. 3688
b Materials (e.g. caesium chloride) are generally listed here where there is sufficient information to assign to a 3689 default absorption Type, but not to give specific parameter values (see text). 3690
c For inhaled material deposited in the respiratory tract and subsequent cleared by particle transport to the 3691 alimentary tract, the default fA values for inhaled materials are applied: i.e. the product of fr for the absorption 3692 Type (or specific value where given) and the fA value for ingested soluble forms of caesium (1.0). 3693
d Default Type M is recommended for use in the absence of specific information, i.e. if the form is unknown, 3694 or if the form is known but there is no information available on the absorption of that form from the 3695 respiratory tract. 3696
3697 6.2.2. Ingestion 3698 3699
(279) Human volunteer studies using 137Cs in soluble inorganic form have shown virtually 3700

DRAFT REPORT FOR CONSULTATION: DO NOT REFERENCE
95
complete absorption from the alimentary tract (Rosoff et al., 1963; Rundo et al., 1963; 3701 Naversten and Liden, 1964; LeRoy et al., 1966). Thus, for example, Rundo et al. (1963) 3702 measured an average fractional absorption of 0.99 for 10 normal subjects following the 3703 ingestion of 137CsCl and Leroy et al. (1966) measured values from 0.87 to 0.9 on four healthy 3704 subjects. 3705
(280) 134Cs and 137Cs incorporated into insoluble particles may be less available for 3706 absorption. LeRoy et al. (1966) reported values of 0.29-0.36 for 134Cs contained in 3707 microspheres from leachable glass and ingested by three volunteers. These values were about 3708 0.8 when 134Cs was given as caesium silicate to five volunteers. 3709
(281) McKay and Memmott (1991) have shown that absorption of Cs adsorbed onto 3710 inorganic sedimentary material was significantly lower than the unity. Experiment with 3711 animals showed that absorption of 137Cs from irradiated reactor fuel particles (2 - 10 μm) in 3712 adult rats were less than 0.1 (Talbot et al, 1993). 3713
(282) In Publication 30 (ICRP, 1979), complete absorption from the alimentary tract was 3714 assumed for all chemical forms of Cs. In this report, an fA of 1 is adopted for all forms of Cs, 3715 except in situations where it is considered that the material is insoluble (e.g. fuel particles) 3716 and a lower fA value of 0.1 is appropriate. 3717 3718 6.2.3. Systemic Distribution, Retention and Excretion 3719 3720 6.2.3.1. Summary of database 3721 3722
(283) Caesium is a physiological analogue of the lighter alkali metals potassium and 3723 rubidium. Caesium has been shown to compete with these elements for both active and 3724 passive membrane transport across cell membranes but is generally transported less readily 3725 than potassium or rubidium by these processes (Hodgkin, 1947; Sjodin and Beauge, 1967; 3726 Edwards, 1982; Latorre and Miller, 1983; Cecchi et al., 1987). In vitro studies of the relative 3727 selectivity of potassium, caesium, and rubidium by membranes have revealed much about the 3728 structure and functions of ionic channels and carriers. 3729
(284) Numerous studies of the biological behavior of caesium in man and laboratory 3730 animals have been published since the 1950s due to the importance of the fission-produced 3731 isotopes 137Cs and 134Cs as occupational and environment hazards. The retention time of 3732 caesium in the human body has been found to vary with age, gender, diet, muscle mass, 3733 pregnancy, and diseases that affect the behavior of potassium in the body. Studies on 3734 laboratory animals indicate that absorbed caesium initially is heterogeneously distributed in 3735 the body with highest concentration in the kidneys but gradually attains a more nearly 3736 uniform distribution (Stather, 1970; Moskalev, 1972). Autopsy studies on environmentally 3737 exposed humans indicate that caesium concentrations do not differ greatly for different 3738 tissues, but higher concentrations generally are found in skeletal muscle than in other 3739 measured tissues (Yamagata, 1962; Williams and Leggett, 1987). Measurements on persons 3740 briefly exposed to elevated levels of 137Cs in accidents or controlled studies show that whole-3741 body retention for periods up to 3-4 years usually can be represented by the sum of two 3742 exponential terms. The long-term component typically represents 85-95% of uptake in adults. 3743 The long-term half-time generally is in the range 45-150 days in adults although values on the 3744 order of 200 days have been reported (Rundo, 1964; Cryer and Baverstock, 1972; Lloyd et al., 3745 1972, 1973; Leggett, 1986). 3746
(285) Leggett et al. (1998) reviewed data on whole-body retention of caesium in healthy 3747 adults from 14 studies involving 2-239 subjects per study. Central estimates of the long-term 3748

DRAFT REPORT FOR CONSULTATION: DO NOT REFERENCE
96
half-time in adult males were in the range 79-133 d with an overall mean of about 97 d. Inter-3749 subject variability within a given study generally was small, with a typical coefficient of 3750 variation of about 20% and a typical geometric standard deviation of about 1.2. In eight of the 3751 14 studies, retention half-times were measured in both men and women. There was some 3752 overlap in half-times for individual male and female subjects, but the mean half-time for 3753 females was 15-35% lower than that for males in each of the eight studies. 3754
(286) The long-term half-time of cesium in the body usually is reduced during pregnancy 3755 to about two-thirds of the value when not pregnant (Lloyd et al., 1966; Zundel et al., 1969; 3756 Melo et al., 1997; Thornberg and Mattsson, 2000). 3757 3758 6.2.3.2. Biokinetic model for systemic caesium 3759 3760
(287) In the model for systemic caesium adopted in ICRP Publication 30 (1979), caesium 3761 is assumed to be uniformly distributed in the body at all times after uptake to blood. Whole-3762 body retention at time t (days) is represented as a sum of two exponential terms: 3763 3764
R(t) = a exp(-0.693t/T1) + (1 - a) exp(-0.693t/T2), 3765 3766 where T1 and T2 are biological half-times for short-term and long-term components of 3767 retention, respectively. Parameter values a = 0.1, T1 = 2 d, and T2 = 110 d are applied to the 3768 worker. This model is also applied in ICRP Publication 68 (1994), but explicit excretion 3769 pathways are added: 80% of activity leaving the body is assumed to pass through the urinary 3770 bladder contents to urine and 20% is assumed to be secreted into the upper large intestine and 3771 subsequently excreted in faeces. 3772
(288) The model for systemic caesium used in this report is adapted from a model 3773 proposed by Leggett et al. (2003) that is constructed around a dynamic blood flow model 3774 involving a number of different blood pools (Leggett and Williams, 1995; Leggett et al., 3775 2006). The dynamic blood flow model is useful, for example, for predicting the blood 3776 circulation and tissue accumulation of ultra-short-lived isotopes of caesium or its 3777 physiological analogues (Leggett et al., 2006). For application to a caesium isotope with half-3778 life of at least a few minutes, it suffices to treat blood plasma as a well-mixed central 3779 compartment. The latter form of the model is used in this report, with the following 3780 modifications: 3781 3782
1. In the original model the skeleton is divided into two compartments representing red 3783 marrow and all remaining skeletal tissues. In the present version of the model, skeletal 3784 caesium is divided into four specific pools that appear to contain nearly all of the 3785 skeletal content (Williams and Leggett, 1987): red marrow, cartilage, trabecular bone 3786 surface, and cortical bone surface. 3787
3788 2. A simplistic representation of the gastrointestinal (GI) tract used in the original model 3789
to describe exchange of caesium between systemic and GI pools is replaced here by 3790 the GI portion of the HATM. 3791
3792 (289) The structure of the model as applied in this report is shown in Figure 5-1. Baseline 3793
parameter values are listed in Table 6-3. Most of the parameter values were taken from Table 3794 2 of Leggett et al. (2003), which provides baseline values for a reference adult male for the 3795 case of a well-mixed plasma pool. Modification or addition of some parameter values was 3796

DRAFT REPORT FOR CONSULTATION: DO NOT REFERENCE
97
required due to the structural differences between the present and original versions of the 3797 model indicated above. The methods of derivation of the values in Table 6-3 are summarized 3798 below. 3799 3800
3801 3802 Figure 6-1. Structure of the model for systemic caesium and its exchange with caesium 3803 in the alimentary tract. Abbreviations: Trab = trabecular, Cort = cortical, surf = surface, 3804 UB = urinary bladder, cont = contents, RBC = red blood cells, St = stomach, SI = small 3805 intestine, RC = right colon, LC = left colon, RS = rectosigmoid colon. 3806 3807
(290) The derivation of most parameter values involves reference values for cardiac output 3808 and the percentage of cardiac output received by individual tissues. The assumed cardiac 3809 output in a resting adult male is 1766 plasma volumes d-1. The assumed distribution of 3810 cardiac output is given in Table 6-4. 3811
(291) Movement of caesium is depicted as a system of first-order processes. The transfer 3812 coefficient from plasma into a tissue T is estimated as the product of the plasma flow rate to 3813 that tissue (1766 plasma volumes per day multiplied by the fraction of cardiac output received 3814 by the tissue) and a tissue-specific extraction fraction, ET. The extraction fraction for a tissue 3815 is defined as the fraction of caesium atoms extracted by that tissue during passage of caesium 3816 from arterial to venous plasma. 3817
(292) Data on tissue-specific extraction fractions for caesium (Cs) and its physiological 3818 analogues potassium (K) and rubidium (Rb) were reviewed by Leggett and Williams (1986, 3819 1988) and Leggett et al. (2003). In general, tissue extraction from plasma decreases in the 3820 order K ≥ Rb > Cs. For example, extraction by the myocardium in dogs was estimated as 3821

DRAFT REPORT FOR CONSULTATION: DO NOT REFERENCE
98
0.71 (range, 0.64-0.80) for potassium, 0.65 (0.58-0.76) for rubidium, and 0.22 (0.09-0.30) for 3822 caesium (Love et al., 1968; Poe, 1972). More information on extraction fractions was found 3823 for potassium and rubidium than for caesium. Data for potassium and rubidium were 3824 extrapolated to caesium by applying modifying factors as indicated by data on discrimination 3825 between these elements by tissues (Leggett et al., 2003). Initial selections of extraction 3826 fractions were modified in some cases after testing the model against reported caesium 3827 distributions in the early minutes or hours after administration to laboratory animals (Carr, 3828 1966; Love et al., 1968; Yano et al., 1970; Stather, 1970; Poe, 1972; Moskalev, 1972; Krulik 3829 et al., 1980; Gregus and Klaasen, 1986; Nishiyama et al., 1975) or human subjects (Rosoff et 3830 al., 1963; Nishiyama et al., 1975). For example, an initially selected extraction fraction of 3831 0.003 for brain was reduced to 0.002 for improved agreement with observations of the time-3832 dependent increase of the caesium content of the brain following acute intake. The final 3833 selections of extraction fractions for caesium are as follows: 0.2 for kidneys, walls of the 3834 gastrointestinal tract, and heart wall; 0.05 for liver and skin; 0.002 for brain; and 0.1 for all 3835 other tissues. 3836 3837
Table 6-3. Transfer coefficients for the model for systemic caesium 3838 3839
From To Transfer coefficient (d-1)
Plasma Red blood cells 1.8 Plasma Skeletal muscle 30.0 Plasma Liver 19.5 Plasma Kidneys 67.1 Plasma Spleen 5.30 Plasma Pancreas 1.77 Plasma Skin 4.42 Plasma Adipose tissue 8.83 Plasma Brain 0.424 Plasma Heart wall 14.1 Plasma Lung tissue 4.42 Plasma Red marrow 5.3 Plasma Cartilage 3.0 Plasma Trabecular bone surface 1.59 Plasma Cortical bone surface 1.06 Plasma Stomach wall 3.53 Plasma Stomach content 4.52 Plasma Small intestine wall 35.3 Plasma Small intestine content 1.05 Plasma Right colon wall 5.65 Plasma Right colon content 0.02 Plasma Left colon wall 5.65 Plasma Rectosigmoid colon wall 2.83 Plasma Other 1 9.71 Plasma Other 2 0.00353 Red blood cells Plasma 0.257 Muscle Plasma 0.0751 Liver Plasma 2.14 Liver Small intestine content 0.113 Kidneys Urinary bladder content 1.68
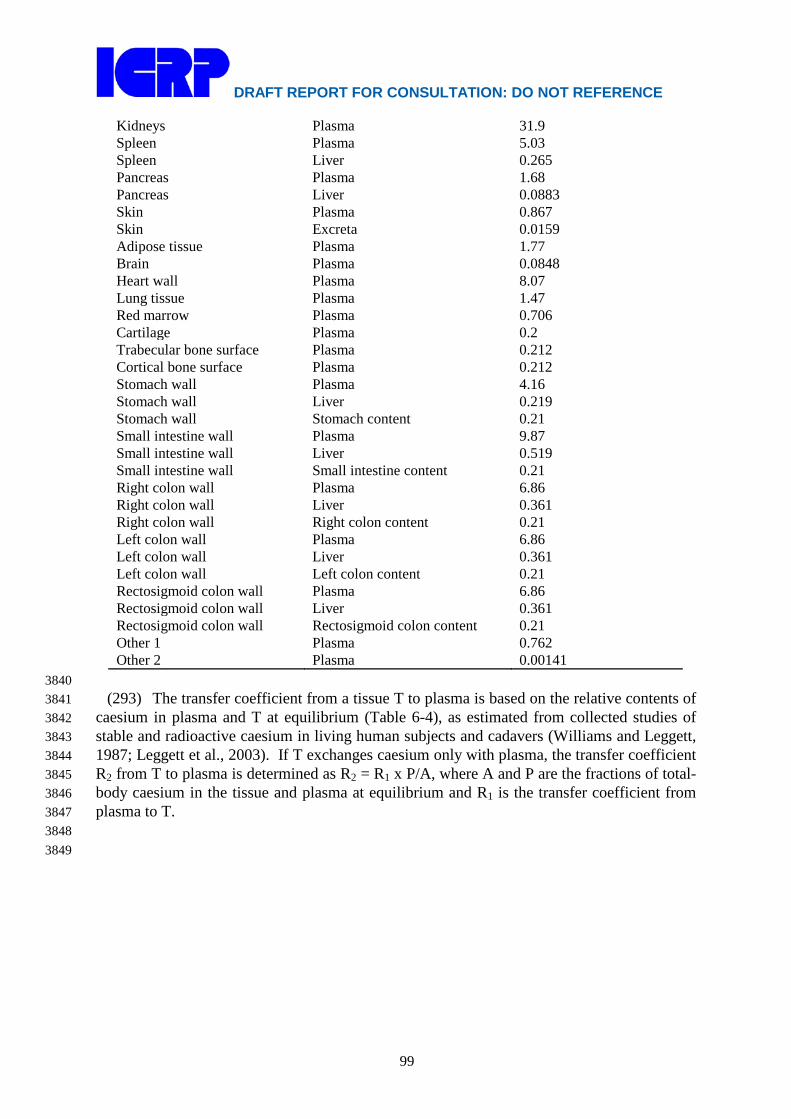
DRAFT REPORT FOR CONSULTATION: DO NOT REFERENCE
99
Kidneys Plasma 31.9 Spleen Plasma 5.03 Spleen Liver 0.265 Pancreas Plasma 1.68 Pancreas Liver 0.0883 Skin Plasma 0.867 Skin Excreta 0.0159 Adipose tissue Plasma 1.77 Brain Plasma 0.0848 Heart wall Plasma 8.07 Lung tissue Plasma 1.47 Red marrow Plasma 0.706 Cartilage Plasma 0.2 Trabecular bone surface Plasma 0.212 Cortical bone surface Plasma 0.212 Stomach wall Plasma 4.16 Stomach wall Liver 0.219 Stomach wall Stomach content 0.21 Small intestine wall Plasma 9.87 Small intestine wall Liver 0.519 Small intestine wall Small intestine content 0.21 Right colon wall Plasma 6.86 Right colon wall Liver 0.361 Right colon wall Right colon content 0.21 Left colon wall Plasma 6.86 Left colon wall Liver 0.361 Left colon wall Left colon content 0.21 Rectosigmoid colon wall Plasma 6.86 Rectosigmoid colon wall Liver 0.361 Rectosigmoid colon wall Rectosigmoid colon content 0.21 Other 1 Plasma 0.762 Other 2 Plasma 0.00141
3840 (293) The transfer coefficient from a tissue T to plasma is based on the relative contents of 3841
caesium in plasma and T at equilibrium (Table 6-4), as estimated from collected studies of 3842 stable and radioactive caesium in living human subjects and cadavers (Williams and Leggett, 3843 1987; Leggett et al., 2003). If T exchanges caesium only with plasma, the transfer coefficient 3844 R2 from T to plasma is determined as R2 = R1 x P/A, where A and P are the fractions of total-3845 body caesium in the tissue and plasma at equilibrium and R1 is the transfer coefficient from 3846 plasma to T. 3847 3848
3849
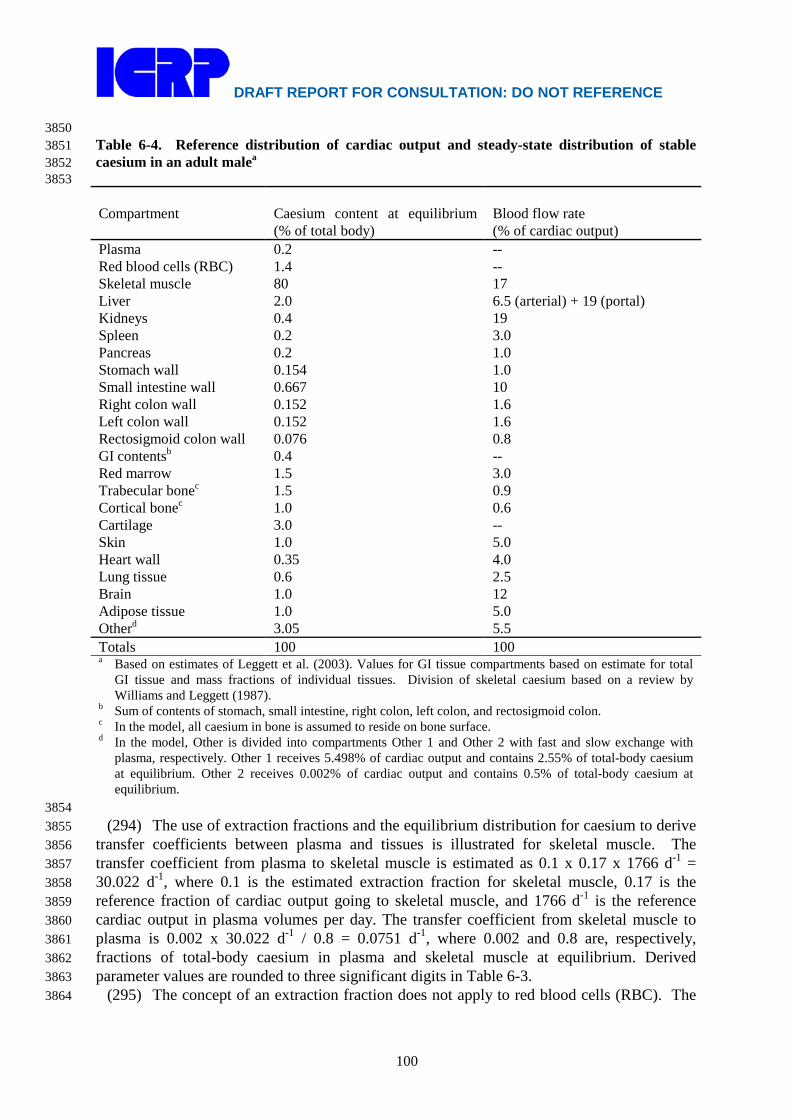
DRAFT REPORT FOR CONSULTATION: DO NOT REFERENCE
100
3850 Table 6-4. Reference distribution of cardiac output and steady-state distribution of stable 3851 caesium in an adult malea 3852 3853 Compartment
Caesium content at equilibrium (% of total body)
Blood flow rate (% of cardiac output)
Plasma 0.2 -- Red blood cells (RBC) 1.4 -- Skeletal muscle 80 17 Liver 2.0 6.5 (arterial) + 19 (portal) Kidneys 0.4 19 Spleen 0.2 3.0 Pancreas 0.2 1.0 Stomach wall 0.154 1.0 Small intestine wall 0.667 10 Right colon wall 0.152 1.6 Left colon wall 0.152 1.6 Rectosigmoid colon wall 0.076 0.8 GI contentsb 0.4 -- Red marrow 1.5 3.0 Trabecular bonec 1.5 0.9 Cortical bonec 1.0 0.6 Cartilage 3.0 -- Skin 1.0 5.0 Heart wall 0.35 4.0 Lung tissue 0.6 2.5 Brain 1.0 12 Adipose tissue 1.0 5.0 Otherd 3.05 5.5 Totals 100 100 a Based on estimates of Leggett et al. (2003). Values for GI tissue compartments based on estimate for total
GI tissue and mass fractions of individual tissues. Division of skeletal caesium based on a review by Williams and Leggett (1987).
b Sum of contents of stomach, small intestine, right colon, left colon, and rectosigmoid colon. c In the model, all caesium in bone is assumed to reside on bone surface. d In the model, Other is divided into compartments Other 1 and Other 2 with fast and slow exchange with
plasma, respectively. Other 1 receives 5.498% of cardiac output and contains 2.55% of total-body caesium at equilibrium. Other 2 receives 0.002% of cardiac output and contains 0.5% of total-body caesium at equilibrium.
3854 (294) The use of extraction fractions and the equilibrium distribution for caesium to derive 3855
transfer coefficients between plasma and tissues is illustrated for skeletal muscle. The 3856 transfer coefficient from plasma to skeletal muscle is estimated as 0.1 x 0.17 x 1766 d-1 = 3857 30.022 d-1, where 0.1 is the estimated extraction fraction for skeletal muscle, 0.17 is the 3858 reference fraction of cardiac output going to skeletal muscle, and 1766 d-1 is the reference 3859 cardiac output in plasma volumes per day. The transfer coefficient from skeletal muscle to 3860 plasma is 0.002 x 30.022 d-1 / 0.8 = 0.0751 d-1, where 0.002 and 0.8 are, respectively, 3861 fractions of total-body caesium in plasma and skeletal muscle at equilibrium. Derived 3862 parameter values are rounded to three significant digits in Table 6-3. 3863
(295) The concept of an extraction fraction does not apply to red blood cells (RBC). The 3864

DRAFT REPORT FOR CONSULTATION: DO NOT REFERENCE
101
transfer coefficients between plasma and RBC are derived from observed transfer rates for 3865 potassium and comparative data on potassium and caesium. The transfer coefficient for 3866 potassium from plasma to RBC is estimated from data from several experimental studies as 6 3867 d-1 (Leggett and Williams, 1986, 1988). The rate of transfer of caesium into RBC is roughly 3868 0.3 times that of potassium in humans, rabbits, and rats (Love and Burch, 1953; Forth et al, 3869 1963; Gyorgyi and Kanyar, 1973) and thus is estimated as 0.3 x 6 d-1 = 1.8 d-1. The transfer 3870 coefficient from RBC to plasma can be determined from the caesium inflow rate (1.8 d-1) and 3871 the equilibrium fractions of caesium in plasma and RBC, respectively. Based on the 3872 reference steady-state content of RBC (as a fraction of total-body caesium; see Table 6-4) the 3873 transfer coefficient from RBC to plasma is 1.8 d-1 x 0.002 / 0.014 = 0.257 d-1. 3874
(296) The concept of an extraction fraction also does not apply to cartilage, which contains 3875 no blood vessels but receives nutrients via a permeable matrix in contact with extravascular 3876 fluids. The simplifying assumption is made here that cartilage receives caesium directly from 3877 plasma and returns caesium to plasma. Transfer coefficients describing exchange between 3878 plasma and cartilage are set to depict rapid uptake and subsequently elevated concentration of 3879 radiocaesium in cartilage as observed in different animal species (Nelson et al., 1961; Ekman, 3880 1961; Furchner et al., 1964) and to yield a cartilage content of 3% of total-body caesium at 3881 equilibrium (Williams and Leggett, 1987). 3882
(297) For a compartment T that receives caesium from plasma but loses caesium to 3883 multiple compartments, the total outflow rate R from T is derived as illustrated above for 3884 skeletal muscle, and additional information is used to divide R into transfer coefficients 3885 representing different paths of movement. For example, the derived rate of loss R from skin 3886 is divided into transfer coefficients R1 and R2 representing the rate of loss from skin to plasma 3887 and the rate of loss from skin to sweat, respectively. The value for R2 is set for consistency 3888 with data of Yamagata et al. (1966) on the appearance of activity in sweat after ingestion of 3889 132Cs by a human subject, and R1 is determined as R – R2. As a second example, the 3890 compartment representing the stomach wall is assumed to return caesium to plasma via the 3891 portal vein and to lose caesium to the stomach contents due to cell sloughing. The total rate of 3892 loss R (4.59 d-1) from the stomach wall to all destinations is derived as illustrated earlier for 3893 skeletal muscle. The transfer coefficient from the stomach wall to the stomach contents 3894 representing cell sloughing is set at 0.21 d-1, an estimated average cell sloughing rate from GI 3895 tract tissues to GI contents (Leggett et al., 2003). The rate of loss of caesium from the 3896 stomach wall via the portal vein is calculated as the total removal rate from stomach wall 3897 minus the rate of cell sloughing: 4.59 d-1 – 0.21 d-1 = 4.38 d-1. Outflow from the stomach 3898 wall via the portal vein is divided between the plasma and liver compartments on the basis of 3899 the extraction fraction for liver (0.05). That is, the transfer coefficient from the stomach wall 3900 to the liver is 0.05 x 4.38 d-1 = 0.219 d-1, and the transfer coefficient from the stomach wall to 3901 plasma is 0.95 x 4.38 d-1 = 4.16 d-1. 3902
(298) Some of the transfer coefficients are based on a combination of basic physiological 3903 data and empirical data for caesium. For example, the rate of transfer of caesium into the 3904 gastrointestinal tract in liver bile is estimated as 5% of total outflow from the liver based on 3905 data on the rate of bile flow in man and observed concentration ratios for caesium in liver and 3906 bile in different animal species. A total outflow rate from the liver of 2.25 d-1 is based on the 3907 derived transfer coefficient from plasma to liver of 19.5 d-1 and the assumption that the liver 3908 contains 2% of total-body caesium at equilibrium. The transfer coefficient from liver to bile is 3909 calculated as 0.05 x 2.25 d-1 = 0.113 d-1. 3910
(299) Urinary excretion of caesium is depicted as transfer from plasma to a well-mixed 3911 kidney compartment and division of outflow from that compartment to plasma and the 3912
DRAFT REPORT FOR CONSULTATION: DO NOT REFERENCE
102
contents of the urinary bladder. Transfer from plasma to kidneys is represented as an 3913 effective extraction fraction times the blood flow rate to kidneys, where the effective 3914 extraction fraction includes atoms temporarily retained in the tubules after filtration at the 3915 glomerulus as well as atoms entering kidney tissue directly from blood plasma. The division 3916 of kidney outflow between plasma and urinary bladder contents is set for consistency with 3917 short-term urinary excretion data for healthy adult males (Lloyd et al., 1972, 1973). It is 3918 assumed that the renal deposit represents the only source of urinary caesium. That is, it is 3919 assumed that none of the urinary caesium arises from filtered or secreted atoms that pass to 3920 the urinary bladder without being retained in kidney tissue. 3921
(300) Endogenous faecal excretion is assumed to arise from transfer of caesium into the 3922 contents of the alimentary tract in saliva, gastric juices, pancreatic secretions, liver bile, and 3923 other secretions. It is assumed that 99% of the secreted activity that reaches the small 3924 intestine is reabsorbed to blood and that absorption occurs only in the small intestine. 3925
(301) The model depicts a small component of very long-term retention observed in 3926 human subjects involved in the accident in Goiania, Brazil (Melo et al., 1997, 1998) and in 3927 experimental studies on rats that received 137Cs by intraperitoneal injection (Thomas and 3928 Thomas, 1968). In eight adult human subjects involved in the Goiania accident, this small 3929 component of retention had an estimated half-time on the order of 500 d and represented an 3930 estimated 0.01-0.25% of uptake to blood, with estimates falling between 0.04% and 0.07% 3931 for five of the eight subjects. In rats, this component represented less than 0.01% of injected 3932 137Cs and had a half-time of 150-200 d. The physiological basis for this retention component 3933 is not known. It is represented in the model as a compartment called “Other 2” that is 3934 assumed to receive 0.002% of cardiac output and to contain 0.5% of total-body caesium at 3935 equilibrium. This long-term component of retention does not represent an important 3936 contribution to dose per unit intake of radiocesium but can be important for interpretation of 3937 bioassay data collected at times remote from exposure. 3938
(302) As is the case for the original model, the present version of the model can be used to 3939 simulate the effect of binding of caesium to Prussian Blue (PB) or other unabsorbed material 3940 in the gut. The simulation is carried out by changing the relative fractions of caesium assumed 3941 to move from the small intestine contents to blood and to the right colon contents. If it is 3942 assumed that all caesium entering the small intestine is carried by PB to the right colon 3943 contents and is eventually excreted in faeces, the long-term retention half-time for the adult 3944 male decreases by about 60%. Melo et al. (1998) found that oral administration of PB 3945 reduced the long-term retention half-time by an average of 69% (range, 36-83%) in 11 adult 3946 male subjects. Ruwei et al. (1985) found an average reduction in the half-time of about 50% 3947 in five subjects. Madshus et al. (1966) found an average reduction of 64% in two subjects. 3948 3949 6.2.3.3. Treatment of radioactive progeny 3950 3951
(303) Four caesium isotopes addressed in this report have radioactive progeny that may 3952 contribute significantly to dose estimates for the parent, depending to some extent on the 3953 assumed behavior of the progeny: 125Cs, 127Cs, 134mCs, and 137Cs. Cesium-134m (T1/2 = 2.9 h) 3954 decays to 134Cs (T1/2 = 2.06 y), which presumably behaves as if entering its site of production 3955 as a parent radionuclide. The other three cesium isotopes decay to radionuclides that are 3956 expected to migrate to some extent from the parent radionuclide. 3957
(304) Cesium-125 (T1/2 = 45 m) decays to the noble gas 125Xe (T1/2 = 16.9 h), which 3958 decays to 125I (T1/2 = 59.4 d). Xenon-125 produced by decay of 125Cs in bone is assumed to 3959 transfer to blood at the rate 100 d-1 if produced in a bone surface compartment and 0.36 d-1 if 3960
DRAFT REPORT FOR CONSULTATION: DO NOT REFERENCE
103
produced in a bone volume compartment. These rates are taken from the model for radon 3961 introduced in ICRP Publication 67 (1993) and applied in this report to radon produced in 3962 bone surface and non-exchangeable bone volume, respectively, by decay of a radium isotope. 3963 Xenon produced in a soft-tissue compartment is assumed to transfer to blood with a half-time 3964 of 20 min. Xenon entering blood is assumed to be removed from the body (exhaled) at the 3965 rate 1000 d-1, corresponding to a half-time of 1 min. Partial recycling of xenon to tissues via 3966 arterial blood is not depicted explicitly in this model for xenon as a daughter radionuclide but 3967 is considered in the assignment of the half-times in tissues. The model is intended to yield a 3968 conservative average residence time of xenon atoms in the body after their production in 3969 systemic pools. 3970
(305) Iodine-125 produced by serial decay of 125Cs and 125Xe is assumed to follow the 3971 characteristic model for iodine (the model applied in this report to iodine as a parent 3972 radionuclide) from its time of production in a compartment of the caesium model that is 3973 identifiable with a compartment of the characteristic model for iodine. For example, the 3974 compartments of the caesium model representing liver and kidneys are assumed to correspond 3975 to the compartments for liver iodide and kidney iodide in the characteristic model for iodine. 3976 When produced in a compartment that is not identifiable with a compartment in the 3977 characteristic model for iodine, 125I generally is assumed to transfer rapidly to blood (at the 3978 rate 330 d-1, the highest transfer rate to blood in the iodine model) and then to follow the 3979 characteristic model for iodine. An exception is that 125I produced in red blood cells is 3980 assumed to transfer to the iodide blood pool in the iodine model at the rate 1000 d-1. 3981
(306) Caesium-127 (T1/2 = 6.25 h) decays to the noble gas 127Xe (T1/2 = 36.4 d). In this 3982 case inclusion of decays of the progeny based on the xenon model described above has a 3983 negligible effect on dose estimates for the parent due to the relatively long half-life of the 3984 xenon isotope. 3985
(307) Cesium-137 (T1/2 = 30.2 y) decays to 137mBa (T1/2 = 2.55 min). Wasserman et al. 3986 (1959) demonstrated considerable dissociation of 137mBa from 137Cs in rats at 4-7 d after 3987 intraperitoneal administration of 137Cs/137mBa, despite the short half-life of 137mBa. Barium-3988 137m was found to exceed equilibrium proportions in bone, blood, and plasma by factors of 3989 3.3, 3.9, and 14, respectively. Some soft tissues were moderately deficient in 137mBa, while 3990 others showed little or no deviation from equilibrium. The authors concluded nevertheless 3991 that soft tissues likely were the main source of the excess 137mBa in plasma and that red blood 3992 cells probably also contributed to the excess. Skeletal muscle was not sampled but seems 3993 likely to have been a major contributor to the excess 137mBa in plasma and bone as it 3994 presumably contained the preponderance of systemic 137Cs after 4-7 d. 3995
(308) The model applied in this report to barium as a parent radionuclide was modified in 3996 the following ways for application to 137mBa produced in systemic pools by decay of 137Cs: 3997 (1) compartments and pathways not relevant to the short-term behavior of systemic barium 3998 were eliminated; and (2) the rate of exchange of barium between plasma and a rapid-turnover 3999 soft-tissue compartment as well as the rates of transfer of barium to tissues and excretion 4000 pathways were increased to provide an improved fit to blood clearance data for human 4001 subjects immediately following intravenous injection of 133Ba (Newton et al., 1991). Kinetic 4002 studies with radioisotopes of barium and other alkaline earth elements indicate that these 4003 elements initially leave plasma with a half-time of a few minutes and equilibrate rapidly with 4004 an extravascular pool about three times the size of the plasma pool (Newton et al., 1991; 4005 Leggett, 1992). Studies of the short-term behavior of 133mBa in human subjects indicate that 4006 the important repositories for barium during the early minutes after intravenous 4007 administration are bone and colon (Korsunskii et al., 1986). The following systemic model 4008

DRAFT REPORT FOR CONSULTATION: DO NOT REFERENCE
104
for 137mBa produced by decay of 137Cs is based on these considerations and the findings of 4009 Wasserman et al. (1959) regarding the dissociation of 137mBa from 137Cs in rats. Barium 4010 produced in skeletal muscle and red blood cells transfers to plasma at the rate 1000 d-1, the 4011 default value for extremely rapid transfer between systemic compartments. Barium produced 4012 in all other soft tissue compartments transfers to plasma at the rate 200 d-1 (half-time of 5 4013 min), chosen to yield at most a moderate deficiency of 137mBa in these tissues compared with 4014 equilibrium values. Barium produced in bone decays at its site of production. Barium 4015 transfers from plasma to: trabecular bone surface at the rate 19.4 d-1, cortical bone surface at 4016 15.6 d-1, right colon contents at 40.3 d-1, urinary bladder contents at 4.48 d-1, and a 4017 compartment representing all soft tissues at 184 d-1. The transfer coefficient from the soft 4018 tissue compartment back to plasma is 61.4 d-1. Barium entering the urinary bladder or right 4019 colon contents follows the generic excretion models. The transfer coefficients from plasma to 4020 bone surface compartments and excretion pathways are two times the corresponding values 4021 given in the model for barium as a parent. The rates of transfer between plasma and the soft 4022 tissue compartment are set to fit the early plasma clearance data of Newton et al. (1991) for 4023 human subjects, with the constraint that the transfer coefficient from soft tissues to plasma is 4024 one-third the coefficient from plasma to soft tissues. This constraint implies that the content 4025 of the soft-tissue compartment is three times that of plasma at equilibrium. The model 4026 predicts that the plasma content of 137mBa at 4-7 d after injection of 137Cs to blood is 13-16 4027 times the equilibrium value, which is consistent with findings of Wasserman et al. (1959) for 4028 rats. The bone content of 137mBa at 4-7 d is predicted to be roughly 2 times the equilibrium 4029 value compared with the ratio 3.3 determined by Wasserman and coworkers. The high rate of 4030 migration of 137mBa from its sites of production to bone indicated by the findings for rats 4031 could not be reproduced while remaining consistent with reported biokinetic data, e.g. blood 4032 clearance data, for barium in human subjects. 4033 4034 6.2.3.4. Differences with gender 4035 4036
(309) The long-term biological half-time of caesium in the total body, representing roughly 4037 90% of absorbed caesium, typically is about one-fourth (15-35%) lower in women than in 4038 men and about one-third lower in pregnant than in non-pregnant women. During lactation 4039 there is substantial transfer of caesium from blood to the mammary glands to milk (ICRP, 4040 2004). 4041 4042 6.3. Individual monitoring 4043 4044
(310) 134Cs internal exposures may be detected using urinalysis or in vivo Whole Body 4045 counting. 4046

DRAFT REPORT FOR CONSULTATION: DO NOT REFERENCE
105
4047 Isotope Monitoring
Technique Method of Measurement
Typical Detection Limit
Achievable detection limit
134Cs Urine Bioassay γ-ray spectrometry 1 Bq/L 0.04 Bq/L 134Cs Whole Body
Counting (shielded room)
γ-ray spectrometry, in vivo
20-40 Bq 11 Bq
134Cs Lung Monitoring γ-ray spectrometry, in vivo
9 Bq*
∗ Lung monitoring of 134Cs is not generally used in routine monitoring of workers. Monte Carlo program 4048 Visual Monte Carlo was used to simulate the photon emission, to calculate the calibration factor for the 4049 geometry and radionuclide, and to calculate the minimum detectable activity (MDA) in the lung. (Hunt et al, 4050 2012) 4051
4052 (311) 137Cs internal exposures are detected by gamma spectroscopy using the 0.661 MeV 4053
gamma ray from its daughter 137mBa (T1/2 =2.5 min), which is produced in approximately 4054 94.4 % of decays of 137Cs and exists in secular equilibrium with 137Cs in the body. Gamma 4055 spectroscopy is used for in vivo measurements and for excreta analysis. 4056 4057
Isotope Monitoring Technique
Method of Measurement
Typical Detection Limit
Achievable detection limit
137 Cs Urine Bioassay γ-ray spectrometry from 137mBa
1-5 Bq/L 0.1 Bq/L
137 Cs Lung monitoring γ-ray spectrometry from137mBa
11 Bq*
137 Cs Whole Body Counting (shielded room)
γ-ray spectrometry from137mBa
25-60 Bq 16 Bq
∗ Lung monitoring of 137Cs is not generally used in routine monitoring of workers. Monte Carlo program 4058 Visual Monte Carlo was used to simulate the photon emission, to calculate the calibration factor for the 4059 geometry and radionuclide, and to calculate the minimum detectable activity (MDA) in the lung. (Hunt et al, 4060 2012) 4061
4062 References 4063
4064 Al Rayyes, A.H., Ronneau, C., Stone, W.E., Genet, M.J., Ladière, J., Cara. J., 1993. Radiocaesium in 4065
Hot particles: solubility vs chemical speciation. J. Environ. Radioact., 21, 143-151. 4066 Andrieu, L., Fatome, M., 1979. Évolution lontaine inattenfue d’une contamination interne. 4067
Radioprotection 14(3), 135-143. 4068 Boecker, B. B., Cuddihy, R.G., Hahn, F F., McClellan, R.O., 1974. A seven year study of the 4069
pulmonary retention and clearance of 137Cs inhaled in fused aluminosilicate particles by the 4070 beagle dog. Inhalation Toxicology Research Institute Annual Report 1973–1974, LF–49, pp. 4071 48–52. Lovelace Biomedical and Research Foundation, Albuquerque, New Mexico. 4072 Available from National Technical Information Service, Springfield, Virginia. 4073
Boecker, B.B., 1969a. The metabolism of 137Cs inhaled as 137CsCl by the beagle dog. Proc. Soc. Exp. 4074 Biol. Med. 30, 966-971. 4075
Boecker, B.B., 1969b. Comparison of 137Cs metabolism in the beagle dog following inhalation and 4076 intravenous injection. Health Phys., 16, 785–788 4077
DRAFT REPORT FOR CONSULTATION: DO NOT REFERENCE
106
Carr, E.A., 1966. Pharmacology of radioactive caesium salts. In: Andrews GA, Kniseley RM, Wagner 4078 HN, editors. Radioactive Pharmaceuticals, Proceedings of a symposium held at Oak Ridge 4079 Associated Universities, Nov 1-4, 1965, USAEC; CONF-651111, pp. 619-634. 4080
Cecchi, X., Wolff, D., Alvarez, O., Latorre, R., 1987. Mechanisms of Cs+ blockade in a Ca2+-4081 activated K+ channel from smooth muscle. Biophys. J., 52, 707-716 4082
Cryer, M.A., Baverstock, K.F., 1972. Biological half-time of 137Cs in man. Health Phys., 23, 394-395. 4083 Cuddihy, R.G., Finch, G.L., Newton, G.J., Hahn, F.F., Mewhinney, J.A., Rothenberg, S.J., Powers, 4084
D.A., 1989. Characteristics of radioactive particles released from the Chernobyl nuclear 4085 reactor. Environ. Sci. Technol., 23, 89–95. 4086
Cuddihy, R.G., Ozog, J.A., 1973. Nasal absorption of CsCl, SrCl2, BaCl2, and CeCl3 in Syrian 4087 Hamsters. Health Phys., 25, 219–224. 4088
Dua, S.K., Maniyan, C.G., Kotrappa, P., 1987. Inhalation exposures during operations in spent fuel 4089 bays. Radiat. Prot. Dosim., 19, 165–172. 4090
Edwards, C., 1982. The selectivity of ion channels in nerve and muscle. Neuroscience 7, 1335-1366. 4091 Ekman, L., 1961, Distribution and excretion of radio-cesium in goats, pigs and hens. Acta Vet. Scand. 4092
2 (Suppl. 4):1-83. 4093 Forth, W., Oberhausen, E., Pfleger, K., Weske, G., 1963. Beitrag zur Kloumarung der Ursachen der 4094
Anreicherung von Caesium-137 im Organismus. Experientia, 19, 25-26. 4095 Froning, M., Kozielewski, T., Schlager, M., Hill, P., 2004. A case study of the long-term retention of 4096
137Cs after inhalation of high temperature reactor fuel element ash, Radiat. Prot. Dosim., 4097 111(1), 55-58. 4098
Furchner, J. E.; Trafton, G. A.; Richmond, C. R. , 1964. Distribution of cesium-137 after chronic 4099 exposure in dogs and mice. Proc. Soc. Exp. Biol. Med. 116:375-378. 4100
Gregus, Z., Klaassen, C.D., 1986. Disposition of metals in rats: A comparative study of fecal, urinary, 4101 and biliary excretion and tissue distribution of eighteen metals. Toxicol Appl. Pharmacol., 85, 4102 24-38. 4103
Gyorgyi, S., Kanyar, B., 1973. Comparison of Cs-137 and K-42 transport of rat erythrocytes by 4104 means of a tracer kinetic model. In: Bujdoso E. Proceedings of the IRPA second European 4105 congress on radiation protection, pp. 263-268. 4106
Hesp, R., 1964. The retention and excretion of caesium-137 by two male subjects. In Assessment of 4107 Radioactivity in Man. Vol. II. IAEA, Vienna, pp. 61-74. 4108
Hodgkin, A.L., 1947. The effect of potassium on the surface membrane of an isolated axon. J. 4109 Physiol., 106, 319-340. 4110
Hölgye, Z., Malý, M., 2002. A case of repeated accidental inhalation contamination of a male subject 4111 with 137Cs. Health Phys., 82(4), 517-520. 4112
ICRP, 1979. Limits for intakes of radionuclides by workers. ICRP Publication 30, Part 1. Oxford: 4113 Pergamon Press. 4114
ICRP, 1989. Age-dependent Doses to Members of the Public from Intake of Radionuclides. Part 1. 4115 ICRP Publication 56. Ann. ICRP 20(2). 4116
ICRP, 1993. Age-dependent Doses to Members of the Public from Intake of Radionuclides. Part 4117 2.Ingestion dose coefficients. ICRP Publication 67. Ann. ICRP 23(3-4). 4118
ICRP, 1994. Dose coefficients for intake of radionuclides by workers. ICRP Publication 68, Ann. 4119 ICRP 24 (4). 4120
ICRP, 2002a. Supporting Guidance 3. Guide for the Practical Application of the ICRP Human 4121 Respiratory Tract Model. Ann. ICRP 32(1-2). 4122
ICRP, 2002b. Basic anatomical and physiological data for use in radiological protection: reference 4123 values. ICRP Publication 89, Ann. ICRP 32 (3-4). 4124
ICRP, 2004. Doses to infants from ingestion of radionuclides in monthers' milk. ICRP Publication 95. 4125 Ann ICRP 34 (3-4). 4126
Korsunskii, V.N., Tarasov, N.F., Naumenko, A.Z., 1981. Clinical evaluation of Ba-133m as an 4127 osteotropic agent. ORNL/TR-86/30 (7 pgs); Translated from the Russian UDC 616.71-006-4128 073.916, Meditsinskaya Radiologiya No. 10, pp. 45-48. 4129

DRAFT REPORT FOR CONSULTATION: DO NOT REFERENCE
107
Kotrappa, P., Bhat, I.S., Vashi, V.D., 1977. Particle size and solubility characteristics of aerosols in 4130 Pu processing areas and BWR type power reactors. IN Proceedings of the Fourth 4131 International Congress of the International Radiation Protection Association (IRPA) Paris 4132 Vol. 3, pp. 771–774. 4133
Krulik, R., Farska, I., Prokes, J., Tykva, R., 1980. Distribution of caesium in the organism and its 4134 effect on the nucleotide metabolism enzymes. Int. Pharmacopsychiat. 15, 157-165. 4135
Kutkov, V.A., 1998. Application of human respiratory tract models for reconstruction of the size of 4136 aerosol particles through the investigation of radionuclides behaviour in the human body. 4137 Radiat. Prot. Dosim., 79, 265–268. 4138
Kutkov, V.A., 2000. Results of in vivo monitoring of the witnesses of the Chernobyl accident. 4139 Radiat. Prot. Dosim. 89, 193-197. 4140
Kutkov, V.A., Komaritskaya, O.I., 1996. In vitro solubility of Chernobyl nuclear fuel aerosol with 4141 respect to collective behaviour of its radionuclides. In : Proc. IRPA 9, Vienna, 2, 445-447. 4142
Latorre, R., Miller, C., 1983. Conduction and selectivity in potassium channels. J Membr. Biol. 4143 71:11-30. 4144
Leggett, R. W., 1992. A generic age-specific biokinetic model for calcium-like elements. Radiat. Prot. 4145 Dosim., 41,183-198. 4146
Leggett, R.W., 1986. Predicting the retention of caesium in individuals. Health Phys., 50, 747-759. 4147 Leggett, R.W., Bouville, A., Eckerman, K.F., 1998. Reliability of the ICRP’s systemic biokinetic 4148
models. Radiat. Prot. Dosim., 79, 335-342. 4149 Leggett, R.W., Williams, L.R., 1986. A model for the kinetics of potassium in healthy humans. Phys. 4150
Med. Biol., 31, 23-42. 4151 Leggett, R.W., Williams, L.R., 1988. A biokinetic model for rubidium in humans. Health Phys., 55, 4152
685-702. 4153 Leggett, R.W., Williams, L.R., 1995. A proposed blood circulation model for Reference Man. Health 4154
Phys., 69, 187-201. 4155 Leggett, R. W.; Williams, L. R.; Eckerman, K. F. (1999). A blood circulation model for reference 4156
man. In: Proceedings of the 6th Annual Radiopharmaceutical Dosimetry Symposium; A. T. 4157 S.-Stelson, M. G. Stabin, and R. B. Sparks, eds. (Oak Ridge, TN: Oak Ridge Institute for 4158 Science and Education); pp. 487-499. 4159
Leggett, R.W., Williams, L.R., Melo, D.R., Lipsztein, J.L., 2003. A physiologically based biokinetic 4160 model for caesium in the human body. The Science of the Total Environment 317, 235-255. 4161
LeRoy, G.V., Rust, J.H., Hasterlik, R.J., 1966. The Consequences of Ingestion by Man of Real and 4162 Simulated Fallout. Health Phys., 12, 449-473. 4163
Lie, R., 1964. Deposition and retention of 137Cs in the rat following inhalation of the chloride and the 4164 nitrate. Health Phys., 10, 1071–1076. 4165
Lloyd, R.D., Mays, C.W., McFarland ,S.S., Zundel, W.S., Tyler, F.H., 1972. Rb-86 and Cs-137 4166 metabolism in persons affected by muscle disease. In: University of Utah Report 4167 COO-119-247, University of Utah College of Medicine. Salt Lake City, UT, pp. 1-72. 4168
Lloyd, R.D., Mays, C.W., McFarland, S.S., Zundel, W.S., Tyler, F.H., 1973. Metabolism of Rb-83 4169 and Cs-137 in persons with muscle disease. Radiat Res., 54, 463-478. 4170
Lloyd, R.D., Zundel, W.S., Mays, C.W., Wagner, W.W., Pendelton, R.C., 1966. Enhanced Cs-137 4171 elimination in pregnant and dystrophic humans. Radiat. Res., 27, 548. 4172
Love, W.D., Burch, G.E., 1953. A comparison of K-42, Rb-86, and Cs-134 as tracers of potassium in 4173 the study of cation metabolism of human erythrocytes in vitro. J. Lab. Clin. Med., 41, 4174 351-362. 4175
Love, W.D., Ishihara, Y., Lyon, L.D., Smith, R.O., 1968. Differences in the relationships between 4176 coronary blood flow and myocardial clearance of isotopes of potassium, rubidium, and 4177 caesium. American Heart J., 76, 353-355. 4178
Madshus, K., Stromme, A., Bohne, F., Nigrovic, V., 1966. Diminution of radiocaesium body-burden 4179 in dogs and human beings by Prussian Blue. Int. J. Radiat. Biol., 10, 519-520. 4180

DRAFT REPORT FOR CONSULTATION: DO NOT REFERENCE
108
McKay, W.A., Memmott, S.D., 1991. An investigation of the availability of 137Cs and 239 + 240Pu 4181 for gut absorption in winkles following cooking and in vitro simulated gastro-intestinal 4182 digestion. Food Addit. Contam., 8, 781-786. 4183
Melo, D.R., Lipsztein, J.L., Oliveira, C.A., Lundgren, D.L., Muggenburg, B.A., Guilmette, R.A., 4184 1997. A biokinetic model for 137Cs. Health Phys., 73, 320-332. 4185
Melo, D.R., Lipsztein, J.L., Oliveira, C.A., Lundgren, D.L., Muggenburg, B.A., Guilmette, R.A., 4186 1998. Prussian Blue decorporation of 137Cs in humans and beagle dogs. Radiat. Prot. Dosim., 4187 79, 473-476. 4188
Miller, C.E., 1964. Retention and distribution of 137Cs after accidental inhalation. Health Phys. 10, 4189 1065–1070. 4190
Mirell, S. G., Blahd, W.H., 1989. Biological retention of fission products from the Chernobyl plume. 4191 Health Phys., 57, 649–652. 4192
Morrow,P.E., Gibb,F.R., Davies, H., Fisher, M., 1968. Dust removal from the lung parenchyma: an 4193 investigation of clearance stimulants. Toxicol. Appl. Pharmacol., 12, 372-396. 4194
Moskalev,Yu., I. 1972. Distribution and acceleration of radioisotope excretion. Distribution of 4195 caesium-137 in the animal organism. AEC-TR-7512, pp. 4-19. 4196
Naversten, Y., Liden, K., 1964. Half-life studies of radiocaesium in humans. In: Assessment of 4197 radioactivity in man, Vol II (Vienna: IAEA), pp. 79-87. 4198
Nelson, A.; Ullberg, S.; Kristoffersson, H.; Ronnback, C., 1961. Distribution of radiocesium in mice. 4199 Acta Radiol. 55:374-384. 4200
Newton, D., Harrison, G.E., Kang, C., Warner, A. J., 1991. Metabolism of injected barium in six 4201 healthy men. Health Phys., 61, 191-201. 4202
Nishiyama, H., Sodd, V.J., Schreiber, T.J., Loudon, R.G., Saenger, E.L., 1975. Imaging of 4203 pulmonary tumors with 129Cs. In: Subramanian, G., Rhodes, B.A., Cooper, J.F., Sodd, V.J., 4204 (Eds.), Radiopharmaceuticals, New York, NY, The Society of Nuclear Medicine, pp. 482-4205 490. 4206
Poe, N.D., 1972. Comparative myocardial uptake and clearance characteristics of potassium and 4207 caesium. J. Nucl. Med., 13:557-560. 4208
Raghavendran, K., Satbhai, P.D., Abhyankar, B., Unnikrishnan, K., Somasundaram, S., 1978. Long-4209 term retention studies of 131I, 137Cs and 60Co in Indian workers, Health Phys., 34, 185-188. 4210
Rosoff, B., Cohn, S.H., Spencer, H.I., 1963. Caesium-137 metabolism in man, Radiat. Res., 19, 4211 643-654. 4212
Rundo, J., 1964. The metabolism of biologically important radionuclides. VI. A survey of the 4213 metabolism of caesium in man. Brit. J. Radiol., 37, 108-114. 4214
Rundo, J., 1965. A case of accidental inhalation of irradiated uranium. Brit. J. Radiol., 38, 39–50. 4215 Rundo, J., Mason, J., Newton, D., Taylor, B., 1963. Biological half-life of caesium in man in acute 4216
and chronic exposure. Nature, Lond., 200, 188-189. 4217 Ruwei, M.A., Yueru, J., Songling, W., 1985. Study of 137Cs metabolism in humans. In: Assessment of 4218
radioactive contamination in man (Vienna: IAEA), IAEA-SM-276/59, pp. 499-506. 4219 Sjodin, R.A., Beauge, L.A., 1967. The ion selectivity and concentration dependence of cation 4220
coupled active sodium transport in squid giant axons. Curr. Mod. Biol., 1, 105-115. 4221 Snipes, M.B., Boecker, B.B., McClellan, R.O., 1983. Retention of monodisperse or polydisperse 4222
aluminosilicate particles inhaled by dogs, rats, and mice. Toxicol. Appl. Pharmacol., 69, 345–4223 362. 4224
Snipes, M.B., McClellan, R.O., 1986. Model for deposition and long-term disposition of 134Cs-4225 labeled fused aluminosilicate particles inhaled by guinea pigs. Inhalation Toxicology 4226 Research Institute Annual Report 1985–1986, LMF–115, pp. 91–95. Lovelace Biomedical & 4227 Environmental Research Institute, Albuquerque, New Mexico. Available from National 4228 Technical Information Service, Springfield, Virginia. 4229
Stara, J.F., 1965. Tissue distribution and excretion of caesium-137 in the guinea pig after 4230 administration by three different routes. Health Phys., 11, 1195–1202. 4231
DRAFT REPORT FOR CONSULTATION: DO NOT REFERENCE
109
Stather, J.W., 1970. An analysis of the whole-body retention of caesium-137 in rats of various ages. 4232 Health Phys., 18, 43-52. 4233
Stradling, G.N., Pellow, P.G., Hodgson, A., Fell, T.P., Phipps, A., Pearce, M., Rance, E., Ellender, 4234 M., Taskaeva, M., Penev, I., Guentchev, T., 1996. Dose coefficient and assessment of intake 4235 of a radionuclide bearing dust formed at the Kozloduy Nuclear Power Plant, NRPB-M679, 4236 Chilton. 4237
Stradling, G.N., Pellow, P.G., Hodgson, A., Fell, T.P., Phipps, A., Pearce, M., Taskaeva, M., Penev, 4238 I., Guentchev, T., 1997. Assessment of intake of a complex radionuclide bearing dust formed 4239 at a nuclear power plant. J. Radioanal. Nucl. Chem., 226(1-2), 7-14. 4240
Stradling, G.N., Stather, J.W., Gray, S.A., Moody, J.C., Ellender M., Collier, C.G., 1989. Assessment 4241 of intake of an actinide-bearing dust formed from the pond storage of spent magnox fuel. 4242 Radiat. Prot. Dosim., 26, 201–206. 4243
Talbot, R.J., Newton, D., Segal, M.G., 1993. Gastrointestinal absorption by rats of Cs-137 and Sr-90 4244 from uranium octoxide fuel particles: implications for radiation doses to man after a nuclear 4245 accident. Radiat. Prot. Dosim. 50: 39-43. 4246
Thomas, R.G., Thomas, R.L., 1968. Long-term retention of Cs-137 in the rat. Health Phys., 15, 83-84. 4247 Thomas, R.L., 1969, Deposition and initial translocation of inhaled particles in small laboratory 4248
animals. Health Phys., 16, 417-428. 4249 Thornberg, C., Mattsson, S., 2000. Increased 137Cs metabolism during pregnancy. Health Phys., 78, 4250
502-506. 4251 Wasserman, R.H., Wardock, A.R., Comar, C.L., 1959. Metabolic dissociation of short-lived barium-4252
137m from its caesium-137 parent. Science 129:568-569. 4253 Williams, L.R., Leggett, R.W., 1987. The distribution of intracellular alkali metals in Reference Man. 4254
Phys. Med. Biol. 32, 173-190. 4255 Yamagata, N., 1962. Balance of potassium, rubidium, and caesium between Japanese people and diet 4256
and assessments of their biological half-times, Nature, 196, 83-84. 4257 Yamagata, N., Iwashima, K., Nagai, T., Watari, K., Iinuma, T.A., 1966. In vivo experiment on the 4258
metabolism of caesium in human blood with reference to rubidium and potassium. J. Radiat. 4259 Res., 7, 29-46. 4260
Yano, Y., Van Dyke, D., Budinger, T.F., Anger, H.O., Chu, P., 1970. Myocardial uptake studies with 4261 129Cs and the scintillation camera. J. Nucl. Med., 11, 663-668. 4262
Zundel, W.S., Tyler, F.H., Mays, C.W., Lloyd, R.D., Wagner, W.W., Pendleton, R.C., 1969. Short 4263 half-times of caesium-137 in pregnant women. Nature, 221, 89-90. 4264
4265 4266
4267

DRAFT REPORT FOR CONSULTATION: DO NOT REFERENCE
110
4268 7. BARIUM (Z = 56) 4269
4270 7.1. Chemical Forms in the Workplace 4271 4272
(312) Barium is an alkaline earth element, which mainly occurs in oxidation states II. It is a 4273 chemical analogue of calcium. Chemical forms encountered in industry include simple 4274 inorganic salts such as chlorides, sulphates and carbonates. Barium sulphate is used as an X-4275 ray radiocontrast agent for imaging the human gastrointestinal tract. 133Ba is routinely used as 4276 a standard source in the calibration of gamma-ray detectors in nuclear physics studies. 4277 4278
Table 7-1. Isotopes of barium addressed in this report 4279 4280
Isotope Physical half-life Decay mode Ba-124 11.0 m EC, B+ Ba-126 100 m EC, B+ Ba-127 12.7 m EC, B+ Ba-128 2.43 d EC Ba-129 2.23 h EC, B+ Ba-129m 2.16 h EC, B+ Ba-131 11.50 d EC Ba-131m 14.6 m IT Ba-133a 10.52 y EC Ba-133m 38.9 h IT, EC Ba-135m 28.7 h IT Ba-139 83.06 m B- Ba-140a 12.752 d B- Ba-141 18.27 m B- Ba-142 10.6 m B-
a Data for these radionuclides are given in the printed copy of this report. Data for other radionuclides are 4281 given on accompanying electronic disk. 4282
4283 7.2. Routes of Intake 4284 4285 7.2.1. Inhalation 4286 4287 Absorption Types and parameter values 4288
(313) No direct information was found on the behaviour of inhaled barium in man. 4289 Information is available from experimental studies of barium as chloride, sulphate or in fused 4290 aluminosilicate particles (FAP). 4291
(314) Absorption parameter values and Types, and associated fA values for particulate 4292 forms of barium are given in Table 7-2. 4293 4294 Barium chloride 4295
(315) Cember et al. (1961) reported that more than 99% of barium administered to rats by 4296 intratracheal injection of 133BaCl2 had cleared from the lungs within 3 hours. Cuddihy and 4297 Griffith (1972) observed very rapid, and almost complete, absorption of 140BaCl2 following 4298 inhalation of 140Ba–140La by dogs, consistent with assignment to Type F. They developed a 4299 biokinetic model to represent the results, and with it estimated a rate of transfer of Ba from 4300

DRAFT REPORT FOR CONSULTATION: DO NOT REFERENCE
111
the respiratory tract to blood of 25 d–1 (t½ ~ 40 minutes). In the model, a small fraction 4301 (0.3%) of the deposit in the pulmonary region was retained indefinitely. This was not 4302 discussed: it could represent a small “bound” component, or systemic barium in lung tissues 4303 and blood. In a complementary experiment, alimentary tract absorption of 140Ba following 4304 administration of 140BaCl2 to dogs by gavage was 7%. However, Cuddihy and Griffith noted 4305 that reported values of alimentary tract absorption reported in the literature for BaCl2 varied 4306 greatly. In subsequent studies (Cuddihy et al., 1974) of dogs that inhaled 133BaCl2, essentially 4307 all of the existing body content was measured in the skeleton 16 d after the exposure. In vitro 4308 dissolution of the same material showed >99.9% dissolved at a rate of 14 d–1 (t½ ~ 1 hour). 4309 Cuddihy and Ozog (1973) deposited 140BaCl2 directly onto the nasal membranes of Syrian 4310 hamsters: the results give an absorption rate of about 7 d–1 (t½ ~ 2 hours). This is somewhat 4311 slower than in other studies, possibly because of the experimental techniques used, including 4312 the anaesthetic or slower clearance from the nasal passage than from the lungs. Similar 4313 observations were made for strontium and caesium chlorides which were also administered by 4314 Cuddihy and Ozog (see Strontium and Caesium Sections). 4315
(316) Based on the results of the experiments outlined above, specific absorption 4316 parameter values for barium chloride were estimated by the Task group to be: fr = 1 and 4317 sr = 20 d-1 (consistent with assignment to default Type F). However, although specific 4318 parameter values for barium chloride based on in vivo data are available, they are not adopted 4319 here, because inhalation exposure to it is so unlikely. Instead, barium chloride is assigned to 4320 Type F. However, the data are used as the basis for the default rapid dissolution rate for 4321 barium. Hence specific parameter values for barium chloride would be the same as default 4322 Type F barium parameter values. 4323 4324 Barium carbonate 4325
(317) For details see the section on carbon. Measurements of lung retention of 14C 4326 following pulmonary intubation of barium 14C-labelled carbonate into rats, and accidental 4327 inhalation by man, indicate assignment to Type F. 4328 4329 Barium sulphate. 4330
(318) Morrow et al. (1964) observed a biological half time in the lungs of 8 d following 4331 inhalation of 131BaSO4 by a dog, corresponding to a rate of absorption of about 0.1 d–1, and 4332 assignment to Type F. Cuddihy et al. (1974) followed the behaviour of 133Ba for 16 d after 4333 inhalation of 133BaSO4 by dogs. In vitro dissolution tests of the same material gave fr = 0.9, sr 4334 = 0.4 d–1 (t½ ~ 2 d) and ss = 0.0017 d–1 (t½ ~ 400 d), consistent with absorption Type F. These 4335 values were incorporated in a biokinetic model, which gave predictions in good agreement 4336 with the observed in vivo behaviour. In similar experiments with heat-treated (900˚C) 4337 133BaSO4 (Cuddihy et al., 1974), in vitro dissolution tests gave fr = 0.2, sr = 0.07 d–1 (t½ ~ 10 4338 d) and ss = 0.038 d–1 (t½ ~ 18 d), consistent with absorption Type M. Again, biokinetic model 4339 predictions using these values were in reasonable agreement with the observed behaviour. 4340
(319) 133BaSO4 has also been used as an effectively insoluble test material to study the 4341 retention and clearance of particles deposited in the trachea in several species (Patrick and 4342 Stirling, 1977; Takahashi and Patrick, 1987; Takahashi et al., 1993; Patrick and Stirling, 4343 1997). Most of these studies were of short duration (typically a week), and absorption was 4344 not considered to be a significant clearance pathway. In one, however, measurements were 4345 made for 6 months, and included tissue distribution data, which indicate Type M behaviour 4346 (Takahashi and Patrick, 1987). In rats, about 1% of the material deposited on the distal 4347

DRAFT REPORT FOR CONSULTATION: DO NOT REFERENCE
112
trachea was retained with a half-time of 88 days, and the main clearance route identified was 4348 to lymph nodes, suggesting an absorption rate of less than 0.01 d–1. 4349
(320) Overall, a wide range of absorption rates has been observed, possibly due to 4350 differences in the method of preparation of the BaSO4. Specific parameter values are 4351 therefore not proposed and BaSO4 is assigned to Type M. 4352 4353 Fused aluminosilicate particles (FAP) 4354
(321) FAP or “fused clay” particles have been extensively used as relatively insoluble 4355 particles in inhalation studies, both of biokinetics and of radiation effects. A natural clay 4356 mineral is labelled by ion exchange, and the labelled clay particles heated to about 1100˚C, to 4357 form aluminosilicate glass microspheres in which the label is incorporated. Cuddihy et al. 4358 (1974) followed the behaviour of 133Ba for 512 d after inhalation of 133Ba-FAP by dogs. In 4359 vitro dissolution tests (duration 120 d) of the same material gave fr = 0.12, sr = 0.13 d–1 (t½ ~ 5 4360 d) and ss = 0.0016 d–1 (t½ ~ 430 d), consistent with absorption Type M. These were 4361 incorporated in a biokinetic model, which gave predictions in good agreement with the 4362 observed behaviour. 4363 4364 Rapid dissolution rate for barium 4365
(322) Studies with barium chloride outlined above give values of sr of about 20 d–1, which 4366 is applied here to all Type F forms of barium. 4367 4368 Extent of binding of barium to the respiratory tract 4369
(323) Evidence from the barium chloride studies outlined above suggests that there is 4370 probably little binding of barium. It is therefore assumed that for barium the bound state can 4371 be neglected, i.e. fb = 0.0. 4372 4373 4374

DRAFT REPORT FOR CONSULTATION: DO NOT REFERENCE
113
Table 7-2. Absorption parameter values for inhaled and ingested barium 4375
Inhaled particulate materials
Absorption parameter valuesa
Absorption from the alimentary tract, fA fr sr (d–1) ss (d–1)
Default parameter valuesb,c Absorption Type Assigned forms F Barium chloride, carbonate 1 20 0.2 M Barium sulphate; all unspecified
formsd 0.2 3 0.005 0.04
S — 0.01 3 1x10⁻⁴ 0.002 Ingested materials Soluble forms 0.2 Insoluble form (sulphate, titanate) 1x10⁻⁴ a It is assumed that for barium the bound state can be neglected, i.e. fb = 0.0. The value of sr for Type F forms 4376
of barium (20 d–1) is element-specific. The values for Types M and S (3 d–1) are the general default values. 4377 b Materials (e.g. barium chloride) are listed here where there is sufficient information to assign to a default 4378
absorption Type, but not to give specific parameter values (see text). 4379 c For inhaled material deposited in the respiratory tract and subsequent cleared by particle transport to the 4380
alimentary tract, the default fA values for inhaled materials are applied: i.e. the product of fr for the absorption 4381 Type (or specific value where given) and the fA value for ingested soluble forms of barium (0.2). 4382
d Default Type M is recommended for use in the absence of specific information, i.e. if the form is unknown, 4383 or if the form is known but there is no information available on the absorption of that form from the 4384 respiratory tract. 4385
4386 7.2.2. Ingestion 4387 4388
(324) Barium absorption depends on its chemical form. Barium sulfate is poorly absorbed 4389 from the gastrointestinal tract of adults (Figueroa et al., 1968; Boender and Verloop, 1969), 4390 while acid-soluble barium salts (e.g. acetate, carbonate, chloride, nitrate, hydroxide…) are 4391 readily dissolved in gastric acid and absorbed (Leggett, 1992a). Other factors are known to 4392 affect absorption. In animals, fasting and low calcium concentration in the gut may increase 4393 barium absorption by a factor 2 to 3 (Taylor et al., 1962, Della Rosa et al., 1967, Cuddihy and 4394 Griffith, 1972). 4395
(325) Figueroa et al. (1968) fed five patients with stable barium sulfate and recovered 4396 97.7-103% of the barium given orally in the stools after 5 days. In another study using stable 4397 barium sulfate and barium titanate, average urinary excretion by five to nine human subjects 4398 during the 24h after oral intake varied from about 0.16 to 0.26 µg.g-1 ingested (Clavel et al., 4399 1987) leading other authors to conclude that absorption of these forms should be in the order 4400 of 10-4 (Leggett, 1992a). 4401
(326) LeRoy et al. (1966) found the absorption of 133Ba from simulated fall-out to be 4402 highly variable. Absorption could only be detected by whole-body counting in 4 of the 8 4403 subjects and in these it varied between 0.01 and 0.15. The analysis of barium in human 4404 excreta (Harrison et al., 1956) suggested absorption of about 0.07 and the fraction of dietary 4405 barium excreted in the urine of 2 subjects in a balance study was 0.02 and 0.06 (Tipton et al., 4406 1969). In five female cancer patients with normal gut function, absorption of 140Ba added to 4407 orange juice as the chloride was about 0.08 with a range of 0.03 - 0.16. Studies in which the 4408 absorption of Ba and Ra have been compared in rats, dogs, sheep, pigs and cows have shown 4409 similar levels of absorption of the two elements (Garner, 1960; Taylor et al., 1962; Della 4410 Rosa et al., 1967; Sansom and Garner, 1966). 4411
(327) In Publication 30 (ICRP, 1979), absorption was taken to be 0.1 for all forms of Ba. 4412

DRAFT REPORT FOR CONSULTATION: DO NOT REFERENCE
114
However, as concluded by Leggett (1992a), absorption for soluble forms of barium may be 4413 higher. On the basis of chemical similarity with Ra, and similar absorption values reported for 4414 the two elements, a value of 0.2 was adopted in Publication 67 (ICRP, 1993). 4415
(328) An fA of 0.2 for adults is recommended here for direct ingestion of soluble forms of 4416 barium. For insoluble forms such as barium sulfate or titanate, an fA of 10-4 is recommended. 4417 4418 7.2.3. Systemic Distribution, Retention and Excretion 4419 4420 7.2.3.1. Summary of the database 4421 4422
(329) The alkaline earth element barium is a physiological analogue of the alkaline earth 4423 elements calcium, strontium, and radium but has different biokinetics from those elements 4424 due to discrimination by biological membranes and hydroxyapatite crystals of bone. The 4425 biokinetics of barium resembles that of radium much more closely than that of calcium or 4426 strontium. 4427
(330) Retention and distribution of barium have been determined in controlled studies 4428 involving healthy human subjects (ICRP, 1973, 1993; Leggett, 1992a). There is also 4429 information on the biokinetics of barium in other animal species (ICRP, 1993, Leggett, 4430 1992b). Data for human subjects or laboratory animals used in the development of the model 4431 for systemic barium used in this report are summarized below in the discussion of the basis 4432 for parameter values. 4433 4434 7.2.3.2. Biokinetic model for systemic barium 4435
4436 (331) The generic model structure for bone-volume-seeking radionuclides was used in 4437
ICRP Publication 67 (1993) to model the systemic biokinetics of barium. The same model 4438 structure is applied in this report. The compartments and paths of movement as applied to 4439 barium are summarized below. 4440
(332) Blood plasma is treated as a uniformly mixed pool that contains all barium in blood 4441 and exchanges activity with soft tissues and bone surfaces. Soft tissues are divided into three 4442 compartments corresponding to fast, intermediate, and slow return of activity to plasma 4443 (compartments ST0, ST1, and ST2, respectively). The liver and kidneys are not addressed 4444 separately in the model for barium but are included implicitly in the soft tissue compartments. 4445 Bone is divided into cortical and trabecular bone, and each of these bone types is further 4446 divided into bone surfaces and bone volume. Bone volume is viewed as consisting of two 4447 pools, one that exchanges with activity in bone surface for a period of weeks or months and a 4448 second, non-exchangeable pool from which activity can be removed only by bone 4449 restructuring processes. Activity depositing in the skeleton is assigned to bone surface. Over 4450 a period of days a portion of the activity on bone surfaces moves to exchangeable bone 4451 volume and the rest returns to plasma. Activity leaves exchangeable bone volume over a 4452 period of months, with part of the activity moving to bone surfaces and the rest to non-4453 exchangeable bone volume. The rate of removal from non-exchangeable bone volume is 4454 assumed to be the rate of bone turnover, with different turnover rates applying to cortical and 4455 trabecular bone. Barium is assumed to be lost from the body only by urinary and fecal 4456 excretion. 4457 4458 Parameter values 4459
(333) The parameter values for barium applied in ICRP Publication 67 (1993) to an adult 4460

DRAFT REPORT FOR CONSULTATION: DO NOT REFERENCE
115
member of the public are adopted in this document for application to workers. The basis for 4461 the parameter values is summarized below. 4462
(334) The biological behavior of injected or ingested barium has been investigated in 4463 several controlled studies involving human subjects (Bauer and Carlsson, 1957; Leroy et al., 4464 1966; Harrison et al., 1967; Harrison, 1981; Korsunskii et al., 1981; Newton et al., 1977, 4465 1991, 2001) and several animal species (Richmond et al., 1960, 1962a, 1962b; Farnham and 4466 Rowland, 1965; Ellsasser et al., 1969; Hardy et al., 1969; Wood et al., 1970; Cuddihy and 4467 Griffith, 1972; Stather, 1974; Domanski et al., 1980). It has been shown that the biokinetics 4468 of barium is similar but not identical to that of radium. For example, data for a healthy 60-y-4469 old male human injected with 223Ra and 133Ba indicate similar retention of these radionuclides 4470 in blood and in the total body for several days after injection but a slightly more rapid decline 4471 of whole-body 223Ra after a few weeks (Harrison et al., 1967, Newton et al., 1977). In human 4472 studies, administered radium and barium isotopes have been excreted primarily in faeces 4473 (Schales, 1964; Harrison et al., 1967; Maletskos et al., 1969; Korsunskii et al., 1981) and 4474 have shown fairly similar fecal excretion rates for at least a month after injection (Harrison et 4475 al., 1967). Barium appears to be eliminated in urine at a greater rate than radium (Harrison et 4476 al., 1967), but urinary excretion constitutes only a small fraction of total excretion of both 4477 elements in humans (Harrison et al., 1967, Korsunskii et al., 1981, Newton et al., 1991). In a 4478 study of the fate of 226Ra and 133Ba acutely ingested by eight beagles from 43 to 1500 days of 4479 age, Della Rosa et al. (1967) found that these two radionuclides were absorbed and retained 4480 with nearly the same efficiency in each animal, with 30-d retention of barium being slightly 4481 greater as an average than that of radium. In cows, radium and barium behaved similarly with 4482 regard to secretion into the gut, resorption from bone, and concentration in pigmented tissue 4483 but differed in their rates of secretion into milk, loss in urine, and whole-body accretion 4484 (Sansom and Garner, 1966). 4485
(335) Kinetic analysis of plasma disappearance curves for normal subjects intravenously 4486 injected with radioisotopes of calcium, strontium, barium, or radium indicates that these 4487 elements initially leave plasma at a rate of several hundred plasma volumes per day and 4488 equilibrate rapidly with an extravascular pool roughly three times the size of the plasma pool 4489 (Heaney, 1964; Harrison et al., 1967; Hart and Spencer, 1976). Total transfer rates from 4490 plasma of 70 d-1 yield reasonable fits to plasma disappearance curves for barium and radium 4491 at times greater than 1-2 h after injection (Leggett, 1992a). The rapid early removal from 4492 plasma is not addressed in this model. 4493
(336) Fractional deposition of barium in the fast-turnover soft-tissue compartment ST0 is 4494 determined as the balance after other deposition fractions have been assigned. As discussed 4495 below, deposition fractions of 0.25 for bone, 0.1 for intermediate-term soft tissues (ST1), 4496 0.002 for long-term soft tissues (ST2), and 0.32 for excretion pathways are assigned to 4497 barium, leaving 0.328 for ST0. The derived transfer rate from plasma to ST0 is 0.328 x 70 d-1 4498 = 23 d-1. Based on the assumed relative amounts of barium in ST0 and plasma, the transfer 4499 rate from ST0 to plasma is set at one-third the transfer rate from plasma to ST0, or 7.67 d-1. 4500
(337) Data on intermediate-term retention of injected barium in human soft tissues are 4501 largely qualitative but indicate that little barium remains in soft tissues by a few days after 4502 injection (Korsunskii et al., 1981; Newton et al., 1991). This conclusion is consistent with 4503 direct measurements of injected, ingested, or inhaled barium in tissues of laboratory animals 4504 (Garner, 1960; Loutit and Russell, 1961; Bligh and Taylor, 1963; Wood et al., 1970; Cuddihy 4505 and Griffith, 1972). In vitro measurements indicate that barium competes with calcium for 4506 transport across cell membranes and in some cases may be transported in preference over 4507 calcium but may not be sequestered at intracellular sites that sequester calcium or strontium 4508

DRAFT REPORT FOR CONSULTATION: DO NOT REFERENCE
116
(Mullins, 1959; Shine et al., 1978; Carafoli, 1987; Tsien et al., 1987). Comparative data on 4509 the distributions of intravenously injected strontium and barium in rats (Bligh and Taylor 4510 1963) indicate similar deposition of these elements in soft tissues but a much higher rate of 4511 loss of barium than strontium from soft tissues. In this model it is assumed that barium is 4512 deposited in the intermediate-term soft-tissue compartment ST1 to the same extent as calcium 4513 or strontium (deposition fraction = 0.1) but returns to plasma at a much higher rate than those 4514 elements. A removal half-time of 1 d for barium is broadly consistent with soft-tissue data on 4515 laboratory animals and qualitative information for human subjects. The derived transfer rate 4516 from plasma to ST1 is 0.1 x 70 d-1 = 7 d-1 and from ST1 to plasma is ln(2)/ 1 d = 0.693 d-1. 4517
(338) Despite the low intermediate-term retention of injected barium in soft tissues, a non-4518 trivial portion of total-body barium can be found in human soft tissues after chronic exposure 4519 (Schroeder et al., 1972; ICRP, 1973, 1975; Schlenker et al., 1982). Much of this may reside 4520 in small, relatively insoluble deposits of barium sulphate (Garner, 1960; Schroeder et al., 4521 1972; Van Middlesworth and Robison, 1975; Doig, 1976). In this model, compartment ST2 4522 is used to account for nearly all the barium in soft tissues during chronic intake. The 4523 deposition fraction for compartment ST2 is set for consistency with the estimate that 4.7% of 4524 total-body Ba resides in soft tissues of the average adult (Schlenker et al., 1982), taking 4525 account of the projected contribution of ST1 and assuming that the removal half-time from 4526 ST2 to plasma is the same as estimated for calcium (5 y). It is assumed that 0.2% of barium 4527 leaving plasma enters ST2. The derived transfer rate from plasma to ST2 is 0.002 x 70 d-1 = 4528 0.14 d-1 and from ST2 to plasma is ln(2)/5 y = 0.00038 d-1. 4529
(339) Data from human and animal studies indicate that the rate of loss of alkaline earth 4530 elements from bone over the first few months after injection increases in the order calcium < 4531 strontium < barium < radium, and fractional long-term retention increases in the reverse 4532 order. Some element-specific parameter values are required to account for these differences, 4533 but most of the parameter values describing bone kinetics are generic, that is, the same for 4534 each of these alkaline earth elements. The basis for applying generic values is discussed in 4535 earlier sections on calcium and strontium. Essentially, kinetic analysis of whole-body 4536 retention data for humans and more direct examination of alkaline earth kinetics in laboratory 4537 animals do not reveal distinct differences between these elements with regard to the 4538 following: early accumulation in bone as a fraction of activity reaching blood; initial division 4539 between trabecular and cortical bone; early rate of loss from bone, interpreted for purposes of 4540 the present model as transfer from bone surfaces to plasma; the fraction subject to 4541 intermediate-term retention in bone, interpreted as transfer from bone surfaces to 4542 exchangeable bone volume; and the rate of removal from bone at times remote from uptake, 4543 interpreted as removal of non-exchangeable activity due to bone resorption. The following 4544 generic parameter values are applied (see the earlier sections on calcium and strontium): 4545 fractional deposition in bone = 0.25; fractional deposition in trabecular bone = 1.25 times that 4546 on cortical bone; half-time on bone surface = 1 d, with 5/6 transferring to plasma and 1/6 to 4547 exchangeable bone volume; removal rate from non-exchangeable trabecular and cortical bone 4548 volume = 18% and 3% y-1, respectively. The transfer rates for barium derived from these 4549 generic parameter values are as follows: plasma to trabecular bone surface = (1.25/2.25) x 4550 0.25 x 70 d-1 = 9.72 d-1; plasma to cortical bone surface = (1/2.25) x 0.25 x 70 d-1 = 7.78 d-1; 4551 trabecular or cortical bone surface to the corresponding exchangeable bone volume 4552 compartment = (1/6) × ln(2)/1 d = 0.116 d-1, trabecular or cortical bone surface to plasma is 4553 (5/6) × ln(2)/1 d = 0.578 d-1; trabecular bone volume to plasma, 0.000493 d-1; and non-4554 exchangeable cortical bone volume to plasma, 0.0000821 d-1. 4555

DRAFT REPORT FOR CONSULTATION: DO NOT REFERENCE
117
(340) Observed differences in the behavior of alkaline earth elements in bone are accounted 4556 for by differences in the rate of removal from the exchangeable bone volume compartments and 4557 the fraction transferred from exchangeable to non-exchangeable bone volume. It is assumed, in 4558 effect, that calcium, strontium, barium, and radium are all equally likely to become temporarily 4559 incorporated in bone mineral after injection into blood but that the likelihood of reaching a non-4560 exchangeable site in bone crystal decreases in the order calcium > strontium > barium > radium. 4561 Fractional transfers of calcium, strontium, barium, and radium from exchangeable to non-4562 exchangeable bone volume are set at 0.6, 0.5, 0.3, and 0.2, respectively, and the balance is 4563 assumed to return to bone surfaces. The removal half-times from exchangeable bone volume 4564 are set at 100 d, 80 d, 50 d, and 30 d, respectively. These values are set to achieve reasonable 4565 consistency with whole-body retention curves for humans injected with radioisotopes of the 4566 alkaline earth elements (e.g. Harrison et al., 1967; Newton et al., 1991). The assumed 4567 fractional transfers to non-exchangeable bone volume are also reasonably consistent with 4568 results of in vitro measurements. For example, under conditions approximating physiological, 4569 Neuman (1964) found that calcium incorporated into forming hydroxyapatite crystals is 65% 4570 non-exchangeable, and Stark (1968) determined discrimination factors relative to calcium of 4571 0.93 for strontium, 0.56 for barium, and 0.32 for radium in forming crystals. Such in vitro 4572 results have varied to some extent with experimental conditions, length of aging of the crystals, 4573 and the definition of discrimination (Neuman, 1964; Stark, 1968). 4574
(341) For barium, the above estimates of the removal half-time from exchangeable bone 4575 volume and the fractional transfers to non-exchangeable bone volume and bone surface yield 4576 the following transfer rates: exchangeable to non-exchangeable bone volume (cortical or 4577 trabecular), 0.3 x ln(2)/50 d = 0.0042 d-1; exchangeable bone volume to bone surface, 0.7 x 4578 ln(2)/50 d = 0.0097 d-1. 4579
(342) Based on estimates from human studies (Harrison et al., 1967; Newton et al., 1991), 4580 it is estimated that about 32% of barium leaving plasma is deposited in excretion pathways 4581 and that the ratio of urinary to faecal excretion is about 1:9. The derived transfer rate from 4582 plasma to the urinary bladder contents is 0.1 × 0.32 × 70 d-1 = 2.24 d-1 and from plasma to the 4583 contents of the right colon is 0.9 × 0.32 × 70 d-1 = 20.16 d-1. 4584
(343) Newton et al. (1991, 2001) conducted a long-term study of the biokinetics of 133Ba in 4585 six healthy adult male subjects. Data for the first ~3 y of that study were considered in the 4586 development of the systemic model (Leggett, 1992b) adopted in ICRP Publication 67 (1993) 4587 and used in the present document. External measurements of whole-body retention of 133Ba 4588 in each subject were continued until recently (Newton et al., 2001), providing a check on 4589 model predictions through ~13 y post injection. Model predictions are compared in Figure 4590 6-1 with the reported data. 4591 4592 4593

DRAFT REPORT FOR CONSULTATION: DO NOT REFERENCE
118
4594 Figure 7-1. Comparisons of measured whole-body retention of 133Ba intravenously 4595 injected into six healthy men (Newton et al., 1991, 2001) with predictions of the systemic 4596 biokinetic model adopted in ICRP Publication 67 (1993) and used in this report. Data 4597 for the first ~3 y post injection were used in the construction of the model. 4598 4599
Table 7-3. Transfer rates (d-1) for barium. 4600 4601 Pathway Transfer rate
(d-1) Plasma to urinary bladder contents 2.2400E+00 Plasma to right colon 2.0160E+01 Plasma to trabecular bone surface 9.7200E+00 Plasma to cortical bone surface 7.7800E+00 Plasma to ST0 2.3000E+01 Plasma to ST1 7.0000E+00 Plasma to ST2 1.4000E-01 Trabecular bone surface to plasma 5.7800E-01 Trabecular bone surface to exch volume 1.1600E-01 Cortical bone surface to plasma 5.7800E-01 Cortical bone surface to exchangeable volume 1.1600E-01 ST0 to Plasma 7.6700E+00 ST1 to Plasma 6.9300E-01 ST2 to Plasma 3.8000E-04 Exchangeable trabecular bone volume to surface 9.7000E-03 Exchangeable to nonexchangeable trabecular bone volume 4.2000E-03 Exchangeable cortical bone volume to surface 9.7000E-03 Exchangeable to nonexchangeable cortical bone volume 4.2000E-03 Nonexchangeable cortical bone volume to plasma 8.2100E-05 Nonexchangeable trabecular bone volume to plasma 4.9300E-04 4602
DRAFT REPORT FOR CONSULTATION: DO NOT REFERENCE
119
7.2.3.3. Treatment of radioactive progeny 4603 4604
(344) Several of the barium isotopes addressed in this report have radioactive progeny that 4605 may contribute significantly to dose coefficients for the internally deposited barium parent. 4606 These progeny are isotopes of barium, caesium, lanthanum, or cerium. 4607
(345) Barium, caesium, lanthanum, and cerium atoms produced in systemic compartments 4608 by radioactive decay are assumed to follow the characteristic models for these elements (i.e. 4609 the models applied in this report to these elements as parent radionuclides) from their time of 4610 production, insofar as application of this assumption is straightforward. This assumption is 4611 sometimes ambiguous due to differences in model structures for the different elements. That 4612 is, the site of production of a radionuclide may not be clearly identifiable with a specific 4613 compartment in its characteristic model. In such cases a transfer rate from the site of 4614 production of the radionuclide to the central blood compartment in the radionuclide’s 4615 characteristic model has been assigned as described below. After reaching its central blood 4616 compartment, the radionuclide is assumed to behave as described by its characteristic model. 4617
(346) A caesium atom produced in a soft tissue compartment of the barium model is 4618 assumed to transfer to the central blood compartment of the characteristic model for cesium at 4619 the rate 1000 d-1, a default value used in this report to describe rapid biological transfer. 4620 Caesium produced in a non-exchangeable bone compartment of the barium model transfers to 4621 the central blood compartment at the rate of bone turnover. Caesium produced in bone surface 4622 or exchangeable bone volume transfers to the central blood compartment at the rate of 4623 removal from bone surface compartments given in the characteristic model for caesium 4624 (0.212 d-1). A caesium atom produced in the blood compartment of the barium model is 4625 assumed to be produced in the central blood compartment of the characteristic model for 4626 caesium. 4627
(347) The characteristic model for lanthanum and cerium (the same model is applied to 4628 both elements) will appear in a later part of this series. The reader is referred to a paper by 4629 Taylor and Leggett (2003) for a description of the model. In this report, a lanthanum or 4630 cerium atom produced in a soft-tissue compartment of the barium model is assumed to 4631 transfer to the blood compartment of the lanthanum/cerium model with a half-time of 0.5 d. 4632 This is the shortest biological half-time for any soft tissue compartment in that model. A 4633 lanthanum or cerium atom produced in a bone compartment of the barium model is assumed 4634 to behave as if deposited in that compartment as a parent radionuclide. With regard to the 4635 biokinetics of lanthanum or cerium, no distinction is made between production in an 4636 exchangeable or a non-exchangeable bone volume compartment of the barium model. In 4637 either case the assigned removal rate to the corresponding marrow compartment is the rate of 4638 bone turnover. 4639 4640 7.3. Individual monitoring 4641 4642 133Ba 4643
(348) Monitoring of 133Ba is usually accomplished through urine bioassay. 4644

DRAFT REPORT FOR CONSULTATION: DO NOT REFERENCE
120
4645 Isotope Monitoring
Technique Method of Measurement
Typical Detection Limit
Achievable detection limit
133 Ba Urine Bioassay γ-ray spectrometry 0.6 Bq/L 0.06 Bq/L 133 Ba Whole Body
Counting γ-ray spectrometry 100 Bq 32 Bq
4646 140Ba 4647
(349) Monitoring of 140Ba is usually accomplished through urine bioassay. Whole Body 4648 Counting may also be used. 4649 4650
Isotope Monitoring Technique
Method of Measurement
Typical Detection Limit
Achievable detection limit
140Ba Urine Bioassay γ-ray spectrometry 1 Bq/L 0.1 Bq/L 140 Ba Whole Body
Counting γ-ray spectrometry 80 Bq 51 Bq
4651 References 4652
4653 Bauer, G.C.H., Carlsson, A., 1957. Lindquist, B. Metabolism of Ba-140 in man. Acta Orth. Scand. 4654
26, 241-257. 4655 Bligh, P.H., Taylor, D.M., 1963. Comparative studies of the metabolism of strontium and barium in 4656
the rat. Biochem. J. 87, 612-618. 4657 Boender, C.A., Verloop, M.C., 1969. Iron absorption, iron loss and iron retention in man: studies 4658
after oral administration of a tracer dose of 59FeSO4 and 131-BaSO4. Br. J. Haematol., 17, 4659 45-58. 4660
Carafoli, E., 1987. Intracellular calcium homeostasis Ann. Rev. Biochem. 56, 395-433. 4661 Cember, Watson, J.A., Novak, M.E., 1961. The influence of radioactivity and lung burden on the 4662
pulmonary clearance rate of barium sulphate. Am. Ind. Hyg. Assoc. J., 22, 27–32. 4663 Clavel, J.P., Lorillot, M.L., Buthiau, D., Gerbet, D., Heitz, F., Galli, A., 1987. Intestinal absorption of 4664
barium during radiological studies. Therapie 42, 239-43. 4665 Cuddihy, R.G., Ozog, J.A., 1973. Nasal absorption of CsCl, SrCl2, BaCl2 and CeCl3 in Syrian 4666
hamsters. Health Phys., 25, 219–224. 4667 Cuddihy, R.G., Griffith, W.C., 1972. A biological model describing tissue distribution and whole-4668
body retention of barium and lanthanum in beagle dogs after inhalation and gavage. Health 4669 Phys., 23, 621-633. 4670
Cuddihy, R.G., Hall, R.P., Griffith, W.C., 1974. Inhalation exposure to barium aerosols: physical, 4671 chemical and mathematical analysis. Health Phys., 26, 405–416. 4672
Della Rosa, R.J., Goldman, M., Wolf, H.G., 1967. Uptake and retention of orally administered Ra-4673 226 and Ba-133: A preliminary report, University of California at Davis, Report 472-114, 4674 pp. 40-41; 4675
Doig, A.T., 1976. Baritosis: a benign pneumoconiosis. Thorax 31, 30-39. 4676 Domanski, T., Witkowska, D., Garlicka, I., 1980. Influence of age on the discrimination of barium in 4677
comparison with strontium during their incorporation into compact bone. Acta Physiol. Pol., 4678 31, 289-296. 4679
Ellsasser, J.C., Farnham, J.E., Marshall, J.H., 1969. Comparative kinetics and autoradiography of Ca-4680 45 and Ba-133 in ten-year-old beagle dogs. J. Bone Jt. Surg. 51A, 1397-1412. 4681

DRAFT REPORT FOR CONSULTATION: DO NOT REFERENCE
121
Farnham, J.E., Rowland, R.E., 1965. The retention of Ba-133 in beagles. In: Radiological physics 4682 division annual report, July 1964 through June 1965, Argonne National Laboratory; ANL-4683 7060; 70-73. 4684
Figueroa, W.G., Jordan, T., Basset, S.H., 1968. Use of barium sulfate an an unabsorbable fecal 4685 marker. Am. J. Cin. Nutr., 21, 1239-1245. 4686
Garner, R.J., 1960. Distribution of radioactive barium in eye tissues. Nature 184, 733-734. 4687 Hardy, E., Rivera, J., Fisenne, I., Pond, W., Hogue, D., 1969. Comparative utilization of dietary 4688
radium-226 and other alkaline earths by pigs and sheep. In: Sikov, M.R., Mahlum, D.D. 4689 (Eds.), Radiation biology of the fetal and juvenile mammal. Proc. 9th Annual Hanford 4690 Biology Symposium at Richland, Washington, May 5-8, 1969. U.S. AEC, Division of 4691 Technical Information, 183-190. 4692
Harrison, G.E., 1981. Whole body retention of the alkaline earths in adult man. Health Phys., 40, 95-4693 99. 4694
Harrison, G.E., Carr, T.E.F., Sutton, A., 1967. Distribution of radioactive calcium, strontium, barium 4695 and radium following intravenous injection into a healthy man. Int. J. Radiat. Biol., 13, 235-4696 247. 4697
Harrison, G.E., Raymond, W.H.A., Tretheway, H.C., 1956. The estimation of barium and strontium 4698 in biological materials by activation analysis with special reference to the turnover of 4699 strontium in man. In: Proc. International Conference on the Peaceful uses of Atomic 4700 Energy. Vol. 11, Biological effects of radiation. New York, United Nations, 156-159. 4701
Hart, H.E., Spencer, H., 1976. Vascular and extravascular calcium interchange in man determined 4702 with radioactive calcium. Radiat. Res., 67, 149-161. 4703
Heaney, R.P., 1964. Evaluation and interpretation of calcium-kinetic data in man. Clin. Orthop. Rel. 4704 Res., 31, 153-183. 4705
ICRP, 1973. Alkaline Earth Metabolism in Adult Man. ICRP Publication 20, Pergamon Press, 4706 Oxford. 4707
ICRP, 1979. Limits on Intakes of Radionuclides for Workers. ICRP Publication 30, Pt.1. Ann. ICRP 4708 2. (3/4). 4709
ICRP, 1993. Age-dependent doses to members of the public from intake of radionuclides, Part 2. 4710 Publication 67, Ann. ICRP 23(3/4). 4711
Korsunskii, V.N., Tarasov, N.F., Naumenko, A.Z., 1981. Clinical evaluation of Ba-133m as an 4712 osteotropic agent. ORNL/TR-86/30 (7 pgs); Translated from the Russian UDC 616.71-006-4713 073.916, Meditsinskaya Radiologiya No. 10, pp. 45-48. 4714
Leggett, R.W., 1992a. Fractional absorption of ingested barium in adult humans. Health Phys., 62, 4715 556-61. 4716
Leggett, R.W., 1992b. A generic age-specific biokinetic model for calcium-like elements. Radiat. 4717 Prot. Dosim., 41, 183-198. 4718
LeRoy, G.V., Rust, J.H., Hasterlik, R.J., 1966. The consequences of ingestion by man of real and 4719 simulated fallout. Health Phys., 12, 449-473. 4720
Loutit, J.F., Russell, R.S., (Eds.), 1961. Progress in Nuclear Energy, Series VI, Biological Sciences. 4721 Vol. 3, The entry of fission products into food chains. Pergamon Press, New York. 4722
Maletskos, C.J., Keane, A.T., Telles, N.C., Evans, R.D., 1969. Retention and absorption of Ra-224 4723 and Th-234 and some dosimetric considerations of Ra-224 in human beings. In: Mays, 4724 C.W., Jee, W.S.S., Lloyd, R.D., Stover, B.J., Dougherty, J.H., Taylor, G.N. (Eds.), Delayed 4725 effects of bone-seeking radionuclides, edSalt Lake City, UT. University of Utah Press, 29-4726 49. 4727
Morrow, P.E., Gibb, F.R., Johnson, L., 1964. Clearance of insoluble dust from the lower respiratory 4728 tract. Health Phys., 10, 443–555. 4729
Mullins, L.J., 1959. The penetration of some cations into muscle. J. Gen. Physiol., 42, 817-829. 4730 Neuman, W.F., 1964. Blood-bone exchange. In: Frost, H.M., (Ed.), Bone biodynamics, Boston, Little, 4731
Brown, and Co, 393-408. 4732

DRAFT REPORT FOR CONSULTATION: DO NOT REFERENCE
122
Newton, D., Ancill, A.K., Naylor, K.E., Eastell, R., 2001. Long-term retention of injected barium-133 4733 in man. Radiat. Prot. Dosim., 97, 231-240. 4734
Newton, D., Harrison, G.E., Kang, C., Warner, A. J., 1991. Metabolism of injected barium in six 4735 healthy men. Health Phys., 61, 191-201. 4736
Newton, D., Rundo, J., Harrison, G.E., 1977. The retention of alkaline earth elements in man, with 4737 special reference to barium. Health Phys., 33, 45-53. 4738
Patrick, G., Stirling, C., 1977. The retention of particles in large airways of the respiratory tract. 4739 Proc. R. Soc. Lond. B., 198, 455–462. 4740
Patrick, G., Stirling, C., 1997. Slow clearance of different-sized particles from rat trachea. J. Aero. 4741 Med., 10, 55–65. 4742
Richmond, C.R., Furchner, J.E., Trafton, G.H., 1962a. Retention and excretion of orally administered 4743 Ba-133 by mice. Los Alamos Scientific Laboratory Report LAMS-2780, 17-25. 4744
Richmond, C.R., Furchner, J.E., Trafton, G.H., 1962b. Retention and excretion of orally administered 4745 Ba-133 by rats. Los Alamos Scientific Laboratory Report LAMS-2780, 26-34. 4746
Richmond, C.R., Furchner, J.E., Trafton, G.H., 1960. Retention of Ba-133 in mice, rats, and dogs. 4747 Los Alamos Scientific Laboratory Report LAMS-2455, 24-31. 4748
Sansom, B.F., Garner, R.J., 1966. The metabolism of radium in dairy cows. Biochem. J. 99, 677-81. 4749 Schales, F., 1964. The excretion of thorium X and its daughter products after intravenous injection in 4750
man. In: Assessment of radioactivity in man, Vol. II, Vienna, IAEA, 267-276. 4751 Schlenker, R.A., Keane, A.T., Holtzman, R.B., 1982. The retention of Ra-226 in human soft tissue 4752
and bone; implications for the ICRP 20 alkaline earth model. Health Phys., 42, 671-693. 4753 Schroeder, H.A., Tipton, I.H., Nason, A.P., 1972. Trace metals in man: strontium and barium. J. 4754
Chron. Dis., 25, 491-517. 4755 Shine, K.I., Douglas, A.M., Ricchiuti, N.V., 1978. Calcium, strontium, and barium movements during 4756
ischemia and reperfusion in rabbit ventricle. Circ. Res., 43, 712-720. 4757 Stark, G., 1968. Studies on synthetic hydroxyapatite crystals with regard to metabolism of calcium, 4758
strontium, barium and radium in bone. I. The discrimination against calcium. Biophysik., 5, 4759 42-54. 4760
Stather, J.W., 1974. Distribution of P-32, Ca-45, Sr-85 and Ba-133 as a function of age in the mouse 4761 skeleton. Health Phys., 26, 71-79. 4762
Takahashi, S., Patrick, G., 1987. Long term retention of 133Ba in the rat trachea following local 4763 administration as barium sulfate particles. Radiat. Res., 110, 321–328. 4764
Takahashi, S., Kubota, Y., Sato, H., Matsuoka, O., 1993. Retention of 133Ba in the trachea of rabbits, 4765 dogs and monkeys following local administration of 133BaSO4 particles. Inhalation 4766 Toxicology 5, 265–273. 4767
Taylor, D.M., Bligh, P.H., Duggan, M.H., 1962. The absorption of calcium, strontium, barium, and 4768 radium from the gastrointestinal tract of the rat. Biochem. J., 83, 25-29. 4769
Taylor, D.M., Leggett, R.W. 2003. A generic biokinetic model for predicting the behaviour of the 4770 lanthanide elements in the human body. Radiat. Prot. Dosimetry, 105, 193-198. 4771
Tipton, I.H., Stewart, P.L., Dickson, J., 1969. Patterns of elemental excretion in long term balance 4772 studies. Health Phys., 16, 455-462. 4773
Tsien, R.W., Hess, P., McCleskey, E.W., Rosenberg, R.L., 1987. Calcium channels: Mechanisms of 4774 selectivity, permeation, and block. Ann. Rev. Biophys. Biophys. Chem., 16, 265-290. 4775
Van Middlesworth, L., Robison, W.L., 1975. Thyroid concentration of barium and radium. Int. J. 4776 Nucl. Med. Biol., 2, 1-4. 4777
Wood, S.K., Farnham, J. E., Marshall, J.H., 1970. Ca-45, Ba-133, and Ra-226 in 6-to 10-year-old 4778 beagle dogs: A 100-day study. In: Radiological Physics Division annual report, Center for 4779 Human Radiobiology, July 1969 through June 1970; Argonne, IL: Argonne National 4780 Laboratory; ANL-7760, Part II, Biology and Medicine, 110-132. 4781
4782 4783

DRAFT REPORT FOR CONSULTATION: DO NOT REFERENCE
123
4784 8. IRIDIUM (Z = 77) 4785
4786 8.1. Chemical Forms in the Workplace 4787 4788
(350) Iridium is a transition metal, which occurs mainly in oxidation states III and IV. 4789 Iridium may be encountered in industry in a variety of chemical and physical forms, including 4790 oxides (IrO2, Ir2O3), chlorides and fluorides. Iridium also forms a number of organometallic 4791 compounds, such as iridium carbonyl. 4792
(351) Iridium-192 is used as a gamma radiation brachytherapy source for the treatment of 4793 cancer. 4794 4795
Table 8-1. Isotopes of iridium addressed in this report 4796 4797
Isotope Physical half-life Decay mode Ir-182 15 m EC, B+ Ir-183 58 m EC, B+ Ir-184 3.09 h EC, B+ Ir-185 14.4 h EC, B+ Ir-186 16.64 h EC, B+ Ir-186m 1.92 h EC, B+, IT Ir-187 10.5 h EC, B+ Ir-188 41.5 h EC, B+ Ir-189 13.2 d EC Ir-190 11.78 d EC Ir-190m 1.12 h IT Ir-190n 3.087 h EC, IT Ir-192a 73.827 d B-, EC Ir-192n 241 y IT Ir-193m 10.53 d IT Ir-194 19.28 h B- Ir-194m 171 d B- Ir-195 2.5 h B- Ir-195m 3.8 h B-, IT Ir-196m 1.40 h B-
a Data for these radionuclides are given in the printed copy of this report. Data for other radionuclides are 4798 given on accompanying electronic disk. 4799
4800 8.2. Routes of Intake 4801 4802 8.2.1. Inhalation 4803 4804 Absorption Types and parameter values 4805
(352) Some information was found on the behaviour of inhaled iridium in man following 4806 accidental intakes. Information is available from experimental studies of iridium chloride and 4807 elemental iridium. 4808
(353) Absorption parameter values and Types, and associated fA values for particulate 4809 forms of iridium are given in Table 8-2. 4810 4811 Iridium chloride 4812

DRAFT REPORT FOR CONSULTATION: DO NOT REFERENCE
124
(354) Kreyling et al. (2002) followed the biokinetics of 192Ir for 7 days after intratracheal 4813 instillation of 192IrCl3 into rats. By 7 days, about 8% of the initial lung deposit (ILD) 4814 remained in the lungs, 10% ILD in soft tissues and bone, and smaller amounts in other 4815 tissues; 60% was excreted in urine and 10% in faeces (mostly in the first three days). Similar 4816 results (unpublished) were obtained following inhalation (Kreyling, 2010). Analysis here 4817 gave fr approximately 0.9. There is insufficient information to estimate other parameter values 4818 precisely, but the low fecal excretion suggests that the rapid dissolution rate is high compared 4819 to particle transport rates from the upper respiratory tract, 100 d–1, or more. The results thus 4820 indicate assignment to Type F. 4821 4822 Elemental iridium (metal/oxide) 4823
(355) Casarett et al. (1960) followed the biokinetics of 192Ir for 28 days after inhalation by 4824 rats of the aerosol formed by nebulising an aqueous suspension of 192Ir-labelled iridium. They 4825 estimated that about 95% of the initial deposit (ID) deposited in the upper respiratory tract. 4826 Only about 0.2% ID was retained in the lungs after 2 days, clearing with a half-time of about 4827 23 days. Immediately after inhalation about 5% ID was found in the carcass, which reduced 4828 to about 0.5% by 14 days, with a corresponding increase in urinary excretion. These results 4829 suggest that the rapid dissolution rate is high compared to the particle transport rate from the 4830 upper respiratory tract, 100 d–1, or more. On that assumption, analysis by the task group gave 4831 fr approximately 0.1, indicating assignment to Type M or S. 4832
(356) Kreyling and co-workers have used 192Ir-labelled particles produced with a spark 4833 generator (an intermittent arc between two electrodes in argon) as relatively inert particles to 4834 study the biokinetics of inhaled ultrafine particles, especially particle transport pathways. The 4835 aerosol, produced by evaporation and condensation, consists of agglomerates of primary 4836 particles of about 2-5 nm diameter. Analysis showed the iridium nanoparticles to be oxidised 4837 at the surface (Szymczak et al., 2006). The aerosol was administered (via an endotracheal 4838 tube) to rats which were intubated and ventilated, to avoid extrathoracic deposition and to 4839 optimize deep lung deposition. In a complementary experiment in which a suspension of the 4840 particles was administered via the oesophagus, no detectable 192Ir was observed in urine 4841 (Kreyling et al., 2002), which suggests that fractional absorption from the alimentary tract fA 4842 <0.0001. 4843
(357) Kreyling et al. (2002) followed the biokinetics of 192Ir for 7 days after inhalation (via 4844 an endotracheal tube) by rats of 15-nm and 80-nm count median diameter (CMD) 4845 agglomerates of 192Ir-labelled particles, or intratracheal instillation of a particle suspension 4846 (15-nm CMD). By 7 days after inhalation 47% and 36% of the deposited 15- and 80-nm 4847 particles had cleared, predominantly to faeces. Following inhalation of both aerosols urinary 4848 excretion by 7 days was ~2% ILD, and following instillation ~0.1% ILD. For both aerosols, a 4849 few percent of the ILD was found in tissues other than the lung, but most of this 192Ir was 4850 attributed to particle translocation, rather than dissolution. Semmler et al. (2004) followed 4851 the biokinetics of 192Ir for 180 days after inhalation (via an endotracheal tube) of 15-nm CMD 4852 agglomerates of 192Ir-labelled particles. As in the study by Kreyling et al. (2002), only small 4853 fractions of ILD were found in tissues other than the lung, and most was attributed to particle 4854 translocation. Based on these results, those of Kreyling et al. (2002), and unpublished 4855 excretion data (Kreyling, 2010) parameter values assessed here were fr = 0.0 and ss = 0.01 d–1, 4856 giving assignment to Type M. 4857
(358) Cool et al. (1979) followed lung retention and excretion of 192Ir for two years after 4858 accidental inhalation of iridium aerosol (produced by cutting into a source) by two workers. 4859 Biological retention half times assessed from lung retention and fecal excretion were in the 4860
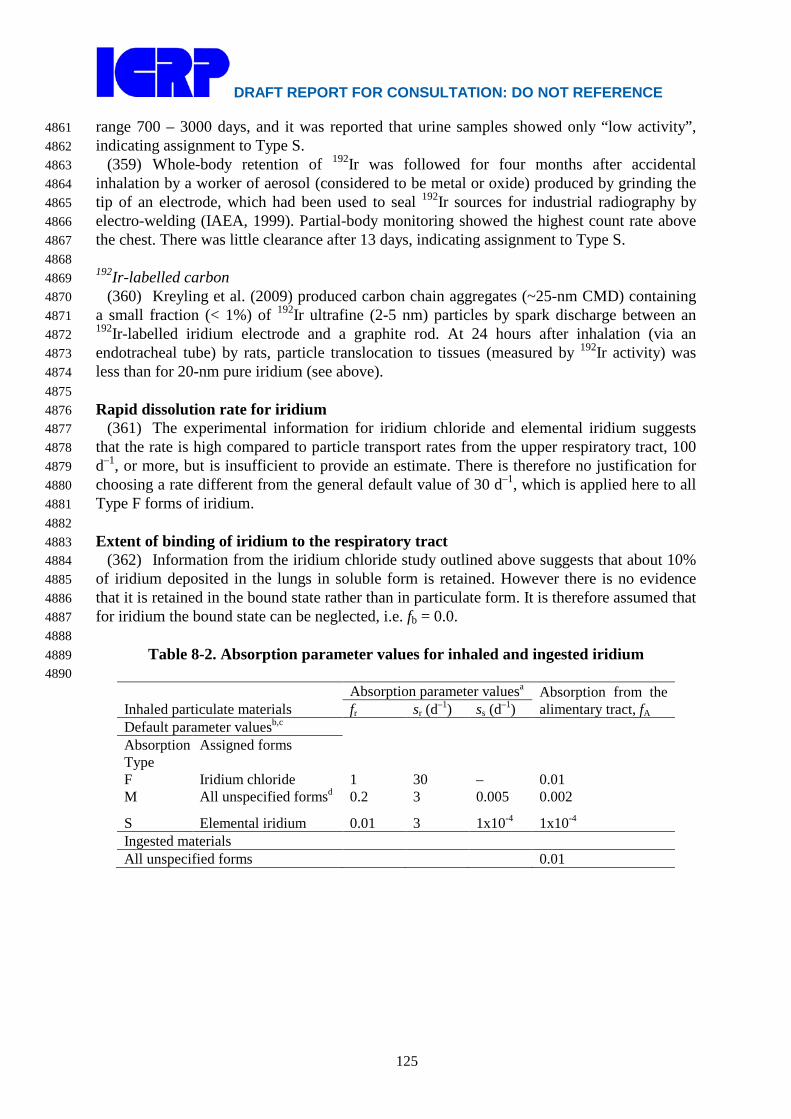
DRAFT REPORT FOR CONSULTATION: DO NOT REFERENCE
125
range 700 – 3000 days, and it was reported that urine samples showed only “low activity”, 4861 indicating assignment to Type S. 4862
(359) Whole-body retention of 192Ir was followed for four months after accidental 4863 inhalation by a worker of aerosol (considered to be metal or oxide) produced by grinding the 4864 tip of an electrode, which had been used to seal 192Ir sources for industrial radiography by 4865 electro-welding (IAEA, 1999). Partial-body monitoring showed the highest count rate above 4866 the chest. There was little clearance after 13 days, indicating assignment to Type S. 4867 4868 192Ir-labelled carbon 4869
(360) Kreyling et al. (2009) produced carbon chain aggregates (~25-nm CMD) containing 4870 a small fraction (< 1%) of 192Ir ultrafine (2-5 nm) particles by spark discharge between an 4871 192Ir-labelled iridium electrode and a graphite rod. At 24 hours after inhalation (via an 4872 endotracheal tube) by rats, particle translocation to tissues (measured by 192Ir activity) was 4873 less than for 20-nm pure iridium (see above). 4874 4875 Rapid dissolution rate for iridium 4876
(361) The experimental information for iridium chloride and elemental iridium suggests 4877 that the rate is high compared to particle transport rates from the upper respiratory tract, 100 4878 d–1, or more, but is insufficient to provide an estimate. There is therefore no justification for 4879 choosing a rate different from the general default value of 30 d–1, which is applied here to all 4880 Type F forms of iridium. 4881 4882 Extent of binding of iridium to the respiratory tract 4883
(362) Information from the iridium chloride study outlined above suggests that about 10% 4884 of iridium deposited in the lungs in soluble form is retained. However there is no evidence 4885 that it is retained in the bound state rather than in particulate form. It is therefore assumed that 4886 for iridium the bound state can be neglected, i.e. fb = 0.0. 4887 4888
Table 8-2. Absorption parameter values for inhaled and ingested iridium 4889 4890
Inhaled particulate materials Absorption parameter valuesa Absorption from the
alimentary tract, fA fr sr (d–1) ss (d–1) Default parameter valuesb,c Absorption Type
Assigned forms
F Iridium chloride 1 30 – 0.01 M All unspecified formsd 0.2 3 0.005 0.002
S Elemental iridium 0.01 3 1x10⁻⁴ 1x10⁻⁴ Ingested materials All unspecified forms 0.01
DRAFT REPORT FOR CONSULTATION: DO NOT REFERENCE
126
a It is assumed that for iridium the bound state can be neglected i.e. fb = 0. The values of sr for Type F, 4891 M and S forms of iridium (30, 3 and 3 d–1, respectively) are the general default values. 4892
b Materials (e.g. iridium chloride) are listed here where there is sufficient information to assign to a 4893 default absorption Type, but not to give specific parameter values (see text). 4894
c For inhaled material deposited in the respiratory tract and subsequent cleared by particle transport to 4895 the alimentary tract, the default fA values for inhaled materials are applied: i.e. the product of fr for 4896 the absorption Type and the fA value for ingested soluble forms of iridium (0.01). 4897
d Default Type M is recommended for use in the absence of specific information, i.e. if the form is 4898 unknown, or if the form is known but there is no information available on the absorption of that form 4899 from the respiratory tract. 4900
4901 8.2.2. Ingestion 4902 4903
(363) No human data are available on the absorption of iridium from the gastrointestinal 4904 tract. 4905
(364) The fractional absorption of iridium, administered as chloride (Na2192IrCl6), has 4906
been measured in several mammalian species (mouse, rat, monkey and dog) and ranged from 4907 0.01 in mice to about 0.04 in monkeys (Furchner et al., 1971). 4908
(365) In Publication 30 (ICRP, 1979), an absorption value of 0.01 was recommended. 4909 Since no new data on the gastrointestinal absorption seem to be available, an fA value of 0.01 4910 is adopted here for all chemical forms. 4911 4912 8.2.3. Systemic Distribution, Retention and Excretion 4913 4914 8.2.3.1. Summary of the database 4915 4916 Data for human subjects 4917
(366) Data on the biokinetics of iridium in human subjects are primarily from cases of 4918 accidental inhalation of 192Ir (Cool et al., 1979; Kelsey and Mettler, 2001; Brodsky and Wald, 4919 2004). The case studies provide little information on the systemic behavior of iridium. 4920 4921 Data for laboratory animals 4922
(367) Casarett et al. (1960) studied the biokinetics of acutely inhaled metallic 192Ir in rats. 4923 The count median diameter of the particles was 0.07 μm with a geometric standard deviation 4924 of about 1.5. Several rats were sacrificed immediately after exposure for determination of 4925 deposition in the respiratory tract, and pairs of rats were sacrificed at 3 h after exposure and at 4926 1, 3, 6, 9, 13, and 14 d after exposure. Excretion was measured in some animals up to 28 d. 4927 Mean deposition in the respiratory tract was ~58% of the inhaled activity. More than 95% of 4928 the deposition was in the upper respiratory tract. The half-time of the initial phase of 4929 clearance was 2-4 h, and the half-time of a second phase was ~24 h. Activity was found in the 4930 liver in two rats immediately after exposure and in one rat at 3 h after exposure, amounting to 4931 about 0.2-0.6% of the deposited amount. In other rats, no significant activity was found in the 4932 liver or other tissues excluding skin except for spleen in two rats (0.14% at time zero and 4933 0.02% at 3 d) and bone in two rats (0.55% at time zero and 0.14% at 3 h). Small but 4934 measurable activities were found in skin throughout the 28-day study. Urinary and fecal 4935 excretion accounted for <4% and >96% of the deposited amount, respectively, over 28 days. 4936 The urinary excretion rate averaged over 48-hour periods was on the order of 1%/day for 0-2 4937 d, 0.1%/day for 10-12 d, and 0.01%/day for 26-28 d. 4938
(368) Durbin et al. (1957, 1960) described the results of tracer studies with 190Ir or 192Ir in 4939
DRAFT REPORT FOR CONSULTATION: DO NOT REFERENCE
127
rats. Kidney, liver, and spleen were the main deposition sites. Excretion was mainly in urine. 4940 After intravenous injection 36% was excreted in urine in the first 4 h. At 1 d the liver, 4941 kidneys, bone, blood, and muscle of rats contained 19.3%, 4%, 3.1%, 6.4%, and 5.6% and 4942 excretion accounted for 43.5% of the administered amount. By 33 d, 45% was excreted in 4943 urine and 35% in faeces, and about 12% remained in liver, skin, and muscle. 4944
(369) Furchner et al. (1971) studied the systemic behavior of 192Ir in mice, rats, monkeys, 4945 and dogs after oral administration, intravenous injection, or intraperitoneal injection of 4946 Na2
192IrCl6. Cumulative urinary excretion during the first two days after oral intake averaged 4947 0.86% of the administered amount in mice, 2.02% in Mystromys rats, 0.96% in Sprague-4948 Dawley rats, 1.34% in monkeys, and 3.54% in dogs. These results indicate that average 4949 fractional uptake by the gastrointestinal tract was higher than the value 0.01 applied to 4950 iridium in ICRP Publication 68 (1994). Whole-body retention over several months following 4951 intravenous or intraperitoneal injection was similar in dogs, mice, Mystromys rats, and 4952 Sprague-Dawley rats (Figure 8-1). Monkeys showed lower excretion rates initially than dogs, 4953 mice, or rats but a faster drop in the body burden than the other species at times remote from 4954 injection (Figure 8-1). Whole-body retention in all species could be described in terms of 4955 three components with average biological half-times on the order of a few hours, a week, and 4956 several months (120-375 d). On average the rapid phase of loss represented about 20% (9-4957 27%) of the administered amount, compared with mean excretion of 43.5% in rats receiving 4958 190Ir or 192Ir chloride by intravenous injection as reported by Durbin (1960). The long-term 4959 component represented at least 46% of the administered amount in all species. As illustrated 4960 in Table 8-3, whole-body retention curves based on the different animal species and different 4961 modes of injection give fairly similar cumulative activities in the body for iridium isotopes 4962 with a range of half-lives. The distribution of activity was determined in rats over the first 120 4963 d after intraperitoneal injection. The retention times in individual organs roughly paralleled 4964 that in the whole body. Highest concentrations were found in spleen, kidneys, and liver, in 4965 that order. The concentration in bone was a factor of 2-3 lower than that of liver but higher 4966 than the average concentration in the body. The liver, kidneys, and bone contained roughly 4967 15%, 5%, 1-2%, and 10% of total-body content, respectively, during the observation period. 4968 The authors concluded from comparison with injection data of Durbin et al. (1957) for rats 4969 that the rate of loss of iridium from the body depends on the chemical form reaching blood. 4970
(370) Ando et al. (1989) determined the distribution of 192Ir in rats at 3, 24, and 48 h after 4971 intravenous injection of H2
192IrCl6. Cumulative urinary excretion at 3 h represented 79.8% of 4972 injected 192Ir. At all three observation times the highest concentration was found in the 4973 kidneys, followed by liver. In contrast to findings of Durbin et al. (1957) and Furchner et al. 4974 (1971), the concentration of iridium in the spleen was an order of magnitude lower than that 4975 of kidney and a factor of 3-4 lower than that of liver. 4976
(371) Hirunuma et al. (1997) studied uptake, retention, and excretion of 17 trace elements 4977 including iridium in Wistar rats over the first 6 d after oral intake of radioisotopes of these 4978 elements in a hydrochloric acid solution. Iridium was found in liver, kidney, and intestinal 4979 tissue, with the kidneys generally showing the highest concentration. Iridium was not 4980 detectable by the multi-tracer technique in brain, skeletal muscle, bone, spleen, testes, or 4981 blood. On Day 3 the liver, kidneys, and intestines contained about 0.35%, 0.26%, and 0.13%, 4982 respectively, of the administered iridium. On Day 6 these three organs contained about 4983 0.11%, 0.13%, and 0.04%, respectively, of the administered iridium. Over the 6-day study 4984 about 90% of the administered iridium was excreted in faeces and 7.7% was excreted in 4985 urine, indicating that most of the absorbed iridium was excreted during the short study period. 4986

DRAFT REPORT FOR CONSULTATION: DO NOT REFERENCE
128
4987 Figure 8-1. Whole-body retention of 192Ir in laboratory animals following intravenous (iv) or 4988 intraperitoneal (ip) injection of Na2
192IrCl6 (curve fits reported by Furchner et al., 1971). Curve 1 = 4989 dogs, iv injection, observation period 304 d; 2 = monkeys, iv, 227 d; 3 = mice, iv, 352 d; 4 = rats, iv, 4990 280 d; 5 = mice, ip, 364 d; 6 = rats, ip, 371 d. 4991 4992
Table 8-3. Cumulative activities of iridium isotopes in the whole body based on retention curves derived by Furchner et al. (1971). Values for a given isotope are normalized to the value for that isotope in dogs. Isotope Half-life Dogsa Monkeysa Micea Ratsa Miceb Ratsb Ir-190 11.78 d 1.0 1.3 1.0 1.1 0.8 1.0 Ir-192 73.827 d 1.0 1.2 1.1 1.0 0.7 1.0 Ir-192n 241 y 1.0 0.8 1.7 0.8 0.6 1.2 Ir-194 19.28 h 1.0 1.1 1.0 1.0 1.0 1.1 Ir194m 171 d 1.0 1.1 1.2 1.0 0.7 1.1
a intravenous injection b intraperitoneal injection
4993 8.2.3.2. Biokinetic model for systemic iridium 4994 4995
(372) Biokinetic data for iridium summarized above indicate that whole-body retention is 4996 not predictable on the basis of body size and does not vary greatly from one species to 4997 another. Three phases of excretion of absorbed or intravenously injected iridium are 4998 indicated: a rapid phase of loss, primarily in urine, with a half-time of a few hours; an 4999 intermediate phase of loss with a half-time on the order of 1-2 wk; and a slow phase of loss 5000 with a half-time of several months. The fraction of uptake associate with each of these phases 5001 is variable and depends on the form of iridium reaching blood. For example, the fraction 5002 associated with the rapid phase of loss in urine has varied from <0.1 to 0.8 or more. The rate 5003 of loss from individual tissues roughly parallels that in the whole body. Concentrations of 5004 iridium in the kidneys and liver are much higher than those in most other tissues. Elevated 5005 uptake of iridium by the spleen is indicated by some data, but findings are inconsistent. Data 5006 on rats indicate that the liver contains roughly 15-20% of the systemic content during the first 5007 few months after input to blood. Most studies indicate that kidneys and bone accumulate less 5008
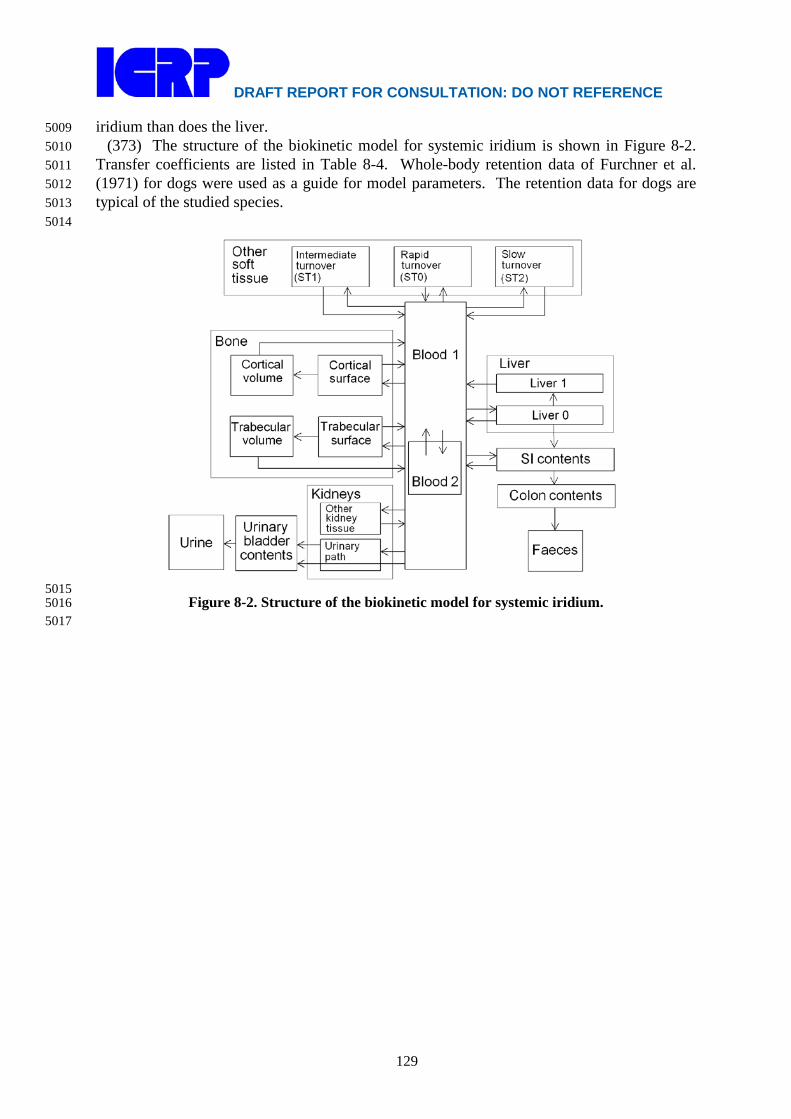
DRAFT REPORT FOR CONSULTATION: DO NOT REFERENCE
129
iridium than does the liver. 5009 (373) The structure of the biokinetic model for systemic iridium is shown in Figure 8-2. 5010
Transfer coefficients are listed in Table 8-4. Whole-body retention data of Furchner et al. 5011 (1971) for dogs were used as a guide for model parameters. The retention data for dogs are 5012 typical of the studied species. 5013 5014
5015 Figure 8-2. Structure of the biokinetic model for systemic iridium. 5016
5017

DRAFT REPORT FOR CONSULTATION: DO NOT REFERENCE
130
5018 Table 8-4. Transfer coefficients for systemic iridium
From To Transfer
coefficient (d-1) Blood 1 Small intestine contents 4.0 Blood 1 Urinary bladder contents 12 Blood 1 Liver 1 12 Blood 1 Urinary path 4.0 Blood 1 Other kidney tissue 2.0 Blood 1 Blood 2 27 Blood 1 ST0 15 Blood 1 ST1 15 Blood 1 ST2 1.0 Blood 1 Cortical bone surface 4.0 Blood 1 Trabecular bone surface 4.0 Blood 2 Blood 1 0.693 Liver 1 Blood 1 0.0231 Liver 1 Small intestine contents 0.0462 Liver 1 Liver 2 0.0693 Liver 2 Blood 1 0.00693 Urinary path Urinary bladder contents 0.139 Other kidney tissue Blood 1 0.00693 ST0 Blood 1 0.0693 ST1 Blood 1 0.00693 ST2 Blood 1 0.00095 Cortical bone surface Blood 1 0.0185 Trabecular bone surface Blood 1 0.0185 Cortical bone surface Cortical bone volume 0.00462 Trabecular bone surface Trabecular bone volume 0.00462 Cortical bone volume Blood 1 0.0000821 Trabecular bone volume Blood 1 0.000493
5019 (374) In the model for iridium, urinary excretion is assumed to arise from transfer of 5020
activity from blood into the urinary bladder contents and transfer from blood to the kidneys 5021 (Urinary path) and subsequent release to the urinary bladder contents over a period of days. 5022 Fecal excretion is assumed to arise in part from biliary secretion into Small intestine contents 5023 from a liver compartment (Liver 1) and in part from secretion from Blood 1 into Small 5024 intestine contents. The parameter values are set so that the two sources of faecal excretion 5025 contribute equally to endogenous faecal excretion of iridium, in the absence of specific data 5026 on relative contributions of these sources. Deposition fractions and removal half-times for 5027 compartments are set to reproduce different phases of loss of iridium from the total body 5028 observed in laboratory animals. 5029
(375) Clearance of iridium from blood is modeled on the basis of human data for the 5030 chemically related element ruthenium (Veronese et al., 2003, 2004). Blood is divided into two 5031 compartments called Blood 1 and Blood 2. Iridium entering blood is assigned to Blood 1, 5032 which is a rapid-turnover pool. Blood 2 is a more slowly exchanging pool that contains the 5033 preponderance of activity in blood except for a short period soon after acute uptake of 5034 iridium. Activity leaves Blood 1 at the rate 100 d-1, corresponding to a half-time of ~10 min, 5035 with 27% of outflow going to Blood 2 and the remaining 73% divided among tissue 5036
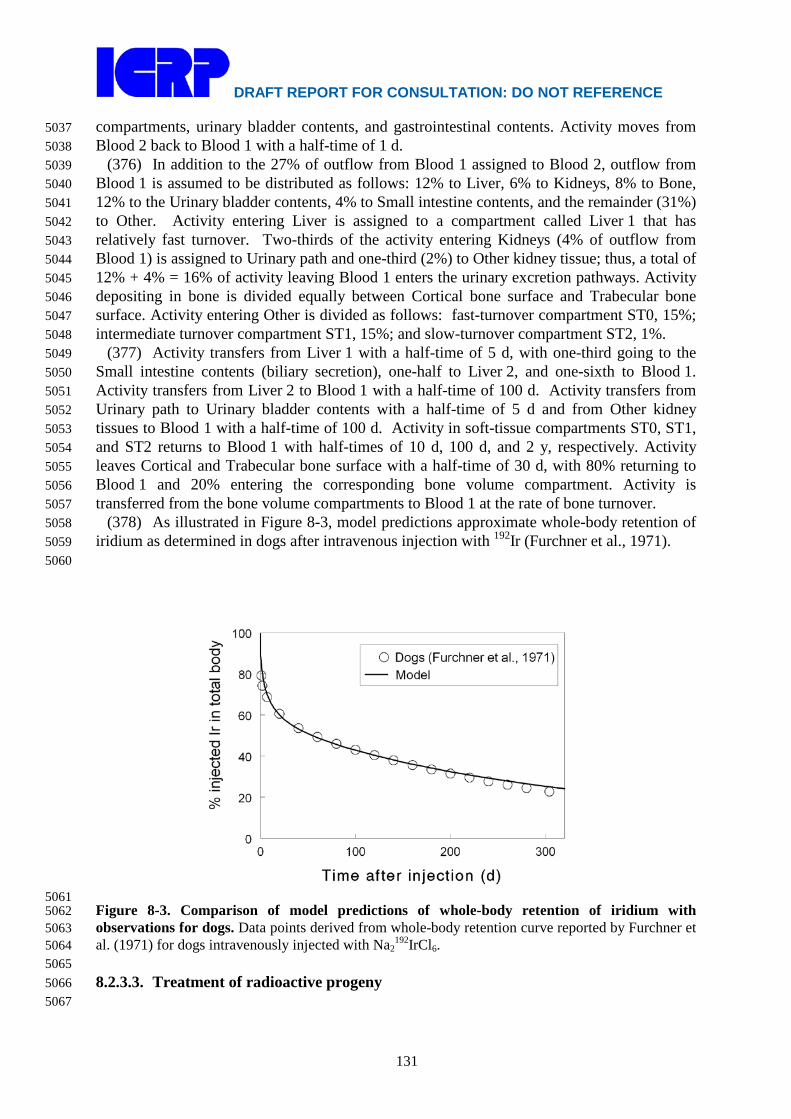
DRAFT REPORT FOR CONSULTATION: DO NOT REFERENCE
131
compartments, urinary bladder contents, and gastrointestinal contents. Activity moves from 5037 Blood 2 back to Blood 1 with a half-time of 1 d. 5038
(376) In addition to the 27% of outflow from Blood 1 assigned to Blood 2, outflow from 5039 Blood 1 is assumed to be distributed as follows: 12% to Liver, 6% to Kidneys, 8% to Bone, 5040 12% to the Urinary bladder contents, 4% to Small intestine contents, and the remainder (31%) 5041 to Other. Activity entering Liver is assigned to a compartment called Liver 1 that has 5042 relatively fast turnover. Two-thirds of the activity entering Kidneys (4% of outflow from 5043 Blood 1) is assigned to Urinary path and one-third (2%) to Other kidney tissue; thus, a total of 5044 12% + 4% = 16% of activity leaving Blood 1 enters the urinary excretion pathways. Activity 5045 depositing in bone is divided equally between Cortical bone surface and Trabecular bone 5046 surface. Activity entering Other is divided as follows: fast-turnover compartment ST0, 15%; 5047 intermediate turnover compartment ST1, 15%; and slow-turnover compartment ST2, 1%. 5048
(377) Activity transfers from Liver 1 with a half-time of 5 d, with one-third going to the 5049 Small intestine contents (biliary secretion), one-half to Liver 2, and one-sixth to Blood 1. 5050 Activity transfers from Liver 2 to Blood 1 with a half-time of 100 d. Activity transfers from 5051 Urinary path to Urinary bladder contents with a half-time of 5 d and from Other kidney 5052 tissues to Blood 1 with a half-time of 100 d. Activity in soft-tissue compartments ST0, ST1, 5053 and ST2 returns to Blood 1 with half-times of 10 d, 100 d, and 2 y, respectively. Activity 5054 leaves Cortical and Trabecular bone surface with a half-time of 30 d, with 80% returning to 5055 Blood 1 and 20% entering the corresponding bone volume compartment. Activity is 5056 transferred from the bone volume compartments to Blood 1 at the rate of bone turnover. 5057
(378) As illustrated in Figure 8-3, model predictions approximate whole-body retention of 5058 iridium as determined in dogs after intravenous injection with 192Ir (Furchner et al., 1971). 5059 5060
5061 Figure 8-3. Comparison of model predictions of whole-body retention of iridium with 5062 observations for dogs. Data points derived from whole-body retention curve reported by Furchner et 5063 al. (1971) for dogs intravenously injected with Na2
192IrCl6. 5064 5065 8.2.3.3. Treatment of radioactive progeny 5066 5067

DRAFT REPORT FOR CONSULTATION: DO NOT REFERENCE
132
(379) Chain members addressed in the derivation of dose coefficients for isotopes of 5068 iridium are isotopes of platinum, osmium, and rhenium. Independent kinetics of chain 5069 members is assumed. 5070
(380) Platinum and osmium are members of the platinum group, which also contains 5071 iridium, ruthenium, rhodium, and palladium. These six metals are chemically similar and 5072 generally are found together in ores. 5073
(381) The systemic biokinetics of ingested, inhaled, or injected platinum has been studied 5074 in laboratory animals, mainly rats, and to some extent in human subjects (Durbin et al., 1957; 5075 Durbin, 1960; Lange et al., 1973; Smith and Taylor, 1974; Litterst et al., 1976; Yoakum et al., 5076 1975; Moore et al., 1975a,b,c; Hirunuma et al., 1997). Platinum shows a high rate of urinary 5077 excretion in the early days after administration. Some but not all studies also indicate a 5078 relatively high rate of faecal excretion. Following intravenous administration of platinum 5079 isotopes as the chloride to rats, highest concentrations generally were found in the kidneys, 5080 followed by the liver (Durbin et al., 1957; Moore et al., 1975a,b,c). At 1 mo the rats 5081 contained roughly 10-15% of the intravenously injected activity. 5082
(382) Biokinetic studies of platinum in human subjects have focused on the behavior of the 5083 antitumor agent cis-diamminedichloroplatinum (II) (DDP) (Lange et al., 1973; Smith and 5084 Taylor, 1974). In these studies the biokinetics of the platinum label was similar to the 5085 behavior of other forms of platinum following their administration to laboratory animals. 5086 Following intravenous administration of 195mPt-labeled DDP to two cancer patients, 5087 approximately 35% of the injected activity was excreted in urine during the first 3.5 d (Smith 5088 and Taylor, 1974). At most a few percent of the activity was excreted in faeces during that 5089 time. Based on external measurements, the liver accumulated an estimated 10% of the 5090 injected activity during the first day. The biological removal half-times of activity from the 5091 liver and total body from days 1-7 were estimated as 8 d and 10 d, respectively. The study 5092 period was too short to determine any longer-term components of retention. 5093
(383) Biokinetic studies on rodents (Durbin et al., 1957; Durbin, 1960; Weininger et al., 5094 1990; Jamre et al., 2011) indicate that the systemic behavior of osmium is broadly similar to 5095 that of platinum and the other members of the platinum group. The systemic distribution of 5096 osmium at 1 d after intravenous injection closely resembled that of platinum (Durbin et al., 5097 1957; Durbin, 1960). Highest concentrations of intravenously injected osmium and generally 5098 occur in the kidneys and liver. Excretion of osmium is primarily in urine. Durbin and 5099 workers (Durbin et al., 1957; Durbin, 1960) found that the rate of excretion of osmium was 5100 initially higher than that of other members of the platinum group. This may reflect 5101 differences in the administered forms of these elements or experimental conditions; osmium 5102 was administered as NaHOsO5 or OsO4, while the other elements were administered as 5103 chloride compounds. Also, studies on mice indicate that the excretion rate of osmium 5104 depends on the pH of the injected solution, with longest retention observed at relatively low 5105 pH (Weininger et al., 1990). The total-body retention curves over the first four weeks 5106 following intravenous administration of osmium to mice at relatively low pH (4.5-5.1) were 5107 similar to the retention pattern observed by Moore et al. (1975a,b,c) for systemic platinum in 5108 rats. 5109
(384) In this report the same biokinetic model is applied to both osmium and platinum as 5110 progeny of systemic iridium. The model is a modification of the characteristic biokinetic 5111 model for ruthenium used in this report. The ruthenium model is modified by shifting a 5112 portion of the deposition in bone and soft tissue compartments ST1 and ST2 to the urinary 5113 bladder content and kidneys. Specifically, the ruthenium model is modified for application to 5114 osmium and platinum as iridium progeny by the following changes in transfer coefficients: 5115

DRAFT REPORT FOR CONSULTATION: DO NOT REFERENCE
133
Blood 1 to Cortical bone surface, reduced from 6 d-1 to 3 d-1; Blood 1 to Trabecular bone 5116 surface, reduced from 2 d-1 to 1 d-1; Blood 1 to ST1, reduced from 5 d-1 to 2.5 d-1; Blood 1 to 5117 ST2, reduced from 5 d-1 to 2.5 d-1; Blood 1 to Urinary bladder content, increased from 17 d-1 5118 to 23 d-1; Blood 1 to Kidneys 1 (urinary path), increased from 7.76 d-1 to 10.67 d-1; and 5119 Blood 1 to Kidneys 2 (other kidney tissue), increased from 0.24 d-1 to 0.33 d-1. These 5120 modifications leave the total outflow rate from the central blood compartment, Blood 1, 5121 unchanged at 100 d-1. 5122
(385) An osmium or platinum atom produced by radioactive decay in a systemic 5123 compartment is assigned the model for these elements described above from its time of 5124 production. This is straightforward for osmium and platinum atoms because their preceding 5125 chain members are also members of the platinum group, and all members of this group have 5126 the same model structure. Each compartment in the model for osmium and platinum is 5127 identified with the iridium compartment with the same name. 5128
(386) Rhenium is a member of Group VIIA of the period table and exhibits chemical and 5129 biokinetic properties remarkably close to those of the adjacent Group VIIA element 5130 technetium (Durbin et al., 1957; Deutsch et al., 1986; Yanaga et al., 1996, Dadachova et al., 5131 2002; Zuckier et al., 2004). Rhenium and technetium presumably become covalently bound 5132 with oxide ions to form the structurally similar anions perrhenate (ReO4
-) and pertechnetate 5133 (TcO4
-) in the body and in many environment settings. These two anions have important 5134 medical applications as close physiological analogues of iodide, with the important exception 5135 that there is little if any organic binding of perrhenate or pertechnetate in the thyroid. The 5136 systemic biokinetic model applied in this report to technetium as a member of ruthenium 5137 chains (see the section on ruthenium) is also applied to rhenium as a member of iridium 5138 chains. 5139 5140 8.3. Individual monitoring 5141 5142
(387) 192 Ir may be detected in urine or Whole Body counting. 5143 5144
Isotope Monitoring Technique
Method of Measurement
Typical Detection Limit
Achievable detection limit
192Ir Urine Bioassay γ-ray spectrometry 0.5Bq/L 192Ir Whole Body
Counting γ-ray spectrometry 97Bq
192Ir Lung Monitoring γ-ray spectrometry 6 Bq* ∗ Lung monitoring of 192Ir is not generally used in routine monitoring of workers. Monte Carlo program 5145
Visual Monte Carlo was used to simulate the photon emission, to calculate the calibration factor for the 5146 geometry and radionuclide, and to calculate the minimum detectable activity (MDA) in the lung. (Hunt et 5147 al, 2012) 5148
5149 References 5150
5151 Ando, A., Ando, I., Hiraki, T., Hisada, K. 1989. Relation between the location of elements in the 5152
periodic table and various organ-uptake rates. Nucl. Med. Biol. 16: 57-69. 5153 Brodsky, A., Wald, N., 2004. Experiences with early emergency response and rules of thumb. In: 5154
Brodsky, A.; Johnson, R.H., Jr., Goans, R.E., (Eds.), Public protection from nuclear, 5155 chemical, and biological terrorism. Health Physics Society 2004 Summer School. Madison, 5156 Wisconsin: Medical Physics Publishing; 2004, Chapter 20, pp. 335-371. 5157
DRAFT REPORT FOR CONSULTATION: DO NOT REFERENCE
134
Casarett, L.J., Bless, S., Katz, R., Scott, J.K., 1960. Retention and fate of iridium-192 in rats 5158 following inhalation. J. Amer. Ind. Hyg. Assoc. 21, 414-418. 5159
Cool, D.A., Cool, W.S., Brodsky, A., Eadie, G.G., 1979. Estimation of long-term biological 5160 elimination of insoluble iridium-192 from the human lung. Health Phys. 36, 629–632. 5161
Dadachova, E.; Bouzahzah, B.; Zuckier, L. S.; Pestell, R. G. 2002. Rhenium-188 as an alternative to 5162 iodine-131 for treatment of breast tumors expressing the sodium/iodide symporter (NIS). 5163 Nucl. Med. Biol. 29:13-18. 5164
Deutsch, E.; Libson, K.; Vanderheyden, J. L.; Ketring, A. R.; Maxon, H. R. 1986. The chemistry of 5165 rhenium and technetium as related to the use of isotopes of these elements in therapeutic 5166 and diagnostic nuclear medicine. Int. J. Rad. Appl. Instrum. B 13:465-477. 5167
Durbin, P.W., 1960. Metabolic characteristics within a chemical family. Health Phys. 2, 225-238. 5168 Durbin, P.W., Scott, K.G., Hamilton, J.G., 1957. Distribution of radioisotopes of some heavy metals 5169
in the rat. University of California (Berkely) Publ. Pharmocol. 3, 1-34. 5170 Furchner, J.E., Richmond, C.R., Drake, G.A., 1971. Comparative metabolism of radionuclides in 5171
mammals-V. Retention of 192Ir in the mouse, rat, monkey and dog. Health Phys. 20, 375-5172 382. 5173
Hirunuma, R., Endo, K., Yanaga, M., Enomoto, S., Ambe, S., Tanaka, A., Tozawa, M., Ambe, F., 5174 1997) The use of a multitracer technique for the studies of the uptake and retention of trace 5175 elements in rats. Appl. Radiat. Isot. 48, 727-733. 5176
IAEA, 1999. Intercomparison and biokinetic model validation of radionuclide intake assessment. 5177 Case 6: Single intake of 192Ir. IAEA-TECDOC-1071 pp. 48-49. 5178
ICRP, 1979. Limits on Intakes of Radionuclides for Workers. ICRP Publication 30, Part 2. Pergamon 5179 Press, Oxford. Ann. ICRP 4 (3/4). 5180
ICRP, 1994. Dose Coefficients for Intakes of Radionuclides by Workers. ICRP Publication 68. Ann. 5181 ICRP 24(4). 5182
Jamre, M.; Salek, N.; Jalilian, A. R.; Moghaddam, L.; Shamsaee, M.; Mazidi, M.; Ghannadi-5183 Maragheh, M. 2011. Development of an in vivo radionuclide generator by labeling 5184 bleomycin with 191Os. J. Radioanal. Nucl. Chem. 290:543-549. 5185
Kelsey, C.A., Mettler, Jr., F.A., 2001. Iridium-192 acid skin burn in Alburquerque, New Mexico, 5186 U.S.A. Chapter 29. In: Gusev, I.A., Guskova, A.K., Mettler, Jr., F.A., (Eds.), Medical 5187 management of radiation accidents, 2nd edition; New York: CRC Press, pp. 421-423. 5188
Kreyling, W.G., 2010. Personal communication. 5189 Kreyling, W.G., Semmler, M., Erbe, F., Mayer, P., Takanaka, S., Schulz, H., Oberdörster, G. and 5190
Ziesenis, A., 2002. Translocation of ultrafine insoluble iridium particles from lung 5191 epithelium to extrapulmonary organs is size dependent but very low. Journal of Toxicology 5192 and Environmental Health, Part A, 65 (20), 1513–1530. 5193
Kreyling, W.G., Semmler-Behnke, M., Seitz, J., Scymczak, W., Wenk, A., Mayer, P., Takenaka, S., 5194 Oberdörster, G., 2009. Size dependence of the translocation of inhaled iridium and carbon 5195 nanoparticles aggregates from the lungs of rats to the blood and secondary target organs. 5196 Inhalation Toxicology, 21 (S1), 55–60. 5197
Lange, R. C.; Spencer, R. P.; Harder, H. C. 1973. The anti-tumor agent cis-Pt(NH3)2Cl2: Distribution 5198 studies and dose calculations for 193mPt and 195mPt. J. Nucl. Med. 14:191-195. 5199
Litterst, C. L.; Gram, T. E.; Dedrick, R. L.; Leroy, A. F.; Guarino, A. M. 1976. Distribution and 5200 disposition of platinum following intravenous administration of cis-5201 diamminedichloroplatinum (II) (NSC119875) to dogs. Cancer Res. 36:2340-2355. 5202
Moore, W.; Hysell, D.; Crocker, W.; Stara, J. 1975a. Whole body retention in rats of different 191Pt 5203 compounds following inhalation exposure. Environ. Health Persp. 12:35-39. 5204
Moore, W.; Hysell, D.; Hall, L.; Campbell, K.; Stara, J. 1975b. Preliminary studies on the toxicity 5205 and metabolism of palladium and platinum. Environ. Health Persp. 10:63-71. 5206
Moore, W.; Malanchuk, M.; Crocker, W.; Hysell, D.; Cohen, A.; Stara, J. F. 1975c. Biological fate of 5207 a single administration of 191Pt in rats following different routes of exposure. Environ Res. 5208 9:152-158. 5209

DRAFT REPORT FOR CONSULTATION: DO NOT REFERENCE
135
Semmler, M., Seitz, J., Erbe, F., Mayer, P., Heyder, J., Oberdörster, G. and Kreyling, W.G., 2004. 5210 Long-term clearance kinetics of inhaled ultrafine insoluble iridium particles from the rat 5211 lung, including transient translocation into secondary organs. Inhal. Tox., 16, 453 – 459 5212
Smith, P. H. S.; Taylor, D. M. 1974. Distribution and retention of the antitumor agent 195mPt-cis-5213 dichlorodiammine platinum (II) in man. J. Nucl. Med. 15:349-351. 5214
Szymczak, W., Menzel, N., Kreyling, W.G., Wittmaack, K., 2006. TOF-SIMS characterisation of 5215 spark-generated nanoparticles made from pairs of Ir–Ir and Ir–C electrodes. International 5216 Journal of Mass Spectrometry 254, 70–84. 5217
Veronese, I., Cantone, M.C., Giussani, A., Maggioni, T., Birattari, C., Bonardi, M., Groppi, F., 5218 Garlaschelli, L., Werner, E., Roth, P., Höllriegl, V., Louvat, P., Felgenhauer, N., Zilker, Th., 5219 2003. Stable tracer investigations in humans for assessing the biokinetics of ruthenium and 5220 zirconium radionuclides. Rad. Prot. Dosim. 105, 209–212. 5221
Veronese, I., Giussani, A., Cantone, M.C., Birattari, C., Bonardi, M., Groppi, F., Höllriegl, V., Roth, 5222 P., Werner, E., 2004. Influence of the chemical form on the plasma clearance of ruthenium 5223 in humans. Appl. Radiat. Isot. 60, 7-13. 5224
Weininger, J.; Issachar, D.; Lubin, E.; Zabari, M.; Trumper, J. 1990. Influence of PH adjustment 5225 agents on the biologic behavior of osmium-191 impurity in iridium-191m generator eluates. 5226 J. Nucl. Med. 31:523-525. 5227
Yanaga, M.; Enomoto, S.; Hirunuma, R.; Iuruta, R.; Endo, K.; Tanaka, A.; Ambe, S.; Tozawa, M.; 5228 Ambe, F. (1996). Multitracer study on uptake and excretion of trace elements in rats. Appl. 5229 Radiat. Isot. 47:235-246. 5230
Yoakum, A. M.; Steward, P. L.; Sterrett, J. E. 1975. Method development and subsequent analysis of 5231 biological tissues for platinum, lead and manganese content. Environ. Health Persp. 10:85-5232 93. 5233
Zuckier, L. S.; Dohan, O.; Li, Y.; Chang, C. J.; Carrasco, N. ; Dadachova, E. 2004. Kinetics of 5234 perrhenate uptake and comparative biodistribution of perrhenate, pertechnetate, and iodide 5235 by NaI symporter-expressing tissues in vivo. J. Nucl. Med. 45:500-507. 5236
5237 5238
DRAFT REPORT FOR CONSULTATION: DO NOT REFERENCE
136
5239 9. Lead (Z = 82) 5240
5241 9.1. Chemical Forms in the Workplace 5242 5243
(388) Lead is a soft metal which mainly occurs in oxidation states II and IV. Lead may be 5244 encountered in industry in a variety of chemical and physical forms, including oxides (PbO, 5245 PbO2, Pb2O3, Pb3O4), chlorides, sulphides, fluorides, nitrates, and also as organic vapour 5246 compounds (tetra-ethyl, tetra-methyl). Lead may also be present in uranium mines and mills. 5247 Molten lead is used as a coolant in lead cooled fast reactors. 5248
(389) 210Pb originates from the decay of 238U and 234Th, and 212Pb from the decay of 232Th. 5249 5250
Table 9-1. Isotopes of lead addressed in this report 5251 5252
Isotope Physical half-life Decay mode Pb-194 12 m EC, B+, A Pb-195m 15 m EC, B+ Pb-196 37 m EC,B+ Pb-197m 43 m EC, B+, IT Pb-198 2.4 h EC Pb-199 90 m EC, B+ Pb-200 21.5 h EC Pb-201 9.33 h EC, B+ Pb-202 5.25E+4 y EC, A Pb-202m 3.53 h IT, EC Pb-203 51.873 h EC Pb-204m 67.2 m IT Pb-205 1.53E+7 y EC Pb-209 3.253 h B- Pb-210a 22.20 y B-, A Pb-211 36.1 m B- Pb-212a 10.64 h B- Pb-214a 26.8 m B- a Data for these radionuclides are given in the printed copy of this report. Data for other radionuclides are 5253
given on accompanying electronic disk. 5254 5255 9.2. Routes of Intake 5256 5257 9.2.1. Inhalation 5258 5259 Absorption Types and parameter values 5260
(390) Information is available from experimental studies of the behaviour of lead inhaled 5261 in a variety of forms by both animals and man. In particular, studies have been conducted to 5262 improve assessment of risks from exposure to radioisotopes of lead inhaled as decay products 5263 of radon, and from exposure to stable lead as an atmospheric pollutant, e.g. from petrol 5264 engine exhaust. 5265
(391) Absorption parameter values and Types, and associated fA values for particulate 5266 forms of lead are given in Table 9-2. Parameter values are not given for the gas and vapour 5267 forms considered here because occupational exposure to radioisotopes in such forms is 5268

DRAFT REPORT FOR CONSULTATION: DO NOT REFERENCE
137
unlikely. Exposures to gas and vapour forms of lead are relatively unusual compared to 5269 exposures to particulate forms, and therefore it is proposed here that particulate form is 5270 assumed in the absence of information (ICRP, 2002b). However, for radiation protection 5271 purposes, the most important exposures to radioisotopes of lead are as decay products of 5272 radon. Specific consideration is given here to studies of the absorption of lead administered in 5273 that form, and to studies using other ionic forms (e.g. nitrate) that were designed to 5274 investigate the absorption of radon decay products from the respiratory tract. Dose 5275 coefficients for isotopes of lead inhaled as radon decay products are given in the radon 5276 section, where factors such as the relevant aerosol size distribution are addressed. Otherwise, 5277 exposures to radioisotopes of lead occur most often as decay products associated with intakes 5278 of uranium, thorium or radium. 5279 5280 (a) Gases and vapours 5281 5282 Tetra ethyl lead (TEL) 5283
(392) Heard et al. (1979) followed the biokinetics of 203Pb for about a week after 5284 inhalation of 203Pb-labelled tetra-methyl lead (TEL) vapour by four healthy male volunteers. 5285 Initial deposition averaged 37% of the inhaled vapour. There was rapid uptake of 203Pb from 5286 the lungs, with the first blood samples taken 3 minutes after intake indicating ~10% of the 5287 deposit in the cells and ~30% in the plasma; and hence an absorption rate greater than 100 d–5288 1. The systemic behaviour was different from that of inorganic lead. Loss from blood was 5289 much faster: concentrations in both fractions fell by two orders of magnitude in the first 10 5290 hours. At 1 hour >50% of 203Pb deposited from inhalation was present in the liver, remaining 5291 fairly constant during the remaining 6 days of observation. About 20% of the 203Pb-TEL 5292 deposited was lost by exhalation within 48 hours. These results indicate about 40% deposition 5293 in the respiratory tract with Type F absorption for TEL. 5294 5295 Tetra methyl lead (TML) 5296
(393) Three of the subjects in the study of TEL above inhaled 203Pb-labelled tetra-methyl 5297 lead (TML) in separate studies (Heard et al., 1979). Initial deposition averaged 51% of the 5298 inhaled vapour. The behaviour of 203Pb inhaled as TML was similar to that for TEL, with 5299 rapid uptake of 203Pb from the lungs, except that initially more 203Pb was in the cells than in 5300 the plasma. About 40% of the 203Pb-TEL deposited was lost by exhalation within 48 hours. 5301 These results indicate about 50% deposition in the respiratory tract with Type F absorption 5302 for TEL. 5303
(394) However, although specific parameter values for TEL and TML based on in vivo 5304 data could be assessed, they are not adopted here, because inhalation exposure to it is so 5305 unlikely. Furthermore the systemic behaviour of lead inhaled in these forms differs from that 5306 of the model adopted here. The information is, however, useful for comparison with the 5307 behaviour of lead inhaled in ionic form, which is absorbed from the lungs much more slowly 5308 than lead inhaled in these organic forms. 5309 5310 (b) Lead as a decay product of radon 5311
(395) In this section studies are considered in which 212Pb (half-life 11 hours) formed from 5312 decay of 220Rn (half-life 56 seconds) and 216Po (half-life 0.15 seconds), or 214Pb (half-life 27 5313 minutes) formed from decay of 222Rn (half-life 3.8 days), and 218Po (half-life 3.1 minutes) 5314 was inhaled directly, while still airborne. For decay schemes, see the thorium and uranium 5315 sections. Studies in which lead ions were inhaled as nitrate or chloride, or in which lead ions 5316

DRAFT REPORT FOR CONSULTATION: DO NOT REFERENCE
138
(either formed from decay of 220Rn and 216Po, or as nitrate) were administered to the 5317 respiratory tract in a liquid medium, which are also relevant to lead as a decay product of 5318 radon, are considered below in the section on particulate forms. 5319 5320 Lead as an unattached decay product of radon 5321
(396) Booker et al. (1969) followed lung retention, blood concentration and fecal excretion 5322 of 212Pb for up to 3 d after inhalation (by mouth) of unattached 212Pb (vapour, formed from 5323 decay of 220Rn/216Po) by one volunteer. In a complementary experiment, the amount of 212Pb 5324 in blood was measured at times up to 2 d after intravenous injection of 212Pb into the same 5325 volunteer. Of the initial deposit in the respiratory tract, 37% was recovered in faeces during 5326 the first 3 d, which the authors attributed to high deposition in the upper airways. Overall, 5327 clearance from the chest occurred with a half-time of about 10 hours. 5328
(397) Detailed analyses, of this and other studies, were carried out here (i.e. by the Task 5329 Groups), to estimate absorption parameter values appropriate for short-lived radon progeny. 5330 The studies by James et al. (1977) and Greenhalgh et al. (1979, 1982) outlined below, which 5331 were designed to investigate the early clearance of lead ions deposited in the lungs, showed a 5332 rapid phase: about 10–40% absorbed with a half-time of about 15 minutes, and evidence that 5333 some of the slow phase was due to binding. Specific consideration was therefore given here 5334 to the rapid absorption phase and the bound state. For this experiment, absorption parameter 5335 values were assessed from the lung, blood and fecal data published by Booker et al. (1969) 5336 using a subject-specific systemic model, and assuming an absorption model with a rapid 5337 dissolution rate (sr) of 67 d–1 (half-time 15 minutes) and slow dissolution (ss) and uptake (sb) 5338 rates of 1.7 d–1 (10-hour half-time). Other parameter values were assessed to be fr = 0.36 and 5339 fb = 0.82, which gives rapid absorption of about 6% of the initial deposit [fr*(1–fb)]. Activity 5340 deposited in the upper respiratory tract retained in particulate form would mainly clear by 5341 mucociliary action to faeces, whereas activity retained in the bound state would not. This 5342 potentially enables a distinction to be made between the two pathways (provided sr, and hence 5343 transfer to the bound state, is fast compared to particle transport). The faecal measurement 5344 was lower than the predicted value, even with the high bound fraction estimated, and suggests 5345 that sr is > 67 d–1. However, because the result was only for one volunteer and because of 5346 measurement uncertainties, it was judged here that it did not provide a better basis for 5347 estimating sr than the information on which the value of 67 d–1 was based. 5348
(398) Butterweck et al. (2001, 2002) carried out volunteer experiments to determine the 5349 absorption rate of unattached radon progeny. Twenty-one volunteers were exposed in a radon 5350 chamber with well-controlled aerosol and radon progeny conditions. The aerosol was 5351 predominantly unattached radon progeny. Eleven volunteers inhaled by mouth and seven by 5352 nose. Measurements were made of radon gas and progeny (214Pb and 214Bi) in blood samples 5353 taken at the end of a 30-minute exposure (Butterweck et al., 2002). In vivo measurements of 5354 the head and chest were carried out over a 30-minute period, starting approximately 7 minutes 5355 after exposure (Butterweck et al,. 2001). No clearance from the head (other than physical 5356 decay) was observed over this period, indicating that small fractions of the unattached 214Pb 5357 and 214Bi were absorbed rapidly to blood (sr >> 100 d–1), as measured by the blood sample, 5358 while the rest (fraction fb) was bound to tissues (or stationary mucus). Assuming a rapid 5359 dissolution rate (sr) of 1000 d–1 with fr = 1.0 and an uptake rate from the bound state (sb) of 5360 1.7 d–1, Butterweck et al. (2002) estimated that fb was in the range 0.7–0.85 for radon progeny 5361 (without distinguishing between 214Pb and 214Bi). In this study the fraction of the initial 5362 deposit that was rapidly absorbed [fr*(1–fb)] was in the range 0.15–0.3, which is more than 5363 observed in the study by Booker et al. (1969) (see above). These data were re-evaluated here 5364

DRAFT REPORT FOR CONSULTATION: DO NOT REFERENCE
139
using a systemic model based on the ICRP Publication 67 model for lead (ICRP, 1993) but 5365 modified to take account of the early rapid exchange between plasma and extravascular fluid. 5366 Assuming sr = 1000 d-1 with fr=1 they estimated fb was ~0.7 for lead. The longer-duration 5367 measurements made by Booker et al. (1969) are consistent with assignment to Type F. 5368
(399) Bianco et al. (1974) followed chest retention and blood concentration of 212Pb for up 5369 to 2 d after inhalation by dogs (via endotracheal tube) of unattached 212Pb (formed from decay 5370 of 220Rn/216Po, effective diffusion diameter of about 11 nm). Fitting a single exponential 5371 function to the chest data (after correction for 212Pb in blood) gave an average biological half-5372 time for lung clearance of about 12 hours with values in the range 7 – 20 hours. The 5373 corresponding absorption half-time would be greater, because no correction was made for 5374 mucociliary clearance. However, some would have occurred before the first chest 5375 measurement took place, and similarly there could have been some rapid absorption that was 5376 not observed. There is insufficient information in the paper for more detailed analysis. 5377 5378 Lead as a radon decay product attached to ambient aerosols 5379
(400) Booker et al. (1969) followed blood concentration, urinary and fecal excretion of 5380 212Pb in two volunteers for up to 3 d after inhalation (by mouth) of an aerosol formed by 5381 mixing 212Pb (formed from decay of 220Rn/216Po) with particles (condensation nuclei, mainly 5382 0.05–5 µm diameter). In complementary experiments, the amount of 212Pb in blood was 5383 measured at times up to 2 d after intravenous injection of 212Pb into the same volunteers. Of 5384 the initial respiratory tract deposit (IRTD), only 2–3% was recovered in faeces during the first 5385 3 d, which the authors attributed to low deposition in the upper airways. Overall clearance 5386 from the chest was deduced from the blood measurements to occur with a half-time of about 5387 10 hours. The authors noted that this was similar to that observed following inhalation of 5388 unattached 212Pb (see above), even though it was expected that for 212Pb attached to particles 5389 there was relatively greater deposition in the lower than in the upper respiratory tract, and 5390 suggesting similar rates of absorption to blood in both cases. 5391
(401) Hursh et al. (1969) followed lung retention, blood concentration, urinary and fecal 5392 excretion of 212Pb in ten volunteers for up to 3 d after inhalation (by mouth) of an aerosol 5393 formed by mixing 212Pb (formed from decay of 220Rn/216Po) with natural room aerosol. On 5394 average about 3% IRTD was excreted in urine in the first 24 hours, and total fecal excretion 5395 (in 24 – 76 hours) was about 3% IRTD. The authors estimated that on average clearance of 5396 212Pb from lungs to systemic tissues occurred with a half time of 6.5 hours, although they 5397 inferred (from detailed measurements of urinary excretion) that some lead was absorbed 5398 promptly from the lungs. They noted that 212Pb in blood and systemic tissues made a 5399 significant contribution to uncertainty in the lung measurements, but complementary 5400 intravenous injection experiments, which would have enabled direct correction to be made, 5401 were not carried out. 5402
(402) Hursh and Mercer (1970) followed lung retention, blood concentration, and urinary 5403 and fecal excretion of 212Pb in four volunteers for up to 3 d after inhalation (by mouth) of an 5404 aerosol formed by mixing 212Pb (formed from decay of 220Rn/216Po) with natural room 5405 aerosol. In complementary experiments, the amount of 212Pb in blood was measured at times 5406 up to 2 d after intravenous injection of 212Pb into the same volunteers. On average about 2% 5407 IRTD was excreted in urine in the first 24 hours and total fecal excretion (in 34 – 50 hours) 5408 was 0.35% IRTD: the authors inferred that the latter suggested low deposition in ciliated 5409 airways. They noted that in two subjects the blood lead appeared to increase more rapidly 5410 than for the other two, and that this suggested that 212Pb inhaled as freshly generated 212Pb of 5411 very small diameter may be more readily absorbed from the lung parenchyma to blood than 5412
DRAFT REPORT FOR CONSULTATION: DO NOT REFERENCE
140
an aged aerosol associated with larger diameter particles. However, the authors noted that 5413 “the determination is not sufficiently precise to establish this relationship.” They estimated 5414 that, on average, clearance of 212Pb from lungs to systemic tissues occurred with a half time of 5415 10.5 to 11.5 hours, after correcting for activity outside the lungs. 5416
(403) Singh et al. (1986) reported that concentrations of 210Pb (half-life 22 years) in the 5417 lungs of uranium miners obtained at autopsy were several times higher than concentrations of 5418 238U, 234U or 230Th. This indicated that there were sources of intake of 210Pb in addition to 5419 uranium ore dust. The authors suggested several possibilities, one of which was inhalation of 5420 210Pb present in the mine air but not associated with ore dust. If this originated from radon in 5421 the mine air it suggests that it was retained in the lungs in a relatively insoluble (Type M or S) 5422 form. 5423
(404) Marsh and Birchall (1999) re-evaluated the published data from experiments in 5424 which volunteers inhaled 212Pb attached to condensation nuclei or to ‘natural’ particles in 5425 room air (Booker et al., 1969; Hursh et al., 1969; Hursh and Mercer, 1970) to estimate an 5426 absorption half-time for lead, assuming a single component. The best estimate obtained was 5427 10 hours with a 95% confidence interval of ±2 hours, which gave an absorption rate of about 5428 1.7 d–1. A more detailed analysis of these and other studies was carried out here to estimate 5429 absorption parameter values appropriate for short-lived radon progeny, giving specific 5430 consideration to the rapid absorption phase (see paragraph above on lead as an unattached 5431 decay product of radon). The published data from experiments in which volunteers inhaled 5432 212Pb attached to condensation nuclei were re-evaluated with a two-component model. 5433 Assuming sr = 67 d-1 (half-time 15 min) values of fr and ss of 0.06 and 1.4 d-1 (half-time 12 h) 5434 respectively were estimated. However, the information did not permit assessment of fb as for 5435 unattached 212Pb (see above), because there was low deposition in the upper respiratory tract 5436 (and for Booker et al., 1969, no direct measurements of activity in the lungs). 5437
(405) Based on these studies and those below on ionic lead, lead nitrate and lead oxide, 5438 bound state parameter values for lead of fb = 0.5 and sb = 1.7 d–1 were chosen here (see 5439 below). For the studies of radon as a decay product above, and ionic lead below, specific 5440 parameter values were estimated of about fr = 0.3, sr = 100 d–1, ss = 1.7 d–1, fb = 0.8 and 5441 sb = 1.7 d–1, i.e. a somewhat higher value of fb. Note that (neglecting particle transport) the 5442 fraction of the initial deposit in the respiratory that is absorbed into blood in the rapid phase is 5443 given by fr*(1 – fb), thus these parameter values are consistent with rapid absorption of 0.3*(1 5444 – 0.8) = 0.06. A similar fractional rapid absorption would be obtained with fb = 0.5 and fr = 5445 0.12. Absorption parameter values: fr = 0.1, sr = 100 d–1, ss = 1.7 d–1, fb = 0.5 and sb = 1.7 d–1 5446 (consistent with assignment to default Type F) are used here for lead as a short-lived decay 5447 product of radon. 5448 5449 (c) Particulate aerosols 5450 5451 Ionic lead 5452
(406) Greenhalgh et al. (1978, 1979) investigated the absorption of lead ions (203Pb or 5453 214Pb) instilled into the bronchi of rabbits or rats in different media. In rabbits, the average 5454 amounts in blood at 20 and 42 minutes after instillation (estimated at about 4% and 7% 5455 respectively of the amount instilled) were similar, whether instilled in lead nitrate solution or 5456 in fresh rat mucus (both isotopes), or in isotonic saline (203Pb). The authors inferred that 5457 about 10% of instilled lead was absorbed in a rapid phase with a half-time of about 10 5458 minutes. In rats, systemic absorption of 203Pb at 30 minutes after instillation in water, 5459 isotonic saline or hypertonic saline was similar, averaging 42% of the amount instilled, but 5460
DRAFT REPORT FOR CONSULTATION: DO NOT REFERENCE
141
higher than in rabbits (~13%). It was somewhat higher when instilled as nitrate (53%), and in 5461 0.1N HCl (61%). 5462
(407) Greenhalgh et al. (1982) investigated the rapid clearance phase of radon decay 5463 products by comparing the biokinetics of ionic 212Pb with those of insoluble radiolabelled 5464 particles (88Y-labelled fused aluminosilicate, FAP) instilled together onto the nasal mucosa of 5465 rats. The 88Y-FAP acted as a tracer for deposition and mucociliary clearance. The suspension 5466 was prepared by collecting 216Po ions from the decay of 220Rn in a chamber onto an electrode, 5467 and transferring the 212Pb formed to distilled water: a suspension of the 88Y-FAP in water was 5468 allowed to dry out, and the 212Pb solution was added to the container. Activity retained in the 5469 head, and blood concentration, were followed for 100 minutes. By the end of the experiment 5470 about 8% of the 212Pb had been absorbed (rate about 66 d–1). (Thus rapid absorption of the 5471 initial deposit [fr*(1–fb)] was about 8%.) Nevertheless, the fraction of the initial deposit 5472 remaining in the nose was greater for 212Pb (~40%) than for the particles (~30%). The authors 5473 concluded that some of the 212Pb was retained by binding either to static mucus or epithelial 5474 tissue, and developed a two phase (sol and gel) model of mucociliary clearance to explain the 5475 results. Analysis carried out here, assuming slow dissolution (ss) and uptake (sb) rates of 1.7 5476 d–1 (10-hour half-time, see paragraph above on lead as an unattached decay product of radon) 5477 gave absorption parameter values of fr = 0.35, sr = 60 d–1 (half-time 17 minutes), and fb = 0.7. 5478 5479 Lead nitrate (Pb(NO3)2) 5480
(408) James et al. (1977) followed the biokinetics of 212Pb for up to 100 minutes after 5481 instillation of 212Pb-nitrate into the trachea or bronchioles of rabbits. (The solution was 5482 prepared by collecting 216Po ions from the decay of 220Rn in a chamber onto an electrode, and 5483 transferring the 212Pb formed to distilled water containing stable lead nitrate carrier.) From 5484 both sites approximately 20% of deposited 212Pb was absorbed to blood with a half-time of 5485 about 4 minutes (250 d–1), and the remainder with a half-time estimated at about 9 h (1.8 d–1). 5486 Insoluble radiolabelled particles were instilled simultaneously into the bronchioles of one 5487 rabbit to act as a tracer for mucus. It was found that despite absorption to blood, the 212Pb 5488 cleared more slowly than the particles, and it was inferred that this indicated slow diffusion of 5489 212Pb through the epithelium (i.e. that some binding occurs). It was reported that by the end 5490 of the experiment (2 hours after instillation) more of the 212Pb remaining in the lungs was 5491 associated with mucus than with epithelium. 5492
(409) Chamberlain et al. (1978) administered to four volunteers an aerosol of 203Pb-5493 labelled nitrate (AMAD in the range 0.4–0.8 µm), formed by adding nitrogen to the flame 5494 produced by burning 203Pb-labelled tetra-ethyl lead in propane. Measurements of 203Pb in the 5495 chest, blood and excreta were made for about 4 days. Complementary measurements were 5496 also made of 203Pb in the legs, to correct lung measurements for systemic 203Pb, based on the 5497 results of similar measurements made after intravenous injection of 203Pb. Lung retention was 5498 represented by a three-component exponential function with half-times of 1.0 hours (26%); 5499 2.2 hours (33%); and 10 hours (41%) (rates of 17, 7.6 and 1.7 d–1 respectively). Clearance 5500 was almost entirely by systemic uptake: only a small percentage of the initial lung deposit 5501 (ILD) was cleared by mucociliary action and swallowed. Chamberlain et al. (1978) noted that 5502 lead nitrate was far more soluble in vitro than indicated by the lung measurements, and 5503 suggested that the mechanism for transferring lead from lung fluid to blood is a relatively 5504 slow process, which determines the overall transfer rate. 5505
(410) Ballou et al. (1986) measured lung retention and tissue distribution of 232U, 228Th, 5506 224Ra, 212Pb, 212Bi and 208Tl at 24 hours after intratracheal instillation into rats of 232U nitrate 5507 with its decay products. (For further information, see the uranium inhalation section.) For 5508
DRAFT REPORT FOR CONSULTATION: DO NOT REFERENCE
142
212Pb, on average 2.1% ILD was measured in the lungs at 1 day. Correcting for the physical 5509 decay of 212Pb gives retention of 10% ILD at 1 day. 5510
(411) Moody et al. (1994b); Moody and Stradling, 1992) measured the tissue distribution 5511 of 228Th, 212Pb, 212Bi and 208Tl, at times from 6 hours to 7 days after intratracheal instillation 5512 into rats of a nitrate solution of 228Th in equilibrium with its decay products. (Radon-220 is a 5513 precursor of 212Pb, but it is unlikely that a significant amount was lost from solution before 5514 deposition in the lungs, because of its short half life of 56 seconds. Its average half distance of 5515 diffusion in water was estimated to be 50 µm by Ballou and Hursh, 1972.) For 212Pb, on 5516 average 8.4% of the initial lung deposit (ILD) was measured in the lungs at 6 hours and 1.2% 5517 ILD at 1 day: clearance was much faster than that of the parent 228Th. Correcting for the 5518 physical decay of 212Pb gives retention of 12.5% ILD at 6 hours and 5.6% ILD at 1 day. From 5519 these results it was assessed here, assuming either (i) that the retained lead was in particulate 5520 form, i.e. a slow dissolution (ss) rate of 1.7 d–1 with no bound state (fb=0) or (ii) that the 5521 retained lead was in the bound state with an uptake rate (sb) of 1.7 d–1 with no slow 5522 dissolution (fr=1) (see paragraphs above on lead as a decay product of radon), that sr was ~50 5523 d–1 (half-time ~20 min) with fr ~0.75 or fb ~0.25 respectively, i.e. about 75% cleared rapidly 5524 in either case. Later measurements were not included because of possible significant 5525 contributions to measured 212Pb from decay of higher members of the chain. 5526
(412) Based on these studies and others, bound state parameter values for lead of fb = 0.5 5527 and sb = 1.7 d–1 were chosen (see below). It is noted that (neglecting particle transport) the 5528 fraction of the initial deposit in the respiratory that is absorbed into blood in the rapid phase is 5529 given by fr *(1 – fb), which for fb = 0.5, gives fr *(0.5). For the study in which lead nitrate were 5530 inhaled by human volunteers (Chamberlain et al., 1978), ~50% ILD was cleared rapidly 5531 (components with half times less than 3 hours), suggesting a value for fr of ~1.0. Specific 5532 parameter values derived for lead nitrate would be close to those for Type F (including the 5533 bound state parameters for lead), and therefore lead nitrate is assigned here to Type F. 5534 5535 Lead chloride (PbCl2) 5536
(413) Morrow et al. (1980) followed lung retention and blood concentration of 203Pb in 5537 eight volunteers for up to 4 d after inhalation (by mouth) of an aerosol formed by nebulising a 5538 sodium chloride vector solution to which carrier-free 203PbCl2 was added, giving an AMAD 5539 of ~0.25 µm. Lung retention was represented by a two-component exponential function with 5540 on average (after correction for systemic 203Pb and physical decay) 7% clearing at a rate of 5541 0.023 min–1 (33 d–1, half-time 30 minutes) and 93% at a rate of 0.00088 min–1 (1.3 d–1, half-5542 time 13 hours). The corresponding absorption rates would be lower, because of particle 5543 transport to the alimentary tract. However, at this aerosol size deposition in the upper 5544 respiratory tract would have been relatively low, and so the contribution would be small, at 5545 least to the slow phase. The authors noted that the blood data suggested that the rapid phase 5546 could be due to absorption rather than mucociliary clearance. Some mucociliary clearance and 5547 some rapid absorption would have occurred before the first chest measurement took place, 5548 shortly after aerosol administration. Without fecal clearance measurements, estimates of 5549 specific absorption parameter values could not be made here: the results are consistent with 5550 assignment to Type F. 5551 5552 Lead hydroxide (Pb(OH)2) 5553
(414) Morrow et al. (1980) followed lung retention and blood concentration of 203Pb in 5554 nine volunteers for up to 4 d after inhalation (by mouth) of a Pb(OH)2 - NaCl aerosol formed 5555 by nebulising a sodium chloride vector solution to which carrier-free 203PbCl2, stable lead 5556
DRAFT REPORT FOR CONSULTATION: DO NOT REFERENCE
143
chloride and sodium hydroxide were added, giving an AMAD of ~0.25 µm. Lung retention 5557 was represented by a two-component exponential function with on average (after correction 5558 for systemic 203Pb and physical decay) 12% clearing at a rate of 0.012 min–1 (17 d–1, half-time 5559 60 minutes) and 88% at a rate of 0.00081 min–1 (1.2 d–1, half-time 14 hours). The authors 5560 noted that the results were not significantly different from those obtained with carrier-free 5561 lead chloride (see above) despite differences in chemical form and mass. As for the chloride, 5562 estimates of specific absorption parameter values could not be made: the results are consistent 5563 with assignment to Type F. 5564
(415) Stradling et al. (2005; Moody et al., 1994a) measured the tissue distribution of 228Th, 5565 212Pb, 212Bi and 208Tl, at times from 1 to 168 days after intratracheal instillation into rats of a 5566 suspension of 228Th hydroxide in equilibrium with its decay products. For 212Pb, on average 5567 2.7% ILD was measured in the lungs at 1 day, when administered with a low mass (50 pg) of 5568 thorium, (5% ILD when administered with a high mass, 6.5 µg, of thorium). Clearance was 5569 much faster than that of the parent 228Th. Correcting for the physical decay of 212Pb gives 5570 retention of 13% ILD at 1 day. From this result it was assessed here that sr was greater than 2 5571 d–1 (half-time ~8 hours). Alternatively, assuming fr = 1, and sr = 100 d–1 gave fb = 0.8. Later 5572 measurements were not included because of possible significant contributions to measured 5573 212Pb from decay of higher members of the chain. There was insufficient information to 5574 quantify a slower phase as seen in other studies of soluble forms of lead: its presence would 5575 give a higher value for sr. The results are consistent with assignment to Type F, to which lead 5576 hydroxide is assigned. 5577 5578 Lead oxide (PbO and Pb3O4) 5579
(416) Rendall et al. (1975) measured lead levels in blood (only) of baboons that inhaled 5580 red lead oxide (Pb3O4): either as a “coarse” (mass median diameter, MMD, 6 µm) or “fine” 5581 (MMD 2 µm) aerosol at similar mass concentrations. There is insufficient information to 5582 assess absorption parameter values, but blood levels were higher following exposure to coarse 5583 than to fine dust. Since it is likely that for the coarse dust deposition in the upper respiratory 5584 tract (URT) was higher and deposition in the lungs lower than for the fine dust, the results 5585 suggest that there was rapid absorption from the URT and/or the alimentary tract. 5586
(417) Boudene et al. (1977) measured tissue distribution and excretion in rats for 6 days 5587 following inhalation (whole body) of an aerosol formed by passing nebulised gasoline 5588 labelled with organic 210Pb with air through a tube furnace at 600°C. Lung clearance was 5589 rapid, reducing to 11% ILD at 24 hours and 1% ILD at 6 days. There is detailed information 5590 on the biokinetics (nine time points within the first day) but large uncertainties on the 5591 deposition pattern (extrathoracic and pelt). From the results, parameter values assessed here, 5592 assuming that the lead which was not cleared in the rapid phase was retained in the bound 5593 state (fr =1) were sr ~5 d–1 (half-time ~3 hours); fb ~0.2 and sb ~0.5 d–1 (half-time ~33 hours), 5594 giving assignment to Type F. 5595
(418) Chamberlain et al. (1978) administered to six volunteers an aerosol of 203Pb-labelled 5596 oxide (AMAD in the range 0.4–0.8 µm), formed by eliminating nitrogen from the flame 5597 produced by burning 203Pb-labelled tetra-ethyl lead in propane. Measurements of 203Pb in the 5598 chest, blood and excreta were made for about 4 days. Complementary measurements were 5599 also made of 203Pb in the legs, to correct lung measurements for systemic 203Pb, based on the 5600 results of similar measurements made after intravenous injection of 203Pb. Lung retention was 5601 represented by a four-component exponential function with half-times of 0.5 hours (25%); 2.9 5602 hours (32%); 9.8 hours (25%) and 38 hours (18%) (rates of 33, 5.7, 1.7 and 0.4 d–1 5603 respectively). Clearance was almost entirely by systemic uptake: only a small percentage of 5604

DRAFT REPORT FOR CONSULTATION: DO NOT REFERENCE
144
the initial lung deposit (ILD) was cleared by mucociliary action and swallowed. Chamberlain 5605 et al. (1978) noted that (in contrast to nitrate and motor exhaust aerosols) the lead oxide was 5606 less soluble in vitro than indicated by the lung measurements, and suggested that this might 5607 be because of efficient fluid flow in the lungs. 5608
(419) Rhoads and Sanders (1985) followed the biokinetics of lead in rats for 91 days after 5609 inhalation of non-radioactive PbO. Lung retention was represented by a two-component 5610 exponential function with half-times of 1 day (93%) and 89 days (7%), consistent with 5611 assignment to Type F. 5612
(420) Lung retention of lead oxide inhaled by human volunteers was similar to that of lead 5613 nitrate (Chamberlain et al., 1978), and therefore specific parameter values derived from them 5614 would also be close to those for Type F (including the bound state parameters for lead), and 5615 therefore lead oxide is assigned here to Type F. 5616 5617 Lead difluoride (PbF2) 5618
(421) Stradling et al. (2005; Moody et al., 1994a) measured the tissue distribution of 228Th, 5619 212Pb, 212Bi and 208Tl, at times from 1 to 168 days after intratracheal instillation into rats of a 5620 suspension of 228Th fluoride in equilibrium with its decay products. For 212Pb, on average 5621 6.0% ILD was measured in the lungs at 1 day, when administered with a low mass (60 pg) of 5622 thorium. Correcting for the physical decay of 212Pb gives retention of 28% ILD at 1 day. 5623 Clearance was faster than that of the parent 228Th. From this result it was assessed here that sr 5624 was at least 1 d–1 (half-time ~8 hours). Later measurements were not included because of 5625 possible significant contributions to measured 212Pb from decay of higher members of the 5626 chain. There was insufficient information to quantify a slower phase as seen in other studies 5627 of soluble forms of lead: its presence would give a higher value for sr. (However, when 5628 administered with a high mass, 6.5 µg, of thorium, 18% ILD of 212Pb was measured in the 5629 lungs at 1 day. Correcting for the physical decay of 212Pb gives retention of ~80% ILD at 1 5630 day, similar to that of the parent thorium.) The results indicate Type F behaviour and lead 5631 difluoride is assigned to Type F. 5632 5633 Lead in fresh or age-aggregated motor exhaust (including lead dibromide, PbBr2) 5634
(422) Although mainly related to environmental, rather than occupational, exposure, 5635 information relating to lead in motor exhaust and tobacco smoke is included here for 5636 completeness. 5637
(423) Chamberlain et al. (1975, 1978) administered various aerosols derived from 203Pb-5638 labelled motor exhaust to several volunteers. Measurements of 203Pb in the chest, blood and 5639 excreta were made for up to about 4 days. Complementary measurements were also made of 5640 203Pb in the legs, to correct lung measurements for systemic 203Pb, based on the results of 5641 similar measurements made after intravenous injection of 203Pb. (Absorption from the 5642 alimentary tract following ingestion of exhaust particles collected on filters was also 5643 determined.) In most cases, patterns of lung clearance and systemic uptake were similar to 5644 those found by these authors for lead inhaled as nitrate or oxide (see above), often in the same 5645 volunteers. For fresh motor exhaust, Chamberlain et al. (1978) represented lung retention by a 5646 three-component exponential function with half-times of 1.2 hours (27%); 2.3 hours (39%); 5647 and 8.1 hours (34%) (rates of 14, 7.2 and 2.1 d–1 respectively). Clearance was almost entirely 5648 by systemic uptake: only a small fraction of the ILD was cleared by mucociliary action and 5649 swallowed. For aged exhaust (stored and in some cases exposed to ultraviolet light) a fourth 5650 component was needed: about 10%-15% was retained with a half-time of 40-220 hours. 5651 (Chamberlain et al., 1975, reported only that most of the 203Pb in the lungs was retained with 5652
DRAFT REPORT FOR CONSULTATION: DO NOT REFERENCE
145
a half-time of about 6 hours, and the rest cleared more slowly.) Most studies of the 5653 composition of exhaust lead (e.g. Habibi 1973) have identified complex mixtures of lead 5654 oxides, halides and ammonium salts, together with sulphates and carbonaceous material. This 5655 suggests that Type F behaviour may be characteristic of many lead compounds other than 5656 those for which specific information is available. In particular, since lead dibromide was an 5657 important constituent of lead in motor exhaust, it suggests that, like lead chloride, it should be 5658 assigned to Type F. 5659 5660 Lead-210 in cigarette smoke tar 5661
(424) A brief summary is given here: for further information see the polonium section. 5662 Lead-210 and its decay product, 210Pb, are inhaled in cigarette smoke (Desideri et al., 2007). 5663 Martell (1974) reported that 210Pb concentrates in resinous material in tobacco leaves, 5664 forming insoluble particles during combustion. Cohen et al. (1979) measured 210Po 5665 concentrations in the tracheobronchial tree and lung parenchyma in autopsy tissues from 5666 smokers and non-smokers, and attributed differences to the retention of insoluble particles 5667 containing 210Pb/210Po in cigarette smoke. Cohen et al. (1985) measured 210Po in the lungs of 5668 rats after exposure to cigarette smoke enriched in 210Pb/210Po: results indicate Type M or S 5669 behaviour for both the 210Pb and 210Po. 5670 5671 Mineral dust 5672
(425) A potentially important source of intake of 210Pb in particulate aerosols arises from 5673 airborne mineral dusts containing the natural long-lived parent. In this case the absorption rate 5674 will probably be determined by the dissolution rate of the mineral matrix in lung fluids. 5675 Measurements have been made of the dissolution in simulated lung fluid of samples of coal 5676 fly ash (Kalkwarf et al., 1984) and condensate from calcining phosphate rock dust (Kalkwarf 5677 and Jackson, 1984) for 60 days. By this time the amounts of 210Pb dissolved were <0.2% and 5678 <5% respectively, indicating assignment to Type S in both cases. 5679 5680 Uranium ore dust 5681
(426) Duport et al. (1991) measured the dissolution in simulated lung fluid of long lived 5682 radionuclides in uranium ore dust from Canadian mines. (For further information see the 5683 uranium section relating to uranium ore dust and to decay products of uranium formed in the 5684 respiratory tract). For high grade ore, measurements were made for up to 60 days. Results 5685 were presented as undissolved fractions as functions of time, and showed two components, 5686 which were expressed as Class D (rapid) and Class Y (slow) fractions. For 210Pb the rapidly 5687 dissolved fraction was 0.28. HRTM parameter values fitted to the 210Pb data by Marsh et al. 5688 (2011) were: fr = 0.26, sr = 3.9 d–1 and ss = 0.001 d–1, indicating assignment to Type M. For 5689 210Pb, no effects of size were observed in total dissolution over 40 days for particles in size 5690 ranges 7–10, 3–7, 1–3 and <1 µm. For low grade and medium grade ores, measurements were 5691 made for 12 days, but only on samples of relatively coarse dust, the smallest fraction being 5692 <37 µm. For 210Pb, rapidly dissolved fractions were lower, <0.01, indicating assignment to 5693 Type S. 5694 5695 Thorium dioxide 5696
(427) Hodgson et al. (2000, 2003) measured the tissue distribution of 228Th, 212Pb, 212Bi 5697 and 208Tl, at times from 1 to 168 days after intratracheal instillation into rats of suspensions of 5698 232Th dioxide enriched with 228Th, in equilibrium with its decay products, with geometric 5699 diameters of about 0.4 and 2 µm. (For further information, see the thorium inhalation 5700
DRAFT REPORT FOR CONSULTATION: DO NOT REFERENCE
146
section.) There was little absorption of the thorium itself, consistent with assignment to Type 5701 S. The activity of 212Pb in the lungs was about 50% and 80% of that of the thorium at 1 day 5702 for the 0.4 and 2 µm particles respectively, and 25% and 70% at later times. The lower 5703 concentrations of 212Pb were attributed to diffusion of 220Rn (thoron) and recoil of the 5704 progeny from alpha particle decay. 5705 5706 Decay products of lead formed in the respiratory tract 5707
(428) The general approach to treatment of decay products formed in the respiratory tract 5708 is described in Part 1, Section 3.2.3. In summary, it is expected that generally the rate at 5709 which a particle dissociates is determined by its matrix, and hence the physico-chemical form 5710 of the inhaled material. It is recognised that nuclei formed by alpha decay within a particle 5711 matrix may be expelled from it into the surrounding medium by recoil, but to implement this 5712 routinely would add greatly to the complexity of calculations. It is expected that the behaviour 5713 of soluble (e.g. Type F) material in the respiratory tract would depend on its elemental form, 5714 i.e. that of the decay product. Nevertheless, for simplicity, in this series of documents the 5715 absorption parameter values of the parent are, by default, applied to all members of the decay 5716 chain formed in the respiratory tract. Exceptions are made for noble gases formed as decay 5717 products, which are assumed to escape from the body directly, at a rate of 100 d–1, in addition 5718 to other routes of removal. 5719
(429) For decay schemes of lead isotopes in the natural decay series, including 214Pb, 212Pb 5720 and 210Pb, see the uranium and thorium sections. Studies specifically comparing the 5721 behaviour of lead with that of its decay products (bismuth and thallium isotopes) are 5722 summarised here. For further information, see the bismuth inhalation section. 5723
(430) Drew (1971) reported that the tissue distributions of 212Pb (half-life 11 hours) and 5724 212Bi (half-life 61 minutes) activities were similar in rats following exposure to 220Rn (thoron) 5725 and its decay products for 2 days. However, the exposure situation was complex, because the 5726 212Pb and 212Bi in tissues originated from inhalation of 220Rn, and its decay within the body, 5727 inhalation of 212Pb and 212Bi, and also their ingestion from food and preening of fur. It is 5728 therefore difficult to estimate how much of the 212Bi originated from decay of 212Pb in the 5729 lungs. Furthermore, 212Bi would have grown in rapidly between dissection of the animals and 5730 measurements of activities in tissues. Thus the activities of 212Bi present in vivo may have 5731 been significantly lower than those measured. 5732
(431) As noted above, measurements have been made of the tissue distributions of 212Pb 5733 and its decay products, 212Bi and 208Tl, following administration to rats of 228Th in various 5734 chemical forms (nitrate, hydroxide, fluoride, dioxide), in equilibrium with its decay products. 5735 In all these studies the distributions of 212Bi and 208Tl were similar to each other and those of 5736 the parent 212Pb. Because their physical half-lives are so short (61 minutes and 3 minutes 5737 respectively) measurements made at 6 hours onwards would be mainly of activity formed 5738 from decay of 212Pb within the body, rather than from intake of 212Bi (or 208Tl). The similar 5739 distributions of 212Bi (and 208Tl) to those of 212Pb might suggest that there was not rapid 5740 movement of 212Bi from the site (e.g. the lungs) in which it was formed by decay of 212Pb. 5741 However, 212Bi (and 208Tl) would have grown in rapidly between dissection of the animals 5742 and measurements of activities in tissues. Without detailed information (which is not 5743 available) about the time which elapsed between dissection of the animals and measurements, 5744 it is not possible to correct for this ingrowth and hence estimate the absorption rates of the 5745 bismuth or thallium formed as a decay products in the lungs. However, since the half-life of 5746 208Tl is so short (as is that of 207Tl present in the 235U decay series, 5 minutes), the absorption 5747 rate of thallium would have to be very high to influence dose assessments. 5748

DRAFT REPORT FOR CONSULTATION: DO NOT REFERENCE
147
(432) As described above, Butterweck et al. (2001, 2002) measured radon gas, 214Pb and 5749 214Bi in blood samples taken from volunteers at the end of a 30-minute inhalation exposure to 5750 unattached radon progeny. In vivo measurements of the head and chest were also carried out. 5751 Assuming a rapid dissolution rate (sr) of 1000 d–1 with fr=1 and an uptake rate from the bound 5752 state (sb) of 1.7 d–1, Butterweck et al. (2002) estimated that the rapid absorption of the initial 5753 deposit is in the range 0.15–0.3 and the remaining fraction is bound with fb in the range 0.7–5754 0.85, for “radon progeny” (without distinguishing between 214Pb and 214Bi). However, 5755 Butterweck et al. (2002) also estimated “absorption rates” for 214Pb and 214Bi from their 5756 activities in the blood sample and the estimated respiratory tract deposition, assuming that 5757 absorption from respiratory tract to blood could be represented by a single rate constant (sr) 5758 i.e. fr=1 and fb=0, although this model seems inconsistent with the in vivo measurements. 5759 They obtained absorption half-times of ~60 minutes for 214Pb and ~25 minutes for 214Bi, 5760 suggesting that there was greater absorption of 214Bi than of 214Pb by the end of the exposure 5761 when the blood sample was taken. 5762
(433) As noted above, Singh et al. (1986) measured concentrations of 210Pb (half-life 22 5763 years) in the lungs of uranium miners obtained at autopsy. In most (six out of eight) cases 5764 several years elapsed between death and analysis, so that, regardless of its concentration in the 5765 lungs at death, 210Po would have reached equilibrium with 210Pb. For the other two miners the 5766 analysis was within a few months of death, and the authors inferred that the results indicated 5767 that the 210Po and 210Pb were in equilibrium at the time of death. 5768 5769 Rapid dissolution rate for lead 5770
(434) The absorption of lead from the respiratory tract following deposition in ionic form 5771 has been studied extensively. There have been human volunteer and laboratory animal studies 5772 of the biokinetics of lead inhaled in several ionic forms: as a decay product of radon and as 5773 nitrate, chloride, hydroxide, fluoride and oxide. There have also been laboratory animal 5774 studies in which solutions of ionic lead were instilled onto the nasal and bronchial epithelium 5775 to study the absorption of lead in more detail. Most of these show a similar pattern. As noted 5776 by Morrow et al. (1980), where absorption from the respiratory tract to blood has been 5777 represented by a single overall absorption rate, half-times of about 10 hours were obtained for 5778 several different forms of lead. For some inhalation studies, the duration of exposure and 5779 delay before the first measurement mean that a minor rapid component (time scale of 5780 minutes) would not have been observed. However, in studies with sufficient data, two 5781 components are generally observed, a rapid phase, with between about 10% and 75% clearing 5782 with a half-time between a few minutes and an hour (rate between about 20 and 200 d–1: the 5783 rest with a half-time of about 10 hours (rate about 1.7 d–1). Exceptions are the human 5784 volunteer studies of lead as an unattached decay product of radon (Booker et al., 1969, 5785 Butterweck et al., 2001, 2002): the results indicate a rate for the rapid phase > 100 d–1. 5786 Studies of lead inhaled as a decay product of radon give values of sr of about 100 d–1, which 5787 is applied here to all Type F forms of lead. 5788 5789 Extent of binding of lead to the respiratory tract 5790
(435) There is strong evidence for a bound state for lead, on a time scale relevant to its 5791 inhalation as a decay product of radon. As noted above, the absorption of lead from the 5792 respiratory tract following deposition in ionic form has been extensively studied. In studies 5793 with sufficient data, two components are generally observed, a rapid phase (10–75% clearing 5794 in less than an hour) and the rest with a half-time of about 10 hours. 5795
(436) This similarity in the half-time associated with slow uptake of lead in several 5796

DRAFT REPORT FOR CONSULTATION: DO NOT REFERENCE
148
different ionic forms suggests that it is a characteristic of the element rather than determined 5797 by dissociation of the different forms. The slow phase was not observed when lead was 5798 inhaled in organic form (tetra-ethyl or tetra-methyl lead): the rate of uptake observed (~50% 5799 in a few minutes), seems consistent with the size of the molecules. Uptake of inorganic ionic 5800 lead was much slower, indicating that some mechanism slows down its uptake to blood. 5801
(437) The question of whether the slow phase of absorption of ionic lead represented 5802 binding to respiratory tract components has been considered for over 30 years. Chamberlain 5803 et al. (1978) noted that lead nitrate was far more soluble in vitro than indicated by the lung 5804 measurements, and suggested that the mechanism for transferring lead from lung fluid to 5805 blood is a relatively slow process, which determines the overall transfer rate. 5806
(438) Hursh and Mercer (1970) complemented their inhalation studies of lead as a radon 5807 decay product (see above) with ultrafiltration experiments (transfer though dialysis 5808 membrane): the 212Pb aerosol was collected electrostatically onto a metal plate, and dispersed 5809 ultrasonically into the liquid medium tested. In distilled water or heparinised plasma less than 5810 1% was ultrafilterable, but this was greatly increased by addition of citrate. The authors 5811 attributed the low fraction without added citrate to binding of lead to the dialysis membrane 5812 (distilled water) or proteins (plasma). 5813
(439) Most directly, James et al. (1977) and Greenhalgh et al. (1982) compared the 5814 biokinetics of ionic 212Pb with those of insoluble radiolabelled particles instilled together onto 5815 the bronchiolar epithelium of rabbits or nasal mucosa of rats. Despite some rapid absorption 5816 into blood, the 212Pb cleared more slowly than the particles. The authors concluded that some 5817 of the 212Pb was retained by binding either to static mucus or epithelial tissue. However, a 5818 similar clearance half-time has been observed with ionic lead deposited predominantly in the 5819 alveolar region (see above, e.g. lead as a radon decay product attached to ambient aerosols), 5820 which does not have a mucus lining, suggesting that there is binding to the epithelium. 5821
(440) For the experiment by Booker et al. (1969) in which a volunteer inhaled unattached 5822 212Pb (see above), absorption parameter values assessed here (assuming an absorption model 5823 with sr = 67 d–1 and ss = sb= 1.7 d–1) were fr = 0.36 and fb = 0.82. Neglecting the bound state 5824 (assuming fb = 0) underestimated lung retention and overestimated fecal excretion. Similar 5825 parameter values were assessed here from the results of the experiment by Greenhalgh et al. 5826 (1982). Butterweck et al. (2002) estimated fb to be in the range 0.7–0.85, assuming that fr = 1, 5827 from the results of their experiments in which volunteers inhaled unattached radon decay 5828 products: fb was estimated here to be ~0.7 for lead from these data. 5829
(441) Note that (neglecting particle transport) the fraction of the initial deposit in the 5830 respiratory tract that is absorbed into blood in the rapid phase is given by fr*(1 – fb). For the 5831 studies in which lead nitrate and lead oxide were inhaled by human volunteers (Chamberlain 5832 et al., 1978), about 60% ILD was cleared rapidly (components with half times less than 3 5833 hours). (There was little mucociliary clearance and fecal excretion.) These results suggest a 5834 lower value of fb than the estimates made for lead as a decay product of radon. Similarly, fb 5835 values of about 0.25 were estimated here for lead nitrate instilled into rats or lead oxide 5836 inhaled by rats based on the data of Moody et al. (1994b) and Boudene et al. (1977) 5837 respectively. 5838
(442) On the basis of all these results, a bound fraction with fb = 0.5 and a rate of uptake sb 5839 = 1.7 d–1 is adopted here for lead. There is experimental evidence that lead in soluble form 5840 deposited in the conducting airways is retained in a bound state. It is therefore assumed here 5841 that these bound state parameter values apply throughout the respiratory tract (ET2, BB, bb 5842 and AI regions). 5843 5844
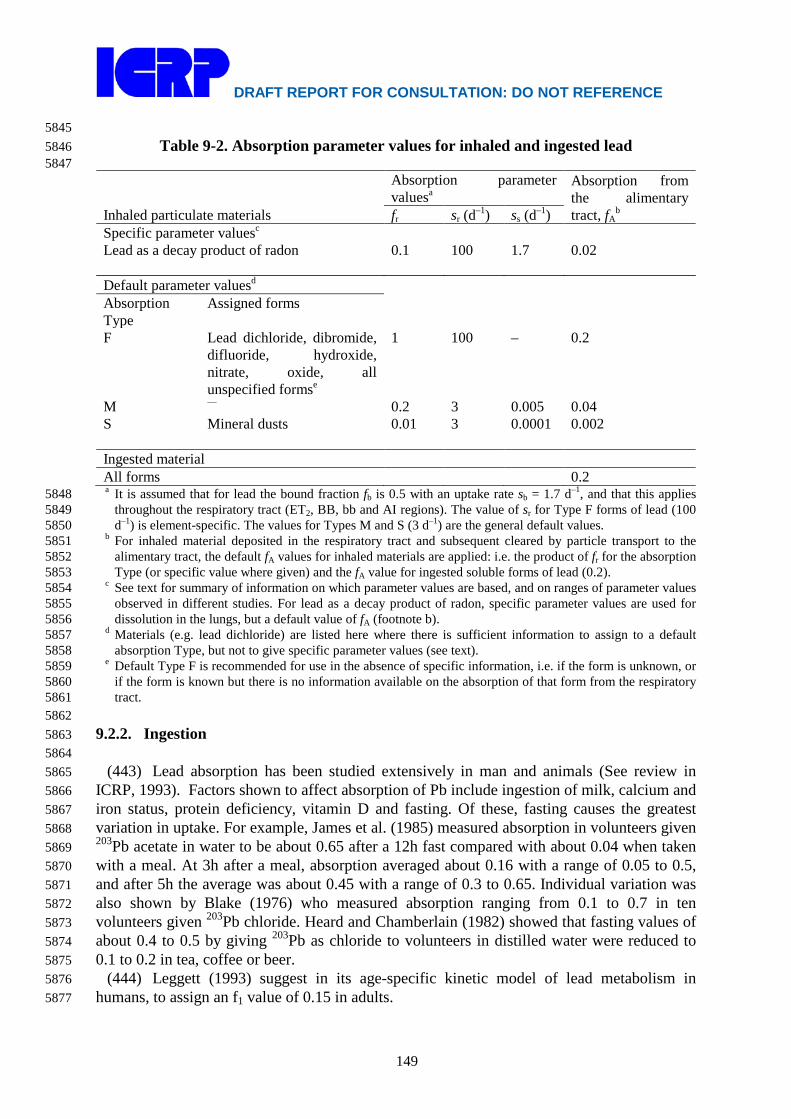
DRAFT REPORT FOR CONSULTATION: DO NOT REFERENCE
149
5845 Table 9-2. Absorption parameter values for inhaled and ingested lead 5846
5847
Inhaled particulate materials
Absorption parameter valuesa
Absorption from the alimentary tract, fA
b fr sr (d–1) ss (d–1) Specific parameter valuesc Lead as a decay product of radon 0.1 100 1.7 0.02 Default parameter valuesd Absorption Type
Assigned forms
F Lead dichloride, dibromide, difluoride, hydroxide, nitrate, oxide, all unspecified formse
1 100 – 0.2
M — 0.2 3 0.005 0.04 S Mineral dusts 0.01 3 0.0001 0.002 Ingested material All forms 0.2 a It is assumed that for lead the bound fraction fb is 0.5 with an uptake rate sb = 1.7 d–1, and that this applies 5848
throughout the respiratory tract (ET2, BB, bb and AI regions). The value of sr for Type F forms of lead (100 5849 d–1) is element-specific. The values for Types M and S (3 d–1) are the general default values. 5850
b For inhaled material deposited in the respiratory tract and subsequent cleared by particle transport to the 5851 alimentary tract, the default fA values for inhaled materials are applied: i.e. the product of fr for the absorption 5852 Type (or specific value where given) and the fA value for ingested soluble forms of lead (0.2). 5853
c See text for summary of information on which parameter values are based, and on ranges of parameter values 5854 observed in different studies. For lead as a decay product of radon, specific parameter values are used for 5855 dissolution in the lungs, but a default value of fA (footnote b). 5856
d Materials (e.g. lead dichloride) are listed here where there is sufficient information to assign to a default 5857 absorption Type, but not to give specific parameter values (see text). 5858
e Default Type F is recommended for use in the absence of specific information, i.e. if the form is unknown, or 5859 if the form is known but there is no information available on the absorption of that form from the respiratory 5860 tract. 5861
5862 9.2.2. Ingestion 5863 5864
(443) Lead absorption has been studied extensively in man and animals (See review in 5865 ICRP, 1993). Factors shown to affect absorption of Pb include ingestion of milk, calcium and 5866 iron status, protein deficiency, vitamin D and fasting. Of these, fasting causes the greatest 5867 variation in uptake. For example, James et al. (1985) measured absorption in volunteers given 5868 203Pb acetate in water to be about 0.65 after a 12h fast compared with about 0.04 when taken 5869 with a meal. At 3h after a meal, absorption averaged about 0.16 with a range of 0.05 to 0.5, 5870 and after 5h the average was about 0.45 with a range of 0.3 to 0.65. Individual variation was 5871 also shown by Blake (1976) who measured absorption ranging from 0.1 to 0.7 in ten 5872 volunteers given 203Pb chloride. Heard and Chamberlain (1982) showed that fasting values of 5873 about 0.4 to 0.5 by giving 203Pb as chloride to volunteers in distilled water were reduced to 5874 0.1 to 0.2 in tea, coffee or beer. 5875
(444) Leggett (1993) suggest in its age-specific kinetic model of lead metabolism in 5876 humans, to assign an f1 value of 0.15 in adults. 5877
DRAFT REPORT FOR CONSULTATION: DO NOT REFERENCE
150
(445) The Publication 30 (ICRP, 1980) derived an absorption value of 0.2 that was applied 5878 in Publication 67 (ICRP, 1993) to dietary intakes. An fA of 0.2 is used here for direct 5879 ingestion of all forms of lead. 5880 5881 9.2.3. Systemic Distribution, Retention and Excretion 5882 5883 9.2.3.1. Summary of the database 5884 5885
(446) Following intravenous administration of radiolead to human subjects, the injected 5886 activity initially cleared from blood at a rate of 1 min-1 or greater (Wells et al., 1975; 5887 Chamberlain et al., 1978). A minimum blood content of about one-third of the injected 5888 amount was reached within 2-3 min, at which time roughly three-fourths of activity in blood 5889 resided in red blood cells (RBC). Increased activity in blood was then seen for 24-48 h as the 5890 tracer returned from extravascular spaces and accumulated in RBC (Booker et al., 1969; 5891 Wells et al., 1975; Chamberlain et al., 1978). Within a few hours after injection, 99% or more 5892 of activity in blood was bound in or on RBC (Hursh et al., 1969; Booker et al., 1969; Wells et 5893 al., 1975; Chamberlain et al., 1978; Everson and Patterson, 1980; DeSilva, 1981; Manton and 5894 Cook, 1984; Heard and Chamberlain, 1984). 5895
(447) At 1-2 d after introduction of radiolead into adult humans by injection or inhalation, 5896 the blood contained 40-75% (mean 58 ± 12%) of the amount reaching the circulation (Hursh 5897 and Suomela, 1968; Booker et al., 1969; Hursh et al., 1969; Wells et al., 1975; Chamberlain 5898 et al., 1978; Morrow et al., 1980; Heard and Chamberlain, 1984). Over the next few weeks, 5899 activity was cleared from blood with a biological half-time on the order of 15-20 days 5900 (Rabinowitz et al., 1973, 1974, 1976; Wells et al., 1975; Heard and Chamberlain, 1984). 5901
(448) Soon after introduction of radiolead into blood plasma, the tracer is largely available 5902 for diffusion into extravascular fluids and filtration by the kidneys (Vander et al., 1977; 5903 Chamberlain et al., 1978; Heard and Chamberlain, 1984). Under steady-state conditions, 5904 however, most of the lead in plasma is bound to proteins (Griffin and Matson, 1972). 5905
(449) The liver contained about 10-15% of administered radiolead at 1 d after intravenous 5906 injection into adult humans (Heard and Chamberlain, 1984), baboons (Cohen et al., 1970), or 5907 dogs (Lloyd et al., 1975). Most of the activity deposited in the liver was removed with a 5908 biological half-time of a few weeks. Autopsy measurements on chronically exposed adult 5909 humans indicate that the liver typically contains about 2-3% of total-body lead. The blood-to-5910 liver concentration ratio in chronically exposed persons typically is about 0.2 (Blanchard and 5911 Moore, 1970, 1971; Hamilton et al., 1972; ICRP, 1975; Gross et al., 1975; Barry, 1975,198l). 5912
(450) Part of the loss of lead from the liver can be accounted for by biliary secretion into 5913 the gastrointestinal content, but return of lead from the liver to blood also must be postulated 5914 to explain the limited losses in faeces. Estimates of the contribution of biliary secretion to 5915 total faecal excretion of lead are variable. For example, data of Rabinowitz et al. (1976) 5916 indicate that biliary secretion represents no more than half of all endogenous secretion of lead 5917 into the gastrointestinal tract, while data of Ishihara and Matsushiro (1986) suggest that 5918 hepatic bile is the main route of faecal elimination of absorbed lead from the body. 5919
(451) Results of experimental studies on dogs and rodents indicate that the kidneys 5920 accumulated as much as 15-20% of intravenously injected radiolead within the first 1-2 h, 5921 most of the accumulated activity represented filtered lead, and a substantial portion of the 5922 early accumulation was reabsorbed or lost in urine within a few hours (Morgan et al., 1977; 5923 Victery et al., 1979; Keller and Doherty, 1980). In rats, the kidneys contained roughly 10% of 5924 the intravenously injected amount after 1 day but less than 2% after 9 days. In baboons 5925
DRAFT REPORT FOR CONSULTATION: DO NOT REFERENCE
151
receiving radiolead by intravenous injection, the kidneys contained about 4% of the 5926 administered amount after 1 day, 0.6% after 30 days, and 0.1% after 60 days (Cohen et al., 5927 1970). In dogs receiving 210Pb by intravenous injection, the kidneys contained about 0.5% of 5928 the administered activity at 1 month (Lloyd et al., 1975). Comparison of the decline of renal 5929 and hepatic activity from 1 d to about 2 mo after intravenous administration of radiolead to 5930 baboons (Cohen et al., 1970) indicate that the removal half-time from the kidneys is roughly 5931 half of that from the liver, if each of these organs were treated as a single compartment. This 5932 agrees with estimates for baboons exposed to lead by daily ingestion over a period of a few 5933 months (Mallon, 1983). 5934
(452) Gradual loss of lead from RBC, liver, kidneys, and other soft tissues over the first 5935 few weeks can be accounted for by a slow loss in urine and faeces and a continual increase in 5936 skeletal lead. Typically, 3-5% of injected or absorbed lead is lost in urine during the first day. 5937 The urinary to faecal excretion ratio is about 2 during days 3-14 after absorption of lead to 5938 blood in humans. About 30% of intravenously injected radiolead is removed in urine and 5939 faeces during the first 20 days (Hursh and Suomela, 1968; Hursh et al., 1969; Hursh and 5940 Mercer, 1970; Booker et al., 1969; Wells et al., 1975; Chamberlain et al., 1978; Heard and 5941 Chamberlain, 1984). 5942
(453) In baboons (Cohen et al., 1970) and human subjects (Heard and Chamberlain, 1984), 5943 there was evidence of rapid skeletal uptake of about 10-15% of intravenously administered 5944 lead. The skeletal content remained nearly constant over the next 2-3 d and then slowly 5945 increased over an extended period as activity returned from RBC and soft tissues to plasma. 5946 In human subjects the skeleton contained roughly 20% of the injected amount after 20 d. 5947 Autopsy data for persons chronically exposed to environmental lead indicate that the skeletal 5948 content of lead increases throughout life and represents 90% or more of systemic lead by the 5949 fifth decade (Tipton and Cook, 1963; Gross et al., 1975; Barry, 1975, 1981; Leggett, 1993). 5950
(454) Skeletal behaviour of lead appears to be qualitatively similar to that of the alkaline 5951 earth elements and quantitatively similar to that of barium or radium, if account is taken of 5952 the slower deposition of lead in the skeleton due to competition from RBC (Hursh, 1973; 5953 Lloyd et al., 1975; Domanski and Trojanowska, 1980; Heard and Chamberlain, 1984). Lead 5954 has been used frequently as a marker of bone growth and osteon formation, and a close 5955 resemblance to calcium has been demonstrated in such studies (Vincent, 1957; Lacroix, 1960; 5956 Scheiman-Tagger and Brodie, 1964; Hong et al., 1968; Yen and Shaw, 1977). Lead is 5957 incorporated into the crystalline structure of bone, where it replaces calcium ions (MacDonald 5958 et al., 1951; Verbeeck et al., 1981; Miyake et al., 1986). 5959
(455) Autoradiographs of bone sections from baboons injected with 210Pb indicate that a 5960 portion of skeletal activity remains near bone surfaces at 1 to 2 months after administration, 5961 as appears to be the case for radium and barium. Studies on human subjects indicate that the 5962 distribution of lead in bone may be skewed toward bone surfaces for at least a few months 5963 after exposure, but the subjects generally have been exposed to heavy levels of lead that could 5964 affect bone metabolism (Lindh et al., 1978; Flood et al., 1988). Burial of lead beneath the 5965 surfaces in regions of bone formation has been observed, and there is evidence that lead is 5966 eventually distributed throughout the bone volume (Vincent, 1957; Lacroix, 1960; Scheiman-5967 Tagger and Brodie, 1964; Hong et al., 1968; Yen and Shaw, 1977; Lindh et al., 1978; Hu et 5968 al., 1989). In beagles, long-term skeletal retention of lead is similar to that of strontium and 5969 radium (Hursh, 1973; Lloyd et al, 1975). Because lead is incorporated into the bone crystal, 5970 long-term losses from bone presumably are largely controlled by the rate of bone resorption. 5971
(456) In a study of the comparative behaviour of injected lead, calcium, and barium in 5972 bone of rabbits, Domanski and Trojanowska (1980) found that the build-up of lead in bone is 5973
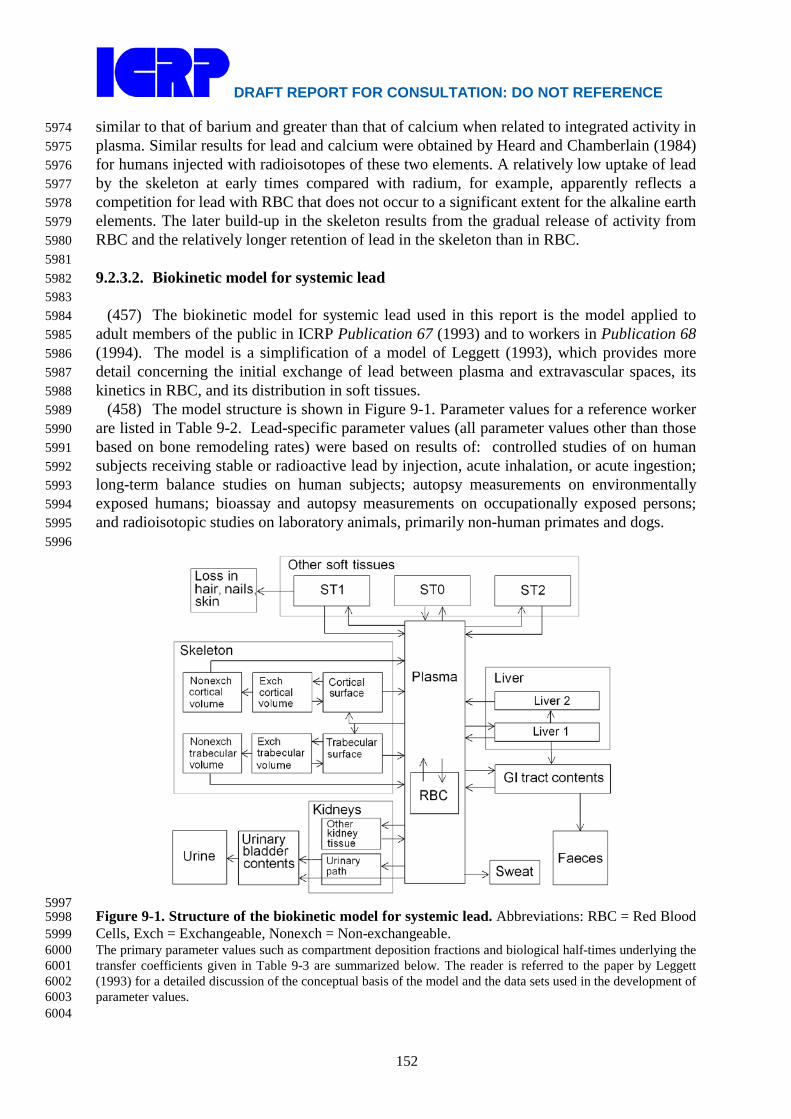
DRAFT REPORT FOR CONSULTATION: DO NOT REFERENCE
152
similar to that of barium and greater than that of calcium when related to integrated activity in 5974 plasma. Similar results for lead and calcium were obtained by Heard and Chamberlain (1984) 5975 for humans injected with radioisotopes of these two elements. A relatively low uptake of lead 5976 by the skeleton at early times compared with radium, for example, apparently reflects a 5977 competition for lead with RBC that does not occur to a significant extent for the alkaline earth 5978 elements. The later build-up in the skeleton results from the gradual release of activity from 5979 RBC and the relatively longer retention of lead in the skeleton than in RBC. 5980 5981 9.2.3.2. Biokinetic model for systemic lead 5982 5983
(457) The biokinetic model for systemic lead used in this report is the model applied to 5984 adult members of the public in ICRP Publication 67 (1993) and to workers in Publication 68 5985 (1994). The model is a simplification of a model of Leggett (1993), which provides more 5986 detail concerning the initial exchange of lead between plasma and extravascular spaces, its 5987 kinetics in RBC, and its distribution in soft tissues. 5988
(458) The model structure is shown in Figure 9-1. Parameter values for a reference worker 5989 are listed in Table 9-2. Lead-specific parameter values (all parameter values other than those 5990 based on bone remodeling rates) were based on results of: controlled studies of on human 5991 subjects receiving stable or radioactive lead by injection, acute inhalation, or acute ingestion; 5992 long-term balance studies on human subjects; autopsy measurements on environmentally 5993 exposed humans; bioassay and autopsy measurements on occupationally exposed persons; 5994 and radioisotopic studies on laboratory animals, primarily non-human primates and dogs. 5995 5996
5997 Figure 9-1. Structure of the biokinetic model for systemic lead. Abbreviations: RBC = Red Blood 5998 Cells, Exch = Exchangeable, Nonexch = Non-exchangeable. 5999 The primary parameter values such as compartment deposition fractions and biological half-times underlying the 6000 transfer coefficients given in Table 9-3 are summarized below. The reader is referred to the paper by Leggett 6001 (1993) for a detailed discussion of the conceptual basis of the model and the data sets used in the development of 6002 parameter values. 6003 6004

DRAFT REPORT FOR CONSULTATION: DO NOT REFERENCE
153
(459) An early, rapid exchange of lead that occurs between plasma and extravascular 6005 spaces (Leggett, 1993) is not addressed in the present model. It is assumed here that lead 6006 leaves plasma at a rate of 70 d-1 and that a substantial portion of activity leaving plasma goes 6007 to a rapid-turnover soft tissue compartment called ST0 that is three times as large as the 6008 plasma compartment. Inflow and outflow rates selected for RBC yield an estimate of roughly 6009 58% of injected lead in RBC at l-2 days after injection. It is assumed that 40% of outflow 6010 from plasma deposits in RBC. A biological half-time of 5 d for lead in RBC is set to yield a 6011 net half-time in blood (elongated by recycling) of about 20 days in the time between a few 6012 days and a few weeks after injection, based on data for humans. 6013 6014
Table 9-3. Transfer coefficients in the biokinetic model for systemic lead
From To Transfer oefficient (d-1)
Plasma Urinary bladder content 1.75 Plasma Right colon content 0.7 Plasma Trabecular bone surface 4.86 Plasma Cortical bone surface 3.89 Plasma ST0 22.16 Plasma ST1 0.7 Plasma ST2 0.14 Plasma Liver 1 4.9 Plasma Urinary path 2.45 Plasma Other kidney tissue 0.0245 Plasma RBC 28 Plasma Excreta (sweat) 0.42 RBC Plasma 0.139 Trabecular bone surface Plasma 0.5 Trabecular bone surface Exch trabecular bone volume 0.5 Cortical bone surface Plasma 0.5 Cortical bone surface Exch cortical bone volume 0.5 Exch trabecular bone volume Trabecular bone surface 0.0185 Exch trabecular bone volume Nonexch trabecular bone volume 0.0046 Exch cortical bone volume Cortical bone surface 0.0185 Exch cortical bone volume Nonexch cortical bone volume 0.0046 Nonexch trabecular bone volume Plasma 0.000493 Nonexch cortical bone volume Plasma 0.0000821 Liver 1 Plasma 0.0312 Liver 1 SI content 0.0312 Liver 1 Liver 2 0.00693 Liver 2 Plasma 0.0019 Urinary path Urinary bladder content 0.139 Other kidney tissue Plasma 0.0019 ST0 Plasma 7.39 ST1 Plasma 0.00416 ST2 Plasma 0.00038 ST1 Excreta (Hair, skin, nails) 0.00277 RBC = Red Blood Cells, Exch = Exchangeable, Nonexch = Non-exchangeable
6015 (460) Urinary and faecal excretion rates were based on observations of the fate of 6016
DRAFT REPORT FOR CONSULTATION: DO NOT REFERENCE
154
intravenously injected radiolead in human subjects. It is assumed that 6% of outflow from 6017 plasma enters urinary excretion pathways. Part of this (2.5%) is assumed to pass 6018 instantaneously through the kidneys to the bladder content, and the rest (3.5%) is assumed to 6019 deposit in the renal tubules and to be released to the bladder content over a period of days. It 6020 is assumed that 1.7% of outflow from plasma enters the intestinal content either directly or 6021 indirectly: 1% passes directly into the right colon content, and 10% of the deposition in liver 6022 (7% of outflow from plasma) is secreted into the SI content. Because lead entering the SI 6023 content is subject to reabsorption to blood, the model predicts that slightly less than 1.7% of 6024 outflow from plasma is excreted in faeces. 6025
(461) Loss of lead in sweat is assumed to represent 0.6% of outflow from plasma. A 6026 fourth excretion pathway, representing loss of lead in hair, skin, and nails, is depicted as 6027 outflow from soft-tissue compartment ST1 (described below). The predicted loss of lead 6028 from the body through this fourth pathway is equivalent to 0.4% of outflow from plasma. 6029
(462) The liver is assumed to consist of two compartments, one with relatively short 6030 retention (Liver 1) and one with relatively long retention (Liver 2). Activity entering the liver 6031 is assigned to Liver 1. A small portion of the activity leaving Liver 1 is assigned to Liver 2, 6032 but most of the outflow is divided between plasma and the small intestine. Parameter values 6033 describing uptake, retention, and removal of lead by the liver were based on biokinetic studies 6034 of radiolead in human subjects, baboons, and dogs, and blood-to-liver concentration ratios 6035 observed in persons chronically exposed to low levels of environmental lead. It is assumed 6036 that 7% of lead leaving plasma deposits in Liver 1; the removal half-time from Liver 1 is 10 6037 days; 10% of activity leaving Liver 1 deposits in Liver 2; and the remaining 90% of outflow 6038 from Liver 1 is evenly divided between plasma and SI content. The removal half-time from 6039 Liver 2 is 1 y. 6040
(463) The kidneys are assumed to consist of two compartments, one with relatively short 6041 retention (Urinary path) and one with relatively long retention (Other kidney tissue). The 6042 Urinary path receives lead from plasma and loses activity to the urinary bladder content. 6043 Other kidney tissue exchanges lead slowly with plasma. Parameter values describing uptake, 6044 retention, and removal of lead by the kidneys were based on biokinetic studies of radiolead in 6045 baboons, dogs, and rats, and blood-to-liver concentration ratios observed in persons 6046 chronically exposed to low levels of environmental lead. It is assumed that 3.5% of outflow 6047 from plasma deposits in the urinary path and 0.035% deposits in other kidney tissue. The 6048 removal half-time from the urinary path to the urinary bladder content is 5 d. The removal 6049 half-time from other kidney tissue is 1 y. 6050
(464) Other soft tissues are divided into compartments ST0, ST1, and ST2 representing 6051 fast (hours), moderate (months), and slow (years) return of lead to plasma. These are not 6052 physically identifiable compartments. They are defined on a kinetic basis, for reasonable 6053 agreement with estimates of the lead content of soft tissues other than liver and kidneys 6054 during chronic exposure or as a function of time after acute intake of lead. The underlying 6055 datasets include results of a variety of studies on laboratory animals and human subjects. 6056 Compartments ST1 and ST2 are assigned 1% and 0.2% of outflow from plasma, respectively. 6057 The fast-turnover compartment is assigned 31.66% of outflow from plasma, where the last 6058 three digits reflect an adjustment of the initially assigned deposition fraction to account for 6059 100% of outflow from plasma. The biological half-times in ST0, ST1, and ST2 are 6060 approximately 2.25 h, 100 d, and 5 y, respectively. Outflow from the intermediate-term 6061 compartment ST1 is divided between plasma (60%) and an excretion compartment 6062 representing loss of lead in hair, skin, and nails (40%). 6063
(465) Parameter values describing the bone kinetics of lead at early to intermediate times 6064

DRAFT REPORT FOR CONSULTATION: DO NOT REFERENCE
155
after uptake to blood are based on studies of radiolead in adult humans, baboons, and dogs, 6065 and analogy with radium. Bone surface is assumed to receive 12.5% of outflow from plasma. 6066 The assumed division between trabecular and cortical surface is based on analogy with 6067 radium. Lead is removed from bone surface at a rate of 1 d-1, with 50% returning to plasma 6068 and 50% entering exchangeable bone volume. The rates of transfer from the exchangeable 6069 bone volume compartments to bone surface and to non-exchangeable bone volume are based 6070 on analogy with radium. The assumed rate of removal from each bone volume compartment 6071 to plasma is the reference bone turnover rate for that bone type (ICRP, 2002a). 6072 6073 9.2.3.3. Treatment of radioactive progeny 6074 6075 Dosimetrically significant lead progeny 6076
(466) Several lead isotopes addressed in this report have radioactive progeny that 6077 contribute significantly to dose coefficients for the internally deposited lead parent. The 6078 dosimetrically significant members of lead chains are isotopes of gold, mercury, thallium, 6079 lead, bismuth, or polonium. The biokinetic models applied to these elements as progeny of 6080 systemic lead are described below. 6081 6082 Gold 6083
(467) The biokinetics of gold has been investigated extensively in human subjects and 6084 laboratory animals in studies related to its medical applications, particularly the use of stable 6085 gold for treating rheumatoid arthritis and short-lived radioactive gold as an imaging agent 6086 (Freyberg, et al., 1942; Block, et al., 1942, 1944; Jeffrey et al., 1958; Lawrence, 1961; Rubin 6087 et al., 1967; McQueen and Dykes, 1969; Mascarenhas et al., 1972; Sugawa-Katayama et al., 6088 1975; Gottlieb, 1979, 1983; Jellum et al., 1980; Massarella and Pearlman, 1987; Andersson et 6089 al., 1988; Bacso et al., 1988; Brihaye and Guillaume, 1990). Also, several studies have 6090 addressed the biological behavior of gold as a radioactive contaminant in the workplace or 6091 environment (Durbin, 1960; Fleshman et al., 1966; Chertok and Lake, 1971a, 1971b, 1971c; 6092 Silva et al., 1973). Development of a representative biokinetic model for systemic gold in 6093 adult humans is complicated by the apparent dependence of reported data on the mode of 6094 administration, chemical form, administered mass, and other study conditions. The following 6095 general properties appear to be typical of gold administered in relatively soluble form. Much 6096 of the gold reaching blood is excreted in the first week or two, but a nontrivial portion is 6097 retained for several weeks or months. Excretion is primarily in urine. Most of the retained 6098 amount is found in the kidneys, liver, and blood. Most of the gold found in blood is bound to 6099 plasma proteins. 6100
(468) The following model is applied in this report to radioisotopes of gold produced in 6101 systemic compartments following intake of a lead parent. Gold leaves the central blood 6102 compartment (Blood 1) at the rate 1 d-1 and is distributed as follows: 10% to Blood 2 (a blood 6103 compartment with relatively slow turnover), 30% to Urinary bladder content, 10% to Right 6104 colon content, 10% to Kidneys, 10% to Liver, 5% to Red marrow (active marrow), 1% to 6105 Spleen, 1% to Trabecular bone surface, 1% to Cortical bone surface, 0.06% to Testes, 0.02% 6106 to Ovaries, 10% to ST2 (a soft tissue compartment with slow turnover), and the remaining 6107 11.92 % to ST1 (a soft tissue compartment with a moderate turnover time). Gold transfers 6108 from Blood 2 to Blood 1 with a half-time of 5 d; from Liver, ST1, Spleen, Testes, Ovaries, 6109 Red marrow, Trabecular bone surface, and Cortical bone surface to Blood 1 with a half-time 6110 of 10 d; from Kidneys to Urinary bladder content with a half-time of 10 d; and from Other 2 6111 to Blood with a half-time of 50 d. Gold produced by radioactive decay in a blood 6112

DRAFT REPORT FOR CONSULTATION: DO NOT REFERENCE
156
compartment that is not identifiable with a blood compartment of the gold model is assumed 6113 to transfer to Blood 1 at the rate 1000 d-1. Gold produced in a soft-tissue compartment that is 6114 not identifiable with a compartment in the gold model is assumed to transfer to Blood 1 with 6115 a half-time of 10 d. Gold produced in a compartment of trabecular or cortical bone volume is 6116 assumed to transfer to Blood 1 at the reference turnover rate for that bone type. 6117 6118 Mercury 6119
(469) The model for mercury produced in systemic compartments by radioactive decay is 6120 based on biokinetic data for human subjects and laboratory animals exposed to inorganic 6121 forms of mercury, primarily divalent mercury salts (Friberg, 1956; Rothstein and Hayes, 6122 1960; Cember, 1962; Hayes and Rothstein, 1962; Berlin and Ullberg, 1963; Clarkson and 6123 Rothstein, 1964; Joselow et al., 1967; Johnson and Johnson, 1968; Berlin et al., 1969; Brown 6124 et al., 1975; Jugo, 1976; Hursh et al., 1976, 1980; Cherian et al., 1978; Berlin, 1986; Newton 6125 and Fry, 1978; Jonsson et al., 1999). Retention data for mercury entering the body as a vapor 6126 are also considered for times remote from intake, as the biokinetics of this initial form of 6127 mercury gradually converges to that seen after intake of divalent mercury salts. Studies of 6128 animals administered divalent mercury salts indicate initially rapid disappearance of mercury 6129 from blood, but a substantial portion of the injected amount is retained in blood after several 6130 hours. Animal and human studies indicate that as much as 30-40% of divalent mercury 6131 reaching blood is deposited in the kidneys and is retained there with a half-time on the order 6132 of 50 (35-90) d. In rats injected with inorganic divalent mercury, the kidneys and liver 6133 accounted for about 10% of the systemic burden after 4 h, 40% after 1 d, 70% after 6 d, 88% 6134 after 15 d, and 91% after 52 d. In human subjects, more than half of absorbed inorganic 6135 mercury is removed from the body in urine. Initially, the rate of fecal excretion is much 6136 higher than that of urinary excretion, but this relation reverses over a few weeks as the kidney 6137 content builds up and the content of other systemic tissues declines. In addition to losses in 6138 urine and faeces, mercury is removed from the systemic fluids and tissues by exhalation as 6139 mercury vapor, and small amounts are lost through sweat, hair, and other routes. External 6140 measurements on human subjects exposed to inorganic mercury suggest that much of the 6141 mercury deposited in soft tissues other than kidneys is removed over a period of a few weeks. 6142 In rats receiving mercury chloride by intravenous or intramuscular injection, a slow phase of 6143 excretion with a half-time of 3 mo or more was apparent by 2 mo after injection. A 6144 component of retention in the body with a half-time on the order of 100 d is also indicated by 6145 long-term measurements of urinary mercury following human exposure to inorganic mercury. 6146
(470) The systemic model for mercury as a member of a lead chain consists of the 6147 following compartments: Plasma 1 (diffusible mercury), Plasma 2 (protein-bound mercury), 6148 RBC, Kidneys, Liver, Spleen, Red marrow (active marrow), Testes, Ovaries, Cortical bone 6149 surface, Trabecular bone surface, and compartments ST1 and ST2 representing two phases of 6150 loss from remaining soft tissues. Mercury absorbed to blood or reentering blood from tissues 6151 is assigned to Plasma 1. The total transfer coefficient from Plasma 1 to all destinations is 6152 16.636 h-1 corresponding to a half-time of 1 h. Outflow from Plasma 1 is divided as follows: 6153 4% to RBC, 12% to Plasma 2, 35% to Kidneys, 20% to Liver, 10% to Small intestine content, 6154 3% to Red marrow, 0.6% to Spleen, 0.036% to Testes, 0.012% to Ovaries, 3.5% to ST2, 5% 6155 to Excreta (excretion other than urine and faeces), 1% to Cortical bone surface, 1% to 6156 Trabecular bone surface, and the remaining 4.852% to ST1. Mercury transfers from RBC to 6157 Plasma 1 with a half-time of 3 d, from Plasma 2 to Plasma 1 with a half-time of 1 d, from 6158 Kidneys to Urinary bladder content with a half-time of 35 d, from bone surface compartments 6159 to Plasma 1 with a half-time of 20 d, from ST1 to Plasma 1 with a half-time of 20 d, and from 6160
DRAFT REPORT FOR CONSULTATION: DO NOT REFERENCE
157
ST2 to Plasma 1 with a half-time of 100 d. Mercury is removed from Liver with a half-time 6161 of 10 d, with outflow from Liver equally divided between Plasma 1 and SI content. Mercury 6162 transfers from Red marrow, Spleen, Testes, and Ovaries to Plasma 1 with a half-time of 20 d. 6163 Mercury is absorbed from SI content to Plasma 1 based on the reference absorption fraction 6164 for ingested inorganic mercury, and the unabsorbed portion transfers to the Right colon 6165 content and is eventually excreted in faeces. Mercury produced in a soft-tissue compartment 6166 that is not identifiable with a compartment in the mercury model is assumed to transfer to the 6167 central blood compartment of the mercury model with a half-time of 20 d. Mercury produced 6168 in a compartment of cortical or trabecular bone volume is assumed to transfer to the central 6169 blood compartment at the reference turnover rate for that bone type. 6170 6171 Thallium 6172
(471) The biokinetics of thallium has been investigated extensively in human subjects and 6173 laboratory animals, due mainly to the importance of radio-thallium in nuclear medicine and 6174 many occurrences of accidental or malicious poisoning with stable thallium (Gettler and 6175 Weiss, 1943; Barclay et al., 1953; Lie et al., 1960; Gehring and Hammond, 1967; Potter et al., 6176 1971; Bradley-Moore et al., 1975; Strauss et al., 1975; Atkins et al., 1977; Suzuki et al., 1978; 6177 Berger et al., 1983; Nakamura et al., 1985; Gregus and Klaassen, 1986; Krahwinkel et al., 6178 1988; Lathrop et al., 1989; Blanchardon et al., 2005). Comparisons of the disappearance of 6179 radioisotopes of thallium, potassium, and rubidium from blood and their uptake by tissues of 6180 laboratory animals suggest a close relation in the movement of these elements, presumably 6181 associated with their similar ionic radii (Gehring and Hammond, 1967; Strauss et al., 1975). 6182 These elements are rapidly removed from plasma, and their early distributions are determined 6183 largely by the distribution of cardiac output. After entering the cell, thallium is released more 6184 slowly than potassium or rubidium, but the mean residence time of thallium in the body is 6185 less than that of potassium or rubidium due to a higher rate of clearance from plasma to 6186 excretion pathways. Most reported removal half-times of thallium from the adult human body 6187 are in the range 9-13 d (Atkins et al., 1977; Krahwinkel et al., 1988; Blanchardon et al., 6188 2005). Chen et al. (1983) reported two components of retention of thallium: 7d for 63% and 6189 28 d for 37% of the injected amount. It appears that faecal excretion typically represents 6190 more than half of cumulative excretion of thallium over a period of weeks following its acute 6191 intake, although some relatively short-term human studies have suggested that excretion of 6192 thallium is primarily in urine (cf. Barclay et al., 1953; Lathrop et al., 1975; Atkins et al., 6193 1977; Blanchardon et al., 2005). 6194
(472) The following model is applied in this report to radioisotopes of thallium produced 6195 in systemic compartments following intake of a lead parent. Thallium leaves the central 6196 blood compartment (Plasma) at the rate 200 d-1 (corresponding to a half-time of 5 min) and is 6197 distributed as follows: 2.5% to RBC, 0.75% to Urinary bladder content, 1.75% to Right colon 6198 content, 5% to Kidneys, 5% to Liver, 1.5% to Red marrow (active marrow), 0.2% to Spleen, 6199 0.045% to Testes, 0.015% to Ovaries, 7.5% to Trabecular bone surface, 7.5% to Cortical bone 6200 surface, and 68.24% to ST0 (remaining soft tissues). Thallium returns from RBC to Plasma 6201 at the rate 3.7 d-1 and from tissue compartments to Plasma at the rate 2.5 d-1. Thallium 6202 produced by radioactive decay in a blood compartment that is not identifiable with a blood 6203 compartment of the thallium model is assumed to transfer to Plasma at the rate 1000 d-1. 6204 Thallium produced in a soft-tissue compartment that is not identifiable with a compartment of 6205 the thallium model is assumed to transfer to Plasma at the rate 2.5 d-1. Thallium produced in 6206 a compartment of cortical or trabecular bone volume is assumed to transfer to Plasma at the 6207 reference turnover rate of that bone type. 6208
DRAFT REPORT FOR CONSULTATION: DO NOT REFERENCE
158
6209 Lead 6210
(473) The systemic model for lead as a progeny of a lead parent is based on the 6211 characteristic model for lead applied in this series of reports. The structure of the 6212 characteristic model is modified by the addition of four compartments that are explicitly 6213 identified in models for some elements appearing in lead chains: Red marrow (active 6214 marrow), Spleen, Testes, and Ovaries. Each of these compartments is assumed to exchange 6215 lead with the central blood compartment of the lead model (Plasma). Transfer coefficients for 6216 the added compartments are selected for reasonable consistency with the biokinetic database 6217 underlying the characteristic model for lead and with the retention curve for total soft tissues 6218 based on the characteristic model. The specific changes to the characteristic model for lead 6219 are as follows: (1) the transfer coefficients from Plasma to compartments added to the 6220 characteristic model for lead are 0.015 d-1 for Red marrow, 0.002 d-1 for Spleen, 0.00045 d-1 6221 for Testes, and 0.00015 d-1 for Ovaries; (2) the transfer coefficient from Plasma to ST1 is 6222 reduced from 0.70 d-1 to 0.69 d-1, and the coefficient from Plasma to ST2 is reduced from 6223 0.14 d-1 to 0.138 d-1; and (3) the assigned transfer coefficient from each of the added 6224 compartments back to Plasma is 0.002 d-1. Lead produced in a blood compartment of a 6225 preceding chain member that is not identifiable with a blood compartment of the lead model 6226 is assigned the transfer rate 1000 d-1 to Plasma. 6227 6228 Bismuth 6229
(474) The systemic model for bismuth as a progeny of lead is based on the characteristic 6230 model for bismuth applied in this series of reports. The structure of the characteristic model 6231 is modified by the addition of four compartments that are explicitly identified in models for 6232 some elements appearing in lead chains: Red marrow (active marrow), Spleen, Testes, and 6233 Ovaries. Each of these compartments is assumed to exchange bismuth with the central blood 6234 compartment (plasma). Transfer coefficients are selected for reasonable consistency with the 6235 biokinetic database underlying the characteristic model for bismuth and with the retention 6236 curve for total soft tissues based on that original model. The specific changes to the 6237 characteristic model for bismuth are as follows: (1) the transfer coefficients from plasma to 6238 the added compartments are 0.3 d-1 for Red marrow, 0.02 d-1 for Spleen, 0.003 d-1 for Testes, 6239 and 0.001 d-1 for Ovaries; (2) the transfer coefficient from plasma to the Other soft-tissue 6240 compartment ST1 is reduced from 4.2 d-1 to 3.976 d-1, and the coefficient from plasma to the 6241 Other soft tissue compartment ST2 is reduced from 1.3 d-1 to 1.2 d-1; and (3) the assigned 6242 transfer coefficient from each of the added compartments back to plasma is 0.007 d-1 (half-6243 time of 100 d). Bismuth produced in a blood compartment that is not identifiable with a 6244 compartment of the bismuth model is assumed to transfer to the plasma compartment of the 6245 bismuth model at the rate 1000 d-1. Bismuth produced in a trabecular or cortical bone volume 6246 compartment is assumed to transfer to plasma at the reference turnover rate for that bone type. 6247 6248 Polonium 6249
(475) The model for polonium produced in systemic compartments following intake of a 6250 lead isotope is a simplified version of the model applied in this report to polonium absorbed 6251 to blood following its inhalation as a parent radionuclide. It is assumed that polonium leaves 6252 the central blood compartment of the model (Plasma) at the rate 100 d-1 and distributes as 6253 follows: 5% to red blood cells (RBC), 3% to plasma proteins (Plasma P), 28% to Liver, 28% 6254 to Kidneys, 1.2% to Bone surface, 3.3% to Red marrow (active marrow), 1.6% to Spleen, 6255 0.1% to Testes, 0.05% to Ovaries, 4% to a soft-tissue compartment with a relatively long 6256

DRAFT REPORT FOR CONSULTATION: DO NOT REFERENCE
159
retention time (ST2), and the remaining 25.755% to a soft-tissue compartment with a 6257 relatively short retention time (ST1). Activity entering Liver is equally divided between 6258 compartments Liver 1 and Liver 2. Of the 28% of outflow from Plasma depositing in 6259 Kidneys, 24% is assigned to the urinary path (Kidneys 1) and 4% is assigned to other kidney 6260 tissue (Kidneys 2). Activity entering Bone surface is equally divided between Cortical bone 6261 surface and Trabecular bone surface. Activity transfers to Plasma from each of the 6262 compartments RBC, Plasma P, ST1, Liver 2, Red marrow, Spleen, and Kidneys 2 with a half-6263 time of 7 d. Activity transfers from Liver 1 to Small intestine content with a half-time of 5 d, 6264 from Kidneys 1 to Urinary bladder content with a half-time of 4 d, from Trabecular and 6265 Cortical bone surface to Plasma with a half-time of 30 d, from ST2 to Plasma with a half-time 6266 of 100 d, and from Testes and Ovaries to Plasma with a half-time of 50 d. Polonium 6267 produced in a soft-tissue compartment of a preceding chain member that is not identifiable 6268 with a compartment in the polonium model is assumed to move to Plasma with a half-time of 6269 7 d. Polonium produced in a compartment of cortical or trabecular bone volume is assumed to 6270 transfer to Plasma at the reference rate of turnover of that bone type. 6271 6272 9.3. Individual monitoring 6273 6274 210 Pb 6275
(476) Urine bioassay is used for the monitoring of 210 Pb. In addition, when necessary, 6276 measurements of the concentration in faeces may be performed. For refined monitoring of 210 6277 Pb skeleton burdens, in vivo measurements of the cranium and knee might be performed. 6278 6279
Isotope Monitoring Technique
Method of Measurement
Typical Detection Limit
Achievable detection limit
210 Pb Urine Bioassay Beta proportional counting
0.1 Bq/L 0.01 Bq/L
210 Pb Faeces Bioassay Beta proportional counting
0.04 Bq/24h
210 Pb Cranium Measurement
γ-ray spectrometry 16 Bq
210 Pb Knee Measurement
γ-ray spectrometry 14 Bq
6280 212 Pb 6281
(477) In vivo monitoring, lung and Whole Body Counting, are the main techniques used to 6282 determine 212 Pb intakes. 6283 6284
Isotope Monitoring Technique
Method of Measurement
Typical Detection Limit
Achievable detection limit
212 Pb Whole Body Counting
γ-ray spectrometry 80 Bq 50Bq
212 Pb Lung Counting γ-ray spectrometry 9 Bq 8Bq 6285 214Pb 6286
(478) In vivo monitoring, lung and Whole Body Counting, are the main techniques used to 6287 determine 214 Pb intakes 6288

DRAFT REPORT FOR CONSULTATION: DO NOT REFERENCE
160
6289 Isotope Monitoring
Technique Method of Measurement
Typical Detection Limit
Achievable detection limit
214Pb Whole Body Counting
γ-ray spectrometry 90 Bq 50 Bq
214 Pb Lung Counting γ-ray spectrometry 16 Bq 6290 6291
References 6292 6293 Andersson, L.; Hallstadius, L.; Strand, S.-E. 1988. Biokinetics and dosimetry for 195Au, evaluated in 6294
an animal model. Eur. J. Nucl. Med. 14:393-399. 6295 Atkins, H. L.; Budinger, T. F.; Lebowitz, E.; Ansari, A. N.; Greene, M. W.; Fairchild, R. G.; Ellis, K. 6296
J. 1977. Thallium-201 for medical use, 3. Human distribution and physical imaging 6297 properties. J. Nucl. Med. 18:133-140. 6298
Bacso, J.; Uzonyi, I.; Dezso, B. 1988. Determination of gold accumulation in human tissues caused 6299 by gold therapy using x-ray fluorescence analysis. Appl. Radiat. Isot. 39:323-326. 6300
Ballou, J.E., Gies, R.A., Case, A.C., Haggard, D.L., Buschbom, R.L., Ryan, J.L., 1986. Deposition 6301 and early disposition of inhaled 233UO2(NO3)2 and 232UO2(NO3)2 in the rat. Health 6302 Phys. 51, 755–771. 6303
Ballou, J.E., Hursh, J.B., 1972. The measurement of thoron in the breath of dogs administered 6304 inhaled or injected ThO2. Health Phys., 22, 155–159. 6305
Barclay, R. K.; Peacock, W. C.; Karnofsky, D. A. 1953. Distribution and excretion of radioactive 6306 thallium in the chick embryo, rat, and man. J. Pharmacol. Exp. Ther.107:178-187. 6307
Barry, P.S.I., 1975. A comparison of lead concentrations in human tissues. Br. J. Znd. Med. 32, 119-6308 139. 6309
Barry, P.S.I., 1981. Concentrations of lead in tissues of children. Br. J. Ind. Med. 38, 61-71. 6310 Berger, C. D.; Lane, B. H.; Hamrick, T. 1983. Clearance of 202Tl contaminate following intravenous 6311
injection of 201Tl. Health Phys. 45:999-1001. 6312 Berlin, M. (1986) Mercury. In: Friberg, L.; Nordberg, G. F.; Vouk, V. B., eds. Handbook of the 6313
toxicology of metals, Vol. II. New York: Elsevier; 387-445. 6314 Berlin, M.; Fazackerley, J.; Nordberg, G. 1969. The uptake of mercury in the brains of mammals 6315
exposed to mercury vapor and to mercuric salts. Arch. Environ. Health 18, 719-729. 6316 Berlin, M.; Ullberg, S. (1963) Accumulation and retention of mercury in the mouse. Arch. Environ. 6317
Health 6, 589-601. 6318 Bianco, A., Gibb, F.R., Morrow, P.E., 1974. Inhalation study of a submicron size lead-212 aerosol. 6319
In: Snyder, W.S. (Ed.), 3rd Int. Congress of the IRPA, Washington D.C., 9–14 Sept. 1973., 6320 USAEC CONF-730907, pp. 1214–1219. 6321
Blake, K., 1976. Absorption of lead-203 From gastrointestinal tract of man. Enviromental Research. 6322 11, 1-4. 6323
Blanchard, R.L., Moore, J.B., 1971. Body burden, distribution and internal dose of Pb-210 and Po-6324 210 in a uranium miner population. Health Phys. 21, 499-518. 6325
Blanchard, R. L., Moore, J.B., 1970. Pb-210 and Po-210 in tissues of some Alaskan residents as 6326 related to consumption of caribou or reindeer meat. Health Phys. 18, 127-134. 6327
Block, W. D.; Buchanan, O. H.; Freyberg, R. H. (1942). Metabolism, toxicity and manner of action of 6328 gold compounds used in the treatment of arthritis. IV. Studies of the absorption, distribution 6329 and excretion of gold following the intramuscular injection of gold thioglucose and gold 6330 calcium thiomalate. J. Pharmacol. Exp. Ther. 76:355-357. 6331
Block, W. D.; Buchanan, O. H.; Freyberg, R. H. (1944). Metabolism, toxicity and manner of action of 6332 gold compounds used in the treatment of arthritis. V. A comparative study of the rate of 6333

DRAFT REPORT FOR CONSULTATION: DO NOT REFERENCE
161
absorption, the retention, and the rate of excretion of gold administered in different 6334 compounds. J. Pharmacol. Exp. Ther. 82, 391-398. 6335
Booker, D.V., Chamberlain, A.C., Newton, D., Stott, A.N., 1969. Uptake of radioactive lead 6336 following inhalation and injection. Br. J. Radiol. 42, 457–466. 6337
Boudene, C., Malet, D., Masse, R., 1977. Fate of 210Pb inhaled by rats. Toxicol. Appl. Pharmacol. 6338 41, 271–276. 6339
Bradley-Moore, P. R.; Lebowitz, E.; Greene, M. W.; Atkins, H. L.; Ansari, A. N. (1975). Thallium-6340 201 for medical use, 2. Biologic behavior. J. Nucl. Med. 16:156-160. 6341
Brihaye, C.; Guillaume, M. (1990). 195Au biokinetics and dosimetry. Eur. J. Nucl. Med. 16:369-371. 6342 Brown, K. W.; McFarlane, J. C.; Bernhardt, D. E. (1975) Accidental inhalation of mercury-203. 6343
Health Phys. 28, 1-4. 6344 Butterweck, G., Schuler, C., Vezzu, G., Muller, R., Marsh, J.W., Thrift, S., Birchall, A., 2002. 6345
Experimental determination of the absorption rate of unattached radon progeny from 6346 respiratory tract to blood. Radiat. Prot. Dosimetry, 102, 343–348. 6347
Butterweck, G., Vezzù, G., Schuler, Ch., Müller, R., Marsh, J.W., Thrift, S., Birchall, A., 2001. In-6348 vivo measurement of unattached radon progeny deposited in the human respiratory tract. 6349 Radiat. Prot. Dosim. 94, 247–250. 6350
Cember, H. (1962) The influence of the size of the dose on the distribution and elimination of 6351 inorganic mercury, Hg(NO3)2, in the rat. Amer. Ind. Hyg. Assoc. J. 23, 304-313. 6352
Chamberlain, A.C., Clough, W.S., Heard, M.J., Newton, D., Stott, A.N.B., Wells, A.C., 1975. Uptake 6353 of lead by inhalation of motor exhaust. Proc. R. Soc. Lond. B. 192, 77–110. 6354
Chamberlain, A.C., Heard, M.J., Little, P., Newton, D., Wells, A.C., Wiffen, R.D., 1978. 6355 Investigations into lead from motor vehicles. UK Atomic Energy Authority Report AERE-R 6356 9198. HMSO, London. 6357
Chen, C. T.; Lathrop, K. A.; Harper, P. V.; Bartlett, R. D.; Stark V. J.; Fultz, K. R.; Faulhaber, P. F. 6358 (1983). Quantitative measurement of long term in vivo thallium distribution in the human. J. 6359 Nucl. Med., 24:P50. 6360
Cherian, M. G.; Hursh, J. B.; Clarkson, T. W.; Allen, J. (1978) Radioactive mercury distribution in 6361 biological fluids and excretion in human subjects after inhalation of mercury vapor. Arch. 6362 Environ. Health 33, 109-114. 6363
Chertok, R. J.; Lake, S. (1971a) Availability in the peccary pig of radionuclides in nuclear debris 6364 from the plowshare excavation buggy. Health Phys. 20, 313-316. 6365
Chertok, R. J.; Lake, S. (1971b) Biological availability of radionuclides produced by the plowshare 6366 event schooner - I. Body distribution in domestic pigs exposed in the field. Health Phys. 20, 6367 317-324. 6368
Chertok, R. J.; Lake, S. (1971c) Biological availability of radionuclides produced by the plowshare 6369 event schooner - II. Retention and excretion rates in peccaries after a single oral dose of 6370 debris. Health Phys. 20, 325-330. 6371
Clarkson, T.; Rothstein, A. (1964) The excretion of volatile mercury by rats injected with mercuric 6372 salts. Health Phys. 10, 1115-1121. 6373
Cohen, B.S., Eisenbud, M., Wrenn, M.E., Harley, N.H., 1979. Distribution of polonium-210 in the 6374 human lung. Radiat. Res. 79, 162-168. 6375
Cohen, B.S., Harley, N.H., Tso, T.C., 1985. Clearance of polonium-210-enriched cigarette smoke 6376 from the rat trachea and lung. Toxicol. Appl. Pharmacol. 79, 314-322. 6377
Cohen, N., Eisenbud, M., Wrenn, M.E., 1970. The Retention and Distribution of Lead-210 in the 6378 Adult Baboon. Progress report, Radioactivity studies, New York University Medical Center, 6379 New York. 6380
Desideri D., Meli, M.A., Feduzi, L., Roselli, C., 2007. 210Po and 210Pb inhalation by cigarette 6381 smoking in Italy. Health Phys. 92(1) 58-63. 6382
DeSilva, P.E., 1981. Determination of lead in plasma and studies on its relationship to lead in 6383 erythrocytes. Br. J. Ind. Med. 38,209-217. 6384

DRAFT REPORT FOR CONSULTATION: DO NOT REFERENCE
162
Domanski, T., Trojanowska, B., 1980. Studies on metabolic kinetics of lead and alkaline earth 6385 elements (Ca, Ba). Acta Physiol. Pol. 31, 439-447. 6386
Drew, R.T., 1971. 212Pb distribution studies in the rat. Health. Phys. 20, 617–623. 6387 Duport, P., Robertson, R., Ho, K., Horvat, F., 1991. Flow-through dissolution of uranium-thorium ore 6388
dust, uranium concentrate, uranium dioxide, and thorium alloy in simulated lung fluid. 6389 Radiat. Prot. Dosim. 38(1/3), 121-133. 6390
Durbin, P. W. (1960) Metabolic characteristics within a chemical family. Health Phys. 2, 225-238. 6391 Everson, J., Patterson, C.C., 1980. "Ultra-clean" isotope dilution/mass spectrometric analyses for lead 6392
in human blood plasma indicate that most reported values are artificially high. Clin. Chem. 6393 26, 1603-1607. 6394
Fleshman, D; Krotz, S.; Silva, A. (1966). The metabolism of elements of high atomic number. UCRL 6395 14739:69-86. 6396
Flood, P.R., Schmidt, P.F., Wesenberg, G.R., Gadeholt, H., 1988. The distribution of lead in human 6397 hemopoietic tissue and spongy bone after lead poisoning and Ca-EDTA chelation therapy. 6398 Arch. Toxicol. 62, 295-300. 6399
Freyberg, R. H.; walter d. Block, W. D.; Levey, S. (1942). Metabolism, toxicity and manner of action 6400 of gold compounds used in the treatment of arthritis. III. Complete excretion studies and 6401 comparison of intravenous and intramuscular administration of some gold salts. Ann. 6402 Rheum. Dis. 3:77-89. 6403
Friberg, L. (1956) Studies of the accumulation, metabolism and excretion of inorganic mercury 6404 (203Hg) after prolonged subcutaneous administration to rats. Acta Pharmacol. et Toxicol. 6405 12, 411-427. 6406
Gehring, P. J.; Hammond, P. B. (1967). The interrelationship between thallium and potassium in 6407 animals. J. Pharmacol. Exp. Ther. 155:187-201. 6408
Gettler, A. O.; Weiss, L. (1943). Thallium poisoning. III. Clinical toxicology of thallium. Amer. J. 6409 Clin. Pathol. 13: 422-429. 6410
Gottlieb, N. L. (1983). Comparison of the kinetics of parenteral and oral gold. Scand. J. Rheumatol. 6411 12:10-14. 6412
Greenhalgh, J.R., Birchall, A., James, A.C., Smith, H., Hodgson, A., 1982. Differential retention of 6413 212Pb ions and insoluble particles in nasal mucosa of the rat. Phys. Med. Biol. 27, 837–6414 851. 6415
Greenhalgh, J.R., James, A.C., Smith, H., Hodgson, A., 1979. Absorption of lead ions from the lung. 6416 NRPB/ R&D3. Annual Research and Development Report 1978 pp. 38–42. 6417
Greenhalgh, J.R., James, A.C., Smith, H., Stubberfield, D.R., 1978. Absorption of lead from the 6418 bronchial region of the lung. NRPB/ R&D2. Annual Research and Development Report 6419 1977 pp. 65–70. 6420
Gregus, Z.; Klaassen, C. D. 1986. Disposition of metals in rats: A comparative study of fecal, urinary, 6421 and biliary excretion and tissue distribution of eighteen metals. Toxicol. Appl. Pharmacol. 6422 85:24-38. 6423
Griffin, R.M., Matson, W.R., 1972. The assessment of individual variability to trace metal insult: 6424 low-molecular-weight metal complexing agents as indicators of trace metal insult. Amer. 6425 Indus. Hyg. Assoc. 33, 373-377. 6426
Gross, S.B., Pfitzer, E.A., Yeager, D.W., Kehoe, R.A., 1975. Lead in human tissues. Toxicol. Appl. 6427 Pharmacol. 32, 638-651. 6428
Habibi, K., 1973. Characterisation of particulate matter in vehicle exhaust. Environ. Sci. Technol. 7, 6429 223–234. 6430
Hamilton, E.I., Minski, M.J., Cleary, J.J., 1972. The concentration and distribution of some stable 6431 elements in healthy human tissues from the United Kingdom. Sci. Total Environ. 1, 341-6432 374. 6433
Hayes, A. D.; Rothstein, A. 1962. The metabolism of inhaled mercury vapor in the rat studied by 6434 isotope techniques. J. Pharmacol. 38, 1-10. 6435
DRAFT REPORT FOR CONSULTATION: DO NOT REFERENCE
163
Heard, M., Chamberlain, A., 1982. Effect of minerals and food on uptake from the gastrointestinal 6436 tract in humans. Human Toxicology. 1. 411–415. 6437
Heard, M.J., Chamberlain, A.C., 1984. Uptake of Pb by human skeleton and comparative metabolism 6438 of Pb and alkaline earth elements. Health Phys. 47,857-865. 6439
Heard, M.J., Wells, A.C. Newton, D., Chamberlain, A.C., 1979. Human uptake and metabolism of 6440 tetra-ethyl and tetra-methyl lead vapour labelled with lead-203. In: Heavy Metals in the 6441 Environment (London: CEP Consultants). 6442
Hodgson, S.A., Rance, E.R., Stradling, G.N., Hodgson, A., Fell, T.P., Youngman, M.J., Moody, J.C., 6443 Ansoborlo, E., 2000. Biokinetics of thorium dioxide and its decay products in the rat after 6444 alveolar deposition: implications for human exposure. Chilton, NRPB-M1192. 6445
Hodgson, S.A., Stradling, G.N., Hodgson, A., Smith, T.J., Youngman, M.J., Moody, J.C., 6446 Ansoborlo, E., 2003. Biokinetics and assessment of intake of thorium dioxide. Radiat. Prot. 6447 Dosim. 105, 115–118. 6448
Hong, Y.C., Yen, P.K.-J., Shaw, J.H., 1968. An analysis of the growth of the cranial vault in rabbits 6449 by vital staining with lead acetate. Calc. Tiss. Res. 2, 271-285. 6450
Hu, H., Milder, F.L., Burger, D.E., 1989. X-ray fluorescence: Issues surrounding the application of a 6451 new tool for measuring burden of lead. Environ. Res. 49, 295-317. 6452
Hursh, J. B.; Greenwood, M. R.; Clarkson, T. W.; Allen, J.; Demuth, S. (1980) The effect of ethanol 6453 on the fate of mercury vapor inhaled by man. J. Pharmacol. Exp. Ther. 214, 520-527. 6454
Hursh, J.B., 1973. Retention of Pb-210 in beagle dogs. Health Phys. 25, 29-35. 6455 Hursh, J.B., Brown, C., 1969. Tissue distribution of 212Bi in rats. Proc. Soc. Exp. Biol. Med. 131, 6456
116-120. 6457 Hursh, J.B., Mercer, T.T., 1970. Measurement of 212Pb loss rate from human lungs. J. Appl. Physiol 6458
28, 268–274. 6459 Hursh, J.B., Schraub, A., Sattler, E.L., Hofmann, H.P., 1969. Fate of 212Pb inhaled by human 6460
subjects. Health Phys. 16, 257–267. 6461 Hursh, J.B., Suomela, J., 1968. Absorption of Pb-212 from the gastrointestinal tract of man. Acta 6462
Radiol. Ther. Phys. Biol. 7, 108-120. 6463 Hursh, J.B.; Clarkson, T. W.; Cherian, M. G.; Vostal, J. J.; Mallie, R. V. (1976) Clearance of 6464
mercury (Hg-197, Hg-203) vapor inhaled by human subjects. Arch. Environ. Health 31, 6465 302-309. 6466
ICRP 1994. Dose Coefficients for Intakes of Radionuclides by Workers, ICRP Publication 68. Ann. 6467 ICRP 24(4). 6468
ICRP 2002a. Basic anatomical and physiological data for use in radiological protection: Reference 6469 values, ICRP Publication 89, Ann. ICRP 32(3/4). 6470
ICRP 2002b. Guide for the Practical Application of the ICRP Human Respiratory Tract Model. ICRP 6471 Supporting Guidance 3 Ann. of the ICRP 32(1–2). 6472
ICRP, 1975. Report of the Task Group on Reference Man, ICRP Publication 23. Oxford, Pergamon 6473 Press. 6474
ICRP, 1980. Limits on Intakes of Radionuclides for Workers. ICRP Publication 30, Pt.2. Ann. ICRP 6475 4(3/4). 6476
ICRP, 1993. Age-dependent Doses to Members of the Public from Intake of Radionuclides: Part 2, 6477 Ingestion dose coefficients. ICRP Publication 67. Ann. ICRP 23. (3/4). 6478
Ishihara, N., Matsushiro, T., 1986. Biliary and urinary excretion of metals in humans. Arch. Environ. 6479 Health 41, 324-330. 6480
James, A.C., Greenhalgh, J.R., Smith, H., 1977. Clearance of lead-212 ions from rabbit bronchial 6481 epithelium to blood. Phys. Med. Biol. 22, 932–948. 6482
James, H., Hilburn, M., Blair, J., 1985. Effects of meal times on uptake of lead from the 6483 gastrointestinal tract in humans. Hum Toxicol., 4, 401-407. 6484
Jeffrey M. R.; Freundlich, H. F.; Bailey, D. M. (1958). Distribution and excretion of radiogold in 6485 animals. Ann. rheum. Dis. 17:52-60. 6486
DRAFT REPORT FOR CONSULTATION: DO NOT REFERENCE
164
Jellum, E.; Munthe, E.; Guldal, G.; Aaseth, J. (1980). Fate of the gold and the thiomalate part after 6487 intramuscular administration of aurothiomalate to mice. Ann. Rheum. Dis. 39:155-158. 6488
Johnson, J. E.; Johnson, J. A. (1968) A new value for the long component of the effective half-6489 retention time of 203Hg in the human. Health Phys. 14, 265-266. 6490
Jonsson, F.; Sandborgh-Englund, G.; Johanson, G. A. (1999) Compartmental model for the kinetics 6491 of mercury vapor in humans. Toxicol. Appl. Pharmacol. 155, 161-168. 6492
Joselow, M. M.; Goldwater, L. J.; Weinberg, S. B. (1967) Absorption and excretion of mercury in 6493 man. XI. Mercury content of “normal” human tissues. Arch. Environ. Health 15, 64-66. 6494
Jugo, S. (1976) Retention and distribution of 203HgCl2 in suckling and adult rats. Health Phys. 30, 6495 241-243. 6496
Kalkwarf, D.R., Jackson, P.O., 1984. Lung-clearance classification of radionuclides in calcined 6497 phosphate rock dust. PNL-5221, Richland, WA. Pacific Northwest Laboratory Reports. 6498
Kalkwarf, D.R., Jackson, P.O., Hardin, J.M., 1984. Lung-clearance classification of radionuclides in 6499 coal fly ash. Health Phys. 47, 37–45. 6500
Keller, C. A., Doherty, R. A. 1980. Distribution and excretion of lead in young and adult female 6501 mice. Environ Res 21, 217-228. 6502
Krahwinkel, W.; Herzog, H.; Feinendegen, L. E. (1988). Paramacokinetics of thallium-201 in normal 6503 individuals after routine myocardial scintigraphy. J. Nucl. Med. 29:1582-1586. 6504
Lacroix, P., 1960. Ca-45 autoradiography in the study of bone tissue. In: Bone as a tissue (Rodahl K, 6505 Nicolson JT, Brown EM, Eds). New York, McGraw-Hill, pp. 262-279, 6506
Lathrop, K. A.; Harper, P. V.; Gloria, I. V.; Rich, M. (1975). Intestinal localization of Tl-201. J. 6507 Nucl. Med. 16:545. 6508
Lathrop, K. A.; Tsui, B. M. W.; Chen, C.-T.; Harper, P. V. (1989). Multiparameter extratrapolation 6509 of biodistribution data between species. Health Phys. 57, Suppl. 1:121-126. 6510
Lawrence, J. S. (1961). Studies with radioactive gold. Ann. Rheum. Dis. 20:341-352. 6511 Leggett, R.W., 1993. An age-specific kinetic model of lead in humans. Environ. Health Perspect. 101, 6512
598-616. 6513 Lie, R.; Thomas, R. G.; Scott, J. K. (1960). The distribution and excretion of thallium-204 in the rat, 6514
with suggested MPC’s and a bioassay procedure. Health Phys. 2:334-340. 6515 Lindh, U., Brune, D., Nordberg, G., 1978. Microprobe analysis of lead in human femur by proton 6516
induced x-ray emission (PIXE). Sci. Total Environ. 10, 31-37. 6517 Lloyd, R.D., Mays, C.W., Atherton, D.R., Bruenger, F.W., 1975. 210Pb studies in beagles. Health 6518
Phys. 28, 575-583. 6519 MacDonald, N.S., Ezmirlian, F., Spain, P., McArthur, C., 1951. The ultimate site of skeletal 6520
deposition of strontium and lead. J. Biol. Chem. 189, 387-399. 6521 Mallon, R.P., 1983. A metabolic model of lead kinetics based upon measured organ burdens during 6522
chronic exposure experiments with infant and juvenile baboons. Dissertation. New York 6523 University. 6524
Manton, W.I., Cook, J.D., 1984. High accuracy (stable isotope dilution) measurements of lead in 6525 serum and cerebrospinal fluid. Br. J. Ind. Med. 41, 313-319. 6526
Marsh J.W., Gregoratto, D., Karcher, K., Nosske D., Bessa Y., Blanchardon E., Hofmann W., 6527 Tomasek, L., 2011. Dosimetric calculations for uranium miners for epidemiological 6528 studies. Radiat. Prot. Dos. pp. 1-13, doi:10.1093/rpd/ncr310. 6529
Marsh, J.W., Birchall, A., 1999. Determination of lung-to-blood absorption rates for lead and bismuth 6530 that are appropriate for radon progeny. Radiat. Prot. Dosim. 83, 331–337. 6531
Martell, E.A., 1974. Radioactivity of tobacco trichomes and insoluble cigarette smoke particles. 6532 Nature 249, 215-217. 6533
Mascarenhas, B. R.; Granda, J. L.; Freyberg, R. H. (1972). Gold metabolism in patients with 6534 rheumatoid arthritis treated with gold compounds – reinvestigated. Arthritis and 6535 Rheumatism 15:391-402. 6536
DRAFT REPORT FOR CONSULTATION: DO NOT REFERENCE
165
Massarella, J. W.; Pearlman, R. S. (1987). Gold disposition in the rat: Studies of its plasma half-life 6537 and its urinary, biliary and fecal elimination pathways. J. Pharmacol. Exp. Ther. 243:247-6538 257. 6539
McQueen, E. G.; Dykes, P. W. (1969). Transport of gold in the body. Ann. Rheum. Dis. 28:437-442. 6540 Miyake, M., Ishigaki, K., Suzuki, T., 1986. Structure refinements of Pb2+ ion-exchanged apatites by 6541
x-ray powder pattern-fitting. J. Solid State Chem. 61, 230-235. 6542 Moody, J.C., Davies, C.P., Stradling, G.N., 1994a. Biokinetics of thorium and daughter radionuclides 6543
after deposition in the rat lung as fluoride and hydroxide. In: Mohr, U., Dungworth, D.L., 6544 Mauderly, J.L., Oberdörster, G. (Eds.), Proc. Fourth International Inhalation Symposium, 6545 Hannover, March 1–5, 1993. Toxic and Carcinogenic Effects of Solid Particles in the 6546 Respiratory System, pp. 611–614. 6547
Moody, J.C., Stradling, G.N., 1992. Biokinetics of thorium and daughter radionuclides after 6548 deposition in the rat lung. J. Aerosol Sci. 23, S523–S526. 6549
Moody, J.C., Stradling, G.N., Pearce, M.J., Gray, S.A., 1994b. Biokinetics of Thorium and Daughter 6550 Radionuclides after Deposition in the Rat Lung as Nitrate: Implications for Human 6551 Exposure. NRPB-M525, Chilton, UK. 6552
Morgan, A., Holmes, A., Evans, J.C., 1977. Retention, distribution, and excretion of lead by the rat 6553 after intravenous injection. Br. J. Ind. Med. 34, 37-42. 6554
Morrow, P.E., Better, F., Amato, F., Gibb, F.R., 1980. Pulmonary retention of lead: an experimental 6555 study in man. Environ. Res. 21 373–384. 6556
Nakamura, K.; Nishiguchi, I.; Takagi, Y.; Kubo, A.; Hashimoto, S. (1985). Distribution of 201Tl in 6557 blood. Radioisotopes. 34:550-554. 6558
Newton, D.; Fry, F. A. (1978) The retention and distribution of radioactive mercuric oxide following 6559 accidental inhalation. Ann. Occup. Hyg. 21, 21-32. 6560
Potter, G. D.; Vattuone, G. M.; McIntyre, D. R. (1971). The fate and implications of ingested 204Tl 6561 in a dairy cow and a calf. Health Phys. 20:657-662. 6562
Rabinowitz, M. B., Wetherill, G.W., Kopple, J.D., 1974. Studies of human lead metabolism by use of 6563 stable isotope tracers. Environ. Health Perspect. 5-7, 145-153. 6564
Rabinowitz, M.B., Wetherill, G.W., Kopple, J.D., 1973. Lead metabolism in the normal human: 6565 Stable isotope studies. Science 182, 725-727. 6566
Rabinowitz, M.B., Wetherill, G.W., Kopple, J.D., 1976. Kinetic analysis of lead metabolism in 6567 healthy humans. J. Clin. Invest 58, 260-270. 6568
Rendall, R.E.G., Baily, P., Soskolne, C. L., 1975. The effect of particle size on absorption of inhaled 6569 lead. Am. Ind. Hyg. Assoc. J. 36, 207–213. 6570
Rhoads, K., Sanders, C.L., 1985. Lung clearance, translocation, and acute toxicity of arsenic, 6571 beryllium, cadmium, cobalt, lead, selenium, vanadium, and ytterbium oxides following 6572 deposition in rat lung. Environ. Res. 36, 359–378. 6573
Rothstein, A.; Hayes, A. D. (1960) The metabolism of mercury in the rat studied by isotope 6574 techniques. J. Pharmacol. Exp. Ther. 130, 166-176. 6575
Rubin, M.; Sliwinski, A.; Photias, M,; Feldman, M.; Zvaifler, N. (1967). Influence of chelation on 6576 gold metabolism in rats. Proc. Soc. Exp. Biol. Med. 124:290-296. 6577
Scheiman-Tagger, E., Brodie, A.G., 1964. Lead acetate as a marker of growing calcified tissues. 6578 Anat. Rec. 150, 435-440. 6579
Silva, A. J.; Fleshman, D. G.; Shore, B. (1973). The effects of penicillamine on the body burdens of 6580 several heavy metals. Health Phys. 24:535-539. 6581
Singh, N.P., Bennett, D.B., Wrenn, M.E., 1986. Concentrations of 210Pb and its states of equilibrium 6582 with 238U, 234U, and 230Th in U miners' lungs. Health Phys., 51, 501–507. 6583
Stradling, G.N., Davies, C.P., Moody, J.C., Gray, S.A., Wilson, I., Ellender, M., 2005. Biokinetics of 6584 thorium and daughter radionuclides after deposition as fluoride and hydroxide in the rat 6585 lung: implications for occupational exposure. NRPB-DA/05/2005, Chilton, UK. 6586
Strauss, H. W.; Harrison, K.; Langan, J. K.; Lebowitz, E.; Pitt, B. (1975). Thallium-201 for 6587 myocardial imaging. Circulation 51:641-645. 6588

DRAFT REPORT FOR CONSULTATION: DO NOT REFERENCE
166
Sugawa-Katayama, Y.; Koishi, H.; Danbara, H. (1975). Accumulation of gold in various organs of 6589 mice injected with gold thioglucose. J. Nutr. 105:957-962. 6590
Suzuki, M.; Morikawa, M.; Tomita, K.; Yoshida, A.; Suwo, M.; Matsushima, H.; Kato, M.; Ueda, N.; 6591 Yamada, H.; Hazue, M. (1978). Thallous chloride-201Tl – Fundamental studies on its 6592 behavior and clinical evaluation. Kaku Igaku. Japanese J. Nucl. Med. 15:27-40. 6593
Tipton, I.H., Cook, M.J., 1963. Trace elements in human tissue. Part II. Adult subjects from the 6594 United States. Health Phys. 9, 103-145. 6595
Vander, A.J., Taylor, D.L., Kalitis, K., Mouw, D.R., Victery, W., 1977. Renal handling of lead in 6596 dogs: Clearance studies. Am. J. Physiol. 233, F532-F538. 6597
Verbeeck, R.M., Lassuyt, C.J., Heijligers, H.J., Driessens, F.C., Vrolijk, J.W., 1981. Lattice 6598 parameters and cation distribution of solid solutions of calcium and lead hydroxyapatite. 6599 Calc. Tiss. Int. 33, 243-247. 6600
Victery, W., Vander, A.J., Mouw, D.R., 1979. Renal handling of lead in dogs, stop-flow analysis. 6601 Am. J. Physiol. 237, F408-F414. 6602
Vincent, J., 1957. Les remaniements de l'os compact marque a l'adie de plomb. Revue Belge de Path. 6603 et Med. Exper. 26, 168-172. 6604
Wells, A.C., Venn, J.B., Heard, M.J., 1975. Deposition in the lung and uptake to blood of motor 6605 exhaust labelled with Pb-203. In: Walton, W.H., McGovern, B. (Eds.), Inhaled Particles IV, 6606 pp. 175-189. Proceedings of a Symposium of the British Occupational Hygiene Society, 6607 Edinburgh. 6608
Yen, P. K., Shaw, J. H. 1977. Remodeling of compact bone studied with lead acetate as an intravital 6609 stain. J Dent. Res. 56, 961-966. 6610
6611 6612
6613

DRAFT REPORT FOR CONSULTATION: DO NOT REFERENCE
167
6614 10. BISMUTH (Z = 83) 6615
6616 10.1. Chemical forms in the workplace 6617 6618
(479) Bismuth is a metalloid which mainly occurs in oxidation state III. Arsenic and 6619 antimony are good chemical analogues of bismuth. Bismuth is encountered in industry in a 6620 variety of chemical and physical forms, including oxides, chlorides, fluorides, iodides, and 6621 sulphides. 6622
(480) Several isotopes of bismuth with short half-lives occur within the radioactive 6623 disintegration chains of actinium, radium and thorium. 6624 6625
Table 10-1. Isotopes of bismuth addressed in this report 6626 6627
Isotope Physical half-life Decay mode Bi-200 36.4 m EC, B+ Bi-201 108 m EC, B+ Bi-202 1.72 h EC, B+ Bi-203 11.76 h EC, B+ Bi-204 11.22 h EC, B+ Bi-205 15.31 d EC, B+ Bi-206 6.243 d EC, B+ Bi-207 32.9 y EC, B+ Bi-208 3.68E+5 y EC Bi-210a 5.013 d B-, A Bi-210m 3.04E+6 y A Bi-212 60.55 m B-, A Bi-213 45.59 m B-, A Bi-214a 19.9 m B-, A
a Data for these radionuclides are given in the printed copy of this report. Data for other radionuclides 6628 are given on accompanying electronic disk. 6629
6630 10.2. Routes of Intake 6631 6632 10.2.1. Inhalation 6633 6634 Absorption Types and parameter values 6635
(481) Very little information from which parameter values can be assessed is available 6636 from experimental studies of the behaviour of bismuth deposited in the respiratory tract. 6637
(482) Absorption parameter values and Types, and associated fA values for particulate 6638 forms of bismuth are given in Table 10-2. For radiation protection purposes, the most 6639 important exposures to radioisotopes of bismuth are as decay products of radon. Dose 6640 coefficients for isotopes of bismuth inhaled as radon decay products are given in the radon 6641 section, where factors such as the relevant aerosol size distribution are addressed. Otherwise, 6642 exposures to radioisotopes of bismuth occur most often as decay products associated with 6643 intakes of uranium, thorium or radium. 6644 6645 (a) Bismuth as a decay product of radon 6646
(483) In this section studies are considered in which 212Bi (half-life 61 minutes) formed 6647
DRAFT REPORT FOR CONSULTATION: DO NOT REFERENCE
168
from decay of 220Rn (half-life 56 seconds) 216Po (half-life 0.15 seconds) and 212Pb (half-life 6648 11 hours), or 214Bi (half-life 20 minutes) formed from decay of 222Rn (half-life 3.8 days), 6649 218Po (half-life 3.1 minutes) and 214Pb (half-life 27 minutes) was inhaled directly, while still 6650 airborne. For decay schemes, see the thorium and uranium sections. Studies in which bismuth 6651 ions were administered to the respiratory tract in a liquid medium, which might also be 6652 relevant to bismuth as a decay product of radon, are considered below in the section on 6653 particulate forms. 6654
(484) Drew (1971) reported that the tissue distributions of 212Pb and 212Bi activities were 6655 similar in rats following exposure to 220Rn (thoron) and its decay products for 2 days. 6656 However, the exposure situation was complex, because the 212Pb and 212Bi in tissues 6657 originated from inhalation of 220Rn and its decay within the body, inhalation of 212Pb and 6658 212Bi, and also their ingestion from food and preening of fur. It is therefore difficult to 6659 estimate how much of the 212Bi originated from intake of 212Bi, and how much from decay of 6660 212Pb in the body. 6661
(485) Butterweck et al. (2001, 2002) carried out volunteer experiments to determine the 6662 absorption rate of unattached radon progeny. (For further information see the lead inhalation 6663 section.) Volunteers inhaled an aerosol which was predominantly unattached radon progeny. 6664 Measurements were made of 222Rn, 214Pb and 214Bi in blood samples taken at the end of a 30-6665 minute exposure (Butterweck et al., 2002). In vivo measurements of the head and chest were 6666 carried out over a 30-minute period, starting approximately 7 minutes after exposure 6667 (Butterweck et al., 2001). No clearance from the head (other than physical decay) was 6668 observed over this period for 214Pb, indicating that a small fraction of the unattached 214Pb 6669 was absorbed rapidly to blood (sr >> 100 d–1), as measured by the blood sample, while the 6670 rest (fraction fb) was bound to tissues (or stationary mucus). Assuming a rapid dissolution 6671 rate (sr) of 1000 d–1 with fr=1.0 and an uptake rate from the bound state (sb) of 1.7 d–1, 6672 Butterweck et al. (2002) estimated values of fb in the range 0.7–0.85, for radon progeny 6673 (without distinguishing between 214Pb and 214Bi) from the blood measurements. However, 6674 Butterweck et al. (2002) also estimated “absorption rates” for 214Pb and 214Bi from their 6675 activities in the blood sample and the estimated respiratory tract deposition, assuming that 6676 absorption from respiratory tract to blood could be represented by a single rate constant (sr) 6677 i.e. fr =1 and fb =0, although this model seems inconsistent with the in vivo measurements. 6678 They obtained absorption half-times of ~60 minutes for 214Pb and ~25 minutes for 214Bi, 6679 suggesting that there was greater absorption of 214Bi than of 214Pb by the end of the exposure 6680 when the blood sample was taken. 6681
(486) Hursh et al. (1969) followed lung retention, blood concentration, urinary and fecal 6682 excretion of 212Pb in ten volunteers for up to 3 d after inhalation (by mouth) of an aerosol 6683 formed by mixing 212Pb (formed from decay of 220Rn/216Po) with natural room aerosol. (For 6684 further information see the lead inhalation section.) Measurements of 212Bi were also made, 6685 but because of its short half-life fecal excretion of 212Bi could not be determined. Initial 6686 deposition of 212Bi in the lungs was ~10% of the 212Pb activity, as expected because of its 6687 lower concentration in the air. Measurements of urinary excretion of 212Bi were reported for 6688 one subject. Hursh and Mercer (1970) measured 212Bi activities in blood and urine in four 6689 volunteers after inhalation of an aerosol formed by mixing 212Pb with natural room aerosol. 6690 (For further information see the lead inhalation section). However, the results were not 6691 reported “to conserve space and because the findings were in all cases similar to those 6692 reported earlier” with reference to Hursh et al. (1969). Marsh and Birchall (1999) used the 6693 measurements of urinary excretion of 212Bi reported by Hursh et al. (1969) to estimate the 6694 absorption rate for bismuth. They took account of ingrowth from decay of its parent 212Pb in 6695
DRAFT REPORT FOR CONSULTATION: DO NOT REFERENCE
169
the lungs and following systemic uptake. They assumed that absorption of both lead and 6696 bismuth could be represented by a single component i.e. fr = 1 and fb = 0. In the analysis the 6697 absorption half-time for lead was fixed at 10 hours. The best fit was obtained with an 6698 absorption half-time for bismuth of 13 hours, suggesting Type F behaviour. However, the 6699 authors noted that this value should be treated with caution as it was based on data from a 6700 single subject. A more detailed analysis of the results of human volunteer studies of inhaled 6701 radon progeny was carried out here (i.e. by the Task Groups), to estimate absorption 6702 parameter values appropriate for short-lived radon progeny, giving specific consideration to 6703 the rapid absorption phase and binding. (For further information see the lead inhalation 6704 section.) However, for the study by Hursh et al. (1969) the information available did not 6705 permit assessment of fb. 6706 6707 (b) Particulate aerosols 6708
(487) In all of the studies summarised below, except that of Greenhalgh et al. (1977) who 6709 administered 207BiCl3, isotopes of uranium or thorium with their decay products were 6710 administered by intratracheal instillation into rats, and measurements were made of the lung 6711 retention and tissue distribution of 228Th, 212Pb, 212Bi and 208Tl at times from 6 or 24 hours 6712 onwards. In all these studies the distributions of 212Bi (and 208Tl) were similar to those of the 6713 parent 212Pb. Because their physical half-lives are so short (61 minutes and 3 minutes 6714 respectively) measurements made at 6 hours onwards would be mainly of activity formed 6715 from decay of 212Pb within the body, rather than from intake of 212Bi. The similar 6716 distributions of 212Bi and 208Tl (allowing for the 36% branching ratio for the formation of 6717 208Tl from decay of 212Bi) to those of 212Pb might suggest that there was not rapid movement 6718 of 212Bi from the site (e.g. the lungs) in which it was formed by decay of 212Pb. However, 6719 212Bi (and 208Tl) would have grown in rapidly between dissection of the animals and 6720 measurements of activities in tissues. Thus the activities of 212Bi (and 208Tl) measured may 6721 have been significantly higher than those present in vivo, and without detailed information 6722 (which is not available) about the time which elapsed between dissection of the animals and 6723 measurements, it is not possible to correct for this and hence estimate the absorption rate of 6724 the bismuth from the respiratory tract. 6725 6726 Bismuth chloride (BiCl3) 6727
(488) Greenhalgh et al. (1977) followed the lung retention of 207Bi for about an hour after 6728 instillation of 207Bi instilled as BiCl3 solution into the bronchi of rabbits. There was little 6729 clearance in this time and the amount of 207Bi in blood after 90 minutes was <1% of that 6730 instilled. The authors estimated that the clearance half-time was greater than 1 day. This 6731 appears to have been a pilot study that was not followed up. 6732 6733 Bismuth nitrate (Bi(NO3)3) 6734
(489) Ballou et al. (1986) measured lung retention and tissue distribution of 232U, 228Th, 6735 224Ra, 212Pb, 212Bi and 208Tl at 24 hours after intratracheal instillation into rats of 232U nitrate 6736 with its decay products. (For further information, see the uranium inhalation section.) Moody 6737 et al. (1994a; Moody and Stradling, 1992) measured the tissue distribution of 228Th, 212Pb, 6738 212Bi and 208Tl, at times from 6 hours to 7 days after intratracheal instillation into rats of a 6739 nitrate solution of 228Th in equilibrium with its decay products. (For further information, see 6740 the thorium and lead inhalation sections.) In both studies the distributions of 212Bi (and 208Tl) 6741 were similar to those of 212Pb. However, no estimate could be made by the task group of the 6742 rate of absorption of the 212Bi from the lungs (see above). 6743
DRAFT REPORT FOR CONSULTATION: DO NOT REFERENCE
170
6744 Bismuth hydroxide (Bi(OH)3) 6745
(490) Moody et al. (1994b; Stradling et al., 2005) measured the tissue distributions of 6746 228Th, 212Pb, 212Bi and 208Tl, at times from 1 to 28 days after intratracheal instillation into rats 6747 of a suspension of 228Th hydroxide in equilibrium with its decay products. (For further 6748 information, see the thorium and lead inhalation sections.) The distributions of 212Bi (and 6749 208Tl) were similar to those of 212Pb. However, no estimate could be made here of the rate of 6750 absorption of the 212Bi from the lungs (see above). 6751 6752 Bismuth fluoride (BiCl3) 6753
(491) Moody et al. (1994b; Stradling et al., 2005) measured the tissue distributions of 6754 228Th, 212Pb, 212Bi and 208Tl, at times from 1 to 28 days after intratracheal instillation into rats 6755 of a suspension of 228Th fluoride in equilibrium with its decay products. (For further 6756 information, see the thorium and lead inhalation sections.) The distributions of 212Bi (and 6757 208Tl) were similar to those of 212Pb. However, no estimate could be made here of the rate of 6758 absorption of the 212Bi from the lungs (see above). 6759 6760 Thorium dioxide 6761
(492) Hodgson et al. (2000, 2003) measured the tissue distributions of 228Th, 212Pb, 212Bi 6762 and 208Tl, at times from 1 to 168 days after intratracheal instillation into rats of suspensions of 6763 232Th dioxide enriched with 228Th, in equilibrium with its decay products. (For further 6764 information, see the thorium and lead inhalation sections.) There was little absorption of the 6765 thorium itself, consistent with assignment to Type S. The activity of 212Pb in the lungs was 6766 lower than of that of the thorium, which was attributed to diffusion of 220Rn (thoron) and 6767 recoil of the progeny from alpha particle decay. The distributions of 212Bi (and 208Tl) were 6768 similar to those of 212Pb. However, no estimate could be made here of the rate of absorption 6769 of the 212Bi from the lungs (see above). 6770 6771 Decay products of bismuth formed in the respiratory tract 6772
(493) The general approach to treatment of decay products formed in the respiratory tract 6773 is described in Part 1, Section 3.2.3. In summary, it is expected that generally the rate at 6774 which a particle dissociates is determined by its matrix, and hence the physico-chemical form 6775 of the inhaled material. It is recognised that nuclei formed by alpha decay within a particle 6776 matrix may be expelled from it into the surrounding medium by recoil, but to implement this 6777 routinely would add greatly to the complexity of calculations. It is expected that the behaviour 6778 of soluble (e.g. Type F) material in the respiratory tract would depend on its elemental form, 6779 i.e. that of the decay product. Nevertheless, for simplicity, in this series of documents the 6780 absorption parameter values of the parent are, by default, applied to all members of the decay 6781 chain formed in the respiratory tract. Exceptions are made for noble gases formed as decay 6782 products, which are assumed to escape from the body directly, at a rate of 100 d–1, in addition 6783 to other routes of removal. 6784
(494) For decay schemes of bismuth isotopes in the natural decay series: 210Bi, 211Bi, 212Bi, 6785 and 214Bi, see the uranium and thorium sections. Studies specifically comparing the behaviour 6786 of bismuth with that of its decay product (thallium) are summarised here. 6787
(495) As noted above, measurements have been made of the tissue distributions of 212Bi 6788 and its decay product, 208Tl, following administration to rats of 228Th in various chemical 6789 forms (nitrate, hydroxide, fluoride, dioxide), in equilibrium with its decay products. In all 6790 these studies the distributions of 212Bi (and 208Tl) were similar to each other and those of the 6791

DRAFT REPORT FOR CONSULTATION: DO NOT REFERENCE
171
parent 212Pb. Because their physical half-lives are so short (61 minutes and 3 minutes 6792 respectively) measurements made at 6 hours onwards would be mainly of activity formed 6793 from decay of 212Pb within the body, rather than from intake of 212Bi (or 208Tl). However, the 6794 half-life of 208Tl (3 minutes) is so short that it would easily reach equilibrium with 212Bi 6795 between dissection of the animals and measurements of activities in tissues. It is not possible 6796 to correct for this ingrowth and hence estimate the absorption rate from the respiratory tract of 6797 the thallium formed as a decay product of bismuth. However, since the half-life of 208Tl is so 6798 short (as is that of 207Tl present in the 235U decay series, 5 minutes), the absorption rate would 6799 have to be very high to influence dose assessments. 6800 6801 Rapid dissolution rate for bismuth 6802
(496) Inferences drawn from the three studies outlined above, which might provide 6803 information on the rapid dissolution rate for bismuth, are contradictory. Greenhalgh et al. 6804 (1977) estimated that the lung retention half-time was greater than 1 day following instillation 6805 of 207BiCl3 into the bronchi of rabbits: much slower absorption than that of lead over the 6806 period (one hour) of measurement. Marsh and Birchall (1999) estimated the absorption rate 6807 for bismuth using measurements of urinary excretion of 212Bi by a volunteer following 6808 inhalation of attached radon decay products reported by Hursh et al. (1969). They assumed 6809 that absorption of both lead and bismuth could be represented by a single component i.e. fr = 6810 1 and fb = 0. The best fit was obtained with an absorption half-time for bismuth of 13 hours, 6811 very similar to that obtained for lead, i.e. sr ~1 d–1. Butterweck et al. (2002) assessed that 6812 absorption of 214Bi was faster than that of 214Pb during inhalation of unattached radon 6813 progeny. 6814
(497) The main use for absorption parameter values for bismuth is in assessing doses from 6815 inhaled radon decay products. A value of sr of 1 d–1, based on the assessment of Marsh and 6816 Birchall (1999) is adopted here. The short-lived isotopes of bismuth (214Bi, 212Bi and 211Bi) 6817 formed as a decay product of radon have radioactive decay constants >> 1 d-1, so the bismuth 6818 absorption rate will have little influence in assessing doses from inhaled radon decay 6819 products. 6820 6821 Extent of binding of bismuth to the respiratory tract 6822
(498) There is insufficient information to estimate the extent of any bound state. It is 6823 therefore assumed by default that fb = 0. 6824 6825

DRAFT REPORT FOR CONSULTATION: DO NOT REFERENCE
172
Table 10-2. Absorption parameter values for inhaled and ingested bismuth 6826 6827
Inhaled particulate materials
Absorption parameter valuesa
Absorption from the alimentary tract, fA
fr sr (d–1) ss (d–1) Default parameter valuesc Absorption Type
Assigned forms
F Bismuth as a decay product of radon
1 1 – 0.05
M All unspecified formsd 0.2 1 0.005 0.01 S — 0.01 1 1x10⁻⁴ 5x10⁻⁴ Ingested material All forms 0.05 a It is assumed that for bismuth the bound state can be neglected, i.e. fb = 0. The values of sr for Type F, M and 6828
S forms of bismuth (1 d–1) are element-specific. 6829 b For inhaled material deposited in the respiratory tract and subsequent cleared by particle transport to the 6830
alimentary tract, the default fA values for inhaled materials are applied: i.e. the product of fr for the absorption 6831 Type (or specific value where given) and the fA value for ingested soluble forms of bismuth (0.05). 6832
c Materials (e.g. bismuth as a decay product of radon) are listed here where there is sufficient information to 6833 assign to a default absorption Type, but not to give specific parameter values (see text). 6834
d Default Type M is recommended for use in the absence of specific information, i.e. if the form is unknown, 6835 or if the form is known but there is no information available on the absorption of that form from the 6836 respiratory tract. 6837
6838 10.2.2. Ingestion 6839 6840
(499) There are few available data on bismuth absorption in human and animals. It has 6841 been stated that basic salts of bismuth are only poorly absorbed from the gastrointestinal tract 6842 (Sollman, 1957) and suggested that the fractional absorption of dietary bismuth from the 6843 gastrointestinal tract is about 0.08 (ICRP, 1975). 6844
(500) The absorption of bismuth from five 205Bi compounds was studied in man (Dresow 6845 at al., 1992). From single oral doses of these five compounds, less than 0.1% bismuth was 6846 absorbed and excreted in the urine, with a significantly higher absorption from the colloidal 6847 subcitrate and gallate compounds (about 0.04%) than from salicylate, nitrate and aluminate 6848 (0.002 to 0.005%). Koch et al. have studied the pharmacokinetics of bismuth following 6849 administration of single or multiple oral doses of ranitidine bismuth citrate to healthy subjects 6850 (Koch et al., 1996a,b). They showed that bismuth absorption from ranitidine bismuth citrate 6851 was below 0.5% of the dose, and bismuth elimination was predominantly by renal secretion. 6852 Boertz et al. (2009) studied the biotransformation and excretion of bismuth after ingestion of 6853 215 mg of colloidal bismuth subcitrate by 20 male volunteers. Bismuth absorption in the 6854 stomach and upper intestine was very low, and a total of 0.03 to 1.2% of the ingested Bi was 6855 eliminated in the urine during the 56 hours test. 6856
(501) The bioavailability of 205Bi from various oral bismuth preparations was also studied 6857 in rats (Dresow et al., 1991). The intestinal absorption, calculated from 205Bi whole body 6858 retention and accumulated urinary excretion was very low, but significantly higher (about 6859 0.3%) from bismuth citrates (Bi citrate and colloidal Bi subcitrate) as compared to bismuth 6860 nitrate, salicylate, gallate and alluminate (0.04 to 0.11%). 6861
(502) The ICRP Publication 30 recommended an absorption value of 0.05 to apply to all 6862

DRAFT REPORT FOR CONSULTATION: DO NOT REFERENCE
173
chemical forms (ICRP, 1980). 6863 (503) The most recent studies confirm this absorption value for bismuth and an fA of 0.05 6864
is therefore adopted here for direct ingestion of all chemical forms. 6865 6866 10.2.3. Systemic Distribution, Retention and Excretion 6867 6868 10.2.3.1. Summary of the database 6869 6870
(504) Bismuth has been used since the late 1700s as a therapeutic agent for a number of 6871 disorders of the human body. For example, it has been used externally on burns and inflamed 6872 skin; orally for gastrointestinal inflammations, ulcers, and as an opaque medium for x-ray 6873 examinations; and intramuscularly for treatment for syphilis (Sollman, 1957). Serious 6874 adverse affects including death have sometimes occurred. Successful treatments often have 6875 involved maintenance of maximal nontoxic concentrations of bismuth. The optimal dosages 6876 have been worked out by measurement and estimation of absorption, distribution, and 6877 excretion, both clinically and in animal studies. 6878
(505) The systemic biokinetics of bismuth has been found to vary with the route of 6879 administration and the form administered. Concentration of particulate or colloidal forms is 6880 particularly high in the reticuloendothelial (RE) system (Eridani et al., 1964; Einhorn et al., 6881 1964). 6882
(506) In the early period after acute input to blood, most forms of bismuth are rapidly 6883 cleared from plasma to extracellular fluids and excretion pathways. For example, 75% or 6884 more of bismuth in human plasma intravenously injected into rats or bismuth citrate 6885 intravenously injected into humans left the circulation in the first 5-10 min (Hursh and 6886 Brown, 1969; Coenegracht and Dorleyn, 1961; Newton et al., 2001). After the rapid 6887 equilibration between blood plasma and extracellular fluids the disappearance of bismuth 6888 from blood is much slower. In a human subject receiving 207Bi citrate by intravenous 6889 injection, about 6% of the injected amount remained in blood after 1 h, 1% after 7 h, and 6890 0.5% after 1 d (Newton et al., 2001). 6891
(507) Data on the distribution of bismuth in blood are inconsistent. Some investigators 6892 have concluded that bismuth shows little affinity for erythrocytes (Benet, 1991; Koch et al., 6893 1996a), while others have concluded that bismuth in blood is present primarily in erythrocytes 6894 (D’Souza and Francis, 1987; Rao and Feldman, 1990; Newton et al., 2001). 6895
(508) In studies involving continued oral dosing of human subjects for 6-8 weeks with 6896 bismuth compounds, there was a continual rise in plasma concentration and the urinary 6897 excretion rate (Froomes et al., 1989). Apparent steady-state levels were reached after about 6898 18 days (range 7-29 days). Renal clearance of bismuth from normal volunteers and gastritis 6899 patients averaged 22.2 ml/min. Elimination half-lives based on declining concentrations of 6900 bismuth in plasma and urine were 20.7 and 21.6 days, respectively. Similarly, in patients with 6901 bismuth encephalopathy, Boiteau et al. (1976) found plasma elimination half-times of about 6902 13-22 days and urine half-times of about 10-20 days. Data of Loiseau and coworkers (1976) 6903 indicated a half-time in plasma of about 23 days. 6904
(509) The pharmacokinetics of bismuth was studied in 60 healthy male subjects, ages 19-6905 40 y, for single oral administration of ranitidine bismuth citrate and for twice daily doses for 6906 28 days in 27 healthy male subjects, ages 20-49 y (Koch et al., 1996a,b). After single 6907 administration the concentration of bismuth in plasma typically peaked after 30-45 min and 6908 declined with a half-time initially on the order of 1 h. The bismuth concentrations in plasma 6909 for 15 subjects measured up to 154 d after the last intake indicated three components of 6910
DRAFT REPORT FOR CONSULTATION: DO NOT REFERENCE
174
removal with average half-times of 20 min, 11.1 h, and 20.7 d. 6911 (510) Gavey et al. (1989) measured the bismuth concentration in plasma and urine in nine 6912
patients before, during, and after treatment with tripotassium dicitrato bismuthate for six 6913 weeks. The 24-h urinary clearance of bismuth was estimated as 19.4 and 19.8 plasma 6914 volumes per day based on data for 3 and 6 weeks after the start of exposure, assuming a 6915 plasma volume of 3000 ml. 6916
(511) Most forms of bismuth show high deposition in the kidneys and subsequent 6917 clearance to urine (Durbin, 1960; Eridani et al., 1964; Matthews et al., 1964; Russ et al., 6918 1975; Pieri and Wegmann, 1981; Slikkerveer and de Wolff, 1989). Human subjects injected 6919 with bismuth citrate excreted a third or more of the administered bismuth in urine during the 6920 first day (Coenegracht and Dorleyn, 1961; Newton et al., 2001). Lower excretion rates have 6921 been observed for some forms used in clinical studies. For example, about 13% of bismuth 6922 injected as citrate adsorbed on charcoal was excreted in urine during the first day 6923 (Coenegracht and Dorleyn, 1961), 2-3% of bismuth injected as phosphate appeared in urine 6924 the first day (Coenegracht and Dorleyn, 1961), and as little as 5% of bismuth injected as a 6925 salicylate suspension is excreted in urine during the first 3 wk after injection (Sollmann, 6926 1957). Microscopic studies of the epithelium of the proximal renal tubules have shown 6927 accumulations of bismuth in the nucleus, cytoplasm, and possibly the lysosomes (Slikkerveer 6928 and de Wolff, 1989). 6929
(512) Clinical data indicate that fecal excretion constitutes 4-10% of total excretion of 6930 bismuth with oil solutions, 6-22% with "watery" solutions, and 12% with oil suspensions 6931 (Sollmann, 1957). In rats and rabbits, fecal excretion arising to a large extent from biliary 6932 secretion accounts for 10-20% of the total excretion of bismuth (Pieri and Wegmann, 1981; 6933 Vienet et al., 1983, Gregus and Klaassen, 1986). 6934
(513) In a study of the fate of intravenously injected tracer doses of 206Bi in human 6935 subjects, Coenegracht and Dorleyn (1961) concluded from in vivo measurements that 206Bi 6936 injected as citrate was taken up and retained to a large extent by the liver and spleen. They 6937 suggested that injected bismuth citrate may form complexes with plasma proteins and that the 6938 size of the bismuth protein complexes will largely determine the initial distribution of 6939 bismuth in the body. A high rate of urinary excretion of 206Bi in the first few days after 6940 injection presumably represented activity that did not attach to plasma proteins or was 6941 released fairly quickly from these proteins. 6942
(514) Extended retention of a portion of the administered bismuth has been reported for 6943 relatively insoluble bismuth compounds used in clinical applications (Sollmann, 1957). 6944 Autopsy measurements have been interpreted as indicating that the total bismuth stored in the 6945 body for an extended period may be as much as 7% of the administered amount (Sollmann, 6946 1957), with approximate relative concentrations (wet weight) of bismuth in different organs 6947 being as follows: kidney, 33; liver, 6.8; spleen, 1.6; colon, 1.3; lung, 0.9; brain, 0.6; and 6948 blood, 0.5 (Sollmann and Seifter, 1942). The kidneys and liver each contained nearly 10% of 6949 the total found in the body (Sollman, 1957). 6950
(515) Buijs and coworkers (1985) found 207Bi (T1/2 = 38 y) remaining in two human 6951 subjects treated a quarter century earlier with 206Bi injections contaminated with small 6952 amounts of 207Bi. They estimated from measurements of the rate of decline of total-body 6953 207Bi and from assumptions on the early rate of excretion of bismuth that 7% of injected 6954 bismuth is retained with a half-time close to 20 y. Buijs's estimate applies to bismuth injected 6955 as phosphate or as citrate adsorbed on charcoal, the two forms known to be administered to at 6956 least one of the subjects. These two forms are taken up to some extent by the RE system 6957 (Coenegracht and Dorleyn, 1961), and it appeared from external measurements that the long-6958

DRAFT REPORT FOR CONSULTATION: DO NOT REFERENCE
175
retained activity in the two human subjects was associated largely with organs of this system 6959 (Buijs et al., 1985). 6960
(516) Newton et al. (2001) studied the biokinetics of bismuth in a healthy male volunteer 6961 after intravenous injection with 207Bi citrate. They estimated that the liver contained 60% of 6962 the body content at 3 d. An estimated 55% was lost in excreta, primarily urine, during the first 6963 47 h. Longer-term losses were much slower. Approximately 0.6% of the injected amount 6964 remained at 924 d. The long-term half-time was estimated as 1.9 y. 6965
(517) Studies on rats indicate elevated deposition in the kidneys and sometimes in the 6966 liver, but the systemic distribution varies with the form of bismuth reaching blood. For 6967 example, the ratio of the concentration in the kidneys to that in the liver averaged roughly 15 6968 at 2 h after intravenous (iv) injection with bismuth nitrate (Gregus and Klaassen, 1986); 10 at 6969 2 h after iv injection of bismuth in human plasma (Hursh and Brown, 1969); 5 at 2-48 h after 6970 iv injection with bismuth citrate (Pieri and Wegmann, 1981); 50 at 6-48 h after intraperitoneal 6971 injection with bismuth citrate (Russ et al., 1975); 20 at 72-144 h after iv injection with 6972 bismuth nitrate (Vienet et al., 1983); and 40 at 2-6 h after intraperitoneal injection of bismuth 6973 in a carbonate buffer (Zidenberg-Cherr et al., 1987). 6974
(518) In studies on rabbits, the liver was generally a more important repository for bismuth 6975 than the kidneys (van den Werff, 1965). The systemic distribution of 206Bi was determined 6976 from a few days up to about 2 wk after intravenous administration of different forms, 6977 including citrate or phosphate in 5% charcoal suspension in saline, nitrate, phosphate in 5% 6978 glucose, and acetate in saline solution. Distributions varied considerably from one form of 6979 206Bi to another. As averages over all animals studied, all forms of 206Bi administered, and all 6980 observation times, the liver, kidneys, skeleton, and remaining tissues contained about 38%, 6981 18%, 17%, and 22%, respectively, of the body burden. Typically, the portion of the total-body 6982 content in the skeleton increased with time while the portions in liver and kidneys decreased 6983 with time. 6984
(519) Deposition of bismuth in bone has also been observed in rats (Eridani et al., 1964; 6985 Hursh and Brown, 1969; Russ et al., 1975; Gaucher et al., 1979; Gregus and Klaassen, 1986). 6986 Reported values for uptake and retention by bone are highly variable and may depend on the 6987 administered form of bismuth. At 4 d after intramuscular injection of 206Bi into rats as BiOCl 6988 or BiO(OH), 14.4% of the administered dosage was found in the kidneys, 6.6% in liver, 1.5% 6989 in bone, and 0.6% in muscle (Durbin, 1960). About three-fourths of the administered activity 6990 was excreted in the first four days, mainly in urine. In rats receiving 206Bi citrate by 6991 intraperitoneal injection, total-body activity declined from about 59% of the administered 6992 activity at 6 h to about 12-18% at 3-5 d (Russ et al., 1975). Bone contained about 4-7% of the 6993 administered amount at 0.5 h and roughly 1% from 1 to 6 d. The kidney content declined 6994 from almost 40% of the administered amount at 0.5 h to roughly 12% at 3-6 d. The liver 6995 content was <1% of the administered amount from 0-6 d. 6996
(520) Data for dogs injected with 224Ra (Lloyd et al., 1982) or 228Th indicate that there is 6997 considerable migration of 212Bi (T1/2 = 60.6 min) from its parent, 212Pb, in bone surfaces, red 6998 blood cells, and some soft tissues, and that much of the migrating bismuth accumulates in the 6999 kidneys or is quickly eliminated in urine. In human subjects who inhaled 212Pb, 212Bi escaped 7000 more quickly from red blood cells than did its parent 212Pb, and the rate of urinary excretion 7001 of 212Bi was 3-4 times that of 212Pb (Hursh et al, 1969). In bone, 210Bi tends to remain to a 7002 large extent with 210Pb at times remote from exposure, indicating that bismuth probably does 7003 not readily escape from Pb in bone volume. 7004 7005

DRAFT REPORT FOR CONSULTATION: DO NOT REFERENCE
176
10.2.3.2. Systemic model 7006 7007
(521) The structure of the biokinetic model for systemic bismuth is shown in Figure 10-1. 7008 Transfer coefficients are listed in Table 10-3. 7009
(522) It is assumed that bismuth leaves blood plasma at the rate 400 d-1 (half-time of 7010 approximately 2.5 min) with three-fourths moving to the fast-turnover soft-tissue 7011 compartment ST0 representing extracellular fluids in the present model. Outflow of the 7012 remaining one-fourth is divided as follows: 20% to urinary bladder contents, 4% to the 7013 contents of the right colon, 30% to liver (compartment Liver 0), 30% to the urinary path, 5% 7014 to other kidney tissue, 5% to bone surfaces, 0.5% to RBC, 1.3% to the slow-turnover soft-7015 tissue compartment ST2, and the remaining 4.2% to the intermediate-term soft-tissue 7016 compartment ST1. Half the activity deposited on bone surfaces is assigned to cortical bone 7017 and half to trabecular bone. The following removal half-times are assigned: 15 min from ST0 7018 to plasma; 2 d from Liver 0, with 60% moving to the small intestine contents in bile and 40% 7019 moving to Liver 1; 10 d from Liver 1 to Plasma; 1 d from the urinary path to urinary bladder 7020 contents; 5 d from other kidney tissue to Plasma; 20 d from bone surface or ST1 to Plasma; 4 7021 d from RBC to Plasma; and 600 d from ST2 to Plasma. 7022 7023
7024 7025
Figure 10-1. Structure of the biokinetic model for systemic bismuth. 7026 7027
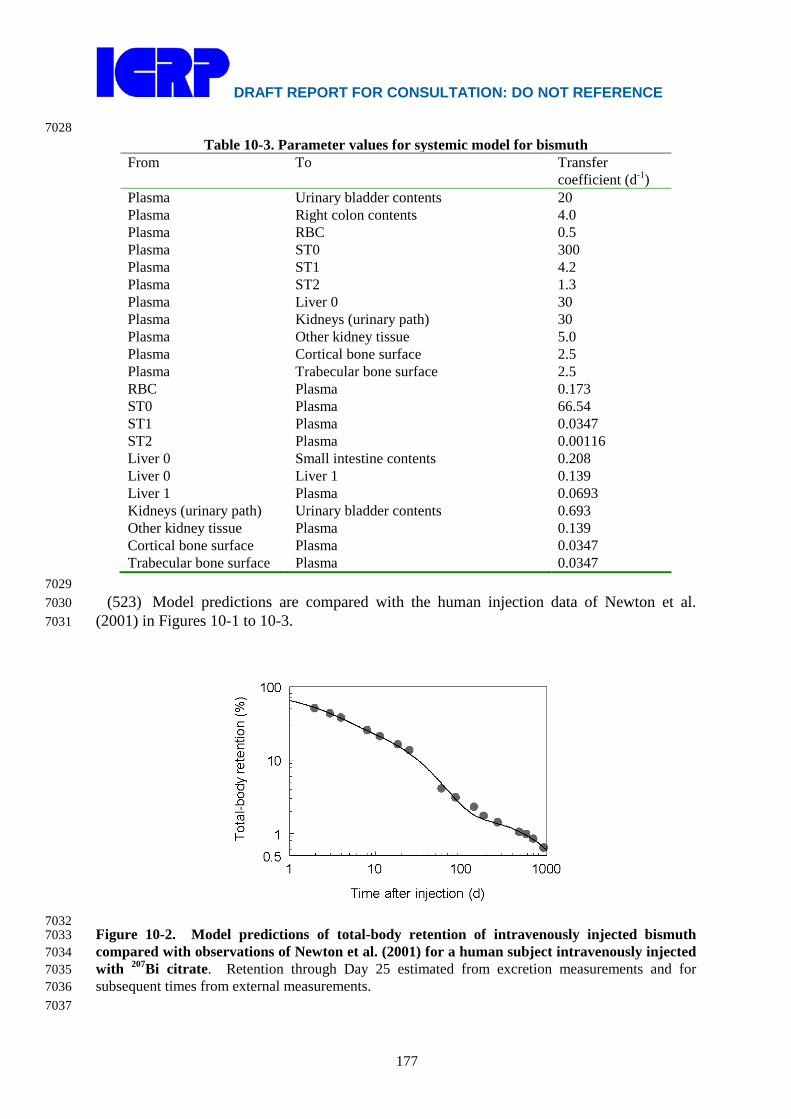
DRAFT REPORT FOR CONSULTATION: DO NOT REFERENCE
177
7028 Table 10-3. Parameter values for systemic model for bismuth
From To Transfer coefficient (d-1)
Plasma Urinary bladder contents 20 Plasma Right colon contents 4.0 Plasma RBC 0.5 Plasma ST0 300 Plasma ST1 4.2 Plasma ST2 1.3 Plasma Liver 0 30 Plasma Kidneys (urinary path) 30 Plasma Other kidney tissue 5.0 Plasma Cortical bone surface 2.5 Plasma Trabecular bone surface 2.5 RBC Plasma 0.173 ST0 Plasma 66.54 ST1 Plasma 0.0347 ST2 Plasma 0.00116 Liver 0 Small intestine contents 0.208 Liver 0 Liver 1 0.139 Liver 1 Plasma 0.0693 Kidneys (urinary path) Urinary bladder contents 0.693 Other kidney tissue Plasma 0.139 Cortical bone surface Plasma 0.0347 Trabecular bone surface Plasma 0.0347
7029 (523) Model predictions are compared with the human injection data of Newton et al. 7030
(2001) in Figures 10-1 to 10-3. 7031
7032 Figure 10-2. Model predictions of total-body retention of intravenously injected bismuth 7033 compared with observations of Newton et al. (2001) for a human subject intravenously injected 7034 with 207Bi citrate. Retention through Day 25 estimated from excretion measurements and for 7035 subsequent times from external measurements. 7036 7037

DRAFT REPORT FOR CONSULTATION: DO NOT REFERENCE
178
7038 Figure 10-3. Model predictions of blood retention of intravenously injected bismuth compared 7039 with observations of Newton et al. (2001) for a human subject intravenously injected with 207Bi 7040 citrate. 7041 7042
7043 Figure 10-4. Model predictions of cumulative urinary and faecal excretion of intravenously 7044 injected bismuth compared with observations of Newton et al. (2001) for a human subject 7045 intravenously injected with 207Bi citrate. 7046 7047 10.2.3.3. Treatment of radioactive progeny 7048 7049
(524) The members of bismuth chains considered in the calculations of dose coefficients 7050 for bismuth isotopes are isotopes of lead, polonium, thallium, bismuth, or mercury. The 7051 systemic models for these elements as progeny of bismuth isotopes are the same as their 7052 systemic models as progeny of lead isotopes. They are described in the section on lead. 7053 7054 10.3. Individual monitoring 7055 7056

DRAFT REPORT FOR CONSULTATION: DO NOT REFERENCE
179
210 Bi 7057 (525) Urine bioassay is used for the monitoring of 210 Bi. 7058
7059 Isotope Monitoring
Technique Method of Measurement
Typical Detection Limit
Achievable detection limit
210 Bi Urine Bioassay γ-ray spectrometry 1-5 Bq/L 0.9Bq/L 7060 214 Bi 7061
(526) Whole Body counting is used for the monitoring of 214 Bi. 7062 7063
Isotope Monitoring Technique
Method of Measurement
Typical Detection Limit
Achievable detection limit
214 Bi Whole Body Counting
γ-ray spectrometry 200 Bq 36 Bq
7064 7065
References 7066 7067 Ballou, J.E., Gies, R.A., Case, A.C., Haggard, D.L., Buschbom, R.L., Ryan, J.L., 1986. Deposition 7068
and early disposition of inhaled 233UO2(NO3)2 and 232UO2(NO3)2 in the rat. Health Phys. 51, 7069 755–771. 7070
Benet, L.Z., 1991. Safety and pharmacokinetics: Colloidal bismuth subcitrate. Scand. J. 7071 Gastroenterol. 26 (Suppl. 185), 29-35. 7072
Boertz, J., Hartmann, L., Sulkowski, M., Hippler, J., Mosel, F., Diaz-Bone, R., Michalke, K., 7073 Rettenmeier, A., Hirner, A., 2009. Determination of trimethylbismuth in the human body 7074 after ingestion of cooloidal bismuth subcitrate. Drug Metabolism and Disposition. 37 (2): 7075 352-358; 7076
Boiteau, H.L., Cler, J.M., Mathe, J.F., Delobel, R., Feve, J.R., 1976. Relations entre l'evolution des 7077 encephalopathies bismuthiques et les taux de bismuth dans le sang et dans les urines. Eur. J. 7078 Toxicol. 9, 233-239. 7079
Buijs, W. C.; Corstens, F.H., Beentjes, L.B., 1985. ong-term retention of 207Bi in the human body 7080 after injection of 206Bi. Health Phys. 49, 1267-1269. 7081
Butterweck, G., Schuler, Ch., Vezzù, G., Müller, R., Marsh, J.W., Thrift, S., Birchall, A., 2002. 7082 Experimental determination of the absorption rate of unattached radon progeny from 7083 respiratory tract to blood. Radiat Prot Dosim. 102, 343–348. 7084
Butterweck, G., Vezzù, G., Schuler, Ch., Müller, R., Marsh, J.W., Thrift, S., Birchall, A., 2001. In-7085 vivo measurement of unattached radon progeny deposited in the human respiratory tract. 7086 Radiat. Prot. Dosim. 94, 247–250. 7087
Coenegracht, J.M., Dorleyn, M., 1961. The distribution of intravenously administered tracer doses of 7088 Bi-206 compounds in the human body. J. Belge de Radiologie 44, 485-504. 7089
D’Souza, R.W., Francis, W.R., 1987. Bioavailability and pharmacokinetics of bismuth in the rat. 7090 Pharm. Res. 4:S115 (abstract). 7091
Dresow, B., Fisher, R., Gabbe, E., Wendel, J., Heinrich, H., 1992. Bismuth absorption from 205Bi-7092 labelled pharmaceutical bismuth compounds used in the treatment of peptic ulcer disease. 7093 Scan. J. Gastroenterol. 27(4): 333-336. 7094
Dresow, B., Nielsen, P., Fisher, R., Wendel, J. Gabbe, E., Heinrich, H., 1991. Bioavailibility of 7095 bismuth from 205Bi-labelled pharmaceutical oral Bi-preparations in rats. Arch. Toxicol. 7096 65(8), 646-650. 7097
Drew, R.T., 1971. 212Pb distribution studies in the rat. Health. Phys. 20, 617–623. 7098

DRAFT REPORT FOR CONSULTATION: DO NOT REFERENCE
180
Durbin, P.W., 1960. Metabolic characteristics within a chemical family. Health Phys. 2, 225-238. 7099 Einhorn, J., Engstedt, L., Franzen, S., Lundell, G., 1964. Distribution of colloidal bismuth 7100
intravenously and intraarterially administered in man. Acta Radiol. 2, 443-448. 7101 Eridani, S., Balzarini, M., Taglioretti, D., 1964. The distribution of radiobismuth in the rat. Br. J. 7102
Radiol. 37, 311-314. 7103 Froomes, P.R.A., Wan, A.T., Keech, A.C., McNeil, J.J., McLean, A.J., 1989. Absorption and 7104
elimination of bismuth from oral doses of tripotassium dicitrato bismuthate. Eur. J. Clin. 7105 Pharmacol. 37, 533-536. 7106
Gaucher, A., Netter, P., Faure, G., 1979 Bismuth-induced osteoarthropathies. Med. J. Aust. 24:129-7107 130. 7108
Gavey, C.J., Szeto, M.-L., Nwokolo, C.U., Sercombe, J., Pounder, R.E., 1989. Bismuth accumulates 7109 in the body during treatment with tripotassium dicitrato bismuthate. Aliment. Pharmacol. 7110 Therap. 3, 21-28. 7111
Greenhalgh, J.R., James, A.C., Smith, H., 1977. Clearance of radon daughters from the lung. 7112 NRPB/R&D1 Annual Research and Development Report 1976 pp. 49–51, Chilton, UK. 7113
Gregus, Z., Klaassen, C.D., 1986. Disposition of metals in rats: a comparative study of fecal, urinary, 7114 and biliary excretion and tissue distribution of eighteen metals. Toxicol. Appl. Pharmacol. 7115 85, 24-38. 7116
Hodgson, S.A., Rance, E.R., Stradling, G.N., Hodgson, A., Fell, T.P., Youngman, M.J., Moody, J.C., 7117 Ansoborlo, E., 2000. Biokinetics of thorium dioxide and its decay products in the rat after 7118 alveolar deposition: implications for human exposure. NRPB-M1192, Chilton, UK. 7119
Hodgson, S.A., Stradling, G.N., Hodgson, A., Smith, T.J., Youngman, M.J., Moody, J.C., Ansoborlo, E., 7120 2003. Biokinetics and assessment of intake of thorium dioxide. Radiat. Prot. Dosim. 105, 115–7121 118. 7122
Hursh, J. B., Brown, C., 1969. Tissue distribution of 212Bi in rats. Proc. Soc. Exp. Biol. Med. 7123 131:116-120. 7124
Hursh, J.B., Mercer, T.T., 1970. Measurement of 212Pb loss rate from human lungs. J. Appl. Physiol 7125 28, 268–274. 7126
Hursh, J.B., Schraub, A., Sattler, E.L., Hofmann, H.P., 1969. Fate of 212Pb inhaled by human subjects. 7127 Health Phys. 16, 257–267. 7128
ICRP, 1980. Limits for intakes of radionuclides by workers. ICRP Publication 30. Part 2. Oxford: 7129 Pergamon Press. 7130
ICRP 1975. Reference Man: Anatomical, Physiological and Metabolic characteristics. ICRP 7131 Publication 23. Oxford, Pergamon Press. 7132
Koch, K.M., Davis, I.M., Gooding, A.E., Yin, Y., 1996a. Pharmacokinetics of bismuth and ranitidine 7133 following single doses of ranitidine bismuth citrate. Br. J. Clin. Pharmacol. 42, 201-205. 7134
Koch, K.M., Kerr, B.M., Gooding, A.E., Davis, I.M., 1996b. Pharmacokinetics of bismuth and 7135 ranitidine following multiple doses of ranitidine bismuth citrate. Br. J. Clin. Pharmacol. 7136 42:207-211. 7137
Lloyd, R.D., Mays, C.W., Taylor, G.N., Atherton, D.R., Bruenger, F.W., Jones, C.W., 1982. Radium 7138 retention, distribution, and dosimetry in beagles. Radiat. Res. 92, 280-295. 7139
Loiseau, P., Henry, P., Jallon, P., Legroux, M., 1976. Encephalopathies myocloniques iatrogenes aux 7140 sels de bismuth. J. Neurol. Sci. 27, 133-143. 7141
Marsh, J.W., Birchall, A., 1999. Determination of lung-to-blood absorption rates for lead and bismuth 7142 that are appropriate for radon progeny. Radiat. Prot. Dosim. 83, 331–337. 7143
Matthews, C.M.E., Dempster, W.J., Kapros, C., Kountz, S., 1964. The effect of bismuth 206 7144 irradiation on survival of skin homografts. Br. J. Radiol. 37, 306-310. 7145
Moody, J.C., Davies, C.P., Stradling, G.N., 1994b. Biokinetics of thorium and daughter radionuclides 7146 after deposition in the rat lung as fluoride and hydroxide. In: Mohr U., Dungworth, D.L., 7147 Mauderly, J.L., Oberdörster, G (Eds.), Proc. Fourth International Inhalation Symposium, 7148 Hannover, March 1–5, 1993. Toxic and Carcinogenic Effects of Solid Particles in the 7149 Respiratory System, pp. 611–614. 7150
DRAFT REPORT FOR CONSULTATION: DO NOT REFERENCE
181
Moody, J.C., Stradling, G.N., 1992. Biokinetics of thorium and daughter radionuclides after 7151 deposition in the rat lung. J. Aerosol Sci. 23, S523–S526. 7152
Moody, J.C., Stradling, G.N., Pearce, M.J., Gray, S.A., 1994a. Biokinetics of Thorium and Daughter 7153 Radionuclides after Deposition in the Rat Lung as Nitrate: Implications for Human 7154 Exposure. NRPB-M525, Chilton, UK. 7155
Newton, D., Talbot, R.J., Priest, N.D., 2001. Human biokinetics of injected bismuth-207. Human 7156 Exper. Toxicol. 20, 601-609. 7157
Pieri, F., Wegmann, R., 1981. Radiopharmaceutical study of Bi-citrate in the rat. Compartmental 7158 distribution. Cell. Molecul. Biol. 27, 57-60. 7159
Rao, N., Feldman, S., 1990. Disposition of bismuth in the rat: I. Red blood cell and plasma protein 7160 binding. Pharm. Res. 7, 188-191. 7161
Russ, G. A., Bigler, R.E., Tilbury, R.S., Woodard, H.Q., Laughlin, J.S., 1975. Metabolic studies with 7162 radiobismuth. I. Retention and distribution of 206Bi in the normal rat. Radiat. Res. 63, 443-7163 454. 7164
Slikkerveer, A., de Wolff, F.A., 1989. Pharmacokinetics and toxicity of bismuth compounds. Med. 7165 Toxicol. Adverse Drug Exp. 4, 303-323. 7166
Sollmann, T.A., 1957. Manual of Pharmacology and its Applications to Therapeutics and Toxicology. 7167 Philadelphia: W.B. Saunders Co. 7168
Sollmann, T., Seifter, J., 1942. Intravenous injections of soluble bismuth compounds: their toxicity, 7169 and their sojourn in the blood and organs. J. Pharmacol. Exp. Ther. 74, 134-154. 7170
Stradling, G.N., Davies, C.P., Moody, J.C., Gray, S.A., Wilson, I., Ellender, M., 2005. Biokinetics of 7171 thorium and daughter radionuclides after deposition as fluoride and hydroxide in the rat 7172 lung: implications for occupational exposure. NRPB-DA/05/2005, Chilton, UK. 7173
Van der Werff, J. Th., 1965. Radioactive bismuth 206Bi. Experimental studies and clinical 7174 applications. Acta Radiological Suppl. 243, 1-89. 7175
Vienet, R., Bouvet, P., Istin, M., 1983. Kinetics and distribution of 206Bi in the rat and the rabbit: a 7176 model. Int. J. Appl. Radiat. Isot. 34, 747-753. 7177
Zidenberg-Cherr, S., Parks, N.J., Keen, C.L., 1987. Tissue and subcellular distribution of bismuth 7178 radiotracer in the rat: considerations of cytotoxicity and microdosimetry for bismuth 7179 radiopharmaceuticals. Radiat. Res. 111, 119-129. 7180
7181 7182
7183
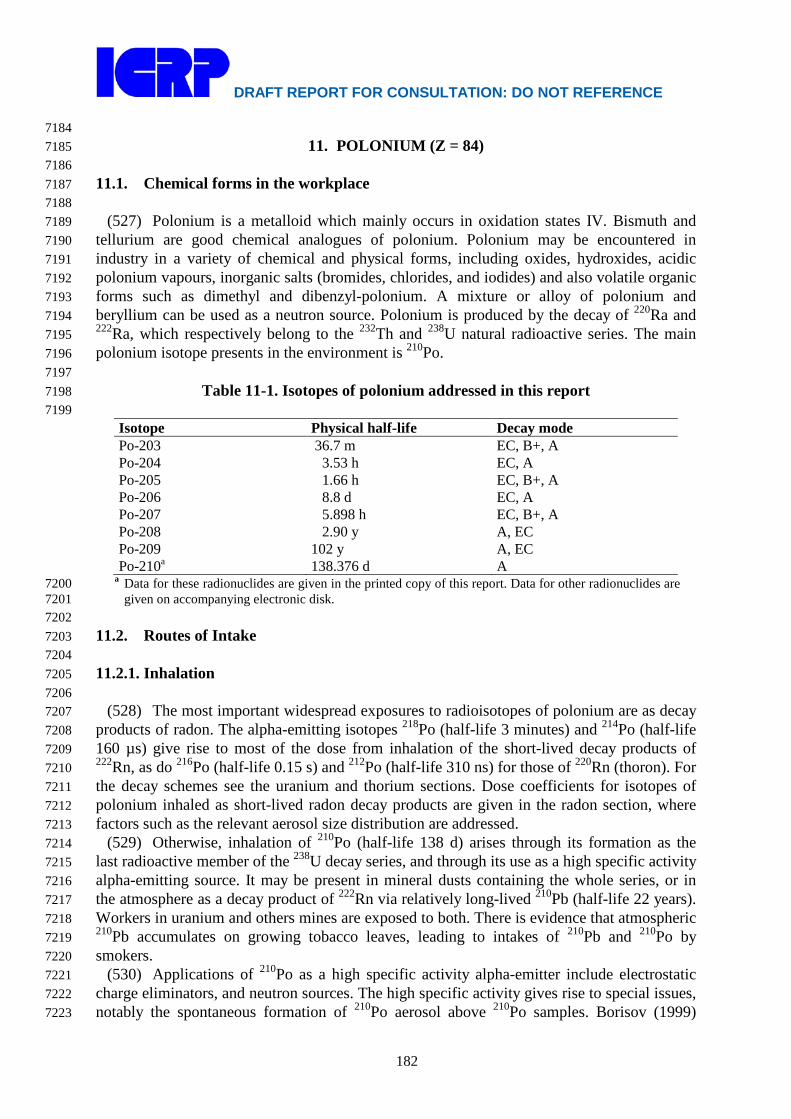
DRAFT REPORT FOR CONSULTATION: DO NOT REFERENCE
182
7184 11. POLONIUM (Z = 84) 7185
7186 11.1. Chemical forms in the workplace 7187 7188
(527) Polonium is a metalloid which mainly occurs in oxidation states IV. Bismuth and 7189 tellurium are good chemical analogues of polonium. Polonium may be encountered in 7190 industry in a variety of chemical and physical forms, including oxides, hydroxides, acidic 7191 polonium vapours, inorganic salts (bromides, chlorides, and iodides) and also volatile organic 7192 forms such as dimethyl and dibenzyl-polonium. A mixture or alloy of polonium and 7193 beryllium can be used as a neutron source. Polonium is produced by the decay of 220Ra and 7194 222Ra, which respectively belong to the 232Th and 238U natural radioactive series. The main 7195 polonium isotope presents in the environment is 210Po. 7196 7197
Table 11-1. Isotopes of polonium addressed in this report 7198 7199
Isotope Physical half-life Decay mode Po-203 36.7 m EC, B+, A Po-204 3.53 h EC, A Po-205 1.66 h EC, B+, A Po-206 8.8 d EC, A Po-207 5.898 h EC, B+, A Po-208 2.90 y A, EC Po-209 102 y A, EC Po-210a 138.376 d A
a Data for these radionuclides are given in the printed copy of this report. Data for other radionuclides are 7200 given on accompanying electronic disk. 7201
7202 11.2. Routes of Intake 7203 7204 11.2.1. Inhalation 7205 7206
(528) The most important widespread exposures to radioisotopes of polonium are as decay 7207 products of radon. The alpha-emitting isotopes 218Po (half-life 3 minutes) and 214Po (half-life 7208 160 µs) give rise to most of the dose from inhalation of the short-lived decay products of 7209 222Rn, as do 216Po (half-life 0.15 s) and 212Po (half-life 310 ns) for those of 220Rn (thoron). For 7210 the decay schemes see the uranium and thorium sections. Dose coefficients for isotopes of 7211 polonium inhaled as short-lived radon decay products are given in the radon section, where 7212 factors such as the relevant aerosol size distribution are addressed. 7213
(529) Otherwise, inhalation of 210Po (half-life 138 d) arises through its formation as the 7214 last radioactive member of the 238U decay series, and through its use as a high specific activity 7215 alpha-emitting source. It may be present in mineral dusts containing the whole series, or in 7216 the atmosphere as a decay product of 222Rn via relatively long-lived 210Pb (half-life 22 years). 7217 Workers in uranium and others mines are exposed to both. There is evidence that atmospheric 7218 210Pb accumulates on growing tobacco leaves, leading to intakes of 210Pb and 210Po by 7219 smokers. 7220
(530) Applications of 210Po as a high specific activity alpha-emitter include electrostatic 7221 charge eliminators, and neutron sources. The high specific activity gives rise to special issues, 7222 notably the spontaneous formation of 210Po aerosol above 210Po samples. Borisov (1999) 7223

DRAFT REPORT FOR CONSULTATION: DO NOT REFERENCE
183
showed that 210Po on open surfaces releases particles ranging from individual 210Po atoms to 7224 aggregates of >3000 atoms. Borisov (1999) also reported that gaseous polonium is present in 7225 aerosols containing 210Po, resulting in some penetration of fibrous filters, and that the gaseous 7226 fraction formed in moist air resembles polonium hydride (PoH2), which is unstable, 7227 decomposing to polonium and hydrogen. 7228 7229 Absorption types and parameter values 7230
(531) Information is available on the behaviour of polonium following deposition in the 7231 respiratory tract from animal experiments with several chemical forms, and from some 7232 accidental human intakes. 7233
(532) However, the behaviour of ionic (soluble) Po following deposition in the respiratory 7234 tract is difficult to determine because ionic solutions (e.g. chloride) are unstable at neutral pH 7235 and in many biological media, resulting in colloid formation. Adsorption of polonium onto 7236 surfaces has caused experimental problems, e.g. in determining amounts administered. All the 7237 experiments described below used 210Po, because of its relatively long half-life and 7238 availability, but as its yield of penetrating photons is very low, direct external counting could 7239 not be used to estimate initial deposits or whole body content in vivo. Analysis of 7240 experimental data to derive absorption parameter values is difficult. Excretion of systemic 7241 polonium is mainly fecal, and so fecal excretion does not enable particle transport from the 7242 respiratory tract to be easily distinguished from absorption. There is also significant 7243 absorption of polonium in the alimentary tract (~10%), and in inhalation experiments, with 7244 high deposition in the extrathoracic airways and rapid clearance to the alimentary tract, this 7245 contributed to early uptake to blood, along with the rapid phase of absorption from the 7246 respiratory tract. Studies of polonium hydroxide colloid administered to rats by intratracheal 7247 instillation and nose-only inhalation are considered first, because they provide the most 7248 detailed information on the rapid phase of absorption. In deriving absorption parameter 7249 values from the results of studies using rats, the systemic model structure described in section 7250 3 below was used, but it was modified using information from the polonium hydroxide 7251 studies (Thomas and Stannard 1964; Casarett 1964) and from intravenous injection 7252 experiments in rats conducted at the same institute (Stannard 1964). 7253
(533) Absorption parameter values and Types, and associated fA values for particulate 7254 forms of polonium are given in Table 11-2. 7255 7256 Polonium hydroxide colloid (PoO(OH)2) 7257
(534) Thomas and Stannard (1964) studied the tissue distribution and excretion of 210Po 7258 after intratracheal administration into rats of a freshly neutralised solution of 210Po in 0.5N 7259 HCl. This preparation was termed "polonium hydroxide colloid" by Morrow and Della Rosa 7260 (1964), referring to Morrow et al. (1964) who investigated the formation of polonium 7261 colloids. According to Morrow and Della Rosa (1964) it consists almost entirely of colloid 7262 particles less than 50 Å (5 nm) in diameter. One group of 30 rats was used to study the short-7263 term biokinetics, with emphasis on lung clearance: seven were sacrificed during the first 24 7264 hours, and the rest at times up to 62 d (further details are given in Thomas and Stannard 7265 1956). Another 39 were used for a long-term experiment with measurements up to 478 d. 7266 Lung retention at 1, 10 and 60 d after administration was estimated to be ~70%, 45% and 5% 7267 of the initial lung deposit (ILD) (after correction for incomplete recovery in 210Po 7268 measurements, and blood-borne 210Po). The distribution of systemic activity was broadly 7269 similar to that observed following intravenous injection into rats of a similar 210Po preparation 7270 (Stannard 1964). The fecal to urine excretion ratio was >20 during the first week, during 7271
DRAFT REPORT FOR CONSULTATION: DO NOT REFERENCE
184
which about 4% ILD was excreted in faeces, presumably reflecting particle transport from the 7272 bronchial tree to the alimentary tract. After 10 days the ratio was ~10, similar to that observed 7273 after intravenous injection (Stannard 1964), indicating that most of the excretion was 7274 systemic. Analysis carried out here (i.e. by the Task Group) of the results of the short-term 7275 (62-d) study, assuming that the 210Po retained in the lungs was in particulate form rather than 7276 bound (fb = 0, see below) gave absorption parameter values of fr = 0.5; sr = 2 d–1 and ss = 0.02 7277 d–1. Analysis of the results of the long-term study gave similar values of fr and sr, but a lower 7278 value of ss, ~0.01 d–1. (Both sets of parameter values give assignment to Type M.) 7279
(535) Casarett (1964) followed the distribution and excretion of 210Po following brief (20-7280 minute) nose-only exposure of 44 rats to polonium hydroxide colloid (neutralised 210Po 7281 chloride) carried on a sodium chloride vector aerosol (count median diameter, CMD, 0.05 7282 µm). Further details are given by Casarett (1958). Six rats were sacrificed immediately after 7283 exposure, the rest in pairs at times up to 30 d, including nine time points in the first 24 hours, 7284 giving unusually detailed information on the rapid phase of respiratory tract clearance for an 7285 inhalation experiment. Complete urine and fecal collections were made for each rat, which 7286 also enabled the "dose", i.e. the initial total deposit (ITD) in each rat to be estimated. The 7287 measurements of activity distribution were complemented by a comprehensive 7288 autoradiographic study. The amounts of 210Po in the alimentary tract and faeces in the first 7289 three days indicate that about 60% ITD was deposited in the upper respiratory tract (URT, the 7290 skinned head and trachea) and bronchial tree. (However, this might also have included some 7291 ingestion of 210Po deposited on the pelt during preening.) The particle clearance rate to the 7292 alimentary tract was estimated here to be about 10-15 d-1 (half-time of 1.5 hours). The 7293 assumption that this clearance was predominantly by particle transport sets an upper limit of 7294 ~10 d–1 on the rapid absorption rate (sr). Casarett (1964, p. 158) reported that "During 7295 exposure, about 20% of the deposited load left the lung and was translocated to other 7296 tissues..." which would imply a value of sr of the order of 100 d–1. The basis for this 7297 inference is not apparent from the tissue or blood data presented in that paper, but Casarett 7298 (1958 pp. 151-152) relates it to the presence of ~25% ITD in the "residual carcass", in the 7299 first few measurements (which fell to ~4% ITD by 1 d, and remained at that level thereafter). 7300 However, it appears that this might well have included most if not all of the pelt, and it is 7301 plausible that the transient high 210Po content could have been due to external contamination. 7302 Since it seems inconsistent with amounts in blood and other tissues, it was not included in 7303 analyses carried out here. Similarly, Casarett (1964) noted that the appearance of high 7304 excretion (~4% ITD) in urine in the first 12 hours was evidence for rapid absorption. 7305 However, whereas the urinary excretion rate was much higher during the first few days (> 1% 7306 ITD d–1) than subsequently (typically < 0.1% ITD d–1), this was not observed after 7307 intratracheal instillation of similar material (Thomas and Stannard 1964), for which the rate 7308 was ~0.07% d–1 during the first week. It seems plausible that the high early excretion rate 7309 after inhalation was due to contamination from the pelt, as noted by Kimball and Fink (1950). 7310 Bailey et al. (1985) similarly observed much higher urinary excretion of 85Sr by rats in the 7311 first few days after nose-only inhalation than after instillation of 85Sr-labelled fused 7312 aluminosilicate particles, and that most of the activity in such samples was removed by 7313 filtration, and was therefore probably particulate contamination. The early urine data were 7314 not therefore included in analyses here. Lung retention at 10 and 30 days after exposure was 7315 ~37% and 17% of the lung content at the end of exposure. As for the instillation experiment, 7316 the fecal to urine excretion ratio after 10 days was ~10, similar to that observed after 7317 intravenous injection (Stannard 1964), indicating that most of the excretion was systemic. 7318
(536) The content of the upper respiratory tract (URT, based on the skinned head and 7319
DRAFT REPORT FOR CONSULTATION: DO NOT REFERENCE
185
trachea) fell rapidly from ~30% ITD immediately after exposure, to ~2% ITD at 8 – 24 hours. 7320 Casarett (1958 p. 166) alluded to retention of ~2% ITD in the trachea throughout the 30-d 7321 study period. He considered it more likely to represent 210Po in associated structures (e.g. 7322 lymphatic tissues) than 210Po in transit from lungs to alimentary tract. This could be evidence 7323 of a bound fraction, but could include contributions from other sources, such as systemic 7324 210Po (see below). Autoradiographs of the lungs throughout the 30 d showed both clusters of 7325 alpha tracks, and many individual tracks, indicating the presence of both particulate and ionic 7326 210Po. Casarett (1958 p. 97) judged that most of the 210Po in the lungs appeared to be in 7327 particulate form. 7328
(537) Analysis carried out here, assuming that the 210Po retained in the lungs was in 7329 particulate form rather than bound (fb = 0, see below) gave absorption parameter values of fr = 7330 0.1; sr = 2 d–1 and ss = 0.03 d–1, giving assignment to Type M. The values of sr and ss are in 7331 good agreement with those derived above for the short-term instillation experiment. The 7332 value of fr is lower, which might reflect a difference resulting from the method of 7333 administration, or a higher proportion of colloidal material in the inhalation experiment. The 7334 value of sr (rounded to 2 d–1) was therefore used in the analyses of results of other 7335 experiments with similar forms of polonium, but for which there were insufficient data to 7336 define sr. 7337
(538) Smith et al. (1961) determined the distribution of 210Po at approximately 1, 4 and 5 7338 months after inhalation by six dogs of polonium hydroxide colloid (neutralised 210Po 7339 chloride) carried on a sodium chloride vector aerosol (CMD, 0.04 µm), similar to that inhaled 7340 by rats (Casarett 1964). Urine and fecal excretion were also measured. Further details 7341 (including daily excretion and additional tissue measurements) are given by Smith et al. 7342 (1960). However, there are differences in some of the results reported in the two documents. 7343 (Some, but not all, could be attributed to decay correction being made in the 1961 paper but 7344 not in the 1960 report.) Since the 1961 paper refers to the other as an earlier version, it was 7345 used as the definitive source in analyses carried out here. About 50% of the ITD cleared in 7346 ~3 d, which was attributed to clearance from the URT, suggesting that the rapid dissolution 7347 rate is slow compared to particle transport from the URT. The other ~50% of 210Po in the 7348 body was retained with a half-time of 37 d. Lung retention after 30 days as a fraction of the 7349 remaining body content decreased with a half-time of 36 d. Since particle transport from the 7350 lungs of dogs is so slow, this would have been mainly by absorption. Analysis carried out 7351 here gave values of fr ~0.3 and ss = 0.03 d–1, assuming that the 210Po retained in the lungs was 7352 in particulate form rather than bound (fb = 0, see below); and that sr = 2 d–1 (based on the 7353 more detailed studies with polonium hydroxide in rats, see above). These are in broad 7354 agreement with the studies in rats described above, and also give assignment to Type M. 7355 Autoradiography of tissues from dogs sacrificed at 28 and 29 d showed uniform distribution 7356 of 210Po as single tracks, except for lesser concentrations in and on tissues of the bronchial 7357 tree. (This might suggest lung retention in the bound state rather than particulate form, see 7358 below.) 7359
(539) Morrow and Della Rosa (1964) studied the tissue distribution and excretion of 210Po 7360 after intratracheal administration to seven rabbits of a freshly neutralised stock solution of 7361 210Po in 0.5N HCl. Further details are given by Morrow and Della Rosa (1956). For two 7362 rabbits the neutralised solution was aged for a week in order to increase the fraction of 7363 polonium colloid, but no differences in retention characteristics were noted between the two 7364 preparations, and the results were combined. At 2 d after administration the lungs contained 7365 about 60% ILD. The authors estimated that of the 40% cleared about half was in the 7366 alimentary tract and contents and half (i.e. ~20% ILD) absorbed into blood, indicating a value 7367
DRAFT REPORT FOR CONSULTATION: DO NOT REFERENCE
186
of fr ~0.2. Since the first measurement was at 1 day, only a lower limit on sr can be set of ≥ 1 7368 d–1. At 10 and 30 d the lungs contained about 24% and 2% ILD, respectively. These values 7369 are significantly lower than those obtained in the experiments with rats (45% and 18% 7370 respectively, Thomas and Stannard, 1964). From 2 to 30 d lung retention could be represented 7371 by a single exponential function with a rate of 0.12 d–1 (half-time ~5.7 d). This is an upper 7372 limit on ss, because some of the clearance was due to particle transport. However, the rate of 7373 particle transport from the rabbit lung is not known. (Rabbits have not often been used to 7374 study alveolar clearance.) The authors estimated that ~60% ILD had been absorbed from the 7375 lung by 30 d, which suggests that absorption was the dominant clearance process and hence 7376 that ss is likely to be in the range 0.05 - 0.1 d–1. This is much faster than assessed for rats or 7377 dogs, and would give assignment to Type F. Another inter-species difference, compared to 7378 rats, is the much higher urinary excretion in rabbits than in rats, the ratio of faecal to urine 7379 excretion being about 0.5 after 10 d. Higher urinary excretion in rabbits than in rats was also 7380 observed after intravenous injection (Silberstein et al., 1950a). In four other rabbits the 210Po 7381 was attached to silver particles (<10 µm diameter) before neutralisation (only reported in 7382 Morrow and Della Rosa, 1956). The biokinetics of 210Po were broadly similar to those 7383 following administration of hydroxide colloid alone. Lung clearance was even faster: 7384 retention could be represented by a single exponential function with a rate of 0.25 d–1 (half-7385 time ~2.8 d). Surprisingly, this did not appear to result from greater particle transport to the 7386 alimentary tract, but to greater absorption: whole body retention and urinary excretion were 7387 higher, and fecal excretion was lower. Complementary autoradiographic studies (on the same 7388 rabbits, with or without silver particles) were reported by Casarett (1958). It was noted that 7389 most of the activity was usually found in one lung lobe. As in the rat studies, autoradiographs 7390 of the lungs throughout the 28 d showed both clusters of alpha tracks, and many individual 7391 tracks, indicating the presence of both particulate and ionic 210Po. 7392
(540) Although specific parameter values for polonium hydroxide based on in vivo data are 7393 available, they are not adopted here, because inhalation exposure to it is unlikely, and because 7394 they are similar to those for default Type M. Instead, polonium hydroxide is assigned to Type 7395 M. 7396 7397 Polonium chloride (PoCl2; PoCl4) 7398
(541) Berke and DiPasqua (1964) followed the biokinetics of 210Po in rats for 60 d after a 7399 5-hour whole-body exposure to 210Po chloride carried on a sodium chloride vector aerosol 7400 (CMD 0.1 µm). However, whereas the aerosols administered in the studies described in the 7401 section on polonium hydroxide colloid were neutralised, in this experiment the solution was 7402 acidified (0.1N HCl). This might have resulted in a greater proportion of the 210Po being in 7403 ionic, rather than colloidal form. Further details are given by Berke and DiPasqua (1957). 7404 With a relatively long exposure and few early measurements (immediately after exposure, 1 7405 and 3 d) there is little information to define sr. The whole body exposure resulted in extensive 7406 contamination of the pelt, which would have affected early excretion measurements. Preening 7407 would have led to ingestion of an indeterminate amount of 210Po, and absorption from the 7408 alimentary tract to blood, making it difficult to estimate early uptake from the respiratory 7409 tract. Lung retention of 210Po at 10, 30 and 60 d was about 44%, 15% and 10% of the ILD 7410 (based on the estimated lung content at the end of exposure). These results are similar to 7411 those observed following administration of polonium hydroxide (Casarett 1964, Thomas and 7412 Stannard 1964, see above). Activity in the URT (skinned head) was about 12% of the body 7413 content (excluding pelt and alimentary tract) immediately after exposure. This fell rapidly to 7414 about 3% of the body content, and remained at that level throughout the experiment. Berke 7415

DRAFT REPORT FOR CONSULTATION: DO NOT REFERENCE
187
and DiPasqua (1957) suggested that this might be due to continuing ingestion e.g. of excreta. 7416 Analyses carried out here gave absorption parameter values of fr = 0.4 and ss = 0.01 d–1, 7417 assuming that the 210Po retained in the lungs was in particulate form rather than bound (fb = 0, 7418 see below); and that sr = 2 d–1 (based on the more detailed studies with polonium hydroxide, 7419 see above). These parameter values give assignment to Type M. The value of ss is broadly 7420 similar to values derived from studies using polonium hydroxide (see above). A central value 7421 of 0.015 d–1 was therefore used in the analyses of results of other experiments with similar 7422 forms of polonium, but for which there were insufficient data to define ss. 7423
(542) Although specific parameter values for polonium chloride based on in vivo data are 7424 available, they are not adopted here, because inhalation exposure to it is unlikely, and because 7425 they are similar to those for default Type M. Instead, polonium chloride is assigned to Type 7426 M. 7427 7428 Volatilised polonium (oxide) 7429
(543) Kimball and Fink (1950) investigated the biokinetics of 210Po for 10 d after a brief 7430 inhalation of volatilised polonium by rats. The aerosol was produced by deposition of 210Po 7431 from solution onto a nickel foil, through which a current was passed until it was red hot. The 7432 chemical form was not investigated, but oxide is mentioned in the report. Measurements of 7433 the diffusion coefficient of Po ions newly formed by decay of radon indicate that they exist in 7434 a variety of chemical forms as a result of interaction with components of air (see e.g. Busigin 7435 et al., 1981). According to Chu and Hopke (1988), Po ions are rapidly converted to PoO2
+ in 7436 the presence of oxygen. In one experiment (individual nose-only inhalation for 10–60 s), lung 7437 retention fell to ~60% ILD at 24 hours, and ~10% ILD at 10 d. The authors assessed that lung 7438 clearance was mainly by absorption to blood. Although data were not given, it was stated that 7439 (when extreme precautions were taken) animals sacrificed within a few minutes of exposure 7440 showed only traces of activity outside the respiratory tract, suggesting that the rapid 7441 absorption was on a time-scale of hours rather than minutes. In another experiment, (group of 7442 20 rats, simultaneous head-only 15-minute inhalation) lung clearance appeared to be slower, 7443 falling from ~40% ILD at 24 hours to ~30% ILD at 10 d. Analyses carried out here gave 7444 values of fr ~0.4 for both experiments, assuming that the 210Po retained in the lungs was in 7445 particulate form rather than bound (fb = 0, see below); and that sr = 2 d–1 and ss = 0.015 d–1 7446 (based on more detailed studies with polonium hydroxide, see above). These parameter 7447 values give assignment to Type M. Retention of material in the URT (based on the skinned 7448 head and trachea) was reported, of the order of 10% of the estimated initial deposit in the 7449 URT. This could be evidence of a bound fraction, but could include contributions from other 7450 sources, such as systemic 210Po (see below). Autoradiography of lungs from a rat sacrificed 7451 immediately after inhalation showed uniform distribution of 210Po in alveolar tissue and clear 7452 deposition throughout bronchi and bronchioles. However, the authors noted that by 24 hours 7453 after inhalation autoradiography showed only a little remaining in the bronchial walls. 7454
(544) Although specific parameter values for volatilised polonium based on in vivo data 7455 are available, they are not adopted here, because of the uncertainty on them, and because they 7456 are similar to those for default Type M. Instead, volatilised polonium is assigned to Type M. 7457 7458 Mineral dusts 7459
(545) Intakes of 210Po in particulate aerosol form can arise from exposure to airborne 7460 mineral dusts containing the natural long-lived parent 210Pb. In this case the absorption rate 7461 will probably be determined by the dissolution rate of the mineral matrix in lung fluids. 7462 Measurements have been made of the dissolution in simulated lung fluid of samples of coal 7463

DRAFT REPORT FOR CONSULTATION: DO NOT REFERENCE
188
fly ash (Kalkwarf et al., 1984) and condensate from calcining phospate rock dust (Kalkwarf 7464 and Jackson 1984) for 60 days. By this time the amounts of 210Po dissolved were <0.2% and 7465 <1% respectively, indicating assignment to Type S in both cases. 7466 7467 Polonium condensed with cigarette smoke tar 7468
(546) Although mainly related to environmental, rather than occupational, exposure 7469 information relating to 210Po in tobacco smoke is included here for completeness. Polonium-7470 210 and its precursor, 210Pb, are inhaled in cigarette smoke (Holtzman 1967; Little and 7471 Radford 1967; Parfenov 1974; Cross 1984; Skwarzec et al., 2001; Desideri et al., 2007). 7472 Higher concentrations of 210Po have been measured in the lungs of smokers than in non-7473 smokers, indicating that not all the 210Pb and 210Po inhaled are readily soluble (Little et al., 7474 1965; Rajewsky and Stahlhofen 1966; Holtzman and Ilcewicz 1966). It has been reported that 7475 210Pb is concentrated in resinous material in the tips of trichomes (hairs) on the surfaces of 7476 tobacco leaves, which forms relatively insoluble particles during combustion (Martell 1974; 7477 Radford and Martell, 1975). The 210Po present probably vaporises during combustion, but 7478 grows in from decay of 210Pb after deposition in the respiratory tract. 7479
(547) Cohen et al., (1979) measured the concentration of 210Po in the tracheobronchial tree 7480 (TB) and parenchyma (alveolar interstitial, AI region) of tissues obtained at autopsy from 7481 smokers, ex-smokers, and non-smokers. In non-smokers, the ratio of 210Po concentration in 7482 TB to that in AI was ~3 (resulting mainly from systemic 210Pb/210Po). In smokers and ex-7483 smokers, the ratio was ~1: the higher concentration of 210Po in the parenchyma was attributed 7484 to the retention of relatively insoluble particles containing 210Pb/210Po inhaled in cigarette 7485 smoke. Cohen et al. (1980) measured the dissolution (in physiological saline at 37°C) of 7486 alpha-activity of cigarette smoke collected on membrane filters. No decrease in activity was 7487 observed (estimated upper limit on dissolution ~20%), although there was a considerable 7488 reduction in sample mass. Cohen et al. (1985) measured 210Po in the lungs of rats at times 7489 during exposure for 6 months to smoke from cigarettes enriched in 210Pb/210Po, and up to 5 7490 months afterwards. A two-component compartment model was fit to measurements of lung 7491 retention following the end of exposure: a good fit was obtained with 90% cleared at a rate of 7492 0.036 d–1 (half-time 19 d) and 10% was cleared at a rate of 0.0055 d–1 (half-time 125 d). This 7493 indicates Type M or S behaviour for both the 210Pb and the 210Po. 7494 7495 Unknown form (accidental exposures of workers) 7496
(548) Follow-up data for many cases of apparently acute inhalation of 210Po by workers 7497 have been reported, but in a high proportion only urine (and in some cases blood) 7498 measurements were reported, and in such cases little can be inferred about respiratory tract 7499 absorption (see e.g. Naimark 1948, 1949, and section 3 below). Some cases are considered 7500 here: in most of these, urine and fecal excretion measurements were reported. The biokinetic 7501 models used in this document predict that for inhalation of a 5-µm AMAD aerosol by a 7502 reference worker, the ratio of daily fecal excretion to daily urinary excretion (F/U) is fairly 7503 constant from about 10 d after intake, being ~3 for default Type F or Type M 210Po (which 7504 does not allow a distinction to be made between them), and ~40 for Type S. However, in their 7505 review, Leggett and Eckerman (2001) pointed out that a technique widely used for routine 7506 workplace monitoring of 210Po in urine involved spontaneous deposition of 210Po onto a metal 7507 disc, without prior acid digestion, and this could underestimate the activity present. In none of 7508 the cases considered in this section was it reported that acid digestion was used prior to 210Po 7509 deposition onto a metal disc, and so any conclusions must be treated with caution, since the 7510 urine measurements may have been underestimated, and the ratio F/U overestimated. 7511
DRAFT REPORT FOR CONSULTATION: DO NOT REFERENCE
189
(549) Foreman et al. (1958) reported excretion data for two physicists who were exposed 7512 to 210Po for at most a few minutes after the rupture of a Po-Be source, for ~200 d after the 7513 incident (urinary excretion for both, and faecal excretion for one). Both urinary and faecal 7514 excretion showed at least two phases. The estimated biological half-time of the first (rapid) 7515 urinary component, representing about 6% of total urinary excretion, was 0.75 d. The ratio 7516 F/U was approximately 20 over the period 10–100 d, suggesting behaviour between Types M 7517 and S. Analysis here, using the systemic model described in section 3, and the updated 7518 HRTM (inhalation of a 5-µm AMAD aerosol by a reference worker) with sr = 2 d–1, gave 7519 estimated parameter values fr = 0.02 d–1, ss = 0.001 d–1. 7520
(550) Sheehan (1964) analyzed blood, urine, and faeces of a worker who inhaled 210Po in 7521 acid vapours. Measurements apparently started several days after exposure. Urine and blood 7522 both showed a biological half-time of 43 d. Total urinary and faecal excretion determined for 7523 days 47-52 post exposure indicated a ratio F/U of 6.5, suggesting behaviour between Types M 7524 and S, but closer to Type M. 7525
(551) Scott and West (1975) measured excretion of 210Po in urine and faeces for 160 d, 7526 starting an estimated 2 days after the presumed accidental inhalation by a worker of material 7527 from a 210Po source. Contamination was found throughout the room. Although the paper's 7528 summary refers to "an exposure to 210-Po oxide...", the only information on chemical form 7529 given is that the source was made by vapour-depositing polonium metal onto a metal disc. 7530 Only ~3% of the estimated activity deposited in the respiratory tract was excreted in the urine. 7531 (The urine data showed very high day-to-day variation.) The ratio F/U was in the range 20-30 7532 over the period 10 - 110 d, suggesting behaviour between Types M and S. 7533
(552) Ilyin (2001) reported measurements on a worker who died as a result of a large 7534 accidental intake of 210Po by inhalation (no information was given on its form). Reported 7535 activities retained at death, 13 days after intake, were: whole body 100 MBq, lungs 13 MBq, 7536 kidney 4.5 MBq and liver 21 MBq. The daily excretion rate was reported to be 1.6 MBq d–1 7537 (urine 25.5%, faeces 33.8%, vomit 32.4%, saliva 7.1% and sweat 1.2%). Harrison et al. 7538 (2007) discussed the reported symptoms in relation to estimated tissue doses. They obtained a 7539 consistent fit to the urine and post-mortem tissue measurements using the Publication 66 7540 Type M default values of sr (100 d–1) and ss (0.005 d–1) but with higher values of fr and 7541 fractional intestinal absorption than the default values. Analysis here, using the systemic 7542 model described in section 3, and the updated HRTM (inhalation of a 5-µm AMAD aerosol 7543 by a reference worker) with sr = 2 d–1, ss = 0.005 d–1, and fA constrained to 0.1*fr (see Table 7544 11-2, footnote c), gave a consistent fit to post-mortem tissue measurements with fr ~0.7. The 7545 result was insensitive to the choice of sr. The F/U ratio was lower (~1.3) than predicted by 7546 the systemic model used here, but may have been affected by the response to the radiation, 7547 which included severe vomiting. 7548 7549 Default rapid dissolution rate for polonium 7550
(553) Studies with polonium hydroxide colloid give values of sr of about 2 d–1. This is 7551 close to the general default value of 3 d–1 for Type M and S materials, and in view of the 7552 uncertainties in assessing absorption parameter values for polonium, a value of 3 d–1 is also 7553 applied here to all Type F forms of polonium. 7554 7555 Extent of binding of polonium to the respiratory tract 7556
(554) The studies with polonium hydroxide, chloride, and volatilised polonium (oxide) all 7557 suggest that there is respiratory tract retention of polonium deposited in ionic (soluble) form. 7558 However, whether this is retained in particulate or bound form is unclear. Because of colloid 7559

DRAFT REPORT FOR CONSULTATION: DO NOT REFERENCE
190
formation at and around neutral pH, some colloid formation before deposition in the 7560 respiratory tract almost certainly occurred with polonium hydroxide, and may have occurred 7561 with the other materials. Similarly colloid formation may well have occurred after deposition. 7562 Thus formation of some particulate material would be expected. 7563
(555) The high proportion of systemic excretion going to faeces makes it difficult to 7564 distinguish clearance by absorption from clearance by particle transport and hence the extent 7565 of any bound fraction. As noted above, in several studies, retention of 210Po in the upper 7566 respiratory tract (URT) was noted, and might be considered to be evidence of a bound 7567 fraction. However, this was usually based on retention in the skinned head, which would have 7568 included 210Po in soft tissues, blood and lymphatics. Clearance from the URT appeared to be 7569 slower than from the lungs: if retention in the respiratory tract were due predominantly to a 7570 bound fraction, then the rate of uptake to blood should be similar from the URT and lungs. 7571 Autoradiographic studies which complemented the radiochemical measurements of activity 7572 distribution and excretion also indicated the presence of both particulate and ionic 210Po. The 7573 latter might be considered to be evidence of a bound fraction, but some would have been 7574 systemic or blood-borne. Another indication of retention in a bound, rather than particulate 7575 form, is the similarity in the retention kinetics of different chemical forms administered, 7576 suggesting the retention is characteristic of the element rather than related to dissolution of 7577 different particulate forms (see lead section). Thus there are indications that there might well 7578 be some binding of polonium. However, the information is insufficient to estimate the extent 7579 of the bound state with confidence. Although it is not clear that the bound state for polonium 7580 is negligible, it is assumed by default that fb = 0. 7581
7582 Table 11-2. Absorption parameter values for inhaled and ingested polonium 7583
7584
Inhaled particulate materials
Absorption parameter valuesa
Absorption from the alimentary tract, fA
fr sr (d–1) ss (d–1) Default parameter valuesb,c Absorption Type
Assigned forms
F — 1 3 – 0.1 M Chloride, hydroxide,
volatilised polonium, all unspecified formsd
0.2 3 0.005 0.02
S — 0.01 3 1x10⁻⁴ 0.001 Ingested material All chemical forms 0.1 a It is assumed that for polonium the bound state can be neglected, i.e. fb = 0.0. The value of sr for Type F 7585
forms of polonium (3 d–1) is element-specific. The values for Types M and S (3 d–1) are the general default 7586 values. 7587
b Materials (e.g. polonium chloride) are generally listed here where there is sufficient information to assign to a 7588 default absorption Type, but not to give specific parameter values (see text). 7589
c For inhaled material deposited in the respiratory tract and subsequent cleared by particle transport to the 7590 alimentary tract, the default fA values for inhaled materials are applied: i.e. the product of fr for the absorption 7591 Type and the fA value for ingested soluble forms of polonium (0.1). 7592
d Default Type M is recommended for use in the absence of specific information, i.e. if the form is unknown, 7593 or if the form is known but there is no information available on the absorption of that form from the 7594 respiratory tract. 7595

DRAFT REPORT FOR CONSULTATION: DO NOT REFERENCE
191
7596 11.2.2. Ingestion 7597 7598
(556) Fractional absorption of 210Po from the alimentary tract has been measured in human 7599 subjects and in animals (see review in Harrison et al., 2007; Scott, 2007). 7600
(557) A male patient being treated for chronic myeloid leukaemia was reported to be 7601 volunteer for ingestion of 7Bq/Kg body mass in drinking water. Blood concentrations and 7602 urinary excretion after administration were about one-tenth of corresponding values obtained 7603 in other subjects after intravenous injection of polonium chloride, suggesting an f1 of 7604 0.1(Silberstein et al., 1950b;Fink 1950). Leggett and Eckerman (2001) reanalysed these data 7605 and estimated that absorption was at least 0.15. 7606
(558) The absorption of 210Po in animals has been reported for rats, guinea pigs and cats. In 7607 rats, the fractional absorption has been reported as 0.03-0.06 for an unspecified chemical 7608 form (Anthony et al., 1956) and 0.06 for the chloride (Della Rosa et al., 1955). In a study of 7609 two rats exposed by gavage to approximately 20MBq/Kg body mass of freshly neutralized 7610 210Po-chloride, fractional absorption was estimated as 0.024 and 0.048 (Cohen et al., 1989). 7611 Haines et al. (1993) obtained values for rats of 0.05 for the nitrate forms. For 210Po 7612 administered as the citrate, absorption was reported as 0.07 - 0.09 in rats and guinea pigs. 7613 After administration by gavage of 0.52 Mbq /Kg body mass to rats (chemical form not 7614 specified) the f1 was found to be 0.03-0.05 (Spoerl and Anthony 1956). 7615
(559) Fractional absorption in animals seems to be identical in males and females. 7616 Stannard (1964) reported average f1 values of 0.05 for male rats and 0.045 for female rats 7617 based on balanced studied after correcting for the amount of Po assumed to be excreted into 7618 the intestine via the bile (see review in Scott 2007). 7619
(560) In a series of experiments by Morrow et al., (1964) cats were administered by gavage 7620 either a colloidal hydroxide or soluble citrate form of 210Po. After placing 210Po in the 7621 stomach, 0.6 to 1.6% were absorbed, independent of chemical form over a 7h-period. 7622 However, significant differences were found for the two isotopes when the solution was 7623 placed in isolated duodenal loops of the small intestine. During a 10h-period, absorption was 7624 up to 40 times greater for the citrate solution. The authors indicated that in the stomach, 7625 gastric acidity converted the colloidal 210Po to a soluble form, making absorption comparable 7626 to the monomeric citrate form. 7627
(561) In Publication 30 (ICRP, 1979), an f1 value of 0.1 was recommended. A higher value 7628 of 0.5 applied to Po in foodstuff (ICRP 1993). In this report, an fA value of 0.1 is used for all 7629 chemical forms in the workplace. 7630 7631 11.2.3. Systemic Distribution, Retention and Excretion 7632 7633 11.2.3.1. Summary of the database 7634 7635 Human subjects - occupational data 7636
(562) Leggett and Eckerman (2001) reviewed records of about 1500 former polonium 7637 workers and estimated urinary half-times for numerous cases of apparently elevated, acute 7638 exposure. Approximately 95% of the derived effective half-times were in the range 8-52 d, 7639 corresponding to a range of biological half-times of 8.5-83 d. The mean, median, and mode 7640 of the effective half-times were approximately 30 d, 30 d, and 34 d, corresponding to 7641 biological half-times of 38 d, 38 d, and 45 d, respectively. 7642
(563) Silverman (1944) reported data for a male worker who was exposed while handling a 7643

DRAFT REPORT FOR CONSULTATION: DO NOT REFERENCE
192
foil containing 44.4 GBq of 210Po. Daily urine sampling and weekly fecal sampling began 7644 immediately and continued for 64 d. Biological half-times of 34.9 d and 29.3 d were derived 7645 from urinary and fecal excretion data, respectively. 7646
(564) Sheehan (1964) described a case in which a worker punctured his finger with a wire 7647 contaminated with 210Po. Daily urinary excretion of 210Po decreased by about a factor of 4 7648 during the first 2-3 d after the incident and then decreased with a biological half-time of about 7649 29 d over the next 14 wk. 7650
(565) Testa (1972) described a case in which a 59-y-old woman contaminated her hands by 7651 cleaning a chemical hood where a 210Po nitrate solution had been handled. Both ingestion 7652 intake (from a habit of finger sucking) and absorption through the skin were suspected. 7653 Urinary excretion measurements were initiated about one week after the incident. These data 7654 indicated a biological half-time of 29 d, but an early, rapid component may have been missed 7655 since the first measurement was at day 7 or 8, and the urinary excretion rate fell by more than 7656 a factor of 2 between the first measurement and the second, which was made about 10 d later. 7657
(566) A solution containing 210Po was accidentally splashed on the face of a female 7658 technician at Mound (Cohen et al., 1989). Measurements of 210Po in urine, faeces, and blood 7659 over several months indicate biological half-times of 13.1 d, 28.6 d, and 20.3 d, respectively. 7660
(567) Wraight and Strong (1989) described a case in which a worker was exposed to 210Po 7661 through a puncture wound of the thumb. The authors derived biological half-times of 35 d, 7662 40 d, and 26 d from measurements of 210Po in urine, faeces, and blood, respectively. Fecal 7663 excretion of 210Po was highly variable, and only one fecal measurement was made at times 7664 greater than about 1 mo after the incident. Urinary data for this subject may be more 7665 precisely described in terms of two excretion phases with biological half-times of about 5 d 7666 (representing about 30% of total urinary excretion) and 42 d (Leggett and Eckerman, 2001). 7667
(568) Follow-up data for several cases of apparently acute inhalation of 210Po by workers 7668 have been reported (e.g. see Naimark 1948, 1949; Spoerl 1951; Jackson and Dolphin 1966). 7669 Estimated biological half-times for individual subjects, based for the most part on urinary 7670 excretion data, generally fall in the range 20-60 d. Central estimates for relatively large 7671 groups of workers usually are in the range 30-50 d. These half-times reflect combined 7672 retention times in the respiratory tract and systemic tissues. Selected incidents are described 7673 below. 7674
(569) Foreman et al. (1958) reported urinary and fecal excretion data for two physicists 7675 who were exposed to airborne 210Po for at most a few minutes after the rupture of a Po-Be 7676 source. Both urinary and fecal excretion showed at least two phases. The estimated 7677 biological half-time of the first (rapid) urinary component, representing about 6% of total 7678 urinary excretion, was 0.75 d. The estimated biological half-time of the first fecal 7679 component, representing roughly 60% of total fecal excretion, was about 0.6 d. Urinary as 7680 well as fecal data for times greater than a few days after exposure indicate a biological half-7681 time of about 40 d, based on reevaluation of the plotted data (Leggett and Eckerman, 2001). 7682
(570) Sheehan (1964) analyzed blood, urine, and faeces of a worker who inhaled 210Po in 7683 acid vapors. Measurements apparently started several days after exposure. Urine and blood 7684 both showed a biological half-time of 43 d. Total urinary and fecal excretion determined for 7685 days 47-52 post exposure indicated a faeces to urine ratio of 6.5. The technique used to 7686 measure 210Po in urine did not involve wet-ashing of samples and thus could have 7687 underestimated urinary excretion of 210Po (Fellman et al., 1989). 7688
(571) Scott and West (1975) measured excretion of 210Po in urine and faeces of a worker 7689 following accidental inhalation of material thought to consist of small particles of 210Po 7690 oxide. Urine sampling began about 2 d after the exposure, and fecal sampling began 2 d later. 7691
DRAFT REPORT FOR CONSULTATION: DO NOT REFERENCE
193
A biological half-time of 33 d was estimated from the urinary excretion data, but the data are 7692 highly variable and not closely represented by a single half-time. 7693 7694 Human subjects - controlled studies 7695
(572) Silberstein et al. (1950b) measured 210Po in the urine, faeces, and blood of four 7696 volunteers (Subjects 1-4) who were administered 210Po chloride by intravenous injection and 7697 in a fifth volunteer (Subject 5) who ingested 210Po chloride. Subject 1 was suffering from 7698 generalized lymphosarcoma, Subject 2 from acute lymphatic leukemia, and Subjects 3-5 from 7699 chronic myeloid leukemia. Observations on Subjects 1, 2, 3, 4, and 5 were continued for up 7700 to 43, 6, 71, 13, and 228 d, respectively. Biological half-times fitted to the time-dependent 7701 concentration of 210Po in urine, faeces, or blood of these subjects varied somewhat with the 7702 observation period and also showed considerable intersubject variability. For the subjects 7703 who were followed for several weeks or months (Subjects 1, 3, and 5), urinary excretion data 7704 indicate half-times of 30-50 d for the period starting 1 wk after exposure; fecal excretion data 7705 indicate half-times of 33-52 d for this period; and data for red blood cells indicate half-times 7706 of 12-48 d for this period. Urinary excretion data for the first week after administration yield 7707 biological half-times as short as 3 d. 7708
(573) Excretion data for the subject of Silberstein et al. who ingested 210Po chloride 7709 (Subject 5) were reanalyzed in an attempt to determine fractional absorption from the GI tract. 7710 Under the assumption that all fecal excretion at times greater than one week after ingestion 7711 was due to secretion of systemic 210Po into the GI tract, it is estimated that endogenous fecal 7712 excretion represented at least 14% of ingested 210Po. Measurements of urinary excretion 7713 indicate that approximately 0.5% of the ingested amount was removed in urine. Thus, it 7714 appears that at least 14.5% of the ingested amount was absorbed to blood. The estimate of 7715 0.5% for urinary excretion may be an underestimate due to problems with the measurement 7716 technique (Fellman et al., 1989). 7717
(574) Subject 2 of Silberstein et al. died of acute lymphatic leukemia six days after 7718 injection of 210Po. The distribution of 210Po was determined from tissue samples taken about 7719 one hour after his death. The usefulness of the data for this subject are limited not only by the 7720 fact that he was terminally ill but also because estimated recovery of polonium was 7721 substantially greater than 100%, probably due to substantial overestimates of the mass of 7722 some tissues. For example, skin was estimated to represent 18% of body weight, which is 7723 about fourfold greater than the relative mass of skin given in the ICRP’s Reference Man 7724 document (ICRP, 1975). For purposes of the present study, the distribution of polonium in 7725 the human subject has been recalculated on the basis of current information on typical organ 7726 weights and by constraining organ contents to achieve mass balance. 7727
(575) Hunt and Allington (1993) determined urinary 210Po in six subjects who had ingested 7728 crab meat containing elevated concentrations of this radionuclide. Urinary excretion rates 7729 were determined for periods of 9-21 d in five of the subjects. Biological half-times of 3-8 d 7730 are indicated by these short-term data. Comparison of fecal excretion data with the ingested 7731 amounts indicates that fractional absorption to blood ranged from about 0.6 to more than 0.9 7732 in the six subjects. Urinary excretion over the first 7 d represented 0.4-1.1% of the absorbed 7733 amount in four of the subjects and 5.1% in a fifth subject. It is not evident whether these data 7734 for ingestion of biologically incorporated polonium are pertinent to occupational exposures to 7735 210Po, but the data demonstrate the potentially high absorption of some forms of polonium 7736 from the GI tract and the potentially high variability in the biokinetics of absorbed polonium. 7737 7738 Laboratory animals 7739

DRAFT REPORT FOR CONSULTATION: DO NOT REFERENCE
194
(576) Data on the biokinetics of polonium in laboratory animals was reviewed by Leggett 7740 and Eckerman (2001). The systemic behavior of polonium is qualitatively similar among 7741 species in most respects, but some species differences have been identified. For example, the 7742 blood cells of rats appear to have an unusually high affinity for polonium absorbed after 7743 ingestion, and rabbits show an unusually high rate of loss of polonium from the body. 7744
7745 11.2.3.2. Biokinetic model for systemic polonium 7746
7747 (577) A biokinetic model for systemic polonium proposed by Leggett and Eckerman 7748
(2001) is used in this report. The model structure is shown in Figure 11-1. Transfer 7749 coefficients are given in Table 11-3. The basis for each of the transfer rates is discussed 7750 below. 7751
7752
7753 Figure 11-1. Structure of the biokinetic model for systemic polonium. 7754
7755 7756
7757

DRAFT REPORT FOR CONSULTATION: DO NOT REFERENCE
195
7758 7759
Table 11-3. Transfer coefficients in the model for systemic polonium. 7760 7761
From To Transfer coefficient (d-1)
Plasma 2 Plasma 1 800 Plasma 2 Kidneys 1 200 Plasma 1 Plasma 3 4 Plasma 1 RBC 6 Plasma 1 Liver 1 17.5 Plasma 1 Liver 2 17.5 Plasma 1 Kidneys 1 5 Plasma 1 Kidneys 2 5 Plasma 1 Skin 5 Plasma 1 Red Marrow 4 Plasma 1 Bone Surface 1.5 Plasma 1 Spleen 2 Plasma 1 Testes 0.1 Plasma 1 Ovaries 0.05 Plasma 1 Other 32.35 Plasma 3 Plasma 1 0.099 RBC Plasma 1 0.099 Liver 1 GI Tract 0.139 Liver 2 Plasma 1 0.099 Kidneys 1 Urinary Bladder 0.173 Kidneys 2 Plasma 1 0.099 Skin Plasma 1 0.00693 Skin Excreta 0.00693 Red Marrow Plasma 1 0.099 Bone Surface Plasma 1 0.0231 Spleen Plasma 1 0.099 Gonads Plasma 1 0.0139 Other Plasma 1 0.099
7762 Blood 7763
(578) Data on non-human primates indicate that there is a rapid phase of removal of 7764 polonium from blood, followed by one or more slower phases of removal (Cohen et al., 7765 1989). The rapid phase represented about 80-90% of intravenously injected polonium and 7766 had a half-time on the order of 10-40 min. The remainder was removed with a half-time of 7767 about 8-19 d in the baboon and about 37 d in the tamarin. The slower phase of removal 7768 appears to be associated with attachment of polonium to red blood cells and plasma proteins 7769 (Thomas 1964, Cohen et al., 1989). 7770
(579) The relative quantities of polonium associated with red blood cells and plasma 7771 proteins varies with species, but in all species the total amount of polonium in red blood cells 7772 exceeds that in plasma at most times after absorption or injection of polonium into blood 7773 (Silberstein et al., 1950a; Smith et al., 1961; Thomas, 1964; Cohen et al., 1989). There was 7774 considerable inter- and intra-subject variability in the relative quantities of 210Po in red blood 7775 cells and plasma determined in human subjects administered 210Po by intravenous injection or 7776 ingestion, but the content of red blood cells averaged about 1.5 times that of plasma 7777
DRAFT REPORT FOR CONSULTATION: DO NOT REFERENCE
196
(Silberstein et al., 1950b). 7778 (580) The initial behavior of polonium in blood may depend on the route of exposure. 7779
After exposure by inhalation or wounds there is generally an early, rapid loss of polonium in 7780 urine (Foreman et al., 1958; Smith et al., 1961; Casarett, 1964; Wraight and Strong, 1989) 7781 that appears to be absent or less pronounced after exposure by other routes. 7782
(581) The model for blood was designed to depict rapid and slow phases of removal such 7783 as those observed in non-human primates (Cohen et al., 1989); to approximate blood 7784 retention data for human subjects (Silberstein et al., 1950a), non-human primates (Cohen et 7785 al., 1989, Fellman et al., 1994), and dogs (Parfenov and Poluboyarinova, 1969); and to depict 7786 a higher rate of urinary excretion of polonium after exposure through inhalation or wounds 7787 than after exposure by other routes. Variation in the rate of urinary excretion with route of 7788 exposure is modelled by using different receptor compartments in plasma with different rates 7789 of transfer to the urinary excretion pathways. Specifically, a compartment called Plasma 2 is 7790 assumed to receive inflow to blood from the respiratory tract or wounds, and a compartment 7791 called Plasma 1 is assumed to receive inflow to blood from all other sources, including 7792 polonium that returns from systemic tissues to blood. Outflow from Plasma 2 is assumed to 7793 be rapid (half-time of 1 min, corresponding to a transfer rate of 1000 d-1) and is divided 7794 between Plasma 1 and a kidney compartment (Kidneys 1) that feeds the urinary bladder 7795 contents. This scheme yields an initially higher rate of urinary excretion for exposure by 7796 inhalation or wounds than for other routes. As default values, 80% of outflow from Plasma 2 7797 is assigned to Plasma 1 and 20% is assigned to Kidneys 1. Assignment of a higher percentage 7798 to Kidneys 1 may be indicated in cases where the observed urinary excretion rate falls rapidly 7799 during the first few days after acute intake of polonium. This is because an unusually rapid 7800 decline in the urinary excretion rate may indicate that an unusually high fraction of the 7801 amount entering the systemic circulation was rapidly cleared by the kidneys. 7802
(582) A third plasma compartment, called Plasma 3, is used to represent protein-bound, or 7803 non-diffusible polonium in plasma. Red blood cells are represented by a single compartment, 7804 called RBC. 7805
(583) The removal half-time from Plasma 1 is assumed to be 10 min, corresponding to a 7806 total transfer rate of 100 d-1. Plasma 3 is assumed to receive 4% and RBC is assumed to 7807 receive 6% of the polonium atoms that leave Plasma 1 (i.e. the deposition fractions for 7808 Plasma 3 and RBC are 0.04 and 0.06, respectively). The removal half-time from either RBC 7809 or Plasma 3 back to Plasma 1 is assumed to be 7 d. The term half-time refers here to the 7810 estimated half-time that would be seen if there were no recycling of polonium between 7811 compartments, and that the “apparent” or “externally viewed” half-time in blood will be 7812 greater than 7 d due to recycling of polonium. 7813 7814 Liver and faecal excretion 7815
(584) Data for laboratory animals (Smith et al., 1961; Parfenov and Poluboyarinova, 1969, 7816 Fellman et al., 1994) and one human subject (Silberstein et al., 1950b) indicate that a 7817 substantial portion of injected or absorbed polonium deposits in the liver. It appears that 7818 much of the initial uptake by the liver may be removed with a half-time of a few days, and the 7819 remainder may be lost over a period of weeks. Endogenous fecal excretion of polonium 7820 appears to arise mainly from biliary secretion from the liver (Silberstein et al., 1950b; 7821 Fellman et al., 1994). 7822
DRAFT REPORT FOR CONSULTATION: DO NOT REFERENCE
197
(585) In this model the liver is assumed to consist of two compartments, called Liver 1 and 7823 Liver 2. Liver 1 is used to represent relatively rapid removal of polonium from the liver and 7824 to account for biliary secretion of polonium, which appears to decline rapidly with time. 7825 Liver 2 is used to describe relatively long-term retention in the liver. 7826
(586) The total liver is assumed to receive 35% of the outflow from Plasma 1, with half of 7827 this amount depositing in Liver 1 and half depositing in Liver 2. Polonium is assumed to be 7828 removed from Liver 1 to the contents of the small intestine with a half-time of 5 d and from 7829 Liver 2 to Plasma 1 with a half-time of 7 d. Passage from Plasma 1 to Liver 1 to the contents 7830 of the small intestine is assumed to be the sole source of endogenous fecal excretion of 7831 polonium. 7832
7833 Kidneys and urinary excretion 7834
(587) In this model the kidneys are assumed to consist of two compartments, called 7835 Kidneys 1 and Kidneys 2. Kidneys 1 represents polonium that is eventually removed to the 7836 urinary bladder contents after filtration at the glomerulus and deposition in the renal tubules. 7837 Kidneys 2 represents polonium that is eventually returned to blood after entering kidney 7838 tissue, either from nutrient blood or the tubular lumen. For simplicity, polonium entering 7839 either Kidneys 1 or Kidneys 2 is assumed to transfer directly from Plasma 1. Also, there is 7840 assumed to be no direct transfer of filtered polonium into the urinary bladder contents. That 7841 is, filtered polonium is assumed to reside temporarily in kidney tissue before being transferred 7842 to the urinary bladder contents. 7843
(588) Parameter values describing renal retention of polonium were chosen to fit retention 7844 data for man, baboons, and dogs. Kidneys 1 and Kidneys 2 are each assumed to receive 5% 7845 of polonium atoms that leave Plasma 1. The removal half-time from Kidneys 1 to bladder 7846 urine is assumed to be 4 d, and the removal half-time from Kidneys 2 to Plasma 1 is assumed 7847 to be 7 d. 7848
(589) After parameter values describing fecal excretion of polonium had been selected, 7849 parameter values describing urinary excretion were set, in part, to yield a (cumulative) fecal-7850 to-urinary excretion ratio, F:U, of about 3. The typical value of F:U for man has not been 7851 established. The selected value of 3 is a compromise, based on a fairly wide range of values 7852 determined for human subjects and non-human primates. The selected value is slightly lower 7853 than the value determined for tamarins (Cohen et al., 1989; Fellman et al., 1989) and higher 7854 than the value determined for baboons (Fellman et al., 1989). The true ratio seems likely to 7855 be lower than the values of 10 or more determined by Silberstein et al. (1950b) for human 7856 subjects, in view of findings of Fellman et al. (1989) that the measurement technique of 7857 Silberstein substantially underestimates the concentration of polonium in urine, at least in 7858 baboons and tamarins. Results of a modern study on a human subject exposed through a 7859 puncture wound seem consistent with the relatively low urinary-to-fecal excretion ratio 7860 determined by Silberstein and coworkers (Wraight and Strong, 1989); however, the technique 7861 for measuring urinary polonium was not described, and conclusions concerning F:U were 7862 based on an uncertain curve fit to scattered fecal excretion data. Reported ratios F:U for 7863 human subjects exposed to 210Po by inhalation are in the range 6.5-70 but provide only upper-7864 bound estimates of F:U for systemic polonium, for two reasons: (1) a substantial portion of 7865 210Po found in faeces may have been transported from the lungs to the gastrointestinal tract 7866 without having been absorbed to blood; and (2) at least some of the reported values were 7867 based on a measurement technique that may substantially underestimate the concentration of 7868 210Po in urine. 7869
(590) The measurement technique used by Silberstein et al. (1950b) and some later 7870
DRAFT REPORT FOR CONSULTATION: DO NOT REFERENCE
198
investigators involved spontaneous deposition of 210Po from raw urine onto a suitable metal 7871 disc. Recovery was estimated by plating 210Po from samples that had been spiked with 7872 known amounts of 210Po. There is evidence from studies on laboratory animals, however, 7873 that 210Po excreted in urine is not plated with the same efficiency as 210Po added to urine, 7874 unless the samples have been digested with acid prior to deposition (Fellman et al., 1989). 7875 Although it is tempting to adjust older urinary excretion data for human subjects to account 7876 for potentially low recovery of 210Po as indicated by results for laboratory animals, such 7877 adjustments would involve substantial uncertainties because recovery of metabolized 210Po 7878 from raw urine appears to depend on species as well as time since exposure (Fellman et al., 7879 1989), and because there is some question as to whether inaccuracies in older methods are as 7880 great as indicated by modern reconstructions of those methods. Moreover, reported data on 7881 urinary excretion of 210Po often have not been accompanied by a description of the 7882 measurement technique. 7883 7884 Spleen 7885
(591) The spleen is represented as a single compartment in exchange with Plasma 1. 7886 Parameter values were set for reasonable consistency with spleen retention data for baboons, 7887 dogs, and one human subject (Leggett and Eckerman, 2001). It is assumed that the spleen 7888 receives 2% of the outflow from Plasma 1 and that the removal half-time from spleen to 7889 Plasma 1 is 7 d. 7890 7891 Skin 7892
(592) Data on laboratory animals and man indicate that skin initially takes up a few percent 7893 of polonium that enters plasma but retains polonium more tenaciously than most other tissues. 7894 At times remote from acute intake, skin may contain half or more of the systemic burden. 7895 Much of the skin content is found around hair follicles (Soremark and Hunt 1966). Hair has a 7896 relatively high polonium content at times remote from exposure (Mayneord and Hill 1964). 7897
(593) In this model, skin is represented as a single compartment that receives 5% of 7898 polonium that leaves Plasma 1. The removal half-time from skin is assumed to be 50 d. Half 7899 of polonium leaving skin is assumed to be lost in excreta (hair, skin, sweat) and the other half 7900 is assumed to return to Plasma 1. 7901
(594) In baboons, pelt contained 53% of the body content at 91 d post injection (Fellman et 7902 al., 1989). In dogs, the pelt contained 44%, 43%, 54% and 51% of total-body polonium at 7903 116, 131, 146, and 149 d after inhalation (Smith et al., 1961). Model predictions are 7904 reasonably consistent with these data. 7905 7906 Skeleton 7907
(595) Experimental data on laboratory animals indicate that about 5% of the injected or 7908 absorbed amount deposits in the skeleton. Soon after exposure, most of the skeletal 7909 deposition is found in the marrow spaces and appears to be associated primarily with active 7910 marrow (ICRP, 1993). A smaller amount found in the mineralized skeleton may be 7911 associated with organic material in bone. The bone deposit may be retained longer than most 7912 soft-tissue polonium. 7913
(596) In this model, the skeleton is represented as two compartments, identified with red 7914 marrow and bone surface. It is assumed that these compartments receive, respectively, 4% 7915 and 1.5% of polonium leaving Plasma 1, and that both compartments lose polonium to 7916 Plasma 1. The removal half-time from red marrow is assumed to be 7 d, and the removal 7917 half-time from bone surface is assumed to be 30 d. 7918
DRAFT REPORT FOR CONSULTATION: DO NOT REFERENCE
199
7919 Gonads 7920
(597) Data on uptake and retention of polonium by testes or ovaries are variable but 7921 indicate elevated concentrations compared with most tissues (Silberstein et al., 1950b, 7922 Blanchard and Moore 1971; Cohen et al., 1989; Naylor et al., 1991). In this model, the testes 7923 and ovaries are each considered as a single compartment that exchanges polonium with 7924 Plasma 1. These compartments are assumed to receive, respectively, 0.1% and 0.05% of 7925 polonium leaving Plasma 1. The removal half-time from each of these compartments is 7926 assumed to be 50 d. 7927 7928 Other tissues 7929
(598) Remaining tissues and fluids are lumped into a compartment called Other that is 7930 assumed to exchange polonium with Plasma 1. Parameter values for this compartment were 7931 chosen for consistency with data on baboons (Cohen et al., 1989). Other is assumed to 7932 receive 32.35% of polonium leaving Plasma 1, which is the amount not accounted for in the 7933 sum of deposition fraction for all explicitly identified compartments. The removal half-time 7934 from Other to Plasma 1 is assumed to be 7 d. 7935
7936 11.2.3.3. Treatment of radioactive progeny 7937 7938
(599) Dosimetrically significant progeny of polonium isotopes addressed in this report are 7939 isotopes of bismuth or lead. The models for these two elements produced in systemic 7940 compartments following intake of a polonium isotope are based on their characteristic 7941 models, i.e. the systemic models applied in this series of reports to bismuth and lead as parent 7942 radionuclides. 7943
(600) For application to bismuth and lead as progeny of polonium, the characteristic 7944 models for bismuth and lead are modified by adding compartments representing the following 7945 tissues that are explicitly identified in the polonium model: spleen, skin, red marrow, testes, 7946 and ovaries. The model revisions are similar for each element and are summarized here for 7947 bismuth. Each of these tissues is represented in the bismuth model as a single compartment. 7948 The five compartments are extracted from the intermediate- and long-term compartments of 7949 Other soft tissues (ST1 and ST2, respectively). Transfer coefficients between the added 7950 compartments and the central blood compartment are based on the biokinetic database for 7951 bismuth summarized elsewhere in this series of reports, together with the requirements that 7952 the total outflow rate of bismuth from blood and integrated activities of long-lived bismuth 7953 isotopes in total soft tissues remain unchanged from the characteristic model for bismuth 7954 (except for small changes due to rounding of parameter values). 7955
(601) The specific changes to the characteristic model for bismuth are as follows: (1) the 7956 transfer coefficient from the central blood compartment (plasma) to ST1 is reduced from 4.2 7957 d-1 to 3.7 d-1, and the coefficient from plasma to ST2 is reduced from 1.3 d-1 to 1.2 d-1; (2) the 7958 following transfer coefficients from plasma to the added compartments are assigned: to Red 7959 marrow, 0.3 d-1, to Spleen, 0.02 d-1, to Skin, 0.3 d-1, to Testes, 0.003 d-1, to Ovaries, 0.001 d-1; 7960 (3) the assigned transfer coefficient from Red marrow, Spleen, Skin, Testes, and Ovaries to 7961 plasma is 0.007 d-1; and (4) the following transfer coefficients are assigned to bismuth 7962 produced in compartments of the polonium model that are not identifiable with compartments 7963 of the bismuth model: Plasma 2 to the plasma compartment of the bismuth model, 1000 d-1; 7964 Plasma 3 to the plasma compartment of the bismuth model, 1000 d-1; and Other to the plasma 7965 compartment of the bismuth model, 0.0347 d-1 (based on removal rate from ST1 to plasma in 7966

DRAFT REPORT FOR CONSULTATION: DO NOT REFERENCE
200
the model for bismuth). 7967 (602) The specific changes to the characteristic model for lead are as follows: (1) the 7968
transfer coefficient from the central blood compartment (Plasma) to ST1 is reduced from 0.70 7969 d-1 to 0.65 d-1, and the coefficient from Plasma to ST2 is reduced from 0.14 d-1 to 0.13 d-1; (2) 7970 the following transfer coefficients from Plasma to the added compartments are assigned: to 7971 Red marrow, 0.015 d-1, to Spleen, 0.002 d-1, to Skin, 0.04 d-1, to Testes, 0.00045 d-1, to 7972 Ovaries, 0.00015 d-1; (3) the assigned transfer coefficient from Red marrow, Spleen, Skin, 7973 Testes, and Ovaries to Plasma is 0.002 d-1; and (4) the following transfer coefficients are 7974 assigned to lead produced in compartments of the polonium model that are not identifiable 7975 with compartments of the lead model: Plasma 2 to Plasma, 1000 d-1; Plasma 3 to Plasma, 7976 1000 d-1; Other to Plasma, 0.00416 d-1 (based on removal rate from ST1 to Blood 1 in the 7977 model for lead). 7978
(603) For modelling convenience, the compartment in the polonium model named Plasma 7979 1 is identified with the compartment in the bismuth model named Plasma and the 7980 compartment in the lead model named Plasma. For example, a bismuth atom produced in 7981 Plasma 1 is assumed to be produced in the plasma compartment of the bismuth model, and a 7982 lead atom produced in Plasma 1 is assumed to be produced in the plasma compartment of the 7983 lead model. 7984 7985 11.3. Individual monitoring 7986
7987 210 Po 7988
(604) Monitoring of 210 Po intakes is accomplished through urine bioassay, using a 7989 technique that involves wet acid digestion followed by alpha spectrometry. 7990 7991
Isotope Monitoring Technique
Method of Measurement
Typical Detection Limit
Achievable detection limit
210 Po Urine Bioassay alpha spectrometry 1 mBq/L 0.1 mBq/L 7992
7993 References 7994
7995 Anthony, D.S., Davis, R.K., Cowden, R.N., Jolley, W.P., 1956. Experimental data useful in 7996
establishing maximum single and multiple exposure to polonium. In: Proceedings of the 7997 International Conference on the Peaceful Uses of Atomic Energy, Vol. 13, pp.215-218. 7998 United Nations, New York. 7999
Bailey, M.R., Hodgson, A., Smith, H., 1985. Respiratory tract retention of relatively insoluble 8000 particles in rodents. J. Aerosol Sci., 16, 279–293. 8001
Berke H.L., Dipasqua A.C. 1957. The distribution and excretion of polonium210 after inhalation. 8002 University of Rochester Atomic Energy Project, Report UR-495. 8003
Berke, H.L., Dipasqua, A.C., 1964. Distribution and excretion of polonium-210. VIII. After 8004 inhalation by the rat. Radiat Res 5 (suppl.), 133-147. 8005
Blanchard, R.L., Moore, J.B., 1971. Body burden, distribution and internal dose of Pb-210 and Po-8006 210 in a uranium miner population. Health Phys. 21, 499-518. 8007
Borisov, N.B., 1999. On the 275th Anniversary of the Russian Academy of Sciences, Research on 8008 polonium aerosols and appropriate safety measures under the leadership of I. V. Petryanov-8009 Sokolov. Atomic Energy. 86 (6) 385–387. 8010

DRAFT REPORT FOR CONSULTATION: DO NOT REFERENCE
201
Casarett, L.J. 1958. A study of the pharmacodynamics of polonium administered via the lungs. PhD 8011 Thesis, University of Rochester. 8012
Casarett, L.J. 1964. Distribution and excretion of polonium-210. IX. Deposition, retention, and fate 8013 after inhalation by nose-only exposure, with notes on mechanics of deposition and clearance 8014 and comparison of routes of administration. Radiat Res 5 (suppl.), 148-165. 8015
Chu, K.-D., Hopke P.K., 1988. Neutralization kinetics for polonium-218. Environ. Sci. Technol., 22, 8016 711-717. 8017
Cohen, B.S., Eisenbud, M., Wrenn, M.E., Harley, N.H., 1979. Distribution of polonium-210 in the 8018 human lung. Radiat. Res. 79, 162-168. 8019
Cohen, N., Fellman, A.L., Hickman, D.P., Ralston, L.G., Ayres, L.S., 1989. Primate polonium 8020 metabolic models and their use in estimation of systemic radiation doses from bioassay 8021 data. Mound Laboratory. 8022
Cohen,B.S., Eisenbud, M., Harley, N.H., 1980. Alpha Radioactivity in cigarette smoke. Radiat Res 8023 83, 190-196. 8024
Cohen, B.S., Harley, N.H., Tso,T.C., 1985. Clearance of polonium-210-enriched cigarette smoke 8025 from the rat trachea and lung. Toxicol. Appl. Pharmacol. 79, 314-322. 8026
Cross F.T., 1984. Radioactivity in cigarette smoke issue. Health Phys. 46(1) 205-209. 8027 Della Rosa, J.R., Thomas, R.G., Stannard, J.N., 1955. The acute toxicity and retention of orally 8028
administered polonium-210. University of Rochester, UR-392. 8029 Desideri D., Meli M.A., Feduzi L., Roselli, C., 2007. 210Po and 210Pb inhalation by cigarette smoking 8030
in Italy. Health Phys. 92(1) 58-63. 8031 Fellman, A., Ralston, L., Hickman, D., Ayres, L., Cohen, N., 1994. Polonium metabolism in adult 8032
female baboons. Radiat. Res. 137, 238-250. 8033 Fellman, A., Ralston, L., Hickman, D., Ayres, L., Cohen, N., 1989. The importance of acid digestion 8034
of urine prior to spontaneous deposition of 210Po. Health Phys. 57, 615-6221. 8035 Fink, R.M., 1950. (Ed.), Biological studies with polonium, radium, and plutonium. New York: 8036
McGraw-Hill. 8037 Foreman, H., Moss, W., Eustler, B.C., 1958. Clinical experience with radioactive materials. 8038
American Journal of Roentgenology Radium Therapy and Nuclear Medicine 79, 1071-8039 1079. 8040
Haines, J.W., Naylor, G.P.L., Pottinger, H., Harrison, J.D., 1993. Gastrointestinal absorption and 8041 retention of plonium in adult and newborn rats and guinea pigs. Int. J. Radiat. Biol. 64, 127-8042 132. 8043
Harrison, J.D., Leggett, R.W., Lloyd D., Phipps, A.W., Scott, B.R., 2007. Polonium-210 as a poison. 8044 J. Radio. Prot. 27, 17–40. 8045
Holtzman, R.B., Ilcewicz, F.H., 1966. Lead-210 and polonium-210 in tissues of cigarette smokers. 8046 Sci. 153, 1259-1260. 8047
Holtzman, R.B., 1967. Polonium-210 in bronchial epithelium of cigarette smokers. Sci. 155, 607. 8048 Hunt, G.J., Allington, D.J., 1993. Absorption of environmental polonium-210 by the human gut. J. 8049
Radiol. Prot. 13, 119-126. 8050 ICRP, 1975. Report of the Task Group on Reference Man. ICRP Publication 23. Oxford: Pergamon 8051
Press. 8052 ICRP, 1979. Limits on Intakes of Radionuclides for Workers. ICRP Publication 30, Pt.1. Ann. ICRP 8053
2, (3/4). 8054 ICRP, 1993. Age-dependent Doses to Members of the Public from Intake of Radionuclides. Pt.2. 8055
ICRP Publication 67. Ann. ICRP. 23, (3/4). 8056 Ilyin, L.A., 2001. Radiation Medicine. Guidance for Medical Researchers and Health Management. 8057
Vol 2. Radiation Damage of Humans. Ed. A. Yu. Bushmanov et al. (Moscow: AT) ISBN 5-8058 86656-114-X. 8059
Jackson, S., Dolphin, G.W., 1966. The estimation of internal radiation dose from metabolic and 8060 urinary excretion data for a number of important radionuclides. Health Phys. 12, 481-500. 8061

DRAFT REPORT FOR CONSULTATION: DO NOT REFERENCE
202
Kalkwarf, D.R., Jackson, P.O., 1984. Lung-clearance classification of radionuclides in calcined 8062 phosphate rock dust. PNL-5221.. Richland, Washington, Pacific Northwest Laboratory. 8063
Kalkwarf, D.R., Jackson, P.O., Hardin, J.M., 1984. Lung-clearance classification of radionuclides in 8064 coal fly ash. Health Phys. 47, 37-45. 8065
Kimball, C.P., Fink, R.M., 1950. Inhalation of volatilized polonium by rats. In: Fink, R.M., editor. 8066 Biological studies with polonium, radium, and plutonium. New York: McGraw-Hill, pp. 8067 89–111. 8068
Landinskaya, L.A., Parfenov, Y.D. Popov, D.K., Federova, A.V., 1973. 210Pb and 210Po content of air, 8069 weater, foodstuffs and the human body. Arch. Environ. Health 27, 254-258. 8070
Leggett, R.W., Eckerman, K.F., 2001. A systemic biokinetic model for polonium. Sci. Total Environ. 8071 275, 109-125. 8072
Little, J.B., Radford, E.P., Jr. 1967. Polonium-210 in bronchial epithelium of cigarette smokers. Sci. 8073 155, 606-607. 8074
Little, J.B., Radford, E.P., Jr., McCombs, H.L., Hunt, V.R., 1965. Distribution of polonium-210 in 8075 pulmonary tissues of cigarette smokers. N. Engl. J. Med. 273, 1343-1351. 8076
Martell, E.A. 1974. Radioactivity of tobacco trichomes and insoluble cigarette smoke particles. 8077 Nature 249, 215-217. 8078
Mayneord, W.V., Hill, C.R., 1964. Total counting and spectroscopy in the assessment of alpha 8079 activity in human tissues. In: Assessment of radioactivity in man, Vol. 1. IAEA, Vienna, 8080 Austria, 291-309. 8081
Morrow, P.E., Della Rosa, R.J., 1956. The fate of polonium210 colloid and polonium210 tagged silver 8082 particles following intratracheal administration to rabbits. University of Rochester Atomic 8083 Energy Project, Report UR-478. 8084
Morrow, P.E., Della Rosa, R.J., 1964. Distribution and excretion of polonium-210. VII. Fate of 8085 polonium colloid after intratracheal administration to rabbits. Radiat Res 5 (suppl.), 124-8086 132. 8087
Morrow, P.E., Della Rosa, R.J., Casarrett L.J., Miller, G.J., 1964. Investigations of the colloidal 8088 properties of polonium-210 solutions using molecular filters. Radiat Res 5 (suppl.), 1-15. 8089
Naimark, D.H., 1948. Acute exposure to polonium (medical study of three human cases). Mound 8090 Laboratory, Report MLM-67. 8091
Naimark, D.H. 1949. Effective half-life of polonium in the human. Mound Laboratory, Report MLM-8092 272. 8093
Naylor, G.P.L., Bonas, H.E., Haines, J.W., Ham, G.J., Harrison, J.D., Sundaram, S., Dayan, A.D., 8094 1991. The gastrointestinal absorption and tissue distribution of alpha-emitting actinide 8095 isotopes and polonium-210. The British Nuclear Energy Society Conference: Occupational 8096 Radiation Protection, Guernsey. Thomas Telford, London. 291-296. 8097
Parfenov, Y. 1974. Polonium-210 in the environment and in the human organism. At. Energy Rev. 8098 12, 75-143. 8099
Parfenov, Yu. D., Poluboyarinova, Z.I., 1969. Dynamics of polonium-210 exchange in dogs after a 8100 single subcutaneous administration. Radioactive isotopes and the body, Yu. I. Moskaleve, 8101 ed. Izdatel’stvo Medisina. Moscow. 1969. AEC-tr-7195, pp. 128-135. 8102
Radford, E.P., Martell, E.A., 1975. Polonium-210: lead-210 ratios an index of residence times of 8103 insoluble particles from cigarette smoke in bronchial epithelium. Walton, W.H. and 8104 McGovern, B. 2, 567-581. 1975. Oxford, Pergamon Press. Proc. of an international 8105 symposium organized by the British Occupational Hygiene Society, Edinburgh. 22-9-1975. 8106
Rajewsky, B., Stahlhofen, W., 1966. Polonium-210 activity in the lungs of cigarette smokers. Nature 8107 209, 1312-1313. 8108
Scott, B.R., 2007. Health risk evaluations for ingestion exposure of humans to polonium-210. Dose 8109 Response 5: 94-122; 8110
Scott, L.M., West, C.M., 1975. Excretion of 210-Po oxide following accidental inhalation. Health 8111 Phys. 28, 563-565. 8112
Sheehan, W.E., 1964. Effective half-life of polonium. Proc. 10th annual bioassay and analytical 8113
DRAFT REPORT FOR CONSULTATION: DO NOT REFERENCE
203
chemistry meeting. Conf. 727, pp. 32-38. 8114 Silberstein, H.E., Minto, W.L., Fink, R.M. 1950a. Intravenous injection of polonium in a rabbit. In: 8115
Biological Studies With Polonium, Radium and Plutonium (Ed. by R.M. Fink), pp. 117-119. 8116 New York, McGraw-Hill. 8117
Silberstein, H.E., Valentine, W.N., Minto, W.L., Lawrence, J.S. & Fink, R.M. 1950b. Studies of 8118 polonium metabolism in human subjects. Intravenous studies, comparison of intravenous 8119 studies, oral administration. In: Fink, R.M. (Ed.), Biological Studies With Polonium, 8120 Radium and Plutonium, pp. 122-148. New York, McGraw-Hill. 8121
Silverman, L.B., 1994. Excretion activity analyses as a monitor for postum exposures. Final report 8122 No. 10. Mound Laboratory. MLM-1443. Miamisburg, Ohio. 8123
Skwarzec, B., Ulatowski, J., Struminska, D.I., Borylo, A., 2001. Inhalation of 210Po and 210Pb from 8124 cigarette smoking in Poland. J. Environ. Radioact. 57, 221-230. 8125
Smith, F.A., Morrow, P.E., Gibb, F.R., Della Rosa, R.J., Casarett, L.J., Scott, J.K., Morken D.A. and 8126 Stannard, J.N. 1960. Distribution and excretion studies in dogs exposed to an aerosol 8127 containing polonium-210. University of Rochester Atomic Energy Project, Report UR-566. 8128
Smith, F.A., Morrow, P.E., Gibb, F.R., Della Rosa, R.J., Casarett, L.J., Scott, J.K., Morken, D.A., 8129 Stannard, J.N. 1961. Distribution and excretion studies in dogs exposed to an aerosol 8130 containing polonium-210. Am. Ind. Hyg. Assoc. J. 22, 201-208. 8131
Soremark, R., Hunt, V.R., 1966. Autoradiographic studies of the distribution of polonium-210 in 8132 mice after a single intravenous injection. Int. J. Rad. Biol. 11, 43-50. 8133
Spoerl, E., Anthony, D.S. 1956. Biological research related to polonium. In : Polonium. United States 8134 Atomic Energy Commission Technical Information Service Extension, July 1956, Oak 8135 Ridge, TN. 8136
Spoerl, E.S., 1951. A derived biological half-life of polonium in humans. Mound Laboratory, MLM-8137 626. Report for biological research, 72-76. 8138
Stannard, J.N., 1964. Distribution and excretion of polonium-210. I. Comparison of oral and 8139 intravenous routes in the rat. Radiat. Res. 5 (suppl.), 49-59. 8140
Testa, C., 1972. Indirect methods used at CNEN for the evaluation of internal contamination. In: 8141 Assessment of radioactive contamination in man. IAEA-SM-150/18, Vienna, pp. 405-421. 8142
Thomas, R.G., 1964. The binding of polonium by red cells and plasma proteins. Radiat. Res. Suppl. 8143 5, 29-39. 8144
Thomas, R.G., and Stannard, J.N., 1956. The metabolism of polonium-210 administered by 8145 intratracheal injection to the rat. University of Rochester Atomic Energy Project, Report 8146 UR-430. 8147
Thomas, R.G., Stannard, J.N., 1964. Distribution and excretion of polonium-210. VI. After 8148 intratracheal administration in the rat. Radiat. Res. 5 (suppl.), 106-123. 8149
Wraight, J.C., Strong, R.A., 1989. Case study on the retention and excretion of internally deposited 8150 polonium. Radiation protection - theory and practice. Proc. of the 4th International 8151 Symposium, Malvern, pp 227-230. 8152
8153
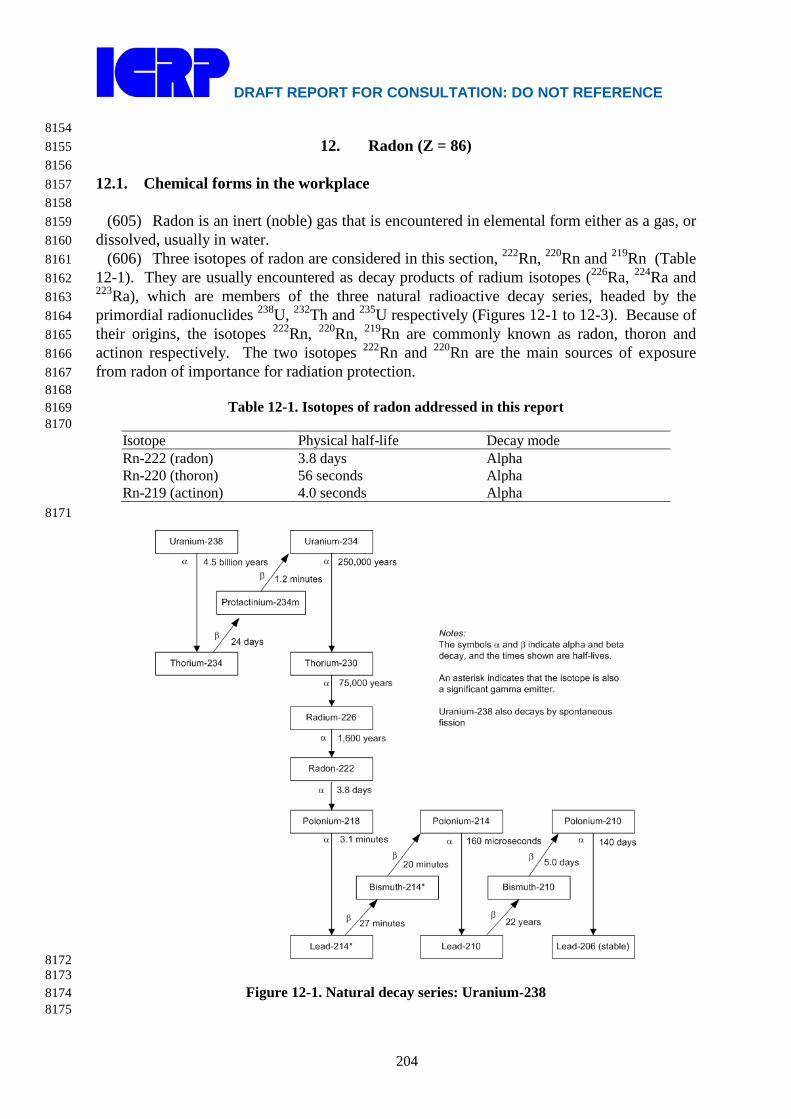
DRAFT REPORT FOR CONSULTATION: DO NOT REFERENCE
204
8154 12. Radon (Z = 86) 8155
8156 12.1. Chemical forms in the workplace 8157 8158
(605) Radon is an inert (noble) gas that is encountered in elemental form either as a gas, or 8159 dissolved, usually in water. 8160
(606) Three isotopes of radon are considered in this section, 222Rn, 220Rn and 219Rn (Table 8161 12-1). They are usually encountered as decay products of radium isotopes (226Ra, 224Ra and 8162 223Ra), which are members of the three natural radioactive decay series, headed by the 8163 primordial radionuclides 238U, 232Th and 235U respectively (Figures 12-1 to 12-3). Because of 8164 their origins, the isotopes 222Rn, 220Rn, 219Rn are commonly known as radon, thoron and 8165 actinon respectively. The two isotopes 222Rn and 220Rn are the main sources of exposure 8166 from radon of importance for radiation protection. 8167 8168
Table 12-1. Isotopes of radon addressed in this report 8169 8170
Isotope Physical half-life Decay mode Rn-222 (radon) 3.8 days Alpha Rn-220 (thoron) 56 seconds Alpha Rn-219 (actinon) 4.0 seconds Alpha
8171
8172 8173
Figure 12-1. Natural decay series: Uranium-238 8174 8175

DRAFT REPORT FOR CONSULTATION: DO NOT REFERENCE
205
Uranium-235*
Thorium-231Thorium-227*
Radium-223*
Radon-219*
Protactinium-231*
Polonium-215
Lead-211*
Actinium-227
Thallium-207
Francium-223*
Bismuth-211*
Lead-207 (stable)
700 million yearsα
β26 hours
19 days
11 days
4.0 seconds
1.8 milliseconds
2.1 minutes
α
α
α
α
α
4.8 minutes
36 minutesβ
β
α 33,000 years
Notes:The symbols α and β indicate alpha and beta decay, and the times shown are half-lives.
An asterisk indicates that the isotope is also a significant gamma emitter.
22 years (1%)
α
22 years (99%)
β
β
22 minutes
8176 8177
Figure 12-2. Natural decay series: Uranium-235 8178 8179
8180 Figure 12-3. Natural decay series: Thorium-232 8181
8182

DRAFT REPORT FOR CONSULTATION: DO NOT REFERENCE
206
(607) Uranium, radium and thorium occur naturally in soil and rocks and provide a 8183 continuous source of radon. Radon can escape from the Earth's crust either by molecular 8184 diffusion or by convection and as a consequence is present in the air outdoors and in all 8185 buildings including workplaces. The build up of activity concentrations of radon and its 8186 short-lived decay products within enclosed spaces gives rise to a radiation hazard. This 8187 applies particularly to workplaces such as underground mines, tourist caves, and water supply 8188 facilities where ground water with a high radon concentration is treated or stored. 8189
(608) In general the problems posed by radon (222Rn) are much more widespread than 8190 those posed by thoron (220Rn). Because thoron (220Rn) has a short half-life (56 s), it is less 8191 able than radon (222Rn) to escape from the point where is formed. As a consequence, building 8192 materials are the most usual source of indoor thoron exposure. In contrast, radon (222Rn), 8193 which has a half-life of 3.8 days can diffuse in soil more than a meter from the point where it 8194 is formed. As a result the ground underneath buildings is usually the main source of indoor 8195 radon (222Rn). Because actinon (219Rn) has an even shorter half-life (4 s) its contribution to 8196 workplace exposure is generally low and in most situations can be ignored. Dose coefficients 8197 for it and its short-lived decay products are discussed in Section 12.5.4. 8198
(609) Radon (222Rn), thoron (220Rn) and actinon (219Rn) gases decay into a series of solid 8199 short-lived radioisotopes (Figures 12-1 to 12-3). The resulting aerosol is created in two steps 8200 (Figure 12-4). After decay of the radon gas, the freshly formed radionuclides react rapidly (< 8201 1 s) with trace gases and vapours and grow by cluster formation to form particles around 1 8202 nm in size. These are referred to as unattached progeny. The unattached radionuclides may 8203 also attach to existing aerosol particles in the atmosphere within 1 – 100 s forming the so-8204 called attached progeny. The attached progeny can have a trimodal activity size distribution 8205 which can be described by a sum of three lognormal distributions (Porstendörfer, 2001). 8206 These comprise the nucleation mode with an activity median thermodynamic diameter 8207 (AMTD) between 10 nm and 100 nm, the accumulation mode with AMTD values of 100 – 8208 450 nm and a coarse mode with activity median aerodynamic diameter, AMAD > 1 μm. 8209 Generally, the greatest activity fraction is in the accumulation mode. 8210
8211 Figure 12-4. Schematic representation of the behaviour of radon progeny in an enclosed space, 8212 (NRC, 1991; Porstendörfer, 1994) 8213

DRAFT REPORT FOR CONSULTATION: DO NOT REFERENCE
207
8214 (610) Because radon progeny in the air can be removed by plate-out (i.e. by deposition on 8215
surfaces) and ventilation, the activity concentrations of the short-lived radon progeny in the 8216 air are less than that of the radon gas. This is quantified by the equilibrium factor, F which is 8217 a measure of the degree of disequilibrium between the radon gas and its progeny (see below). 8218 If the activity concentrations of the short-lived radon progeny were equal to the activity 8219 concentration of the radon gas (i.e. secular equilibrium had been reached) then F would be 1. 8220 However, because of plate-out and ventilation, F is in practice always less than 1; typically 8221 for 222Rn, F is 0.4 for indoor air and 0.2 for force-ventilated mines. 8222
(611) For exposures to radon (222Rn) and thoron (220Rn) gas, inhalation of their short-lived 8223 decay products generally gives much higher contributions to effective dose than inhalation of 8224 the gas itself (Figures 12-1 to 12-3). Following inhalation of the short-lived progeny most of 8225 their decay takes place in the lung before clearance can occur, either by absorption into blood 8226 or by particle transport to the alimentary tract. As a consequence the lung dose contributes 8227 more than 95% of the effective dose. Because of the importance of this route of exposure, 8228 detailed consideration is given below to exposures to radon and thoron decay products. 8229 Exceptionally, dose coefficients are given here for simultaneous intakes of radon with its 8230 short-lived decay products, under exposure conditions representative of two different types of 8231 workplace. 8232 8233 12.2. Special quantities and units 8234 8235
(612) Special quantities and units are used to characterise the concentration of radon and 8236 its short-lived progeny in the air, and the resulting inhalation exposure. 8237 8238 Concentration 8239
(613) The dose to the lung mainly arises from the inhalation of the short-lived radon 8240 progeny and the alpha particles emitted during their decay and that of their short-lived 8241 progeny. The quantity ‘potential alpha energy concentration (PAEC)’ of the radon progeny 8242 mixture was historically used as a measure of concentration that was an indicator of dose and 8243 risk. The potential energy, εp,i of an atom, i, in the decay chain of radon (222Rn) is the total 8244 alpha energy emitted during the decay of this atom to stable 210Pb. The PAE per unit of 8245 activity (Bq) of radionuclide, i, is εp,i / λr,i where λr (in s-1) is the radioactive decay constant. 8246 The PAE per atom and per unit activity are listed in Table 12-2 for the short-lived progeny of 8247 radon (222Rn) and thoron (220Rn). The PAEC, cp, of any mixture of short-lived radon progeny 8248 in air is the sum of the PAE of these atoms present per unit volume of air. Thus, if ci (in Bq 8249 m-3) is the activity concentration of decay product nuclide i, the PAEC of the progeny mixture 8250 is 8251 8252
( )∑=i
iripip cc ,, λε (Eq. 12-11) 8253
8254 (614) The SI unit of this quantity is J m-3 (1 J m-3 = 6.242 1012 MeV m-3). 8255 (615) The historical unit of PAEC that was used in the mining industry is the working 8256
level (WL). A concentration of 1 WL is defined, in ICRP Publication 65 (ICRP, 1993), as 8257 any combination of the short-lived radon progeny in 1 m3 of air that will result in the 8258 emission of 1.300 108 MeV of alpha energy (i.e. a PAEC of 1.300 108 MeV m-3). 8259
(616) The so-called equilibrium equivalent concentration (EEC) is defined as the activity 8260

DRAFT REPORT FOR CONSULTATION: DO NOT REFERENCE
208
concentration of radon gas, in equilibrium with its short-lived progeny which would have the 8261 same potential alpha energy concentration as the existing non-equilibrium mixture. It can 8262 therefore be calculated as follows for a given radon progeny mixture: 8263 8264
( )( )∑
∑=
iirip
iiripic
EEC,,
,,
λε
λε (Eq. 12-2) 8265
8266 (617) One WL equals approximately 3750 Bq m-3 of EEC of 222Rn (radon gas) or 8267
approximately 275 Bq m-3 of EEC of 220Rn (thoron gas). 8268 8269 Table 12-2. Potential alpha energy per atom and per unit activity for radon (222Rn) and thoron 8270 (220Rn) progeny. 8271 8272
Nuclide Half-life Potential alpha energy per atom per unit of activity MeV 10-12 J MeV Bq-1 10-10 J Bq-1
Radon (222Rn) progeny: 218Po 3.05 min 13.69 2.19 3.615 103 5.79 214Pb 26.8 min 7.69 1.23 1.784 104 28.6 214Bi 19.9 min 7.69 1.23 1.325 104 21.2 214Po 164 μs 7.69 1.23 2 10-3 3 10-6
Total at equilibrium, per Bq of 222Rn 3.471 104 55.6 Thoron (220Rn) progeny: 216Po 0.15 s 14.6 2.34 3.16 5.1 10-3
212Pb 10.64 h 7.8 1.25 4.312 105 691 212Bia 60.6 min 7.8 1.25 4.090 104 65.5 212Po 304 ns 8.78 1.41 3.85 10-6 6.2 10-9
Total at equilibrium, per Bq of 220Rn 4.721 105 756 a 212Bi decays into 212Po and 208Tl with branching ratio of 64% and 36%. 8273
8274 Equilibrium factor, F 8275
(618) The equilibrium factor, F is defined as the ratio of the EEC to the radon gas 8276 concentration. In other words, it is the ratio of the PAEC for the actual mixture of radon 8277 decay products to that which would apply at radioactive equilibrium. 8278
8279 Exposure 8280
(619) The PAE exposure is defined as the time integral of the PAEC in air. The SI unit of 8281 PAE exposure is J h m-3 and the historical unit applied to uranium mining is the working 8282 level month (WLM). The WLM is defined as the cumulative exposure from breathing an 8283 atmosphere at a concentration of 1 WL for a working month of 170 hours. The relationship 8284 between the historical and SI units is as follows: 8285 8286
1 WLM = 3.54 mJ h m-3 8287 1 mJ h m-3 = 0.282 WLM 8288
8289 (620) One WLM equals approximately 6.37 105 Bq h m-3 of EEC of 222Rn (radon gas) or 8290
approximately 4.68 104 Bq h m-3 of EEC of 220Rn (thoron gas). In terms of SI units, 1 J h m-3 8291

DRAFT REPORT FOR CONSULTATION: DO NOT REFERENCE
209
equals approximately 1.80 108 Bq h m-3 of EEC of 222Rn gas or approximately 1.32 107 Bq h 8292 m-3 of EEC of 220Rn gas. For 222Rn, if the exposure is expressed in terms of the radon gas 8293 concentration then the two units are related via the equilibrium factor: 1 WLM = (6.37 105 / 8294 F) Bq h m-3 or 1 J h m-3 = (1.80 108 / F) Bq h m-3. 8295
(621) Because of its short half-life, the gas activity concentration of thoron (220Rn) can 8296 vary substantially across an enclosed space and so it is not possible to use thoron gas 8297 concentration in dose evaluation. Therefore, for control purposes, the PAEC of the thoron 8298 progeny should be determined; that is, the EEC of thoron should be controlled. In ICRP 8299 Publication 65 (ICRP, 1993), it was stated that ‘for protection against thoron, it is usually 8300 sufficient to control the intake of the decay product, 212Pb, which has a half-life of 10.6 8301 hours’. This is because the PAE per unit activity inhaled is about 10 times higher for 212Pb 8302 than for other thoron progeny (Table 12-2). However, in this report doses are calculated for 8303 exposures of thoron and its decay products, considering intakes of 212Pb as well as 212Bi and 8304 220Rn. 8305 8306 Unattached fraction, fp 8307
(622) The unattached fraction, fp is defined as the fraction of the potential alpha energy 8308 concentration (PAEC) of the short-lived progeny that is not attached to the ambient aerosol. 8309 The magnitude of fp primarily depends on the concentration of particles of ambient aerosol, Z 8310 and can be estimated with the semi-empirical equations given by Porstendörfer, (2001): 8311 8312
Radon (222Rn) progeny: )(
4143−=
cmZf p (Eq. 12-3) 8313
Thoron (220Rn) progeny: )(
1503−=
cmZf p (Eq. 12-4) 8314
8315 (623) Porstendörfer and his colleagues measured the unattached fraction of radon and 8316
thoron progeny using a single screen diffusion battery with 50% penetration for 4 nm 8317 diameter particles. A condensation nuclei counter was used to measure Z for particle 8318 diameters > 5 nm. Equation (3) agrees fairly well with data for 2000 < Z < 7 105 cm-3 8319 (Porstendörfer, 2001). At lower particle concentrations (Z< 400 cm-3), the agreement with 8320 data is poor (Cheng et al., 1997). Also the above equation may underestimate fp in situations 8321 where the radon progeny is far from equilibrium as is the case in some modern mines, which 8322 are ventilated at a high rate to reduce radon concentrations (Cavallo et al., 1999). Because of 8323 the relatively long radioactive half-life of the thoron decay product 212Pb (10 h), the fp value 8324 for the thoron progeny is lower than that for the radon progeny under the same conditions. 8325 Reasonable agreement was obtained between equation (4.4) and the data of Tschiersch et al., 8326 2007, for 900 < Z < 3 104 cm-3. 8327 8328 Correlation between F and fp 8329
(624) For indoor air, F is weakly correlated with the unattached fraction, fp (Vaupotič, 8330 2007; Vaupotič and Kobal, 2006, Marsh et al., 2002; Huet et al., 2001a; Vargas et al., 2000; 8331 Chen et al., 1998; Tokonami, et al., 1996a; NRC, 1991; Vanmarcke, et al., 1989). This 8332 negative correlation between F and fp has also been observed in a tourist cave (Vaupotič, 8333 2008). The correlation can be explained as follows for conditions where the ventilation rate 8334 is relatively low: When the aerosol particle concentration is high the unattached fraction is 8335 low, and the equilibrium factor is relatively high as more of the radon progeny are attached 8336

DRAFT REPORT FOR CONSULTATION: DO NOT REFERENCE
210
and stay in the air. More stay in the air because plate-out rates (i.e. deposition rates) for the 8337 aerosol attached nuclides are significantly lower than that for the unattached nuclides 8338 (Porstendörfer, 1994). Taking account of this negative correlation between F and fp, it has 8339 been shown that for indoor air the radon gas concentration is a better index of dose than the 8340 PAEC under a range of aerosol conditions normally encountered (Vargas et al., 2000; Marsh 8341 and Birchall, 1998; Vanmarcke, et al., 1989; James et al., 1988). On this basis and because of 8342 practical considerations, radon gas measurements are generally carried out in homes and 8343 indoor workplaces. However, in mines with forced ventilation, the correlation between F and 8344 fp is unlikely, so control of radon exposure in mines should be in terms of PAE exposure. 8345 8346 12.3. External dose 8347 8348
(625) Radon progeny in the ambient air can plate-out (i.e. deposit) on surfaces including 8349 human skin. The alpha particles emitted will deliver a dose to the outer layers of the skin in 8350 areas exposed to the atmosphere such as neck and face whereas skin protected by clothing and 8351 hair will in general receive a minimal dose (AGIR, 2009). The amount of radon progeny 8352 depositing on the skin for a given air concentration mainly depends on the deposition 8353 velocity, which in turn depends on particle size and air movement. The BEIR VI report 8354 (NRC, 1999) gives values of absorbed dose rate to exposed areas of the skin as a result of 8355 domestic exposure to 222Rn based on the work of Harley and Robbins (1992) and of Eatough 8356 and Henshaw (1992). The latter authors give estimates of equivalent dose to skin of 1.4 10-8 8357 Sv per Bq h m-3 (range 0.97 10-8 to 9.710-8 Sv per Bq h m-3 ) for 222Rn and 1.1 10-7 Sv per Bq 8358 h m-3 (range 0 to 7.2 10-7 Sv per Bq h m-3) for EEC of 220Rn. These values relate to the 8359 basal cell layer of the face and neck with an assumed epidermal thickness of 50 μm. The 8360 values for 222Rn were calculated assuming F= 0.5 (and fp =0.03), so the estimated equivalent 8361 dose to skin in terms of mSv per WLM for indoor exposure is about 18 mSv per WLM 8362 (range 12 to 124 mSv per WLM). The estimated range mainly reflects the uncertainties in the 8363 deposition velocity of the radon progeny. As the tissue weighting factor for the skin is 0.01, 8364 this skin dose contributes a small amount to the overall effective dose (Table 12-15). 8365
(626) Charles (2004), point out that currently there is no definitive answer to the location 8366 and the identity of the target cells in the skin that play a dominate role in the induction of skin 8367 cancer. It has generally been assumed by several authors that the basal cell layer of the 8368 epidermis is the target cell layer. However, there are existing animal data that imply that the 8369 target cells are in the underlying dermis, in which case they may lie too deep to receive any 8370 significant dose from radon progeny on skin surface. In this report, the calculation of 8371 effective dose from exposure to radon and its progeny does not include dose to skin from 8372 radon progeny deposited on skin surface. 8373
(627) The external dose from submersion in a cloud of radon and its decay products is not 8374 considered in this report. 8375 8376 12.4. Routes of Intake 8377 8378 12.4.1. Inhalation 8379 8380
(628) Consideration is given to the two components of exposure: 8381 • Inhalation of the short-lived decay products; 8382 • Inhalation of radon gas. 8383

DRAFT REPORT FOR CONSULTATION: DO NOT REFERENCE
211
(629) Absorption parameter values for radon decay products are addressed in the 8384 inhalation sections of the elements (lead, bismuth and polonium) and are given in Table 12-3. 8385 As described in OIR part 1, Section 3.2.3 shared kinetics are assumed in the respiratory tract. 8386 However, analysis has shown that the application of independent kinetics in the respiratory 8387 tract rather than shared kinetics would make little difference to the lung dose; less than about 8388 5%. 8389
(630) Information is available on the behaviour of inhaled radon and other inert gases in 8390 man. This information is given in Section 12.4.3, which describes the biokinetic model for 8391 radon following inhalation and ingestion. 8392 8393
Table 12-3. Absorption parameter values for inhaled radon progeny 8394 8395 Inhaled radon progeny Dissolution parameter
values Uptake parameter values
Absorption from the alimentary tract, fA fr sr (d–1) ss (d–1) fb Sb (d–1)
Polonium 1 3 – – – 0.1 Lead 0.1 100 1.7 0.5 1.7 0.02 Bismuth 1 1 – – – 0.05 8396 Inhalation of the short-lived decay products of 222Rn 8397
(631) Aerosol characteristics need to be defined in order to calculate doses from inhaling 8398 radon progeny. The activity size distribution of the radon progeny aerosol can be very 8399 variable and depends upon the exposure scenario. For the purposes of dose calculation, 8400 aerosol parameter values are given for indoor workplaces and mines (Table 12-4). However, 8401 for completeness measured values of aerosol parameters for tourist caves, water supply 8402 facilities and thermal spas are also discussed. Because the absolute risk of lung cancer from 8403 inhaling radon and its progeny is greatly influenced by tobacco smoking, choosing aerosol 8404 parameter values other than those given in Table 12-4 is considered generally not to be 8405 warranted for radiation protection purposes. 8406
(632) The relative activity size distribution of unattached radon progeny clusters depends 8407 on the concentration of water vapour, trace gases and the electrical charge distribution of the 8408 radionuclides in the air. Porstendörfer (2001) found that under ‘normal’ conditions of 8409 humidity and radon concentration, the activity size distribution of the unattached progeny can 8410 be approximated with three lognormal distributions. The AMTD values measured were 0.6 8411 nm, 0.85 nm, and 1.3 nm with geometric standard deviations (σg) of about 1.2. In places with 8412 high radon concentrations, the fraction with the greatest AMTD value (1.3 nm) was not 8413 observed. The neutralisation rate of the unattached clusters increases with radon 8414 concentration and so it is likely that modes below 1 nm are mainly associated with neutral 8415 clusters, whereas modes above 1 nm are charged clusters (Porstendörfer et al., 2005). Huet et 8416 al. (2001b) also measured the size distribution for the unattached radon progeny and found a 8417 unimodal distribution with median diameters between 0.5 and 1.5 nm and values of σg 8418 between 1.2 and 1.4. Other workers have also measured a unimodal distribution in the range 8419 0.7 – 1.7 nm (Cheng et al., 1997; El-Hussein, et al., 1998; Mohammed, 1999; El-Hussein, 8420 2005). For the purposes of dose calculation and for simplicity, a unimodal distribution with 8421 an AMTD of 0.9 nm and a σg of 1.3 is assumed here for all exposure scenarios. 8422
(633) The size of the unattached radon progeny is assumed to remain constant in the lung 8423 (NRC, 1991). However, some of the ambient aerosols, to which radon progeny attach, are 8424

DRAFT REPORT FOR CONSULTATION: DO NOT REFERENCE
212
unstable in saturated air (i.e. hygroscopic) and are assumed to grow very quickly on inhalation 8425 by a given factor (Sinclair et al., 1974; NRC, 1991). For modelling purposes and simplicity, it 8426 is assumed that the AMTD increases by the hygroscopic growth factor (hgf) instantaneously 8427 as the particle enters the nose or mouth. Assumed values for the hgf are given in Table 12-4 8428 for different exposure scenarios. 8429
(634) Porstendörfer (1996) pointed out that results of experimental studies show that the 8430 differences between the activity size distribution of the individual decay products attached on 8431 aerosol particles are negligible. Therefore, for simplicity and for dosimetry purposes, the 8432 aerosol distribution of each of the short-lived 222Rn progeny (i.e. of 218Po, 214Pb and 214Bi) is 8433 assumed to be the same. 8434
(635) Low pressure cascade impactors, which measure the aerodynamic diameter, can be 8435 used to measure the activity size distribution of the attached progeny. Such results are 8436 expressed in terms of an AMAD with a σg for a given mode of the attached size distribution 8437 (Reineking et al., 1994). However, measurements carried out with diffusion batteries measure 8438 the thermodynamic diameter and the results are expressed in terms of AMTD with a σg for a 8439 given mode. For particle sizes less than 500 nm diffusion is the dominate mechanism of 8440 deposition in the respiratory tract and the AMTD is the parameter that characterises 8441 deposition by diffusion. 8442 8443 8444 8445
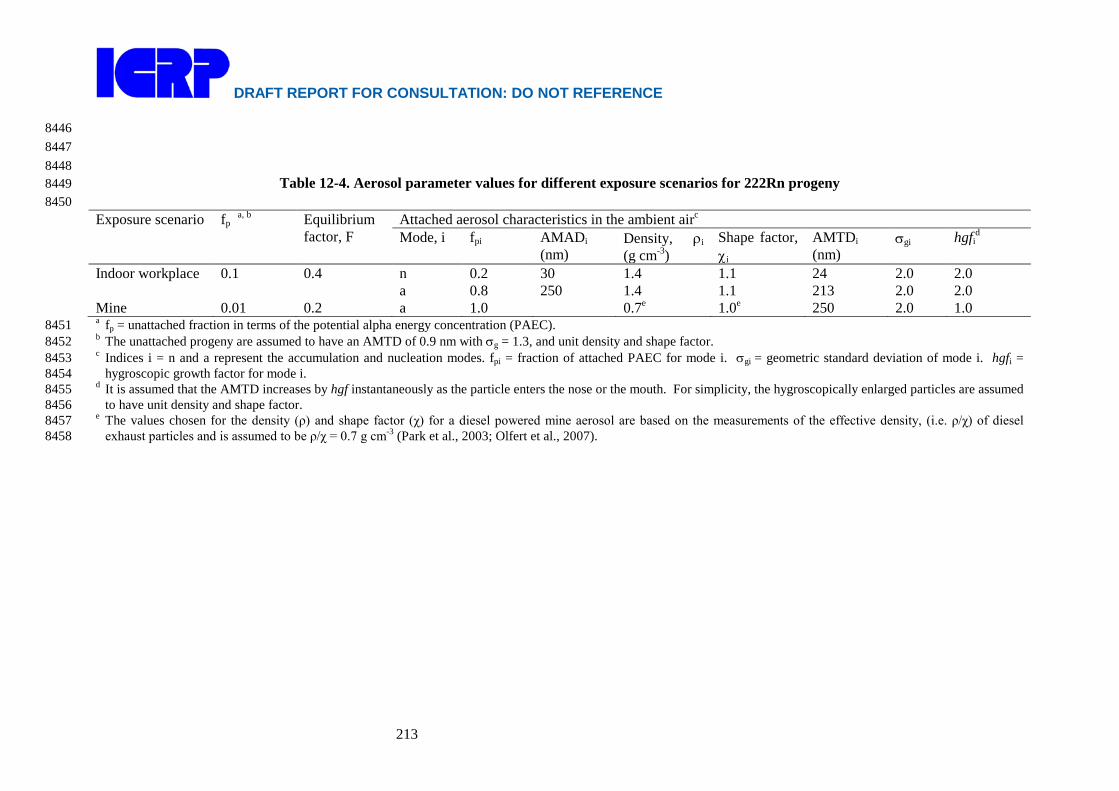
DRAFT REPORT FOR CONSULTATION: DO NOT REFERENCE
213
8446 8447 8448
Table 12-4. Aerosol parameter values for different exposure scenarios for 222Rn progeny 8449 8450 Exposure scenario fp a, b Equilibrium
factor, F Attached aerosol characteristics in the ambient airc
Mode, i fpi AMADi (nm)
Density, ρi (g cm-3)
Shape factor, χi
AMTDi (nm)
σgi hgfid
Indoor workplace 0.1 0.4 n a
0.2 0.8
30 250
1.4 1.4
1.1 1.1
24 213
2.0 2.0
2.0 2.0
Mine 0.01 0.2 a 1.0 0.7e 1.0e 250 2.0 1.0 a fp = unattached fraction in terms of the potential alpha energy concentration (PAEC). 8451 b The unattached progeny are assumed to have an AMTD of 0.9 nm with σg = 1.3, and unit density and shape factor. 8452 c Indices i = n and a represent the accumulation and nucleation modes. fpi = fraction of attached PAEC for mode i. σgi = geometric standard deviation of mode i. hgfi = 8453
hygroscopic growth factor for mode i. 8454 d It is assumed that the AMTD increases by hgf instantaneously as the particle enters the nose or the mouth. For simplicity, the hygroscopically enlarged particles are assumed 8455
to have unit density and shape factor. 8456 e The values chosen for the density (ρ) and shape factor (χ) for a diesel powered mine aerosol are based on the measurements of the effective density, (i.e. ρ/χ) of diesel 8457
exhaust particles and is assumed to be ρ/χ = 0.7 g cm-3 (Park et al., 2003; Olfert et al., 2007). 8458

DRAFT FOR MC REVIEW PRIOR TO CONSULTATION
214
Indoor workplaces 8459 (636) Published data on activity size distributions in indoor workplaces other than homes 8460
are relatively sparse. Reichelt et al. (2000) carried out activity size measurements of radon 8461 progeny at several workplaces including offices, workshops, factories, kitchens, agricultural 8462 facilities and public buildings like schools, hospitals and art galleries. Porstendörfer (2001) 8463 summarised their results and suggested dividing indoor workplaces into two categories: 8464 workplaces in rooms without coarse particles, and workplaces with coarse particles generated 8465 by human activities and dispersion processes. Calculated values of the equivalent dose to the 8466 lung per unit exposure for the two categories differed by less than 10% (Porstendörfer, 2001). 8467 In this report workplaces in rooms without coarse particles are considered. 8468
(637) The parameter values of the activity size distribution for the attached radon progeny 8469 assumed for indoor workplaces (Table 12-4) are based primarily on the measurement results 8470 of Porstendörfer (2001) and on results published for homes. Marsh et al. (2002) summarises 8471 measurement results for homes published in the literature since 1980. 8472
(638) For an aged aerosol (i.e. without additional aerosols), the presence of a nucleation 8473 mode is not always measured but can be observed when additional aerosols are produced 8474 (Marsh et al., 2002; Huet et al., 2001b; Tu et al., 1991; NRC, 1991). For an aged aerosol, 8475 Huet et al. (2001b) found that the attached size distribution consisted only of the 8476 accumulation mode. However, intercomparison measurements performed in a house in 8477 Germany, without additional aerosols, showed nucleation and accumulation modes with the 8478 fraction of the attached PAEC in the nucleation mode (fpn) being about 0.2 (Reineking et al., 8479 1994). Measurements of the activity size distribution of the attached progeny in a dwelling in 8480 Okinawa, Japan also showed a nucleation mode with an activity fraction of 0.14 (Kranrod et 8481 al., 2009). The mean AMAD of the nucleation mode was about 30 nm with a σg of 1.6. 8482 Porstendörfer (2001) reported values of fpn between 0.2 and 0.5 for workplaces. The AMAD 8483 of the nucleation mode was reported to be between 15 to 40 nm with a σg ranging between 8484 1.6 and 2.2. A fpn value of 0.2 is assumed here for indoor workplaces. An AMAD of 30 nm 8485 with a σg of 2.0 is assumed for the nucleation mode. 8486
(639) Indoor measurements of the AMAD of the accumulation mode show a wide range of 8487 values, typically between 110 – 370 nm (Huet et al., 2001b, Porstendörfer, 2001, Mohammed, 8488 1999, El-Hussein et al., 1998; Tu et al., 1991; Tu and Knutson, 1988). A central value of 250 8489 nm is assumed here with a σg of 2.0. 8490
(640) Sinclair et al. (1974) found that atmospheric particles in their laboratory increased in 8491 diameter by about a factor of 2 when the relative humidity increased from zero to 98%. For 8492 indoor workplaces a hygroscopic growth factor (hgf) of 2.0 is assumed here for the ambient 8493 aerosol. The density (g cm-3) and the shape factor of these hygroscopically enlarged particles 8494 are taken to be unity. 8495
(641) Measurements of the unattached fraction, fp, in indoor workplaces such as schools 8496 and offices show a wide range of values, typical between 3% and 15% and with some values 8497 greater than 20% (Vaupotič, 2008b; Porstendörfer, 2001; Yu et al., 1998; Tokonami et al., 8498 1996b; Hattori et al., 1995, Hattori and Ishida, 1994). Typical values of fp in homes range 8499 between 4% and 20% with some values greater than 40% (Kranrod et al., 2009; El-Hussein, 8500 2005; Mohamed, 2005; Vargas, et al., 2000; Tokonami, et al., 1996a; Yu, et al., 1996; Hopke, 8501 et al., 1995; Reineking and Porstendörfer, 1990; Chen, et al., 1988; Kojima and Abe, 1988). 8502 A representative value of fp = 0.1 is chosen for indoor workplaces. 8503
(642) The value of the equilibrium factor, F, depends mainly on the indoor ventilation rate 8504 due to opening/shutting of windows, use of electric fans, air conditioners and dehumidifiers. 8505

DRAFT FOR MC REVIEW PRIOR TO CONSULTATION
215
(Iyogi et al., 2003; Iimoto, 2000; Iimoto et al., 2001; Chen, et al., 1998). Typically, mean 8506 values of F ranged from 0.3 to 0.6 for schools, kindergardens, offices, nuclear power plant, 8507 factories and cafes (Labidi et al., 2010; Vaupotič, 2008b, Maged, 2006; Misdaq and Amghar, 8508 2005; Iyogi et al., 2003; Misdaq and Flata, 2003; Tokonami et al., 2003, 1996; Yu et al., 8509 2000, 1998; Hattori et al., 1995; Hattori and Ishida, 1994). In its 2000 report, UNSCEAR 8510 assumed an F value of 0.4 for indoor exposures, based mainly on measurements in dwellings 8511 in the USA (Hopke et al., 1995) and in India (Ramachandran and Subba Ramu, 1994). A F 8512 value of 0.4 is assumed here for indoor workplaces, which is in agreement with the value 8513 given in ICRP Publication 65 (ICRP, 1993). 8514 8515 Mines 8516
(643) Characterising the aerosol parameters for mines is difficult because of the highly 8517 variable conditions and because of the different types of mining conditions such as use of 8518 diesel or electric powered equipment, different ventilation rates, and the type of heating used 8519 during the winter months (Marsh et al., 2008; Cavallo, 2000). 8520
(644) Measurements were made of the activity size distribution in two mines in the USA in 8521 Colorado and New Mexico (Cooper et al., 1973). Because the measurements were made 8522 during wintertime, it is likely that the incoming ventilation air was heated by burning propane 8523 gas. However, it is not clear from the report whether the heaters were being used when the 8524 measurements were made. Both mines used diesel engines. The measurements were carried 8525 out with a low pressure impactor having five stages and a backup filter. However, its 8526 resolution was relatively poor. These data were reanalysed by Cavallo (1998) using modern 8527 unfolding techniques. The reanalysed data showed that for the Colorado mine the AMAD of 8528 the principal mode ranged from 111 nm to 303 nm with a mean of 200 nm. The mean value 8529 of σg was 2.0. Four out of the nine spectra had a secondary mode with a peak around 30 nm 8530 containing about 20-25% of the PAEC. However, given the poor resolution of the impactor 8531 the authors did not consider this secondary mode in their dose calculations. For the New 8532 Mexico mine, the mean values of the AMAD and σg of the accumulation modes were 140 nm 8533 and 2.9 respectively (Cavallo, 1998). 8534
(645) Measurements were carried out in four uranium mines in New Mexico, USA during 8535 the summer of 1971 (George et al., 1975). All four mines were diesel powered with one of 8536 the mines being much less active than the others. The activity size measurements obtained 8537 with a diffusion battery were reanalysed by Knutson and George (1990). Twenty six spectra 8538 were obtained; nine of the spectra were unimodal with a mean AMTD of 150 nm ( 80 – 210 8539 nm) and a σg of about 2.7, and 11 spectra had both unattached and accumulation modes. The 8540 remaining six spectra showed one activity peak at 100 – 200 nm and another at 5 – 10 nm. 8541 The average value of the equilibrium factor was 0.17. 8542
(646) During the summer of 1978 measurements were carried out with a diffusion battery 8543 in a Canadian diesel powered uranium mine (Busgin et al., 1981). An AMTD of about 100 8544 nm with a σg of 1.9 was measured in an exhaust ventilation area of the mine. The unattached 8545 fraction of 218Po was estimated to be less than 2%. Based on the measured particle 8546 concentration (105 cm-3), fp is calculated to be about 0.4%. The same group also carried out a 8547 second set of measurements during the winter of 1985 in two mines in Canada; one mine used 8548 diesel equipment and the other used electrically powered equipment (Kahn et al., 1987). In 8549 the diesel powered mine the AMTD was about 90 nm with a σg of 1.8 whereas in the 8550 electrically powered mine the AMTD was about 50 nm with a σg of 1.8. The measurements 8551 were carried out with a set of diffusion batteries which had relatively poor resolution. 8552
(647) Activity size measurements have been performed at a diesel powered uranium mine 8553
DRAFT FOR MC REVIEW PRIOR TO CONSULTATION
216
in France, at the Bellezane mining centre during the summer of 1989 (Boulaud and Chouard, 8554 1992). The gallery cross section was 10 m2 with mean air velocities of about 1 m s-1. A 8555 combination of a cascade impactor in series with a diffusion battery was used to carry out the 8556 measurements. The AMTD ranged from 150 nm to 210 nm with a mean of 178 nm. The 8557 aerosol concentration was also measured; mean values per half day varied from 6 104 to 9 104 8558 cm-3. This indicates fp values of less than about 1%. 8559
(648) Butterweck et al. (1992) carried out activity size measurements in underground 8560 mines in Germany with a low pressure cascade impactor and a high volume impactor. The 8561 unattached fraction was also measured with wire screens. Their results showed that with 8562 diesel engines, the diesel aerosol dominates the mine aerosol resulting in a very low 8563 unattached fraction; 0.1% - 2.5% with a mean of 0.7%. In the diesel powered slate mine, they 8564 found that during working hours the AMAD of the accumulation mode was about 200 nm 8565 with a σg of about 2.0. During non-working hours the AMAD increased to about 350 nm. 8566 For the other active mines in Germany (barite: Dreislar, Bad Lauterberge; iron: Salzgitter; 8567 uranium: Groβ-Schloppen), the mean values of the AMAD ranged from 180 – 270 nm during 8568 working hours. The equilibrium factor value ranged from 0.3 to 0.6 with a mean of 0.45. 8569
(649) Solomon et al. (1993, 1994) carried out activity size distributions measurements in 8570 an underground uranium mine, at Olympic Dam, South Australia. Measurements were 8571 carried out with a serial graded screen array and a diffusion battery. In areas of the mine 8572 where there were large diesel-powered vehicles, the AMTD of the accumulation mode ranged 8573 from 200 to 300 nm. The average value of the AMTD was 250 nm with a σg of about 2.5. In 8574 the areas of the mine where there were no vehicles or the ventilation intakes were close by, 8575 the AMTD values were smaller in the range 90-200 nm with a mean of 150 nm. The mean 8576 value of the unattached fraction throughout the mine was about 3% to 4% and the mean value 8577 of the equilibrium factor was about 0.2. 8578
(650) Measurements have been carried out to characterise the aerosol in a wet underground 8579 uranium mine in northern Saskatchewan, Canada (Cavallo, 1997, 2000; Cavallo et al., 1999, 8580 Wu-Tu et al., 1997). This mine used state-of-the art mining technology and used diesel 8581 powered equipment extensively. Because of the exceptionally high grade ore, the mine 8582 ventilation rate was very high; about 3.6 104 m3 min-1, which was estimated to be about one 8583 air change per 3 minutes. The average air velocity in the main decline was about 5 m s-1 (12 8584 mph). Measurements were carried out in the winter of 1995 and in the summer of 1996. An 8585 impactor with a graded screen array was used to determine the size distribution over a range 8586 of particle sizes of 0.6 to 5000 nm. During the winter months the temperature inside the mine 8587 was maintained at 5ºC by direct burning of propane gas to heat the ventilation air. As a 8588 result, the mine aerosol consisted of particles from the combustion of propane gas as well as 8589 diesel particles. The winter time measurements carried out at a stope and a drilling area where 8590 miners were working showed predominately a two modal distribution for the attached 8591 progeny. The fraction of the attached PAEC associated with the nucleation and accumulation 8592 modes were about 65%, and 35%, and the mean values of the AMAD were about 60 nm and 8593 330 nm respectively. The unattached fraction (fp) was about 1%. Winter time measurements 8594 were also carried out at a bolt-storage bay next to a major mine exhaust. Most of these 8595 measurements showed that the attached progeny consisted of the nucleation mode containing 8596 about 97% of the attached PAEC, on average, with AMAD values between 50 and 75 nm. 8597 The coarse mode accounted for the remaining 3% of attached PAEC with an AMAD between 8598 2 and 8 μm. Typically fp was less than 2% and the mean value of the AMTD of the 8599 unattached progeny was less than 1 nm. The results of the summer time measurements of 8600 1996 showed that throughout the mine the AMAD values ranged from 50 nm to 120 nm with 8601
DRAFT FOR MC REVIEW PRIOR TO CONSULTATION
217
a mean value of 85 nm and σg of about 2.0. The average value of fp was about 6% whereas 8602 the expected value based on particle concentration was 0.3%. This unexpected high value of 8603 fp was theoretically shown to occur under conditions when the radon progeny is far from 8604 equilibrium as was the case in this Canadian mine, which was ventilated at a high rate 8605 (Cavallo et al., 1999). The average value of the equilibrium factor was 0.08. 8606
(651) Tokonami, et al. (2005) measured the activity size distribution in an underground 8607 mine located in the Gifu prefecture region of Japan. A cascade impactor with ten stages and a 8608 graded screen array were used for the measurements. The AMTD of the unattached progeny 8609 was 0.8 nm with a σg of 1.5. The activity size distribution of the attached progeny was 8610 represented by a single mode having an AMAD of 162 nm with a σg of 3.1. 8611
(652) Based on the measurements of Cooper et al. (1973) in US mines and the 8612 measurements of Bigu and Kirk (1980) in Canadian mines, a panel of experts from the 8613 National Research Council (NRC, 1991) recommended an AMTD of 250 nm in areas of 8614 active mining and a fp value of 0.5%. In areas of transport and maintenance work (i.e. 8615 haulage drifts), a fp value of 3% was assumed. In these areas a lower AMTD value of 150 nm 8616 was assumed based on the measurement data of George et al., 1975, which was reanalysed by 8617 Knutson and George (1990). 8618
(653) Aerosol parameter values are given for a diesel powered mine with medium to good 8619 ventilation (Table 12-4). These chosen values are mainly based on the measurements carried 8620 out in mines in Australia (Solomon et al., 1993, 1994), France (Bouland and Chouland, 1992) 8621 and Germany (Butterweck et al., 1992). For diesel powered mines it is assumed that the 8622 aerosol does not increase in size in the respiratory tract because diesel aerosols are 8623 hydrophobic (Cavallo, 2000; Weingartner et al., 1997). 8624
(654) For a diesel powered mine it is assumed that the aerosol is mainly dominated by the 8625 diesel aerosol. Several workers have calculated the effective density of diesel exhaust 8626 particles from measurements of the thermodynamic diameter (dth) and aerodynamic diameter 8627 (dae) of the exhaust particles (Park et al., 2003; Olfert et al., 2007). The effective density is 8628 the ratio of the particle density (ρ) and shape factor (χ). Results indicate that the effective 8629 density decreases with increasing dth in the size range from 50 – 300 nm. This mainly occurs 8630 because particles become more highly agglomerated as size increases. The smaller particles 8631 are more compact than the larger particles and therefore have a higher effective density. 8632 Typically, the effective density varies from 1.2 to about 0.3 g cm-3 depending on size and fuel 8633 composition; higher effective densities are observed for high sulphur fuel. The chosen values 8634 for the effective density of the aerosol in diesel powered mines are based on the 8635 measurements of Park et al. (2003) and Olfert et al. (2007). 8636
(655) It is acknowledged that the exposure conditions in mines today are significantly 8637 different from those 10 to 20 years ago and that the chosen aerosol parameter values are not 8638 necessarily representative of mines today. However, there are currently no published data on 8639 aerosol characteristics in modern mines. 8640 8641 Tourist caves 8642
(656) Information on exposure conditions in tourist caves is given here for completeness. 8643 Reference parameter values for tourist caves are not given in this report. 8644
(657) Typically there is no additional ventilation in tourist caves as forced ventilation may 8645 alter the humidity inside the cave affecting some of the geological formations that attract 8646 tourists. As a result radon concentrations can reach high levels of several thousand Bq m-3 8647 (Butterweck et al., 1992; Sainz et al., 2007). Several measurements have been carried out in 8648 natural caves to characterise the aerosols. 8649
DRAFT FOR MC REVIEW PRIOR TO CONSULTATION
218
(658) Butterweck et al. (1992) carried out activity size measurements in a natural tourist 8650 cave, in Postojna, Slovenia, with a low pressure cascade impactor and a high volume 8651 impactor. The unattached fraction was also determined from wire screen measurements. The 8652 AMAD of the accumulation mode ranged from 120 nm to 290 nm with a mean of 230 nm. 8653 The mean σg value of the accumulation mode was 2.2. The fp value varied from 6% to 16% 8654 with a mean of 10%. The average value of the particle concentration was about 3000 cm-3. 8655 The F value range from about 0.3 to 0.5 with a mean of 0.4. 8656
(659) Solomon, et al. (1992) used a parallel wire screen diffusion battery and a serial 8657 graded screen array battery to measure the activity size distribution of the radon progeny in a 8658 limestone cave, Victoria, Australia. Measurements were carried out over a 3 day period 8659 during October 1990 at different sites in the cave. The accumulation mode had an AMTD of 8660 170 nm and the unattached mode had an AMTD of 1.1 nm. The fp value throughout the cave 8661 varied from 11% to 18% whereas the F factor varied from 0.2 to 0.5. The average fp value 8662 weighted by the occupancy of the tour guides in each sampling site was 14%. Measurements 8663 of the radon concentration carried out during June and October indicated that the radon 8664 concentration is relatively constant throughout the year. 8665
(660) Measurements have been carried out over a 3 day period during the summer of 1994 8666 in the Carlsbad Caverns, in southern New Mexico to determine air exchange rate, aerosol 8667 characteristics and radon progeny activity size distributions (Cheng et al., 1997). During the 8668 summer months the outside air temperature is much greater than inside the cave, which keeps 8669 the cave air stagnant. The mean ventilation rate was measured to be 2 10-3 h-1, which was 8670 estimated to be one air exchange every 18 days. The measured particle concentration was 8671 very low; average daily values were between 280 and 385 cm-3. As a result the measured fp 8672 values were high; values ranged from 25% to 60% with a mean of 44%. The average value of 8673 F was 0.4. The activity size measurements were carried out with a graded diffusion battery. 8674 The AMTD of the unattached particles were between 0.6 and 0.8 nm, and the attached mode 8675 had a peak > 50 nm. It was noted that the particle concentration measurements made in the 8676 same area of the cave during summer months by Wilkening and Romero (1981) were more 8677 than twice as high, indicating fp values lower by a factor of 2 or more. 8678
(661) Sainz et al. (2007) carried out radon concentration and particle concentration 8679 measurements in tourist caves located in the region of Cantabria in the North of Spain. The 8680 results of the particle concentration measurements were 464 cm-3 in the Castillo cave and 8681 1514 cm-3 in the Monedas cave. This indicates fp values of 86% and 26% respectively. 8682
(662) Measurements of the unattached fraction and equilibrium factor have been carried 8683 out in the Postojna Cave, Slovenia for 10-15 days during summer and winter months of 8684 consecutive years from 1998 to 2001 (Vaupotič, 2008a). Measurements were carried out at 8685 the railway station in the cave and at the lowest point of a walking tour. There is no forced 8686 ventilation in the cave; however during the winter months there is a natural draught of air 8687 from the cave to the outdoors as the temperature in the cave is greater than the outdoor 8688 temperature, whereas in the summer months this draught is minimal. As a consequence, the 8689 radon concentration in the cave is higher in the summer compared with the winter. The 8690 measurement results show that unattached fraction is higher in the summer compared with the 8691 winter. At the lowest point of the cave, mean values of fp were about 60% in the summer and 8692 about 12% in the winter; the mean values of F were about 0.3 in the summer and 0.6 in the 8693 winter. Values of F were negatively correlated with fp. At the railway station during the 8694 summer, mean values of fp and F were 17% and 0.6 respectively. 8695
(663) Rosvenská, et al. (2008) measured the unattached fraction, equilibrium factor and the 8696 particle size spectrum in the Bozkov dolomite cave, Czech Republic. The fp value was low 8697

DRAFT FOR MC REVIEW PRIOR TO CONSULTATION
219
and varied between 1% and 3%. The F value was about 0.7. The activity size distribution 8698 was theoretically determined from the particle size distribution. For the attached progeny the 8699 AMAD and σg of three modes were calculated: 140 nm with σg = 1.7; 720 nm with σg = 1.4 8700 and 1.9 μm with σg = 1.9. The fraction of the PAEC associated with each mode was not 8701 given. 8702 8703 Water Supply facilities and Spas 8704
(664) Information on exposure conditions in water supply facilities and spas is given here 8705 for completeness. Reference parameter values for water supply facilities and spas are not 8706 given in this report. 8707
(665) High levels of 222Rn gas concentrations in indoor air have been measure at water 8708 supply facilities where ground water with a high radon concentration is treated or stored 8709 (Trautmannsheimer, 2003). Porstendörfer and Reineking (1999) measured the activity size 8710 distribution at a water supply station in Germany. About 84% of the attached PAEC was 8711 associated with the accumulation mode, having an AMAD of 300 nm with a σg=1.8. The 8712 remaining 16% of the attached PAEC was associated with the nucleation mode, having an 8713 AMAD of 50 nm with a σg=1.5. They reported a fp value of 0.05. The relative humidity at a 8714 water supply station was reported to be close to 100% (Porstendörfer, 2001). 8715
(666) Thermal spa facilities have been used for medical therapy and rehabilitation centres 8716 as well as for recreational purposes. Radon emanating from the thermal waters is an 8717 additional source of radiation exposure to the working personnel as well as to the bathers. 8718 Measurements of 222Rn in air in thermal spas have shown that the dominant mechanism by 8719 which 222Rn is released from water to air is during bath filling and to a lesser extent during 8720 bathing as a result of water agitation (Vogiannis et al., 2004a, Lettner et al., 1996). During 8721 bathtub filling, F is initially low but then gradually increases and reaches a peak with a time 8722 delay preceding a 222Rn peak. Correspondingly, the fp value is initially high but then 8723 decreases and reaches a minimum. Average values of F and fp have been reported for 8724 measurements carried out in treatment/bath rooms, rest rooms and reception rooms of spas in 8725 Greece (Vogiannis et al., 2004b, 2004c); average values of fp range from 0.06 to 0.12 and F 8726 values range from 0.2 to 0.4. However, Geranios et al. (2004) reported higher values of fp of 8727 about 0.23 in a treatment room and a reception room of the spa of Loutra Eipsou, Greece. 8728 Values of F measured in treatment rooms of spas in Slovenia and Austria range from 0.14 – 8729 0.45 (Vaupotič and Kobal , 2001; Lettner et al., 1996). In two Spanish spas, the estimated 8730 average F value was 0.6 (Soto and Gómez, 1999). 8731 8732 Inhalation of the short-lived decay products of 220Rn 8733
(667) Thoron (220Rn) decays into the short-lived progeny of 216Po, 212Pb, and 212Bi (Figure 8734 12-2, Table 12-2. As can be seen from Table 12-2, the PAE per unit activity of 212Pb is about 8735 10 times higher than for other thoron progeny. As a consequence, ICRP Publication 65 8736 (ICRP, 1993) states that “For protection against thoron, it is usually sufficient to control the 8737 intake of the decay product, lead-212, which has a half-life of 10.6 hours.” In this report the 8738 intake of 212Bi is also considered, but most of the dose arises from the intake of 212Pb. The 8739 activity size distribution of 212Bi attached on aerosols is assumed to be the same as that for 8740 212Pb. 8741
(668) Published data on the activity size distributions of the thoron decay product, 212Pb 8742 are relatively sparse. It has been suggested that because of the longer radioactive half-life of 8743 212Pb compared with that of 222Rn progeny that the aerosol size of attached 212Pb is likely to 8744 be larger compared with that of 222Rn progeny (Khan et al., 1987). The longer half-life means 8745
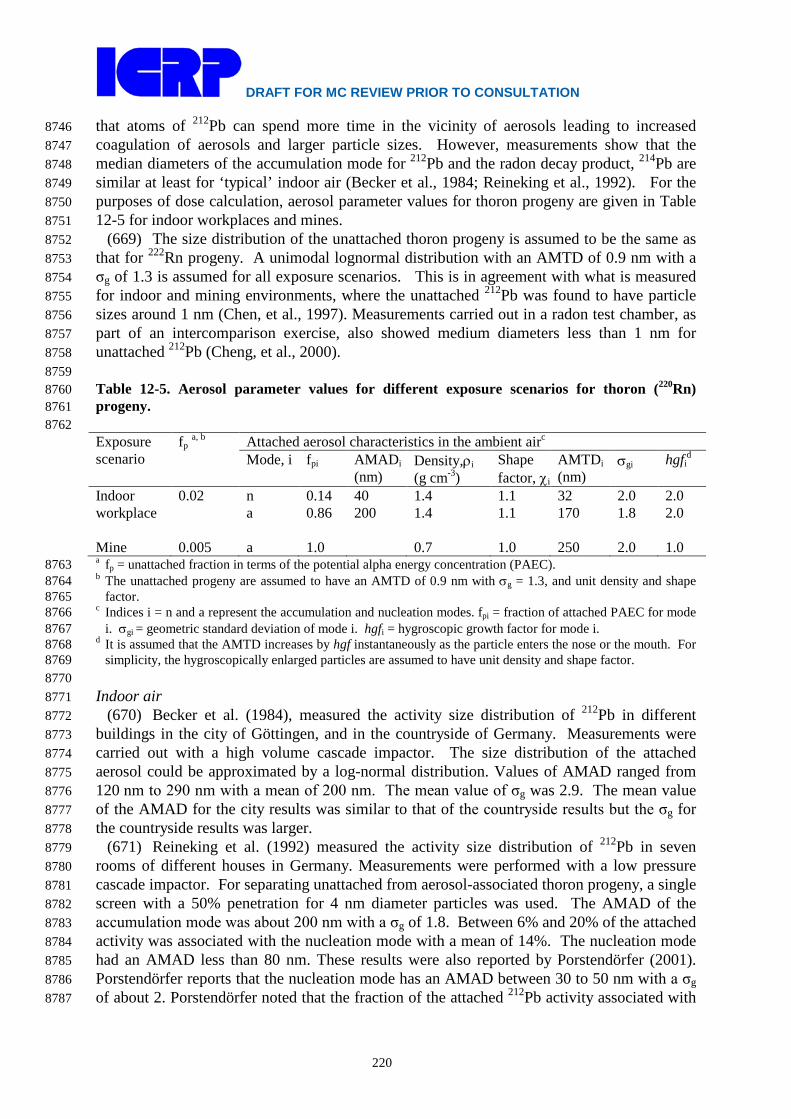
DRAFT FOR MC REVIEW PRIOR TO CONSULTATION
220
that atoms of 212Pb can spend more time in the vicinity of aerosols leading to increased 8746 coagulation of aerosols and larger particle sizes. However, measurements show that the 8747 median diameters of the accumulation mode for 212Pb and the radon decay product, 214Pb are 8748 similar at least for ‘typical’ indoor air (Becker et al., 1984; Reineking et al., 1992). For the 8749 purposes of dose calculation, aerosol parameter values for thoron progeny are given in Table 8750 12-5 for indoor workplaces and mines. 8751
(669) The size distribution of the unattached thoron progeny is assumed to be the same as 8752 that for 222Rn progeny. A unimodal lognormal distribution with an AMTD of 0.9 nm with a 8753 σg of 1.3 is assumed for all exposure scenarios. This is in agreement with what is measured 8754 for indoor and mining environments, where the unattached 212Pb was found to have particle 8755 sizes around 1 nm (Chen, et al., 1997). Measurements carried out in a radon test chamber, as 8756 part of an intercomparison exercise, also showed medium diameters less than 1 nm for 8757 unattached 212Pb (Cheng, et al., 2000). 8758 8759 Table 12-5. Aerosol parameter values for different exposure scenarios for thoron (220Rn) 8760 progeny. 8761 8762 Exposure scenario
fp a, b Attached aerosol characteristics in the ambient airc
Mode, i fpi AMADi (nm)
Density,ρi (g cm-3)
Shape factor, χi
AMTDi (nm)
σgi hgfid
Indoor workplace
0.02 n a
0.14 0.86
40 200
1.4 1.4
1.1 1.1
32 170
2.0 1.8
2.0 2.0
Mine 0.005 a 1.0 0.7 1.0 250 2.0 1.0 a fp = unattached fraction in terms of the potential alpha energy concentration (PAEC). 8763 b The unattached progeny are assumed to have an AMTD of 0.9 nm with σg = 1.3, and unit density and shape 8764
factor. 8765 c Indices i = n and a represent the accumulation and nucleation modes. fpi = fraction of attached PAEC for mode 8766
i. σgi = geometric standard deviation of mode i. hgfi = hygroscopic growth factor for mode i. 8767 d It is assumed that the AMTD increases by hgf instantaneously as the particle enters the nose or the mouth. For 8768
simplicity, the hygroscopically enlarged particles are assumed to have unit density and shape factor. 8769 8770 Indoor air 8771
(670) Becker et al. (1984), measured the activity size distribution of 212Pb in different 8772 buildings in the city of Göttingen, and in the countryside of Germany. Measurements were 8773 carried out with a high volume cascade impactor. The size distribution of the attached 8774 aerosol could be approximated by a log-normal distribution. Values of AMAD ranged from 8775 120 nm to 290 nm with a mean of 200 nm. The mean value of σg was 2.9. The mean value 8776 of the AMAD for the city results was similar to that of the countryside results but the σg for 8777 the countryside results was larger. 8778
(671) Reineking et al. (1992) measured the activity size distribution of 212Pb in seven 8779 rooms of different houses in Germany. Measurements were performed with a low pressure 8780 cascade impactor. For separating unattached from aerosol-associated thoron progeny, a single 8781 screen with a 50% penetration for 4 nm diameter particles was used. The AMAD of the 8782 accumulation mode was about 200 nm with a σg of 1.8. Between 6% and 20% of the attached 8783 activity was associated with the nucleation mode with a mean of 14%. The nucleation mode 8784 had an AMAD less than 80 nm. These results were also reported by Porstendörfer (2001). 8785 Porstendörfer reports that the nucleation mode has an AMAD between 30 to 50 nm with a σg 8786 of about 2. Porstendörfer noted that the fraction of the attached 212Pb activity associated with 8787

DRAFT FOR MC REVIEW PRIOR TO CONSULTATION
221
the nucleation mode is lower than the corresponding values for radon (222Rn) progeny. The 8788 unattached fraction (fp) of thoron progeny for ‘typical’ indoor air with aerosol particle 8789 concentration of (5-15) × 103 cm-3 is between 0.01 and 0.03. 8790
(672) Zhang et al. (2010) measured activity size distributions of 212Pb in countryside and 8791 city dwellings of China. There were no appreciable differences among the particle size 8792 distribution from dwellings within the same area and under the same climate conditions. 8793 However, the particle size distribution measured in countryside dwellings were lower than in 8794 city dwellings. In city dwellings of Beijing, the AMAD of 212Pb was about 150 nm with a σg 8795 of 2.0 and in the suburbs of Beijing the AMAD was about 110 nm with a σg of 2.0. For some 8796 of the countryside dwellings of Yangjiang, Guuangdong Province, which were mainly made 8797 of brick, the mean AMAD was 80 nm with a σg of 2.9. For the cave dwellings of Datong, 8798 Shanxi Province, the mean AMAD was 50 nm with a σg of 3.1. 8799
(673) The aerosol parameter values assumed for thoron progeny for indoor workplaces are 8800 based on the measurements of Reineking et al., 1992 and on the values recommended by 8801 Porstendörfer, 2001 (Table 12-5). 8802 8803 Mine 8804
(674) The activity size distribution of 212Pb was measured with a diffusion battery in a 8805 Canadian diesel powered uranium mine during the summer of 1978 (Busgin et al., 1981). 8806 Measurements were carried out in an exhaust ventilation area of the mine where there was no 8807 work of any kind in progress. The average value of the AMTD was found to be about 90 nm 8808 with a σg from 1.5 to 2.3. The same group also carried out a second set of measurements 8809 during the winter of 1985 in a diesel powered mine and in an electrical powered mine (Kahn 8810 et al., 1987). The mean AMTD of 212Pb was about 100 nm with a σg of 1.7 in the diesel 8811 powered mine whereas in the electrically powered mine the mean AMTD was about 70 nm 8812 with a σg of 2.0. The thoron (220Rn) WL was similar to the 222Rn WL in the electric powered 8813 mine but less than the 222Rn WL in the diesel powered mine. 8814
(675) Butterweck et al. (1992) carried out activity size measurements in underground 8815 mines in Germany with a low pressure cascade impactor and a high volume impactor. 8816 Measurements were made at a uranium mine (Groβ-Schloppen), an iron mine (Salzgitter) and 8817 at a barite mine (Bad Lauterberge). The activity size distribution of 212Pb could be 8818 approximated by a unimodal log-normal distribution described by the AMAD and σg. During 8819 working hours mean values of the AMAD of 212Pb ranged from 150 – 290 nm with a σg 8820 ranging from 2 – 3.1. For the Barite mine of Bad Lauterberge, the mean value AMAD of 8821 212Pb was 290 nm during working hours but increased to 400 nm outside working hours. 8822 Measurements were also carried out at a disused silver mine at Lautenthal, which was open to 8823 tourists; the mean value of AMAD was 310 nm (range: 270 – 340 nm) and the σg was 2.4 8824 (range: 2.1 – 3.6). In most of these mines, the activity size distributions of the accumulation 8825 mode of 212Pb were broadly similar to the corresponding size distribution of the 222Rn 8826 progeny, 214Pb/214Bi. 8827
(676) The activity size distribution for thoron (220Rn) progeny assumed for the mining 8828 environment is given in Table 12-5. These values are the same as those assumed for radon 8829 (222Rn) progeny for mine (Table 12-4) apart from assuming a lower unattached fraction. 8830 Because of the longer half-life of 212Pb, more of the lead is likely to be attached. However, 8831 the value of fp also depends upon the ventilation rate; higher unattached fractions are 8832 expected for high ventilation rates. 8833 8834 Reference values for regional deposition of inhaled 222Rn and 220Rn progeny aerosols 8835

DRAFT FOR MC REVIEW PRIOR TO CONSULTATION
222
8836 Radon (222Rn) progeny 8837
(677) The aerosol distributions for the attached 222Rn progeny (218Po, 214Pb and 214Bi) in 8838 the ambient air are given in Table 12-4 for indoor workplaces and mines. Taking account of 8839 hygroscopic growth, the assumed aerosol characteristics of the attached progeny in the 8840 respiratory tract are given in Table 12-6. The unattached mode of the short-lived 222Rn 8841 progeny (i.e. of 218Po and 214Pb) is assumed to have an AMTD of 0.9 nm with σg = 1.3, and 8842 unit density and shape factor for both exposure scenarios (Section 12.4.1.1). Table 12-7 gives 8843 the corresponding regional depositions in the respiratory tract for each mode of the assumed 8844 aerosol distribution of 222Rn progeny. 8845 8846
Table 12-6. Attached aerosol characteristics in the respiratory tract for 222Rn progeny 8847 8848
Exposure scenario
Attached aerosol characteristics in the respiratory tract
Modea, i AMADi (nm)
Density, ρi (g cm-3)
Shape factor, χi
AMTDi (nm)
σgi b
Indoor workplace
Nucl. Acc.
48 427
1.0 1.0
1.0 1.0
48 427
2.0 2.0
Mine Acc. 197 0.7 1.0 250 2.0 a Indices i = ‘Nucl.’ and ‘Acc.’ represent the nucleation and accumulation modes respectively. 8849 b σgi = geometric standard deviation of mode i. 8850
8851 Table 12-7. Deposition of inhaled 222Rn progeny aerosols in respiratory tract regions. Values 8852 are given for each mode of the assumed aerosol distribution for indoor workplaces and mines. 8853 8854
Exposure scenario Modea Deposition in regions (%)(b)
ET1 ET2 BB bb AI Total All Unatt. 53.33 28.71 7.585 8.633 0.3920 98.65 Indoor workplace Nucl. 4.458 2.401 1.084 7.627 31.79 47.36
Acc. 8.643 4.654 0.5289 1.540 9.04 24.41 Mine Acc. 3.150 1.696 0.4087 2.164 9.95 17.37
a ‘Unatt.’ = unattached mode, ‘Nucl.’ = nucleation mode, and ‘Acc.’ = accumulation mode. 8855 b The degree of precision of the values is given for computational purposes and does not reflect the 8856
certainty with which they are known. 8857 8858 Thoron (220Rn) progeny 8859
(678) The aerosol distributions for the attached thoron progeny (212Pb and 212Bi) in the 8860 ambient air are given in Table 12-5 for indoor workplaces and mines. Taking account of 8861 hygroscopic growth, the assumed aerosol characteristics of the attached progeny in the 8862 respiratory tract are given in Table 12-8. The unattached mode of the short-lived 220Rn decay 8863 product, 212Pb is assumed to have an AMTD of 0.9 nm with σg = 1.3, and unit density and 8864 shape factor for both indoor workplaces and mines. Table 12-9 gives the corresponding 8865 regional depositions in the respiratory tract for each mode of the assumed aerosol distribution 8866 of 220Rn progeny. 8867 8868

DRAFT FOR MC REVIEW PRIOR TO CONSULTATION
223
Table 12-8. Attached aerosol characteristics in the respiratory tract for 220Rn progeny 8869 8870
Exposure scenario
Attached aerosol characteristics in the respiratory tract
Modea, i AMADi (nm)
Density, ρi (g cm-3)
Shape factor, χi
AMTDi (nm)
σgi b
Indoor workplace
Nucl. Acc.
64 340
1.0 1.0
1.0 1.0
64 340
2.0 2.0
Mine Acc. 197 0.7 1.0 250 2.0 a Indices i = ‘Nucl.’ and ‘Acc.’ represent the nucleation and accumulation modes respectively. 8871 b σgi = geometric standard deviation of mode i. 8872
8873 Table 12-9. Deposition of inhaled 220Rn progeny aerosols in respiratory tract regions. Values 8874 are given for each mode of the assumed aerosol distribution for indoor workplaces and mines. 8875 8876
Exposure scenario Modea Deposition in regions (%)b
ET1 ET2 BB bb AI Total All Unatt. 53.33 28.71 7.585 8.633 0.3920 98.65 Indoor workplace Nucl. 3.701 1.993 0.895 6.231 26.79 39.60
Acc. 6.335 3.411 0.467 1.768 9.35 21.33 Mine Acc. 3.150 1.696 0.4087 2.164 9.95 17.37 a ‘Unatt.’ = unattached mode, ‘Nucl.’ = nucleation mode, and ‘Acc.’ = accumulation mode. 8877 b The degree of precision of the values is given for computational purposes and does not reflect the 8878
certainty with which they are known. 8879 8880 Inhalation of radon gas 8881
(679) The biokinetic model for radon gas described in Section 12.4.3.2 is used to calculate 8882 doses from inhalation of radon gas. Although, radon is chemically inert, the radon gas can be 8883 absorbed into the blood stream from the lung, where it moves rapidly within the body. 8884 Radon gas absorbed to pulmonary blood is distributed in arterial blood to tissues and is then 8885 transferred from tissue to venous blood. The gas is carried in the venous blood to pulmonary 8886 blood where some of it exhaled, while the rest returns to artery blood and the cycle continues. 8887 The transfer rates between blood and tissues depend on blood flow rates, tissue and blood 8888 volumes, and on the relative solubility of radon in tissues and blood represented by tissue-to-8889 blood partition coefficients. Transfer rate constants from lung air-to-blood, blood-to-tissues, 8890 tissues-to-blood, and blood-to-lung air are given in Section 12.4.3.2. Equilibrium 8891 concentrations in tissues, blood and lung air are reached for continuous chronic exposure to a 8892 given radon concentration. The time it takes for 222Rn to reach equilibrium concentrations in 8893 tissues varies from several minutes to a few days depending upon their blood supply and the 8894 tissue-to-blood partition coefficient. However, the value of the equilibrium concentration of 8895 222Rn in a tissue can be calculated directly from the ambient concentration, the tissue-to-blood 8896 partition coefficient, and the blood-to-air partition coefficient. 8897
(680) The equivalent doses to regions of the respiratory tract arising from the radon gas 8898 within the airways are calculated assuming that the radon gas within the airways equilibrates 8899 rapidly with the ambient concentration (Section 12.4.3.2). However, Absorbed Fractions 8900 (AFs) have not been calculated for a source consisting of the volume of the gas within the 8901 airways. Because there is little loss of energy within the air in the airways, the AFs for non-8902 penetrating radiations can be approximated by assuming the activity in the volume of the gas 8903 within the airways can be replaced by the same activity uniformly deposited on the surface 8904 (‘surface’ in ET1 and ET2, ‘mucus layers’ in BB and bb, ‘AI’ in AI). For this purpose, Table 8905

DRAFT FOR MC REVIEW PRIOR TO CONSULTATION
224
12-10 gives reference volumes of the respiratory tract regions for reference worker (ICRP, 8906 1994). 8907 8908 Table 12-10. Reference volumes of respiratory tract regions for calculating doses from gases 8909 within the airways for Reference worker a,b 8910 8911
Region Volume (m3) ET1 2.500E-06 ET2 3.375E-05 BB 3.901E-05 bb 6.265E-05 AI 3.720E-03
a Values given to four significant figures for precision in calculation. 8912 b Taken from ICRP Publication 68; Table A.1, page 23. In ICRP Publication 68 there is a transcript error 8913
for the reference volume of bb; this has been corrected here. 8914 8915 12.4.2. Ingestion 8916 8917
(681) Radon is soluble in water, and if high concentrations are found in drinking water this 8918 may be an important source of exposure. Volunteer experiments have shown that radon is 8919 readily absorbed from the alimentary tract into blood (Section 12.4.3.1). Kursheed (2000) 8920 assumed that ingested radon follow the pathway of water out of the stomach and is absorbed 8921 to blood only via the small intestine. However, important issues relating to the dosimetry of 8922 radon gas from ingestion relate to the residence time of radon in the stomach and the extent to 8923 which radon diffuses into the wall of the stomach. As a result of different assumptions 8924 regarding these two issues published estimates of dose to the stomach wall per unit intake of 8925 ingested 222Rn vary by a factor of about 200 (von Döbeln and Lindell, 1964; Hursh et al., 8926 1965; Suomela and Kahlos, 1972; Crawford-Brown, 1989; Brown and Hess, 1992; Harley 8927 and Robbins, 1994; Sharma et al., 1996; NAS, 1999; Khursheed, 2000). The rate of removal 8928 of radon from the stomach assumed in the dose calculations has varied from a few minutes to 8929 a few hours. The following approaches illustrate the variety of assumptions that have been 8930 made concerning accumulation of radon in the stomach wall. Hursh and coworkers (1965) 8931 assumed that the stomach wall contains radon at the same concentration as occurs in the 8932 stomach contents at all times following ingestion and that the radon is uniformly distributed 8933 in the wall. A committee of the U.S. National Academy of Sciences (NAS, 1999) assumed 8934 that the time-integrated concentration of radon at the depth of the radiosensitive cells in the 8935 stomach wall is 30% of the time-integrated concentration in the contents. Harley and Robbins 8936 (1994) assumed on the basis of the structure and secretory properties of the stomach wall that 8937 any radon that diffuses from the contents into the wall does not reach a depth at which the 8938 alpha emissions could irradiate the stem cells. Kursheed (2000) pointed out that improved 8939 fits were obtained between the model predictions and the data of Hursh et al. (1965) if the site 8940 of absorption into blood is only the small intestine. 8941
(682) The biokinetic model for radon gas following ingestion assumed in this report is 8942 described in Section 12.4.3.2. In this model it is assumed that radon gas does not diffuse 8943 from Stomach contents to Stomach wall but that radon is absorbed to blood via the small 8944 intestine. 8945 8946 12.4.3. Biokinetic model for radon gas 8947 8948
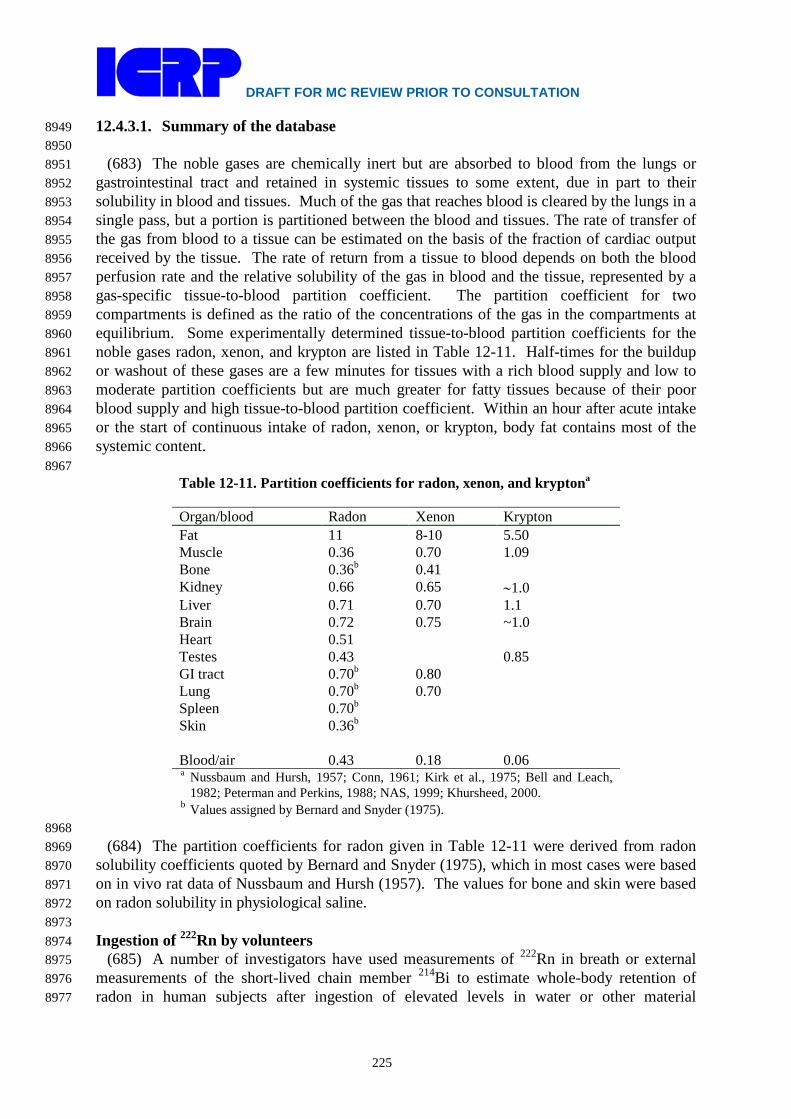
DRAFT FOR MC REVIEW PRIOR TO CONSULTATION
225
12.4.3.1. Summary of the database 8949 8950
(683) The noble gases are chemically inert but are absorbed to blood from the lungs or 8951 gastrointestinal tract and retained in systemic tissues to some extent, due in part to their 8952 solubility in blood and tissues. Much of the gas that reaches blood is cleared by the lungs in a 8953 single pass, but a portion is partitioned between the blood and tissues. The rate of transfer of 8954 the gas from blood to a tissue can be estimated on the basis of the fraction of cardiac output 8955 received by the tissue. The rate of return from a tissue to blood depends on both the blood 8956 perfusion rate and the relative solubility of the gas in blood and the tissue, represented by a 8957 gas-specific tissue-to-blood partition coefficient. The partition coefficient for two 8958 compartments is defined as the ratio of the concentrations of the gas in the compartments at 8959 equilibrium. Some experimentally determined tissue-to-blood partition coefficients for the 8960 noble gases radon, xenon, and krypton are listed in Table 12-11. Half-times for the buildup 8961 or washout of these gases are a few minutes for tissues with a rich blood supply and low to 8962 moderate partition coefficients but are much greater for fatty tissues because of their poor 8963 blood supply and high tissue-to-blood partition coefficient. Within an hour after acute intake 8964 or the start of continuous intake of radon, xenon, or krypton, body fat contains most of the 8965 systemic content. 8966 8967
Table 12-11. Partition coefficients for radon, xenon, and kryptona
Organ/blood Radon Xenon Krypton Fat 11 8-10 5.50 Muscle 0.36 0.70 1.09 Bone 0.36b 0.41 Kidney 0.66 0.65 ∼1.0 Liver 0.71 0.70 1.1 Brain 0.72 0.75 ~1.0 Heart 0.51 Testes 0.43 0.85 GI tract 0.70b 0.80 Lung 0.70b 0.70 Spleen 0.70b Skin 0.36b Blood/air 0.43 0.18 0.06 a Nussbaum and Hursh, 1957; Conn, 1961; Kirk et al., 1975; Bell and Leach,
1982; Peterman and Perkins, 1988; NAS, 1999; Khursheed, 2000. b Values assigned by Bernard and Snyder (1975).
8968 (684) The partition coefficients for radon given in Table 12-11 were derived from radon 8969
solubility coefficients quoted by Bernard and Snyder (1975), which in most cases were based 8970 on in vivo rat data of Nussbaum and Hursh (1957). The values for bone and skin were based 8971 on radon solubility in physiological saline. 8972 8973 Ingestion of 222Rn by volunteers 8974
(685) A number of investigators have used measurements of 222Rn in breath or external 8975 measurements of the short-lived chain member 214Bi to estimate whole-body retention of 8976 radon in human subjects after ingestion of elevated levels in water or other material 8977
DRAFT FOR MC REVIEW PRIOR TO CONSULTATION
226
(Vaternahm, 1922; Fernau and Smereker, 1933; Meyer, 1937; Anderson and Nilsson, 1964; 8978 von Dobeln and Lindell, 1964; Hursh et al., 1965; Suomela and Kahlos, 1972; Gosink et al., 8979 1990; Brown and Hess, 1992). Reported rates of loss of radon from the body are variable, 8980 probably due in large part to differences in experimental conditions such as the timing of 8981 intake of radon relative to meals, the level of physical activity of the subjects after intake of 8982 radon, and the length of the observation period. Retention half-times in the range 30-70 min 8983 have been reported in several studies involving relatively short observation periods. Multiple 8984 retention components with half-times varying from a few minutes to several hours have been 8985 determined in some studies with relatively long observation periods. 8986
(686) Hursh et al. (1965) used periodic measurements of breath to estimate total-body 8987 retention of 222Rn following acute intake of 222Rn in water by each of two subjects on two 8988 occasions. In three of the four individual experiments the radon was ingested two hours after 8989 a normal light breakfast. In the fourth experiment the radon was ingested 10 min after a heavy 8990 breakfast. Retention was longer in the fourth experiment than in the first three, presumably 8991 due to a longer retention time in the full stomach. Retention of radon in the subjects with 8992 empty stomach could be expressed as a sum of three exponential terms corresponding to half-8993 times of about 11 min (61%), 19 min (34%), and 3 h (5%). Retention in the subject with full 8994 stomach could be expressed as a sum of three exponential terms corresponding to half-times 8995 of about 12 min (39%), 58 min (51%), and 5 h (10%). Hursh and coworkers interpreted the 8996 data as indicating that much of the ingested radon mixes with the stomach contents, diffuses 8997 out through the stomach walls into the splanchnic venous blood system, and passes through 8998 the liver and up into the right heart to the lung where much of the absorbed amount is rapidly 8999 lost in the expired air. Uptake of radon by systemic tissues was assumed to be divided mainly 9000 among three pools: liver, fat, and other. Fat was estimated to contain only a small portion of 9001 the systemic burden in the early minutes after intake but a major portion after 2-3 h. 9002
(687) Suomela and Kahlos (1972) used external measurements of the 222Rn chain member 9003 214Bi to estimate whole-body retention of radon in 10 healthy adult male subjects who 9004 ingested radon-rich water as a single intake. A single exponential function with biological 9005 half-time in the range 30-50 min was found to describe the elimination of 222Rn reasonably 9006 well in some cases over observation periods of up to about 6 h. In other cases a second 9007 component with half-time 1.5-2 h was evident within the 6-h observation period. Suomela 9008 and Kahlos compared their findings with results from earlier studies of retention of 222Rn 9009 ingested in water by human subjects (Andersson and Nilsson, 1964; Döbeln and Lindell, 9010 1964; unpublished study by Mays, 1972; Hursh et al., 1965). The retention curves determined 9011 by Hursh et al. (1965) for a full and empty stomach bounded the retention curves determined 9012 in other studies over the first 6 h after intake. 9013
(688) Gosink et al. (1990) used breath measurements to estimate the rate of loss of 222Rn 9014 from a 51-year-old male subject (1.96 m, 112 kg) in different experiments involving 9015 consumption of water with a moderately high natural concentration of 222Rn. During a period 9016 of relatively high physical activity the subject eliminated virtually all the ingested 222Rn 9017 during the first 4 h after intake. During mild activity the biological half-time was 45-65 min. 9018 For a sedentary or sleeping period a biological half-time was estimated as 11.2 h for a 9019 substantial portion of the ingested radon. For the sedentary case the subject exhaled <3% of 9020 ingested 222Rn per hour after the first hour. 9021
(689) Brown and Hess (1992) conducted 41 tests on 38 human subjects, ages 9-85 y, to 9022 measure elimination rates of 222Rn in expired breath following acute intake of 222Rn in 9023 drinking water. The levels of physical activity of the subjects ranged from inactive to 9024 marathon level. The percentage of elimination of 222Rn from the body during the first 30 min 9025

DRAFT FOR MC REVIEW PRIOR TO CONSULTATION
227
after intake ranged from 12 to 68%. The elimination rate showed a moderate correlation with 9026 the time passed since eating. Estimated retention half-times ranged from 17 to 400 min. 9027 9028 Inhalation of inert gases by volunteers 9029
(690) In a series of experiments, Harley and coworkers (1951, 1994) studied the retention 9030 of inhaled radon by subjects following exposures to constant, elevated concentrations of 9031 radon in air for periods up to 8.5 h. Measurements of 222Rn in periodic breath samples after 9032 the end of exposure were used to infer the rate of loss of 222Rn from the body. About the 9033 same peak total-body content of radon (~850 Bq) was estimated following exposure for 8.5 h 9034 at an air concentration of 25.9 Bq/L and for 7 h at 22.2 Bq/L, suggesting that saturation may 9035 have been approached. Following both the 7-h and 8.5-h exposures the activity remaining in 9036 the body at the end of exposure showed five distinct components of retention. In the more 9037 detailed study involving exposure for 8.5 h, about 8% of the total expired radon was removed 9038 with a half-time of 23 s, 9% with a half-time of 4.5 min, 18% with a half-time of 41 min, 9039 32% with a half-time of 3.4 h, and 33% with a half-time of 18 h. These retention half-times 9040 are broadly similar to half-times observed in human subjects following inhalation of xenon or 9041 krypton (Susskind et al., 1977; Ellis et al., 1977). 9042
(691) Susskind et al. (1977) used in vivo measurements to estimate retention of inhaled 9043 127Xe in 12 human subjects. Five components of retention with average biological half-times 9044 of 21.7 s, 3.05 min, 0.40 h, 2.71 h, and 10.4 h were determined. The half-time of the slowest 9045 component of clearance ranged from 7.4 h to 17.0 h and correlated highly with total-body fat 9046 as a percent of body weight (Figure 12-5). The mean half-time (+/- standard deviation) of this 9047 component for five subjects with body fat representing less than one-third of total-body 9048 weight was 8.4 +/- 0.7 h. On average the slowest component of clearance represented 9049 approximately 13% of the retained activity, excluding the rapid clearance represented by the 9050 retention components with half-times 21.7 s and 3.05 min. 9051
(692) Ellis et al. (1977) studied total-body retention of 79Kr in 16 subjects by whole-body 9052 external counting following a 10-min or 30-min inhalation period. The retention data were 9053 resolved into a five-component exponential curve with average half-times of 21.5 s, 4.74 min, 9054 0.33 h, 2.41 h, and 7.0 h. The last three retention components represented on average 61.7%, 9055 29.6%, and 9.4% of the retained activity, excluding the rapid clearance represented by the 9056 retention components with half-times of 21.5 s and 4.74 min. The half-time of the long-term 9057 component ranged from about 4.2 h to 9.6 h and correlated significantly with the estimated 9058 percentage of total body fat (Figure 12-5). The mean half-time (+/- standard deviation) for 9059 six subjects with body fat representing less than one-third of body weight was 5.5 +/- 0.7 h. 9060 9061
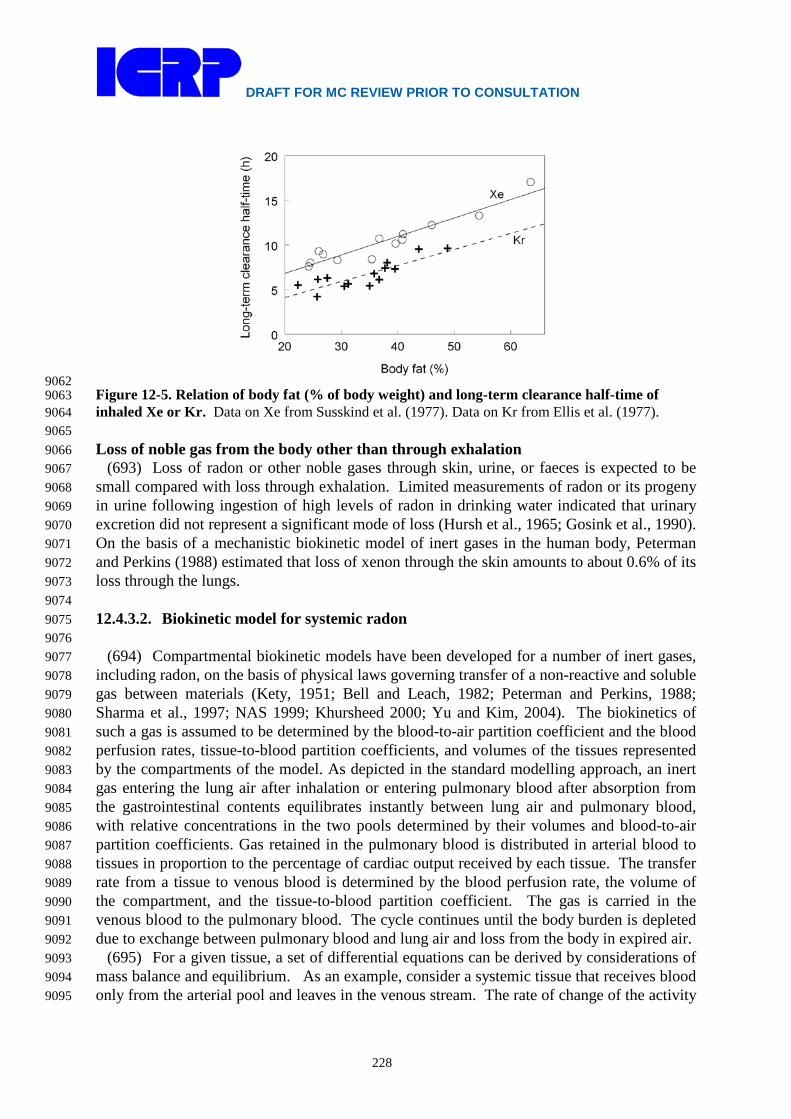
DRAFT FOR MC REVIEW PRIOR TO CONSULTATION
228
9062 Figure 12-5. Relation of body fat (% of body weight) and long-term clearance half-time of 9063 inhaled Xe or Kr. Data on Xe from Susskind et al. (1977). Data on Kr from Ellis et al. (1977). 9064 9065 Loss of noble gas from the body other than through exhalation 9066
(693) Loss of radon or other noble gases through skin, urine, or faeces is expected to be 9067 small compared with loss through exhalation. Limited measurements of radon or its progeny 9068 in urine following ingestion of high levels of radon in drinking water indicated that urinary 9069 excretion did not represent a significant mode of loss (Hursh et al., 1965; Gosink et al., 1990). 9070 On the basis of a mechanistic biokinetic model of inert gases in the human body, Peterman 9071 and Perkins (1988) estimated that loss of xenon through the skin amounts to about 0.6% of its 9072 loss through the lungs. 9073 9074 12.4.3.2. Biokinetic model for systemic radon 9075 9076
(694) Compartmental biokinetic models have been developed for a number of inert gases, 9077 including radon, on the basis of physical laws governing transfer of a non-reactive and soluble 9078 gas between materials (Kety, 1951; Bell and Leach, 1982; Peterman and Perkins, 1988; 9079 Sharma et al., 1997; NAS 1999; Khursheed 2000; Yu and Kim, 2004). The biokinetics of 9080 such a gas is assumed to be determined by the blood-to-air partition coefficient and the blood 9081 perfusion rates, tissue-to-blood partition coefficients, and volumes of the tissues represented 9082 by the compartments of the model. As depicted in the standard modelling approach, an inert 9083 gas entering the lung air after inhalation or entering pulmonary blood after absorption from 9084 the gastrointestinal contents equilibrates instantly between lung air and pulmonary blood, 9085 with relative concentrations in the two pools determined by their volumes and blood-to-air 9086 partition coefficients. Gas retained in the pulmonary blood is distributed in arterial blood to 9087 tissues in proportion to the percentage of cardiac output received by each tissue. The transfer 9088 rate from a tissue to venous blood is determined by the blood perfusion rate, the volume of 9089 the compartment, and the tissue-to-blood partition coefficient. The gas is carried in the 9090 venous blood to the pulmonary blood. The cycle continues until the body burden is depleted 9091 due to exchange between pulmonary blood and lung air and loss from the body in expired air. 9092
(695) For a given tissue, a set of differential equations can be derived by considerations of 9093 mass balance and equilibrium. As an example, consider a systemic tissue that receives blood 9094 only from the arterial pool and leaves in the venous stream. The rate of change of the activity 9095
DRAFT FOR MC REVIEW PRIOR TO CONSULTATION
229
of inert gas in a tissue is Fi (CB-A – CB-V), where Fi is the blood flow rate (L min-1) through the 9096 systemic tissue, CB-A is the activity gas concentration (Bq L-1) in non-pulmonary arterial 9097 blood and CB-V is the activity gas concentration in non-pulmonary venous blood. In the 9098 standard modeling approach it is assumed that the perfusion of the gas in tissues is 9099 instantaneous, allowing equilibrium to achieve between venous blood and tissue such that CB-9100 V = Ci/Pi, where Ci is the activity concentration of the gas in the tissue and Pi is the tissue-9101 blood partition coefficient. Thus, for a given organ the differential equation describing the 9102 rate of change of the activity of gas Qi in a tissue, is: 9103 9104
iri
iABi
i QPC
CFdt
dQλ−
−= − (Eq. 12-5) 9105
9106 where λr is the radioactive rate constant for the inert gas. To express the above equation in 9107 terms of activity of gas, Q, it can be rewritten as: 9108 9109
iriii
iAB
AB
ii QQVP
FQ
VF
dtdQ
λ−−= −−
(Eq. 12-6) 9110
9111 where VB-A is the volume of the non-pulmonary arterial blood and Vi is the volume of the 9112 tissue. So the transfer rate constant from arterial blood to tissue is Fi/VB-A and the transfer 9113 rate constant from tissue to venous blood is Fi/(PiVi). The blood flow rate (Fi) through a 9114 systemic tissue, i is given by the product of the cardiac output and the fraction of the cardiac 9115 output going to tissue, i (ICRP, 2002). The volume of a systemic tissue is calculated from its 9116 mass and specific gravity. 9117
(696) The biokinetic model for radon used in this report is based largely on the theoretical 9118 considerations summarised above but includes some empirical features and simplifications. 9119 As a first step, a detailed biokinetic model involving three blood compartments representing 9120 pulmonary, arterial, and venous blood and 20 compartments representing systemic tissues 9121 was developed for radon on the basis of these theoretical considerations. That model was then 9122 simplified for use in this report by dividing blood into two rather than three compartments, 9123 pooling several tissue compartments with broadly similar time-dependent radon 9124 concentrations, and replacing the theoretical model of instantaneous exchange of radon 9125 between lung air and pulmonary blood with a first-order system consistent with the ICRP’s 9126 general modelling approach for inhaled activity. Also, the theoretical considerations as 9127 applied to bone were replaced by a dosimetrically cautious bone model involving exchange of 9128 radon between blood and bone surfaces. 9129
(697) The structure of the model used in this report is shown in Figure 12-6. Baseline 9130 transfer coefficients are listed in Table 12-12. 9131
(698) Blood is divided into arterial and venous blood (Blood-A and Blood-V, 9132 respectively). These compartments are assumed to represent 27%, and 73%, respectively, of 9133 the total blood volume based on reference sizes of blood pools summarized in ICRP 9134 Publication 89 (2002). The reference total blood volume is 5.3 L in the adult male and 3.9 L 9135 in the adult female (ICRP, 2002). 9136
(699) Fat is represented as two compartments with equal volumes but different blood 9137 perfusion rates as a way of depicting the two phases of relatively long-term retention (several 9138 hours) observed in human subjects following inhalation of radon or radioisotopes of xenon or 9139

DRAFT FOR MC REVIEW PRIOR TO CONSULTATION
230
krypton. The blood perfusion rate of Fat 1 is assumed to be four times higher than that of Fat 9140 2, which implies that the removal half-time from Fat 2 is four times greater than the removal 9141 half-time from Fat 1. 9142
(700) For continuous inhalation of radon, it is assumed that the activity concentration in 9143 respiratory tract (RT) air rapidly reaches equilibrium with the activity concentration in the 9144 environment, Cenv. The transfer rate from RT air to environment, λ is assumed to be 2600 d-1 9145 (half-time 23 s). The removal half-time of 23 s is based on observed half-times for the rapid 9146 phase of exhalation of radon, xenon, or krypton by human subjects immediately after a period 9147 of continuous inhalation (Harley et al., 1951; Susskind et al., 1977; Ellis et al., 1977). The 9148 removal half-time does depend on breathing rate but for dosimetry purposes it is assumed to 9149 be constant. The rate at which activity enters the RT air space is assumed to be λ Cenv VRT-air 9150 (Bq d-1), where VRT-air is the average volume of the RT air space (3.858 L for male, ICRP, 9151 1994). In order to use the model to calculate the number of disintegrations in the respiratory 9152 tract (RT) air space, this rate is partitioned to each region of the HRTM according to its 9153 fractional volume (Table 12-10). 9154
(701) It is assumed that the radon in RT air diffuses to Blood-A rapidly, allowing 9155 equilibrium to achieve between Blood-A and RT air such that CB-A = CRT-air Pb-air, where Pb-air 9156 is the blood to air partition coefficient, (Table 12-11) and CRT-air is the activity concentration 9157 in RT air. On the basis of mass balance and equilibrium the rate of change of activity in the 9158 RT air is given by: 9159 9160
( ) airRTrairbairRTVBairRTairRTenvairRT QPCCFQVC
dtdQ
−−−−−−− −−+−= λλλ (Eq. 12-7) 9161
9162 where F (L min-1) is the cardiac output. To express the above equation in terms of activity of 9163 gas, Q, it can be rewritten as: 9164 9165
airRTrairRTairRT
airbVB
VBairRTairRTenv
airRT QQV
PFQ
VFQVC
dtdQ
−−−
−−
−−−
− −−+−= λλλ
(Eq. 12-8) 9166
9167 (702) From equation (4.8) it can be seen that the transfer rate constant from Blood-V to 9168
RT-air is F/VB-V and the transfer rate constant from RT-air to Blood-A is F Pb-air/VRT-air. 9169 (703) Radon ingested in drinking water or other material is transferred from Stomach 9170
contents to Small intestine contents at a material-specific stomach emptying rate. The default 9171 transfer coefficient from Stomach contents to Small intestine contents are reference values for 9172 total diet (ICRP, 2002, 2006): 20.57 d-1 for adult males and 15.16 d-1 for adult females. 9173
(704) Radon is transferred from Small intestine contents to Liver at the rate 5994 d-1. This 9174 corresponds to an absorption fraction of 0.999 based on a reference transfer coefficient of 6 d-9175 1 from the small intestine contents to the right colon contents (ICRP, 2002, 2006). 9176
(705) With exceptions described later, derivations of transfer coefficients between 9177 systemic compartments are based on the blood flow rates, compartment volumes, and tissue-9178 to-blood partition coefficients listed in Table 12-13. The blood flow rates are taken from 9179 ICRP Publication 89 (2002). The compartment volumes are based on reference tissue masses 9180 for adults (ICRP, 2002), together with the following specific gravities based on information 9181 summarized in ICRP Publication 23 (1975) and Publication 89 (2002): fat, 0.92; red marrow, 9182 1.0; all other soft tissues, 1.04. The tissue-to-blood partition coefficients are based on 9183 estimates listed in Table 12-11. A rounded partition coefficient of 0.4 for Other was based on 9184

DRAFT FOR MC REVIEW PRIOR TO CONSULTATION
231
the estimate of 0.36 for skeletal muscle, which represents much of the volume of Other. The 9185 specific gravity and tissue-to-blood partition coefficient for red marrow are based on 9186 reference masses of active marrow and total marrow given in ICRP Publication 89 (2002) and 9187 the assumptions that red marrow is composed of active marrow plus fat and represents half 9188 the mass of total marrow. In other words, the specific gravity and tissue-to-blood partition 9189 coefficient for red marrow were calculated assuming red bone marrow is composed of about 9190 40% fat (ICRP, 1975). 9191 9192
9193 Figure 12-6. Structure of the biokinetic model for systemic radon 9194
9195 (706) The derivation of transfer coefficients is illustrated for the reference adult male. 9196
Radon is cleared from Blood-A at the rate 6.5 L min-1 x 1440 min d-1 / 1.431 L = 6541 d-1, 9197 where 1.431 L = 0.27 x 5.3 L is the volume of Blood-A. Radon is transferred from Blood-V 9198 to lung air at the rate 6.5 L min-1 x 1440 min d-1 / 3.869 L = 2419 d-1, where 3.869 L = 0.73 x 9199 5.3 L is the volume of Blood-V. The transfer coefficient from Blood-A to Kidneys, for 9200 example, is 0.19 x 6541 d-1 = 1243 d-1, where 0.19 is the fraction of cardiac output received 9201 by the kidneys in the reference adult male. The transfer coefficient from Kidneys to Blood-V 9202 is 1440 min d-1 x 0.19 x 6.5 L min-1 / (0.298 L x 0.7) = 8525 d-1, where 0.298 L is the volume 9203 of the kidneys and 0.7 is the kidneys-to-blood partition coefficient. 9204
(707) Tissue compartments other than Liver receive radon only from Blood-A. In addition 9205 to Blood-A, Liver receives a portion of outflow from Other, representing radon that leaves the 9206 splanchnic tissues, as well as radon absorbed from the alimentary tract following its 9207

DRAFT FOR MC REVIEW PRIOR TO CONSULTATION
232
ingestion. Activity leaving tissue compartments is assigned to Blood-V, except that the 9208 portion of outflow from Other representing outflow from splanchnic tissues is assigned to 9209 Liver. The fraction of outflow from Other assigned to Liver is 19/(19+46) = 19/65, based on 9210 estimated blood flows of 19% and 46%, respectively, of cardiac output through splanchnic 9211 and non-splanchnic tissues within Other. 9212
(708) As a dosimetrically cautious approach, radon depositing in bone is assigned to bone 9213 surface. Transfer coefficients from Blood-A to Trabecular bone surface and Cortical bone 9214 surface are based on the reference blood flow rates of 0.9% and 0.6% to trabecular and 9215 cortical bone, respectively expressed as a % of cardiac output (ICRP, 2002). Transfer 9216 coefficients from these bone surface compartments to Blood-V were not derived by the same 9217 methods as applied to other tissue compartments due to difficulties in determining meaningful 9218 volumes and partition coefficients for bone surface. Rather, the transfer coefficient from each 9219 bone surface compartment to Blood-V is taken as 100 d-1, which is the value estimated in 9220 ICRP Publication 67 for radon produced on bone surface by radioactive decay of radium 9221 isotopes. 9222
(709) Figure 12-7 compares model predictions derived from the baseline parameter values 9223 in Table 12-12 with observations of total-body retention in adult male subjects exposed 9224 acutely to elevated levels of 222Rn in drinking water. Two sets of predictions are shown, one 9225 based on relatively fast transfer of radon from the stomach to the small intestine (T1/2 = 15 9226 min), and one based on relatively slow transfer (T1/2 = 1 h). The predicted total-body retention 9227 pattern based on a half-time of 15 min in the stomach is reasonably similar to the retention 9228 pattern observed for subjects who ingested radon two hours after a light breakfast (Hursh et 9229 al., 1965). The predicted retention pattern based on a half-time of 1 h in the stomach is 9230 reasonably similar to the pattern observed by the same investigators for a subject who 9231 ingested radon 10 min after a heavy breakfast. 9232
(710) Figure 12-8 compares model predictions with observations of the rate of exhalation 9233 of 222Rn by an adult male following exposure to a constant, elevated concentration (25.9 9234 Bq/L) of radon in a closed room for 8.5 h (Harley et al., 1951). The rate of exhalation of 9235 radon at the end of the 8.5-h exposure was 132 Bq/min. This indicates a radon inhalation rate 9236 of 132 Bq/min and is consistent with the breathing rate (Br) of 5 L air/min estimated by 9237 Harley and coworkers. A transfer rate λ of 2600 d-1 (1.8 min-1) from RT air to environment is 9238 estimated from the fastest component (half-time of 23 s) of the exhalation rate of radon 9239 determined in the human study. The estimated volume of lung air involved in the radon 9240 exchange with blood is VL-air=Br/λ=2.8 L. Based on a lung air volume of 2.8 L, the transfer 9241 coefficient from RT air to Blood-A is F Pb-air/ VL-air = 1437 d-1, where F is cardiac output in 9242 blood volumes per day and Pb-air is the blood-to-air partition coefficient. This case-specific 9243 estimate of the transfer coefficient from RT-air to Blood-A was used in the model simulation 9244 rather than the baseline value 1043 d-1 listed in Table 12-12. All other model parameters were 9245 assigned their baseline values. A radon inhalation rate of 190,000 Bq/d (132 Bq/min) was 9246 assumed. 9247 9248 12.4.3.3. Treatment of radioactive progeny 9249 9250
(711) The radon isotopes addressed in this report as parent radionuclides are 222Rn, 220Rn, 9251 and 219Rn. Their radioactive progeny considered in the determination of dose coefficients are 9252 isotopes of lead, polonium, bismuth, and thallium. Radioisotopes of mercury, astatine, and 9253 radon also appear in the 222Rn chain, but their contributions to tissue doses following intake 9254 of 222Rn are negligible. 9255

DRAFT FOR MC REVIEW PRIOR TO CONSULTATION
233
(712) The systemic models for lead, polonium, bismuth, and thallium as radon progeny are 9256 based on their characteristic systemic models as modified for their application as lead progeny 9257 (see the section on lead). The following additions are made to their models as lead progeny: 9258 lead, polonium, bismuth, or thallium produced in respiratory tract air (RT-air) is assumed to 9259 be exhaled at the rate 1000 d-1; polonium produced in a blood compartment for which its 9260 biokinetics is not defined is assumed to transfer to the central blood compartment of the 9261 polonium model at the rate 1000 d-1; lead produced in a soft-tissue compartment for which its 9262 biokinetics is not defined is assumed to transfer to the central blood compartment of the lead 9263 model at the rate 7.39 d-1 (the highest transfer rate from tissues to blood in the lead model); 9264 and bismuth produced in a soft-tissue compartment for which its biokinetics is not defined is 9265 assumed to transfer to the central blood compartment of the bismuth model at the rate 66.542 9266 d-1 (the highest transfer rate from tissues to blood in the bismuth model). 9267 9268
Table 12-12. Transfer coefficients in the systemic model for radon Transfer coefficient (d-1) From To Adult male Adult female Environment RT air (a) (a) RT air Environment 2600 2600 Blood-A Fat 1 261.6 548.6 Blood-A Fat 2 65.41 137.2 Blood-A Kidneys 1243 1372 Blood-A Liver 425.2 524.4 Blood-A Trab bone surface 58.9 72.6 Blood-A Cort bone surface 39.3 48.4 Blood-A Red marrow 196.2 242.0 Blood-A Other 4252 5123 Fat 1 Blood-V 4.48 5.68 Fat 2 Blood-V 1.12 1.42 Kidneys Blood-V 8525 7803 Liver Blood-V 1970 586.1 Trab bone surface Blood-V 100 100 Cort bone surface Blood-V 100 100 Red marrow Blood-V 34.1 42.0 Other Blood-V 260.3 302.7 Other Liver 107.5 149.8 Blood-V RT air 2419 2984 RT air Blood-A 1043 1043 Stomach Content SI Content 20.57 15.16 SI Content Liver 5994 5994 (a) The rate at which activity enters the respiratory tract (RT) air space is assumed to be λ Cenv VRT-9269
air (Bq d-1), where λ is the transfer coefficient from environment to RT air space (2600 d-1), 9270 Cenv is the concentration of radon in the environment (Bq L-1), and VRT-air (L) is the average 9271 volume of the respiratory tract air space (3.858 L for male, ICRP, 1994). This rate is 9272 partitioned to each region of the HRTM according to its fractional volume (Table 12-10). 9273
9274

DRAFT FOR MC REVIEW PRIOR TO CONSULTATION
234
9275 Table 12-13. Reference blood flow rates, compartment volumes, and blood:tissue partition coefficients used to derive transfer coefficients.
Compartment
Blood flow ratea (% of cardiac output)
Volumeb (L)
Blood:Tissue partition coefficientc Male Female Male Female
Fat 1 4 6.8 7.61 9.24 11 Fat 2 1 1.7 7.61 9.24 11 Kidneys 19 17 0.298 0.264 0.7 Liver Arterial Total
6.5 25.5
6.5 27
1.73
1.35
0.7
Trabecular bone surface 0.9d 0.9d -- -- -- Cortical bone surface 0.6d 0.6d -- -- -- Red marrow 3 3 1.83 1.35 4.5 Other 65 63.5 41.35 29.80 0.4 Blood -- -- 5.3 3.9 -- Blood-A -- -- 1.431 1.053 -- Blood-V -- -- 3.869 2.847 -- Cardiac output (L min-1) 6.5 5.9 -- -- -- a From ICRP Publication 89 (2002). b Based on reference tissue masses given in ICRP Publication 89 (2002) and specific gravities listed in
the text. c See Table 12-11 and discussions in text of partition coefficients for Red marrow and Other. d See discussion in text.
9276 Figure 12-7. Comparison of model predictions and observations of total-body retention of 9277 radon following its ingestion in drinking water 9278

DRAFT FOR MC REVIEW PRIOR TO CONSULTATION
235
9279 Figure 12-8. Comparison of model predictions and observations of the exhalation rate of radon 9280 following continuous exposure to a high concentration of radon in air for 8.5 hours 9281 9282 12.5. Dosimetry 9283 9284 12.5.1. Calculation of dose conversion factor arising from the inhalation of radon 9285 progeny. 9286 9287
(713) The effective doses arising from the inhalation of the short-lived radon progeny are 9288 calculated in terms of Sv per PAE exposure, (i.e. in units of Sv per J h m-3 or in units of Sv 9289 per WLM). The intakes of activity of the radon progeny, Ii (in Bq) for a subject exposed to 1 9290 WLM are given by Eq. 12-9. : 9291 9292
tBCI ii = (Eq. 12-9) 9293
9294 where Ci (in Bq m-3) is the activity concentration of the decay product i corresponding to a 9295 radon progeny mixture of 1 WL, B (in m3 h-1) is the average breathing rate and t (in h) is the 9296 exposure period of 170 h. 9297
(714) In practice, the activity concentrations of radon progeny will vary with particular 9298 environmental conditions of exposure. However, Marsh and Birchall (2000) showed that for 9299 intakes of short-lived 222Rn progeny, the equivalent dose to the lung per WLM is relative 9300 insensitive to F (i.e. to the activity ratios of the radon progeny). This is because the WL is 9301 defined in terms of the PAEC and because the fraction of alpha energy absorbed by the target 9302 tissues in the lung is similar for 218Po and 214Po per disintegration. Based on measurements 9303 of the activity concentration of 218Po, 214Pb, and 214Bi carried out indoors (Reineking and 9304 Porstendörfer, 1990; Kojima and Abe, 1988) the following activity ratios of 222Rn progeny 9305 are assumed for dosimetry: 9306
DRAFT FOR MC REVIEW PRIOR TO CONSULTATION
236
9307 Unattached: 218Po : 214Pb : 214Bi = 1 : 0.1 : 0 9308 Attached: 218Po : 214Pb : 214Bi = 1 : 0.75 : 0.6 9309
9310 (715) For thoron (220Rn) progeny, the activity ratios assumed are the ones proposed by the 9311
committee of the National Research Council (NRC, 1991); activity ratios of 212Pb : 212Bi of 9312 1.0:0 and 1.0:0.25 were assumed for the unattached and attached modes respectively. Because 9313 216Po contributes less than 0.001% to the PAEC, it can be ignored for dosimetry purposes. 9314
(716) The activity concentrations of radon progeny that correspond to a radon progeny 9315 mixture of 1 WL for either the unattached or the attached progeny can be calculated by 9316 assuming the above activity ratios and by applying Eq. 12-1. These values are given in Table 9317 12-14. 9318 9319 Table 12-14. Activity concentrations, Ci of a mixture of short-lived radon (222Rn) or thoron 9320 (220Rn) progeny that gives 1 WL for either the unattached or the attached progeny 9321 9322
Nuclide Activity concentration, Bq m-3 Unattached Attacheda
Radon (222Rn) progenyb: 218Po 2.41 104 5.21 103 214Pb 2.41 103 3.91 103 214Bi 0 3.13 103 Thoron (220Rn) progenyc: 212Pb 3.01 102 2.94 102 212Bi 0 7.36 101 a For simplicity, it is assumed that the activity ratios of the radon progeny for each of the attached 9323
modes are the same. 9324 b Activity ratios of 218Po : 214Pb : 214Bi of 1.0:0.1:0 and 1.0:0.75:0.60 are assumed for the unattached 9325
and attached modes respectively. 9326 c Activity ratios of 212Pb : 212Bi of 1.0:0 and 1.0:0.25 are assumed for the unattached and attached 9327
modes respectively. 9328 9329
(717) For the average breathing rate, B, the ICRP default value for a reference worker of 9330 1.2 m3 h-1 is assumed for all exposure scenarios (ICRP, 1994). Regarding exposures in a 9331 mine, this value is similar to the average breathing rate of 1.3 m-3 h-1 estimated from a study 9332 of 620 underground miners carrying out heavy work in a gold mine in South Africa (ICRP 9333 Publication 66, para. B76, ICRP, 1994). It is also consistent with the breathing rates derived 9334 by Ruzer et al. (1995) for personnel (0.9 ± 0.4 m-3 h-1), assistant drillers (1.1 ± 0.5 m-3 h-1) 9335 and drillers (1.4 ± 0.5 m-3 h-1) working underground in a metal mine in Tadjikistan. 9336
(718) The effective dose per WLM arising from the inhalation of the short-lived radon 9337 progeny is calculated by combining the intakes, Ii (derived from Eq. 12-9) with the effective 9338 dose coefficients (Sv per Bq) for the individual radon progeny. The following equation is 9339 applied: 9340 9341
∑∑=
=3
1,,)(
i jijpjij EfIWLMperSvE (Eq. 12-10) 9342
9343 where index j corresponds to the aerosol mode of the activity size distribution; j=1, 2, and 3 9344 for the unattached, nucleation and accumulation modes respectively. The fpj value is the 9345

DRAFT FOR MC REVIEW PRIOR TO CONSULTATION
237
fraction of the PAEC associated with mode j. The index i corresponds to the inhaled decay 9346 product; in the case of 222Rn progeny, i =1, 2, and 3, which corresponds to 218Po, 214Pb and 9347 214Bi respectively. The symbol Ej,i is the effective dose coefficient (in Sv per Bq) for decay 9348 product i with an activity size distribution for mode j. In the case of 222Rn progeny, the 9349 intakes Ij,1, Ij,2 and Ij,3 are the intakes of 218Po, 214Pb and 214Bi respectively, which result in an 9350 exposure of 1 WLM for either the unattached progeny (j=1) or for the attached progeny 9351 (j=2,3). 9352
(719) Table 12-15 gives calculated values of the effective dose per unit exposure for 9353 indoor workplaces and mines in terms of PAE exposure (mSv per WLM or mSv per mJ h m-9354 3) and in terms of radon gas exposure (Sv per Bq h m-3). For exposures to 222Rn progeny, the 9355 units Sv per WLM can be converted to Sv per Bq h m-3 of 222Rn gas exposure by multiplying 9356 by (F/6.37 105 WLM per Bq h m-3). For exposures to thoron (220Rn) the units Sv per WLM 9357 can be converted to Sv per Bq h m-3 of EEC of 220Rn by multiply by (1/4.68 104 WLM per Bq 9358 h m-3 of ECC of 220Rn). 9359
(720) The committed equivalent doses to organs arising from the inhalation of 222Rn 9360 progeny and from 220Rn progeny are given in the accompanying electronic disk. 9361 9362 Table12-15. Calculated values of effective doses per unit exposure to radon progeny for indoor 9363 workplaces and mines. Dose from inhaling 222Rn or 220Rn gas is excluded. 9364 9365
Place Unattached fractiona, fp
Fb Effective dose per unit exposurec
mSv per WLM
mSv per mJ h m-3
Sv per Bq h m-3
Radon (222Rn) progeny: Indoor workplace 0.1 0.4 21 5.9 1.3 10-8 Mine 0.01 0.2 11 3.0 - Thoron (220Rn) progeny:
Indoor workplace 0.02 - d Mine 0.005 - d
a fp = unattached fraction in terms of the potential alpha energy concentration (PAEC). 9366 b F = equilibrium factor. 9367 c 1 WLM = (6.37 105/F) Bq h m-3; 1 WLM = 3.54 mJ h m-3 9368 d In terms of Sv per Bq h m-3 of EEC of 220Rn 9369
9370 Inhalation of short-lived decay products of actinon 219Rn 9371
(721) Because actinon (219Rn) has a very short half-life (4s) it is less able than radon 9372 (222Rn; half-life 3.8 d) or thoron (220Rn; half-life 56 s) to escape from the point of where it is 9373 formed. As a consequence, exposures to 219Rn and its progeny in the workplace are low and 9374 can generally be ignored. However, there may be some unusual situations where it is 9375 appropriate to calculate doses from inhaling 219Rn and its progeny. For example, Crawford 9376 (1980) reported that radiological surveys at former uranium ore processing facilities showed 9377 that there were a number of sites with high levels of airborne 219Rn decay products. Further 9378 investigation showed that these sites had been used for the storage of a precipitate, which was 9379 formed during processing pitchblende ore and found to have a relatively high content of 227Ac 9380 and a low content of 226Ra. In such cases, for radiation protection purposes, it is normally 9381 sufficient to control exposures on the basis of the intake of 211Pb. This is because the PAE 9382 per unit activity of 211Pb is about 15 times higher or more than for other actinon progeny. 9383 However, for completeness, in the accompanying electronic disk dose coefficients (Sv Bq-1) 9384 are given for both 211Pb and 211Bi. To our knowledge there have been no activity size 9385
DRAFT FOR MC REVIEW PRIOR TO CONSULTATION
238
measurements of actinon progeny. Dose coefficients have been calculated separately for the 9386 unattached, nucleation and accumulation modes with size characteristics (AMTD, σg) equal 9387 to that assumed for 222Rn progeny in indoor work places (Table 12-4 and Table 12-6), 9388 because the half-life of 211Pb (36 minutes) is much closer to that of the 222Rn decay product 9389 214Pb (27 minutes) than that of the 220Rn decay product 212Pb (11 h). For these modes the 9390 regional deposition in the respiratory tract are given in Table 12-7. 9391 9392 12.5.2. Inhalation of radon gas 9393 9394
(722) The equilibrium effective dose rate for continuous chronic exposure to unit 9395 concentration of 222Rn is ? Sv per Bq h m-3. The corresponding equilibrium equivalent dose 9396 rates to organs are given in the accompanying electronic disk. The equilibrium effective dose 9397 can be expressed in terms of potential alpha energy exposure for a given F value; for F=0.4 9398 the effective dose arising from the inhalation of 222Rn gas alone is ? mSv per WLM (? Sv per 9399 J h m-3) and for F=0.2 effective dose is ? mSv per WLM (? Sv per J h m-3). Comparing these 9400 numbers with the effective doses arising from the inhalation of radon progeny shows that the 9401 dose from inhaling radon gas is only a small component; less than 10%. 9402 (Data will be provided in the final version of this document.) 9403 9404 12.5.3. Ingestion of radon 9405 9406
(723) Equivalent doses to organs per unit activity of 222Rn ingested are given in the 9407 accompanying electronic disk. The effective dose per unit intake of ingested 222Rn is ? Sv per 9408 Bq. 9409 (Data will be provided in the final version of this document.) 9410 9411 12.5.4. Use of dose coefficients for radon-222 and radon-220 and their short lived decay 9412 products 9413 9414
(724) For the radioisotopes of most elements, dose coefficients are given in this report 9415 series for different exposure conditions (mainly different chemical forms) with the advice that 9416 in situations where more specific data are available, and estimated doses warrant more 9417 detailed consideration, site specific dose coefficients may be calculated. 9418
(725) Radioisotopes of radon represent a special case since there is substantial direct 9419 evidence of lung cancer induction resulting from inhalation of 222Rn and its radioactive 9420 progeny (ICRP, 2000). Epidemiological data clearly show that tobacco smoke is a more 9421 powerful lung carcinogen that accounts for many more lung cancer cases than radon 9422 inhalation (ICRP, 2010). Background lung cancer rates in different populations will differ 9423 according to smoking prevalence and will change with time as habits change. In transporting 9424 risk estimates for radiation induced cancer across populations and calculating overall and 9425 relative detriment values, ICRP does not take account of smoking statistics. Thus, it should be 9426 recognised that ICRP nominal risk coefficients and dose coefficients apply to a mixed 9427 population of smokers and non-smokers. 9428
(726) Dose coefficients are given in this publication for the inhalation of radon isotopes 9429 and their progeny in two situations of exposure:- Indoor Workplaces and Mines. The value 9430 for Indoor Workplaces should also be applied to other situations of exposure, including those 9431 in tourist caves, water supply facilities and spas. The task group calculated similar dose 9432 coefficients for indoor workplaces, tourist caves, water supply facilities and spas. In 9433

DRAFT FOR MC REVIEW PRIOR TO CONSULTATION
239
circumstances of occupational exposure to radon and progeny which require the application 9434 of the system of protection and the calculation of worker doses, it is envisaged that the 9435 appropriate reference dose coefficient will be applied. Employers may also wish to make 9436 assessments of risk to their workers. It would then be appropriate to take account of the 9437 specific conditions of exposure (aerosol characteristics, equivalent factors, etc) in the 9438 calculation of lung dose, and of the individual characteristics of workers, including smoking 9439 habits, in estimating the associated risks. 9440 9441
References 9442 9443 AGIR (Advisory Group on Ionising Radiation) (2009). Radon and public health. Doc HPA, RCE-11, 9444
ISBN 978-0-85951-644-0. Available at www.hpa.org.uk. 9445 Andersson, I. O.; Nilsson, I. (1964). Exposure following ingestion of water containing radon-222. In: 9446
IAEA Symposium on Assessment of Radioactivity in Man: Vienna, IAEA, pp. 317-326. 9447 Becker, H. K., Reineking, A., Scheibel, H. G. and Porstendörfer, J. (1984). Radon daughter activity 9448
size distributions. Radiat. Prot. Dosim., 7(1-4), 147-150. 9449 Bell, C. M. J.; Leach, M. O. (1982). A compartmental model for the investigation of the influence of 9450
physiological factors on the rate of Xe-133 and Ar-37 from the body. Phys. Med. Biol. 9451 27:1105–1117. 9452
Bernard, S. R.; Snyder, W. S. (1975). Metabolic models for estimation of internal radiation exposure 9453 received by human subjects from inhalation of noble gases. ORNL Report 5046, pp. 197-9454 204. 9455
Bigu, J. and Kirk, B. (1980). Determination of the unattached radon daughter fractions in some 9456 uranium mines. Presented at the workshop on attachment of radon daughters, 9457 measurements techniques and related topics, October 30, 1980, University of Toronto. 9458 (Report available from CANMET, P.O. Box 100, Elliot Lake, Ontario, Canada). 9459
Boulaud, D., & Chouard, J. C. (1992). Submicron sized aerosol and radon progeny measurements in 9460 a uranium mine. Radiat. Prot. Dosim., 45(1-4), 91-94. 9461
Brown, W. L.; Hess, C. T. (1992). Measurement of the biotransfer and time constant of radon from 9462 ingested water by human breath analysis. Health Phys. 62:162-170. 9463
Busgin, A., van der Vooren, A., & Phillips, C. R. (1981). Measurements of the total and radioactive 9464 aerosol size distribution in a Canadian uranium mine. American Industrial Hygiene 9465 Association Journal, 42, 310-314. 9466
Butterweck, G., Porstendörfer, J., Reineking A. and Kesten J. (1992). Unattached Fraction and the 9467 Aerosol Size Distribution of the Radon Progeny in a Natural Cave and Mine Atmospheres. 9468 Radiat. Prot. Dosim., 45(1-4), 167-170. 9469
Cavallo, (1997). Understanding aerosols in uranium mines in order to compute the lung dose for 9470 uranium miners. J. of Aerosol Sci., 28, Suppl. 1, S435- S436. 9471
Cavallo, (2000). Understanding mine aerosols for radon risk assessment. J. Environ. Radioactivity 9472 51, 99-119. 9473
Cavallo, A. J. (1998). Reanalysis of 1973 activity-weight particle size distribution measurements in 9474 active US uranium mines. Aerosol Science and Technology, 29, 31-38. 9475
Cavallo, A., Hutter, A., Shebell, P. (1999). Radon progeny unattached fraction in an atmosphere far 9476 from radioactive equilibrium. Health Physics, 76 (5), pp. 532-536. 9477
Charles, M. W. (2004). The skin in radiological protection ─ recent advances and residual 9478 unresolved issues. Radiat. Prot. Dos., 109(4), 323-330. 9479
Chen, R. T., Cheng, Y.-S., Hopke, P. K., Tung, C.-J. and Pourprix, M. (1997). Electrical mobility and 9480 size distribution of aged 212Pb nanometer carriers in nitrogen gas. J. Aeerosol Sci. Vol. 9481 28(8), 1465-1477. 9482
Chen C.-J., Liu C.-C., Lin Y.-M. (1998). Measurement of equilibrium factor and unattached fraction 9483 of radon progeny in Kaohsiung, Taiwan. Appl. Radiat. Issot. 49(12) 1613-1618. 9484
DRAFT FOR MC REVIEW PRIOR TO CONSULTATION
240
Cheng, Y.-S., Chen, T.-R., Wasiolek, P. T., Van Engen, A. (1997). Radon and radon progeny in the 9485 Carlsbad caverns. Aerosol Science and Technology, 26, 74-92. 9486
Cheng, Y.-S., Chen, R. T., Yeh, H. C., Bigu, J, Holub, R., Tu, K., Knutson, E. O. and Falk, R. (2000). 9487 Intercomparison of activity size distribution of thoron progeny and a mixture of radon and 9488 thoron progeny. J. Environ. Radioactivity 51, 59-78. 9489
Conn, H. L. (1961). Equilibrium distribution of radioxenon in tissue: Xenon-hemoglobin association 9490 curve. J. Appl. Physiol. 16:153-157. 9491
Cooper, J. A., Jackson, P. O., Langford, J.C., Petersen, M. R., and Stuart, B. O. (1973). 9492 Characteristics of attached radon-222 daughters under both laboratory and field conditions 9493 with particular emphasis on the underground uranium mine environment. Report to the U.S. 9494 Bureau of Mines; Contract Report H0220029, Battelle Pacific Northwest Laboratories. 9495
Correia, J.; Weise, S.; Callahan, R.; Strauss, H. (1987). The Kinetics of ingested Rn-222 in humans 9496 determined from measurements with Xe-133 (Boston: Massachusetts General Hospital). 9497
Crawford, D. J. (1980). Radiological characteristics of 219Rn. Health Physics, 39, 449-461. 9498 Crawford-Brown, D. J. (1989). The biokinetics and dosimetry of radon-222 in the human body 9499
following ingestion of groundwater. Environ. Geochem. Health 11:10-17. 9500 Dundulis, W. P.; Bell, W. J.; Keene, B. E.; Dostie, P. J. (1984). Radon-222 in the gastrointestinal 9501
tract: A proposed modification of the ICRP Publication 30 model. Health Phys. 47:243–9502 252. 9503
Eatough, J. P., Henshaw, D. L. (1992). Radon and thoron associated dose to the basal layer of the 9504 skin. Phys. Med. Biol. 37, 955-67. 9505
El-Hussein, A. (2005). A study on natural radiation exposure in different realistic living rooms. 9506 Journal of Environmental Radioactivity 79 355-367. 9507
El-Hussein, A., Ahmed, A. and Mohammed, A. (1998). Radiation dose to the Human Respiratory 9508 Tract from inhalation of radon-222 and its progeny. Appl. Radiat. Isot. Vol. 49, No. 7, pp. 9509 783-790. 9510
Ellis, K. J.; Cohn, S. H.; Susskind, H.; Atkins, H. L. (1977). Kinetics of inhaled krypton in man. 9511 Health Phys. 33:515-522. 9512
Fernau, A.; Smereker, H. (1933). Concerning the remaining radioactive substance in organisms due to 9513 radon emanation. Strahlentherapie 46:365-373. 9514
George, A. C., Hinchliffe, L., and Sladowski, R. (1975). Size distribution of radon daughters in 9515 uranium mine atmospheres. American Industrial Hygeine Association Journal, 36, 484. 9516
Geranios, A. Nikolopoulos, D., Louizi, A, et al., 2004. Multiple radon survey in spa of Loutra 9517 Edipsou (Greece). Radiat. Prot. Dosim. 112(2), 251-258. 9518
Gosink, T. A.; Baskaran, M.; Holleman D. F. (1990). Radon in the human body from drinking water. 9519 Health Phys. 59: 919-924. 9520
Harley, J. H.; Jetter, E.; Nelson, N. (1951). Elimination of radon from the body. New York, NY: U.S. 9521 Atomic Energy Commission, New York Operations Office; Report No. 3. Reissued as 9522 Health and Safety Report, HASL-32 (1958). New York: U.S. Atomic Energy Commission. 9523 New York Operations Office. Also see: Harley, J. H.; Jetter, E.; Nelson, N. (1994). 9524 Elimination of radon from the body. Environmental International 20:573-584. 9525
Harley, N. H., Robbins E. S. (1992). 222Rn alpha dose to organs other than the lung. Radiat. Prot. 9526 Dosim. 45, 617-622. 9527
Harley, N. H.; Robbins, E. S. (1994). A biokinetic model for 222Rn gas distribution and alpha dose 9528 in humans following ingestion. Environ. Int. 20:605-610. 9529
Hattori, T. and Ishida, K. (1994). Equilibrium factor and unattached fraction of radon in nuclear 9530 power plants. Radiat. Prot. Dosim., 55(3), 191-197. 9531
Hattori, T. Ichiji, T., and Ishida, K. (1995). Behaviour of radon and its progeny in a Japanese office. 9532 Radiat. Prot. Dosim., 62(3), 151-155. 9533
Hopke, P., Jenson, B., Li, C. S., Montassier, N. Wassiolek, P., Cavallo, A. J., Gatsby K. Scocolow, R. 9534 H. and James, A. C. (1995). Assessment of the exposure to and dose from radon decay 9535 products in normally occupied homes. Environ. Sci. Technol. 29: 1359-1364 (1995). 9536

DRAFT FOR MC REVIEW PRIOR TO CONSULTATION
241
Huet, C. Tymen, G., Boulaud, D., (2001a). Long-term measurements of equilibrium factor and 9537 unattached fraction of short-lived radon decay products in dwelling – comparison with 9538 Praddo Model. Aerosol Science and Technology 35, 553-563. 9539
Huet, C. Tymen, G., Boulaud, D., (2001b). Size distribution, equilibrium ratio and unattached 9540 fraction of radon decay products under typical indoor domestic conditions. The Science of 9541 the Total Environment, 272, 97-103. 9542
Hursh, J. B.; Morken, A.; Thomas, P. D.; Lovaas, A. (1965). The fate of radon ingested by man. 9543 Health Phys. 11:465-476. 9544
ICRP (1975). International Commission on Radiological Protection, Report of the Task Group on 9545 Reference Man, ICRP Publication 23. Oxford: Pergamon Press. 9546
ICRP (1993). Protection against radon-222 at home and at work. ICRP Publication 65. Annals of the 9547 ICRP 23(2), Pergamon Press, Oxford. 9548
ICRP (1994a). Human respiratory tract model for radiological protection. ICRP Publication 66. 9549 Annals of the ICRP, 24(1-3), Pergamon Press, Oxford. 9550
ICRP (1994b). Dose coefficients for intakes of radionuclides by workers. ICRP Publication 68. 9551 Annals of the ICRP, 24(4), Pergamon Press, Oxford. 9552
ICRP (2002). International Commission on Radiological Protection. Basic anatomical and 9553 physiological data for use in radiological protection: Reference values. ICRP Pub. 89. Ann. 9554 ICRP, 32(3-4). Oxford: Pergamon Press. 9555
ICRP (2006). International Commission on Radiological Protection. Human Alimentary Tract Model 9556 for Radiological Protection. ICRP Publication 100. Ann. ICRP, 26(1-2). Oxford: 9557 Pergamon Press. 9558
Iimoto, T. (2000). Time variation of the radon equilibrium factor in reinforced concrete dwelling. 9559 Radiat. Prot. Dosim., 92(4), 319-321 9560
Iimoto, T., Kosako, T. and Sugiura, N. (2001). Measurements of summer radon and its progeny 9561 concentrations along with environmental gamma dose rates in Taiwan. Journal of 9562 Environmental Radioactivity, 57 (1), 57-66 9563
Iyogi, T., Ueda, S., Hisamatsu, S., Kondo, K., Sakurai, N. and Inaba, J. Radon concentrations in 9564 indoor occupational environments in Aomori Prefecture, Japan. (2003). Journal of 9565 Environmental Radioactivity 67, 91-108. 9566
James, A C, Strong, J C, Cliff, K D, and Stranden. (1988). The significance of equilibrium and 9567 attachment in radon daughter dosimetry. Radiat. Prot. Dosim., 24, 451-455. 9568
Kahn, A., Bandi, F., Gleasur, R.W., Phillips, C.R., & Duport, P. (1987). Underground measurements 9569 of aerosol and activity distributions of radon and thoron progeny. P.K. Hopke, Radon and 9570 its decay products Washington, DC: (p. 219), The American Chemical Society. 9571
Kety, S. G. (1951). The theory and applications of the exchange of inert gases at lung and tissue. 9572 Pharmacol. Rev. 3:1-41. 9573
Khursheed, A. (2000). Doses to systemic tissues from radon gas. Radiat. Prot. Dosim. 88:171-181. 9574 Kirk, W. P.; Parish, P. W; Morken, D. A. (1975); In vivo solubility of Kr-85 in guinea pig tissues. 9575
Health Physics 28, 249-261 (1975). 9576 Knutson, E. O., and George, A. C. (1990). Reanalysis of the data on the particle size distribution of 9577
radon progeny in uranium mines. Proceedings of the 29th life sciences symposium, indoor 9578 radon and lung cancer: reality or myth? October 16-19, Part 1. Edited by F. T. Cross. 9579 Pacific Northwest Laboratories Richland, WA (p. 149). 9580
Kojima, H. and Abe, S. (1988). Measurements of the total and unattached radon daughters in a 9581 house. Radiat. Prot. Dosim., 24(1/4), 241- 244. 9582
Kranrod, C., Tokonami, S., Ishikawa, T., Sorimachi, A., Janik, M., Shigaki, R., Furukawa, M., 9583 Chanyotha, S. and Chankow, N. (2009). Mitgation of the effective dose of radon decay 9584 products through the use of an air cleaner in a dwelling in Okinawa, Japan. Applied 9585 Radiation and Isotopes 67(6), 1127-1132. 9586
Labidi, S., Al-Azmi, D., Mahjoubi, H., Ben Salah, R. (2010). Radon in elementary schools in 9587 Tunisia. Radiopotection, 45(2), 209-217. 9588

DRAFT FOR MC REVIEW PRIOR TO CONSULTATION
242
Leggett, R. W.; Williams, L. R. (1995). A proposed blood circulation model for reference man. 9589 Health Phys. 69:187-201. 9590
Lettner, H., Hubmer, A.K., Rolle, R., Steinhäusler, F. (1996). Occupational exposure to radon in 9591 treatment facilities of the radon-spa Badgastein, Austria. Environ. Intern 22 (1), S399-9592 S407. 9593
Maged, A. F. (2006). Radon concentrations in elementary schools in Kuwait. Health Phys. 90(3), 9594 258-262. 9595
Marsh J W and Birchall A (1998). Sensitivity analysis of the weighted equivalent lung dose per unit 9596 exposure from radon progeny. NRPB-M929 Health Protection Agency, Chilton, Didcot, 9597 Oxon, OX11 ORQ, UK. 9598
Marsh, J. W., Bessa, Y., Birchall, A., Blanchardon, E., Hofmann, W., Nosske. D. and L. Tomasek 9599 (2008). Dosimetric models used in the Alpha-Risk project to quantify exposure of uranium 9600 miners to radon gas and its progeny. Radiat. Prot. Dosim., 130(1) 101-106. 9601
Marsh, J.W., Birchall, A., Butterweck, G., Dorrian, M.-D., Huet, C., Ortega, X., Reineking, A., 9602 Tymen, G., Schuler, Ch., Vargas, A., Vezzu, G. and Wendt. J. (2002). Uncertainty 9603 analysis of the weighted equivalent lung dose per unit exposure to radon progeny in the 9604 home. Radiat. Prot. Dosim., 102(3), 229-248. 9605
Meyer, S. (1937). Physical foundations of radon cures. Strahlentherapie. 58:656-663. 9606 Misdaq, M. A. and Amghar, A. (2005). Radon and thoron emanation from various marble materials: 9607
impact on the workers. Radiation Measurements 39, 421-430. 9608 Misdaq, M. A. and Flata, K. (2003). The influence of the cigarette smoke pollution and ventilation 9609
rate on alpha activities per unit volume due to radon and its progeny. Journal of 9610 Environmental Radioactivity, 67, 207-218. 9611
Mohammed, A. (1999). Activity size distributions of short-lived radon progeny in indoor air. Radiat. 9612 Prot. Dosim., 86(2), 139-145. 9613
Mohammed, A. (2005). Study on radon and radon progeny in some living rooms. Radiat. Prot. 9614 Dosim., 117(4), 402-407. 9615
NAS (1999). Risk assessment of radon in drinking water. National Research Council. National 9616 Academy of Sciences. Washington, D.C.: National Academy Press. 9617
National Research Council, (1991). Comparative Dosimetry of Radon in Mines and Homes. 9618 National Academy Press (Washington, DC). ISBN 0-309-04484-7 (1991). 9619
Nickell, W.B. (2005). Skelton J Breast fat and fallacies: more than 100 years of anatomical fantasy. 9620 Journal of Human Lactation, 21(2):126-130 9621
NRC (National Research Council), (1999). Health effects of exposure to radon. Washinghton, DC: 9622 National Academy Press; BEIR VI, ISBN: 0-309-05645-4. 9623
Nussbaum, E. and Hursh, J. B. (1958). Radon solubility in fatty acids and triglycerides. J Phys. 9624 Chem. 62, 81-84. 9625
Nussbaum, E.; Hursh, J. B. (1957). Radon solubility in rat tissues. Science 125:552. 9626 Olfert, J. S., Symonds, J. P. R. and Collings, N. (2007). The effective density and fractal dimensions 9627
of particles emitted from a light-duty vehicle with a diesel oxidation catalyst. Aerosol 9628 Science 38 69-82. 9629
Park, K., Cao, F., Kittelson, D. B. and McMurry, P. H. (2003). Relationship between particle mass 9630 and mobility for diesel exhaust particles. Environ. Sci. Technol. 37, 577-583. 9631
Peterman, B. F.; Perkins C. J. (1988). Dynamics of radioactive chemically inert gases in the human 9632 body. Radiat. Prot. Dosim. 22:5–12. 9633
Porstendörfer, J (1994). Tutorial/Review: Properties and behaviour of radon and thoron and their 9634 decay products in the air. J. Aerosol Sci., 25(2), 219-263. 9635
Porstendörfer, J (1996). Radon: Measurements related to dose. Environmental International, Vol. 9636 22, Suppl. 1, pp. S563-S583. 9637
Porstendörfer, J (2001). Physical parameters and dose factors of the radon and thoron decay 9638 products. Radiat. Prot. Dosim., 94(4), 365-373. 9639
Porstendörfer, J., Pagelkopf, P. and Gründel, M. (2005). Fraction of the positive 218Po and 214Pb 9640

DRAFT FOR MC REVIEW PRIOR TO CONSULTATION
243
clusters in indoor air. Radiat. Prot. Dosim., 113(3), 242-351. 9641 Porstendörfer, J. and Reineking, A. (1999). Radon: Characteristics in air and dose conversion 9642
factors. Health Phys. 76(3), 300-305. 9643 Ramachandran, T.V. and Subba Ramu, M.C. (1994). Variation of equilibrium factor F between 9644
radon and its short-lived decay products in an indoor atmosphere. Nuclear 9645 Geophysics, 8 (5), pp. 499-503. 9646
Ramsay, D. T. ; Kent, J. C.; Hartmann, R. A. ; Hartmann, P. E. (2005). Anatomy of the lactating 9647 human breast redefined with ultrasound imaging. J. Anat. 206:525–534. 9648
Reichelt, A., Lehmann, K.H., Reineking, A., Porstendörfer, J., Schwedt, J. and Streil, T. (2000). 9649 Radon at workplaces. In: Proc. IRPA-10, Hiroshima, Japan, 14-19 May (2000). 9650
Reineking, A., Butterweck, G., Kesten, J. and Porstendörfer J (1992). Thoron gas concentration and 9651 aerosol characteristics of thoron decay products. Radiat. Prot. Dosim., 45(1/4), 353-356. 9652
Reineking A, Knutson E A, George A C, Solomon S B, Kesten J, Butterweck G and Porstendorfer J 9653 (1994). Size distribution of unattached and aerosol-attached short-lived radon decay 9654 products: some results of intercomparison measurements. Radiat. Prot. Dosim., 56(1-4), 9655 113-118. 9656
Reineking, A and Porstendörfer, J. (1990). “Unattached” fraction of short-lived Rn decay products in 9657 indoor and outdoor environments: an improved single-screen method and results. Health 9658 Physics, 58(6) 715-727. 9659
Richardson, R. B.; Eatough, J. P.; Henshaw, D. L. (1991). Dose to red bone marrow from natural 9660 radon and thoron exposure. Br. J. Radiol. 64:608-624. 9661
Rosvenská, K., Thinová, L., Ždímal, V. (2008). Assessment of the dose from radon and its decay 9662 products in the Bozkov dolomite cave. Radiat. Prot. Dosim., 130(1), 34-37. 9663
Ruzer, L. S., Nero A.V. and Harley N. H. (1995). Assessment of lung deposition and breathing rate 9664 of underground miners in Tadijikistan. Radiat. Prot. Dosim., 58, 261-268. 9665
Sainz, C., Quidós, L. S., Fuente, I., Nicolás, J., Quidós, L. (2007). Analysis of the main factors 9666 affecting the evaluation of the radon dose in workplaces: The case of the tourist caves. 9667 Journal of Hazardous Materials, 145, 368-371. 9668
Sharma, N.; Hess, C. T.; Thrall, K. D. (1997). A compartment model of water radon contamination in 9669 the human body. Health Phys. 72:261-268. 9670
Sinclair, D., Countess, R. J. and Hoopes, G. S (1974). Effect of relative humidity on the size of 9671 atmospheric aerosols particles. Atmos. Environ., 8, 1111-1117. 9672
Solomon, S. B., Cooper, M. B., O’Brien, R. S., Wilkinson, L., (1992). Radon exposure in a 9673 limestone cave. Radiat. Prot. Dosim., 45(1-4), 171-174. 9674
Solomon, S. B., Wilks, M., O’Brien, R. S. and Ganakas, G. (1993). Particle sizing of airborne 9675 radioactivity field measurements at Olympic Dam. Report ARL/TR113. ISSN 0157-1400. 9676 Australian Radiation Laboratory, Lower Plenty Road, Yallambie VIC 3085. 9677
Solomon, S. B., O’Brien, R. S., Wilks, M. and James, A. C. (1994) Application of the ICRP’s new 9678 respiratory tract model to an underground uranium mine. Radiat. Prot. Dosim., 53(1-4), 9679 261-268. 9680
Soto, J., Gómez, J. (1999). Occupational doses from radon in Spanish spas. Health Phys. 76(4), 9681 398-401. 9682
Suomela, M.; Kahlos, H. (1972). Studies on the elimination rate and the radiation exposure following 9683 ingestion of Rn-222 rich water. Health Phys. 23:641-652. 9684
Susskind, H.; Atkins, H. L.; Cohn, S. H.; Ellis, K. J.; Richards, P. (1977). Whole-body retention of 9685 radioxenon. J. Nucl. Med. 18:462-471. 9686
Tokonami, S., Fukutsu, K., Yamada, Y., Yatabe, Y. (2005). Particle size measurement of radon 9687 decay products using MOUDI and GSA. In: High Levels of Natural Radiation and Radon 9688 Areas: Radiation Dose and Health Effects (T. Sugahara et al., eds.). International Congress 9689 Series 1276, 278-280, Elsevier. 9690
DRAFT FOR MC REVIEW PRIOR TO CONSULTATION
244
Tokonami, S., Iimoto, T. and Kurosawa. (1996a). Continuous measurement of the equilibrium factor, 9691 F and the unattached fraction, fp of radon progeny in the environment. Environmental 9692 International, 22, Suppl. 1, S611-S616. 9693
Tokonami, S., Matsumoto, M. Furukawa, M., Fujimoto, K., Fujitaka, K., and Kurosawa, R. (1996b). 9694 Behavior of radon and its progeny at working place. In: Proc. IRPA-9. 9695
Trautmannsheimer, M., Schindlmeier, W., Börner, K. (2003). Radon concentration measurements and 9696 personnel exposure levels in Bavarian water supply facilities. Health Phys. 84(1), 100-110. 9697
Tschiersch, J., Li, W. B. and Meisenberge, O. (2007) Increased indoor thoron concentrations and 9698 implication to inhalation dosimetry. Radiat. Prot. Dosim., 127(1-4), 73-78. 9699
Tu K W and Knutson E O. (1988) Indoor radon progeny particle size distribution measurements 9700 made with two different methods. . Radiat. Prot. Dosim., 24(1/4) 251-255. 9701
Tu K W, Knutson E O and George A C. (1991) Indoor radon progeny aerosol size measurements in 9702 urban, surban, and rural regions. Aerosol Science and Technolgy 15 170-178. 9703
Vanmarcke, H., Berkvens, P. and Poffijn, A. (1989) Radon versus Rn daughters. Health Physics, 9704 56(2), 229-231. 9705
Vargas, A., Ortega, X. and Porta, M. (2000). Dose conversion factor for radon concentration in 9706 indoor environments using a new equation for the F-fp correlation. Health Phys. 78(1): 80-9707 85. 9708
Vaternahm, T. (1922). Comparative investigation of the radon capacity of exhaled breath after 9709 drinking of radon ladened water and oil. Zschr. Phys. Diat. Ther. 26:361-364. 9710
Vaupotič, J. (2007) Nano-size radon short-lived progeny aerosols in Slovenian kindergartens in 9711 wintertime. Chemosphere, 69 (6), 856-863. 9712
Vaupotič, J. (2008a). Nanosize radon short-lived decay products in air of the Postojna Cave. Science 9713 of the total environment 393 27-38. 9714
Vaupotič, J. (2008b). Levels of nanosize radon decay products in indoor air: A comparison for 9715 different environments. Coll. Antropol. 32 Suppl. 2 99-104. 9716
Vaupotič, J. and Kobal, I (2001). Radon exposure in Slovenia spas. Radiat. Prot. Dosim. 97(3) 265-9717 270 9718
Vaupotič, J. and Kobal, I. (2006) Effective doses in schools based on nanosize radon progeny 9719 aerosols. Atmospheric Environment, 40 (39), 7494-7507. 9720
Vogiannis, E. Nikolopoulos, D., Halvadakis, C. P (2004a). Contribution of 222Rn-bearing water to 9721 the occupational exposure in thermal baths. Environmental International 30, 621-629. 9722
Vogiannis, E., Nikolopoulos, D., Loouizi, A., Halvadakis, C. P. (2004b). Radon exposure in the 9723 thermal spas of Lesvos island—Greece. Radiat. Prot. Dos., 111(1), 121-127. 9724
Vogiannis, E., Nikolopoulos, D., Loouizi, A., Halvadakis, C. P. (2004c). Radon variations during 9725 treatment in thermal spas of Lesvos Island (Greece). J. Environ. Radioactivity., 76, 283-9726 294. 9727
von Döbeln, W.; Lindell, B. (1964). Some aspects of radon contamination following ingestion. Arkiv 9728 für Fysik 27:531-572. 9729
Weingartner, E., Burtscher, H. and Baltensperger, U. (1997) Hygroscopic properties of carbon and 9730 diesel soot particles. Atmospheric Environ. 31 2311-2327. 9731
Wilkening, M. H., Romero, V. (19781). 222Rn and atmospheric electrical parameters in the Carlsbad 9732 caverns. J. Geophys. Res. 86:9911-9916. 9733
Wu-Tu, K., Fisenne, I. M. and Hutter, A. R. (1997). Short - and long-lived radionuclide particle size 9734 measurements in a uranium mine. Report EML-588, Environmental Measurements 9735 Laboratory, U.S. [www.eml.doe.gov/publications/reports/eml588.pdf] 9736
Yu, D.; Kim, J. K. (2004). A physiologically based assessment of human exposure to radon released 9737 from groundwater. Chemospher 54:639-645. 9738
Yu, K. N., Cheung, T., Guan, Z. J., Mui, B. W. N. and Ng, Y. T. (2000). 222Rn, 220Rn and their 9739 progeny concentrations in offices in Hong Kong. Journal of Environmental Radioactivity 9740 48 211 – 221. 9741
DRAFT FOR MC REVIEW PRIOR TO CONSULTATION
245
Yu, K. N., Young, M. C. E. and Li, K. C. (1996). A survey of radon properties for dwellings for 9742 Hong Kong. Radiat. Prot. Dosim., 63(1) 55-62. 9743
Yu, K. N., Young, M. C. E., Stokes, M. J. and Tang, K. K. (1998). Radon properties in offices. 9744 Health Phys. 75(2) 159-164. 9745
Zhang, L. Guo, Q. and Zhuo, W. (2010). Measurement of the 212Pb particle size distribution indoors. 9746 Radiat. Prot. Dosim., 141(4), 371-373. 9747
9748
DRAFT FOR MC REVIEW PRIOR TO CONSULTATION
246
9749 13. Radium (Z = 88) 9750
9751 13.1. Chemical Forms in the Workplace 9752 9753
(727) Radium is an alkaline earth element, which mainly occurs in oxidation states II. It is 9754 a chemical analogue of calcium. Chemical and physical forms encountered in industry include 9755 oxides, nitrates, chlorides, sulphates, and luminising residues. Radium can be found in trace 9756 amounts in uranium ores. A mixture of radium and beryllium is used as a neutron source. 9757 224Ra, 226Ra and 228Ra are the most common isotopes of radium. 223Ra is currently under 9758 investigation for use in medicine as a treatment for bone metastases. 9759 9760
Table 13-1. Isotopes of radium addressed in this report 9761 9762
Isotope Physical half-life Decay mode Ra-223 11.43 d A Ra-224 3.66 d A Ra-225 14.9 d B- Ra-226a 1600 y A Ra-227 42.2 m B- Ra-228a 5.75 y B- Ra-230 93 m B- a Data for these radionuclides are given in the printed copy of this report. Data for other radionuclides 9763
are given on accompanying electronic disk. 9764 9765 13.2. Routes of Intake 9766 9767 13.2.1. Inhalation 9768 9769 Absorption Types and parameter values 9770
(728) Several studies have been reported on the behaviour of inhaled radium in man 9771 following accidental intakes, especially of the sulphate, which was used in powder form in 9772 gamma-ray sources. However, it is difficult to estimate the contribution of absorption to lung 9773 clearance in such cases, because the systemic excretion of radium is predominantly by the 9774 faecal route. Information is available from experimental studies of radium as nitrate, or in fly 9775 ash. 9776
(729) Absorption parameter values and Types, and associated fA values for particulate 9777 forms of radium are given in Table 13-2. 9778 9779 Radium nitrate (Ra(NO3)2) 9780
(730) Following administration of 232UO2(NO3) with its decay products to rats by 9781 intratracheal instillation (Ballou et al., 1986), about 3% of the 224Ra present was retained in 9782 the lung after 1 day, consistent with assignment to Type F. (For further information see the 9783 uranium inhalation section.) 9784
(731) Following administration of Ra(NO3)2 (alone or with thorium nitrate) to rats by 9785 intratracheal instillation (Moody and Stradling 1992; Moody et al., 1994), about 14% of the 9786 initial lung deposit (ILD) was retained in the lung after 6 hours and ~5% ILD after 1 or 7 9787 days. From the results, it was assessed here that fr was about 0.95 and sr about 10 d–1, but it 9788 was not possible to estimate ss. 9789
DRAFT FOR MC REVIEW PRIOR TO CONSULTATION
247
(732) Based on the results of the experiments outlined above, specific absorption 9790 parameter values for radium nitrate were estimated here to be: fr = 1 and sr = 10 d-1 (consistent 9791 with assignment to default Type F). However, although specific parameter values for radium 9792 nitrate based on in vivo data are available, they are not adopted here, because inhalation 9793 exposure to it is unlikely. Instead, radium nitrate is assigned to Type F. However, the data 9794 are used as the basis for the default rapid dissolution rate for radium. Hence specific 9795 parameter values for radium nitrate would be the same as default Type F radium parameter 9796 values. 9797 9798 Radium sulphate (RaSO4) 9799
(733) Marinelli et al. (1953) reported measurements on six people following accidental 9800 inhalation of a mixture of radium and barium sulphates, resulting from rupture of a capsule. 9801 The observed lung retention half-time of 120 d suggested that the material was relatively 9802 insoluble. Looney and Archer (1956) reported measurements on two men, also following the 9803 inhalation of a mixture of radium and barium sulphates from a damaged source. The results 9804 from both studies are difficult to interpret. 9805 9806 Coal fly ash 9807
(734) Kalkwarf et al. (1984) measured the in vitro dissolution of radionuclides in 11 9808 samples of coal fly ash (3–5 size fractions from three sources). Less than 0.2% of the 226Ra 9809 present dissolved during the 60 days, indicating Type S behaviour. 9810 9811 Uranium ore dust 9812
(735) Duport et al. (1991) measured the dissolution in simulated lung fluid of long lived 9813 radionuclides in uranium ore dust from Canadian mines. (For further information see the 9814 uranium section relating to uranium ore dust and to decay products of uranium formed in the 9815 respiratory tract). For high grade ore, measurements were made for up to 60 days. Results 9816 were presented as undissolved fractions as functions of time, and showed two components, 9817 which were expressed as Class D (rapid) and Class Y (slow) fractions. For 226Ra the rapidly 9818 dissolved fraction was 0.12. HRTM parameter values fitted to the 210Pb data by Marsh et al. 9819 (2011) were: fr = 0.11, sr = 7.3 d–1 and ss = 0.0004 d–1, indicating assignment to Type M. For 9820 226Ra, no effects of size were observed in total dissolution over 40 days for particles in size 9821 ranges 7–10, 3–7, 1–3 and <1 µm. For low grade and medium grade ores, measurements were 9822 made for 12 days, but only on samples of relatively coarse dust, the smallest fraction being 9823 <37 µm. For 226Ra, rapidly dissolved fractions were lower, 0.07, indicating assignment to 9824 Type S. 9825 9826 Other compounds 9827
(736) In another case of human inhalation, Toohey et al. (1984) reported a lung retention 9828 half-time of 120 d. However, the radium compound was unknown, (Ra-contaminated dust 9829 from grinding old rubber liners from ion-exchange tanks). It was considered by the authors to 9830 be insoluble, because the amount recovered in fecal excretion corresponded closely to the 9831 amount clearing from the lungs. 9832 9833 Decay products of radium formed in the respiratory tract 9834
(737) The general approach to treatment of decay products formed in the respiratory tract 9835 is described in Part 1, Section 3.2.3. In summary, it is expected that generally the rate at 9836 which a particle dissociates is determined by its matrix, and hence the physico-chemical form 9837

DRAFT FOR MC REVIEW PRIOR TO CONSULTATION
248
of the inhaled material. It is recognised that nuclei formed by alpha decay within a particle 9838 matrix may be expelled from it into the surrounding medium by recoil, but to implement this 9839 routinely would add greatly to the complexity of calculations. It is expected that the behaviour 9840 of soluble (e.g. Type F) material in the respiratory tract would depend on its elemental form, 9841 i.e. that of the decay product. Nevertheless, for simplicity, in this series of documents the 9842 absorption parameter values of the parent are, by default, applied to all members of the decay 9843 chain formed in the respiratory tract. Exceptions are made for noble gases formed as decay 9844 products, which are assumed to escape from the body directly, in addition to other routes of 9845 removal. For calculation purposes it is assumed that radon formed as a decay product within 9846 the respiratory tract escapes from the body at a rate of 100 d–1, in addition to other routes of 9847 removal. (For further information see Part 1, Section 3.2.3, and the section on decay products 9848 of thorium formed in the respiratory tract. 9849
(738) For decay schemes of radium isotopes in the natural decay series, including 223Ra, 9850 224Ra, 226Ra and 228Ra, see the uranium and thorium sections. 9851
(739) Studies specifically comparing the behaviour of radium with that of its decay 9852 products (lead, bismuth and thallium isotopes) are summarised here. For further information 9853 on these elements, see the lead and bismuth inhalation sections. 9854
(740) Studies relating to the loss from the body (emanation) of radon formed in the lungs 9855 are summarised in the section on decay products of thorium formed in the respiratory tract, 9856 even though radium is its immediate predecessor. It was considered useful to have the 9857 relevant information in one place, and to avoid repetition. The most important practical 9858 application of radon emanation is measurement of exhaled 220Rn to assess intakes of 9859 relatively insoluble thorium (thoron-in-breath measurements) and most studies investigating 9860 radon formed in the respiratory tract involved thorium deposited in the lungs. 9861
(741) Ballou et al. (1986) measured lung retention and tissue distribution of 232U, 228Th, 9862 224Ra, 212Pb, 212Bi and 208Tl at 24 hours after intratracheal instillation into rats of 232U nitrate 9863 with its decay products. (For further information, see the uranium inhalation section.) As 9864 noted above, for 224Ra, ~3% ILD was retained in the lungs at 24 hours. For the first 9865 descendant measured, 212Pb, ~2.1% ILD was measured in the lungs: correcting for the 9866 physical decay of 212Pb gives retention of 10% ILD at 24 hours. However, measurements of 9867 212Pb are difficult to interpret, being partly of material administered with the parent 224Ra, and 9868 partly formed from its decay in the lungs. Furthermore, the 212Pb measured could have been 9869 higher than that present in vivo because of ingrowth of 212Pb between dissection and 9870 measurement. If not due to ingrowth, the greater fractional retention of lead could reflect its 9871 slower absorption than that of radium observed when administered separately. 9872
(742) As described in the lead inhalation section, measurements have been made of the 9873 tissue distributions of 212Pb and its decay products, 212Bi and 208Tl, following administration 9874 to rats of 228Th in various chemical forms (nitrate, hydroxide, fluoride, dioxide) in 9875 equilibrium with its decay products. These included 224Ra, but it was not measured. In all 9876 these studies the distributions of 212Bi and 208Tl were similar to each other and those of the 9877 parent 212Pb. In the study of thorium nitrate (Moody et al., 1994; Moody and Stradling, 1992) 9878 a complementary study was carried out with 226Ra (see radium nitrate above). For 212Pb, on 9879 average 8.4% ILD was measured in the lungs at 6 hours and 1.2% ILD at 1 day (clearance 9880 was much faster than that of the 228Th). Correcting for the physical decay of 212Pb gives 9881 retention of 12.5% ILD at 6 hours and 5.6% ILD at one day. This is similar to that found for 9882 226Ra (see above), suggesting similar overall clearance of radium and lead over this period. 9883 9884 Rapid dissolution rate for radium 9885
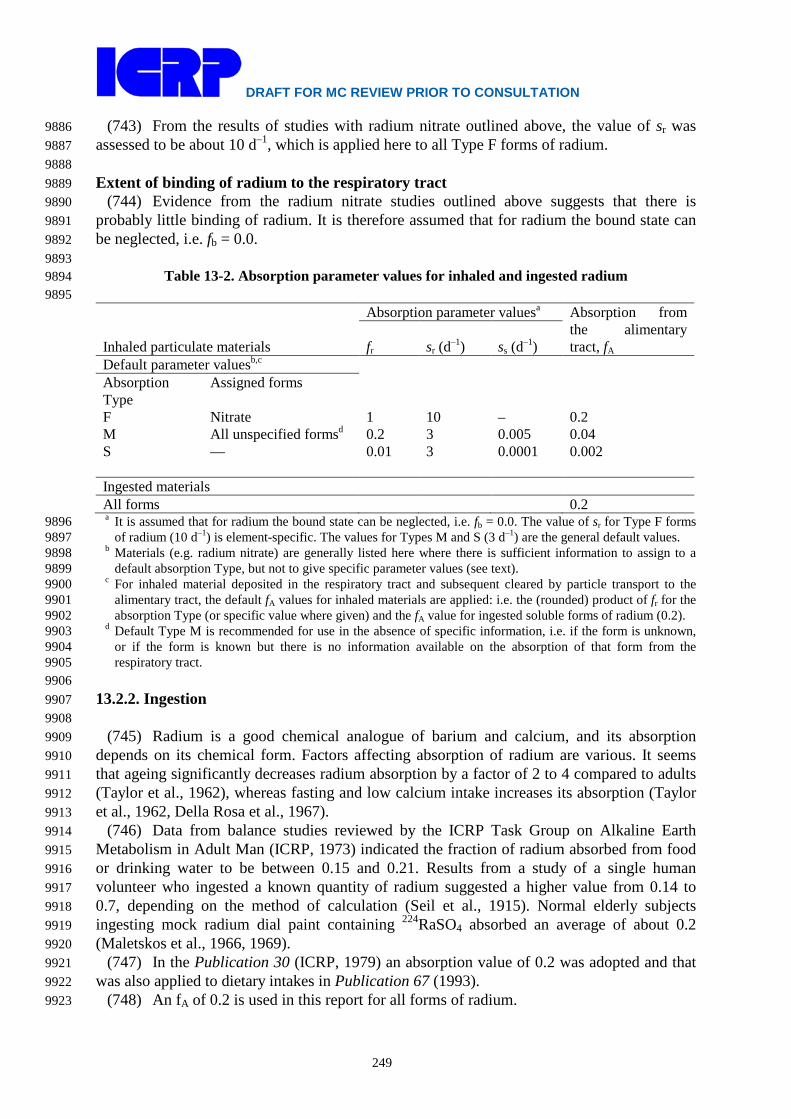
DRAFT FOR MC REVIEW PRIOR TO CONSULTATION
249
(743) From the results of studies with radium nitrate outlined above, the value of sr was 9886 assessed to be about 10 d–1, which is applied here to all Type F forms of radium. 9887 9888 Extent of binding of radium to the respiratory tract 9889
(744) Evidence from the radium nitrate studies outlined above suggests that there is 9890 probably little binding of radium. It is therefore assumed that for radium the bound state can 9891 be neglected, i.e. fb = 0.0. 9892 9893
Table 13-2. Absorption parameter values for inhaled and ingested radium 9894 9895
Inhaled particulate materials
Absorption parameter valuesa Absorption from the alimentary tract, fA fr sr (d–1) ss (d–1)
Default parameter valuesb,c Absorption Type
Assigned forms
F Nitrate 1 10 – 0.2 M All unspecified formsd 0.2 3 0.005 0.04 S — 0.01 3 0.0001 0.002 Ingested materials All forms 0.2 a It is assumed that for radium the bound state can be neglected, i.e. fb = 0.0. The value of sr for Type F forms 9896
of radium (10 d–1) is element-specific. The values for Types M and S (3 d–1) are the general default values. 9897 b Materials (e.g. radium nitrate) are generally listed here where there is sufficient information to assign to a 9898
default absorption Type, but not to give specific parameter values (see text). 9899 c For inhaled material deposited in the respiratory tract and subsequent cleared by particle transport to the 9900
alimentary tract, the default fA values for inhaled materials are applied: i.e. the (rounded) product of fr for the 9901 absorption Type (or specific value where given) and the fA value for ingested soluble forms of radium (0.2). 9902
d Default Type M is recommended for use in the absence of specific information, i.e. if the form is unknown, 9903 or if the form is known but there is no information available on the absorption of that form from the 9904 respiratory tract. 9905
9906 13.2.2. Ingestion 9907
9908 (745) Radium is a good chemical analogue of barium and calcium, and its absorption 9909
depends on its chemical form. Factors affecting absorption of radium are various. It seems 9910 that ageing significantly decreases radium absorption by a factor of 2 to 4 compared to adults 9911 (Taylor et al., 1962), whereas fasting and low calcium intake increases its absorption (Taylor 9912 et al., 1962, Della Rosa et al., 1967). 9913
(746) Data from balance studies reviewed by the ICRP Task Group on Alkaline Earth 9914 Metabolism in Adult Man (ICRP, 1973) indicated the fraction of radium absorbed from food 9915 or drinking water to be between 0.15 and 0.21. Results from a study of a single human 9916 volunteer who ingested a known quantity of radium suggested a higher value from 0.14 to 9917 0.7, depending on the method of calculation (Seil et al., 1915). Normal elderly subjects 9918 ingesting mock radium dial paint containing 224RaSO4 absorbed an average of about 0.2 9919 (Maletskos et al., 1966, 1969). 9920
(747) In the Publication 30 (ICRP, 1979) an absorption value of 0.2 was adopted and that 9921 was also applied to dietary intakes in Publication 67 (1993). 9922
(748) An fA of 0.2 is used in this report for all forms of radium. 9923
DRAFT FOR MC REVIEW PRIOR TO CONSULTATION
250
9924 13.2.3. Systemic Distribution, Retention and Excretion 9925 9926 13.2.3.1. Biokinetic database 9927 9928
(749) The alkaline earth element radium is a physiological analogue of the alkaline earth 9929 elements calcium, strontium, and barium but has different biokinetics from those elements 9930 due to discrimination by biological membranes and hydroxyapatite crystals of bone. The 9931 biokinetics of radium resembles that of barium much more closely than that of calcium or 9932 strontium. 9933
(750) Retention and distribution of radium have been determined in a number of persons 9934 who were briefly exposed to radium isotopes (ICRP, 1973, 1993; Leggett, 1992). There is 9935 also extensive information on the biokinetics of radium in laboratory animals, particularly 9936 dogs (ICRP, 1993, Leggett, 1992). Data for human subjects and laboratory animals used in 9937 the development of the model are summarized below in the discussion of the basis for 9938 parameter values. 9939 9940 13.2.3.2. Biokinetic model for systemic radium 9941 9942
(751) The model for systemic radium applied in this report is a modification of the model 9943 adopted in ICRP Publication 67 (1993). In the earlier version of the model the liver was 9944 represented as a single compartment, and the kidneys were not depicted explicitly but were 9945 included as part of Other soft tissues. In the present version the kidneys are also depicted 9946 explicitly, and both the liver and kidneys are modelled as two compartments representing 9947 relatively fast and relatively slow loss of radium. 9948
(752) The structure of the present model is shown in Figure 13-1. Blood plasma (called 9949 “Blood” in Figure 13-1) is treated as a uniformly mixed pool that contains all radium in 9950 blood, exchanges activity with soft tissues and bone surfaces, and loses activity to urinary and 9951 faecal excretion pathways. Soft tissues are divided into compartments representing two 9952 phases of loss from the liver, two phases of loss from the kidneys, and three phases of loss 9953 from remaining soft tissues. Bone is divided into cortical and trabecular bone. Each of these 9954 bone types is further divided into bone surfaces and bone volume. Bone volume is viewed as 9955 consisting of two pools, one that exchanges with activity in bone surface over a period of 9956 months and a second, non-exchangeable pool from which activity is removed only by bone 9957 restructuring processes. Activity depositing in the skeleton is assigned to bone surface. Over 9958 a period of days a portion of the activity on bone surfaces moves to exchangeable bone 9959 volume and the rest returns to plasma. Activity leaving exchangeable bone volume is divided 9960 between bone surfaces and non-exchangeable bone volume. The assigned rate of removal 9961 from non-exchangeable bone volume is the reference rate of bone turnover for trabecular or 9962 cortical bone. 9963 9964 9965

DRAFT FOR MC REVIEW PRIOR TO CONSULTATION
251
9966 Figure 13-1. Model for systemic radium used in this report. 9967
9968 Parameter values 9969
(753) Retention and distribution of radium have been determined in a number of persons 9970 who were briefly exposed to radium isotopes (Schlundt et al., 1933; Norris et al., 1955; Mays 9971 et al., 1962, 1963; Miller and Finkel, 1965; Harrison et al., 1967; ICRP, 1973; Parks et al., 9972 1978; Harrison, 1981; Schlenker et al., 1982; Parks and Keane, 1983; Keane and Schlenker, 9973 1987). These data can be supplemented with extensive biokinetic data for radium in beagles 9974 (Wood et al., 1970; Lloyd et al., 1976a,b, 1982, 1983a,b,c,d; Parks et al., 1978) and with 9975 human and beagle data for barium, a chemical and physiological analogue of radium. In 9976 extrapolation of data from beagles to man, consideration must be given to the relatively low 9977 rate of faecal excretion of heavy alkaline earths in beagles (Van Dilla et al. ,1958; Della Rosa 9978 et al., 1967; Cuddihy and Griffith, 1972) compared with human subjects (Harrison et al., 9979 1967; Newton et al., 1991). 9980
(754) Kinetic analysis of plasma disappearance curves for normal subjects intravenously 9981 injected with radioisotopes of calcium, strontium, barium, or radium indicates that these 9982 elements initially leave plasma at a rate of several hundred plasma volumes per day and 9983 equilibrate rapidly with an extravascular pool roughly three times the size of the plasma pool. 9984 Total transfer rates from plasma of 70 d-1 yield reasonable fits to plasma disappearance curves 9985 for radium and barium at times greater than 1-2 h after injection (Leggett, 1992). The rapid 9986 early removal from plasma is not depicted in this model. 9987
(755) Soft tissues apparently contain a substantial portion of systemic radium for a period 9988 of days or weeks after its uptake to blood (Hursh and Lovaas, 1963; Atherton et al., 1965; 9989 Harrison et al., 1967; Hardy et al., 1969; Schlenker et al., 1982; Qiyue et al., 1988). Based on 9990 a review of data on 226Ra in human soft tissues, Schlenker et al. (1982) estimated that soft-9991 tissue retention rises to about 58% of whole body retention at 18 d after single intake and then 9992 falls steadily to 33% at 100 d and 6% at 1000 d. These estimates relied on assumptions and 9993 features of the ICRP’s alkaline earth model introduced in the 1970s (ICRP, 1973). A model-9994 free fitting procedure would yield somewhat lower estimates at early times. Harrison et al. 9995 (1967) inferred from measurements on a human subject receiving 223Ra by intravenous 9996

DRAFT FOR MC REVIEW PRIOR TO CONSULTATION
252
injection that extracellular fluids of soft tissues of man contain about one-fourth of 9997 administered radium at 24 h. In adult beagles, soft tissues contained about 62% of the total-9998 body burden of intravenously injected 224Ra at 1 h, 29% at 1 d, and 12% at 7 d (Lloyd et al., 9999 1982). The liver and kidneys contained on average about one-third of the total 226Ra in soft 10000 tissues from 7-1190 d after its intravenous administration to adult beagles (Atherton et al., 10001 1965). 10002
(756) Autopsy measurements of environmental 226Ra in adult humans indicate that soft 10003 tissues contain 10-30% of total-body 226Ra (Hursh and Lovaas, 1963; Rajewsky et al., 1965; 10004 Maletskos et al., 1969; ICRP, 1973; Qiyue et al., 1988). These estimates have been based on 10005 means or pooled samples for several subjects, which may give misleading results since 10006 measured 226Ra concentrations are likely to be asymmetically distributed in the population. 10007 Using median values of 226Ra to Ca ratios obtained from the literature, Schlenker et al. (1982) 10008 estimated that soft tissues contain 5.5-6% of the natural Ra-226 in the total body. 10009
(757) In the present model, fractional deposition of radium in the fast-turnover soft-tissue 10010 compartment ST0 is determined as the balance after other deposition fractions have been 10011 assigned. As discussed below, deposition fractions of 0.25 for bone, 0.05 for intermediate-10012 term soft tissues (ST1), 0.001 for long-term soft tissues (ST2), 0.06 for liver, 0.02 for 10013 kidneys, and 0.32 for excretion pathways are assigned to radium, leaving 0.299 for ST0. The 10014 derived transfer rate from plasma to ST0 is 0.299 × 70 d-1 = 20.93 d-1. Based on the assumed 10015 relative amounts of radium in ST0 and plasma, the transfer rate from ST0 to plasma is set at 10016 one-third the transfer rate from plasma to ST0, or 6.98 d-1. 10017
(758) The biokinetics of radium in the liver is modeled on the basis of observations of the 10018 behavior of 224Ra and 226Ra in adult beagle dogs (Glad et al., 1960; Atherton et al., 1965; 10019 Lloyd et al., 1982). The liver consists of compartments Liver 1 and Liver 2 with fast and slow 10020 turnover, respectively. Radium transfers from plasma to Liver 1 and is removed from Liver 1 10021 with a half-time of 1 d, with 99.7% returning to plasma and 0.3% moving to Liver 2. Radium 10022 transfers from Liver 2 to plasma with a half-time of 1 y. 10023
(759) The biokinetics of radium in the kidneys is also based on data for adult beagle dogs 10024 (Glad et al., 1960; Atherton et al., 1965; Lloyd et al., 1982). The kidneys are divided into 10025 compartments Kidneys 1 and Kidneys 2 with fast and slow turnover, respectively. Radium 10026 transfers from plasma to Kidneys 1 and is removed from Kidneys 1 with a half-time of 8 h, 10027 with 99.7% returning to plasma and 0.3% moving to Kidneys 2. Radium transfers from 10028 Kidneys 2 to plasma with a half-time of 1 y. 10029
(760) The removal half-time from the long-term soft-tissue compartment ST2 to plasma is 10030 assumed to be 5 y, the same as applied in the models for calcium, strontium, and barium. 10031 Fractional deposition of radium in ST2 is set to yield reasonable agreement with autopsy data 10032 for persons exposed over a short period to relatively high levels of 226Ra and persons exposed 10033 over their lifetimes only to natural levels of 226Ra (Schlenker et al., 1982). It is assumed that 10034 0.1% of radium leaving plasma enters ST2. The derived transfer rate from plasma to ST2 is 10035 0.001 × 70 d-1 = 0.07 d-1 and from ST2 to plasma is ln(2)/5 y = 0.00038 d-1. 10036
(761) Data from human and animal studies indicate that the rate of loss of alkaline earth 10037 elements from bone over the first few months after injection increases in the order calcium < 10038 strontium < barium < radium, and fractional long-term retention increases in the reverse 10039 order. Some element-specific parameter values are required to account for these differences, 10040 but most of the parameter values describing bone kinetics are generic, that is, the same for 10041 each of these alkaline earth elements. The basis for applying generic values is discussed in 10042 earlier sections on calcium and strontium. Essentially, kinetic analysis of whole-body 10043 retention data for humans and more direct examination of alkaline earth kinetics in laboratory 10044
DRAFT FOR MC REVIEW PRIOR TO CONSULTATION
253
animals do not reveal distinct differences between these elements with regard to the 10045 following: early accumulation in bone as a fraction of activity reaching blood; initial division 10046 between trabecular and cortical bone; early rate of loss from bone, interpreted for purposes of 10047 the present model as transfer from bone surfaces to plasma; the fraction subject to 10048 intermediate-term retention in bone, interpreted as transfer from bone surfaces to 10049 exchangeable bone volume; and the rate of removal from bone at times remote from uptake, 10050 interpreted as removal of non-exchangeable activity due to bone resorption. The following 10051 generic parameter values are applied (see the earlier sections on calcium and strontium): 10052 fractional deposition in bone = 0.25; fractional deposition in trabecular bone = 1.25 times that 10053 on cortical bone; half-time on bone surface = 1 d, with 5/6 transferring to plasma and 1/6 to 10054 exchangeable bone volume; removal rate from non-exchangeable trabecular and cortical bone 10055 volume = 18% and 3% y-1, respectively. The transfer rates for radium derived from these 10056 generic parameter values are as follows: plasma to trabecular bone surface = (1.25/2.25) × 10057 0.25 × 70 d-1 = 9.72 d-1; plasma to cortical bone surface = (1/2.25) × 0.25 × 70 d-1 = 7.78 d-1; 10058 trabecular or cortical bone surface to the corresponding exchangeable bone volume 10059 compartment = (1/6) × ln(2)/1 d = 0.116 d-1, trabecular or cortical bone surface to plasma is 10060 (5/6) × ln(2)/1 d = 0.578 d-1; trabecular bone volume to plasma, 0.000493 d-1; and non-10061 exchangeable cortical bone volume to plasma, 0.0000821 d-1. 10062
(762) Observed differences in the behavior of alkaline earth elements in bone are 10063 accounted for by differences in the rate of removal from the exchangeable bone volume 10064 compartments and the fraction transferred from exchangeable to non-exchangeable bone 10065 volume. It is assumed, in effect, that calcium, strontium, barium, and radium are all equally 10066 likely to become temporarily incorporated in bone mineral after injection into blood but that 10067 the likelihood of reaching a non-exchangeable site in bone crystal decreases in the order 10068 calcium > strontium > barium > radium. Fractional transfers of calcium, strontium, barium, 10069 and radium from exchangeable to non-exchangeable bone volume are set at 0.6, 0.5, 0.3, and 10070 0.2, respectively, and the balance is assumed to return to bone surfaces. The removal half-10071 times from exchangeable bone volume are set at 100 d, 80 d, 50 d, and 30 d, respectively. 10072 These values are set to achieve reasonable consistency with whole-body retention curves for 10073 humans injected with radioisotopes of the alkaline earth elements (e.g. Harrison et al., 1967; 10074 Newton et al., 1977; Harrison, 1981; Newton et al., 1991). The assumed fractional transfers 10075 to non-exchangeable bone volume are also reasonably consistent with results of in vitro 10076 measurements. For example, under conditions approximating physiological, Neuman (1964) 10077 found that calcium incorporated into forming hydroxyapatite crystals is 65% non-10078 exchangeable, and Stark (1968) determined discrimination factors relative to calcium of 0.93 10079 for strontium, 0.56 for barium, and 0.32 for radium in forming crystals. Such in vitro results 10080 have varied to some extent with experimental conditions, length of aging of the crystals, and 10081 the definition of discrimination (Neuman, 1964; Stark, 1968). 10082
(763) For radium, the above estimates of the removal half-time from exchangeable bone 10083 volume and the fractional transfers to non-exchangeable bone volume and bone surface yield 10084 the following transfer rates: exchangeable to non-exchangeable bone volume (cortical or 10085 trabecular), 0.2 × ln(2)/30 d = 0.0046 d-1; exchangeable bone volume to bone surface, 0.8 × 10086 ln(2)/30 d = 0.0185 d-1. 10087
(764) Based on estimates from human studies (Looney et al., 1956; Schales, 1964; 10088 Harrison et al., 1967; Maletskos et al.. 1969, Newton et al., 1991), it is estimated that 32% of 10089 radium leaving plasma is deposited in excretion pathways and that the ratio of urinary to 10090 faecal excretion is 1:36. The derived transfer rate from plasma to the urinary bladder contents 10091

DRAFT FOR MC REVIEW PRIOR TO CONSULTATION
254
is 0.606 d-1 and from plasma to the contents of the right colon is 21.8 d-1. 10092 (765) The transfer coefficients of the model for systemic radium in the worker are 10093
summarized in Table 13-3. 10094 10095 13.2.3.3. Treatment of radioactive progeny 10096 10097 Dosimetrically significant progeny of radium 10098
(766) The radioactive progeny of radium isotopes addressed in this report are isotopes of 10099 radon, polonium, lead, bismuth, thallium, actinium, thorium, radium, francium, or astatine. 10100 10101 Radon 10102
(767) A generic model is applied in this series of reports to radon, xenon, and krypton 10103 produced in systemic compartments by decay of a parent radionuclide. These gases are 10104 assigned the model for transfer of radon from bone to blood introduced in ICRP Publication 10105 67 (1993) but are assigned element-specific rates of transfer from soft tissues to blood. 10106 Specifically, radon, xenon, or krypton produced in non-exchangeable bone volume, 10107 exchangeable bone volume, or bone surface transfers to blood at the rate 0.36 d-1, 1.5 d-1, or 10108 100 d-1, respectively. Radon produced in a soft-tissue compartment transfers to blood with a 10109 half-time of 30 min, compared with a half-time of 20 min for xenon and 15 min for krypton. 10110 Radon, xenon, or krypton produced in blood or entering blood after its production in a 10111 systemic compartment is removed from the body (exhaled) at the rate 1000 d-1, corresponding 10112 to a half-time of 1 min. 10113 10114 10115

DRAFT FOR MC REVIEW PRIOR TO CONSULTATION
255
10116 Table 13-3. Transfer coefficients for radium
From To
Transfer coefficient (d-1)
Blood Urinary bladder content 0.606 Blood Right colon content 21.79 Blood Trabecular bone surface 9.72 Blood Cortical bone surface 7.78 Blood ST0 20.93 Blood ST1 3.5 Blood ST2 0.07 Blood Liver 1 4.2 Blood Kidneys 1 1.4 Trabecular bone surface Blood 0.578 Trabecular bone surface Exch trabecular bone volume 0.116 Cortical bone surface Blood 0.578 Cortical bone surface Exch cortical bone volume 0.116 ST0 Blood 6.98 ST1 Blood 0.693 ST2 Blood 0.00038 Liver 1 Blood 0.691 Liver 1 Liver 2 0.00208 Liver 2 Blood 0.0019 Kidneys 1 Blood 2.073 Kidneys 1 Kidneys 2 0.00624 Kidneys 2 Blood 0.0019 Exch trabecular bone volume Trabecular bone surface 0.0185 Exch trabecular bone volume Nonexch trabecular bone volume 0.0046 Exch cortical bone volume Cortical bone surface 0.0185 Exch cortical bone volume Nonexch cortical bone volume 0.0046 Nonexch cortical bone volume Blood 0.0000821 Nonexch trabecular bone volume Blood 0.000493
10117 Polonium 10118
(768) The model for polonium produced in systemic compartments following intake of a 10119 radium isotope is a simplified version of the model applied in this report to polonium 10120 absorbed to blood following its inhalation as a parent radionuclide. It is assumed that 10121 polonium leaves the central blood compartment of the model (Plasma) at the rate 100 d-1 and 10122 distributes as follows: 5% to red blood cells (RBC), 3% to plasma proteins (Plasma P), 28% 10123 to Liver, 28% to Kidneys, 1.2% to Bone surface, 3.3% to Trabecular marrow, 1.1% to 10124 Cortical marrow, 1.6% to Spleen, 0.1% to Testes, 0.05% to Ovaries, 4% to a soft-tissue 10125 compartment with a relatively long retention time (ST2), and the remaining 24.65% to a soft-10126 tissue compartment with a relatively short retention time (ST1). Activity entering Liver is 10127 equally divided between compartments Liver 1 and Liver 2. Of the 28% of outflow from 10128 Plasma depositing in Kidneys, 24% is assigned to the urinary path (Kidneys 1) and 4% is 10129 assigned to other kidney tissue (Kidneys 2). Activity entering Bone surface is equally divided 10130 between Cortical bone surface and Trabecular bone surface. Activity transfers to Plasma 10131 from each of the compartments RBC, Plasma P, ST1, Liver 2, Trabecular marrow, Cortical 10132

DRAFT FOR MC REVIEW PRIOR TO CONSULTATION
256
marrow, Spleen, and Kidneys 2 with a half-time of 7 d. Activity transfers from Liver 1 to 10133 Small intestine content with a half-time of 5 d, from Kidneys 1 to Urinary bladder content 10134 with a half-time of 4 d, from Trabecular and Cortical bone surface to Plasma with a half-time 10135 of 30 d, from ST2 to Plasma with a half-time of 100 d, and from Testes and Ovaries to 10136 Plasma with a half-time of 50 d. Polonium produced in a soft-tissue compartment of a 10137 preceding chain member that is not identifiable with a compartment in the polonium model is 10138 assumed to move to Plasma with a half-time of 7 d. Polonium produced in a compartment of 10139 cortical or trabecular bone volume is assumed to transfer to Plasma at the reference rate of 10140 turnover of that bone type. 10141 10142 Lead 10143
(769) The systemic model for lead as a progeny of radium is based on the characteristic 10144 model for lead applied in this series of reports. The structure of the characteristic model is 10145 modified by the addition of five compartments that are explicitly identified in models for 10146 some elements appearing in radium chains: Trabecular marrow, Cortical marrow, Spleen, 10147 Testes, and Ovaries. Each of these compartments is assumed to exchange lead with the 10148 central blood compartment of the lead model (Plasma). Transfer coefficients are selected for 10149 reasonable consistency with the biokinetic database underlying the characteristic model for 10150 lead and with the retention curve for total soft tissues based on that original model. The 10151 specific changes to the characteristic model for lead are as follows: (1) the transfer 10152 coefficients from Plasma to compartments added to the characteristic model for lead are 10153 0.015 d-1 for Trabecular marrow, 0.005 d-1 for Cortical marrow, 0.002 d-1 for Spleen, 0.00045 10154 d-1 for Testes, and 0.00015 d-1 for Ovaries; (2) the transfer coefficient from Plasma to ST1 is 10155 reduced from 0.70 d-1 to 0.681 d-1, and the coefficient from Plasma to ST2 is reduced from 10156 0.14 d-1 to 0.136 d-1; and (3) the assigned transfer coefficient from each of the added 10157 compartments back to Plasma is 0.002 d-1. Lead produced in a blood compartment of a 10158 preceding chain member that is not identifiable with a blood compartment of the lead model 10159 is assigned the transfer rate 1000 d-1 to Plasma. 10160 10161 Bismuth 10162
(770) The systemic model for bismuth as a progeny of radium is based on the characteristic 10163 model for bismuth applied in this series of reports. The structure of the characteristic model 10164 is modified by the addition of five compartments that are explicitly identified in models for 10165 some elements appearing in radium chains: Trabecular marrow, Cortical marrow, Spleen, 10166 Testes, and Ovaries. Each of these compartments is assumed to exchange lead with the 10167 central blood compartment of the bismuth model. Transfer coefficients for these added 10168 compartments are selected for reasonable consistency with the biokinetic database underlying 10169 the characteristic model for bismuth and with the retention curve for total soft tissues based 10170 on that original model. The specific changes to the characteristic model for bismuth are as 10171 follows: (1) the transfer coefficients from plasma to the added compartments are 0.3 d-1 for 10172 Trabecular marrow, 0.1 d-1 for Cortical marrow, 0.02 d-1 for Spleen, 0.003 d-1 for Testes, and 10173 0.001 d-1 for Ovaries; (2) the transfer coefficient from plasma to the Other soft-tissue 10174 compartment ST1 is reduced from 4.2 d-1 to 3.876 d-1, and the coefficient from plasma to the 10175 Other soft tissue compartment ST2 is reduced from 1.3 d-1 to 1.2 d-1; and (3) the assigned 10176 transfer coefficient from each of the added compartments back to plasma is 0.007 d-1 (half-10177 time of 100 d). Bismuth produced in a blood compartment that is not identifiable with a 10178 compartment of the bismuth model is assumed to transfer to the plasma compartment of the 10179 bismuth model at the rate 1000 d-1. Bismuth produced in a trabecular or cortical bone volume 10180

DRAFT FOR MC REVIEW PRIOR TO CONSULTATION
257
compartment is assumed to transfer to plasma at the reference turnover rate for that bone type. 10181 10182 Thallium 10183
(771) The section on lead contains a summary of biokinetic information on systemic 10184 thallium and a biokinetic model for thallium produced in systemic compartments following 10185 intake of a radioisotope of lead. The following modified version of that model is applied to 10186 thallium produced in systemic compartments following intake of a radioisotope of radium. 10187 Thallium leaves the central blood compartment (Plasma) at the rate 200 d-1 (corresponding to 10188 a half-time of 5 min) and is distributed as follows: 2.5% to RBC, 0.75% to Urinary bladder 10189 content, 1.75% to Right colon content, 5% to Kidneys, 5% to Liver, 1.5% to Trabecular 10190 marrow, 0.5% to Cortical marrow, 0.2% to Spleen, 0.045% to Testes, 0.015% to Ovaries, 10191 7.5% to Trabecular bone surface, 7.5% to Cortical bone surface, and 67.74% to ST0 10192 (remaining soft tissues). Thallium returns from RBC to Plasma at the rate 3.7 d-1 and from 10193 tissue compartments to Plasma at the rate 2.5 d-1. Thallium produced by radioactive decay in 10194 a blood compartment that is not identifiable with a compartment of the thallium model is 10195 assumed to transfer to Plasma at the rate 1000 d-1. Thallium produced in a soft-tissue 10196 compartment that is not identifiable with a compartment of the thallium model is assumed to 10197 transfer to Plasma at the rate 2.5 d-1. Thallium produced in a compartment of cortical or 10198 trabecular bone volume is assumed to transfer to Plasma at the reference turnover rate of that 10199 bone type. 10200 10201 Actinium 10202
(772) Studies on laboratory animals indicate that the systemic behavior of actinium is 10203 broadly similar to that of americium (USEPA, 1999; NCRP, 2009). The model for systemic 10204 americium adopted in ICRP Publication 67 (1993) is applied here to actinium as a progeny of 10205 radium. Actinium produced in a compartment of a preceding chain member that is not 10206 identifiable with a compartment in the actinium model is assumed to transfer to the central 10207 blood compartment of the actinium model at the following rate: 0.0019 d-1 (half-time of 1 y) 10208 if produced in the liver; and at the rate of bone turnover if produced in the exchangeable bone 10209 volume compartment of trabecular or cortical bone. 10210 10211 Thorium 10212
(773) The systemic model applied to thorium as a parent radionuclide in this series of 10213 reports is also applied to thorium produced in systemic compartments following intake of a 10214 radium isotope. Thorium produced in an exchangeable bone volume compartment in the 10215 model of a preceding chain member is assumed to transfer to the central blood compartment 10216 of the thorium model at the rate of bone turnover. 10217 10218 Radium 10219
(774) The model for radium as a parent radionuclide is also applied to radium produced by 10220 serial decay of members of a radium chain. Radium produced in a compartment of a 10221 preceding chain member that is not identifiable with a compartment in the radium model is 10222 assumed to transfer to the central blood compartment of the radium model at the following 10223 rates: 1000 d-1 if produced in a blood compartment and 0.693 d-1 (half-time of 1 d) if 10224 produced in a soft-tissue compartment. The value 0.693 d-1 is the transfer coefficient from the 10225 intermediate-term soft tissue compartment ST1 to blood in the characteristic model for 10226 radium. 10227 10228
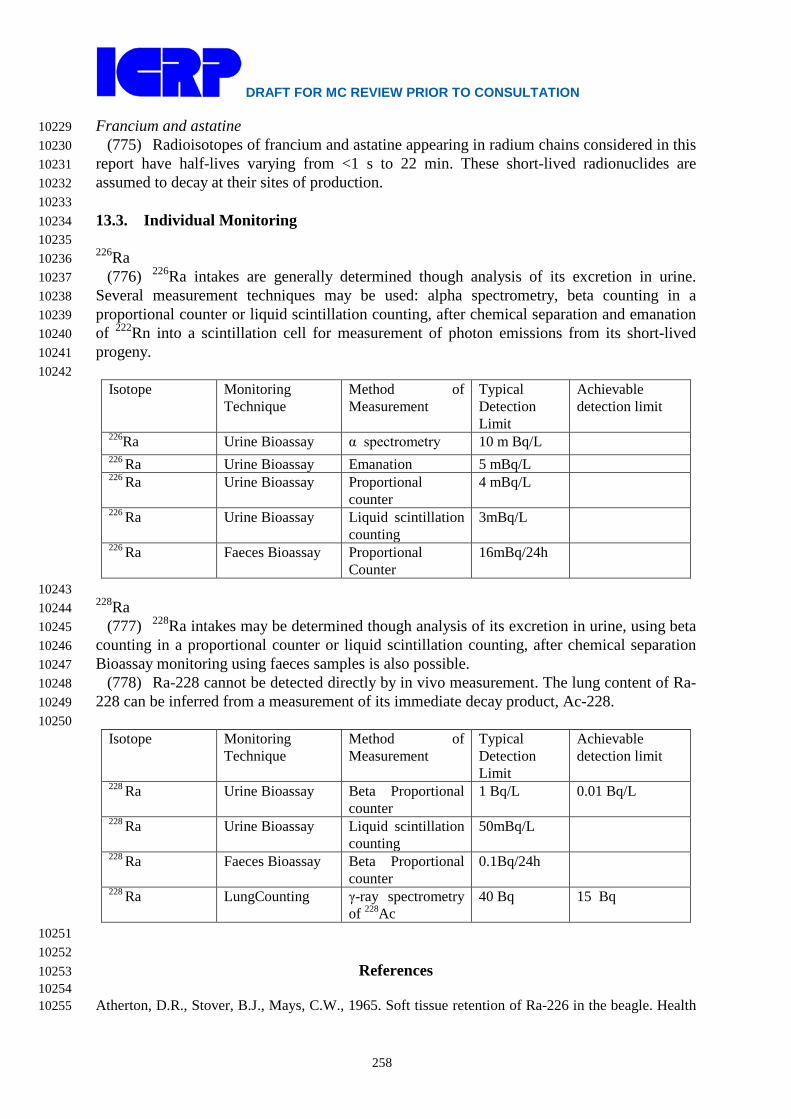
DRAFT FOR MC REVIEW PRIOR TO CONSULTATION
258
Francium and astatine 10229 (775) Radioisotopes of francium and astatine appearing in radium chains considered in this 10230
report have half-lives varying from <1 s to 22 min. These short-lived radionuclides are 10231 assumed to decay at their sites of production. 10232 10233 13.3. Individual Monitoring 10234 10235 226Ra 10236
(776) 226Ra intakes are generally determined though analysis of its excretion in urine. 10237 Several measurement techniques may be used: alpha spectrometry, beta counting in a 10238 proportional counter or liquid scintillation counting, after chemical separation and emanation 10239 of 222Rn into a scintillation cell for measurement of photon emissions from its short-lived 10240 progeny. 10241 10242
Isotope Monitoring Technique
Method of Measurement
Typical Detection Limit
Achievable detection limit
226Ra Urine Bioassay α spectrometry 10 m Bq/L 226 Ra Urine Bioassay Emanation 5 mBq/L 226 Ra Urine Bioassay Proportional
counter 4 mBq/L
226 Ra Urine Bioassay Liquid scintillation counting
3mBq/L
226 Ra Faeces Bioassay Proportional Counter
16mBq/24h
10243 228Ra 10244
(777) 228Ra intakes may be determined though analysis of its excretion in urine, using beta 10245 counting in a proportional counter or liquid scintillation counting, after chemical separation 10246 Bioassay monitoring using faeces samples is also possible. 10247
(778) Ra-228 cannot be detected directly by in vivo measurement. The lung content of Ra-10248 228 can be inferred from a measurement of its immediate decay product, Ac-228. 10249 10250
Isotope Monitoring Technique
Method of Measurement
Typical Detection Limit
Achievable detection limit
228 Ra Urine Bioassay Beta Proportional counter
1 Bq/L 0.01 Bq/L
228 Ra Urine Bioassay Liquid scintillation counting
50mBq/L
228 Ra Faeces Bioassay Beta Proportional counter
0.1Bq/24h
228 Ra LungCounting γ-ray spectrometry of 228Ac
40 Bq 15 Bq
10251 10252
References 10253 10254 Atherton, D.R., Stover, B.J., Mays, C.W., 1965. Soft tissue retention of Ra-226 in the beagle. Health 10255
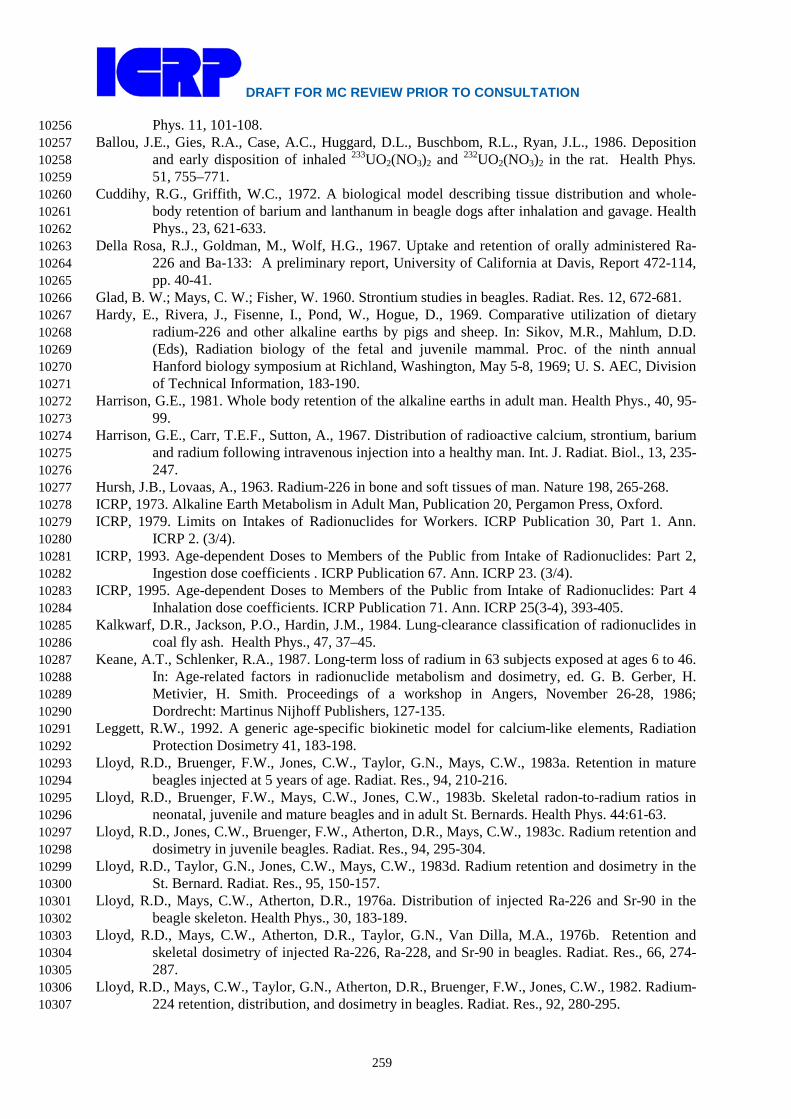
DRAFT FOR MC REVIEW PRIOR TO CONSULTATION
259
Phys. 11, 101-108. 10256 Ballou, J.E., Gies, R.A., Case, A.C., Huggard, D.L., Buschbom, R.L., Ryan, J.L., 1986. Deposition 10257
and early disposition of inhaled 233UO2(NO3)2 and 232UO2(NO3)2 in the rat. Health Phys. 10258 51, 755–771. 10259
Cuddihy, R.G., Griffith, W.C., 1972. A biological model describing tissue distribution and whole-10260 body retention of barium and lanthanum in beagle dogs after inhalation and gavage. Health 10261 Phys., 23, 621-633. 10262
Della Rosa, R.J., Goldman, M., Wolf, H.G., 1967. Uptake and retention of orally administered Ra-10263 226 and Ba-133: A preliminary report, University of California at Davis, Report 472-114, 10264 pp. 40-41. 10265
Glad, B. W.; Mays, C. W.; Fisher, W. 1960. Strontium studies in beagles. Radiat. Res. 12, 672-681. 10266 Hardy, E., Rivera, J., Fisenne, I., Pond, W., Hogue, D., 1969. Comparative utilization of dietary 10267
radium-226 and other alkaline earths by pigs and sheep. In: Sikov, M.R., Mahlum, D.D. 10268 (Eds), Radiation biology of the fetal and juvenile mammal. Proc. of the ninth annual 10269 Hanford biology symposium at Richland, Washington, May 5-8, 1969; U. S. AEC, Division 10270 of Technical Information, 183-190. 10271
Harrison, G.E., 1981. Whole body retention of the alkaline earths in adult man. Health Phys., 40, 95-10272 99. 10273
Harrison, G.E., Carr, T.E.F., Sutton, A., 1967. Distribution of radioactive calcium, strontium, barium 10274 and radium following intravenous injection into a healthy man. Int. J. Radiat. Biol., 13, 235-10275 247. 10276
Hursh, J.B., Lovaas, A., 1963. Radium-226 in bone and soft tissues of man. Nature 198, 265-268. 10277 ICRP, 1973. Alkaline Earth Metabolism in Adult Man, Publication 20, Pergamon Press, Oxford. 10278 ICRP, 1979. Limits on Intakes of Radionuclides for Workers. ICRP Publication 30, Part 1. Ann. 10279
ICRP 2. (3/4). 10280 ICRP, 1993. Age-dependent Doses to Members of the Public from Intake of Radionuclides: Part 2, 10281
Ingestion dose coefficients . ICRP Publication 67. Ann. ICRP 23. (3/4). 10282 ICRP, 1995. Age-dependent Doses to Members of the Public from Intake of Radionuclides: Part 4 10283
Inhalation dose coefficients. ICRP Publication 71. Ann. ICRP 25(3-4), 393-405. 10284 Kalkwarf, D.R., Jackson, P.O., Hardin, J.M., 1984. Lung-clearance classification of radionuclides in 10285
coal fly ash. Health Phys., 47, 37–45. 10286 Keane, A.T., Schlenker, R.A., 1987. Long-term loss of radium in 63 subjects exposed at ages 6 to 46. 10287
In: Age-related factors in radionuclide metabolism and dosimetry, ed. G. B. Gerber, H. 10288 Metivier, H. Smith. Proceedings of a workshop in Angers, November 26-28, 1986; 10289 Dordrecht: Martinus Nijhoff Publishers, 127-135. 10290
Leggett, R.W., 1992. A generic age-specific biokinetic model for calcium-like elements, Radiation 10291 Protection Dosimetry 41, 183-198. 10292
Lloyd, R.D., Bruenger, F.W., Jones, C.W., Taylor, G.N., Mays, C.W., 1983a. Retention in mature 10293 beagles injected at 5 years of age. Radiat. Res., 94, 210-216. 10294
Lloyd, R.D., Bruenger, F.W., Mays, C.W., Jones, C.W., 1983b. Skeletal radon-to-radium ratios in 10295 neonatal, juvenile and mature beagles and in adult St. Bernards. Health Phys. 44:61-63. 10296
Lloyd, R.D., Jones, C.W., Bruenger, F.W., Atherton, D.R., Mays, C.W., 1983c. Radium retention and 10297 dosimetry in juvenile beagles. Radiat. Res., 94, 295-304. 10298
Lloyd, R.D., Taylor, G.N., Jones, C.W., Mays, C.W., 1983d. Radium retention and dosimetry in the 10299 St. Bernard. Radiat. Res., 95, 150-157. 10300
Lloyd, R.D., Mays, C.W., Atherton, D.R., 1976a. Distribution of injected Ra-226 and Sr-90 in the 10301 beagle skeleton. Health Phys., 30, 183-189. 10302
Lloyd, R.D., Mays, C.W., Atherton, D.R., Taylor, G.N., Van Dilla, M.A., 1976b. Retention and 10303 skeletal dosimetry of injected Ra-226, Ra-228, and Sr-90 in beagles. Radiat. Res., 66, 274-10304 287. 10305
Lloyd, R.D., Mays, C.W., Taylor, G.N., Atherton, D.R., Bruenger, F.W., Jones, C.W., 1982. Radium-10306 224 retention, distribution, and dosimetry in beagles. Radiat. Res., 92, 280-295. 10307
DRAFT FOR MC REVIEW PRIOR TO CONSULTATION
260
Looney, W.B., Hursh, J.B., Archer, V.E., Steadman, L.T., Colodzin, M., 1956. A summary of radium 10308 and thorium excretion in humans. In: Proceedings of the international conference on the 10309 peaceful uses of atomic energy. Vol. 11. Biological effects of radiation. United Nations, pp. 10310 55-64. 10311
Looney, W.B., Archer, V.E., 1956. Radium inhalation accident - radium excretion study. Am. J. 10312 Roentgenol. Rad. Ther. Nucl. Med., 75, 548-558. 10313
Maletskos, C.J., Keane, A.T., Telles, N.C., Evans, R.D., 1969. Retention and absorption of Ra-224 10314 and Th-234 and some dosimetric considerations of Ra-224 in human beings. In: Delayed 10315 effects of bone-seeking radionuclides, ed. by C.W. Mays, W.S.S. Jee, R.D. Lloyd, B.J. 10316 Stover, J.H. Dougherty, G.N. Taylor, Salt Lake City, UT, University of Utah Press, 29-49. 10317
Maletskos, C.J., Keane, A.T., Trelles, N.C., Evans, R.D., 1966. The metabolism of intravenously 10318 administered radium and thorium in human beings and the relative absorption from the 10319 human gastrointestinal tract of radium and thorium in simulated radium dial paints. Annual 10320 Report MIT-952-3, Radioactivity Center, Inst Technology, Cambridge, MA. Pp.202-317. 10321
Marinelli, L.D., Norris, W.P., Gustafson, P.F., Speckman, T.W., 1953. Transport of radium sulfate 10322 from the lung and its elimination from the human body following single accidental 10323 exposures. Radiology 61, 903–915. 10324
Mays, C.W., Christensen, W.R., Lloyd, R.D., Atherton, D.R., Parmley, W.W., Pitchford, G.S., 1962. 10325 Radium studies in a man soon after injection. In: Research in radiobiology, COO-226, Univ. 10326 of Utah, 71-77. 10327
Mays, C.W., Lloyd, R.D., Christensen, W.R., Atherton, D.R., Pitchford, G.S., 1963. Radium 10328 metabolism in a man. Radiat. Res., 19, 210. 10329
Miller, C.E., Finkel, A.J., 1965. A re-examination of retention patterns in patients who received 10330 radium by multiple injections 33 years earlier. In: Health division gamma-ray spectroscopy 10331 group annual report, July 1964 through June 1965, Argonne National Laboratory, ANL-10332 7217; 5-90. 10333
Moody, J.C., Stradling, G.N., 1992. Biokinetics of thorium and daughter radionuclides after 10334 deposition in the rat lung. J. Aerosol Sci., 23, Suppl. 1, S523–S526. 10335
NCRP 2009. Management of persons contaminated with radionuclides. NCRP Report No. 161. 10336 National Council on Radiation Protection and Measurements: Bethesda, Maryland. 10337
Neuman, W.F., 1964. Blood-bone exchange. In: Bone biodynamics, ed. by H.M. Frost. Boston: Little, 10338 Brown, and Co, 393-408. 10339
Newton, D., Harrison, G.E., Kang, C., Warner, A.J., 1991. Metabolism of injected barium in six 10340 healthy men. Health Phys., 61, 191-201. 10341
Newton, D., Rundo, J., Harrison, G.E., 1977. The retention of alkaline earth elements in man, with 10342 special reference to barium. Health Phys., 33, 45-53. 10343
Norris, W.P., Speckman, T.W., Gustafson, P.F., 1955. Studies on the metabolism of radium in man. 10344 Am. J. Roentgenol., Radium Ther. Nucl. Med., 73, 785-802. 10345
Parks, N.J., Keane, A.T., 1983. Consideration of age-dependent radium retention in people on the 10346 basis of the beagle model. Health Phys., 44, 103-112. 10347
Parks, N.J., Pool, R.R., Williams, J.R., Wolf, H.G., 1978. Age and dosage-level dependence of 10348 radium retention in beagles. Radiat. Res., 75, 617-632. 10349
Qiyue, H., Zhonghon, Z., Shijun, L., 1988. Radium-226: Concentration and distribution in human 10350 bone. Chin. J. Radiol. Med. Prot. 8:224-225 (abstract). 10351
Rajewsky, B., Belloch-Zimmermann, V., Loehr, E., Stahlhofen, W., 1965. Ra-226 in human 10352 embryonic tissue, relationship of activity to the stage of pregnancy, measurement of natural 10353 Ra-226 occurrence in the human placenta. Health Phys., 11, 161-169. 10354
Schales, F., 1964. The excretion of thorium X and its daughter products after intravenous injection in 10355 man. In: Assessment of radioactivity in man, Vol. II, Vienna, IAEA, 267-276. 10356
Schlenker, R.A., Keane, A.T., Holtzman, R.B., 1982. The retention of Ra-226 in human soft tissue 10357 and bone; implications for the ICRP 20 alkaline earth model. Health Phys., 42, 671-693 10358 1982. 10359

DRAFT FOR MC REVIEW PRIOR TO CONSULTATION
261
Schlundt, H., Nerancy, J.T., Morris, J.P., 1933. The detection and estimation of radium in living 10360 persons. IV. The retention of soluble radium salts administered intravenously. Am. J. 10361 Roentgenol., Radium Ther., 30, 515-522. 10362
Seil, H, Viol, C, Gorden, M., 1915. The elimination of soluble radium salts taken intravenously and 10363 per os. Radium., 5, 40-44. 10364
Stark, G., 1968. Studies on synthetic hydroxyapatite crystals with regard to metabolism of calcium, 10365 strontium, barium and radium in bone. I. The discrimination against calcium. Biophysik, 5, 10366 42-54. 10367
Taylor, D.M., Bligh, P.H., Duggan, M.H., 1962. The absorption of calcium, strontium, barium, and 10368 radium from the gastrointestinal tract of the rat. Biochem. J., 83, 25-29. 10369
Toohey, R.E., Sha, J.Y., Urnezis, P.W., Hwang, E.Y., 1984. An unusual case of radium exposure. 10370 Argonne National Laboratory Environmental Research Division Annual Report July 1982 – 10371 June 1983, ANL–83–100 Part II, 15–20. 10372
USEPA 1999. Cancer risk coefficients for environmental exposure to radionuclides. Federal 10373 Guidance Report No. 13, EPA 402-R-99-001. Prepared by Eckerman, K. F.; Leggett, R. W.; 10374 Nelson, C. B.; Puskin, J. S.; Richardson, A. C. B. Office of Radiation and Indoor Air. US 10375 Environmental Protection Agency: Washington, D.C. 10376
Van Dilla, M.A., Stover, B.J., Floyd, R.L., Atherton, D.R., Taysum, D.H., 1958. Radium (Ra-226) 10377 and radon (Em-222) metabolism in dogs. Radiat. Res., 8, 417-437. 10378
Wood, S.K., Farnham, J.E., Marshall, J.H., 1970. Ca-45, Ba-133, and Ra-226 in 6-to 10-year-old 10379 beagle dogs: A 100-day study. In: Radiological Physics Division annual report, Center for 10380 Human Radiobiology, July 1969 through June 1970; Argonne, IL: Argonne National 10381 Laboratory; ANL-7760, Part II, Biology and Medicine, 110-132. 10382
10383

DRAFT FOR MC REVIEW PRIOR TO CONSULTATION
262
10384 14. Thorium (Z = 90) 10385
10386 14.1. Chemical Forms in the Workplace 10387 10388
(779) Thorium is an actinide element which occurs mainly in oxidation state IV. It is 10389 naturally abundant in the earth and the main ores are thorite, thorianite, and monazite, the 10390 latter occurring mainly as mineral sand. Thorium may be encountered in industry in a variety 10391 of chemical and physical forms, such as oxides (ThO2), hydroxides, nitrates, fluorides and 10392 sulphates. 10393
(780) Thorium-232 can be used as fuel in a nuclear reactor to absorb slow neutrons and to 10394 produce 233U, which is fissile. 10395 10396
Table 14-1. Isotopes of thorium addressed in this report 10397
a Data for these radionuclides are given in the printed copy of this report. Data for other 10398 radionuclides are given on accompanying electronic disk. 10399
10400 14.2. Routes of Intake 10401 10402 14.2.1. Inhalation 10403 10404 Absorption Types and parameter values 10405
(781) Information is available on the biokinetic behaviour of thorium after deposition of 10406 various chemical forms in the respiratory tract after accidental human exposure, and from 10407 experimental studies with animals, mainly rats. 10408
(782) Absorption parameter values and Types, and associated fA values for particulate 10409 forms of thorium are given in Table 14-2. In referring to default types it should be noted that 10410 the biokinetic behaviour of thorium is exceptional in that, following deposition of water-10411 soluble forms in the lungs, a minor fraction of the lung deposit is absorbed very rapidly, after 10412 which absorption is minimal. This indicates that there are no commonly encountered Type F 10413 forms of thorium. 10414 10415 Thorium chloride (ThCl4) 10416
(783) Boecker et al. (1963) conducted a series of experiments to determine the effect of the 10417 mass of thorium deposited in the lungs on its disposition, by following the biokinetics of 10418 234Th (half-life 24 days) for up to 90 days after inhalation of the chloride by rats. They 10419 observed that soon after exposure a fraction of the thorium deposited in the lungs was 10420
Isotope Physical half-life Decay mode Th-226 30.57 m A Th-227 18.68 d A Th-228a 1.912 y A Th-229a 7.34E+3 y A Th-230a 7.538E+4 y A Th-231 25.52 h B- Th-232a 1.405E+10 y A Th-233 22.3 m B- Th-234a 24.10 d B- Th-236 37.5 m B-

DRAFT FOR MC REVIEW PRIOR TO CONSULTATION
263
absorbed into the body, but after this the thorium organ contents remained approximately 10421 constant: the lung content decreased with time, with excretion of thorium predominantly in 10422 faeces. Similar behaviour has been observed following deposition of other water-soluble 10423 thorium compounds in the lungs: see below. It suggests that the fraction of thorium that is not 10424 absorbed rapidly is retained in the lungs in particulate form, rather than bound to respiratory 10425 tract tissues. They also found that the fraction of the thorium initial lung deposit (ILD) that 10426 was absorbed, and the fractions excreted in the urine and faeces, did not appear to be affected 10427 by variation in the mass of the ILD by a factor of 105. This was in contrast to mass-dependent 10428 biokinetics observed by Thomas et al. (1963) following injection by different routes, 10429 including intratracheal instillation. It was considered that this might be due to the relatively 10430 high local concentrations that occurred in the injection studies, compared to the more diffuse 10431 (in both space and time) distribution following inhalation. At the first measurement of 10432 distribution, made <1 hour after exposure, the “Remainder” tissue (taken by the authors to 10433 represent activity absorbed from the lungs), contained about 10% ILD, and showed little 10434 further change. This indicated that the absorption rate corresponds to a time constant of less 10435 than an hour, i.e. that sr was more than 20 d–1. However, it was not very much greater, 10436 because it appeared that clearance from the upper respiratory tract (URT) was mainly to the 10437 alimentary tract. At this time there were similar amounts of thorium in the URT and in the 10438 alimentary tract plus contents, indicating that the particle transport rate from the URT was 10439 about 20 d–1: this was assumed in all the assessments carried out here (i.e. by the Task Group) 10440 for thorium inhaled by rats. The lung content decreased from about 85% ILD at 6 d to 28% 10441 ILD at 84 d. Absorption parameter values of fr = 0.06, sr = 90 d–1 and ss = 0.002 d–1 were 10442 assessed here. Retention in lung and carcass were represented well, without the need to 10443 introduce the bound state. 10444
(784) Boecker (1963) followed the biokinetics of 234Th for 32 days after inhalation of the 10445 chloride by rats. At the first measurement of distribution, made <1 hour after exposure, the 10446 “Remainder” tissue contained ~7% ILD, which increased to ~15% at 2 days onwards. 10447 Absorption parameter values of fr = 0.13, sr = 20 d–1 and ss = 0.004 d–1 were assessed here. 10448 Boecker also found that thorium in rats exposed up to five times behaved similarly to thorium 10449 in rats exposed only once. 10450 10451 Water-soluble forms of thorium and Type F thorium 10452
(785) Based on the results of the experiments outlined above, and those with thorium 10453 citrate and nitrate below, specific dissolution parameter values of fr = 0.1, sr = 50 d–1 and ss = 10454 0.005 d–1 (consistent with assignment to default Type M) are used here for water-soluble 10455 forms of thorium, including chloride. It should be noted that with an initial uptake as high as 10456 ~10% ILD, it is difficult to estimate the low value of ss. This consideration also applies to the 10457 following compounds that are assigned to Type M. Since the estimated values of ss are close 10458 to the Type M default value of 0.005, it was used. The values of sr, with those estimated for 10459 chloride (below), are also used here to assign the specific value of sr for Type F thorium. 10460 Default Type F thorium (with dissolution parameter values: fr = 0.1, sr = 50 d–1) is 10461 nevertheless retained as an option. 10462 10463 Thorium citrate 10464
(786) Thomas et al. (1963) measured the tissue distribution of 234Th at times from 7 to 19 10465 days after intratracheal instillation into rats as the citrate, as a preliminary to inhalation 10466 experiments (see below for citrate, and above for chloride). There was no obvious change 10467 with time and mean values were reported. When administered at tracer level, ~3% ILD 10468

DRAFT FOR MC REVIEW PRIOR TO CONSULTATION
264
remained in the lungs and ~50% was absorbed (deposited in systemic organs). When 10469 administered with carrier, ~10% ILD remained in the lungs, and ~15% was absorbed, 10470 indicating Type F and Type M behaviour respectively. 10471
(787) Boecker (1963) followed the biokinetics of 234Th for 32 days after inhalation of the 10472 citrate by rats. The first measurement of distribution was made soon (<1 hour) after 10473 exposure. The “Remainder” tissue, taken by the author to represent activity absorbed from 10474 the lungs, already contained about 40% ILD, and showed little further change. This was more 10475 than found for the chloride in a similar experiment (~10% ILD, see above) but suggests that 10476 as for the chloride sr was more than 20 d–1, but not much greater. About 60% ILD remained in 10477 the lungs at 7 days, much more than after intratracheal instillation (see above) and it was 10478 suggested that the difference was an artefact of the instillation procedure. Absorption 10479 parameter values of fr = 0.14, sr = 70 d–1 and ss = 0.01 d–1 were assessed here, giving 10480 assignment to Type M. 10481
(788) Based on the results of the experiments outlined above, and those with thorium 10482 chloride (above) and nitrate (below), specific absorption parameter values of fr = 0.1, sr = 50 10483 d–1 and ss = 0.005 d–1 (consistent with assignment to default Type M) are used here for water-10484 soluble forms of thorium, including citrate. The values of sr, with those estimated for chloride 10485 (above), are also used here to assign the specific value for Type F thorium. 10486 10487 Thorium nitrate (Th(NO3)4) 10488
(789) Ballou et al. (1986) measured the tissue distributions of 232U and its decay products 10489 at 24 hours after their intratracheal instillation into rats as nitrates. (For further information 10490 see the uranium inhalation section, and the section below on decay products of thorium 10491 formed in the respiratory tract.) For 228Th, lung retention was 52% ILD, much higher than for 10492 the other radionuclides, with deposition in the skeleton at 12% ILD, broadly similar to the 10493 behaviour observed after instillation of thorium sulphate (see below). 10494
(790) Gray et al. (1991) measured the tissue distribution of 230+232Th at times between 7 10495 and 252 days after administration to rats by inhalation or intratracheal instillation of thorium 10496 nitrate with an ILD of about 5 µg thorium. Following inhalation, lung retention decreased 10497 from 73% ILD to 12.6% ILD between 7 and 252 days. It was estimated that about 10% was 10498 absorbed by 7 days, with little subsequent change. Thus the overall behaviour was similar to 10499 that observed for inhaled chloride and citrate (see above). With the first measurement at 7 10500 days, there is no information on which sr can be estimated. Stradling et al. (2004) derived 10501 two sets of parameter values from the data: assuming a “low” value for sr of 3 d–1, gave fr = 10502 0.07 and ss = 0.00035 d–1; assuming a “high” value for sr of 100 d–1, gave fr = 0.04 and ss = 10503 0.0005 d–1. Values of sr in the range 20–90 d–1 were obtained here from the results of 10504 inhalation experiments with chloride and citrate (see above). Taking a central value of 50 d–1, 10505 a good fit to the data was obtained here with fr = 0.04 and ss = 0.0008 d–1, giving assignment 10506 to Type M. Very similar values were obtained for the data following instillation (fr = 0.05 and 10507 ss = 0.0008 d–1). 10508
(791) Gray et al. (1991) also followed the biokinetics of thorium after intratracheal 10509 instillation into rats of thorium nitrate with ILDs of about 2 pg or 3 ng thorium, with the first 10510 measurement at 1 or 7 days and the last at 28 or 84 days. Assuming sr = 50 d–1, and ss = 10511 0.0008 d–1 (as in the longer-term studies) values of fr of about 0.3 were obtained here for both 10512 (giving assignment to Type M). Thus a larger fraction was absorbed rapidly when these lower 10513 masses were instilled, as observed by Thomas et al. (1963) for thorium citrate. 10514
(792) Moody et al. (1994a; Moody and Stradling, 1992) measured the tissue distributions 10515 of 228Th, 212Pb, 212Bi and 208Tl, at times from 6 hours to 7 days after intratracheal instillation 10516

DRAFT FOR MC REVIEW PRIOR TO CONSULTATION
265
into rats of a nitrate solution of 228Th in equilibrium with its decay products (ILD 17 ng Th). 10517 (For further information see the section below on decay products of thorium formed in the 10518 respiratory tract.) For thorium, about 20% ILD was absorbed by 6 hours, with little 10519 subsequent change, indicating that sr was more than 4 d–1. They also measured the tissue 10520 distribution of 228Th at times from 1 to 84 days after instillation of Th nitrate (ILD 32 ng). 10521 Assuming sr = 50 d–1, and ss = 0.0008 d–1 (as above) values of fr of 0.2 and 0.14 respectively 10522 were obtained here. 10523
(793) Stradling et al. (2005a) measured the tissue distribution of 228Th at times from 1 to 10524 84 days after intratracheal instillation into rats of a nitrate solution of 228Th. Absorption was 10525 somewhat greater for an ILD of 1.6 pg thorium than for an ILD of 0.17 µg thorium. Assuming 10526 sr = 50 d–1, and ss = 0.0008 d–1 (as above) values of fr of 0.35 and 0.25 were obtained here. 10527 The behaviour of thorium was not significantly affected by the presence of uranium when 10528 they were administered together (for further information, see section on decay products of 10529 uranium formed in the respiratory tract). 10530
(794) Thus similar overall behaviour was reported in these experiments, with absorption to 10531 blood largely complete by the time of the first measurement. The studies with citrate and 10532 chloride outlined above suggest that following inhalation there is little effect of mass on the 10533 biokinetics of thorium, but following instillation the rapidly absorbed fraction decreases with 10534 mass instilled. Similarly, for thorium nitrate administered by instillation, the fraction of ILD 10535 absorbed rapidly tends to decrease with increasing ILD. Values of fr estimated here varied 10536 from 0.05 to 0.35, (giving assignment to Type M) with the lowest value at the highest ILD. A 10537 value of fr = 0.04 was obtained from the results of the only inhalation experiment with 10538 thorium nitrate (Gray et al., 1991). Based on the results of the experiments outlined above, 10539 and those with thorium chloride and citrate, specific absorption parameter values of fr = 0.1, sr 10540 = 50 d–1 and ss = 0.005 d–1 (consistent with assignment to default Type M) are used here for 10541 water-soluble forms of thorium, including nitrate. 10542 10543 Thorium sulphate (Th(SO4)2) 10544
(795) Scott et al. (1952) measured the tissue distribution of 234Th at 4 days after 10545 intratracheal instillation into rats of thorium sulphate solution (with carrier). About 35% ILD 10546 remained in the lungs and 4% was deposited in systemic organs indicating somewhat less 10547 absorption than for instillation of thorium citrate (see above), but also indicating Type M 10548 behaviour. Since the thorium sulphate was administered in solution the specific parameter 10549 values adopted here for water-soluble forms of thorium (fr = 0.05, sr = 50 d–1, and ss = 0.001 10550 d–1) are also applied to thorium sulphate. 10551 10552 Thorium fluoride (ThF4) 10553
(796) Stradling et al. (2005b; Moody et al., 1994b) measured the tissue distributions of 10554 228Th, 212Pb, 212Bi and 208Tl, at times from 1 to 168 days after intratracheal instillation into 10555 rats of a suspension of 228Th or 228+232Th fluoride (ILD 60 pg or 6.5 µg thorium) in 10556 equilibrium with the decay products of 228Th. (For further information see the section below 10557 on decay products of thorium formed in the respiratory tract.) As for the water-soluble forms 10558 (see above) absorption of thorium to blood was largely complete by the time of the first 10559 measurement. However, the authors noted that although the tissue distribution of systemic 10560 thorium was independent of mass or chemical form administered, the fraction excreted 10561 rapidly in urine was much higher than observed for the nitrate, and suggested that this might 10562 reflect the transfer of ultrafine particles through the kidneys. Lung retention at 168 days was 10563 greater with the higher mass than with the lower mass administered (25% vs 8% ILD), 10564

DRAFT FOR MC REVIEW PRIOR TO CONSULTATION
266
presumably because particle transport was impaired. Estimated absorption in the first day 10565 was greater for an ILD of 60 pg (12% ILD) than for an ILD of 6.5 µg thorium (6% ILD). 10566 Assuming sr = 50 d–1, (as above, since most absorption took place within 1 d) values of fr of 10567 0.10 and 0.06, respectively and values of ss of 0.003 d–1 and 0.001 d–1 respectively were 10568 obtained here, giving assignment to Type M. The parameter values assessed are similar to 10569 those adopted here for water-soluble forms of thorium (fr = 0.1, sr = 50 d–1 and ss = 0.005 d–1) 10570 and therefore these specific absorption parameter values are also used here for thorium 10571 fluoride. 10572 10573 Thorium hydroxide (Th(OH)4) 10574
(797) Albert (1966), in a review of lung retention of thorium, referred to a study in which 10575 about 2% ILD of the thorium was absorbed from the lungs in 2 months after intratracheal 10576 instillation of Th(OH)4 into rats (Thomas R. G., The Metabolism of Thorium-230 (Ionium) 10577 Administered by Intratracheal Injection to the Rat. USAEC Report UR-40, University of 10578 Rochester, January 1957). 10579
(798) Stradling et al. (2005b; Moody et al., 1994b) measured the tissue distributions of 10580 228Th, 212Pb, 212Bi and 208Tl at times from 1 to 168 days after intratracheal instillation into rats 10581 of a suspension of 228Th or 228+232Th hydroxide (ILD 50 pg or 6.5 µg thorium) in equilibrium 10582 with the decay products of 228Th. (For further information see the section below on decay 10583 products of thorium formed in the respiratory tract.) Results were similar to those obtained 10584 for the fluoride. Absorption to blood was largely complete by the time of the first 10585 measurement. However, the authors noted that although the tissue distribution of systemic 10586 thorium was independent of mass or chemical form administered, the fraction excreted 10587 rapidly in urine was much higher than observed for the nitrate, and suggested that this might 10588 reflect the transfer of ultrafine particles through the kidneys. Lung retention at 168 days was 10589 greater with the higher mass than with the lower mass administered (17% vs 8% ILD), 10590 presumably because particle transport was impaired. Estimated absorption in the first day was 10591 somewhat greater for an ILD of 50 pg (8% ILD) than for an ILD of 6.5 µg thorium (6% ILD). 10592 Assuming sr = 50 d–1, (as above, since most absorption took place within 1 d) values of fr of 10593 0.07 and 0.06, respectively and values of ss of 0.002 d–1 and 0.001 d–1 respectively were 10594 obtained here, giving assignment to Type M. The parameter values assessed are similar to 10595 those adopted here for water-soluble forms of thorium (fr = 0.1, sr = 50 d–1 and ss = 0.005 d–1) 10596 and therefore these specific absorption parameter values are also used here for thorium 10597 hydroxide. 10598 10599 Thorium dioxide (ThO2) 10600
(799) Hodge and Thomas (1959) reported that high concentrations of thorium were found 10601 in the lungs and lymph nodes of dogs sacrificed 7 years after 2-year inhalation exposure to 10602 ThO2. Few details are given but the authors inferred that negligible amounts of thorium had 10603 cleared from the lungs in 7 years, indicating Type S behaviour. 10604
(800) Newton et al. (1981) followed the retention of 228Th for 7 years in a man who 10605 became internally contaminated, presumably through its inhalation in oxide form. The first 10606 measurements were made about 500 days after the presumed time of intake. The authors 10607 assessed that by this time only a small fraction of the 228Th in the body was in the lungs, 10608 suggesting Type M rather than Type S behaviour. 10609
(801) Ballou and Hursh (1972) followed retention of 228Th in the lungs of dogs for 150 10610 days after inhalation of ThO2, by in vivo measurements of exhaled thoron (220Rn) and 208Tl 10611 gamma emissions over the thorax, and post mortem measurements of 228Th in the lungs. At 10612
DRAFT FOR MC REVIEW PRIOR TO CONSULTATION
267
14 days, about 1% ILD was in the body outside the lungs, indicating that fr was ~0.01. The 10613 authors estimated lung retention half-times of 350–500 days, suggesting Type S behaviour. 10614 (See also the section below on decay products of thorium formed in the respiratory tract.) 10615
(802) Lamont et al. (2001) measured the dissolution rates in simulated lung fluid of freshly 10616 prepared and aged samples of ThO2 for 100 days. The fractions dissolved over 100 days were 10617 ~2x10⁻⁶ and 1x10⁻⁵ respectively. The higher value for the aged oxide was attributed to 10618 radiolytic damage and consequent increase in surface area. Most of the dissolution occurred 10619 in the first day or so, giving values of fr ~2x10⁻⁶ and 1x10⁻⁵, and values of ss less than ~10–7 10620 d–1 and 10–8 d–1 respectively. 10621
(803) Hodgson et al. (2000, 2003) measured the tissue distributions of 228Th, 212Pb, 212Bi 10622 and 208Tl, at times from 1 to 168 days after intratracheal instillation into rats of suspensions of 10623 232Th dioxide enriched with 228Th in equilibrium with its decay products, with two different 10624 particle sizes (geometric diameters about 0.4 and 2 µm). About 1% ILD was measured in the 10625 carcass at the first measurement (6 hours), with no further measurable increase, showing that 10626 sr was not less than about 10 d–1. The authors derived absorption parameter values of fr = 10627 0.02, sr = 10 d–1 and ss = 1x10⁻⁶ d–1, giving assignment to Type S. However, they considered 10628 that the value of fr should not be regarded as typical of ThO2. They referred to in vitro 10629 dissolution tests (Lamont et al., 2001, see above) which showed much lower values of fr. In 10630 view of this, specific parameter values are not adopted for thorium dioxide, which is assigned 10631 to Type S, but it should be recognised that absorption could be even lower than assumed for 10632 default Type S. 10633 10634 Thorium ore and refinery dusts 10635
(804) Measurements of thorium decay products in the chest and exhaled air of nearly 200 10636 former thorium refinery workers, made three or more years after the end of exposure to a 10637 range of compounds from monazite ore to thorium nitrate, indicate long-term retention and 10638 hence Type S behaviour for at least some of the material (Stehney et al., 1980; Rundo et al., 10639 1981). (See also the section below on decay products of thorium formed in the respiratory 10640 tract.) Analysis of autopsy tissues from five workers showed excess concentrations of 10641 thorium in lung and lymph nodes (Mausner 1982; Stehney and Lucas 2000). The authors 10642 noted that the large amounts of 232Th remaining in the lungs 6–30 years after the end of 10643 employment supported the long-term lung retention assumed in the original HRTM. 10644
(805) Maniyan et al. (2000) carried out repeated in vivo measurements of the decay product 10645 208Tl in the chest of four workers at a monazite processing plant. They had previous chronic 10646 inhalation exposure for 25 to 30 years mainly to thorium hydroxide and phosphate. 10647 Measurements, which extended over periods of ~500–1200 days, indicated a clearance half-10648 life for thorium in the chest of ~1000 days. However it was recognised that because of the 10649 long exposure there were contributions to the measurements from activity in lymph nodes and 10650 skeleton. 10651
(806) Jaiswal et al. (2004) reported that the ratios of daily urinary excretion to lung content 10652 of thorium in five workers exposed chronically (10–32 years) at a plant that processed 10653 thorium concentrate (hydroxide) to produce thorium nitrate and oxide, were consistent with 10654 the predictions of the HRTM and ICRP Publication 69 systemic Th model (ICRP 1994b; 10655 1995a) assuming Type S, but not Type M. 10656
(807) As part of a programme of measurements of the dissolution in simulated lung fluid 10657 of thorium and uranium in dusts to which workers were exposed (see below), Duport et al. 10658 (1991) observed negligible dissolution of 232Th in samples of Ni-ThO2 (2%Th: 98%Ni) alloy 10659 from a plant that produced heat and corrosion resistant alloys for aircraft industries. 10660

DRAFT FOR MC REVIEW PRIOR TO CONSULTATION
268
10661 Uranium ore dust 10662
(808) There is experimental evidence that thorium present in uranium ore dust is retained 10663 in the lungs longer than other constituents of the particle matrix (Stuart and Beasley 1967; 10664 Stuart and Jackson 1975). Similarly, Fisher et al. (1983) measured significantly higher 10665 activity levels of 234U and 238U than of the decay product 230Th in excreta samples obtained 10666 from active uranium millers, indicating that clearance of uranium in the inhaled ore dust was 10667 faster than that of thorium. In contrast, Wrenn et al. (1985) measured 230Th concentrations 10668 similar to those of 234U in the lungs of five uranium miners. In a later study (Singh et al., 10669 1987) the same group found 230Th to 234U concentrations ratios >1 in the lungs of three 10670 uranium miners and two uranium millers. They concluded that overall, dissolution in the 10671 human lungs of uranium and thorium in uranium ore dust was similar. For further 10672 information see the section on decay products of uranium formed in the respiratory tract. 10673
(809) Duport et al. (1991) measured the dissolution in simulated lung fluid of long lived 10674 radionuclides in uranium ore dust from Canadian mines. (For further information see the 10675 sections on decay products of uranium and thorium formed in the respiratory tract). For high 10676 grade ore, measurements were made for up to 60 days. Results were presented as undissolved 10677 fractions as functions of time, and showed two components, which were expressed as Class D 10678 (rapid) and Class Y (slow) fractions. For 238U and 230Th, the rapidly dissolved fractions were 10679 0.25 and 0.15 respectively, indicating assignment to Type M. (HRTM parameter values fitted 10680 to the 230Th data by Marsh et al., 2011, were: fr = 0.14, sr = 4.6 d–1 and ss = 0.0007 d–1). For 10681 both radionuclides, no effects of size were observed in total dissolution over 40 days for 10682 particles in size ranges 7–10, 3–7, 1–3 and <1 µm. For low grade and medium grade ores, 10683 measurements were made for 12 days, but only on samples of relatively coarse dust, the 10684 smallest fraction being <37 µm. For 238U, rapidly dissolved fractions were greater than those 10685 measured in the high grade ores: ~0.33 and 0.5 for low and medium grade ores respectively. 10686 Measurements were also made of 232Th in low grade ore, and a much lower fraction obtained, 10687 0.01, indicating assignment to Type S. 10688
(810) Reif (1994) measured the dissolution rates in simulated lung fluid of thorium 10689 residues from two different uranium mill tailings in the USA for 100 days. Dissolution 10690 parameter values calculated were ss = 6.4x10⁻⁴ d–1 for one compound, and fr = 0.3, sr = 0.23 d–10691 1 and ss = 4.1x10⁻³ d–1 for the second compound, indicating assignment to Type S and Type M 10692 respectively. 10693
(811) Bečková and Malátová (2008) measured dissolution for 26 days of 238U, 234U and 10694 230Th in simulated serum ultrafiltrate of uranium ore dust collected on personal air filters in a 10695 mine in the Czech Republic. The dust contained no measurable 232Th series radionuclides. 10696 Moderate dissolution of both uranium isotopes was observed, indicating assignment to Type 10697 M. (For further information see the uranium inhalation section.) In contrast no dissolution of 10698 230Th was detected, indicating assignment to Type S. 10699 10700 Other mine dusts 10701
(812) Chen et al. (1995) followed lung retention of thorium by measurements of exhaled 10702 thoron in a worker involved in crushing ore containing iron, rare earths and thorium 10703 (~0.04%). This worker’s lung content was the highest found in a survey of over 100 workers 10704 at the mine (Chen et al., 1988), and he suffered from pneumoconiosis. About 40% of the 10705 thorium remaining in the lungs when exposure stopped cleared within about a year, but there 10706 was very little further clearance during the following 5 years, indicating Type S behaviour of 10707 at least some of the dust. 10708
DRAFT FOR MC REVIEW PRIOR TO CONSULTATION
269
10709 Environmental thorium 10710
(813) Although mainly related to public, rather than worker exposure, information relating 10711 to environmental thorium is included here for completeness. 10712
(814) Measurements of environmental levels of thorium in autopsy tissues from members 10713 of the public showed that the fraction of thorium in the lungs (~25% of the estimated total 10714 body content) was considerably greater than that of plutonium (~5%), and suggested a long 10715 term lung retention half-time for thorium of between 1 and 8 y (Wrenn et al., 1981; Singh et 10716 al., 1983). The concentrations of thorium in the lymph nodes were 10-20 times those in the 10717 lungs in autopsy tissues from members of the public (Hamilton et al., 1972; Ibrahim et al., 10718 1983; Singh et al., 1983; Wrenn et al., 1985; Sunta et al., 1987). 10719
(815) Jaiswal et al. (2004) found good agreement between measured values of Th in lung, 10720 skeleton and liver in autopsy tissues from members of the public, and those predicted by the 10721 HRTM assuming Type S, and the ICRP Publication 69 systemic model for Th (ICRP 1994b; 10722 1995a). 10723
(816) These results indicate that environmental thorium is inhaled mainly in insoluble 10724 forms. 10725 10726 Decay products of thorium formed in the lungs 10727
(817) The general approach to treatment of decay products formed in the respiratory tract 10728 is described in Part 1, Section 3.2.3. In summary, it is expected that generally the rate at 10729 which a particle dissociates is determined by its matrix, and hence the physico-chemical form 10730 of the inhaled material. It is recognised that for decay products formed within particles by 10731 alpha emission, recoil of the daughter nucleus from the alpha emission expels some of the 10732 decay product from the particle. In the case of decay chains, this will result in successively 10733 lower activities of members compared to the parent retained in relatively insoluble particles. 10734 Experimental evidence relating to this is described below in the section on relatively insoluble 10735 forms of thorium. However, it was considered impractical to implement loss of decay 10736 products by alpha recoil in the calculation of dose coefficients and bioassay functions in this 10737 series of documents. (For further information see Part 1, Section 3.2.3.) Nevertheless, this 10738 phenomenon should be borne in mind, especially when using decay products to monitor 10739 intakes and doses of the parent. This is of particular importance in the case of thorium. 10740
(818) Exceptions are made for noble gases formed as decay products, which are assumed 10741 to escape from the body directly, in addition to other routes of removal. For calculation 10742 purposes it is assumed that radon formed as a decay product within the respiratory tract 10743 escapes from the body at a rate of 100 d–1, in addition to other routes of removal. For further 10744 information see the section below on relatively insoluble forms of thorium. 10745
(819) The decay schemes of thorium isotopes in the natural decay series: 227Th, 228Th, 10746 230Th, 231Th, 232Th and 234Th are shown in Part 1, Figures 3.9, 3.10, 3.11. The 232Th decay 10747 series is also shown here and the 238U and 235U decay series are shown in the uranium 10748 inhalation section. 10749 10750

DRAFT FOR MC REVIEW PRIOR TO CONSULTATION
270
Thorium-232
Radium-228
Thorium-228
Radium-224
Radon-220
Polonium-216
Actinium-228*
Lead-212*
Polonium-212
Thallium-208*
Bismuith-212*
Lead-208 (stable)
14 billion yearsα α 1.9 years
6.1 hoursβ
β5.8 years
3.7 days
50 seconds
0.15 seconds 310 nanoseconds
α
α
α
3.1 minutes
11 hours
β
β
αβ 61 minutes
(64%)
Notes:The symbols α and β indicate alpha and beta decay, and the times shown are half-lives.
An asterisk indicates that the isotope is also a significant gamma emitter.
61 minutes (36%)
α
10751 10752
Figure 14-1. Natural decay series: Thorium-232 10753 10754
(820) It is expected that the behaviour of soluble (e.g. Type F) material in the respiratory 10755 tract would depend on its elemental form, i.e. that of the decay product. Nevertheless, for 10756 simplicity, in this series of documents the absorption parameter values of the parent are, by 10757 default, applied to all members of the decay chain formed in the respiratory tract. 10758
(821) The behaviour of decay products of thorium can be of particular importance in this 10759 context, because there is generally significant long-term retention of thorium in the lungs 10760 following its deposition in water-soluble form (see above). Conversely, soluble forms of 10761 important decay products of thorium, notably radium and lead, are relatively readily absorbed 10762 from the respiratory tract into the systemic circulation. Studies specifically comparing the 10763 behaviour of thorium with that of its decay products are summarised below, although it 10764 should be noted that the decay products were administered with the thorium as well as being 10765 formed from decay of thorium (and its daughters) in the respiratory tract. For more 10766 information, see also the sections on radium, lead, polonium, bismuth and uranium, relating 10767 to the behaviour of their decay products formed in the respiratory tract. 10768
(822) As noted above, measurements have been made of the tissue distributions of 212Pb, 10769 212Bi and 208Tl, following administration to rats of 228Th in various chemical forms (nitrate, 10770 hydroxide, fluoride, dioxide), in equilibrium with its decay products. (Radon-220 is a 10771 precursor of 212Pb, but it is unlikely that a significant amount was lost from solution before 10772 deposition in the lungs, because of its short half life of 56 seconds. Its average half-distance 10773 of diffusion in water was estimated to be 50 µm by Ballou and Hursh, 1972.) The behaviour 10774 of 212Pb is compared with that of 228Th for each chemical form below. (For further 10775 information see the lead inhalation section.) In all these studies the distributions of 212Bi and 10776 208Tl were similar to each other and those of the parent 212Pb. Because their physical half-10777 lives are so short (61 minutes and 3 minutes respectively) measurements made at 6 hours 10778 onwards would be mainly of activity formed from decay of 212Pb within the body, rather than 10779
DRAFT FOR MC REVIEW PRIOR TO CONSULTATION
271
from intake of 212Bi or 208Tl. The similar distributions of 212Bi and 208Tl to those of 212Pb 10780 might suggest that there was not rapid movement of 212Bi from the site (e.g. the lungs) in 10781 which it was formed by decay of 212Pb. However, 212Bi (and 208Tl) would have grown in 10782 rapidly between dissection of the animals and measurements of activities in tissues. Thus the 10783 activities of 212Bi (and 208Tl) present in vivo, may have been significantly lower than those 10784 measured and without detailed information (which is not available) about the time which 10785 elapsed between dissection of the animals and measurements, it is not possible to correct for 10786 this ingrowth and hence estimate the absorption rate from the respiratory tract of the bismuth 10787 formed as a decay product of lead, nor that of the thallium formed as a decay product of 10788 bismuth. However, since the half-life of 208Tl is so short (as is that of 207Tl present in the 235U 10789 decay series, 5 minutes), the absorption rate would have to be very high to influence dose 10790 assessments. 10791 10792 Relatively soluble (Type M) forms 10793
(823) Ballou et al. (1986) measured the tissue distributions of 232U, 228Th, 224Ra, 212Pb, 10794 212Bi and 208Tl at 24 hours after intratracheal instillation into rats of 232U nitrate with its decay 10795 products. (For further information see the uranium inhalation section.) Measurements of 10796 228Th, 224Ra, and perhaps 212Pb, were mainly of material administered with the parent 232U, 10797 rather than formed from its decay in the lungs. The physical half-lives of 212Bi and 208Tl are so 10798 short, 61 minutes and 3 minutes respectively, that measurements made at 24 hours would 10799 mainly be of activity formed in situ. Lung retention was 7.9% ILD for 232U, 52% ILD for 10800 228Th, and about 2-3% ILD for the other decay products measured, reflecting the high lung 10801 retention of thorium, and relatively rapid lung clearance of radium and lead observed in other 10802 studies in which soluble forms were administered. Similarly, the distribution between liver, 10803 skeleton and kidneys of 232U, 228Th, 224Ra and 212Pb reflected the elemental forms. The 10804 distributions of 212Bi and 208Tl were similar to those of 212Pb, presumably because of their 10805 short physical half-lives: whatever their distribution in vivo, they would tend to equilibrium 10806 between dissection and measurement. 10807
(824) Lipsztein et al. (1989) made in vivo measurements of 228Ac and 208Tl in the lungs of 10808 two workers involved in the chemical treatment of monazite sand. They considered that the 10809 exposures were to “Class W” (moderately soluble i.e. Type M) forms of thorium. The mean 10810 ratio of 228Ac to 208Tl was 1.5, suggesting that some members of the decay series cleared 10811 faster than the 228Ac, but the differences were not great. 10812
(825) Moody et al. (1994a; Moody and Stradling, 1992) measured the tissue distributions 10813 of 228Th, 212Pb, 212Bi and 208Tl, at times from 6 hours to 7 days after intratracheal instillation 10814 into rats of a solution of 228Th nitrate in equilibrium with its decay products. For 228Th, on 10815 average 48% ILD was measured in the lungs at 6 hours and 40% ILD at 1 day (see above). 10816 For 212Pb, clearance was much faster, with 8.4% ILD at 6 hours and 1.2% ILD at 1 day 10817 (correcting for the physical decay of 212Pb, 12.5% and 5.6% ILD respectively). Later 10818 measurements of 212Pb could have included significant ingrowth of 212Pb from decay of 10819 higher members of the chain in the lungs. Nevertheless the concentration of 212Pb remained 10820 much lower than that of the 228Th parent, (presented as a high 228Th:212Pb ratio). 10821
(826) Stradling et al. (2005b; Moody et al., 1994b) measured the tissue distributions of 10822 228Th, 212Pb, 212Bi and 208Tl, at times from 1 to 168 days after intratracheal instillation into 10823 rats of a suspension of 228Th or 228+232Th fluoride in equilibrium with the decay products of 10824 228Th. For thorium (see above), on average 65% ILD was measured in the lungs at 1 day 10825 when administered with a low mass (60 pg) of thorium, and 72% ILD when administered 10826 with a high mass (6.5 µg) of thorium. For 212Pb, the corresponding amounts were 6.0% and 10827
DRAFT FOR MC REVIEW PRIOR TO CONSULTATION
272
18% ILD. Correcting for the physical decay of 212Pb gives retention of 28% and 84% ILD at 1 10828 day. Thus, at the low mass, clearance was much faster than that of the parent 228Th, but not at 10829 the high mass. From the results for low mass it was assessed here that sr was at least 1 d–1 10830 (half-time ~8 hours). Later measurements of 212Pb could have included significant ingrowth 10831 of 212Pb from decay of higher members of the chain in the lungs. Nevertheless, as for the 10832 nitrate, the concentration of 212Pb remained lower than that of the 228Th parent, (presented as 10833 a high 228Th:212Pb ratio). 10834
(827) Stradling et al. (2005b; Moody et al., 1994b) measured the tissue distributions of 10835 228Th, 212Pb, 212Bi and 208Tl, at times from 1 to 168 days after intratracheal instillation into 10836 rats of a suspension of 228Th or 228+232Th hydroxide in equilibrium with the decay products of 10837 228Th. For thorium (see above), on average 59% ILD was measured in the lungs at 1 day 10838 when administered with a low mass (60 pg) of thorium, and 75% ILD when administered 10839 with a high mass (6.5 µg) of thorium. For 212Pb, the corresponding amounts were 2.7% and 10840 5.3% ILD. Correcting for the physical decay of 212Pb gives retention of 13% and 25% ILD at 10841 1 day. At both mass levels clearance of 212Pb was much faster than that of the parent 228Th. 10842 Later measurements of 212Pb could have included significant ingrowth of 212Pb from decay of 10843 higher members of the chain in the lungs. 10844
(828) In the studies by Moody et al. (1994a; 1994b), Moody and Stradling, (1992) and 10845 Stradling et al. (2005b) the concentration of 212Pb remained much lower than that of the 228Th 10846 parent, despite ingrowth (presented as a high 228Th:212Pb ratio). This might be partly due to 10847 loss of intermediate decay products by alpha recoil and diffusion of radon, but partly also due 10848 to more rapid dissolution (leaching) of the decay products, including 212Pb, from the particle 10849 matrix. Stradling et al. (2004) proposed that since the decay products (radium and lead) are 10850 rapidly absorbed, as expected for radium and lead nitrates, they should be assigned to Type F. 10851
(829) For the other moderately soluble forms the situation is less clear: retention of lead is 10852 less than that of thorium, but greater than that of lead nitrate. The decay products are 10853 therefore also assigned to Type M. 10854 10855 Relatively insoluble (Type S) forms 10856
(830) As noted above (section on Uranium ore dust), Duport et al. (1991) measured the 10857 dissolution in simulated lung fluid of long lived radionuclides in uranium ore. For high grade 10858 ore, measurements were made for up to 60 days, on particles in size ranges that included 10859 respirable particles. Results were presented as undissolved fractions as functions of time, and 10860 showed two components, which were expressed as Class D (rapid) and Class Y (slow) 10861 fractions. For 238U, 230Th, 226Ra, and 210Pb, the rapidly dissolved fractions were 0.25, 0.15, 10862 0.12 and 0.28 respectively. Marsh et al., 2011, fitted two-component exponential functions to 10863 the data (un-dissolved fractions) and obtained the following HRTM parameter values: 10864 10865
Nuclide fr sr (d–1) ss (d–1) 230Th 0.14 4.6 0.0007 226Ra 0.11 7.3 0.0004 210Pb 0.26 3.9 0.001
10866 (831) For these radionuclides, no effects of size were observed in total dissolution over 40 10867
days for particles in size ranges 7–10, 3–7, 1–3 and <1 µm. For low grade and medium grade 10868 ores, measurements were made for 12 days, but only on samples of relatively coarse dust, the 10869 smallest fraction being <37 µm. For 238U, rapidly dissolved fractions were higher (0.33 and 10870 0.5 for low and medium grade ores) than those measured in the high grade ores. However, for 10871

DRAFT FOR MC REVIEW PRIOR TO CONSULTATION
273
other radionuclides the fractions were lower: 0.07 for 226Ra, and <0.01 for 210Pb. 10872 Measurements were also made for 210Po in low and medium grade ores, and low fractions 10873 obtained, 0.00 and 0.005 respectively. Consistent differences in dissolution between uranium, 10874 thorium and their decay products were not apparent. 10875 10876 Emanation of radon: recoil and diffusion 10877
(832) Griffiths et al. (1980) developed a model to describe the retention of 232U and its 10878 decay products, which include 228Th, in the lungs following inhalation in ThO2 or UO2 10879 particles. In addition to chemical dissolution, they considered recoil emanation of daughter 10880 product nuclei by alpha-particle decay, and diffusion emanation of 220Rn from particles. They 10881 presented equations to calculate fractional losses by recoil and diffusion as functions of 10882 particle size (but only for spherical particles). They calculated recoil ranges of about 0.05 µm 10883 for the decay products, assuming a particle density of 10 g cm–3, and fractional losses by 10884 recoil emanation in the range 0.3 – 0.1, for aerosols with AMAD in the range 1 – 10 µm. The 10885 calculated loss of 220Rn from particles by diffusion emanation was difficult to predict, ranging 10886 from 0.03 to 0.7 depending on the assumed diffusion coefficient (10–15 - 10–11 cm2 s–1). 10887
(833) Coombs and Cuddihy (1983) measured the fraction of 228Th escaping by recoil and 10888 the fraction of 220Rn escaping by diffusion from size-fractionated samples of ThO2 and 10889 uranium oxide (mixture of UO2.2 and U3O8) containing 1% 232U. The fraction of 228Th 10890 escaping increased from ~0.07 for particles with AMAD 2.5 µm (count median diameter, 10891 CMD ~1 µm) to ~0.3 for particles with AMAD 0.65 µm (CMD ~0.1 µm). This was in 10892 reasonable agreement with the model of Griffiths et al. (1980). Calculated recoil range was 10893 expressed in terms of recoil range times density, with values of ~20 µg cm–2. The fraction of 10894 220Rn escaping by diffusion increased from ~0.07 for particles with AMAD 2.5 µm, to ~0.35 10895 for particles with AMAD 0.65 µm, and gave a diffusion coefficient of ~3x10–14 cm2 s–1. This 10896 was similar to the fraction of 228Th escaping by recoil, and therefore presumably similar to the 10897 fraction of 220Rn escaping by recoil, since the recoil ranges of 220Rn and 228Th are similar 10898 (Griffiths et al., 1980). 10899
(834) Johnson and Peterman (1984) developed a model to describe the emanation of 220Rn 10900 from ThO2 particles by alpha-particle recoil, and its exhalation from the lungs. They 10901 calculated that the fraction of 220Rn atoms produced that escaped from particles (density 10 g 10902 cm–3) by recoil decreased from ~1.0 at 1 nm to ~0.5 at 10 nm and ~0.1 at 0.5 µm diameter. 10903 The average fraction for an aerosol of AMAD 1 µm was calculated to be 0.2, which seems to 10904 be consistent with the results derived by Griffiths et al. (1980). 10905
(835) Ballou and Hursh (1972) measured thoron (220Rn) in the breath of dogs at times up 10906 to 150 days after inhalation of ThO2 (see above) and, for comparison, after intravenous 10907 injection of ThO2. (After intravenous injection, about 75% of the ThO2 was retained in the 10908 lung vasculature.) Lung retention of 228Th was also followed by in vivo measurements of 208Tl 10909 gamma emissions over the thorax, and post mortem measurements of 228Th in the lungs. At 10910 14 days, the activity of the 224Ra daughter was about 70% of that of the 228Th, suggesting 10911 some differential loss of 224Ra. The ratio of thoron in the lung space to 228Th in the whole 10912 body was lower (0.065) immediately after inhalation than after intravenous injection (0.11), 10913 but increased to about 0.1 by 14 days. By this time most of the 228Th was in the lungs, and 10914 the ratio of thoron in the lung space to 228Th in the lungs remained fairly constant thereafter. 10915 The lower initial value was attributed to the particles’ being embedded in mucus in the upper 10916 respiratory tract. 10917
(836) Measurements of thorium decay products in the chest (212Bi, and in some cases 10918 228Ac) and exhaled air (thoron, 220Rn) of nearly 200 former thorium refinery workers, were 10919

DRAFT FOR MC REVIEW PRIOR TO CONSULTATION
274
made three or more years after the end of exposure to a range of compounds from monazite 10920 ore to thorium nitrate (Stehney et al., 1980; Rundo et al., 1981; Toohey et al., 1985). 10921 Measurements of exhaled thoron were expressed as the activity of freely emanating 224Ra (the 10922 parent of 220Rn) at the mouth of the subject. They found an average value of 0.101 for the 10923 ratio of freely emanating 224Ra to retained 212Bi, from which they deduced an average 10924 exhalation of 9.2% of the thoron produced. Stebbings (1985) reported a positive correlation 10925 between this ratio and the thorium body content, which could lead to serious underestimation 10926 if it were applied to estimate the thorium body content from exhaled thoron at population 10927 exposure levels. 10928
(837) Rundo and Toohey (1986) reported that measurements of 212Bi in the thorax and of 10929 exhaled thoron made on an employee of a ceramics firm showed no change over a period of 7 10930 years. Mean values reported gave a value of 0.07 for the ratio of freely emanating 224Ra to 10931 retained 212Bi, similar to that reported by Rundo et al. (1981) for former thorium refinery 10932 workers. 10933
(838) Terry and Hewson (1993, 1995) measured thoron in the breath of 62 workers 10934 exposed to monazite dust in the mineral sands industry. For 6 of them, in vivo measurements 10935 were also made of 228Ac, 212Pb and 208Tl in the lungs. The authors estimated that on average 10936 4.7% of the thoron produced in the lungs was exhaled. They also reported that (excluding 10937 data for the two workers with the lowest lung burdens) the mean ratio of the 911 keV 228Ac 10938 peak to the 2,615 keV 208Tl peak was 1.42. They inferred that the 232Th decay series is not in 10939 secular equilibrium, but that up to 30% of the decay products formed from 228Ac to 208Tl had 10940 translocated from the lungs. 10941
(839) Hodgson et al. (2000, 2003) measured the tissue distributions of 228Th, 212Pb, 212Bi 10942 and 208Tl, at times from 1 to 168 days after intratracheal instillation into rats of suspensions of 10943 232Th dioxide enriched with 228Th in equilibrium with its decay products, with geometric 10944 diameters of about 0.4 and 2 µm. There was little absorption of the thorium itself, consistent 10945 with assignment to Type S (see thorium dioxide section above). The activity of 212Pb in the 10946 lungs was about 50% and 80% of that of the thorium at 1 day for the 0.4 and 2 µm particles 10947 respectively, and 25% and 70% at later times. The lower concentrations of 212Pb were 10948 attributed to diffusion of 220Rn (thoron) and recoil of the progeny from alpha particle decay, 10949 and the authors suggested that the concentration of 212Pb relative to that of 228Th would be 10950 even lower following deposition of ultrafine particles. These inferences are consistent with 10951 the conclusions of Coombs and Cuddihy, 1983 (see above), although some more rapid 10952 dissolution of lead (and/or its precursors) than of thorium cannot be completely excluded. 10953
(840) Thus, consideration of the recoil range of decay product nuclei formed by alpha 10954 emission and measurements of emanation of such decay products indicate that an important 10955 fraction is transferred from particles to the surrounding medium. Measurements of decay 10956 product ratios to thorium seem broadly consistent with this model. The fraction decreases 10957 with increasing particle size and density, but is of the order of 10% for aerosols likely to be 10958 encountered in the workplace. However, as noted above, it was considered impractical to 10959 implement loss of decay products by alpha recoil in the calculation of dose coefficients and 10960 bioassay functions in this series of documents. (For further information see Part 1, Section 10961 3.2.3.) Nevertheless, this phenomenon should be borne in mind, especially when using decay 10962 products to monitor intakes and doses of thorium. 10963
(841) For calculation purposes it is assumed that radon formed as a decay product within 10964 the respiratory tract escapes from the body at a rate of 100 d–1, in addition to other routes of 10965 removal (ICRP, 1995b). This rate was set as a convenient, arbitrary, rapid rate. The 10966 underlying assumption is that loss of radon is a continuous process such as diffusion. The 10967

DRAFT FOR MC REVIEW PRIOR TO CONSULTATION
275
three radon isotopes in the natural decay series: 222Rn (radon), 220Rn (thoron), and 219Rn 10968 (actinon) have half-lives of about 3.8 days, 56 seconds and 4 seconds, and therefore decay 10969 rates of about 0.18, 1100 and 15,000 d–1, respectively. Hence the assumption of a rate of loss 10970 of 100 d–1 implies that nearly all 222Rn escapes from the particles before it decays, about 10% 10971 of 220Rn escapes, and nearly all 219Rn decays within the particles. 10972
(842) The predicted transfer to lung air of ~10% of 220Rn formed is broadly consistent with 10973 observations that ~10% of the thoron produced in particles in the lungs is exhaled (see 10974 above). It was assessed here that most of the 220Rn entering lung air is exhaled3. However, the 10975 prediction that all of the 222Rn escapes from the particles is not supported by measurements of 10976 radon emanation coefficients (the fraction of radon atoms that escape from the particles in 10977 which they were formed) made on dust samples. Duport and Edwardson (1984) reported 10978 values between 0 and 0.5 for micron sized samples of uranium ore dust. Kalkwarf et al. 10979 (1985) measured radon emanation coefficients in the range 0.001 to 0.1 for coal fly ash 10980 particles in sized fractions from <0.5 µm to 11-15 µm. They recognized that since the 10981 particles in their experiments were closely packed, some recoiling radon would be injected 10982 into adjacent particles, and emanation would be somewhat greater in the lungs. Strong and 10983 Levins (1982) measured the effect of moisture content on emanation of radon from uranium 10984 mine tailings. The radon flux from a column of powder was higher when it was moist than 10985 when it was dry: this was attributed to recoiling radon atoms being stopped in the water 10986 between particles (from which it subsequently diffused) rather than becoming trapped in other 10987 particles. The discussion assumed that the main mechanism of radon loss from particles was 10988 recoil following decay of the parent 226Ra. Thus the assumption of a rate of transfer of radon 10989 from particles of 100 d–1 appears to be pragmatic: it is simply to apply and seems to predict 10990 exhalation of 220Rn (thoron) in broad agreement with observations, but probably 10991 overestimates loss of 222Rn from particles in the lungs. 10992 10993 Rapid dissolution rate for thorium 10994
(843) In the various studies of the biokinetics following deposition in the lungs of water 10995 soluble forms of thorium it was observed that only a fraction of the ILD, usually less than 10996 50%, was absorbed into blood, and that most of the absorption had taken place by the time of 10997 the first measurement of tissue distribution. The earliest measurements of distribution were 10998 made <1 hour after inhalation of thorium chloride or citrate by rats, which indicated that the 10999 absorption rate corresponds to a time constant of less than an hour, i.e. that sr was more than 11000 20 d–1. However, it was not very much greater, because it appeared that clearance from the 11001 upper respiratory tract was mainly to the alimentary tract. Values of fr estimated here from 11002 the results of three experiments were 20, 70 and 90 d–1. A central value of 50 d–1 is adopted 11003 here, and applied to all Type F forms of thorium. However, as noted in the introduction 11004 above, the results of studies of water-soluble forms of thorium (chloride, citrate, nitrate, 11005 sulphate) deposited in the lungs, indicate that there are no commonly encountered Type F 11006
3 According to Stehney et al. (1980) the average breathing rate during measurements of thoron in breath was 7.5 litres per minute. An adult male at rest takes about 12 breaths per minute (ICRP 1994c, page 194): hence the tidal volume was ~0.6 litres and each breath took ~5 seconds. The volume of air in the lungs at the start of a breath is ~3.9 litres (Functional Residual Capacity, 3.3 litres (ICRP 1994c, page 189) plus tidal volume 0.6 litres). Hence ~15% of the air in the lungs is exhaled, and it is assumed here that a similar proportion of the thoron is exhaled. During the 5 seconds of a breathing cycle, ~6% of the thoron present decays, and hence any thoron atom is ~2.5 times more likely to be exhaled than to decay during this breath, or any other. This is in broad agreement with Johnson and Peterman (1984), who calculated that the proportion of 220Rn atoms entering lung air that was exhaled increased from ~60% in airway generations >20 to ~80% in airway generations <16.
DRAFT FOR MC REVIEW PRIOR TO CONSULTATION
276
forms of thorium. 11007 11008 Extent of binding of thorium to the respiratory tract 11009
(844) As noted above, in the various studies of the biokinetics following deposition in the 11010 lungs of water soluble forms of thorium it was observed that only a fraction of the ILD, 11011 usually less than 50%, was absorbed into blood. Clearance from the lungs continued, with 11012 excretion mainly to faeces, indicating that the clearance was predominantly by particle 11013 transport, and that the thorium was retained in the lungs in particulate form, rather than in the 11014 bound state. Adequate fits to data were obtained here on that assumption. It is therefore 11015 assumed that for thorium the bound state can be neglected, i.e. fb = 0.0. 11016 11017
Table 14-2. Absorption parameter values for inhaled and ingested thorium 11018 11019
Inhaled particulate materials
Absorption parameter valuesa Absorption from the alimentary tract, fA
b fr sr (d–1) ss (d–1) Specific parameter valuesc Water soluble forms, including thorium chloride, citrate, nitrate and sulphate; thorium fluorided
0.1 50 0.005 5 x 10⁻⁵
Default parameter valuese Absorption Type
Assigned forms
F — NB: Type F should not be assumed without evidence
1 50 - 5 x 10⁻⁴
Mf Thorium hydroxide 0.2 3 0.005 1 x 10⁻⁴ Sf Oxide, all unspecified
formsg 0.01 3 1x10⁻⁴ 5 x 10⁻⁶
Ingested material All forms 5 x 10⁻⁴ a It is assumed that for thorium the bound state can be neglected, i.e. fb = 0.0. The value of sr for Type F forms 11020
of thorium (50 d–1) is element-specific. The values for Types M and S (3 d–1) are the general default values. 11021 b For inhaled material deposited in the respiratory tract and subsequent cleared by particle transport to the 11022
alimentary tract, the default fA values for inhaled materials are applied: i.e. the (rounded) product of fA for the 11023 absorption Type (or specific value where given) and the fA value for ingested soluble forms of thorium (5 x 11024 10–4). 11025
c See text for summary of information on which parameter values are based, and on ranges of parameter values 11026 observed for individual materials. For water soluble forms of thorium specific parameter values are used for 11027 dissolution in the lungs, but the default value of fA. 11028
d Decay products assigned to Type F. 11029 e Materials (e.g. thorium hydroxide) are listed here where there is sufficient information to assign to a default 11030
absorption Type, but not to give specific parameter values (see text). 11031 f Decay products assigned to Type M. 11032 g Default Type S is recommended for use in the absence of specific information, i.e. if the form is unknown, or 11033
if the form is known but there is no information available on the absorption of that form from the respiratory 11034 tract. 11035
11036 14.2.2. Ingestion 11037 11038

DRAFT FOR MC REVIEW PRIOR TO CONSULTATION
277
(845) Maletskos et al. (1969) measured the absorption of 234Th ingested as the sulphate in 11039 a mock "dial" paint by six elderly humans. The values obtained were in the range 10-4 to 11040 6.10-4 with a mean of 2.10-4. Estimates of Th absorption have also been derived by Johnson 11041 and Lamothe (1989) from human data on skeletal content, dietary intake, estimated inhalation 11042 rates and excretion data, giving values of less than 10-3 to 10-2. However, these estimates of 11043 absorption are uncertain because they are based on balance studies involving disparate data 11044 sources. Dang and Sunta (1992) questioned the higher uptake values reported by Johnson and 11045 Lamothe (1989) and reinterpreted the data used by them to suggest absorption values of about 11046 10-3 - 2x10⁻³. Their own data for Th concentrations in tissues, body fluids, and daily diet for 11047 urban Indian populations suggested values lower than 10-3. Roth et al. (2005) measured 11048 urinary excretion of 232Th in 11 adults who were not occupationally exposed. Comparison 11049 with reference intake values suggested that absorption was around 5 x 10⁻³. 11050
(846) There have been several reports of Th absorption in rats and mice, with values of 11051 5.10-5 to 6.10-3 for rats (Traikovich, 1970; Pavlovskaya et al, 1971; Sullivan, 1980), about 11052 6.10-4 for mice (Sullivan, 1980; Sullivan et al., 1983) and 1.10-3 for fasted mice (Larsen et al., 11053 1984). 11054
(847) In Publication 30 (ICRP, 1979), an absorption value of 2x10⁻⁴ was recommended on 11055 the basis of the study of Maletskos et al. (1969). In Publication 67 (1993) and 69 (1994a), 11056 because similar values have been obtained in more recent human studies on the absorption of 11057 Pu, Am, Np and Cm, a general absorption value of 5x10⁻⁴ was adopted for dietary intake by 11058 adults for all actinides other than uranium. In Publication 68 (1994b), a value of 2x10⁻⁴ was 11059 applied to oxides and hydroxides, with 5x10⁻⁴ for all other chemical forms. An fA of 5x10⁻⁴ is 11060 adopted here for all chemical forms. 11061 11062 14.2.3. Systemic distribution, Retention and Excretion 11063 11064 14.2.3.1. Summary of the database 11065 11066 Human subjects 11067
(848) Maletskos et al. (1966, 1969) examined the clearance of thorium from blood and its 11068 retention and excretion after intravenous injection of 234Th citrate into normal human subjects 11069 of age 63-83 y. Detailed measurements were reported for 3 male and 2 female subjects 11070 (Maletskos et al., 1966). During the first day, thorium disappeared from blood with a 11071 half-time of a few hours. As an average, about 10% of the injected amount remained in blood 11072 after 1 d, 3% after 2 d, 1.5% after 3 d, and 0.3% after 10 d. As indicated by whole-body 11073 counting and analysis of excreta, whole-body retention was greater than 90% of the injected 11074 amount at 3 wk after injection. Cumulative urinary excretion represented 4.5-6.1% of the 11075 injected amount over the first 5 d after injection and an additional 2-3% over the next 19 d. 11076 Little activity was lost in faeces during the first five days. The ratio of urinary to faecal 11077 excretion over the first five days averaged about 12 for the male subjects and 25 for the 11078 female subjects. External measurements indicated virtually no biological removal from the 11079 body during the period from 3-16 wk after injection. There appeared to be no disproportionate 11080 accumulation of thorium in the liver compared with other soft tissues. 11081
(849) Long-term measurements of 227Th or 228Th in the bodies and excreta of accidentally 11082 exposed workers suggest a minimum biological half-time of 10-15 y for the total-body 11083 content (Rundo, 1964; Newton et al., 1981). Similar measurements on workers chronically 11084 exposed to thorium over 1-3 decades (Dang et al., 1992) suggest that the rate of removal of 11085 the systemic burden to urine was less than 1% y-1. 11086

DRAFT FOR MC REVIEW PRIOR TO CONSULTATION
278
(850) Stehney and Lucas (2000) reported concentrations of 232Th and activity ratios of 11087 228Th to 232Th and 230Th to 232Th in autopsy samples from five subjects who had worked for 11088 3-24 y at a thorium refinery. Times from the end of work to death ranged from 6 to 31 y. The 11089 subjects presumably were exposed primarily by inhalation. For three workers for whom 11090 analyses were available for both bone and liver, the 232Th content of total bone averaged 11091 roughly 20 times that of the liver based on reference organs masses. For two workers for 11092 whom analyses were available for both liver and kidney, the 232Th content of the liver 11093 averaged roughly 30 times that of the kidneys. In most samples the activity ratios 228Th:232Th 11094 and 230Th:232Th were in the ranges 0.2-0.4 and 0.1-0.2, respectively. 11095
(851) Measurements of thorium isotopes in autopsy samples from non-occupationally 11096 exposed subjects (Wrenn et al., 1981; Singh et al., 1983; Ibrahim et al., 1983) indicate that the 11097 skeleton typically contains more than three-fourths of the systemic burden during or after 11098 chronic exposure to thorium. The reported contents of the liver and kidneys are variable but 11099 typically represent about 2-4% and 0.3-1%, respectively, of the systemic burden. These 11100 estimates are based on the assumption that muscle, fat, and skin do not accumulate more than 11101 20% of the systemic content, as suggested by data on laboratory animals (Stover et al., 1960; 11102 Thomas et al., 1963; Boecker et al., 1963; Traikovich, 1970; Larsen et al., 1984). 11103
(852) Glover et al. (2001) reported detailed measurements of 232Th in tissues of a whole 11104 body donor to the United States Transuranium and Uranium Registries. The subject had no 11105 known occupational exposure to thorium but had occupational intakes of plutonium and 11106 americium and had been chelated with DTPA following an incident 19 years before his death. 11107 The authors estimated that the skeleton, liver, kidneys, and other soft tissues contained about 11108 56%, 0.36%, 0.19%, and 43% of systemic 232Th. The ratio 156 of skeletal 232Th to liver 232Th 11109 estimated for this subject is substantially greater than values typically determined for human 11110 subjects with or without occupational exposure to 232Th. 11111 11112 Laboratory animals 11113
(853) Stover et al. (1960) studied the biological behavior of 228Th in adult beagle dogs over 11114 a 1300-d period following its intravenous administration. Biological retention was about 11115 88% of the injected amount at 3 wk, 80-85% at 3 mo, and 65-70% at 2.5 y (Fig. 5). The 11116 urinary excretion rate was about 4 times the faecal excretion rate in the first few weeks, but 11117 the urinary-to-faecal excretion ratio gradually decreased and was close to 1 at 2.5 y after 11118 injection. About 70%, 5%, and 3% of injected thorium deposited in the skeleton, liver, and 11119 kidneys, respectively. At times greater than 100 d after administration, about 80% of retained 11120 thorium was in the skeleton and about 20% was widely distributed in soft tissues, with 11121 relatively high concentrations in the liver and kidneys. There was little if any decline in the 11122 thorium content of compact bone over 1300 d or in trabecular bone over 800 d, but there was 11123 a noticeable decline in activity in trabecular bone over 800-1300 d after administration. The 11124 thorium content of the liver and kidneys declined considerably in the first several months 11125 after injection but showed little or no decrease thereafter. Retention of thorium in the kidneys 11126 and its rate of urinary excretion at times remote from injection may have been affected by 11127 radiation damage at high dosage levels (Stover et al., 1960). 11128
(854) Comparison of the organ distributions of thorium isotopes in humans and beagles 11129 exposed only to environmental levels indicate broad similarities in the long-term distributions 11130 of systemic thorium in the two species (Singh et al., 1988). There are also broad similarities 11131 in the patterns of distribution and excretion of injected thorium in human subjects (Maletskos 11132 et al., 1966, 1969) and beagles (Stover et al., 1960) at early times after administration. 11133
(855) The biokinetics of systemic thorium has been studied in various small mammals 11134

DRAFT FOR MC REVIEW PRIOR TO CONSULTATION
279
including rats, mice, guinea pigs, and rabbits (Scott et al., 1952; Thomas et al., 1963; Boecker 11135 et al., 1963; Traikovich, 1970; Larsen et al., 1984). In many cases, the administration of high 11136 concentrations of thorium apparently resulted in colloid formation and high deposition in the 11137 reticuloendothelial system or in the tissue into which thorium was introduced (e.g. lung with 11138 intratracheal injection, or muscle with intramuscular injection). The results of such high-dose 11139 studies do not appear to be useful for determining the biokinetics of thorium after intake at 11140 levels likely to be encountered in the environment or in most occupational situations. 11141
(856) For tracer levels of thorium administered as the citrate to rats, deposition was 11142 considerably greater in bone than other systemic tissues (Thomas et al., 1963). Muscle and 11143 pelt accounted for about 20% of the systemic activity at 7-54 d post injection. 11144
(857) Boecker et al. (1963) found that the level of absorption of thorium to blood and its 11145 subsequent pattern of distribution and excretion following acute inhalation by rats did not 11146 depend on the initial lung content of inhaled thorium. The absorbed activity was deposited 11147 mainly in the skeleton. The liver content at 0-40 d was about 15-20% of the skeletal content, 11148 and the kidney content during that time was about 3% of the skeletal content. The content of 11149 pelt and muscle plus connective tissue was about the same as liver. The urinary to faecal 11150 excretion ratio increased gradually to a value of about 0.6-0.7 at 40-50 d post inhalation. 11151
(858) At 3 d after injection of thorium into mice, about 90% of the systemic burden was 11152 found in the skeleton, 6% in liver, 4% in kidneys, and 0.1% in reproductive organs (Larsen et 11153 al., 1984). A urinary to faecal excretion ratio of 16 was observed. The systemic distribution 11154 of thorium was essentially the same after gastrointestinal absorption as after intravenous 11155 injection. 11156 11157 14.2.3.2. Biokinetic model for systemic thorium 11158 11159
(859) The biokinetic model for systemic thorium used in this report is the model applied to 11160 adult members of the public in ICRP Publication 69 (1995a) and to workers in Publication 68 11161 (1994). The model structure (Figure 14-1) is the generic structure for bone-surface-seeking 11162 radionuclides. Parameter values for a reference worker are listed in Table 14-3. The primary 11163 parameter values such as compartment deposition fractions and biological half-times 11164 underlying the transfer coefficients given in Table 14-3 are summarized below. The 11165 conceptual basis of the model and the selection of parameter values are described by Leggett 11166 (1997). 11167
(860) In the following summary of the model, the "removal half-time" from a compartment 11168 refers to the biological half-time that would be observed if there were no recycling to that 11169 compartment. This will generally differ from the apparent or “externally viewed” half-time 11170 observed in the presence of recycling. Transfer coefficients from blood to various 11171 compartments are based on "deposition fractions", which provide a convenient way to 11172 describe the initial distribution of activity leaving the circulation. 11173
(861) Blood is treated as a uniformly mixed pool. Compartment ST0 is a soft-tissue pool 11174 that includes the extracellular fluids and exchanges material with blood over a period of days. 11175 Compartment ST0 is used to depict an early build-up and decline of material in soft tissues 11176 and to account for early feedback of material to blood. Compartment ST0 is viewed as an 11177 integral part of the early circulation of thorium. In the summary of parameter values below, 11178 deposition fractions for compartments other than ST0 are given in terms of activity “leaving 11179 the circulation" and refer to the division of thorium among compartments other than ST0. 11180 11181 11182

DRAFT FOR MC REVIEW PRIOR TO CONSULTATION
280
11183
11184 Figure 14-2. Structure of the biokinetic model for systemic thorium. 11185
11186 (862) The removal half-time from blood is assumed to be 0.25 d, corresponding to a total 11187
transfer coefficient (the sum of transfer coefficients to all repositories) of ln 2/0.25 d = 2.7726 11188 d-1, where ln 2 is the natural logarithm of 2. Since 30% of this goes to ST0, the transfer 11189 coefficient from blood to ST0 is 0.3 x 2.7726 d-1 = 0.8318 d-1. Transfer coefficients from 11190 blood to other compartments are based on deposition fractions described below and the rate at 11191 which thorium leaves the circulation, which is taken to be the total transfer coefficient from 11192 blood to all compartments minus the transfer coefficient from blood to ST0: 2.7726 d-1 – 11193 0.8318 d-1 = 1.9408 d-1. For example, the transfer coefficient from blood to a compartment 11194 with a deposition fraction of 0.01 is 0.01 x 1.9408 d-1 = 0.019408 d-1, before rounding. 11195
(863) It is assumed that 70% of thorium leaving the circulation deposits on bone surface. 11196 One-half of the deposited amount is assigned to trabecular surface and one-half is assigned to 11197 cortical surface. The fate of thorium after its deposition on bone surface is described by the 11198 generic model for bone-surface-seeking radionuclides. That is, the rate of translocation of 11199 skeletal deposits is controlled by bone restructuring processes. The transfer coefficient from 11200 compact or trabecular bone surface or volume to the corresponding bone marrow 11201 compartment is the rate at which that type of bone surface is resorbed. The transfer 11202 coefficient from a bone surface compartment to the corresponding bone volume compartment 11203 is one-half the surface formation rate. A common rate (referred to as the “bone turnover 11204 rate”) is used for both bone formation and bone resorption and is applied both to surface and 11205 volume remodeling. Bone turnover rates used here are reference values for adults given in 11206 ICRP Publication 89 (2002). The removal half-time from bone marrow to blood is assumed 11207 to be 0.25 y. 11208 11209
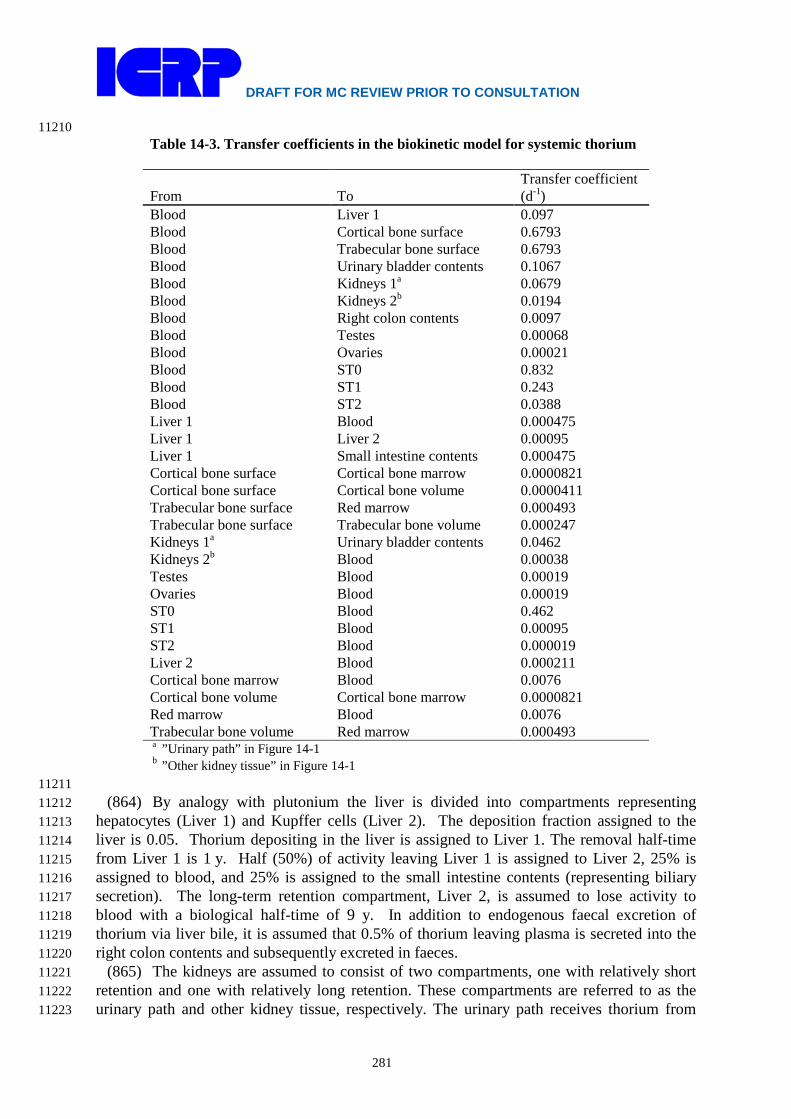
DRAFT FOR MC REVIEW PRIOR TO CONSULTATION
281
11210 Table 14-3. Transfer coefficients in the biokinetic model for systemic thorium
From To Transfer coefficient (d-1)
Blood Liver 1 0.097 Blood Cortical bone surface 0.6793 Blood Trabecular bone surface 0.6793 Blood Urinary bladder contents 0.1067 Blood Kidneys 1a 0.0679 Blood Kidneys 2b 0.0194 Blood Right colon contents 0.0097 Blood Testes 0.00068 Blood Ovaries 0.00021 Blood ST0 0.832 Blood ST1 0.243 Blood ST2 0.0388 Liver 1 Blood 0.000475 Liver 1 Liver 2 0.00095 Liver 1 Small intestine contents 0.000475 Cortical bone surface Cortical bone marrow 0.0000821 Cortical bone surface Cortical bone volume 0.0000411 Trabecular bone surface Red marrow 0.000493 Trabecular bone surface Trabecular bone volume 0.000247 Kidneys 1a Urinary bladder contents 0.0462 Kidneys 2b Blood 0.00038 Testes Blood 0.00019 Ovaries Blood 0.00019 ST0 Blood 0.462 ST1 Blood 0.00095 ST2 Blood 0.000019 Liver 2 Blood 0.000211 Cortical bone marrow Blood 0.0076 Cortical bone volume Cortical bone marrow 0.0000821 Red marrow Blood 0.0076 Trabecular bone volume Red marrow 0.000493 a ”Urinary path” in Figure 14-1 b ”Other kidney tissue” in Figure 14-1
11211 (864) By analogy with plutonium the liver is divided into compartments representing 11212
hepatocytes (Liver 1) and Kupffer cells (Liver 2). The deposition fraction assigned to the 11213 liver is 0.05. Thorium depositing in the liver is assigned to Liver 1. The removal half-time 11214 from Liver 1 is 1 y. Half (50%) of activity leaving Liver 1 is assigned to Liver 2, 25% is 11215 assigned to blood, and 25% is assigned to the small intestine contents (representing biliary 11216 secretion). The long-term retention compartment, Liver 2, is assumed to lose activity to 11217 blood with a biological half-time of 9 y. In addition to endogenous faecal excretion of 11218 thorium via liver bile, it is assumed that 0.5% of thorium leaving plasma is secreted into the 11219 right colon contents and subsequently excreted in faeces. 11220
(865) The kidneys are assumed to consist of two compartments, one with relatively short 11221 retention and one with relatively long retention. These compartments are referred to as the 11222 urinary path and other kidney tissue, respectively. The urinary path receives thorium from 11223
DRAFT FOR MC REVIEW PRIOR TO CONSULTATION
282
plasma and loses activity to the urinary bladder contents. Other kidney tissue receives thorium 11224 from blood and loses thorium to blood. It is assumed that 3.5% of outflow from plasma 11225 deposits in the urinary path and 1% deposits in other kidney tissue. The removal half-time 11226 from the urinary path to the urinary bladder contents is 15 d. The removal half-time from 11227 other kidney tissue is 5 y. It is further assumed that 5.5% of activity leaving the circulation 11228 moves instantaneously through the kidneys and deposits in urinary bladder contents. Hence, a 11229 total of 9% of thorium leaving the circulation is assumed to enter urinary excretion pathways. 11230
(866) The model describing uptake and removal of thorium by the gonads is the default 11231 model for the actinide elements. It is assumed that deposition in the gonads, expressed as a 11232 percentage of thorium leaving the circulation, is 0.001% per gram of gonadal tissue. This 11233 yields a deposition of 0.035% of thorium leaving the circulation in the 35-g testes of the 11234 reference adult male and 0.011% in the 11-g ovaries of the reference adult female (ICRP, 11235 2002). The removal half-time from gonads to blood is assumed to be 10 y. 11236
(867) Other soft tissues are divided into compartments ST0, ST1, and ST2 representing 11237 fast, moderate, and slow return of thorium to blood. These compartments and associated 11238 parameter values are defined on a kinetic basis and are not physically identifiable entities. 11239 They are based mainly on observations of the time-dependent content of soft tissues other 11240 than liver and kidneys following intravenous administration of thorium to laboratory animals. 11241 As described earlier, it is assumed that 30% of outflow from blood deposits in ST0. It is 11242 assumed that 2% of activity leaving the circulation deposits in compartment ST2. The 11243 percentage left over after all other deposition fractions in the model have been chosen, 11244 amounting to ~12.5% of thorium leaving the circulation, is assigned to the 11245 intermediate-turnover soft-tissue compartment, ST1. The removal half-times from ST0, ST1, 11246 and ST2 are 1.5 d, 2 y, and 100 y, respectively. 11247 11248 14.2.3.3. Treatment of radioactive progeny 11249 11250
(868) The dosimetrically significant progeny of thorium isotopes addressed in this report 11251 are isotopes of actinium, thorium, protactinium, uranium, radium, radon, polonium, lead, 11252 bismuth, thallium, actinium, francium, or astatine. 11253
(869) The characteristic model for thorium described above is applied to thorium isotopes 11254 produced in systemic compartments by serial decay of members of a thorium chain. Thorium 11255 produced in a compartment that is not identifiable with a compartment in the characteristic 11256 model for thorium is assumed to transfer to the central blood compartment at the rate 1000 d-1 11257 if produced in a blood compartment and at the rate of bone turnover if produced in an 11258 exchangeable bone volume compartment. The model for thorium is also applied to 11259 protactinium produced in systemic compartments following intake of a thorium parent. 11260
(870) The characteristic model for uranium is applied to uranium produced in systemic 11261 compartments following intake of a thorium parent. Uranium produced in a compartment 11262 that is not identifiable with a compartment in the characteristic model for uranium (which 11263 occurs only for certain soft-tissue compartments) is assumed to transfer to the central blood 11264 compartment at the rate 0.0347 d-1 (half-time of 20 d), the rate of loss from the intermediate-11265 term compartment of Other soft tissues in the characteristic model for uranium. 11266
(871) The models for actinium, radium, radon, polonium, lead, bismuth, thallium, 11267 actinium, francium, and astatine produced systemically by serial decay of members of a 11268 thorium chain are essentially the same as the models applied to these elements as progeny of 11269 radium (see the section on radium). 11270 11271
DRAFT FOR MC REVIEW PRIOR TO CONSULTATION
283
14.3. Individual monitoring 11272 11273 228Th 11274
(872) 228Th monitoring techniques include urine and faeces bioassay. Care must be taken 11275 when interpreting intakes of 228Th though measurements of the nuclide concentrations in 11276 excreta samples due to presence of natural thorium. Th-228 itself cannot be detected directly 11277 by in vivo measurement. The body content of Th-228 can be inferred from the measurement 11278 of the gamma emissions of the decay products, Pb-212 or Tl-208. Assumptions concerning 11279 the equilibrium ratio between 228Th and its decay products are required. The ratios of 11280 daughters’ activities to Th-228 in the source material are important. Depending on these 11281 ratios monitoring done immediately after exposure might be strongly influenced by inhaled 11282 Rn-220. The biokinetics of Pb-212 in the lung should be considered, as Pb-212 might have a 11283 faster clearing rate from the lungs than thorium. 11284
(873) In addition, as explained in section 2.1, in the paragraphs describing Decay products 11285 of thorium formed in the lungs, a fraction of the daughters formed within the lung will leave 11286 the lung in a faster clearing rate, not taken into account on the bioassay functions described in 11287 this series of documents. The underestimation due to the loss of decay products by alpha 11288 recoil should be added to the uncertainty of the result. 11289
(874) Measurement of thoron (Rn-220) in breath is a potentially useful technique for 11290 determining lung burdens of Th-228. The uncertainties in the assessment of lung burdens are 11291 difficult to quantify and may underestimate the lung burdens, as explained in section 2.1, 11292 Emanation of radon: recoil and diffusion. 11293 11294
Isotope Monitoring Technique
Method of Measurement
Typical Detection Limit
Achievable detection limit
228Th Urine Bioassay α spectrometry 1 mBq/L 0.1 mBq/L 228Th Faeces Bioassay α spectrometry 2mBq/24h 0.2 mBq/24h 228Th Lung Counting γ-ray spectrometry
of 212 Pb 10 Bq (of Pb-212)
8 Bq (of Pb-212)
11295 229Th 11296
(875) Urine bioassay is used to determine 229 Th intakes. 11297 11298
Isotope Monitoring Technique
Method of Measurement
Typical Detection Limit
Achievable detection limit
229Th Urine Bioassay α spectrometry 2 mBq/L 11299 230Th 11300
(876) 230Th intakes are determined though urine and faeces bioassay. 11301 11302
Isotope Monitoring Technique
Method of Measurement
Typical Detection Limit
Achievable detection limit
230Th Urine Bioassay α spectrometry 1 mBq/L 0.05 mBq/L 230Th Faeces Bioassay α spectrometry 2 mBq/24h 0.2 mBq/24h
11303
DRAFT FOR MC REVIEW PRIOR TO CONSULTATION
284
232Th 11304 (877) Intakes of 232Th are determined by in vitro bioassay of urine samples, complemented 11305
or not by analysis of faeces. In general it is necessary to use the most sensitive measurement 11306 technique to be able to detect Th-232 exposures at the investigation levels. As thorium is a 11307 nuclide naturally present in the environment and in the diet, excretion rates of natural thorium 11308 are expected and should be evaluated for the population in the region of residence of the 11309 workers. This is especially important for the interpretation of faeces sample results. 11310
(878) Th-232 itself cannot be detected directly by in vivo measurement. In vivo lung 11311 counting is performed using the measurement of its decay products.. Assessment of Th-232 11312 lung content by the measurement of the gamma emissions of daughter nuclides is not 11313 straightforward. It depends on equilibrium assumptions in the source material that the worker 11314 is exposed and on the biokinetics of the chain members in the lung. For sources of exposure 11315 in which Th-232 is presumed in equilibrium with the daughters, Ac-228 is in general chosen 11316 to be measured, because no assumptions about Rn-220 are needed to calculate the 11317 corresponding Th-232 activity. As explained in section 2.1, in the paragraphs describing 11318 Decay products of thorium formed in the lungs, Ra-228 and Ac-228 have faster clearing rates 11319 from the lungs than thorium. In addition, a fraction of the daughters formed within the lung 11320 will leave the lung in a faster clearing rate, not taken into account on the bioassay functions 11321 described in this series of documents. The underestimation due to the loss of decay products 11322 by alpha recoil should be added to the uncertainty of the result. 11323
(879) When the source of exposure is a purified thorium source, containing only Th-232 11324 and Th-228, in equal quantities immediately after purification, Ac-228 will not be measurable 11325 for a long time. On the other hand, in about three weeks Pb-212 will be in equilibrium with 11326 Th-228, and may be used to assign Th-232 intakes, keeping in mind the uncertainties on 11327 underestimation of thorium due to the faster clearing rate of the daughter products formed 11328 within the lung. If the Th-232 source is purified again, depending on the amount of Th-228 11329 which is left, the measurement of Pb-212 will underestimate the Th-232, and may not be 11330 useful even for screening. 11331
(880) Thus in order to estimate Th-232 content using lung monitoring of the daughter 11332 products, it is necessary to know the ratios of daughters activities to Th-232 in the source of 11333 exposure. In addition the biokinetics of daughter products in the lung should be carefully 11334 evaluated. 11335
(881) Measurement of thoron (Rn-220) in breath is a potentially useful technique for 11336 determining lung burdens of Th-232. The uncertainties in the assessment of lung burdens are 11337 difficult to quantify and may underestimate the lung burdens, as explained in section 2.1, 11338 Emanation of radon: recoil and diffusion. 11339 11340
Isotope Monitoring Technique
Method of Measurement
Typical Detection Limit
Achievable detection limit
232Th Urine Bioassay α spectrometry 1 mBq/L 0.05 mBq/L 232Th Urine Bioassay ICPM/S 0.3 mBq/L 0.06 mBq/L 232Th Faeces Bioassay α spectrometry 2 mBq/24h 0.2 mBq/24h 232Th Lung Counting γ-ray spectrometry
of 228Ac 20 Bq of 228Ac
10 Bq of 228Ac
11341 11342 11343

DRAFT FOR MC REVIEW PRIOR TO CONSULTATION
285
234Th 11344 (882) 234Th is a gamma emitter. Its intake may be determined through bioassay analysis of 11345
urine samples or though in vivo lung counting. 11346 11347
Isotope Monitoring Technique
Method of Measurement
Typical Detection Limit
Achievable detection limit
234Th Urine Bioassay γ-ray spectrometry 4 Bq/L 0.09 mBq/L 234Th Lung Counting γ-ray spectrometry 50 Bq 30 Bq
11348 References 11349
11350 Albert, R.E., 1966. Thorium: Its Industrial Hygiene Aspects. Academic Press, New York. 11351 Ballou, J.E., Hursh, J.B., 1972. The measurement of thoron in the breath of dogs administered 11352
inhaled or injected ThO2. Health Phys., 22, 155–159. 11353 Ballou, J.E., Gies, R.A., Case, A.C., Haggard, D.L., Bushbom, R.L., Ryan, J.L., 1986. Deposition and 11354
early disposition of inhaled 233UO2(NO3)2 and 232UO2(NO3)2 in the rat. Health Phys. 51 11355 755-771. 11356
Bečková, V., Malátová, I., 2008. Dissolution behaviour of 238U, 234U and 230Th deposited on filters 11357 from personal dosemeters. Radiat. Prot. Dosim. 129(4): 469-472, published ahead of print 11358 November 1, 2007 doi:10.1093/rpd/ncm455. 11359
Boecker, B.B., 1963. Thorium distribution and excretion studies III. Single inhalation exposure to 11360 the citrate complex and multiple inhalation exposures to the chloride. Am. Ind. Hyg. Assoc. 11361 J. 24, 155–163. 11362
Boecker, B.B., Thomas, R.G., Scott, J.K., 1963. Thorium distribution and excretion studies II. 11363 General patterns following inhalation and the effect of the size of the inhaled dose. Health 11364 Phys. 9, 165–176. 11365
Chen Xing-an, Xiao Hui-juan, Cheng Yong-e, Yang Ying-je, 1995. An observation on the clearance 11366 of thorium dioxide from the lung of a miner. J. Radiol. Prot. 15, 343–346. 11367
Chen Xing-an, Xiao Hui-juan, Dong Zhihua, Lu Hiu Min, Yang Yingjie, Wang Ji Zhong, Wang 11368 Yidien, Li Shou-Hua, Hu Ya Qin, 1988. An assessment of the estimated thorium lung 11369 burdens of 130 miners in a rare-earth and iron mine in China. In Inhaled Particles VI, 11370 Proceedings of an International Symposium and Workshop on Lung Dosimetry Organised 11371 by the British Occupational Hygiene Society in Co-operation with the Commission of the 11372 European Communities, Cambridge, 2-6 September 1985, (Eds. Dodgson, J., McCallum, 11373 R.I., Bailey, M.R., and Fisher, D.R), Pergamon Press, Oxford, United Kingdom. Ann. 11374 Occup. Hyg., 32 (Suppl. 1), 871 – 876. 11375
Coombs, M.A., Cuddihy, R.G., 1983. Emanation of 232U daughter products from submicron particles 11376 of uranium dioxide and thorium dioxide by nuclear recoil and inert gas diffusion. J Aerosol 11377 Sci. 14, 75-86. 11378
Dang, H.S., Jaiswal, D.D., Murthy, K.B., Sharma, R.C., Nambiar, P.P., Sunta, C.M., 1992. Relevance 11379 of ICRP metabolic model of thorium in bio-assay monitoring. J. Radioanalytical Nucl. 11380 Chem. Articles 156, 55-64. 11381
Duport, P., Edwardson, E., 1984. Characterization of radioactive long-lived dust present in uranium 11382 mines and mills atmospheres. In: Stocker, H. (Ed.), Proc. Int. Conf. on occupational 11383 radiation safety in mining, pp. 189–195. Toronto, Canadian Nuclear Association. 11384
Duport, P., Robertson R., Ho K., Horvath F., 1991. Flow-through dissolution of uranium-thorium ore 11385 dust, uranium concentrate, uranium dioxide, and thorium alloy in simulated lung fluid. 11386 Radiat. Prot. Dosim. 38(1/3), 121-133. 11387
Fisher, D.R. Jackson, P.O., Brodaczynski, G.G., Scherpelz, R.I., 1983. Levels of 238U and 230Th in 11388 excreta of uranium mill crushermen. Health Phys. 45, 617-629. 11389
DRAFT FOR MC REVIEW PRIOR TO CONSULTATION
286
Glover, S.E., Traub, R.J., Grimm, C.A., Filby, R.H., 2001. Distribution of natural thorium in the 11390 tissues of a whole body. Radiat. Prot. Dosim. 97, 153-160. 11391
Gray, S.A., Stradling G.N., Moody J.C., Pearce, M.J., Hodgson, A., Ellender, M., 1991. Biokinetics 11392 of Thorium in the Rat after Administration as Nitrate: Implications for Human Exposure. 11393 NRPB-M281, Chilton, Didcot, Oxon OX11 0RQ. 11394
Griffiths W.C., Cuddihy, R.G., Hoover, M.D. Stalnaker, N.D. 1980. Simulation of the retention and 11395 dosimetry of 232U and its daughters after inhalation in ThO2 or UO2 particles. In: Sanders C. 11396 L., Cross F.T., Dagle G. E., Mahaffey, J.A., (Eds.), Pulmonary Toxicology of Respirable 11397 Particles. pp. 193-208. Proc. 19th Annual Hanford Life Sciences Symposium at Richland, 11398 WA, October 22-24, 1979. CONF-791002. Available from National Technical Information 11399 Service. Springfield. Virginia. 11400
Hamilton, E.I., Minsky, M.J., Cleary, J.J., 1972. The concentration and distribution of some stable 11401 elements in healthy human tissues from the United Kingdom. Sci. Total Environ., 1, 341-11402 374. 11403
Hodge, H.C., Thomas, R.G., 1959. The questions of health hazards from the inhalation of insoluble 11404 uranium and thorium oxides. In: Marley, W.G., Morgan, K.Z. (Eds.), Progress in Nuclear 11405 Energy, Series XII, Health Physics. Pergamon Press pp. 52 – 59. 11406
Hodgson, S.A., Rance, E.R., Stradling, G.N., Hodgson, A., Fell, T.P., Youngman, M.J., Moody, J.C., 11407 Ansoborlo, E., 2000. Biokinetics of thorium dioxide and its decay products in the rat after 11408 alveolar deposition: implications for human exposure. Chilton, NRPB-M1192. 11409
Hodgson, S.A., Stradling, G.N., Hodgson, A., Smith, T.J., Youngman, M.J., Moody, J.C., Ansoborlo, E. 11410 2003. Biokinetics and assessment of intake of thorium dioxide. Radiat. Prot. Dosim. 105, 11411 115–118. 11412
Ibrahim, S.A., Wrenn, M.E., Singh, N.P., Cohen, N., Saccomanno, G., 1983. Thorium concentration 11413 in human tissues from two U. S. populations. Health Phys. 44, Suppl. 1, 213-220. 11414
ICRP, 1979. International Commission on Radiological Protection. Limits on Intakes of 11415 Radionuclides for Workers. ICRP Publication 30, Pt.1. Pergamon Press, Oxford. Ann. ICRP 11416 2, (3/4). 11417
ICRP, 1993. International Commission on Radiological Protection. Age-dependent Doses to 11418 Members of the Public from Intake of Radionuclides. Pt.2. ICRP Publication 67. Pergamon 11419 Press, Oxford. Ann. ICRP. 23, (3/4). 11420
ICRP, 1994a. Dose Coefficients for Intakes of Radionuclides by Workers, ICRP Publication 68. Ann. 11421 ICRP 24(4). Oxford, Pergamon Press. 11422
ICRP, 1994b. International Commission on Radiological Protection. Human respiratory tract model 11423 for radiological protection. ICRP Publication 66, Ann. ICRP 24 (1-3). 11424
ICRP, 1995a. Age dependent Doses to Members of the Public from Intakes of Radionuclides: Part 3. 11425 Ingestion dose coefficients. ICRP Publication 69. Ann. ICRP 25(1). Oxford, Pergamon 11426 Press. 11427
ICRP, 1995b. Age-dependent Doses to Members of the Public from Intake of Radionuclides. Pt.4: 11428 Inhalation Dose Coefficients. ICRP Publication 71. Pergamon Press, Oxford. Ann. ICRP. 11429 25, (3 - 4). 11430
ICRP, 2002. Basic anatomical and physiological data for use in radiological protection: Reference 11431 values, ICRP Publication 89, Ann. ICRP 32(3/4). International Commission on Radiological 11432 Protection. Oxford, Pergamon Press. 11433
Jaiswal, D.D., Singh, I.S., Nair, S., Dang, H.S., Garg, S.P., Pradham, A.S., 2004. Comparison of 11434 observed lung retention and urinary excretion of thorium workers and members of the 11435 public in India with the values predicted by the ICRP biokinetic model. Radiat. Prot. Dosim. 11436 112, 237-243. 11437
Johnson, J.R., Peterman, B.F. 1984. A model to describe thoron exhalation following an inhalation 11438 exposure to thoria aerosols. In: Smith, H., Gerber, G. (Eds.) Lung Modelling for Inhalation of 11439 Radioactive Materials. EUR 9384. pp. 193 – 197 Commission of the European Communities, 11440 Luxemburg. 11441

DRAFT FOR MC REVIEW PRIOR TO CONSULTATION
287
Johnson, J.R., Lamothe, E.S., 1989. A Review of the Dietary Uptake of Th. Health Phys. 56, 165-11442 168. 11443
Kalkwarf, D.R., Jackson, P.O., Kuti, J.C., 1985. Emanation coefficients for Rn in sized coal fly ash. 11444 Health Phys. 48, 429–436. 11445
LaMont, S.P., Filby, R.H., Glover, S.E., 2001. In vitro dissolution characteristics of aged and 11446 recrystallised high-fired 232ThO2. Radiat. Prot. Dosim, 14, 75-86. 11447
Larsen, R.P., Oldham, R.D., Bhattacharyya, M.H., Moretti, E.S., 1984. Gastrointestinal absorption 11448 and distribution of thorium in the mouse. In: Environmental Research Division annual 11449 report, July 1982-June 1983; Argonne National Laboratory, ANL-83-100-Pt. 2; pp. 65-68. 11450
Leggett, R.W., 1997. Basis and implications of the ICRP’s new biokinetic model for thorium. Health 11451 Phys. 73, 587-600. 11452
Lipsztein, J.L., Bertelli, L.N., Oliveira, C.A.N., Azeredo, A.M.G., Melo, D.R., Lourenco, M.C., 11453 Grynspan, D., Dantas, B.M., 1989. Bioassay monitoring studies for thorium. Radiat. Prot. 11454 Dosim. 26, 57-60. 11455
Maletskos, C.J., Keane, A.T., Telles, N.C., Evans, R.D., 1966. The metabolism of intravenously 11456 administered radium and thorium in human beings and the relative absorption from the 11457 human gastrointestinal tract of radium and thorium in simulated radium dial paints. In: 11458 Radium and mesothorium poisoning and dosimetry and instrumentation techniques in 11459 applied radioactivity (MIT-952-3), Massachusetts Institute of Technology, Cambridge, 11460 Massachusetts; pp. 202-317. 11461
Maletskos, C.J., Keane, A.T., Telles, N.C., Evans, R.D., 1969. Retention and absorption of 224Ra and 11462 234Th and some dosimetric considerations of 224Ra in human beings. In: (Mays, C.W., Jee, 11463 W.S.S., Lloyd, R.D., Stover, B.J., Dougherty, J.H., Taylor, T.N. (Eds.), Delayed Effects of 11464 Bone-seeking Radionuclides University of Utah Press, Salt Lake City. pp. 29-49. 11465
Maniyan, C.G., Pillai, P.M., Khan, A.H., 2000. An in vivo study on clearance of thorium from the 11466 thorax. Radiat.Prot.Dosim. 90(4), 423-427. 11467
Marsh J.W., Gregoratto, D., Karcher, K., Nosske D., Bessa Y., Blanchardon E., Hofmann W., 11468 Tomasek L., 2011. Dosimetric calculations for uranium miners for epidemiological studies. 11469 Radiat Prot Dos pp. 1-13, doi:10.1093/rpd/ncr310.. 11470
Mausner, L.F., 1982. Inhalation exposures at a thorium refinery. Health Phys. 42, 231–236. 11471 Moody, J.C., Davies, C.P., Stradling, G.N., 1994b. Biokinetics of thorium and daughter radionuclides 11472
after deposition in the rat lung as fluoride and hydroxide. In: Mohr, U., Dungworth, D.L., 11473 Mauderly, J.L., Oberdörster, G. (Eds.), Proc. Fourth International Inhalation Symposium, 11474 Hannover, March 1-5, 1993. Toxic and Carcinogenic Effects of Solid Particles in the 11475 Respiratory System, pp. 611-614. 11476
Moody, J.C., Stradling, G.N., Pearce, M.J., Gray, S.A., 1994a. Biokinetics of thorium and daughter 11477 radionuclides after deposition in the rat lung as nitrate: implications for human exposure. 11478 NRPB–M525, Chilton, UK. 11479
Moody, J.C., Stradling, G.N., 1992. Biokinetics of thorium and daughter radionuclides after 11480 deposition in the rat lung. J. Aerosol Sci. 23, Suppl. 1, S523–S526. 11481
Newton, D., Rundo, J., Eakins, J.D., 1981. Long term retention of 228Th following accidental intake. 11482 Health Phys. 40, 291–298. 11483
Pavlovskaya, N.A., Provotorov, A.V., Makeeva, L.G., 1971. Absorption of thorium from the 11484 gastrointestinal tract into blood of rats and build-up in organs and tissues. Gig. Sanit. 36, 11485 47-50. 11486
Reif, R.H., 1994. Evaluation of in vitro dissolution rates of thorium in uranium mill tailings. Health 11487 Phys., 67, 545-547. 11488
Roth, P., Höllriegl, V., Li, W.B., Oeh, U., Schramel, P., 2005. Validating an important aspect of the 11489 new ICRP biokinetic model of thorium. Health Phys 88, 223-228. 11490
Rundo, J., 1964. Two cases of chronic occupational exposure to radioactive materials. In: Assessment 11491 of radioactivity in man, Vol. II (Vienna: IAEA); pp. 291-306. 11492
DRAFT FOR MC REVIEW PRIOR TO CONSULTATION
288
Rundo, J., Brewster, D.R., Essling, M.A., Sha, J.Y., 1981. Radioactivity in former workers at a 11493 thorium refinery. In: Wrenn, M.E. (Ed.), Actinides in Man and Animals, Proceedings of the 11494 Snowbird Actinide Workshop, pp. 261–267. Radiobiology Division, University of Utah, 11495 Salt Lake City, RD Press. 11496
Rundo, J., Toohey, R.E., 1986. Long-term retention of thorium in lung: Report of a case. Health 11497 Phys., 50, Suppl. 1, S24. 11498
Scott, J.K., Neuman, W.F., Bonner, J.F., 1952. The distribution and excretion of thorium sulphate. J. 11499 Pharmacol. Exp. Ther. 106, 286–290. 11500
Singh, N.P., Wrenn, M.E., Ibrahim, S.A., 1983. Plutonium concentration in human tissues: 11501 Comparison to thorium. Health Phys. 44, Suppl. 1, 469-476. 11502
Singh, N.P., Zimmerman, C.J., Taylor, G.N., Wrenn, M.E., 1988. The beagle: An appropriate 11503 experimental animal for extrapolating the organ distribution pattern of thorium in humans. 11504 Health Phys. 54, 293-299. 11505
Singh, N.P., Bennett, D.D., Wrenn, M.E., 1987. Concentrations of α-emitting isotopes of U and Th 11506 in uranium miners' and millers' tissues. Health Phys., 53, 261–265. 11507
Stebbings J.H., 1985. Personal factors affecting thoron exhalation from occupationally acquired 11508 thorium body burdens. Environmental Research Division, Center for Human Radiobiology, 11509 Annual Report June 1983 – June 1984, ANL-84-103 Part II, pp. 60 – 74. Argonne National 11510 Laboratory. 11511
Stehney, A.F., Lucas, H.F., 2000. Thorium isotopes in autopsy samples from thorium workers. Health 11512 Phys. 78, 8-14. 11513
Stehney, A.F., Polednak, A.P., Rundo, J., Brues, A.M., Lucas, H.F., Patten, B.C., Rowland, R.E., 11514 1980, Health status and body radioactivity of former thorium workers. Argonne National 11515 Laboratory; NUREG/CR-1420 ANL-80-37. 11516
Stover, B.J., Atherton, D.R., Keller, N., Buster, D.S., 1960. Metabolism of the Th-228 decay series in 11517 adult beagle dogs. Radiat. Res. 12, 657-671. 11518
Stradling, G.N., Hodgson, A., Fell, T.P., Phipps, A.W., Etherington, G., 2004. Thorium Nitrate and 11519 Dioxide: Exposure Limits and Assessment of Intake and Dose after Inhalation NRPB–W57, 11520 Chilton, UK. Available at www.hpa.org.uk 11521
Stradling, G.N., Davies, C.P., Moody, J.C., Gray, S.A., Wilson, I., Ellender, M., 2005b. Biokinetics 11522 of thorium and daughter radionuclides after deposition as fluoride and hydroxide in the rat 11523 lung: implications for occupational exposure. NRPB-DA/05/2005, Chilton, UK. 11524
Stradling, G.N., Gray, S.A., Moody, J.C., Ellender, M., Pearce, M.J., 2005a. Biokinetics of thorium in 11525 the presence of a highly transportable form of uranium: implications for occupational 11526 exposure. NRPB-DA/04/2005, Chilton, UK. 11527
Strong, K.P., Levins, D.M., 1982. Effect of moisture content on radon emanation from uranium ore 11528 and tailings. Health Phys. 42, 27–32. 11529
Stuart, B.O., Jackson, P.O., 1975. The inhalation of uranium ores. In: Proceedings of the Conference 11530 on Occupational Health Experience with Uranium. Arlington, Virginia, April 28–30, 1975, 11531 ERDA 93 (Ed. Wrenn, M.E.). US Energy Research and Development Administration, pp. 11532 130–139. Available from National Technical Information Service, Springfield, Virginia. 11533
Stuart, B.O. Beasley, T.M., 1967, Non-equilibrium tissue distributions of uranium and thorium 11534 following inhalation of uranium ore by rats. In: Davies, C.N., (Ed.), Inhaled Particles and 11535 Vapours II. Proceedings of an International Symposium organised by the British 11536 Occupational Hygiene Society; Cambridge, UK. Oxford: Pergamon Press pp. 291-8. 11537
Sullivan, M.F., 1980. Absorption of Actinide Elements from the Gastrointestinal tract of rats, guinea 11538 pigs, pigs and dogs. Health Phys. 38, 159-171. 11539
Sullivan, M.F., Miller, B.M., Ryan, J.L., 1983. Absorption of thorium and protactinium from the 11540 gastrointestinal tract in adult mice and rats and neonatal rats. Health Phys. 44, 425-428. 11541
Sunta, C.M., Dang, H.S., Jaiswal, D.D., 1987. Thorium in man and environment, uptake and 11542 clearance. J. Radioanal. Nucl. Chem., 115, 149-158. 11543
DRAFT FOR MC REVIEW PRIOR TO CONSULTATION
289
Terry, K.W., Hewson, G.S., 1995. Thorium lung burdens of mineral sands workers. Health Phys. 69, 11544 233–242. 11545
Terry, K.W.,, Hewson, G.S., 1993. Retention and excretion of thorium by mineral sands industry 11546 employees. Minerals and Energy Research Institute of Western Australia; Report No. 117. 11547
Thomas, R.G., Lie, R., Scott, J.K., 1963. Thorium distribution and excretion studies I. Patterns 11548 following parenteral administration. Health Phys. 9, 153–163. 11549
Toohey R.E., Rundo, J., Sha J.Y., Essling M.A., Pedersen J.C., Slane J.M. 1985. Activity ratios of 11550 thorium daughters in vivo. Environmental Research Division, Center for Human 11551 Radiobiology, Annual Report June 1983 – June 1984, ANL-84-103 Part II, pp. 53 – 59. 11552 Argonne National Laboratory. 11553
Traikovich, M., 1970. Absorption, distribution and excretion of certain soluble compounds of natural 11554 thorium. In: Letavet, A.A., Kurlyandskaya, E.B. (Eds.), Toxicology of radioactive 11555 substances, Vol. 4: thorium-232 and uranium-238. English Translation (G.W. Dolphin, Ed.). 11556 Pergamon Press, Oxford. 11557
Wrenn, M.E., Singh, N.P., Cohen, N., Ibrahim, S.A., Saccomanno, G., 1981. Thorium in human 11558 tissues. NUREG/CR–1277, US Nuclear Regulatory Commission. Available from National 11559 Technical Information Service, Springfield, Virginia. 11560
Wrenn, M.E., Singh, N.P., Paschoa, A.S., Lloyd, R.D., and Saccomanno, G. (1985). Concentration of 11561 U and Th Isotopes in U Miners' and Millers' Tissues. NUREG/CR 4382, U.S. Nuclear 11562 Regulatory Commission, Washington, D.C. Available from National Technical Information 11563 Service, Springfield, Virginia. 11564
11565
DRAFT FOR MC REVIEW PRIOR TO CONSULTATION
290
11566 15. URANIUM (Z = 92) 11567
11568 15.1. Chemical forms in the workplace 11569 11570
(883) Uranium is an actinide element which mainly occurs in oxidation states IV and VI. It 11571 is encountered in industry in a variety of chemical and physical forms, including oxides (UO3, 11572 UO4, UO2, U3O8, uranates), inorganic salts (nitrates, chlorides, fluorides, carbonates, 11573 phosphates) and some organic compounds (acetylacetonate, Tri-Butyl-Phosphate). Some 11574 forms, notably the metal, carbide and oxide may be encountered as depleted uranium (~ 0.2% 11575 235U), natural (0.7% 235U) or enriched (>0.7% 235U) uranium. The chemical behavior of any 11576 given uranium compound will be similar irrespective of whether it is present in natural, 11577 depleted or enriched form. Depleted uranium has found use as a shielding material in 11578 aeronautics and military applications such as counterweights for aircraft control surfaces. 11579 238U, 235U, and 234U, are the three major isotopes and 235U is typically the main fissile material 11580 for nuclear power reactors. It should be noted that intakes of the more readily absorbed 11581 uranium compounds are limited by considerations of chemical toxicity rather than radiation 11582 dose (ICRP, 1997). 11583 11584
Table 15-1. Isotopes of uranium addressed in this report 11585 11586
Isotope Physical half-life Decay mode U-230 20.8 d A U-231 4.2 d EC, A U-232 68.9 y A U-233 1.592E+5 y A U-234a 2.455E+5 y A U-235a 7.04E+8 y A U-235m 26 m IT U-236 2.342E+7 y A U-237 6.75 d B- U-238a 4.468E+9 y A,SF U-239 23.45 m B- U-240 14.1 h B- U-242 16.8 m B-
a Data for these radionuclides are given in the printed copy of this report. Data for other 11587 radionuclides are given on accompanying electronic disk. 11588
11589 15.2. Routes of Intake 11590 11591 15.2.1. Inhalation 11592 11593
(884) There is extensive information available on the behaviour of uranium after 11594 deposition in the respiratory tract from animal experiments (mainly in rats), in vitro 11595 dissolution studies, and some accidental human intakes. Much of this information has been 11596 obtained since the issue of Publication 30 (ICRP, 1979). Absorption parameter values have 11597 been derived from the results of animal and in vitro studies for a wide range of compounds 11598 encountered in the nuclear fuel industry. Ansoborlo et al. (2002) and Stradling et al. (2002) 11599 compiled absorption parameter values derived from the results of a large number of in vivo 11600
DRAFT FOR MC REVIEW PRIOR TO CONSULTATION
291
and in vitro studies carried out on materials from French and UK nuclear fuel fabrication 11601 facilities. 11602
(885) Absorption parameter values and Types, and associated fA values for particulate 11603 forms of uranium are given in Table 15-2. 11604 11605 Absorption parameter values and Types 11606 11607 Uranium hexafluoride (UF6) 11608
(886) Uranium hexafluoride exists in vapour form, but in the presence of water in the 11609 atmosphere and in the respiratory tract it is converted to uranyl fluoride (UO2F2) aerosol. 11610 Generally, any exposure would be to both chemical forms simultaneously, and also to HF 11611 fumes. Hence, the mixture is treated here as an aerosol rather than a vapour. In experiments 11612 with beagle dogs (Morrow et al., 1982), 80% of the initial lung deposit (ILD) of uranium was 11613 absorbed into blood within 20 minutes. The rapid urinary excretion observed after accidental 11614 inhalation exposures by humans (Boback, 1975, Beau and Chalabreysse, 1989, Fisher et al., 11615 1991) indicates assignment to default Type F. The rapid absorption half-time was estimated 11616 by the task group to be 45 minutes (sr = 22 d-1) from the data of Fisher et al. (1991). 11617 Absorption parameter values derived here from urinary excretion data presented by Beau and 11618 Chalabreysse (1989) are fr = 1 and sr = 1.6 d–1. Bailey and Davis (2002) derived absorption 11619 parameter values of fr = 1 and sr = 1.5 d–1 from daily urinary excretion data presented by 11620 Moore and Kathren (1985) for an accidental intake by a worker (Case G) described by 11621 Boback (1975). However, the detailed data for the first two days after exposure reported by 11622 Boback (1975) show faster absorption (sr ~100 d–1) of much of the uranium. In view of the 11623 wide range of values of sr derived from the studies above, these data are judged to be an 11624 insufficient basis to provide specific absorption parameter values and UF6 is therefore 11625 assigned to Type F. 11626 11627 Uranyl Tri-Butyl-Phosphate (U-TBP) 11628
(887) Tri-n-Butyl-Phosphate (TBP) is used extensively as an extractant during fabrication 11629 of nuclear fuel and for the separation of uranium and plutonium during reprocessing. After 11630 administration of U-TBP to rats by intratracheal instillation, 80–90% of the U was absorbed 11631 into blood by about 1 d after exposure (Pellow et al., 1996; 1997). Absorption parameter 11632 values derived from the results by Stradling et al. (2002) were fr = 0.97, sr = 12 d–1 and ss = 11633 0.0021 d–1. From results of a complementary gavage experiment it was estimated that 11634 fractional absorption from the alimentary tract fA = 0.022. 11635
(888) Specific absorption parameter values of fr = 0.97, sr = 12 d–1 and ss = 0.002 d–1 11636 (consistent with assignment to default Type F) and fA = 0.02 are used here for U-TBP. 11637 11638 Uranyl nitrate (UO2(NO3)2) 11639
(889) Uranyl nitrate in aqueous solution is widely encountered in nuclear fuel fabrication 11640 and reprocessing. Ballou et al. (1986) followed the biokinetics of 232U and 233U in rats for 200 11641 days after inhalation of aerosols of aqueous uranyl nitrate solution: 15–45% ILD was retained 11642 in the lung at 30 d, depending on particle size, supporting assignment to default Type M. 11643 Measurements made after intratracheal instillation into rat lungs are consistent with 11644 assignment to default Type F (Cooper et al., 1982, Ellender, 1987, Stradling et al., 2005). 11645 Ballou et al. (1986) reported that 1 hour after instillation of 232U or 233U nitrate, only 22% 11646 ILD remained in the lungs, with systemic uptake of at least 40% ILD. Hodgson et al. (2000) 11647 derived absorption parameter values of fr = 0.93, sr = 3 d-1 and ss = 0.005 d–1 from the results 11648

DRAFT FOR MC REVIEW PRIOR TO CONSULTATION
292
of the study by Ellender (1987) in which the biokinetics of uranium were followed for 30 11649 days after intratracheal instillation of uranyl nitrate. The available human and animal data 11650 indicate that a value of 0.02 for fractional absorption in the alimentary tract is appropriate for 11651 occupational exposures to UO2(NO3)2.6H2O. 11652
(890) Specific absorption parameter values of fr = 0.9, sr = 3 d-1 and ss = 0.005 d–1 11653 (consistent with assignment to default Type F) and fA = 0.02 are used here for uranyl nitrate. 11654 11655 Ammonium diuranate (ADU) (NH4)2U2O7 11656
(891) ADU is a basic product in the uranium fuel cycle, a component of “yellow cake” (a 11657 generic term for material which may comprise ADU, U3O8 or a mixture of both). Stradling et 11658 al. (1987) followed the biokinetics of uranium for 360 days after inhalation of ADU by rats. 11659 At 7 days, 11% ILD remained in the lung and 70% ILD was absorbed into blood. From these 11660 results, Hodgson et al. (2000) derived parameter values of fr = 0.85 and sr = 0.78 d-1: the value 11661 of ss was too low to be determined and was taken to be 0.005 d-1. Ansoborlo et al. (2002) 11662 derived parameter values of fr = 0.71, sr = 0.61 d–1 and ss = 0.019 d–1 from the results of a 11663 study in which the biokinetics of uranium were followed for 30 days after intratracheal 11664 instillation of ADU into rats. 11665
(892) Specific absorption parameter values of fr = 0.8, sr = 0.7 d–1 and ss = 0.02 d–1 11666 (consistent with assignment to default Type F) are used here for ADU. 11667 11668 Uranium peroxide hydrate (UO4.nH2O) 11669
(893) Uranium peroxide hydrate is present at one stage of the enriched uranium fuel cycle. 11670 This compound, also expressed as UO3.H2O2.H2O, is very similar to uranium trioxide 11671 UO3.nH2O. The dissolution and biokinetic behaviour of both compounds are very sensitive to 11672 the hydration state (n can vary between 0 and 2.5). One main characteristic of UO4.nH2O is 11673 that it consists of small needles with an average AMAD of about 1.1 µm. Assessments of the 11674 physico-chemical and biokinetic properties of UO4, both in vitro and in vivo, have been 11675 carried out (Ansoborlo et al., 1998a). The biokinetics of uranium were followed for 90 days 11676 after intratracheal administration to rats. By 7 d after exposure 3–10% of uranium remained in 11677 the lungs, whereas about 65% was absorbed into blood. The calculated absorption parameter 11678 values were: fr = 0.87, sr = 0.93 d–1 and ss = 0.024 d–1 (Ansoborlo et al., 1998a). Experimental 11679 data on ingestion of UO4 by laboratory animals, reviewed by Leggett and Harrison (1995), 11680 suggest that absorption in the alimentary tract is about 0.5 times that of uranyl nitrate, which 11681 is taken here to be 0.02 (see above). 11682
(894) Specific absorption parameter values of fr = 0.9, sr = 0.9 d–1 and ss = 0.02 d–1 11683 (consistent with assignment to default Type F) and fA = 0.01 are used here for uranium 11684 peroxide hydrate. 11685 11686 Uranium trioxide (UO3.nH2O) 11687
(895) In the fuel fabrication cycle, uranium trioxide is formed by heating uranyl nitrate and 11688 is then reduced to form UO2. The biokinetic behaviour of UO3.nH2O is very sensitive to the 11689 hydration state and its solubility depends on the value of n. 11690
(896) Harris (1961) measured excretion of uranium following repeated inhalation of UO3 11691 by a volunteer. There was considerable clearance to urine and faeces over the first few days 11692 after each intake, indicating rapid absortion from the lower, but not from the upper, 11693 respiratory tract. The reported measurements are not straightforward to interpret, but a 11694 reasonable fit to the excretion data in the two days following the first intake was obtained 11695 here with fr = 0.5 and sr = 0.15 d–1. Morrow et al. (1972) followed the biokinetics of uranium 11696

DRAFT FOR MC REVIEW PRIOR TO CONSULTATION
293
for 218 days after inhalation of UO3 by dogs. Clearance from the airways was mainly to 11697 faeces in the first day, while subsequent lung clearance was rapid, with predominantly urinary 11698 excretion. Parameter values derived here from lung retention were: fr = 0.82, sr = 0.15 d–1 and 11699 ss = 0.019 d–1 (consistent with assignment to default Type F). 11700
(897) Hodgson et al. (2000) derived absorption parameter values from the results of a 11701 study by Stradling et al. (1985b) in which the biokinetics of uranium were followed for 168 11702 days after inhalation of UO3 by rats: fr = 0.92, sr = 1.4 d–1, ss = 0.0036 d–1 (consistent with 11703 assignment to default Type F). Ansoborlo et al. (2002) derived absorption parameter values 11704 from the results of a study in which the biokinetics of uranium were followed for 30 days 11705 after intratracheal instillation of UO3 into rats: fr = 0.71, sr = 0.28 d–1 and ss = 0.0011 d–1 11706 (consistent with assignment to default Type M). ICRP (2002), as a worked example, derived 11707 absorption parameter values from the results of a study by Moody et al. (1997) in which the 11708 biokinetics of uranium were followed for 42 days after intratracheal instillation of UO3 into 11709 rats: fr = 0.77, sr = 9.2 d–1, ss = 0.0017 d–1 (consistent with assignment to default Type M). 11710 Experimental data on ingestion of UO3 by laboratory animals, reviewed by Leggett and 11711 Harrison (1995), suggest that absorption in the alimentary tract is about 0.5 times that of 11712 uranyl nitrate, which is taken here to be 0.02 (see above). 11713
(898) Specific absorption parameter values of fr = 0.8, sr = 1 d–1 and ss = 0.01 d–1 11714 (consistent with assignment to default Type M) and fA = 0.01 are used here for UO3. 11715 11716 Uranium tetrafluoride (UF4) 11717
(899) Uranium tetrafluoride is an intermediate product in the uranium fuel cycle. It can be 11718 reduced to uranium metal or oxidized by fluorine to form UF6. The reported biokinetic 11719 behaviour of UF4 is complex. Measurement of urinary excretion after inhalation by workers 11720 (Chalabreysse et al., 1989) and experiments in rats and baboons (Stradling et al., 1985a, 11721 André et al., 1989, Ansoborlo et al., 1990) showed that a large fraction (35–40%) of the lung 11722 deposit was absorbed to the blood by 7 d after administration. However, considerable 11723 variations in behaviour were observed, with some experiments indicating assignment to 11724 default Type F and others to default Type M. 11725
(900) Zhao and Zhao (1990) reported measurements of urinary excretion of uranium made 11726 for three years after an accidental inhalation of UF4 powder by a worker. The excretion rate, 11727 initially very low, increased to a peak at about 2 months, and then declined. To represent this 11728 behaviour, the alternative HRTM representation of dissolution was applied here, in which 11729 material is deposited in a compartment representing “Particles in initial state”, in which it 11730 dissolves at a rate sp, and is simultaneously transferred at a rate spt to a compartment 11731 representing “Particles in transformed state”, in which material dissolves at a rate st. Material 11732 specific parameter values were derived here: sp = 0.000002 d–1; spt = 0.02 d–1; st = 0.04 d–1; 11733 with fA = 0.0002. However, it was not possible to fit a peak as sharp as that observed. The 11734 unusual behaviour may have been caused in part by the size of the intake, which was 11735 sufficient to give rise to biochemical indications of kidney dysfunction. 11736
(901) Hodgson et al. (2000) derived absorption parameter values from the results of a 11737 study by Stradling et al. (1985a) in which the biokinetics of uranium in rats were followed for 11738 360 days after inhalation and 168 days after intratracheal administration of two forms of UF4: 11739 (i) fr = 0.51, sr = 0.10 d–1, ss = 0.0074 d–1; (ii) fr = 0.52, sr = 0.11 d–1, ss = 0.0039 d–1. Chazel et 11740 al, (2000a) derived parameter values of fr = 0.58, sr = 0.21 d–1 and ss = 0.026 d–1 from the 11741 results of a study in which the biokinetics of uranium were followed for 30 days after 11742 intratracheal instillation of UF4 into rats. Experimental data on ingestion of UF4 by laboratory 11743 animals, reviewed by Leggett and Harrison (1995), suggest that absorption in the alimentary 11744

DRAFT FOR MC REVIEW PRIOR TO CONSULTATION
294
tract is about 0.003-0.02 times that of uranyl nitrate, which is taken here to be 0.02 (see 11745 above). A central value of 0.01 times that of uranyl nitrate is applied here. 11746
(902) Specific absorption parameter values of fr = 0.6, sr = 0.15 d–1 and ss = 0.005 d–1 11747 (consistent with assignment to default Type M) and fA = 0.0002 are used here for UF4. 11748 11749 Uranyl acetylacetonate 11750
(903) Uranyl acetylacetonate is an organic complex of uranium with military applications. 11751 In vitro dissolution tests in simulated lung fluid led to the classification of 50% Class D and 11752 50% Class W (Fisher and Briant, 1994). Absorption parameter values calculated here are fr = 11753 0.52, sr = 2.5 d–1 and ss = 0.026 d–1, corresponding to default Type M. These data (in vitro 11754 only) are judged to be an insufficient basis to propose specific absorption parameter values 11755 and uranyl acetylacetonate is therefore assigned to Type M. 11756 11757 Uranium aluminide 11758
(904) As part of an epidemiological study, Leggett et al. (2005) estimated doses for 11759 workers exposed to airborne uranium aluminide (UAlx) during the fabrication of reactor fuel 11760 plates. Occupational monitoring data included air concentrations, urine, fecal and lung 11761 measurements with observation periods exceeding two years in several cases. In workers who 11762 were removed from exposure, the rate of urinary excretion of uranium increased for a few 11763 months, peaked, and then declined at a rate consistent with moderately soluble uranium. To 11764 represent this behaviour, the authors applied the alternative HRTM representation of 11765 dissolution, in which material is deposited in a compartment representing “Particles in initial 11766 state”, in which it dissolves at a rate sp, and is simultaneously transferred at a rate spt to a 11767 compartment representing “Particles in transformed state”, in which material dissolves at a 11768 rate st. They derived material specific parameter values: sp = 0.0001 d–1, spt = 0.004 d–1, st = 11769 0.004 d–1, with fA taken to be 0.002. These parameter values are adopted here for uranium 11770 aluminide. 11771 11772 Uranium octoxide (U3O8) 11773
(905) Uranium octoxide can be present in the ore concentrate (“yellow cake”, see ADU 11774 above) and also occurs at later stages in the uranium fuel cycle. Human data from accidental 11775 intakes of U3O8 (Saxby et al., 1964, West et al., 1979, Eidson, 1990), and from monitoring 11776 data for workers in processing facilities (Barber and Forrest, 1995, Chalabreysse et al., 1989), 11777 animal studies using rats, dogs and monkeys (Métivier et al., 1992, Stradling et al., 1989), and 11778 in vitro studies (Eidson, 1994, Ansoborlo et al., 1998a, Chazel et al., 1998) have shown that 11779 the biokinetic behaviour of this compound depends on the particular process of manufacture. 11780 A study of the influence of specific surface area (SSA) (Chazel et al., 1998) demonstrated the 11781 importance of this parameter on dissolution characteristics. When the SSA increased from 0.7 11782 to 16 m2 g–1, the rapidly dissolved fraction, fr, increased from 0.01 to 0.20. At 30 d after 11783 intake by rats and baboons, lung retention and total urinary excretion were 50-90% and 2–11784 10%, respectively, of the initial lung deposit. 11785
(906) Ansoborlo et al. (2002) derived absorption parameter values from the results of 11786 studies in which the biokinetics of uranium were followed for 90 days after intratracheal 11787 instillation into rats of two forms of U3O8: (i) fr = 0.046, sr = 2.25 d–1 and ss = 0.0012 d–1; (ii) 11788 fr = 0.03, sr = 2.07 d–1 and ss = 0.00038 d–1. Hodgson et al. (2000) derived absorption 11789 parameter values from the results of a study by Stradling et al. (1987) in which the biokinetics 11790 of uranium were followed for 360 days after inhalation by rats of uranium ore concentrate 11791 (95% U3O8, 5% UO2); fr = 0.044, sr = 0.49 d–1 and ss = 0.00035 d–1. Experimental data on 11792

DRAFT FOR MC REVIEW PRIOR TO CONSULTATION
295
ingestion of U3O8 by laboratory animals, reviewed by Leggett and Harrison (1995), suggest 11793 that absorption in the alimentary tract is about 0.01 times that of uranyl nitrate, which is taken 11794 here to be 0.02 (see above). 11795
(907) Specific absorption parameter values of fr = 0.04, sr = 1 d–1 and ss = 0.0006 d–1 11796 (consistent with assignment to default Type S) and fA = 0.0002 are used here for U3O8. 11797 11798 Uranium dioxide (UO2) 11799
(908) Uranium dioxide is the final product in the manufacture of nuclear fuel pellets, and 11800 is also present as depleted uranium in mixed oxide fuel (MOX). Manufacturing processes of 11801 UO2 differ from one industry to another. Human studies have shown that UO2 can be very 11802 insoluble (Pomroy and Noel, 1981, Price, 1989, Schieferdecker et al., 1985). Experiments in 11803 rats, dogs, monkeys and baboons (Leach et al., 1973, Stradling et al., 1988, Métivier et al., 11804 1992) also support the assignment of UO2 to default Type S. At 30 d after intake by rats and 11805 baboons, the total urinary excretion was 1–4% ILD and lung retention was 60-90% ILD. The 11806 effect of SSA on dissolution has been investigated (Chazel et al., 2000b), but in contrast to 11807 U3O8 (see above), no clear effect was observed. For compounds with SSA varying from 1.0 to 11808 4.4 m2 g–1, fr values were from 0.003 to 0.004. 11809
(909) Ansoborlo et al. (2002) derived absorption parameter values from the results of 11810 studies in which the biokinetics of uranium were followed for 75 or 90 days after intratracheal 11811 instillation into rats of three forms of UO2: (i) fr = 0.03, sr = 1.25 d–1 and ss = 0.0015 d–1; (ii) fr 11812 = 0.01, sr not determined and ss = 0.00049 d–1 (iii) fr = 0.01, sr not determined and ss = 11813 0.00058 d–1. Hodgson et al. (2000) derived absorption parameter values from the results of a 11814 study by Stradling et al. (1988) in which the biokinetics of uranium were followed for 315 11815 days after inhalation by rats of two forms of UO2; (non-ceramic) fr = 0.011, sr = 0.95 d–1 and 11816 ss = 0.00061 d–1; (ceramic) fr = 0.008, sr = 1.3 d–1 and ss = 0.00026 d–1. All but the first of 11817 these five sets of parameter values are consistent with assignment to default Type S. 11818 Experimental data on ingestion of UO2 by laboratory animals, reviewed by Leggett and 11819 Harrison (1995), suggest that absorption in the alimentary tract is about 0.1-0.01 times that of 11820 uranyl nitrate, which is taken here to be 0.02 (see above). Since data on U3O8 (which tends to 11821 dissolve somewhat more rapidly in the lungs than UO2) suggest that absorption in the 11822 alimentary tract is about 0.01 times that of uranyl nitrate, the lower value is applied here. 11823
(910) Specific absorption parameter values of fr = 0.015, sr = 1 d–1 and ss = 0.0005 d–1 11824 (consistent with assignment to default Type S) and fA = 0.0002 are used here for UO2. 11825 11826 Vaporised uranium metal 11827
(911) A new method for uranium enrichment, based on laser isotopic separation, can 11828 produce three different types of aerosol identified as variable mixtures of Umetal + UO2 + 11829 U3O8, with different particle size distributions. Ansoborlo et al. (1998b, 2002) derived 11830 absorption parameter values from the results of studies in which the biokinetics of uranium 11831 were followed for 126 or 168 days after intratracheal instillation into rats of three such 11832 materials: (i) fr = 0.36, sr = 1.44 d–1 and ss = 0.0046 d–1; (ii) fr = 0.20, sr = 0.68 d–1 and ss = 11833 0.00094 d–1 ;(iii) fr = 0.12, sr = 1.45 d–1 and ss = 0.0026 d–1 (all consistent with assignment to 11834 default Type M). 11835
(912) In view of the wide range of values of ss derived in the study above, these data are 11836 judged to be an insufficient basis to propose specific absorption parameter values and 11837 vaporised uranium metal is therefore assigned to Type M. 11838 11839 Uranium ore dust 11840
DRAFT FOR MC REVIEW PRIOR TO CONSULTATION
296
(913) Duport et al. (1991) measured the dissolution in simulated lung fluid of long lived 11841 radionuclides in uranium ore dust from Canadian mines (and also in samples of yellowcake 11842 and refined oxides). (For further information see the section below on decay products of 11843 uranium formed in the lungs.) Factors including ore grade (uranium content), particle size, 11844 and solution pH were investigated. For high grade ore, measurements were made for up to 60 11845 days, on particles in size ranges that included respirable particles. Results were presented as 11846 undissolved fractions as functions of time, and showed two components, which were 11847 expressed as Class D (rapid) and Class Y (slow) fractions. For 238U, the rapidly dissolved 11848 fraction was ~0.25 indicating assignment to Type M. No effect of size was observed in total 11849 dissolution over 40 days for particles in size ranges 7–10, 3–7, 1–3 and <1 µm. For low grade 11850 and medium grade ores, measurements were made for 12 days, but only on samples of 11851 relatively coarse dust, the smallest fraction being <37 µm. For 238U, rapidly dissolved 11852 fractions were greater than those measured in the high grade ores; about 0.33 and 0.5 for low 11853 and medium grade ores respectively. 11854
(914) Bečková and Malátová (2008) measured dissolution for 26 days of 238U, 234U and 11855 230Th in simulated serum ultrafiltrate of uranium ore dust collected on personal air filters in a 11856 mine in the Czech Republic. Retention (undissolved) was represented by a two-component 11857 exponential function, giving parameter values for 238U of fr = 0.14, sr = 0.49 d–1 and ss = 0.004 11858 d–1 and assignment to Type M. Dissolution of 234U was somewhat faster, as expected due to 11859 recoil phenomena: fr = 0.18, sr = 0.49 d–1 and ss = 0.006 d–1. (For further information see the 11860 section below on decay products of uranium formed in the lungs, and the thorium inhalation 11861 section.) 11862
(915) Marsh et al. (2011) estimated the following parameter values for dissolution of 11863 uranium from ore dust, based on the results of both Duport et al. (1991) (high grade ore) and 11864 those of Bečková and Malátová (2008): fr = 0.2, sr = 0.8 d–1 and ss = 0.0014 d–1. 11865
(916) For a summary of in vivo and autopsy studies relating to uranium ore dust see the 11866 section below on decay products of uranium formed in the lungs. 11867 11868 Depleted uranium (DU) 11869
(917) Depleted uranium, a by-product of the manufacture of enriched uranium for nuclear 11870 reactor fuel, has found a number of applications resulting mainly from its high density, in 11871 particular, in anti-tank munitions, counterweights for aircraft control surfaces and radiation 11872 shielding. DU, typically alloyed with 0.75% titanium is used in ‘kinetic energy penetrators’, 11873 rods of the metal fired at very high speed (~1.5 km s–1). On impact with a hard object such as 11874 armour plate, a significant fraction of the penetrator mass may be converted to an aerosol that 11875 could be inhaled by persons in the vicinity or downwind. In vitro tests have shown 11876 considerable variability in that 1–50% of the respirable material dissolves rapidly, and the rest 11877 very slowly, while X-ray analyses indicate that the uranium is present as a mixture of oxides 11878 including U3O7, U3O8, U4O9, and UO2, but also combinations with other metals (Glissmeyer 11879 and Mishima, 1979, Scripsick et al.,1985a, 1985b, Chazel et al., 2003, Mitchel and Sunder, 11880 2004). In vitro dissolution tests carried out by Chazel et al. (2003) gave dissolution parameter 11881 values in the following ranges: fr = 0.47–0.57, sr = 0.06 – 0.07 d–1 and ss = 0.00018 to 11882 0.00034 d–1, giving assignment to Type M. 11883
(918) In the comprehensive Capstone DU Aerosol Study, aerosols formed when DU 11884 rounds penetrated armoured vehicles were used in studies of dissolution in simulated lung 11885 fluid, making measurements over 46 days on a total of 27 samples (Parkhurst et al., 2004a, 11886 2004b; Parkhurst and Guilmette, 2009; Guilmette and Cheng, 2009). Dissolution was fitted 11887 by two- or three-component exponential functions. Based on the two-component fits, there 11888
DRAFT FOR MC REVIEW PRIOR TO CONSULTATION
297
was a rapidly dissolving fraction of 1-28% (geometric mean, GM, 12.5%), with an associated 11889 rapid dissolution rate of 0.1-30 d-1 (GM 6 d-1; corresponding half-time, t1/2 = 0.12 d). The 11890 remaining fraction dissolved at a slow rate of 0.0004-0.0095 d-1 (GM 0.0026 d-1: t1/2 = 268 d). 11891 Thus there was considerable variation between samples, especially in the fraction that 11892 dissolved rapidly. There appeared to be some correlation between the initial and final 11893 dissolution rates: the greater the dissolution in the first day, the faster the long term 11894 dissolution rate. Based on extrapolation of the three-component exponential function where 11895 available (two-component otherwise), 24 samples would be assigned to Type M and three to 11896 Type S. Several sets of measurements were made on different stages from the same cascade 11897 cyclone. However, there was no clear trend of dissolution with particle size and in some cases 11898 the back-up filter, with the smallest particles, showed the slowest dissolution. Two 11899 confounding factors were noted: (1) cyclone cut-offs are not sharp, so there was considerable 11900 overlap in size distribution between stages (2) scanning electron microscope examination 11901 showed great heterogeneity of particle composition, shape etc. 11902
(919) Mitchel and Sunder (2004) followed urinary excretion of uranium for 7 days after 11903 intratracheal instillation into rats of the <50-µm fraction of dust obtained from impact of DU 11904 munitions on armour plate. Results indicate that about 10% ILD dissolved during 7 days, 11905 about half of it within 1 day. However, the large size suggests that the material was from 11906 surface deposits rather than air samples, and may not be representative of dust that might be 11907 inhaled. 11908
(920) If large pieces of uranium metal are subjected to fire (e.g. in a burning vehicle or 11909 aircraft crash - generally depleted uranium is used in applications which require only the non-11910 fissile properties of uranium) they will gradually oxidise and some of the oxide may be 11911 dispersed and inhaled. In vitro tests have shown that 0.5–10% of the respirable material 11912 dissolves rapidly, and the rest very slowly, while X-ray analyses indicate that most of the 11913 uranium is present as U3O8 (Mishima et al., 1985, Elder and Tinkle, 1980, Scripsick et al., 11914 1985a, OSAGWI, 2000). Default Type M should be assumed. 11915
(921) Overall, the available data show that the dissolution and lung absorption of 11916 particulate DU, whether formed by the impact of kinetic energy penetrators, or in fires, is very 11917 variable. It is therefore judged to be inappropriate to propose specific absorption parameter 11918 values and DU is therefore assigned to default Type M. 11919 11920 Irradiated fuel fragments 11921
(922) Following an accidental release from a nuclear reactor, fission and activation 11922 products may be present in fragments of irradiated fuel, of which the matrix is predominantly 11923 uranium dioxide (Devell, 1988, Begichev et al., 1989, Toivonen et al., 1992). In studies of the 11924 in vitro dissolution of particles released from the Chernobyl accident, seven out of ten of 11925 which consisted mainly of uranium (Cuddihy et al., 1989), the data obtained were consistent 11926 with assignment of all the γ-emitting radionuclides to Type M. 11927 11928 Decay products of uranium formed in the respiratory tract 11929
(923) Decay schemes of uranium isotopes in the natural decay series: 234U, 238U and 235U, 11930 are described in Figure 15-1 and Figure 15-2. The 232Th decay series is shown in the thorium 11931 inhalation section (Figure 14-1): it is relevant to 232U, which decays to 228Th, a descendent of 11932 232Th. 11933 11934 11935
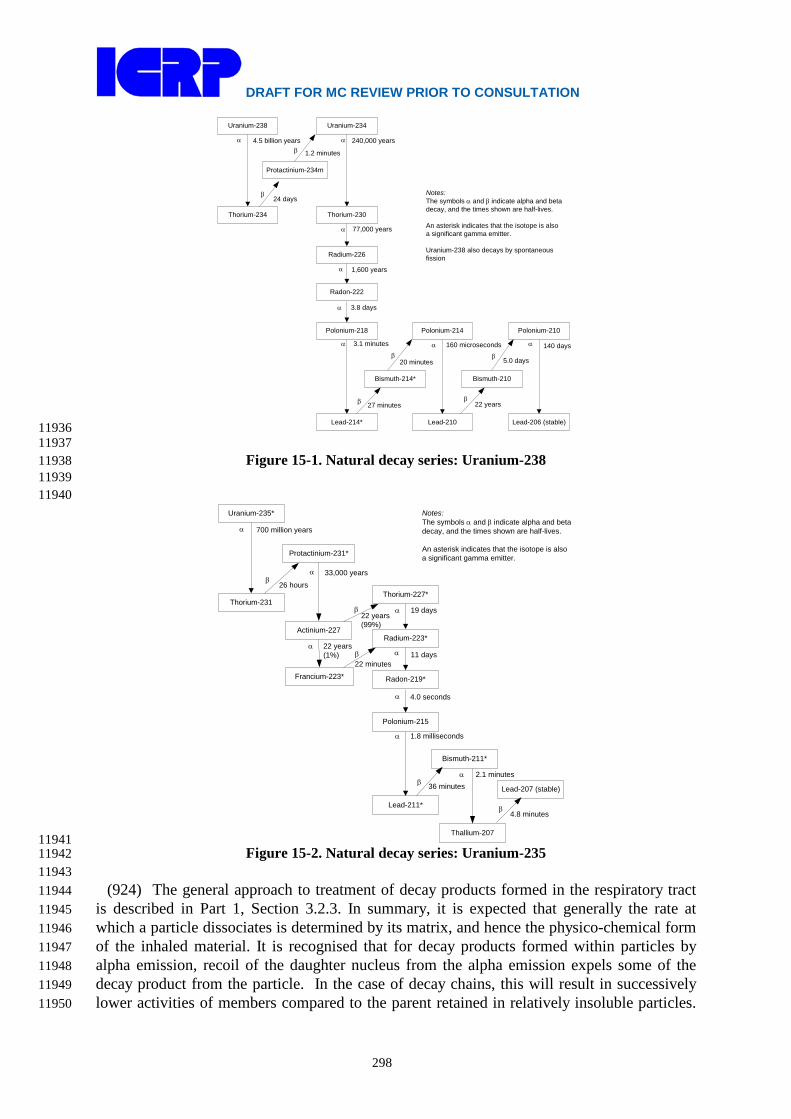
DRAFT FOR MC REVIEW PRIOR TO CONSULTATION
298
Uranium-238
Thorium-234
Uranium-234
Thorium-230
Radium-226
Radon-222
Protactinium-234m
Polonium-218
Lead-214*
Polonium-214 Polonium-210
Lead-210 Lead-206 (stable)
Bismuth-214* Bismuth-210
4.5 billion yearsα α 240,000 years
1.2 minutesβ
β24 days
77,000 years
1,600 years
3.8 days
3.1 minutes 160 microseconds 140 days
5.0 days
α
α
α
α α
22 years27 minutesβ β
β
α
β20 minutes
Notes:The symbols α and β indicate alpha and beta decay, and the times shown are half-lives.
An asterisk indicates that the isotope is also a significant gamma emitter.
Uranium-238 also decays by spontaneous fission
11936 11937
Figure 15-1. Natural decay series: Uranium-238 11938 11939
11940 Uranium-235*
Thorium-231Thorium-227*
Radium-223*
Radon-219*
Protactinium-231*
Polonium-215
Lead-211*
Actinium-227
Thallium-207
Francium-223*
Bismuth-211*
Lead-207 (stable)
700 million yearsα
β26 hours
19 days
11 days
4.0 seconds
1.8 milliseconds
2.1 minutes
α
α
α
α
α
4.8 minutes
36 minutesβ
β
α 33,000 years
Notes:The symbols α and β indicate alpha and beta decay, and the times shown are half-lives.
An asterisk indicates that the isotope is also a significant gamma emitter.
22 years (1%)
α
22 years (99%)
β
β
22 minutes
11941 Figure 15-2. Natural decay series: Uranium-235 11942
11943 (924) The general approach to treatment of decay products formed in the respiratory tract 11944
is described in Part 1, Section 3.2.3. In summary, it is expected that generally the rate at 11945 which a particle dissociates is determined by its matrix, and hence the physico-chemical form 11946 of the inhaled material. It is recognised that for decay products formed within particles by 11947 alpha emission, recoil of the daughter nucleus from the alpha emission expels some of the 11948 decay product from the particle. In the case of decay chains, this will result in successively 11949 lower activities of members compared to the parent retained in relatively insoluble particles. 11950

DRAFT FOR MC REVIEW PRIOR TO CONSULTATION
299
Experimental evidence relating to this is described in the section on relatively insoluble (Type 11951 S) forms of thorium formed in the respiratory tract. However, it was considered impractical 11952 to implement loss of decay products by alpha recoil in the calculation of dose coefficients and 11953 bioassay functions in this series of documents. (For further information see Part 1, Section 11954 3.2.3.) Nevertheless, this phenomenon should be borne in mind, especially when using decay 11955 products to monitor intakes and doses of the parent, which can be applicable to uranium. 11956
(925) Exceptions are made for noble gases formed as decay products, which are assumed 11957 to escape from the body directly, in addition to other routes of removal. For calculation 11958 purposes it is assumed that radon formed as a decay product within the respiratory tract 11959 escapes from the body at a rate of 100 d–1, in addition to other routes of removal. For further 11960 information see the section on relatively insoluble (Type S) forms of thorium formed in the 11961 respiratory tract. 11962
(926) It is expected that the behaviour of soluble (e.g. Type F) material in the respiratory 11963 tract would depend on its elemental form, i.e. that of the decay product. Nevertheless, for 11964 simplicity, in this series of documents the absorption parameter values of the parent are, by 11965 default, applied to all members of the decay chain formed in the respiratory tract. 11966
(927) The formation of thorium as a decay product can be of particular importance in this 11967 context, because there can be significant long-term retention of thorium in the lungs 11968 following its deposition in soluble form (see thorium inhalation section). Conversely, 11969 important decay products of thorium, notably radium and lead, in soluble forms, are (like 11970 uranium) relatively readily absorbed from the respiratory tract into the systemic circulation. 11971 Studies specifically comparing the behaviour of uranium with that of its decay products are 11972 summarised here, although it should be noted that the thorium was mainly administered with 11973 the uranium, rather than formed from decay of uranium in the respiratory tract. For more 11974 information, see also the sections on thorium, radium, polonium, lead and bismuth, relating to 11975 the behaviour of their decay products formed in the respiratory tract. 11976 11977 Relatively soluble (Type F) forms 11978
(928) As noted above, Ballou et al. (1986) studied the biokinetics of 232U and 233U in rats 11979 after inhalation of uranyl nitrate aerosols. For the main studies, the uranium was freshly 11980 separated from its decay products, and measurements were not made of decay products 11981 formed within the body. Uranium-233 has a long half-life (1.6x10⁵ years), but that of 232U is 11982 only 74 years and the authors recognised that assessment of doses from occupational exposure 11983 to 232U needed to take account of the behaviour of its decay products, especially 228Th. A 11984 complementary experiment was carried out in which tissue distributions of 232U, 228Th, 224Ra, 11985 212Pb, 212Bi and 208Tl were measured at 24 hours after intratracheal instillation into rats of 11986 232U nitrate with its decay products. Although measurements of 228Th, 224Ra, and perhaps 11987 212Pb, were mainly of material administered with the parent 232U, rather than formed from its 11988 decay in the lungs, it is reasonable to assume similar behaviour. (The physical half-lives of 11989 212Bi and 208Tl are so short, 61 minutes and 3 minutes respectively, that measurements made 11990 at 24 hours would mainly be of activity formed in situ.) Lung retention was 7.9% ILD for 11991 232U, 52% ILD for 228Th, and about 2-3% ILD for the other decay products measured, 11992 reflecting the high lung retention of thorium, and relatively rapid lung clearance of radium 11993 and lead observed in other studies in which soluble forms were administered. Similarly, the 11994 distribution between liver, skeleton and kidneys of 232U, 228Th, 224Ra and 212Pb reflected the 11995 elemental forms. The distributions of 212Bi and 208Tl were similar to those of 212Pb, 11996 presumably because of their short physical half-lives: whatever their distribution in vivo, they 11997 would tend to equilibrium between dissection and measurement. Ballou et al. noted that the 11998

DRAFT FOR MC REVIEW PRIOR TO CONSULTATION
300
greater retention of 228Th in the lungs and deposition in skeleton than of the 232U, suggested 11999 that assessments based on the assumption of shared kinetics would significantly 12000 underestimate doses. 12001
(929) Stradling et al. (2005) followed the biokinetics of uranium and thorium for 3 months 12002 after intratracheal instillation into rats of the nitrates, given separately, or together at uranium: 12003 thorium mass ratios of 5x10⁶:1 or 50:1. Their behaviour when administered separately was as 12004 expected from other studies: by 1 day ~80% ILD of uranium but only ~30% ILD of thorium 12005 had been absorbed into blood. The behaviour of thorium was not significantly affected by the 12006 presence of uranium when they were administered together (for further information see 12007 thorium inhalation section). 12008 12009 Relatively insoluble (Type M or S) forms 12010
(930) Hill (1962) noted the disequilibrium between the early long-lived members of the 12011 uranium decay series measured in a lung sample from a uranium miner, although they were 12012 probably close to equilibrium in the uranium ore to which he was exposed. The concentration 12013 of 230Th was about twice, and that of 226Ra about half, that of 238U or 234U, suggesting 12014 selective removal of radium and uranium compared to thorium. 12015
(931) Stuart and Beasley (1967) followed the biokinetics of uranium (238U + 234U) and 12016 thorium (228Th) for up to 4 months after repeated inhalation by rats of uranium ore dust 12017 (pitchblende, 25% U3O8, with uranium and thorium in secular equilibrium) over an 8-week 12018 period. Faster clearance from the lungs of uranium than thorium was observed: at 1 week 12019 after the end of exposures the thorium activity was 2 – 3 times that of 238U or 234U. Stuart and 12020 Jackson (1975) similarly found 230Th concentrations were several times those of 238U in the 12021 lungs and lymph nodes of dogs at 2 weeks or 15 months after repeated inhalation of the same 12022 uranium ore (Cross et al., 1982). They also reported that thorium concentrations in the lungs 12023 were about twice those of uranium in hamsters one year after repeated inhalation of carnotite 12024 ore dust (4% U3O8, with uranium and thorium in secular equilibrium), and several times 12025 higher in dogs after several years of daily inhalation exposure. Thus even though the material 12026 was relatively insoluble, and the thorium was present as a minor component by mass, its 12027 slower absorption from the lung than that of uranium could be observed. 12028
(932) Fisher et al. (1983) measured significantly higher activity levels of 234U and 238U 12029 than of the daughter product 230Th in both urine and fecal samples obtained from active 12030 uranium millers, indicating that uranium in the inhaled ore dust was cleared from the body 12031 with a shorter biological half-time than the daughter product 230Th. Assessment of lung 12032 clearance from the results is not straightforward, especially given the chronic and continuing 12033 exposures. Higher urinary excretion of uranium than of thorium would be expected even if 12034 absorption from the lung were at similar rates, because of the higher urinary excretion of 12035 systemic uranium. For both elements fecal clearance dominated, and given the high urinary 12036 excretion of systemic uranium, this suggests greater lung clearance by particle transport than 12037 by absorption to blood. The lower fecal excretion of thorium than of uranium suggests a 12038 lower particle transport rate, and hence that there is binding of thorium released in the lungs 12039 by dissolution. However, it was recognised by the authors that other sources of fecal excretion 12040 of uranium (dietary intakes, exposure to refined uranium which is depleted in thorium) could 12041 not be excluded. 12042
(933) In contrast, Wrenn et al. (1983) measured 230Th concentrations similar to those of 12043 234U in the lungs of five uranium miners (average 230Th/234U ratio 1.1, range 0.54–2.6). They 12044 noted that this was surprising in view of the results of the reported disequilibrium in dogs 12045 chronically exposed to carnotite (see above). An interlaboratory comparison was conducted, 12046

DRAFT FOR MC REVIEW PRIOR TO CONSULTATION
301
which showed that the difference was not due to differences in radiochemical methods (Singh 12047 et al., 1986a). In a later study (Singh et al., 1987) the same group found ratios of 1.5–3.5 in 12048 the lungs of three uranium miners and 1.1–1.3 in the lungs of two uranium millers: they 12049 concluded that overall, dissolution in the human lungs of uranium and thorium in uranium ore 12050 dust was similar. 12051
(934) As noted above, Duport et al. (1991) measured the dissolution in simulated lung 12052 fluid of long lived radionuclides in uranium ore dust from Canadian mines. For high grade 12053 ore, measurements were made for up to 60 days, on particles in size ranges that included 12054 respirable particles. For 238U, 230Th, 226Ra, and 210Pb, the rapidly dissolved fractions were 12055 0.25, 0.15, 0.12 and 0.28 respectively. Marsh et al, 2011, fitted two-component exponential 12056 functions to the data (un-dissolved fractions) and obtained the following HRTM parameter 12057 values: 12058 12059
Nuclide fr sr (d–1) ss (d–1) 230Th 0.14 4.6 0.0007 226Ra 0.11 7.3 0.0004 210Pb 0.26 3.9 0.001
12060 (935) For these radionuclides, no effects of size were observed in total dissolution over 40 12061
days for particles in size ranges 7–10, 3–7, 1–3 and <1 µm. For low grade and medium grade 12062 ores, measurements were made for 12 days, but only on samples of relatively coarse dust, the 12063 smallest fraction being <37 µm. For 238U, rapidly dissolved fractions were higher (0.33 and 12064 0.5 for low and medium grade ores) than those measured in the high grade ores. However, for 12065 other radionuclides the fractions were lower: 0.07 for 226Ra, and <0.01 for 210Pb. 12066 Measurements were also made for 232Th in low grade ore and 210Po in low and medium grade 12067 ores, and much lower fractions obtained, 0.01, 0.00 and 0.005 respectively. Consistent 12068 differences in dissolution between uranium and its decay products were not apparent. 12069
(936) As noted above, Bečková and Malátová (2008) measured dissolution for 26 days of 12070 238U, 234U and 230Th in simulated serum ultrafiltrate of uranium ore dust collected on personal 12071 air filters in a mine in the Czech Republic. Moderate dissolution of both uranium isotopes 12072 was observed, with fr = 0.14 for 238U and 0.18 for 234U, but no dissolution of 230Th was 12073 detected. 12074
(937) Griffith et al. (1980) developed a model to describe the retention of 232U and its 12075 decay products, in the lungs following inhalation in ThO2 or UO2 particles. In addition to 12076 chemical dissolution, they considered recoil emanation of daughter product nuclei by alpha-12077 particle decay, and diffusion emanation of 220Rn from particles. In complementary 12078 experiments, Coombs and Cuddihy (1983) measured the fraction of 228Th escaping by recoil 12079 and the fraction of 220Rn escaping by diffusion from size-fractionated samples of ThO2 and 12080 uranium oxide (mixture of UO2.2 and U3O8) containing 1% 232U. For further information on 12081 these and other studies relating to recoil emanation of decay products and to loss of radon 12082 formed in the respiratory tract see the section on decay products of thorium formed in the 12083 respiratory tract. 12084 12085 Rapid dissolution rate for uranium 12086
(938) Studies on the uranium compounds which are most rapidly absorbed from the lungs 12087 (uranium hexafluoride and uranyl tri-butyl-phosphate) give values of sr of about 10 d–1, which 12088 is applied here to all Type F forms of uranium in the absence of material-specific data. 12089 12090
DRAFT FOR MC REVIEW PRIOR TO CONSULTATION
302
Extent of binding of uranium to the respiratory tract 12091 (939) Experimental evidence suggests that there is little binding of uranium to the 12092
respiratory tract. Cooper et al. (1982) and Ellender (1987) followed the behaviour of 233U 12093 after instillation of uranyl nitrate and bicarbonate into the pulmonary region of the lungs of 12094 rats. Cooper et al. (1982) found that less than 2% ILD remained at 7 days. Ellender (1987) 12095 gave more information for the nitrate, for which about 8% ILD remained at 1 d and 3% at 30 12096 d. Detailed analysis, however, indicates that clearance over this period was mainly by particle 12097 transport, and that the results did not provide evidence for binding of uranium (Hodgson, et 12098 al., 2000). It is therefore assumed that for uranium the bound state can be neglected, i.e. fb = 12099 0.0. 12100 12101
DRAFT FOR MC REVIEW PRIOR TO CONSULTATION
303
Table 15-2. Absorption parameter values for inhaled and ingested uranium 12102 12103
Inhaled particulate materials
Absorption parameter valuesa
Absorption from the alimentary tract, fA
d fr sr (d–1) ss (d–1) Specific parameter valuesb Uranyl Tri-Butyl-Phosphate (U-TBP) 0.97 12 0.002 0.02 Uranyl nitrate, UO2(NO3)2 0.9 3 0.005 0.02 Uranium peroxide hydrate UO4 0.9 0.9 0.02 0.01 Ammonium diuranate, ADU 0.8 0.7 0.02 0.02
Uranium trioxide UO3 0.8 1 0.01 0.01 Uranium tetrafluoride UF4 0.6 0.15 0.005 2x10⁻⁴ Triuranium octoxide U3O8 0.04 1 6x10⁻⁴ 2x10⁻⁴ Uranium dioxide UO2 0.015 1 5x10⁻⁴ 2x10⁻⁴ Uranium aluminide UAlX c c c 0.002 Default parameter valuesd,e Absorption Type
Assigned forms
F Uranium hexafluoride, UF6 1 10 - 0.02 M Uranyl acetylacetonate; DU
aerosols from use of kinetic energy penetrators; vaporized U metal; all unspecified formsf
0.2 3 0.005 4x10⁻³
S — 0.01 3 1x10⁻⁴ 2x10⁻⁴ Ingested materials Soluble forms (Type F) – – – 0.02 Relatively insoluble forms (as assigned to Types M and S for inhalation)
– – – 0.002
a It is assumed that for uranium the bound state can be neglected, i.e. fb = 0.0. The value of sr for Type F forms 12104 of uranium (10 d–1) is element-specific. The values for Types M and S (3 d–1) are the general default values. 12105
b See text for summary of information on which parameter values are based, and on ranges of parameter values 12106 observed for individual materials. For uranium specific parameter values are used for dissolution in the lungs, 12107 and where information is available for absorption from the alimentary tract. For other materials, the default 12108 value of fA is used (footnote d). 12109
c See text: sp = 1x10⁻⁴ d–1, spt = 4x10⁻³ d–1, st = 4x10⁻³ d–1, with fA taken to be 0.002. 12110 d For inhaled material deposited in the respiratory tract and subsequent cleared by particle transport to the 12111
alimentary tract, the default fA values for inhaled materials are applied: i.e. the (rounded) product of fr for the 12112 absorption Type (or specific value where given) and the fA value for ingested soluble forms of uranium (0.02). 12113
e Materials (e.g. UF6) are listed here where there is sufficient information to assign to a default absorption Type, 12114 but not to give specific parameter values (see text). 12115
f Default Type M is recommended for use in the absence of specific information, i.e. if the form is unknown, or 12116 if the form is known but there is no information available on the absorption of that form from the respiratory 12117 tract. 12118
12119 15.2.2. Ingestion 12120 12121
(940) Data on the absorption of uranium have been reviewed by Wrenn et al. (1985), 12122 Harrison (1991), Leggett and Harrison (1995) and in ICRP Publication 69 (1995). 12123
(941) In the first controlled human study involving more than one subject, Hursh et al. 12124 (1969) administered uranyl nitrate to four hospital patients. The data obtained were taken to 12125
DRAFT FOR MC REVIEW PRIOR TO CONSULTATION
304
suggest fractional absorption in the range 0.005 - 0.05. Leggett and Harrison (1995) have 12126 interpreted the data as suggesting absorption of 0.004, 0.01, 0.02 and 0.06, respectively, for 12127 the four subjects. Wrenn et al., (1989) estimated absorption in twelve normal healthy adult 12128 volunteers given drinking water high in uranium. On the basis that 40 - 60% of absorbed U 12129 was excreted in the urine in the first three days, rather than the author’s assumption of 79%, 12130 Leggett and Harrison (1995) concluded that mean absorption was 0.01-0.015, maximum 12131 absorption was in the range 0.02-0.04, and that six subjects absorbed less than 2.5x10⁻³. 12132 Harduin et al., (1994) reported results for the absorption of U from drinking water either 12133 administered on one day or over 15 days. The data for acute administration suggested 12134 absorption of 0.005-0.05 with an average value of 0.015-0.02. The data for 15-day 12135 administration suggested absorption of 0.003-0.02 and average absorption of 0.01-0.015. In 12136 another in situ study, the gastro-intestinal absorption factor was determined for 50 12137 participants ingesting uranium at natural levels in drinking water and food. The participants, 12138 ranged in age from 13 to 87 years were selected from either a Canadian area with naturally 12139 high (2-780 µg.L-1) or low (<1µg.L-1) uranium levels. The distribution of f1 values obtained 12140 was non-Gaussian with a range of 0.001 to 0.06 and a median of 0.009 (Zamora et al, 2002). 12141 These values were not gender sensitive and independent of age at the time of the study, 12142 duration of exposure and total uranium intake. Similar results have also been obtained in a 12143 number of dietary balance studies (Larsen and Orlandini, 1984; Spencer et al., 1990; Wrenn 12144 et al., 1989; Leggett and Harrison, 1995). 12145
(942) Data from animal studies provide information on the relative uptake of U ingested in 12146 different chemical forms, showing that absorption is strongly dependent on the solubility of 12147 the compound. Measurements have been made in rats, hamsters, rabbits, dogs and baboons 12148 (reviewed by Wrenn et al., 1985; Harrison, 1991; Leggett and Harrison, 1995). Absorption 12149 appears to be greatest for U ingested as UO2(NO3)2.6H2O, U-TBP, UO2F2 or Na2U2O7, 12150 roughly half as great for UO4 or UO3, and 1 - 2 orders of magnitude lower for UCl4, U3O8, 12151 UO2 and UF4. It should be noted, however, that the solubility of some poorly soluble U 12152 compounds can vary substantially with thermal history as well as particle size (Cooke and 12153 Holt, 1974). Thus, greater absorption as UO2 in hamsters than rats and dogs, could reflect 12154 solubility of the preparation of UO2 rather than just species differences. A number of studies 12155 have shown that absorption is substantially greater in fasted than fed animals. For example, 12156 Bhattacharyya et al., (1989) found that uptake was increased by an order of magnitude in mice 12157 and baboons deprived of food for 24 h prior to U administration. Sullivan (1980) reported a 2 12158 – 4 fold increase in U absorption in rats given U nitrate after a 24 hour fast. 12159
(943) In Publication 30 (ICRP, 1979), an f1 of 0.05 was recommended for water soluble 12160 inorganic forms of U(VI) and a value of 0.002 for U(IV) in relatively insoluble compounds 12161 such as UF4, UO2 and U3O8. In Publication 69 (ICRP, 1995), an f1 of 0.02 was adopted for 12162 dietary intakes of U on the basis of human data as reviewed by Wrenn et al., (1985), Harrison 12163 (1991) and Leggett and Harrison (1995). The available human and animal data indicate that a 12164 value of 0.02 is also appropriate for occupational exposures to more soluble inorganic forms, 12165 including UO2(NO3)2.6H2O, UO2F2 and Na2U2O7. 12166
(944) In this report, an fA value of 0.002 is adopted for the fractional absorption of 12167 relatively insoluble compounds (e.g. UO2, U3O8) and an fA value of 0.02 is adopted for all 12168 other more soluble chemical forms (Table 15-2). 12169 12170 15.3. Systemic Distribution, Retention and Excretion 12171 12172 15.3.1. Summary of the database 12173
DRAFT FOR MC REVIEW PRIOR TO CONSULTATION
305
12174 Controlled studies on human subjects 12175
(945) The systemic biokinetics of uranium has been investigated in three human injection 12176 studies known as the Boston study, the Rochester study, and the Terepka study. 12177
(946) The Boston study (Struxness et al., 1956; Bernard and Struxness, 1957; Luessenhop 12178 et al., 1958) involved 11 patients, ages 26-63 y, in the terminal phases of diseases of the 12179 central nervous system. Most of the subjects were comatose at the time of injection. Uranyl 12180 nitrate solutions enriched with 234U and 235U were administered to Subjects 1-6 and Subjects 12181 9-11 by intravenous injection. Subjects 7 and 8 received intravenous injections of tetravalent 12182 uranium as UCl4. The mass of administered uranium was varied from one subject to another 12183 but ranged up to about 1 mg/kg. The mass of injected uranium is known only approximately 12184 for Subjects 2, 9, 10 and 11. In some cases, several bone biopsy samples were taken from the 12185 anterior tibia during the first day or two after injection. Extensive measurements of uranium 12186 in blood and excreta were made over the first several weeks or months after injection. Urinary 12187 uranium measurements were made over several months in some of the Boston subjects and 12188 extended to times >1 y for one subject. Autopsy samples were obtained from various bones 12189 and soft tissues of subjects dying at times from 2.5 d to 4.5 months after injection and from 12190 one subject dying 566 d after injection. 12191
(947) Selected data from the Boston study are summarised in Table 15-3. The range of 12192 values given for bone indicate the lower and upper bounds derived from different 12193 assumptions regarding the portion of the skeleton represented by samples collected at 12194 autopsy. 12195 12196
Table 15-3. Summary of results for eight of the Boston subjects, based on data of Struxness et al. (1956) and Bernard and Struxness (1957), and logbooks from the Boston study (after Leggett, 1994). Subject number 1 6 9 11 2 10 5 3 Time to death (d) 2.5 18 25 28 74 94 139 566 Urinary U, day 1 (%) 59 49 ~80 ~60 78 ~80 67 84 Kidney (%) 14 6 1.7 1.6 0.6 0.8 1.0 0.3 Bone (%) 8-12 4-13 1.5-2.5 2-3 1.2-2 2.5-3 0.5-0.7 1.1-1.7 Liver (%) 1.5 1.0 0.2 0.05 0.2 0.01 0.15 0.05 Other soft tissues (%) 6 4 1 2 1.5 2.5 0.5 0.3
12197 (948) The poor physical condition of the Boston subjects limits the confidence with which 12198
the data can be taken to represent the typical biokinetics of uranium. Struxness et al. (1956) 12199 pointed out that the bed-ridden condition of these subjects indicated a negative calcium 12200 balance, which might "hasten the removal of uranium from the skeleton". Also, the subjects 12201 were given relatively high masses of uranium. Animal studies indicate that administration of 12202 high masses of uranium will result in elevated uptake and retention in kidneys, among several 12203 potential effects on biokinetics (Bernard and Struxness, 1957; Leggett, 1989; 1994). A third 12204 difficulty is that the post-mortem data are not sufficiently detailed in some cases to allow a 12205 close determination of the total uranium content of some organs or tissues, particularly the 12206 skeleton. 12207
(949) The Rochester study involved two female and four male subjects, ages 24-61 y, 12208 chosen because they had reasonably good kidney function and their urine was free of protein 12209 (Bassett et al., 1948). These subjects were hospital patients but were ambulatory. Subjects 1-12210
DRAFT FOR MC REVIEW PRIOR TO CONSULTATION
306
6, respectively, suffered from rheumatoid arthritis, cirrhosis of the liver, chronic 12211 undernutrition, alcoholism, unresolved pneumonia, and pulmonary fibrosis plus gastric ulcer. 12212 The subjects received intravenous injections of uranyl nitrate solutions enriched with 234U and 12213 235U. Administered masses ranged from 6.3 to 70.9 μg U/kg. Total urine and faecal 12214 collection was made for up to 16 d, and several blood samples were taken. 12215
(950) Terepka and co-workers (Terepka et al., 1964; Hursh and Spoor, 1973) investigated 12216 the possibility of evaluating bone disorders based on the level of retention of intravenously 12217 injected uranium. They injected hexavalent uranium (30 μg/kg) into three control patients 12218 and seven patients with various bone disorders (Paget's disease, hyper- or 12219 hypoparathyroidism, osteomalacia, or senile osteoporosis). Some patients were investigated 12220 before and after oestrogen or parathyroid extract treatments. Urinary excretion of uranium 12221 was measured for at least 6 d in each subject. Subjects with osteomalacia and Paget’s disease 12222 showed radically reduced urinary uranium compared with controls, presumably due to 12223 radically increased uptake of uranium by the skeleton. Cumulative urinary uranium over 6 d 12224 was similar in controls and subjects with osteoporosis or hyper- or hypoparathyroidism. 12225 12226 Occupational and environmental studies 12227
(951) Additional information on the biological fate of uranium in humans is provided by 12228 post-mortem measurements of uranium in tissues of occupationally and environmentally 12229 exposed subjects (Donoghue et al., 1972; Campbell, 1975; Roberts et al., 1977; Igarashi et al., 12230 1985; Fisenne and Welford, 1986; Sing et al., 1986, 1987; Kathren et al., 1989; Russell and 12231 Kathren, 2004). Such studies provide information on the long-term distribution of uranium in 12232 the human body. For example, the collective data from these studies suggest that the skeleton 12233 typically contains 15-50 (median, ~30) times as much uranium as the liver, and the kidneys 12234 typically contain 0.2-0.6 (median, ~0.5) times as much uranium as the liver at times remote 12235 from the start of exposure. Some limitations of the post-mortem data for modelling purposes 12236 are the small numbers of subjects examined in most studies; uncertainties in the exposure 12237 histories of those subjects; uncertainties in estimates of total-organ contents of the subjects 12238 based on small samples of tissue, particularly skeletal tissues; and, in some cases, unreliable 12239 techniques for determining low concentrations of uranium in tissues or fluids. 12240 12241 Animal studies 12242
(952) The biokinetics of uranium has been studied in baboons, dogs, rabbits, rats, mice, 12243 monkeys, sheep, and other animal species (see reviews by Durbin, 1984; Leggett, 1994; 12244 ICRP, 1995). As indicated in the following discussion of model parameter values, data from 12245 several animal studies were used in the development of parameter values for the systemic 12246 model described below. The animal data helped to fill gaps in the human data and in 12247 selection of some parameters were given heavier weight than questionable data for human 12248 subjects. In addition to uncertainties regarding interspecies extrapolation of results, the 12249 animal data have many of the same problems that complicate the human studies. For 12250 example, most animal studies involved administration of relatively high masses of U; there 12251 was often limited sampling of tissues, particularly bone and massive soft tissues such as 12252 muscle, fat, and skin; and some studies involved small numbers of animals. When potentially 12253 significant differences in numerical results were indicated by results of different animal 12254 studies, preference was generally given to baboons or dogs over rats or other small animals, 12255 and to results involving uptake of relatively low masses of uranium. 12256

DRAFT FOR MC REVIEW PRIOR TO CONSULTATION
307
12257 15.3.2. Biokinetic model for systemic uranium 12258 12259
(953) The biokinetic model for systemic uranium used in this report is the model for adults 12260 adopted in ICRP Publication 69 (1995) and applied in ICRP Publication 68 (1994a) to 12261 workers. The model structure (Figure 15-3) is the generic structure for elements that follow 12262 the movement of calcium in bone. Although the chemical analogy between UO2
2+ and Ca2+ is 12263 not strong in terms of affinity constants for mineral ligands (Ansoborlo et al., 2006), the 12264 behaviour of uranium in the skeleton shows qualitative similarities to that of calcium. 12265 12266
12267 Figure 15-3. Structure of the model for systemic uranium. 12268
12269 (954) Parameter values for the worker are listed in Table 15-4. Primary databases and 12270
assumptions underlying parameter values are summarized below. Additional details and 12271 references can be found in an article by Leggett (1994). In that article parameter values are 12272 first discussed for a relatively detailed model with regard to the time dependent kinetics of 12273 uranium in blood and kidneys and then are adjusted to the less detailed generic model 12274 structure for calcium-like elements. 12275 12276
12277

DRAFT FOR MC REVIEW PRIOR TO CONSULTATION
308
12278 Table 15-4. Transfer coefficients in the model for systemic uranium.
From To Transfer rate (d-1) Plasma ST0 10.5 Plasma RBC 0.245 Plasma Urinary bladder content 15.43 Plasma Kidneys (Urinary path) 2.94 Plasma Kidneys (Other kidney tissue) 0.0122 Plasma Right colon content 0.122 Plasma Liver 1 0.367 Plasma ST1 1.63 Plasma ST2 0.0735 Plasma Trabecular bone surface 2.04 Plasma Cortical bone surface 1.63 ST0 Plasma 8.32 RBC Plasma 0.347 Kidneys (Urinary path) Urinary bladder content 0.099 Kidneys (Other kidney tissue) Plasma 0.00038 Liver 1 Plasma 0.092 Liver 1 Liver 2 0.00693 Liver 2 Plasma 0.00019 ST1 Plasma 0.0347 ST2 Plasma 0.000019 Trabecular bone surface Plasma 0.0693 Trabecular bone surface Exch trabecular bone volume 0.0693 Cortical bone surface Plasma 0.0693 Cortical bone surface Exch cortical bone volume 0.0693 Trabecular bone volume Plasma 0.000493 Cortical bone volume Plasma 0.0000821 Excha trabecular bone volume Trabecular bone surface 0.0173 Exch trabecular bone volume Nonexchb trabecular bone volume 0.00578 Exch cortical bone volume Cortical bone surface 0.0173 Exch cortical bone volume Nonexch cortical bone volume 0.00578 a Exchangeable b Non-exchangeable
12279 Blood clearance 12280
(955) There is rapid loss of uranium from the circulation in the first few minutes after 12281 injection due to high rates of filtration by the kidneys and diffusion into extracellular fluid. 12282 The rate of disappearance declines as uranium returns from the extracellular spaces to blood 12283 and some uranium attaches to red blood cells. In human subjects given uranyl nitrate 12284 intravenously, median retention in blood was about 25% at 5 min, 10% at 2 h, 5% at 5 h, 1% 12285 at 20 h, and <0.5% at 100 h, but inter-subject variation was high (Bassett et al., 1948; Bernard 12286 and Struxness, 1957). Blood clearance rates observed in baboons (Lipsztein, 1981) and dogs 12287 (Rowland and Farnham, 1969) are similar to those determined in human subjects. 12288
(956) Limited measurements on human blood containing environmental levels of uranium 12289 indicate that a substantial portion of uranium in blood is associated with red blood cells 12290 (Leggett, 1994). Measurements of intravenously injected uranium in plasma and red blood 12291 cells of baboons showed that red blood cells contained on average about 10% of circulating 12292

DRAFT FOR MC REVIEW PRIOR TO CONSULTATION
309
uranium after 2 hours, 25% after 6 hours, 80% after 1 day and at least 50% from 1 - 49 days 12293 (Lipsztein, 1981). These data indicate that about 0.5 – 1% of uranium from plasma attaches to 12294 red blood cells and is returned to plasma with a half-time of about 1 day (Leggett, 1994). 12295
(957) Morrow et al. (1982) estimated that soft tissues of beagles given intravenous 12296 injections of UO2F2 contained about 24% of the administered amount after 24 hours and 4% 12297 after 48 hours. This presumably reflects a high rate of transfer of uranium from blood to 12298 extracellular fluids and subsequent return to the circulation over a period of hours. 12299
(958) In the present model, plasma is taken to be a uniformly mixed pool from which 12300 uranium is removed at a rate of 35 d-1, with 30% going to a soft-tissue compartment called 12301 ST0 that returns uranium to blood with a half-time of 2 h. Thus, the transfer coefficient from 12302 plasma to ST0 is 35 d-1 x 0.3 = 10.5 d-1 and from ST0 to plasma is ln(2) / 2 h = 8.32 d-1. 12303 Resulting model predictions are in reasonable accord with data for blood clearance in the 12304 Boston subjects, animal data on binding of uranium to red blood cells (Lipsztein, 1981), and 12305 the early rise and fall of uranium in soft tissues of beagles (Morrow et al. (1982)). 12306 12307 Urinary excretion and renal retention 12308
(959) Data from the human injection studies indicate that typically about two-thirds of 12309 intravenously injected uranium is excreted in the first 24 hours and a further 10% over the 12310 next 5 days. Similar results were obtained for baboons and beagle dogs. The human and 12311 animal data indicate that most of the remaining uranium is excreted over a period of a few 12312 months, but a few percent of the amount injected may be retained for a period of years 12313 (Bernard et al., 1957; Struxness et al., 1956; Luessenhop et al., 1958; Stevens et al., 1980; 12314 Sontag, 1984). 12315
(960) A substantial fraction of uranium filtered by the kidneys is temporarily retained in 12316 the renal tubules before passing in the urine to the urinary bladder. Morrow et al. (1982) 12317 estimated that the kidneys of beagle dogs contained 44% of uranium reaching blood at 6 12318 hours after inhalation of UO2F2 and 16% after 24 hours. At 1 – 3 days after inhalation or 12319 injection of soluble forms of uranium, the kidneys of humans, dogs and rats contained 12 – 12320 25% of the amount entering blood (Bernard and Struxness, 1957; Muir et al., 1960; Jones, 12321 1966; Stevens et al., 1980; Morrow et al., 1982). Durbin (1984) reviewed data on the 12322 retention of uranium in the kidneys of humans, beagles, rats and mice and concluded that 92 – 12323 95% of the renal content at 1 day was lost with a half-time of 2 – 6 days and the remainder 12324 was lost with a half-time of 30 – 340 days. Interpretation of the data is complicated by 12325 indications that retention in the kidneys depends on the mass of uranium administered 12326 (Leggett, 1994). 12327
(961) In the present model, urinary excretion is assumed to occur in part from direct 12328 transfer from plasma to the urinary bladder contents, accounting for 63% of uranium leaving 12329 the circulation, and in part after temporary retention in renal tubules, accounting for 12% of 12330 uranium leaving the circulation. The half-time of retention in the renal tubules is taken to be 7 12331 days. The model also includes other kidney tissues which are assumed to receive 0.05% of 12332 uranium leaving the circulation, retained with a half-time of 5 years. These parameter values 12333 were chosen to be consistent with data on urinary excretion and renal retention of uranium, 12334 including data for the relative retention in kidneys and liver in occupationally and 12335 environmentally exposed humans. Parameter values for Kidney 2 were based to a large extent 12336 on retention data on baboons injected with tracer quantities of uranium (Neton et al., 1979, 12337 Lipsztein 1981, Bhattacharyya et al., 1989) and data on dogs administered low to moderate 12338 masses of uranium (Tannenbaum 1951, Fish and Bernard 1961). However, the model was 12339 required to remain broadly consistent with data on humans and dogs exposed to relatively 12340
DRAFT FOR MC REVIEW PRIOR TO CONSULTATION
310
high masses of uranium. 12341 (962) Model predictions of short-term urinary excretion of uranium are compared in Figure 12342
15-4 with data from the human injection studies. The model was not designed to reproduce 12343 the central values of the observations for these subjects at later times due to the poor physical 12344 conditions of most of the subjects and the high variability of the data. Model predictions of 12345 daily urinary uranium are within the wide range of observations at all times but are generally 12346 higher than central values from the injection studies at times greater than a few days after 12347 injection. Essentially, predictions of urinary uranium at remote times are driven by parameter 12348 values for uptake and removal of uranium by individual tissues, particularly the skeleton, 12349 which is expected to contain most of the retained uranium by a few weeks after uptake. 12350 12351 Faecal excretion 12352
(963) Faecal excretion accounted for less than 1% of total excretion in the human injection 12353 studies discussed above (Leggett, 1994; ICRP 1995a). Similar results were obtained for 12354 baboons (Lipsztein, 1981). In beagles, an estimated 2 – 5% of injected uranium was excreted 12355 in the faeces in the first 2 weeks (Stevens et al., 1980; Morrow et al., 1982). In the ICRP 12356 model, faecal excretion is included as 0.5% of uranium leaving the circulation entering the 12357 right colon. 12358 12359 Liver retention 12360
(964) The assumptions for uranium retention in the liver in the ICRP model are based on 12361 the available experimental data for humans, baboons and dogs and data for chronic exposures 12362 of humans. Liver compartments called Liver 1 and Liver 2 are used to model the short-term 12363 retention of uranium shown by the experimental data and the long-term retention indicated by 12364 the environmental data. It is assumed that 1.5% of uranium leaving the circulation deposits in 12365 Liver 1 and that the retention half-time for this compartment is 7 days. Outflow from Liver 1 12366 is divided between Liver 2 and plasma in the ration 7 : 93 The half-time of retention in Liver 12367 2 is assumed to be 10 years. 12368

DRAFT FOR MC REVIEW PRIOR TO CONSULTATION
311
12369 Figure 15-4. Observations and model predictions of cumulative urinary uranium in human 12370 subjects as a function of time after intravenous injection with uranium isotopes (Leggett, 1994). 12371 The three study groups indicated in the legend are described in the text. 12372 12373 Other soft tissues 12374
(965) The high initial uptake of uranium by soft tissues is discussed above. This is 12375 modeled by assuming that 30% of outflow from plasma enters the soft-tissue compartment 12376 ST0. Soft-tissue compartments called ST1 and ST2 are used to model intermediate and long-12377 term retention of uranium in soft tissues. Parameter values for these compartments were set 12378 for consistency with data for the Boston subjects and data for chronic exposure suggesting 12379 that there may be significant long-term retention of uranium in soft tissues (Igarashi et al., 12380 1985; Fisenne et al., 1988; Gonzales and McInroy, 1991). For example, post-mortem data for 12381 two non-occupationally exposed persons indicate that muscle and skin accounted for about 12382 25% of retained uranium, with 70% in the skeleton (Gonzales and McInroy, 1991). 12383
(966) Compartments ST1 and ST2 are assumed to receive 6.65% and 0.3%, respectively, 12384 of uranium leaving the circulation. Removal half-times from these compartments to plasma 12385 are assumed to be 20 days and 100 years respectively. The model predicts that chronic soft 12386 tissues (ST0+ST1+ST2) contain about 20% of total body uranium in chronically exposed 12387 adults. 12388 12389 Retention in the skeleton 12390
(967) There is evidence that UO2++ exchanges with Ca++ at the surfaces of bone mineral 12391
crystals, although UO2++ apparently does not participate in crystal formation or enter existing 12392
crystals. Also, the early gross distribution of uranium in the skeleton is similar to that of 12393 calcium. Like calcium, uranium is initially present on all bone surfaces but is most 12394 concentrated in areas of growth. Studies on dogs demonstrated that uranium on bone surfaces 12395 diffuses into bone volume, although at a slower rate than calcium (Rowland and Farnham, 12396 1969; Stevens et al., 1980). Such diffusion was absent or less pronounced in rodents (Priest 12397 et al., 1982; Kisieleski et al., 1952). Autoradiographic studies of 233U in mice at 1 d and 224 d 12398 after injection indicate an initial deposition of uranium on bone surfaces and subsequent 12399
DRAFT FOR MC REVIEW PRIOR TO CONSULTATION
312
burial of lines of activity as well as some evidence of diffuse activity within bone mineral 12400 (Ellender et al., 1995). In all species for which there are data, there is evidence of similarity to 12401 calcium in that return of uranium from bone to plasma occurs at rates that are greater than 12402 could be attributed only to bone resorption. 12403
(968) Parameter values for uptake and retention in the skeleton were based on data from 12404 the Boston study, animal data, post-mortem measurements on environmentally and 12405 occupationally exposed humans, analogy with the alkaline earth elements and considerations 12406 of bone metabolism. Each of the data sets has important limitations to their usefulness for the 12407 prediction of the skeletal kinetics of uranium in healthy humans. The Boston subjects were 12408 terminally ill, and their calcium metabolism cannot reliably be regarded as normal. 12409 Extrapolation of biokinetic data from laboratory animals to man is prone to error, particularly 12410 data for rodents. Baboon data for uranium are limited, and the dog data are subject to 12411 uncertainties resulting from the use of high masses of uranium, small number of animals and 12412 small bone samples. Some investigators have reported much higher early accumulation of 12413 uranium in the skeleton than assumed in the model. For example, Sanotskii et al. (1963, 12414 1964) reported high initial deposition of uranium in the skeleton (25-40% of the administered 12415 amount) in dogs, rabbits and rats after subcutaneous or intratracheal administration of uranyl 12416 nitrate, although only 3-4% was retained after 6 months. 12417
(969) It is assumed in the model that 15% of uranium leaving the circulation deposits on 12418 bone surfaces. By analogy with the alkaline earth elements (ICRP, 1993), the ratio of the 12419 amount deposited on trabecular surfaces to that deposited on cortical surfaces is assumed to 12420 be 1.25 in the mature skeleton (after 25 years of age). The value of 1.25 is derived from an 12421 average six-fold greater rate of turnover of trabecular bone divided by a four-fold greater 12422 cortical bone mass (Leggett et al., 1982; Leggett, 1992). The rate of removal of uranium from 12423 bone surfaces cannot be estimated with much certainty, but reasonable lower and upper 12424 bounds can be determined. Uranium apparently leaves bone surfaces much more slowly than 12425 calcium (Rowland and Farnham, 1969; Stevens et al., 1980), but a half-time longer than about 12426 5 – 10 days would be difficult to reconcile with the relatively rapid loss of uranium from bone 12427 seen in human and most animal studies. The assumption made is of a removal half-time of 5 12428 days, compared with a value of 1 day for calcium (Leggett, 1992). Because of recycling, the 12429 apparent retention time on bone surfaces will be greater than 5 days. For consistency with the 12430 available experimental data for the first few weeks after injection, it is assumed that 50% of 12431 uranium from bone surfaces returns to plasma and 50% transfers to exchangeable bone 12432 volume. 12433
(970) The removal half-time assigned to the exchangeable bone volume is 30 days. This 12434 value was derived for radium and lead (Leggett, 1992, 1993). From exchangeable bone 12435 volume, 75% of uranium is returned to bone surfaces and 25% transfers to non-exchangeable 12436 bone volume. Removal from non-exchangeable bone volume to plasma is assumed to occur 12437 at the rate of bone turnover (reference values given in ICRP, 2002). 12438
(971) The model predicts that the uranium content of the skeleton is about 30 times greater 12439 than that of the liver following constant chronic exposures to uranium, in reasonable 12440 agreement with most autopsy data for occupational or environmentally exposed subjects. The 12441 model predicts that the adult skeleton contains about 75% of the body content of uranium 12442 after chronic exposure, consistent with autopsy data (Gonzales and McInroy, 1991). 12443 12444 15.3.3. Treatment of radioactive progeny 12445 12446
(972) The dosimetrically significant progeny of uranium isotopes addressed in this report 12447

DRAFT FOR MC REVIEW PRIOR TO CONSULTATION
313
are isotopes of actinium, thorium, protactinium, uranium, neptunium, plutonium, radium, 12448 radon, polonium, lead, bismuth, thallium, actinium, francium, or astatine. The models for 12449 actinium, thorium, radium, radon, polonium, lead, bismuth, thallium, actinium, francium, and 12450 astatine produced in systemic compartments by serial decay of members of a uranium chain 12451 are essentially the same as the models applied to these elements as progeny of radium (see the 12452 section on radium). Uranium produced in a systemic compartment by serial decay of members 12453 of a uranium chain is assigned the characteristic model for uranium. The characteristic 12454 models for neptunium and plutonium applied in this series of reports are applied to 12455 neptunium and plutonium, respectively, produced in systemic compartments following intake 12456 of a uranium parent. Protactinium produced in a systemic compartment following intake of a 12457 uranium parent is assigned the characteristic model for thorium. Protactinium, neptunium, or 12458 plutonium produced in a compartment that is not identifiable with a compartment in its model 12459 is assumed to transfer to the central blood compartment at the rate 1000 d-1 if produced in a 12460 blood compartment and at the rate of bone turnover if produced in an exchangeable bone 12461 volume compartment. 12462 12463 15.4. Individual monitoring 12464 12465 234U 12466
(973) 234U intakes are determined by measuring the nuclide concentration in urine and 12467 faeces. As 234U is a nuclide naturally present in the environment and in the diet, excretion 12468 rates of natural uranium are expected and should be evaluated for the population in the region 12469 of residence of the workers. 12470 12471
Isotope Monitoring Technique
Method of Measurement
Typical Detection Limit
Achievable detection limit
234U Urine Bioassay α spectrometry 0.3 mBq/L 0.05 mBq/L 234U Faeces Bioassay α spectrometry 1 mBq/24h 0.2 mBq/24h
12472 235U 12473
(974) Measurements of 235U concentrations in urine and faeces are used to determine 12474 intakes of the nuclide. The main techniques used for urinalysis are alpha spectrometry and 12475 ICP-MS. 235U may also be monitored by in vivo lung counting. Whole Body Counting might 12476 be used as a complement. 12477 12478
Isotope Monitoring Technique
Method of Measurement
Typical Detection Limit
Achievable detection limit
235U Urine Bioassay α spectrometry 0.3 mBq/L 0.05 mBq/L 235U Urine Bioassay ICPM/S 0.001 µg/L
(0.016 mBq/L) 8 E-07 Bq/L
235U Faeces Bioassay α spectrometry 1 mBq/24h 0.2 mBq/24h 235U Lung Counting γ-ray
spectrometry 8 Bq 3 Bq
235U Whole Body Counting
γ-ray spectrometry
60 Bq 40 Bq
12479 238U 12480
(975) Measurements of 238U concentrations in urine and faeces are used to determine 12481

DRAFT FOR MC REVIEW PRIOR TO CONSULTATION
314
intakes of the nuclide. Several techniques are used for urine bioassays, alpha spectrometry, 12482 ICP-MS, kinetic phosphorescence analysis (TrKPA) and fluorimetry. As 238 U is a nuclide 12483 naturally present in the environment and in the diet, excretion rates of natural uranium are 12484 expected and should be evaluated for the local population. 238U may also be monitored by in 12485 vivo lung counting. 238 U detection is based on the 62.8 and 92.3 keV photons emitted by its 12486 decay product 234Th. 12487
12488 Isotope Monitoring
Technique Method of Measurement
Typical Detection Limit
Achievable detection limit
238U Urine Bioassay α spectrometry 0.3 mBq/L 0.05 mBq/L 238U Urine Bioassay ICPM/S 0.0015 µg/L
(0.03 mBq/L) 0.002mBq/L
238U Urine Bioassay TrKPA 0.1µg/L 0.06 µg/L 238U Urine Bioassay Fluorimetry 1 µg/L 238U Faeces Bioassay α spectrometry 2 mBq/24h 0.2 mBq/24h 238U Lung Counting γ-ray
spectrometry of 234Th
50 Bq of Th-234
30 Bq of Th-234
12489 References 12490
12491 André, S., Métivier, H., Auget, D., Lantenois, G., Boyer, M., Masse, R., 1989. Lung dissolution of 12492
uranium tetrafluoride in rats and baboons. Comparison with dissolution by alveolar 12493 macrophages in culture and chemical dissolution. Hum. Toxicol. 8, 111-119. 12494
Ansoborlo, E, Chalabreysse, J., Escallon, S., Hengé-Napoli, M.H., 1990. In vitro solubility of 12495 uranium tetrafluoride with oxidizing medium compared with in vivo solubility in rats. Int. J. 12496 Radiat. Biol. 58, 681-689. 12497
Ansoborlo, E., Chazel, V., Hengé_Napoli, M.H., Pihet, P., Rannou, A., Bailey, M.R., Stradling, N., 12498 2002. Determination of the physical and chemical properties, biokinetics, and dose 12499 coefficients of uranium compounds handled during nuclear fuel fabrication in France. 12500 Health Phys. 82(3), 279-289, 12501
Ansoborlo, E., Chazel, V., Houpert, P., Hengé-Napoli, M.H., Paquet, F., Hodgson, A., Stradling, N., 12502 1998a. Assessment of physico-chemical and biokinetic properties of uranium peroxide 12503 hydrate UO4. Health Phys., 75(4), 389-397 12504
Ansoborlo, E., Hodgson, A., Stradling, G.N., Hodgson, S., Metivier, H., Hengé-Napoli, M.H., Jarvis, 12505 N., Birchall, A., 1998b. Exposure implications for uranium aerosols formed at a new laser 12506 enrichment facility: application of the ICRP respiratory tract and systemic model. Radiat. 12507 Prot. Dosim., 79(1-4), 23-27. 12508
Ansoborlo, E., Prat, O., Moisy, P., Denauwer, C., Guilbaud, P., Carriere, M., Gouget B.,Duffield, J., 12509 Doizi D., Vercouter, T., Moulin, C., Moulin, V., 2006. Actinide in speciation in relation to 12510 biological processes. Biochimie 88(11), 1605-18. 12511
Bailey, M., Davis, K., 2002. Estimations of kidney uranium concentrations from published reports of 12512 uranium intakes in man where subsequent effects on kidney function were monitored. 12513 Annexe A to The Health Hazards of Depleted Uranium Munitions Part II. The Royal 12514 Society, London. www.royalsoc.ac.uk/du.. 12515
Ballou, J.E., Gies, R.A., Case, A.C., Haggard, D.L., Bushbom, R.L., Ryan, J.L., 1986. Deposition and 12516 early disposition of inhaled 233UO2(NO3)2 and 232UO2(NO3)2 in the rat. Health Phys. 51 12517 755-771. 12518
Barber, J.M. Forrest, R.D., 1995. A study of uranium lung clearance at a uranium processing plant. 12519 Health Phys. 68 661-669. 12520

DRAFT FOR MC REVIEW PRIOR TO CONSULTATION
315
Bassett, S.H., Frankel, A., Cedars, N., VanAlstine, H., Waterhouse, C., Cusson, K., 1948. The 12521 excretion of hexavalent uranium following intravenous administration.: II. Studies on 12522 human subjects. Rochester, New York, UR-37. 12523
Beau, P.G., Chalabreysse, J., 1989. Knowledge gained from bioassay data on some metabolic and 12524 toxicological features of uranium hexafluoride and its degradation products. Radiat. Prot. 12525 Dosim. 26, 107-112. 12526
Bečková, V., Malátová, I., 2008. Dissolution behaviour of 238U, 234U and 230Th deposited on filters 12527 from personal dosemeters. Radiat. Prot. Dosim. 129(4): 469-472, published ahead of print 12528 November 1, 2007 doi:10.1093/rpd/ncm455. 12529
Begichev, S.N., Borovoj, A.A., Burlakov, E.V., Gagarinski, A., Ju Demin, V.F., Khodakovsky, I.L., 12530 Khrulev, A.A., 1989. Radioactive releases due to the Chernobyl accident. Int. Sem. “Fission 12531 Product Transport Processes in Reactor Accidents”, May 22-26, 1989, Dubrovnik, 12532 Yugoslavia. 12533
Bernard, S.R., Struxness, E.G., 1957. A study of the distribution and excretion of uranium in man. An 12534 Interim Report. Tennessee, USA, ORNL 2304. 12535
Bernard, S.R., Muir, J.R., Royster, G.W., 1957. The distribution and excretion of uranium in man. In: 12536 Proceedings of the Health Physics Society First Annual Meeting pp. 33-48. 12537
Bhattacharyya, M.H., Larsen, R.P., Cohen, N., Ralston, L.G., Moretti, E.S., Oldham, R.D.. Ayres, L., 12538 1989. Gastrointestinal absorption of plutonium and uranium in fed and fasted adult baboons 12539 and mice: application to humans. Radiat. Prot. Dosim. 26, 159-165. 12540
Boback, M.W., 1975. A review of uranium excretion and clinical urinalysis data in accidental 12541 exposure cases. In: Proceedings of the Conference on Occupational Health Experience with 12542 Uranium, pp. 226–243. Arlington Virginia, April 28–30, 1975, ERDA 93, US Energy 12543 Research and Development Administration. 12544
Bruenger, F.W., Atherton, D.R., Bates, D.S., Buster, D.S., Stevens, W., 1976. The early distribution 12545 and excretion of 233U in the Beagle . University of Utah College of Medicine, Salt Lake 12546 City, Report No. COO-119-251, pp. 194-202. 12547
Campbell, E.E., McInroy, J.F., Schulte, H.F., 1975. Uranium in the tissue of occupationally exposed 12548 workers. Conference on Occupational Health Experience with Uranium. Arlington VA, US 12549 ERDA 93, 324-350. 12550
Chalabreysse, J., Beau, P.G., Chevalier, C., Jeanmaire, L., Bataller, G., Bérard, P., Gibert, B., 1989. 12551 French experience with uranium compounds. Radiat. Prot. Dosim. 26, 49-56. 12552
Chazel, V., Gerasimo, P., Dabouis V., Laroche, P., Paquet, F., 2003. Characterisation and dissolution 12553 of depleted uranium aerosols produced during impacts of kinetic energy penetrators against 12554 a tank. Radiat. Prot. Dosim. 105(1-4) 163-166. 12555
Chazel, V., Houpert, P., Ansoborlo, E., 1998. Effect of U3O8 specific surface area on in vitro 12556 dissolution, biokinetics, and dose coefficients. Radiat. Prot. Dosim. 79(1-4) 39-42. 12557
Chazel, V., Houpert, P., Hengé-Napoli, M.H., Paquet, F., Ansoborlo, E., 2000a. Experimental 12558 determination of the solubility of industrial UF4 particles. Radiat. Prot. Dosim. 92(4) 289-12559 294 12560
Chazel,V., Houpert, P., Ansoborlo, E., Hengé-Napoli, M.H., Paquet, F., 2000b. Variation of 12561 solubility, biokinetics and dose coefficients of industrial uranium oxides according to 12562 specific surface area. Radiat. Prot. Dosim. 88(3) 223-231. 12563
Cooke, N., Holt, F.B., 1974. The solubility of some uranium compounds in simulated lung fluid. 12564 Health Phys. 27, 69-77. 12565
Coombs M.A., Cuddihy R.G. 1983. Emanation of 232U daughter products from submicron particles 12566 of uranium dioxide and thorium dioxide by nuclear recoil and inert gas diffusion. J. Aerosol 12567 Sci. 14, 75-86. 12568
Cooper, J.R., Stradling, G.N., Smith, H., Ham, S.E., 1982. The behaviour of uranium-233 oxide and 12569 uranyl-233 nitrate in rats. Int. J. Radiat. Biol. 41(4) 421-433. 12570
DRAFT FOR MC REVIEW PRIOR TO CONSULTATION
316
Cross, F. T., Palmer, R. F., Filipy, R. E., Dagle, G. E., Stuart, B. O., 1982, Carcinogenic effects of 12571 radon daughters, uranium ore dust and cigarette smoke in beagle dogs. Health Phys. 42(1), 12572 33-52. 12573
Cuddihy, R.G., Finch, G.L., Newton, G.J., Hahn, F.F. Mewhinney, J.A. Rothenberg, S.J., Powers, 12574 D.A., 1989. Characteristics of radioactive particles released from the Chernobyl nuclear 12575 reactor. Environ. Sci. Technol. 23, 89-95. 12576
Devell, L., 1988. Nuclide composition of Chernobyl hot particles. In: von Phillipsborn, H., 12577 Steinhäusler F., (Eds.), Hot Particles from the Chernobyl Fallout. Proc. Int. Workshop, 12578 Theuern, October 1987, pp. 23-34. Bergbau und Industriemuseum Ostbayern, Band 16. 12579
Donoghue, J.K., Dyson, E.D., Hislop, J.S., Leach, A.M., Spoor, N.L., 1972. Human exposure to 12580 natural uranium. Brit. J. Indust. Med. 29, 81-89. 12581
Duport, P., Robertson, R., Ho, K., Horvath, F., 1991.) Flow-through dissolution of uranium-thorium 12582 ore dust, uranium concentrate, uranium dioxide, and thorium alloy in simulated lung fluid. 12583 Radiat. Prot. Dosim. 38(1/3) 121-133. 12584
Durbin, P.W., 1984. Metabolic models for uranium. In Proceedings of a colloquium: Biokinetics and 12585 analysis of uranium in man. 8-9 Aug. 1984 (Moore RH Ed). Richland, USA, United States 12586 Uranium Registry/Hanford Environmental Health Foundation. USUR-05 HEHF-47, 12587 Document No:PB86-203080, F1-F65. 12588
Eidson, A.F., 1990. Biological characterisation of radiation exposure and dose estimates for inhaled 12589 uranium mining effluents NUREG/CR-5489 TI90 012914, United States Nuclear 12590 Regulatory Commission. 12591
Eidson, A.F., 1994. The effect of solubility on inhaled uranium compound clearance: a review. 12592 Health Phys. 67, 1-14. 12593
Elder, J.C., Tinkle, M.C., 1980. Oxidation of Depleted Uranium Penetrators and Aerosol Dispersal at 12594 High Temperatures. Los Alamos National Laboratory Report LA-8610-MS. http://lib-12595 www.lanl.gov/la-pubs/00313603.pdf 12596
Ellender, M., Haines, J.W., Harrison, J.D., 1995. The distribution and retention of plutonium, 12597 americium and uranium in CBA/H mice. Hum. Exper. Toxicol. 14, 38-48. 12598
Ellender, M., 1987. The clearance of uranium after deposition of the nitrate and bicarbonate in two 12599 regions of the rat lung. Human Toxicol. 6, 479-482. 12600
Fisenne, I.M., Welford, G.A., 1986. Natural U concentrations in soft tissues and bone of New York 12601 City residents. Health Phys. 50(6) 739-46. 12602
Fisenne, I.M., Perry, P.M., Harley, N.H., 1988. Uranium in humans. Radiat. Prot. Dosimetry 24(1/4) 12603 127-131. 12604
Fish, B.R., Bernard, S.R., 1961. Unpublished data. Sixth Conference on Industrial Hygiene and Air 12605 Pollution and summarized in Industrial Hygiene News Reports IV 1. 12606
Fisher, D.R., Jackson, P.O., Brodaczynski, G.G., Scherpelz, R.I., 1983. Levels of 234U, 238U and 230Th 12607 in excreta of uranium mill crushermen. Health Phys. 45, 617-629. 12608
Fisher, D.R, Swint, M.J., Kathren, R.L., 1991. Modified biokinetic model for uranium from analysis 12609 of acute exposure to UF6. Health Phys. 60, 335-342. 12610
Fisher, D.R., Briant, J.K., 1994. Assessment of accidental intakes of uranyl acetylacetonate (UAA). 12611 Radiat. Prot. Dosim. 53(1-4) 263-267. 12612
Glissmeyer, J.A., Mishima, J., 1979. Characterization of Airborne Uranium from Test Firings of 12613 XM774 Ammunition. Pacific Northwest Laboratory. PNL-2944. Richland, WA. 12614
Gonzales, E.R., McInroy, J.F., 1991. Abstract WPM-A1: The distribution of uranium in two whole 12615 bodies. Health Phys. 60[Supplement 2], S51. 12616
Griffith W.C., Cuddihy R.G., Hoover M.D. Stalnaker N.D., 1980. Simulation of the retention and 12617 dosimetry of 232U and its daughters after inhalation in ThO2 or UO2 particles. In: Sanders, 12618 C.L., Cross, F.T., Dagle, G.E., Mahaffey, J.A., (Eds.), Pulmonary Toxicology of Respirable 12619 Particles. pp. 193-208 Proc. 19th Annual Hanford Life Sciences Symposium at Richland, 12620 WA. CONF-791002. Available from National Technical Information Service. Springfield. 12621 Virginia. 12622
DRAFT FOR MC REVIEW PRIOR TO CONSULTATION
317
Guilmette, R.A., Cheng, Y.S., 2009. Physicochemical characterization of Capstone depleted uranium 12623 aerosols IV: in vitro solubility analysis. Health Phys. 96, 292-305. 12624
Harduin, J.C., Royer, Ph., Piechowski, J., 1994. Uptake and urinary excretion of uranium after oral 12625 administration in man. Radiat. Prot. Dosim. 53, 245-248. 12626
Harris, W.B., 1961. Experimental clearance of uranium dust from the human body. In: Davies, C.N., 12627 (Ed.), Inhaled Particles and Vapours. Proc. of an International Symposium organised by the 12628 British Occupational Hygiene Society. Oxford, Pergamon Press, pp. 209-220. 12629
Harrison, J.D., 1991. The gastrointestinal absorption of the actinide elements. Sci. Total Environment 12630 100, 43-60. 12631
Hill, C. R., 1962, Identification of alpha emitters in normal biological material. Health Phys. 8, 17–12632 25. 12633
Hodgson, A., Moody, J.C., Stradling, G.N., Bailey, M.R., Birchall, A., 2000. Application of the ICRP 12634 respiratory tract model to uranium compounds produced during the manufacture of nuclear 12635 fuel. NRPB-M1156, Chilton. 12636
Hursh, J.B., Spoor, N.L., 1973. Data on Man. In: Hodge, H.C., Stannard, J.N., Hursh, J.B., (Eds.), 12637 Uranium, plutonium, transplutonic elements. Handbook of Experimental Pharmacology 36. 12638 New York. Springer-Verlag, pp. 197-239. 12639
Hursh, J.B., Neuman, W.R., Toribara, T., Wilson, H., Waterhouse, C., 1969. Oral ingestion of 12640 uranium by man. Health Phys. 17, 619-621. 12641
ICRP, 1979. Limits for Intakes of Radionuclides by Workers. ICRP Publication 30 Part 1. Ann. 12642 ICRP 2(3/4). 12643
ICRP, 1993. Age-dependent Dose to Members of the Public from Intake of Radionuclides. Part 2. 12644 ICRP Publication 67. Ann. ICRP 23(3/4). 12645
ICRP, 1994a. Dose Coefficients for Intakes of Radionuclides by Workers. ICRP Publication 68, Ann 12646 ICRP, 24(4), 12. 12647
ICRP, 1994b. Human Respiratory Tract Model for Radiological Protection. ICRP Publication 66. 12648 Ann. ICRP 24(1/3). 12649
ICRP, 1995. Age-dependent Doses to Members of the Public from Intake of Radionuclides. Pt.3. 12650 ICRP Publication 69. Ann. ICRP 25(1). 12651
ICRP, 1997. Individual monitoring for internal exposure of workers. ICRP Publication 78. Ann. ICRP 12652 27(3-4). 12653
ICRP, 2002. Guide for the Practical Application of the ICRP Human Respiratory Tract Model. 12654 Supporting Guidance 3. Ann. ICRP, 32(1-2). 12655
Igarashi, Y., Yamakawa, A., Seki, R., Ikeda, N., 1985. Determination of U in Japanese human tissues 12656 by the fission track method. Health Physics 49, 707-712. 12657
Jones, E.S., 1966. Microscopic and autoradiographic studies of distribution of uranium in the rat 12658 kidney. Health Physics 12, (10) 1437-51. 12659
Kathren, R.L., McInroy, J.F., Moore, R.H., Dietert, S.E., 1989. Uranium in the tissues of an 12660 occupationally exposed individual. Health Phys. 57, 17-21. 12661
Kisieleski, W.E., Faraghan, W.G., Norris, W.P., Arnold, J.S., 1952. The metabolism of uranium-233 12662 in mice. J. Pharm. Exper. Therapeutics 104(4) 459-67. 12663
Larsen, R.P., Orlandini, K.A., 1984. Gastrointestinal absorption of uranium in man. In: 12664 Environmental Research Division Annual Report, July 1982 - June 1983; Argonne National 12665 Laboratory, ANL-83-100-Pt.2. pp.46-50. 12666
Leach, L.J., Yuile, C.L., Hodge, H.C., Sylvester, G.E., Wilson, H.B., 1973. A five-year inhalation 12667 study with natural uranium dioxide (UO2) dust—II. Post-exposure retention and biologic 12668 effects in the monkey, dog and rat. Health Phys. 25, 239-258. 12669
Leggett, R.W., 1989. The behavior and chemical toxicity of U in the kidney: a reassessment. Health 12670 Phys., 57(3) 365-83. 12671
Leggett, R.W., 1992. A generic age-specific biokinetic model for calcium-like elements. Radiation 12672 Protection Dosimetry 41, 183-198. 12673
Leggett, R.W., 1993. An age-specific kinetic model of lead metabolism in humans. Environmental 12674
DRAFT FOR MC REVIEW PRIOR TO CONSULTATION
318
Health Perspectives 101(7) 598-616. 12675 Leggett, R.W., 1994. Basis for the ICRP's age-specific biokinetic model for uranium. Health Phys. 12676
67, 589-610. 12677 Leggett, R.W., Pellmar, T.C., 2003. The biokinetics of uranium migrating from embedded DU 12678
fragments. J Environ. Radioact. 64(2-3) 205-25. 12679 Leggett, R.W., Eckerman, K.F., Williams, L.R., 1982. Strontium-90 in bone: A case study in age-12680
dependent dosimetric modelling. Health Phys. 43(3) 307-322. 12681 Leggett, R.W., Eckermann, K.F., Boice, J.D., 2005. A respiratory model for uranium aluminide based 12682
on occupational data. J. Radiol. Prot. 25, 405–416. 12683 Leggett, R.W., 1994. Basis for the ICRP's age-specific biokinetic model for uranium. Health Phys. 12684
67, 589-610. 12685 Leggett, R.W., Harrison, J.D., 1995. Fractional absorption of ingested U in humans. Health Phys. 68, 12686
1-15. 12687 Lipsztein, J.L., 1981. An improved model for uranium metabolism in the primate. Ph.D Dissertation, 12688
New York University. 12689 Luessenhop, A.J., Gallimore, J.C., Sweet, W.H., Struxness, E.G., Robinson, J., 1958. The toxicity of 12690
hexavalent uranium following intravenous administration. Am J. Roentgenol. 79, 83-100. 12691 Marsh J.W., Gregoratto, D., Karcher, K., Nosske D., Bessa Y., Blanchardon E., Hofmann W., 12692
Tomasek L., 2011. Dosimetric calculations for uranium miners for epidemiological studies. 12693 Radiat. Prot. Dos. pp. 1-13, doi:10.1093/rpd/ncr310. 12694
Metivier, H., Poncy, J.L., Rateau, G., Stradling, G.N., Moody, J.C., Gray, S.A., 1992. Uranium 12695 behaviour in the baboon after the deposition of a ceramic forms of uranium dioxide and 12696 uranium octoxide in the lungs: Implications for human exposure. Radioprot. 27, 263-281. 12697
Mishima, J., Parkhurst M.A., Scherpels, R.L., Hadlock, D.E., 1985. Potential Behavior of Depleted 12698 Uranium Penetrators under Shipping and Bulk Storage Accident Conditions. Pacific 12699 Northwest Laboratory. PNL-5415. Richland, WA. 12700
Mitchell, R.E.J., Sunder, S., 2004. Depleted uranium dust from fired munitions: physical, chemical 12701 and biological properties. Health Phys. 87(1) 57–67. 12702
Moody, J.C., Birchall, A., Stradling, G.N., Britcher, A.R., Battersby, W., 1997. Biokinetics of 12703 recycled uranium trioxide and implications for human exposure. Inhaled Particles VIII. 12704 Annals of Occupational Hygiene. 41 Suppl.1, 104-110. 12705
Moore, R.H., Kathren, R.L., 1985. A World War II uranium hexafluoride inhalation event with 12706 pulmonary implications for today. J. Occup. Med. 27, 753–756. 12707
Morrow, P., Gelein, R., Beiter, H., Scott, J.B., Picano, J.J., Yuile, C.L., 1982. Inhalation and 12708 intravenous studies of UF6/UO2F2 in dogs. Health Phys. 43(6) 859-874. 12709
Morrow, P.E., Gibb, F.R., Beiter, H.D., 1972. Inhalation studies of uranium trioxide. Health Phys. 23, 12710 273-280. 12711
Muir, J.R., Fish, B.R., Jones, E.S., Gillum, N.L., Thompson, J.L., 1960. Distribution and excretion of 12712 uranium. Oak Ridge, USA, Health Physics Division Annual Progress Report for period 12713 ending July 31, 1960. Report No. ORNL-2994. 12714
Neton, J., Lo Sasso, T., Lipsztein, J., Wrenn, M.E., Cohen, N., 1979. Short term kinetics of uranium 12715 in the adult baboon : Preliminary data. Radioactivity studies progress report. COO-3382-18, 12716 Institute of Environmental Medicine, New York University Medical Center. 12717
OSAGWI, 2000. (Office of the Special Assistant to the Deputy Secretary of Defense for Gulf War 12718 Illnesses. DoD) Exposure Investigation Report, Depleted Uranium in the Gulf (II), 12719 December 2000 at www.gulflink.osd.mil in the Environmental Exposure Reports Section. 12720
Parkhurst, M.A., Szrom, F., Guilmette, R.A., Holmes, T.D., Cheng, Y.S., Kenoyer, J.L., Collins, 12721 J.W., Sanderson, T.E., Fliszar, R.W., Gold, K., Beckman, J.C., Long, J.A., 2004a. Capstone 12722 Depleted Uranium Aerosols: Generation and Characterization, Volumes 1. Main Text. 12723 Attachment 1 of Depleted Uranium Aerosol Doses and Risks: Summary of U.S. 12724 Assessments. PNNL-14168, Prepared for the U.S. Army by Pacific Northwest National 12725 Laboratory, Richland, Washington. 12726

DRAFT FOR MC REVIEW PRIOR TO CONSULTATION
319
Parkhurst, M.A., Szrom, F., Guilmette, R.A., Holmes, T.D., Cheng, Y.S., Kenoyer, J.L., Collins, 12727 J.W., Sanderson, T.E., Fliszar, R.W., Gold, K., Beckman, J.C., Long, J.A., 2004b. Capstone 12728 Depleted Uranium Aerosols: Generation and Characterization, Volume 2. Appendices. 12729 Attachment 2 of Depleted Uranium Aerosol Doses and Risks: Summary of U.S. 12730 Assessments. PNNL-14168, Prepared for the U.S. Army by Pacific Northwest National 12731 Laboratory, Richland, Washington. 12732
Parkhurst, M.A., Guilmette, R.A., 2009. Overview of the Capstone depleted uranium study of 12733 aerosols from impact with armored vehicles: Test setup and aerosol generation, 12734 characterization, and application in assessing dose and risk. Health Phys. 96, 207-220. 12735
Pellow, P.G., Stradling, G.N., Hodgson, A., Fell, T.P., Phipps, A. Ellender, M., 1996. Biokinetics of 12736 Uranium Tributyl Phosphate in the Rat : Implications for Occupational Exposure. NRPB-12737 M682, Chilton. 12738
Pellow, P.G., Stradling, G.N., Hodgson, A., Fell, T.P., Phipps, A. and Ellender, M., 1997. Absorption 12739 kinetics of uranium tri-n-butyl phosphate in the rat: Implications for occupational exposure. 12740 Journal of Radioanalytical and Nuclear Chemistry 226, 93-98. 12741
Pomroy, C., Noel, L., 1981. Retention of uranium thorax burdens in fuel fabricators. Health Phys. 41, 12742 393-400. 12743
Price, A., 1989. Review of methods for assessment of intake of uranium by workers at BNFL 12744 Springfields. Radiat. Prot. Dosim. 26(1/4) 35-42. 12745
Priest, N.D., Howells, G.R., Green, D. Haines, J.W., 1982. Uranium in bone: metabolic and 12746 autoradiographic studies in the rat. Human Toxicol. 1, 97-114. 12747
Roberts, A.M., Coulston, D.J., Bates, T.H., 1977. Conformation of in vivo uranium-in chest survey 12748 by analysis of autopsy specimens. Health Phys., 32(5) 435-7. 12749
Rowland, R.E., Farnham, J.E., 1969. The deposition of uranium in bone. Health Phys. 17(1) 139-44. 12750 Russell, J.J., Kathren, R.L., 2004. Uranium deposition and retention in a USTUR whole body case. 12751
Health Phys. 86, 273-284. 12752 Sanotskii, V.A., Mikhailovich, S.M., Ivannikov, A.T., 1963. Abstract No. 40513: The toxic effect of 12753
uranium compounds. Nuclear Science Abstracts 17, 5450. 12754 Sanotskii, V.A., Mikhailovich, S.M., Ivannikov, A.T., 1964. The toxic effect of uranium compounds. 12755
In: Radiological Health and Safety in mining and milling of nuclear materials. Vienna, 12756 IAEA pp. 275-288. 12757
Saxby, W.N., Taylor, N.A., Garland, J., Rundo, J., and Newton, D., 1964. A Case of inhalation of 12758 enriched uranium dust. In: Assessment of Radioactivity in Man, Volume II. Vienna, IAEA, 12759 pp. 535-547. 12760
Schieferdecker, H., Dilger, H., Doerfel, H., 1985. Inhalation of U aerosols from UO2 fuel element 12761 fabrication. Health Phys. 48(1) 29-48. 12762
Scripsick, R.C., Crist, K.C., Tillery, M.I., Soderholm, S.C., Rothenberg, S.J., 1985a. Preliminary 12763 Study of Uranium Oxide Dissolution in Simulated Lung Fluid. LA-10268-MS, Los Alamos 12764 National Laboratory. http://lib-www.lanl.gov/la-pubs/00318819.pdf. 12765
Scripsick, R.C., Crist, K.C., Tillery, M.I., Soderholm, S.C., 1985b. Differences in in vitro dissolution 12766 properties of settled and airborne uranium material. In: Stocker, H., (Ed.), Occupational 12767 Radiation Safety in Mining Canadian Nuclear Association pp. 255-260. http://lib-12768 www.lanl.gov/la-pubs/00374828.pdf. 12769
Singh, N. P., Wrenn, M. E., McInroy, J. F., Gonzales, E., Cross, F. T., Jackson, P. O. 1986a Ratios of 12770 234U, 238U and 230Th in dogs' lungs exposed to uranium ore dust: An interlaboratory 12771 comparison. Health Phys., 50, 292-297. 12772
Singh, N.P., Bennett, D.D., Wrenn, M.E., Saccomanno, G., 1987. Concentrations of alpha-emitting 12773 isotopes of U and Th in uranium miners' and millers' tissues. Health Phys. 53(3) 261-265. 12774
Singh, N.P., Lewis, L.L., Wrenn, M.E., 1986b. Abstract THAM-E3: Uranium in human tissues of 12775 Colorado, Pennsylvania and Utah populations. Health Phys., 50, (Supplement 1) S83. 12776
Sontag, W., 1984. Long-term behaviour of 239Pu, 241Am and 233U in different bones of one-year-old 12777 rats: macrodistribution and macrodosimetry. Human Toxicol. 3, 469-483. 12778

DRAFT FOR MC REVIEW PRIOR TO CONSULTATION
320
Spencer, H., Osis, D., Fisenne, I.M., Perry, P.M., Harley, N.H., 1990. Measured intake and excretion 12779 patterns of naturally occurring 234U, 238U and calcium in humans. Radiat. Res. 124, 90-95. 12780
Stevens, W., Bruenger, F.W., Atherton, D.R., Smith, J.M., Taylor, G.N., 1980. The distribution and 12781 retention of hexavalent 233U in the Beagle. Radiat. Res., 83, 109-126. 12782
Stradling, G.N., Stather, J.W., Gray, S.A., Moody, J.C., Ellender, M., Hodgson, A., Sedgwick D., 12783 Cooke, N., 1987. The metabolism of uranium in the rat after inhalation of two industrial 12784 forms of ore concentrate: the implications for occupational exposure. Human Toxicol. 6, 12785 385-393. 12786
Stradling, G.N., Stather, J.W., Price, A., Cooke, N., 1989. Limits on intake and the interpretation of 12787 monitoring data for workers exposed to industrial uranium bearing dusts. Radiat. Prot. 12788 Dosim. 26(1/4). 83-87. 12789
Stradling, G.N., Stather, J.W., Strong, J.C., Sumner, S.A., Moody, J.C., Towndrow, C.G., Hodgson, 12790 A., Sedgwick, D., Cooke, N., 1988. The metabolism of ceramic and non-ceramic forms of 12791 uranium dioxide after deposition in the rat lung. Human Toxicol. 7, 133 - 139. 12792
Stradling, G.N., Stather, J.W., Strong, J.C., Sumner, S.A., Towndrow, C.G., Moody, J.C., Sedgwick, 12793 D., Cooke, N., 1985a. The metabolism of some industrial uranium tetrafluorides after 12794 deposition in the rat lung. Human Toxicol. 4, 159-168. 12795
Stradling, G.N., Stather, J.W., Ellender, M., Sumner, S.A., Moody, J.C., Towndrow, C.G., Hodgson, 12796 A., Sedgewick, D., Cooke, N., 1985b. Metabolism of an industrial uranium trioxide dust 12797 after deposition in the rat lung. Human Toxicol. 4, 563-572. 12798
Stradling, N., Hodgson, A., Ansoborlo, E., Berard, P., Etherington, G., Fell, T., Rance, E., Le Guen, 12799 B., 2002. Industrial uranium compounds: exposure limits, assessment of intake and toxicity 12800 after inhalation NRPB-W22, Chilton. 12801
Stradling, G.N., Gray, S.A., Moody, J.C., Ellender, M., Pearce, M., 2005. Biokinetics of thorium in 12802 the presence of a highly transportable form of uranium: Implications for occupational 12803 exposure. NRPB-DA/04/2005, Chilton. 12804
Struxness, E.G., Luessenhop, A.J., Bernard, S.R., Gallimore, J.C., 1956. The distribution and 12805 excretion of hexavalent uranium in man. IN Proceedings of the international conference on 12806 the peaceful uses of atomic energy 8 Aug. 1955-20 Aug. 1955 New York, United Nations, 12807 186-196. 12808
Stuart, B. O. Beasley, T. M., 1967, Non-equilibrium tissue distributions of uranium and thorium 12809 following inhalation of uranium ore by rats. In: Davies, C. N., editor. Inhaled Particles and 12810 Vapours II. Proceedings of an International Symposium organised by the British 12811 Occupational Hygiene Society; Cambridge, UK. Oxford: Pergamon Press pp. 291-8. 12812
Stuart, B.O., Jackson, P.O., 1975. The inhalation of uranium ores. In: Wrenn, M.E., (Ed.), Proc. of 12813 the Conference on Occupational Health Experience with Uranium. Arlington, Virginia, 12814 ERDA 93. US Energy Research and Development Administration, pp. 130–139. Available 12815 from National Technical Information Service, Springfield, Virginia. 12816
Sullivan, M.F., 1980. Absorption of actinide elements from the gastrointestinal tract of rats, guinea 12817 pigs and dogs. Health Phys. 38, 159-171. 12818
Tannenbaum, A., 1951. Toxicology of uranium: Survey and collected papers. New York, USA, 12819 McGraw-Hill Book Company Inc. National Nuclear Energy Series, Manhattan Project 12820 Technical Section. 12821
Terepka, A.R., Toribara, T.Y., Neuman, W.F., 1964. Abstract 22: Skeletal retention of uranium in 12822 man. In: 46th meeting of the Endocrine Society 1964, p. 33. 12823
Toivonen, H., Pöllämem, R., Leppänen, A., Klemola, S., Lathinen, J., 1992. Release from the nuclear 12824 power plant in Sosnovyy Bor in March 1992. Radiochimica Acta 57, 169-172. 12825
West, C.M., Scott, L., Schultz, N.B., 1979. Sixteen years of uranium personnel monitoring 12826 experience. In retrospect. Health Phys. 36, 665-669. 12827
Wood, S.K., Farnham, J.E., Marshall, J.H., 1970. 45Ca, 133Ba, and 226Ra in 6- to 10-year-old Beagle 12828 dogs: a 100 day study. Argonne, Illinois, ANL-7760 Part II Biology and Medicine. July 12829 1969-June 1970, pp. 110-132. 12830

DRAFT FOR MC REVIEW PRIOR TO CONSULTATION
321
Wrenn, M.E., Singh, N. P., Saccomanno, G., 1983. Uranium and thorium isotopes and their state of 12831 equilibria in lungs from uranium miners. Health Phys. 44 Suppl. 1, 385-389. 12832
Wrenn, M.E., Durbin, P.W., Howard, B., Lipzstein, J., Rundo, J., Still, E.T., Willis, D.L., 1985. 12833 Metabolism of ingested U and Ra. Health Phys. 48, 601-603. 12834
Wrenn, M.E., Singh, N.A., Ruth, H., Rallison, M.I., Burleigh, D.P., 1989. Gastrointestinal absorption 12835 of soluble uranium from drinking water by man. Radiat. Prot. Dosim. 26, 119-122. 12836
Zamora, L., Zielinski, J.M., Meyerhof, D.P., Tracy, B.L., 2002. Gastrointestinal absorption of 12837 uranium in humans. Health Phys. 83(1) 35-45. 12838
Zhao, S.L., Zhao, F.-Y., 1990. Nephrotoxic limit and annual limit of intake for natural U. Health 12839 Phys; 58(5) 619-623. 12840
12841