6 5 survey 5 3 1 kenya ict board ict monitoring and ...icta.go.ke/pdf/julisha final report 1.pdf ·...
TRANSCRIPT

Filing Information: November 2011, IDC #undefined
: Survey
S U R V E Y
K e n y a I C T B o a r d I C T M o n i t o r i n g a n d E v a l u a t i o n I n d i c a t o r sS t u d y
I D C O P I N I O N
Despite unfavorable global economic conditions prevailing between 2008 and 2009,
the Kenyan ICT market remained robust and was propped up by investments in
international connectivity during that period, which in turned spurred a flurry of activity
in investment in terrestrial networks, broadband services and devices.
The Kenyan ICT Market is forecast to grow at a compound annual growth rate
(CAGR) of 15.5% to reach a value of US$ 1.5 billion by 2015, mainly riding on the
back of various factors including positive measures by government to promote ICT
usage, political stability and sustained acquisitions cycles in key sectors like
telecommunications, financial, government and the consumer segment.
Operating Environment: According to vendors interviewed in the survey the
Kenyan market environment has been favorable over the last few years and it is
widely felt that greater growth can be realized if certain challenges can be
addressed through government policies and related interventions. Among the
chief challenges experienced by vendors include changes of leadership with
government organizations with whom vendors would like to enter into private
public partnerships (PPPs) to grow skills and nurture usage, enforcement of
intellectual property and copyright laws (piracy, counterfeit goods, IP theft, etc),
creation of industry standards and overall harmonized policies to govern
development the sector.
ICT Skills: The growth of ICT professionals and the levels of skills in Kenya
hinges largely on; the size of and number of both local and international large
organizations; the level of maturity and sophistication in their ICT set ups; and
the growth of the SME segment as a key consumer.
Inherent in this medley of issues are concerns on how to retain staff that have
acquired extensive experience (after a major project), who may need to grow
further or use that experience in another organization and cannot do so in the
local market and therefore elect to seek opportunities outside Kenya. On the
other hand, in the supply side, some market players that secure windfall
opportunities which that are not likely to recur any time soon, will temporarily
import skills to implement and manage large projects and will do so outside any
framework that ensures transfer of skills to local professionals. Thus the issue
of skills when viewed broadly and when viewed at higher cadres, presents a
double edged sword that requires a measured approach that factors in the needs
of the market, growth of the market and resulting demand for such skills.
Changing Ecosystem: Various developments in the sector, including a unified
telecommunications licensing regime, infrastructure developments and
technological advances, have caused the local ICT Ecosystem to undergo some
metamorphosis that has gradually seen the lines blurred between traditional
telcos and traditional ICT service providers. With voice services nearing
saturation, coupled with lower tariffs, telcos have been compelled to re-think their
strategies away from both voice services and the mass market towards data
IDC
EastA
fric
a,B
uild
ing
Unit
B6,Liz
aA
part
ments
,R
hapta
Road,
Westlands,V
icto
ria
Isla
nd,P
OB
ox
10142-0
0100,
Nairobi,
Kenya
Tel:
+254
2444
1355/5
6F
ax:+
254
2444
1357

#undefined ©2011 IDC
services and enterprise solutions (cloud computing, hosted infrastructure,
managed services, etc). The overall effect has been a reduction in the number of
Tier II telcos in the market, partly as a result of some mergers and acquisitions,
and also by the gradual atrophying of traditional ISPs in the market.
Increased presence of multinational vendors: Numerousvendors have made
entries into Kenya between 2007 and 2011, and those present before that have
drastically scaled up their operations both as a result of the favorable operating
environment and also to tap into regional opportunities. However, IDC's analysis
of the channel structure in Kenya, has revealed that most vendors have a limited
pool of channel partners (distributors and Value Added Resellers) with whom
they can work with and most of the prominent channel partners are largely
foreign owned and can leverage of their regional or international networks to
avail goods and services more competitively than local players. IDC sees an
opportunity in Kenya to help local companies scale up and participate in a bigger
way and create more local employment in ICT.
Kenya as an ICT Hub: Benchmarking data collected by IDC shows that Kenya
has a mix of indicators in its favor vis a vis some of the seven countries it was
benchmarked against, mostly African countries. Some positive benchmark
items included; higher household internet penetration, higher overall internet
penetration, lower broadband tariffs and comparable business internet usage.
Indeed the business survey conducted as part of this study shows that 90% of
respondent companies have websites while 99% use email. However, as stated
above, the issue of producing and retaining higher level ICT skills needs a
measured approach to complete the picture in the business end user
environment.
Market Demand: In both the business and residential segments, there is
relatively good uptake of various ICT services though costs (of devices and some
services), quality and access (last mile, backhaul) still hold back citizens and
businesses from more wholesome consumption of ICT.
Outlook: Overall, given the considerable actions taken by the government in the
ICT sector over the last four to five years, which are starting to bear fruit and will
continue to in the years to come, there is still great scope to address some
issues including ICT skills, access (to devices and services), costs (of devices
and services) and generally nurture increased usage among both businesses
and residents. In some instances, the interventions recommended by IDC
include easy to execute awareness campaigns while others touch on existing
plans by the sector regulator (Universal Access Fund and subsidies) and multi
stakeholder intervention (academia, government and business in revising ICT
curricular, collaborating through various PPPs, etc).
©2011 IDC #undefined
T A B L E O F C O N T E N T S
P
Executive Summary 1
Key Performance Indicators 2010............................................................................................................. 1
Situat ion Overview 3
IT Environment ......................................................................................................................................... 3
In 2010, ICT spending in Kenya stood at US$ 3.5 billion with IT spending accounting for US$ 746 million andtelecom services spending at US$ 2.7 billion.Out of the IT spending, hardware accounted for 78.5%, followed byIT Services at 12.2% and Software at 9.3%. ............................................................................................ 3
Key ICT Market Drivers ..................................................................................................................... 4
Key ICT Market Inhibitors .................................................................................................................. 5
ICT Ecosystem 7
Channel Analysis - Vendors and channel performance and trends .......................................................... 8
Kenya as a regional hub ........................................................................................................................... 9
Key challenges in the sector..................................................................................................................... 9
Support expected from the government.................................................................................................... 10
Market Opportunities ................................................................................................................................ 11
Vendors' Market Outlook .......................................................................................................................... 11
Regional and International Benchmarking 13
Overview ........................................................................................................................................... 13
ICT Ski l ls Analys is 20
ICT Skills Overview................................................................................................................................... 20
IT Employment Highlights......................................................................................................................... 20
ICT Skills market trends............................................................................................................................ 24
IT Skills Gap Analysis Framework ............................................................................................................ 25
Key market highlights ............................................................................................................................... 25
Outlook ..................................................................................................................................................... 26
Usage and Penetrat ion Analys is 26
Overview................................................................................................................................................... 26
Residential................................................................................................................................................ 27
Business ................................................................................................................................................... 42
Online Government Services............................................................................................................. 45
Future Outlook 47
Forecast and Assumptions ....................................................................................................................... 47
ICT Market Expectations for 2011–2015 ........................................................................................... 47
Forecast Tables........................................................................................................................................ 49
ICT Spending..................................................................................................................................... 49
Key Forecast Assumptions ....................................................................................................................... 54
Essential Guidance 56
Actions to Consider................................................................................................................................... 56
Summary Recommendations ................................................................................................................... 58
Learn More 61
Related Research..................................................................................................................................... 61
APPENDIX I – International Benchmarking 62
#undefined ©2011 IDC
T A B L E O F C O N T E N T S — C o n t i n u e d
P
APPENDIX I I – Key Performance Indicators 64
Appendix I I I - Project Background 67
Project Benefits ................................................................................................................................. 67
Project flow........................................................................................................................................ 68
Project Outputs.................................................................................................................................. 69
Appendix I I I - Methodology 70
In-depth Market Analysis and Research ................................................................................................... 70
3 A: Understanding of the State of IT in Kenya and Local Kenya IT ecosystem................................ 70
Benchmarking of Kenya with key peer countries ............................................................................... 73
3 B: Benchmarking of KPIs of Kenya ICT Board ............................................................................... 73
3 C: Skills Gap Analysis .................................................................................................................... 75
3 D: ICT Usage and Penetration analysis.......................................................................................... 77

©2011 IDC #undefined
L I S T O F T A B L E S
P
1 Key ICT Indicators........................................................................................................................ 1
2 Total ICT Spending (US$M) by Technology 2010–2013............................................................. 50
3 Total ICT Spending (US$M) by Vertical Markets 2010–2013...................................................... 52
4 Total ICT Spending (US$M) by Business Size 2010–2013......................................................... 53
5 Key Forecast Assumptions for the Kenya ICT Market 2012–2015>............................................. 54
6 Recommendations ....................................................................................................................... 58
7 Actions by Macro Areas ............................................................................................................... 60
8 Benchmarking .............................................................................................................................. 62
9 Key Performance Indicators ......................................................................................................... 64
10 Project Benefits ............................................................................................................................ 68

#undefined ©2011 IDC
L I S T O F F I G U R E S
P
1 Kenya ICT Market Size 2010 and Forecast to 2015..................................................................... 3
2 IT Spending Share by top 5 verticals ........................................................................................... 4
3 Channel and Market Structure .................................................................................................... 7
4 Total Internet Penetration (users as a % of population) ............................................................... 14
5 Total Internet penetration vs Household Internet Penetration ...................................................... 15
6 Internet Users vs. Connections as a % of Population .................................................................. 16
7 Total Internet Penetration Vs. Proportion of Households with a computer ................................... 17
8 Business Internet Usage .............................................................................................................. 18
9 Broadband Access Tariffs - $....................................................................................................... 19
10 IT Employment vs IT Spending .................................................................................................... 21
11 Demand Prediction by Professionals ........................................................................................... 21
12 Demand/Availability Matrix by IT Professions .............................................................................. 22
13 Demand Prediction by IT Skills .................................................................................................... 23
14 IT Skills Gap Analysis Framework................................................................................................ 25
15 Reasons for not having an internet connection ............................................................................ 27
16 Devices Used to Access the Internet ........................................................................................... 29
17 Primary purpose for using a PC ................................................................................................... 30
18 Services actively used on a mobile device................................................................................... 31
19 Confidence in Using a PC ............................................................................................................ 32
20 Confidence in Using the Internet .................................................................................................. 33
21 Residents' Online Presence ......................................................................................................... 34
22 Internet usage .............................................................................................................................. 35
23 Financial Transactions on the Internet and Mobile....................................................................... 36
24 Satisfaction with Internet Services ............................................................................................... 37
25 Awareness of online government services................................................................................... 38
26 Online government services used ................................................................................................ 39
27 Barriers to ICT usage ................................................................................................................... 40
28 Business Online Presence ........................................................................................................... 42
29 Internet Connection (Business Internet Speeds).......................................................................... 43
30 Constraints for Internet Usage ..................................................................................................... 44
31 Total number of full time employees that have access to or use shared / dedicated PC ............. 45
32 Usage of e-government services.................................................................................................. 46
33 Satisfaction with e-government services ...................................................................................... 47
34 Ecosystem.................................................................................................................................... 70
35 Methodology................................................................................................................................. 71
36 Benchmarking .............................................................................................................................. 73
37 Skills Gap Analysis....................................................................................................................... 75
38 Usage and penetration Analysis................................................................................................... 77

©2011 IDC #undefined


©2011 IDC #undefined 1
E x e c u t i v e S u m m a r y
K e y P e r f o r m a n c e I n d i c a t o r s 2 0 1 0
T A B L E 1
K e y I C T I n d i c a t o r s
Indicators Data
Volume of international traffic (Mbps) 20,209.56 Mbps
International Internet bandwidth, Mbps per 10,000 population 4.2
Number of Computers per 100 inhabitants 2.4
% of households with a personal computer 6.3
Total number of Internet Subscriptions 4,716,977
Total number of internet users 10,199,836
% of population with Internet Access 25.9
Internet subscribers as % of total population 11.5
Total number of main fixed lines (fixed lines plus fixed wireless) 380.748
Total number of mobile subscriptions 24,968,891
Number of .Ke domain names 18,000
% of organizations with a website 90
% of full time employees who use internet for work at least once a
week
52.1
Source: IDC, CCK, e-Gov, WEF, World Bank, Kenic
The premise behind establishing and subsequently tracking key ICT indicators in this
study is to provide a means to both measure the impact of government interventions
have had on the sector as well as to showcase the sector to possible investors who
may want to benchmark Kenya against other competing markets as an investment
destination and also to illustrate the level of development in the sector.
Overall these indicators are also crucial to non ICT investors whose businesses are
very dependent on ICT, including players in the financial sector, telecommunications,
manufacturing, etc.
IDC's research has identified some key developments in Kenya's ICT space between
2007 and 2011, that illustrate where there has already been an impact in these
indicators and has helped in growing the market, attracting investment and creating
employment.

2 #undefined ©2011 IDC
They include the following
International Bandwidth - The arrival of three submarine cables between 2009 and
2010 helped wean operators off expensive satellite capacity and allowed for greater
speeds at lower costs for consumers. However, despite this extra capacity, there still
remain challenges in final access as well as development of suitable pricing models
(reseller and final end user).
Terrestrial Infrastructure - The development of these cables spurred investment in
terrestrial segments chief among them being the government led National Optic Fiber
Backbone Infrastructure (NOFBI) project that seeks to cover all major towns in Kenya.
Indeed one of the first cables to go live, TEAMS (The East African Marine System)
was a government led initiative in conjunction with UAE's national operator Etisalat,
which later was opened to include private sector operators from Kenya.
In total Kenya's international bandwidth has grown more than tenfold in two years
from xxxx mbps to xxxx mbps.
Unified Licensing Regime - The introduction of a unified licensing framework that
simplifies the market structure and allows operators more latitude in terms of service
offerings rather than having licenses tied to technology dependent delivery. This
framework has also allowed for better stratification of the market along the lines of
services, infrastructure, content and applications. Under this new regime, several
mobile operators acquired ISP licenses to add to their existing mobile and
international gateway licenses and started offering mobile based internet services
which have seen residential connectionsgrowing exponentially over the last 2-3 years.
Presently nearly 90% of all connections are mobile device based connections and
many used by individuals.
Cost of Mobile Services and Mobile Termination Tariffs – The intervention by the
sector regulator, the Communications Commission of Kenya (CCK) to determine
maximum mobile termination rates saw mobile voice tariffs plunge downwards to half
the costs. Indeed Kenya now has among the lowest mobile tariffs in Africa and this
has resulted in increased subscriptions and consumption of services.
Summary - Overall the above developments have impacted key aspects of the
Kenyan ICT market including better communications infrastructure for enterprises and
residents, increased uptake of services, lower tariffs for voice and data services,
increased usage of computers (given the value addition from affordable internet
access and inherent content), more sophistication among business and residential
users, among many other positive developments.
However, a lot more needs to be done and by establishing these baseline
performance indicators, that in itself can help determine what courses of action might
be needed to stimulate the market further.
Thus for this study a second phase is envisaged to review these baseline indicators,
note any areas that have changed significantly and perhaps attribute certain actions
by government, investors or service providers to such changes and continually
monitor such developments in an effort to steer the sector in the right direction.
S I T U AT I O N O V E R V I E W
I T E n v i r o n m e n t
In 2010, ICT spending in Kenya stood at US$ 3.5 billion with IT spending accounting
for US$ 746 million and telecom services spending at US$ 2.7 billion. Out of the IT
©2011 IDC #undefined 3
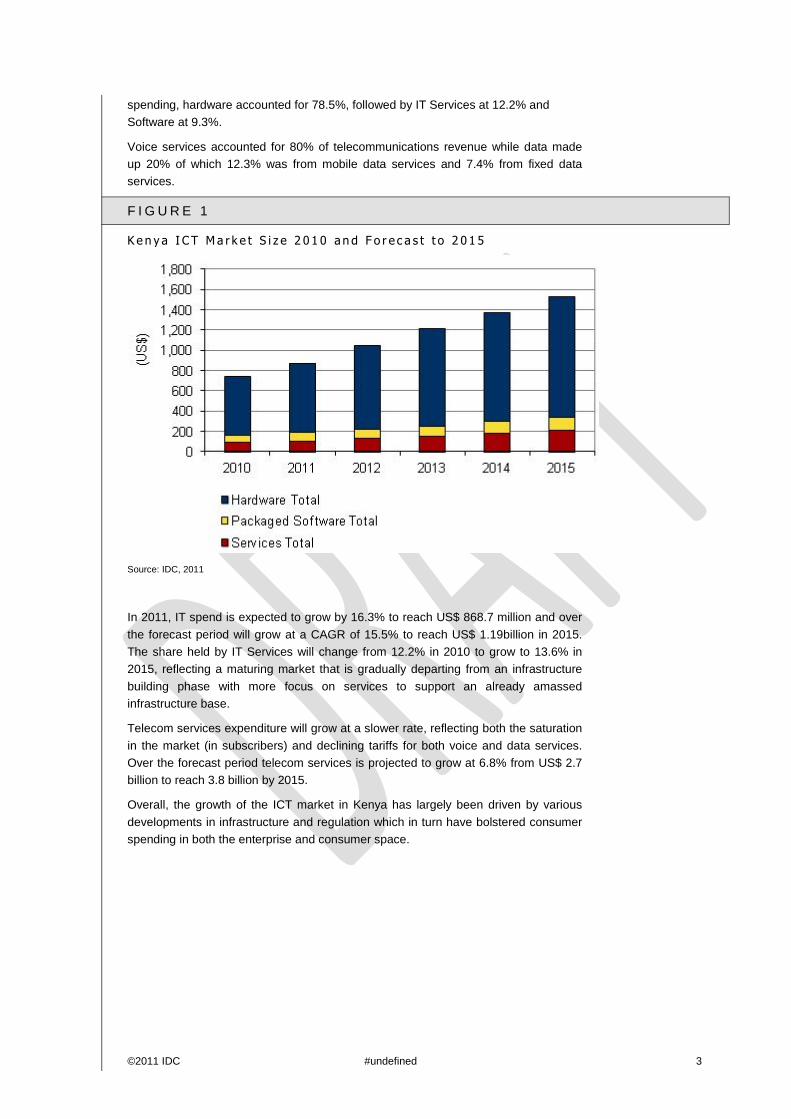
spending, hardware accounted for 78.5%, followed by IT Services at 12.2% and
Software at 9.3%.
Voice services accounted for 80% of telecommunications revenue while data made
up 20% of which 12.3% was from mobile data services and 7.4% from fixed data
services.
F I G U R E 1
K e n y a I C T M a r k e t S i z e 2 0 1 0 an d F o r e c a s t t o 2 0 1 5
Source: IDC, 2011
In 2011, IT spend is expected to grow by 16.3% to reach US$ 868.7 million and over
the forecast period will grow at a CAGR of 15.5% to reach US$ 1.19billion in 2015.
The share held by IT Services will change from 12.2% in 2010 to grow to 13.6% in
2015, reflecting a maturing market that is gradually departing from an infrastructure
building phase with more focus on services to support an already amassed
infrastructure base.
Telecom services expenditure will grow at a slower rate, reflecting both the saturation
in the market (in subscribers) and declining tariffs for both voice and data services.
Over the forecast period telecom services is projected to grow at 6.8% from US$ 2.7
billion to reach 3.8 billion by 2015.
Overall, the growth of the ICT market in Kenya has largely been driven by various
developments in infrastructure and regulation which in turn have bolstered consumer
spending in both the enterprise and consumer space.

4 #undefined ©2011 IDC
F I G U R E 2
I T S p en d i n g S h a r e b y t o p 5 v e r t i c a l s
Source: IDC, 2011
The three top key sectors contributing to IT Spending in 2010 were Communications
(20.5%), Financial (including insurance and other financial services – 12.9%) and
government (including public sector education - 14.7%). The combined consumer
segment accounted for 14.9% of IT spending.
The communications sector has seen very robust in recent years owing to
technological, infrastructural and regulatory effects on the businesses. Further, recent
departures from the mass market, coupled with an increased focus on data services
(for both enterprise and consumers) has sustained spending on various IT projects in
infrastructure, new services, network upgrades and expansion.
The financial sector remains consistently a big player thanks to rigid hardware
renewal cycles, software upgrades, enhancements to applications and integration of
new technologies and platforms (mobile) and data centre related expenses.
Efforts by government to cut procurement costs, enhance transparency and improve
governance, through various ICT systems, has seen it become a major player. The
Kenyan government has in the last year articulated its shared services and e-
government strategies and intends to consolidate its systems and break away from
having discrete systems and multiple operating environments.
Key ICT Market Drivers
Connectivity – between 2009 and 2011, better access and higher speeds have
helped both businesses and residents increase their uptake in data services and
devices. Lower bandwidth costs passed on to consumers, mainly by mobile
operators, have helped stimulate sales of mobile devices (smart phones, laptops
and tablets) in the market and in the business segment, have supported
initiatives to deploy cheaper wide area networking (WAN) technologies like
Virtual Private Networks.
Growth of basic IT skills – Skills mainly nurtured in a nascent BPO sector albeit
only for IT enabled front office services (help desk, contact centre, etc) have
helped bigger market players make the transition to outsourcing such services
and encouraging new business practices to develop around this and creating
employment.
©2011 IDC #undefined 5
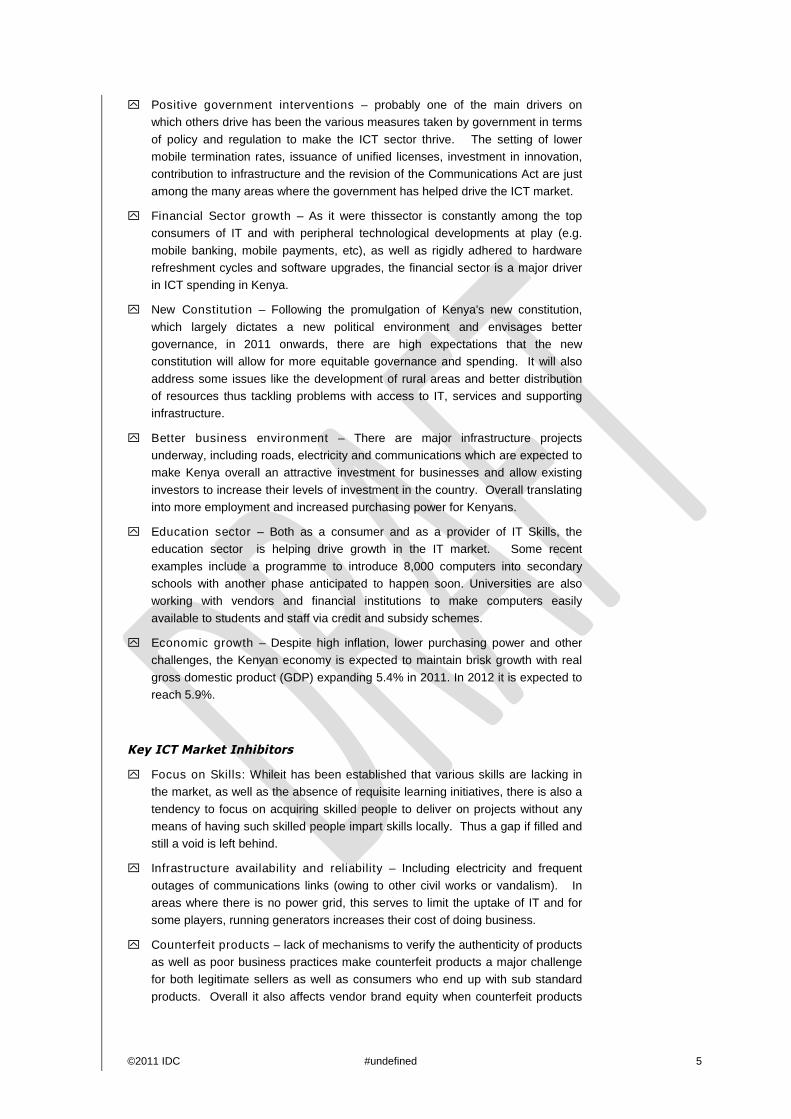
Positive government interventions – probably one of the main drivers on
which others drive has been the various measures taken by government in terms
of policy and regulation to make the ICT sector thrive. The setting of lower
mobile termination rates, issuance of unified licenses, investment in innovation,
contribution to infrastructure and the revision of the Communications Act are just
among the many areas where the government has helped drive the ICT market.
Financial Sector growth – As it were thissector is constantly among the top
consumers of IT and with peripheral technological developments at play (e.g.
mobile banking, mobile payments, etc), as well as rigidly adhered to hardware
refreshment cycles and software upgrades, the financial sector is a major driver
in ICT spending in Kenya.
New Constitution – Following the promulgation of Kenya's new constitution,
which largely dictates a new political environment and envisages better
governance, in 2011 onwards, there are high expectations that the new
constitution will allow for more equitable governance and spending. It will also
address some issues like the development of rural areas and better distribution
of resources thus tackling problems with access to IT, services and supporting
infrastructure.
Better business environment – There are major infrastructure projects
underway, including roads, electricity and communications which are expected to
make Kenya overall an attractive investment for businesses and allow existing
investors to increase their levels of investment in the country. Overall translating
into more employment and increased purchasing power for Kenyans.
Education sector – Both as a consumer and as a provider of IT Skills, the
education sector is helping drive growth in the IT market. Some recent
examples include a programme to introduce 8,000 computers into secondary
schools with another phase anticipated to happen soon. Universities are also
working with vendors and financial institutions to make computers easily
available to students and staff via credit and subsidy schemes.
Economic growth – Despite high inflation, lower purchasing power and other
challenges, the Kenyan economy is expected to maintain brisk growth with real
gross domestic product (GDP) expanding 5.4% in 2011. In 2012 it is expected to
reach 5.9%.
Key ICT Market Inhibitors
Focus on Skills: Whileit has been established that various skills are lacking in
the market, as well as the absence of requisite learning initiatives, there is also a
tendency to focus on acquiring skilled people to deliver on projects without any
means of having such skilled people impart skills locally. Thus a gap if filled and
still a void is left behind.
Infrastructure availability and reliability – Including electricity and frequent
outages of communications links (owing to other civil works or vandalism). In
areas where there is no power grid, this serves to limit the uptake of IT and for
some players, running generators increases their cost of doing business.
Counterfeit products – lack of mechanisms to verify the authenticity of products
as well as poor business practices make counterfeit products a major challenge
for both legitimate sellers as well as consumers who end up with sub standard
products. Overall it also affects vendor brand equity when counterfeit products

6 #undefined ©2011 IDC
fail and where the consumer cannot distinguish between genuine and counterfeit
products.
Relative maturity of the market – Presently the Kenyan market is largely
unsophisticated and the number of major enterprise users of IT are not many.
This presents a unique mix of conditions whereby the size of IT projects done
help limit the number of professionals in the industry and also encourage high
staff turnover especially in IT Departments.
Change of guard – A most commonly cited problem in the industry has to do
with the change of decision makers and leadership in various government
departments especially with regard to the initiation of collaboration programmes
and projects. Some vendors reach the point of signing an MoU but are
frustrated when there are such changes and the projects wither stall or do not
take off at all.
Politics – With an election looming in 2012 and no clear indication of the dates
will be a cause for disquiet in the sector as businesses adopt a wait and see
stance and while at the same time the government holds back on some ICT
expenditure in order to finance the election. At the periphery, electioneering
may disrupt policy and other discussions in parliament and elsewhere.
Taxes - Taxes levied on certain IT products like copiers will curtail growth for
these as well as encourage the proliferation of refurbished copiers into the
market, which, just like counterfeiting, may affect brand equity.
Currency – In 2011 the Kenyan shilling has lost ground to major currencies,
meaning higher import costs for IT distributors and in turn affecting how much
inventory they can acquire and hold. Should the trend persist, this will not only
affect the IT Sector but overall other sectors that depend on imported inputs
(Agriculture, Manufacturing, etc).

©2011 IDC #undefined 7
I C T E C O S Y S T E M
The supply side of the market is presently dominated by a few major players
(excluding vendors) who participate in the bulk of ICT projects in the country. These
include some foreign owned companies.
Overall, vendors present in the country are fairly satisfied with the business
environment and are increasing their investment and headcount in anticipation of
increased sales both in Kenya and in the greater Eastern Africa region.
With the entry of new vendors, it can be expected that the channel partnerships will
grow or the need for diverse channel partners will grow. Bearing in mind the
challenges faced by Tier II companies, as outlined later in this section, this
underscores the need for a broad base of providers to which new and existing
vendors can have access.
Smaller players, Tier II players, who are typically Kenyan owned companies, need to
be supported and provided with an environment that can help them grow and
participate in large deals. These players presently only focus on part of the SME
market and the consumer market and are typically regional players (provincial level)
without much technical or financial capacity to take on country wide or big projects.
F I G U R E 3
C h an n e l a n d M a r k e t S t r u c t u r e
Source: IDC, 2011
C h a n n e l A n a l y s i s - V e n d o r s a n d c h a n n e l
p e r f o r m a n c e a n d t r e n d s
IDC's interviews with vendors in the market, indicate that Kenya has, over the last
three years, provided a very conducive environment for business, as evinced by their
growth in both headcount and business between 2009 and 2011.
8 #undefined ©2011 IDC
Government initiatives including infrastructure development, regulatory reforms
(licensing frameworks), investment in public access centers, e-government projects,
content creation, device subsidies, have all had a very positive effect in transforming
the market, stimulating investment, stimulating ICT uptake and bolstering confidence
in the overall ICT market.
Among the highlights of feedback received from vendors include:
There are an estimated 20-30 vendors present in the market most of whom rely
on a small pool of major distributors and Tier 1 Value Added Resellers (VARs)
and Dealers who combined account for the bulk of ICT Business in Kenya
estimated at nearly 50-60%.
On average PC and Printer vendors each have between three to four distributors
and at least six other partners (dealers and systems integrators) each at different
market levels.
At the lower part of the pyramid are Tier 2 VARs and dealers, estimated to
number more than 100 players and whose focus is part of the SME segment, the
SMME and home user segment. These are players who typically do not have a
country wide presence and would largely be found operating at a provincial level
or even a national level (where SMEs have such a presence to require
nationwide services) but at a smaller scale nonetheless.
These Tier 2 firms are mostly Kenyan owned companies serving other Kenyan
owned businesses and occasionally securing parts of relatively good contracts in
the government and education segments, where procurement of goods or
services may require a local player.
The Tier I players largely comprise companies with both a national and regional
presence, and in most instances are majority foreign owned companies spinning
off regional offices in South Africa, UAE, India among other countries.
Owing to having a good foothold in their parent regions, coupled with access to
industry best practices, fairly solid skills bases and access to capital, such
companies have been able to target the market segment that includes
multinational companies (MNCs), large enterprises and government, where such
credentials bear heavily on decision making at this level.
Vendor competition on channel partnerships has intensified with main distributors
being sought after by other vendors to leverage on their reseller network. Thus
multiple brand handling by the channels is the norm even for channel partners
who were "loyal" to certain vendors.
The channel is maturing fast with thinning out of grey shipments while traditional
telcos and their channel partners are joining the fray in terms of PC sales.
Vendors are keen on setting up offices in Kenya to serve the East and Central
Africa region.
Vendors with a local presence enhance the brand image significantly as well as
improve logistical support and increased marketing campaigns.
With more vendors setting up locally, the market has seen an increase in both
the number of channel partners.
Government initiatives including infrastructure development, regulatory reforms
(licensing frameworks), investment in public access centers, e-government
projects, content creation, device subsidies, have all had a very positive effect in
transforming the market, stimulating investment, ICT uptake and bolstering
confidence in the overall ICT market.

©2011 IDC #undefined 9
Thus vendors present in Kenya have registered positive growth over the last
three years of between 15-25% in business value and with some posting growth
in headcount ranging between 25-100%
K e n y a a s a r e g i o n a l h u b
Kenya is without doubt the regional hub for most vendors with a regional reach
spanning between three to six countries on average for vendors. Aside from being a
hub, it is also a stepping stone for these vendors to set up operations in neighboring
countries but still maintaining somewhat centralized marketing, inventory and support
functions at regional levels. Inherent in this structure are various opportunities
including training, skills transfer, overall higher employment, technology leadership
and increased investment.
Among the most common countries some vendors reach into include from their
Kenyan hub include:Uganda, Tanzania, Rwanda, Burundi, Ethiopia and Southern
Sudan.
In some instances vendor offices in Kenya have an even wider geographic reach with
some having sub-Saharan hubs or combined hubs for East Africa, West Africa and
Indian Ocean Islands.
Typically these regional hubs would have parent or principal offices in South Africa,
United Arab Emirates or various countries in Europe but with sufficient autonomy in
terms of marketing, channel management and partnerships.
K e y c h a l l e n g e s i n t h e s e c t o r
Purchasing Power – In the present environment where inflation hovers around
the 20% mark, the consumer market has been negatively impacted, especially in
the lower echelons where in some cases ICT spending, including mobile voice
services, will take second place to other pressing needs. So when viewed as the
long tail end of the market, a lot less spending is being registered in terms of
device sales and services consumption.
Taxation – Despite positive developments to remove import duty and value
added tax (VAT) on computers and printers, the present taxation regime for
consumables and components, especially amidst a rather unclear taxation
framework that does not always properly define various ICT imports, affects
various channel players including local assemblers.
Product Perception – The Kenyan market is mostly inclined towards western
brands or brands associated with western countries. For players from Asia and
the Middle East, gaining a foothold in the market and at the same time
commanding prices that are on par to reflect similar product quality, has been
cited as a major challenge.
Lengthy customs procedures–Both Vendors and Distributors have cited
lengthy customs procedures as a stumbling block affecting how fast they are able
to place products on the market, and further compounding this issue are
demurrage costs levied by customs authorities, which costs in many instances
are passed on to end user and therefore needlessly causing higher prices.
Sourcing highly qualified talent – This issue is dealt with in detail under the
SKILLS section of this report but suffice to say, for some vendors, especially
those playing in the enterprise space, the issue of availability and quality of ICT
Skills is a constant problem that in some cases greatly affects their go to market
10 #undefined ©2011 IDC
strategies and sometimes necessitates the use of expatriates to undertake
project implementation, technical sales, support and end user training.
Currency fluctuation– Therecent decline of the Kenya shilling against major
currencies, mainly between April and October 2011, has meant higher Kenya
shillings costs for importers and in many instances affects their ability to maintain
an adequate inventory. At the consumer end, it has meant higher prices of
goods. The currency decline has been attributed to increased oil imports and
should this be sustained in 2012, it will affect the over market negatively including
the manufacturing sector that rely on imports of some raw materials, putting ICT
consumers in a quandary in terms of prioritizing their budgets.
Government Procurement - Doing business with the government has widely
been cited as a major challenge in terms of protracted procurement laws and
sales cycles. Impropriety and lack of transparency are other factors that need to
be addressed.
S u p p o r t e x p e c t e d f r o m t h e g o v e r n m e n t
In view of some of the challenges cited above, and thinking very broadly about what
else could be done in the ICT market, the following were among the interventions
vendors feel the government should consider to help allay their collective concerns:
Taxation rates - Review of taxation regimes on accessories, components and
consumables
Taxation categories - Education of customs officials on the different array of ICT
products to ensure correct application of import duties which can also help speed
up clearing of goods.
Counterfeits – The government should undertake awareness campaigns to
enlighten end users as well as customs officials on how to detect and manage
counterfeit imports.
Copyright laws – More so the execution of existing Copyright laws. Vendors
feel that there are adequate laws expect that they are not upheld.
ICT Labor market – To stave off the need to import labor for various projects, or
to constantly ship in expatriates to implement projects, vendors feel there is room
for the government to create, nurture and then protect jobs by strongly vetting
imported labor and ensuring some skills transfer takes place. One additional
suggestion pertains to finding a mechanism to establish the value chain in ICT
jobs (where is the value added and to which participants does this accrue) to
overall gauge how much ends up in the local market.
Procurement Standards - Opening up procurement standards to allow a greater
variety of software and hardware providers to bid for government jobs would
ease the country’s adoption of technology on a large scale.
Overall the type of interventions required of the government do not require significant
investment and can be operationalised using existing channels and with relative ease
of implementation but of course bearing in mind the likely impact of such interventions
e.g. lower tax rates = lower revenues.
M a r k e t O p p o r t u n i t i e s
Despite the challenges cited earlier in this document but partly subject to various
interventions by the government, looking ahead, vendors have articulated the
following opportunities in the market:
©2011 IDC #undefined 11
Skills development - Amajor factor that even affects the businesses side of the
environment in terms of innovation, adoption of technology and advanced
services. If this can be tackled appropriately, the Kenyan ICT market can
mature further and become more sophisticated.Further Skills gaps are
opportunities where channel partners can intervene themselves rather than leave
it up to vendors to acquire and maintain the skills. Channel partners can develop
their own existing staff to meet some of these positions and leave the vendor to
have a basic presence - a sort of shift down the tier and in line with the earlier
stated objective to deepen intimacy with customers and strengthen the channel.
Infrastructure - Further infrastructure investment, mainly in last mile access and
the quality of existing networks is crucial for more pervasive adoption and
consumption of services.
Counterfeit Products – The success of such products in the market is evidence
enough that demand exists. Addressing the problem of counterfeit products
(consumables, devices), with support of relevant government departments (in
terms of scrutiny, enforcement and standards) can help normalize the market
and breed the right culture where consumers opt for quality goods. Further,
replacing such products with genuine products can help increase tax revenues
owing to the price differences.
V e n d o r s ' M a r k e t O u t l o o k
Given the relatively favorable market environment, vendors remain optimistic about
the Kenyan market and see various opportunities that they themselves can drive
to support the growth of the ICT market in the years to come.
Among the areas vendors feel they can validly play a role include:
Investing in specific ICT Skills like mobile applications development and setting
up innovation hubs.Setting up bursaries at universities and within user and
developer groups
Developing strategies to develop and use more local talent than imported.
Introduction of products relevant to the market that take into account the
operating environment and challenges experienced by users e.g. solar powered
devices.
Increased participation in government driven ICT programmes. Some vendors
are watching very keenly on developments with the proposed Konza Digital City
with a view to examining how they can participate and possibly use that
opportunity to enhance their regional presence and investment.
Deepen customer relations as more intimacy is needed in the market.
Reforming go to market strategies in line with a changing ecosystem
underpinned by technological and other developments.
Increase presence in the region, headcount and channel partnerships.
Enhance vertical sector and product specializations – in terms of skills, niche
products and their go to market approach.
Focus on infrastructure issues and address those elements that are not within
the ambit of government e.g. terminal devices/equipment, asset finance
schemes, etc.
12 #undefined ©2011 IDC
R E G I O N AL AN D I N T E R N AT I O N A LB E N C H M AR K I N G
Overview
Various benchmarking criteria were identified and Kenya was compared to seven
other countries – 5 from the African continent (Egypt, Morocco, RSA, Nigeria and
Rwanda) and 2 from the rest of the world (Ukraine and Philippines).
The factors considered while identifying these countries were
1. Population.
2. Economic Indicators such as GDP.
3. Focus on IT sector as an engine of economic growth.
4. Perceived competitiveness to Kenya (e.g. South Africa, Rwanda, and Nigeria).
In order to benchmark the countries, indicators were chosen that provided insights on
the level of penetration and adoption of technology in day to day life of the country.
The sections below highlight various comparisons on different ICT indicators.
F I G U R E 4
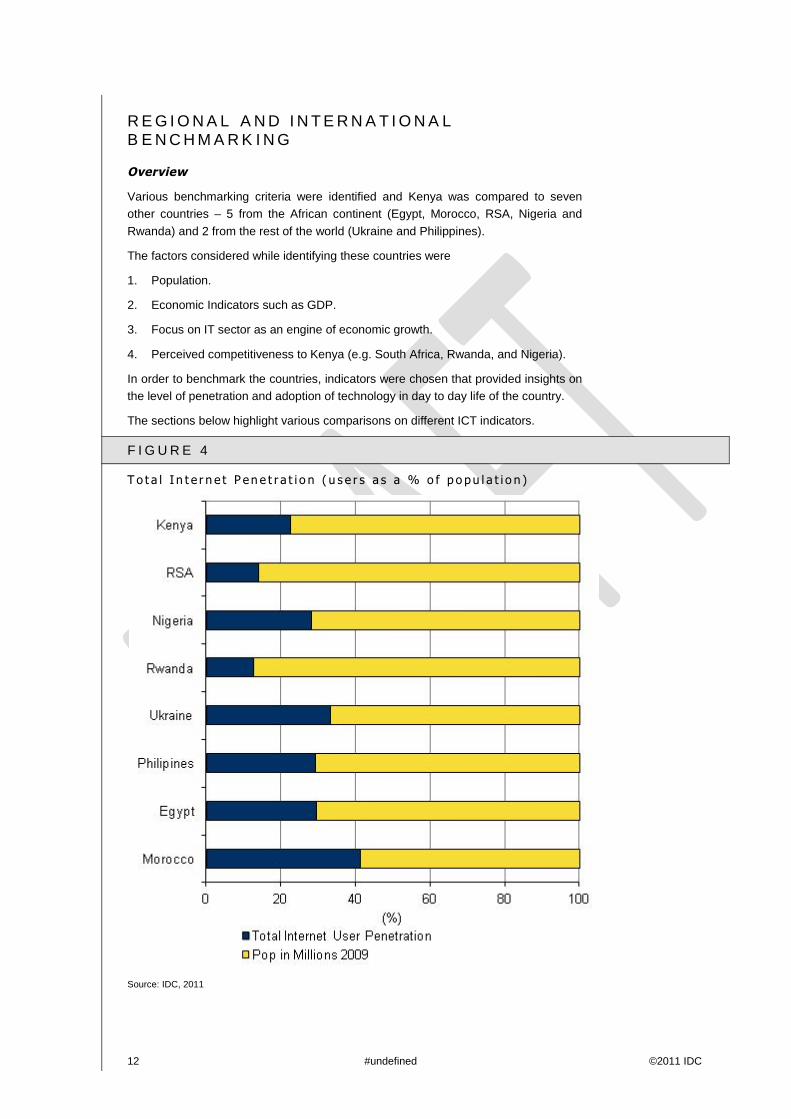
T o t a l I n t e r n e t P en e t r a t i o n ( u s e r s a s a % o f p o pu l a t i o n )
Source: IDC, 2011
©2011 IDC #undefined 13
Comparatively speaking, Kenya is not very far behind in terms of the number of
internet users in the population, and surprisingly posting better penetration rates than
South Africa which is perceived to be more advanced, and only slightly lower than
Egypt and the Philippines.
Owing to infrastructural developments, Kenya is ahead of neighboringland-locked
Rwanda which relies on its bandwidth both from satellite providers and terrestrial
providers in Uganda and Kenya thus presupposing higher bandwidth rates and
therefore lower consumption.
It can be expected that with positive developments in the Kenyan market which are
yet to manifest fully, that Kenya's internet penetration will increase in the coming
years to become even more comparable or exceed countries like Morocco and
Ukraine.
F I G U R E 5
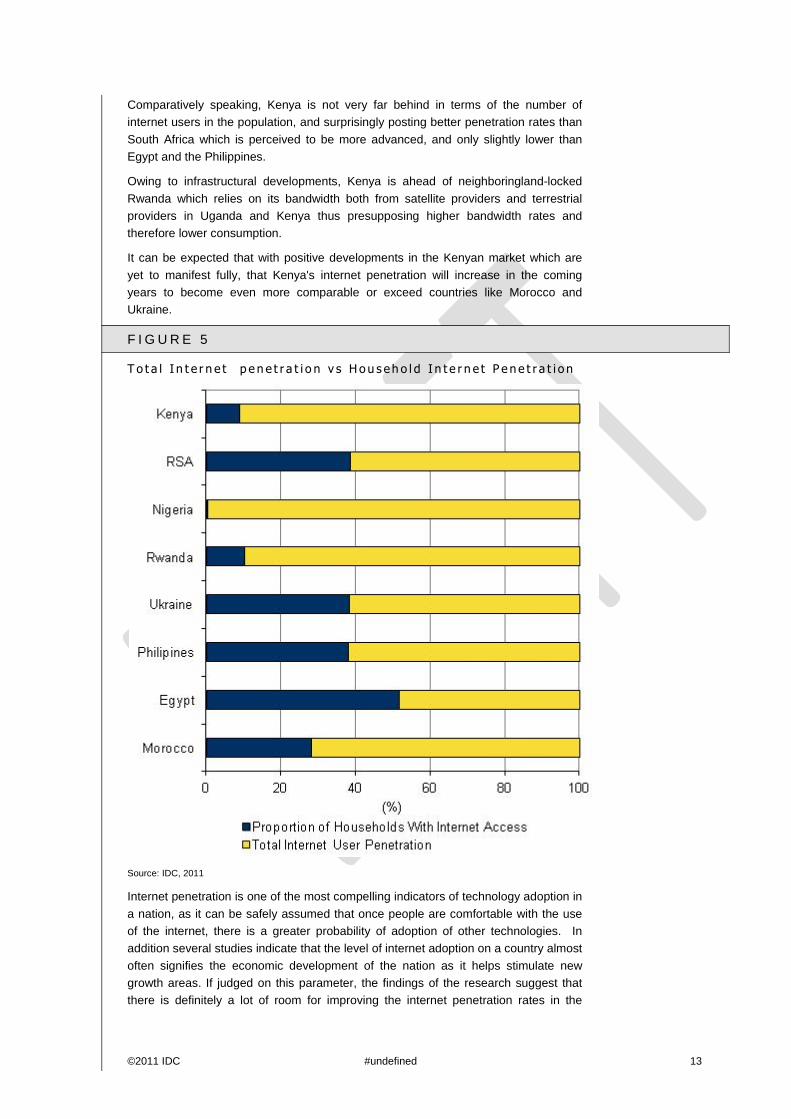
T o t a l I n t e r n e t p e n e t r a t i o n v s H o u s eh o l d I n t e r n e t P e n e t r a t i o n
Source: IDC, 2011
Internet penetration is one of the most compelling indicators of technology adoption in
a nation, as it can be safely assumed that once people are comfortable with the use
of the internet, there is a greater probability of adoption of other technologies. In
addition several studies indicate that the level of internet adoption on a country almost
often signifies the economic development of the nation as it helps stimulate new
growth areas. If judged on this parameter, the findings of the research suggest that
there is definitely a lot of room for improving the internet penetration rates in the

14 #undefined ©2011 IDC
countries studied. The reasons for a low internet penetration rate could be cost of
accessing the internet ( internet affordability) as also could be regulations that
prevent Internet service providers from entering a country. Kenya , with just over 20%
internet penetration, stands among the countries with lower penetration in comparison
to countries such as Morocco and Ukraine. Though it is understandable the costs of
internet access could be a major contributor to the widespread uptake of internet, it
could also be worthwhile to investigate other aspects such as regulations governing
Internet Service providers etc.
To further validate the point of shared internet connections, household penetration of
internet was considered as a proportion of total internet penetration. This matrix
revealed important facts about the use of internet in addition to its availability. In
Kenya, it was found that, in comparison to the total internet penetration rates (which
touched 23%), only 2% of the households had internet access. This shows that
internet uptake is most prevalent at the business, education and government levels
and not so much in households.
Kenya has a higher internet penetration vis a vis South Africa but mainly bolstered by
mobile internet connections though with a lower proportion of households connected
owing to a declining fixed network and poor development of DSL based services.
Kenya compares much better than both Nigeria and Rwanda on both counts.
Egypt has a much higher overall and household internet penetration with a huge gap
of almost 25 percentage points at household level.
©2011 IDC #undefined 15
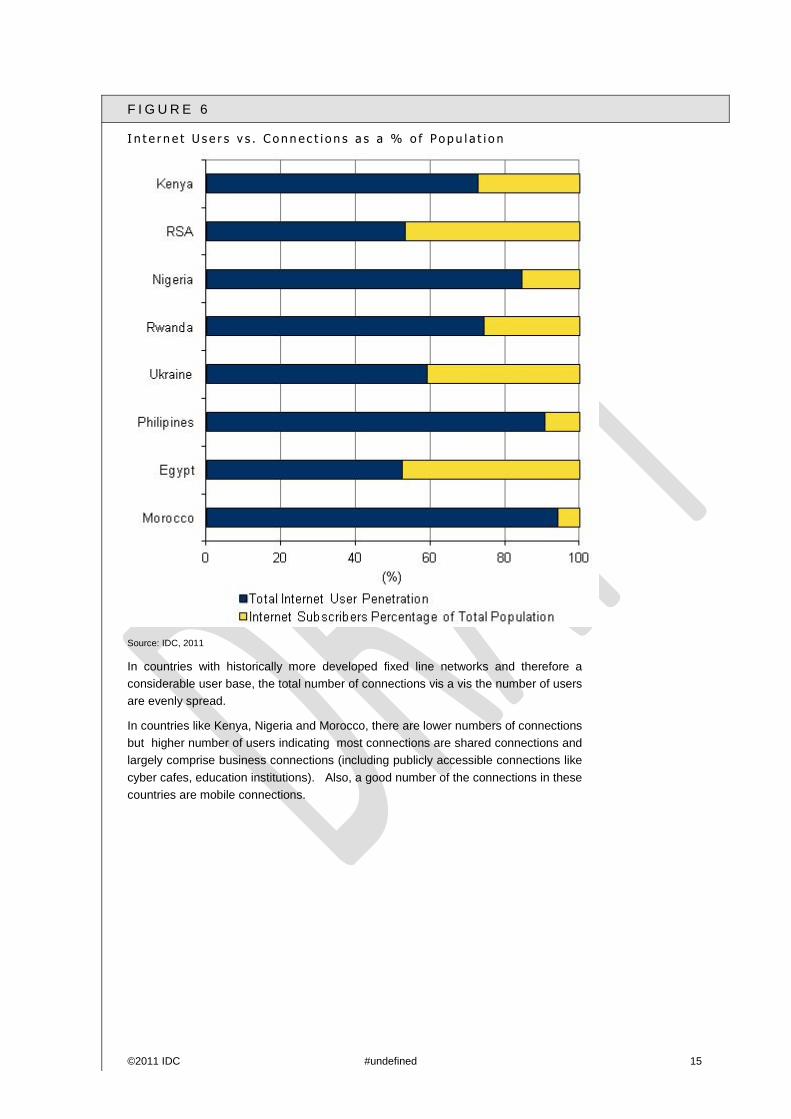
F I G U R E 6
I n t e r n e t U s e r s v s . C o n n e c t i o n s a s a % o f Po p u l a t i o n
Source: IDC, 2011
In countries with historically more developed fixed line networks and therefore a
considerable user base, the total number of connections vis a vis the number of users
are evenly spread.
In countries like Kenya, Nigeria and Morocco, there are lower numbers of connections
but higher number of users indicating most connections are shared connections and
largely comprise business connections (including publicly accessible connections like
cyber cafes, education institutions). Also, a good number of the connections in these
countries are mobile connections.

16 #undefined ©2011 IDC
F I G U R E 7
T o t a l I n t e r n e t P en e t r a t i o n V s . P r o po r t i o n o f H o u s eh o l d s w i t h a
c o m pu t e r
Source: IDC, 2011
Further investigation was carried out in this manner to identify if the internet
penetration at a household level was owing to the lack of suitable infrastructure.
Taking into account the number of computers per 100 populations, it was found that
Kenya ranked among the bottom three among the countries studied. While RSA had
8.4 computers per 100 population and Philippines had 7.2, Kenya had 1.4 computers
per 100 populations, only marginally better than Nigeria and Rwanda. This
corroborates the finding that out of the 6% of the households that had a computer
only 2% had access to internet. Therefore it can be safely assumed that internet or
technology affordability in general should be addressed so that it is made available to
a larger proportion of the population. Another approach could be to emulate countries
such as Egypt that nurture private public partnerships, wherein private sector
companies lends support in providing the hardware to get more people to use the
internet.
Overall Kenya has a slightly higher PC penetration rates than Nigeria and Rwanda
but still very far behind South Africa and Morocco, mostly owing to lower disposable
income than these countries.
In terms of PC Access at the household level, Kenya is only better than Rwanda and
more attention should be given to this aspect.

©2011 IDC #undefined 17
It should be noted that Nigeria as a manufacturer of PCs (Zinox brand) that are
locally affordable, accounts for much higher PC penetration at household levels but
negligible household internet penetration given infrastructure issues (submarine
cables arrived way after they did in East Africa)
F I G U R E 8
B u s i n e s s I n t e r n e t U s ag e
Source: IDC, 2011
Moving on from households to businesses, and using a WEF indicator that measures
the extent of business use, it was found that Kenyan businesses use internet to a
large extent and is comparable to one of the more developed business nations in
Africa namely Republic of South Africa. This is an important determinant in the future
of Kenya as an outsourcing hub as this indicator is a silent endorsement of the fact
that Kenyan businesses have reasonably robust technology support.
Overall all that may be needed in this segment is greater sophistication and direction
towards more solid online presence over and above websites and use of email to
electronic trading. Given that mobile technology is very pervasive, this platform
offers the most ideal way for businesses to engage more with their consumers.
18 #undefined ©2011 IDC
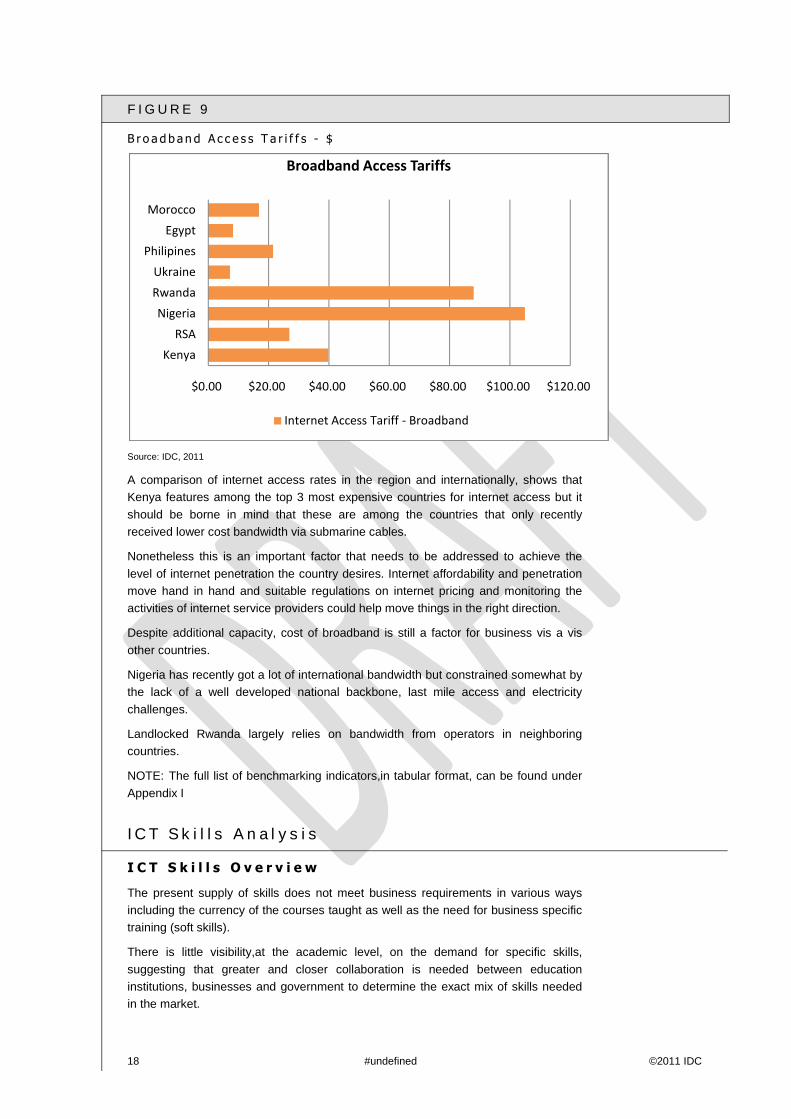
F I G U R E 9
B r o a d b an d A c c e s s T a r i f f s - $
Source: IDC, 2011
A comparison of internet access rates in the region and internationally, shows that
Kenya features among the top 3 most expensive countries for internet access but it
should be borne in mind that these are among the countries that only recently
received lower cost bandwidth via submarine cables.
Nonetheless this is an important factor that needs to be addressed to achieve the
level of internet penetration the country desires. Internet affordability and penetration
move hand in hand and suitable regulations on internet pricing and monitoring the
activities of internet service providers could help move things in the right direction.
Despite additional capacity, cost of broadband is still a factor for business vis a vis
other countries.
Nigeria has recently got a lot of international bandwidth but constrained somewhat by
the lack of a well developed national backbone, last mile access and electricity
challenges.
Landlocked Rwanda largely relies on bandwidth from operators in neighboring
countries.
NOTE: The full list of benchmarking indicators,in tabular format, can be found under
Appendix I
I C T S k i l l s An a l y s i s
I C T S k i l l s O v e r v i e w
The present supply of skills does not meet business requirements in various ways
including the currency of the courses taught as well as the need for business specific
training (soft skills).
There is little visibility,at the academic level, on the demand for specific skills,
suggesting that greater and closer collaboration is needed between education
institutions, businesses and government to determine the exact mix of skills needed
in the market.
$0.00 $20.00 $40.00 $60.00 $80.00 $100.00 $120.00
Kenya
RSA
Nigeria
Rwanda
Ukraine
Philipines
Egypt
Morocco
Broadband Access Tariffs
Internet Access Tariff - Broadband

©2011 IDC #undefined 19
Presently some skills gaps are temporarily met via expat labor though it does not
always translate into skills transfer to locals. Thus when projects are completed, a
void is left in the market.
I T E m p l o y m e n t H i g h l i g h t s
IDC estimates the total IT employment in 2010 was approximately 27,000 IT
professionals.*
Over the next three years, ~9600 new IT jobs will be created and the total IT
workforce will increase by 36%.
The drivers of growth are increased investment in IT services by companies,
increased demand for specific IT skills particularly project management and
software development skills and expansion efforts in ICT companies.
The growth rate per year overall is expected to be in the 10% to 11% range.
IT employment is expected to grow at a CAGR (compound annual growth rate) of
10.8% over the next five years. The total employment is expected to increase by
36% by the end of 2013.
IT spending is projected to grow faster, at a CAGR of 17.4%. This will result in a
62% increase in IT spending between 2010 and 2013.
F I G U R E 1 0
I T E m p l o y m en t v s I T S p e n d i n g
Source: IDC, 2011
IT employment is expected to grow at a CAGR (compound annual growth rate) of
10.8% over the next five years. The total employment is expected to increase by 36%
by the end of 2013. Meanwhile, under the present circumstances, where there is lack
of IT skills, IT spending is expected to grow a little faster indicating that while skills
play a major role in supporting an IT environment, business needs and consumer
demands will supersede any inadequacies inherent in the issue of skills.

20 #undefined ©2011 IDC
F I G U R E 1 1
D e m an d P r e d i c t i o n b y P r o f e s s i o n a l s
Source: IDC, 2011
Nearly 10,000 IT professionals are expected to join the IT market between 2011 and
2013 with the biggest demand being for IT support professionals followed by software
developers and project managers.
These growth rates help depict the current make up of the IT market where expansion
in IT set up is taking place (and therefore needs more support for more users), new
projects being implemented (project management) and existing systems needing
customization or enhancement (development). With such characteristics, it can be
expected that the tide will turn in the next couple of years with more emphasis in
areas like ICT consulting and administration but dependent on different sectors and
how much ICT supports their business needs.

©2011 IDC #undefined 21
F I G U R E 1 2
D e m an d / A va i l a b i l i t y M a t r i x b y I T P r o f e s s i o n s
Source: IDC, 2011
Bearing in mind the expressed demand, present focus needs to be placed on IT
professions that are both immediately in high demand and hard to acquire by
businesses and vendors.
The diagram above plots these different professions based on what end users and
vendors have indicated in terms of ease of filling such positions vis a vis demand for
these positions.
Therefore greater focus should be placed on; IT Project Mangers, Consultants
Application Systems Analysts and Software Developers, being the professions in
highest demand and hard to fill.
While there is difficulty in filling positions with Systems Engineers, the demand is not
very high presently thus some thought should be spared to include plans for such
positions.
Overall a close tab should be kept on positions that are in low demand and presently
easily filled in order to track developments in IT set up across the board.
New jobs growth between 2011 and 2013
%o
fco
mp
an
ies
rep
ort
ed
ve
ryd
iffi
cu
lto
rd
iffi
cu
ltto
fin
d
Monitor
Consider FocusA
vaila
bili
tyD
ifficult
DemandLow High
Softwaredeveloper
ApplicationSystemsAnalyst
IT ProjectManager
System Engineer
IT Manager/Director
IT Consultant
Web Designer
IT Support
IT Administrator
Team Leader
0%
5%
10%
15%
20%
25%
30%
35%
40%
45%
50%
0.00% 20.00% 40.00% 60.00% 80.00%

22 #undefined ©2011 IDC
F I G U R E 1 3
D e m an d P r e d i c t i o n b y I T S k i l l s
Source: IDC, 2011
Away from broad categories of IT professionals and looking at specific skills that
these professionals hold, the survey indicates that the greatest demand will be for IT
Project Management Skills (136%) and Software development skills (135%).
Again this is indicative of positions articulated earlier i.e. the growing need to
implement new projects and enhance or integrate existing systems via customized
application development.
Presently the lowest growth is expressed for IT Administration and HW skills at less
than 12%.
I C T S k i l l s m a r k e t t r e n d s
Drivers
Increased Connectivity makes for more sophistication – With increased
connectivity options in the enterprise segment, and the resulting technology
options these avail, it is expected that more advanced skills in terms of
integration and deployment will be needed in the market e.g. for WAN,
networking, Virtual Private Networks, multiple site implementation, etc
©2011 IDC #undefined 23
Multinational Corporations – Multinational corporations will dictate IT strategies
that trickle down from their hubs and thus compel their local subsidiaries to adopt
the same systems in order to have seamless global integration. This will compel
the market to acquire and avail the required skills sets needed for such
implementations locally.
Increase in ICT players - Over the last ten years, there has been significant
growth in the number of companies operating in the ICT sector, including telcos,
hardware and software providers. This exponential growth has fuelled the need
for more locally qualified staff. In addition, a number of companies are starting to
invest in IT services which calls for locally available staff to be on hand.
Inhibitors
Imported Labor – The importation of skilled ICT Labor by some players, without
commensurate methods to ensure the transfer of skills to local IT professionals,
especially for the implementation major projects, only serves present needs but
leaves a void in the market. With appropriate intervention, such imported skilled
labor can be leveraged to impart skills and enhance the profile of local IT
professionals.
Imported Labor Competition - Availability of lower cost imported ICT labor (e.g.
India) for big implementations where the charge out rate is even lower than for
local ICT Professionals. This causes some lost opportunities and results in brain
drain to the region where local professionals seek "greener pastures" elsewhere
since they are unable to compete on price locally.
Frequency and size of projects - There are not adequate big projects that
result in a big pool of skilled personnel especially given the number and size of
local companies and the kind of projects that they implement. Big projects are
few and far between and the cycles between these are long, leaving little room to
build up enough skilled and experienced resources.
Training standards and curriculum – In most cases, the majority of graduates
need to be re-trained or undergo apprenticeship before they can contribute
properly to an IT environment.
Ethics – Given the shortage of experienced staff and the small pool from which
businesses can fill positions (and also bearing in mind that large projects are few
and far between), there is emerging a trend whereby skilled IT resources migrate
from company to company (vendor or business) seeking outlets where they can
utilize their skills and gain economically. To a large extent this is a cause for
disquiet among employers that try to place a premium on loyalty.
I T S k i l l s G a p A n a l y s i s F r a m e w o r k

24 #undefined ©2011 IDC
F I G U R E 1 4
I T S k i l l s G a p A n a l y s i s F r a m e w o r k
Source: IDC, 2011
K e y m a r k e t h i g h l i g h t s
There is relatively decent skills availability in the market and of good caliber.
However, there are issues to do with ethics on both the part of employees
(greener pasture seekers) and industry players (head hunting staff trained by
competitors. Thus the pool is small and most players keep drawing the same
people out of the same pool
There is a limited supply of good skills coupled with requisite experience across
hardware and software types.
Ethics is wanting - loyalty to employers - both within the supply side and demand
side - is lacking - thus IT professionals largely tend to be migratory and green
pasture seekers.
There is little international exposure - those with advanced skills leave the market
and the Kenyan market cannot really attract experienced professionals owing to
the "glass ceiling" in IT (bearing in mind the overall maturity levels in the market.
There is a limited supply of good skills coupled with requisite experience.
Ethics is wanting - loyalty to employers - both within the supply side and demand
side - is lacking - thus IT professionals largely tend to be migratory and green
pasture seekers.
There is little international exposure - those with advanced skills leave the market
and the Kenyan market cannot really attract experienced professionals owing to
the "glass ceiling" in IT (bearing in mind the overall maturity levels in the market.
Most university students readily dabble with application development using
mainly open source software and do have considerable skills in that regard but
come into a market place where the uptake of open source operating systems
and applications are not very pervasive. .
©2011 IDC #undefined 25
O u t l o o k
Seeing that various factors are at play in determining the skills base in Kenya,
including the opportunities presented by businesses to help nurture skills, the number
and size of projects, the cyclic nature of IT projects, a delicate balance needs to be
attained in order to address shortages while at the same time creating more
employment and encouraging more sophistication in ICT adoption.
Among the key areas expressed by vendors, businesses and academic institutions, to
address this issue include:
Integrating IT studies early in the educational curriculum to attract more interest
and therefore talent to the sector and demystify the industry.
Engaging in partnerships with higher education facilities with greater involvement
by the government and continually vet and incentivize participants in the
education sector to include more technical skills in their curriculum.
Given Kenya’s rising status as a budding innovation hub in the region,
developing an enabling environment for the sector will be critical to its success.
Increasing globalization will also push countries like Kenya to lean more heavily
on IT to participate on the same economic field as it competitors.
Mainstreaming of basic ICT training at a large scale e.g. MCSE, CCNA, etc
Find ways to help create work experience rather than rely purely on credentials
and certification - attachment programmes/apprenticeships
U S AG E AN D P E N E T R AT I O N AN A L Y S I S
O v e r v i e w
IDC Conducted two end user studies that included 150 businesses and 750 residents
and polled them on various issues relating to ICT set up, device usage, ICT staff
(business), professionals (business) ICT technical skills (business) and general ICT
end user skills (residential) among many other areas.
Note: In this section IDC will not cover ICT skills as the feedback is treated separately
under a different section. Thus the following are highlights of feedback obtained from
the residential and business survey results.
R e s i d e n t i a l
In this part of the survey, a total of 750 residents across five towns (Nairobi, Kisumu,
Nakuru, Mombasa and Nyeri) were polled at a household level with feedback solicited
on various ICT related issues.Respondents ranged from the age of 15 to over 45
years and were drawn from three main social classes.
Given the selection of urban areas for the survey, the uptake and usage of ICT, the
level of skills (end user) demonstrated and overall usage of ICT was relatively high as
outlined in the highlights below.
26 #undefined ©2011 IDC
F I G U R E 1 5
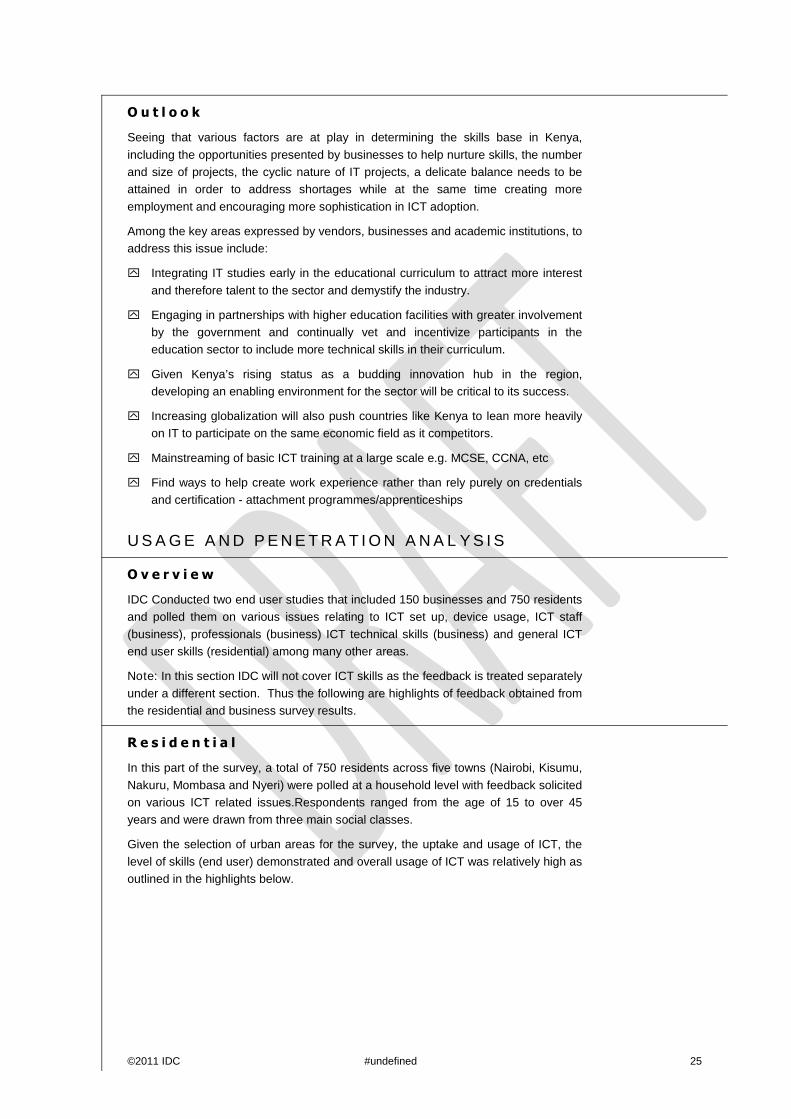
R e a so n s f o r n o t h a v i n g a n i n t e r n e t c o n n e c t i o n
Source: IDC, 2011
Feedback received from end users polled, on their reasons for not having an
internet connection at home were mainly associated with the cost of devices
(computers) and the cost of services. However, it should be noted that a good
number also indicated that they already access the internet at work or publicly
shared connections which to a certain extent implies that residents who have
access at work may not necessarily be prompted to acquire or invest in
connections at home, especially where cost and level of use are factors.
13% of the respondents cited lack of internet infrastructure as the reason for not
having a connection which helps confirm earlier assertions that last mile access
is a major issue that needs to be addressed.
The main issues that were immediately apparent, which could be justifiably
inferred to apply to rural populations, had to do with cost of devices and services,
and in many cases, to access to services and quality of services. On that note,
given that access and cost are already issues in urban areas, it goes without
saying that these are also very real issues in rural areas, more so on cost of
devices and services.
Another aspect that may also be safely assumed to inhibit uptake in rural areas
has to do with literacy (just above 10% indicated that they do not know how to
use the internet), awareness and relative need of services. While there may be
need for certain services in urban areas, the same cannot be said for rural areas
where culture, economic activities and ability play a major role in ICT
consumption.
Highl ights on Deta i l ing PC, Internet & Mobi le Phone Usage
Mobile usage among respondents (99%) prevails over internet (79%) and PC
(69%) usage
Internet and PC usage is heavily concentrated among young respondents
(especially the 15-24 yrs) and males
Main reasons for not using a PC or internet are common and correspond mostly
to the inability to buy them or not knowing about their functions
©2011 IDC #undefined 27
Using PC and internet at public places is a prominent feature , explaining more
the weak internet access from homes
89% of respondents use PC mainly at public internet facilities (at varying
frequencies per week). On the other hand, their internet usage is mostly done
through mobile at varying frequencies per week (85%)
Young respondents (15-24 yrs) tend more to use PC for entertainment (77%)
and educational (57%) reasons; while older respondents (especially 35+ yrs)
specify most of their PC time for personal (76%) and work obligations (59%)
Internet and mobile usage is centered over basic tasks, with the advanced
features still not quite well explored
The main purposes for using the internet are communication via email or social
networking (86%) opposed by a low preference for doing online voice or video
calls
While 97% of respondents use mobiles mostly for the normal calling and texting,
internet-based functions like web browsing, chatting etc. are dominated by young
residents (15-24 yrs)
Time spent on PC and internet have similar distribution among different age
groups and is a resultant of the general purposes that these age groups use PC
or internet:
Respondents (15-34 yrs) allocate most of their PC/internet time for personal or
education reasons
Respondents (35+ yrs) are heavily consumed by work obligations while using PC
or internet
On average, 12 hrs per week are spent using a PC and/or internet
Males tend to spend 2.2 hr more than females on PC every week. They also
spend 3.4 hrs every week more than females for internet usage
Males’ consumption of the mobile service is also much more than females. This
is clear in the amount of weekly SMS, MMS and their total spending on mobile
services
Respondents are more confident in using basic PC functions (text processing,
working with spread sheets, etc.) as well as basic internet functions (email
communication, search engines, etc.)

28 #undefined ©2011 IDC
F I G U R E 1 6
D e v i c e s U s ed t o A c c e s s t h e I n t e r n e t
Source: IDC, 2011
Mobile phones remain the most used device to access the internet. Out of the nearly
4.7 million connections, at least 95% are mobile based connections. In this feedback
it is apparent that any strategies to engage with residents needs to be deployed on
mobile platforms (and which is later confirmed when looking at the number of internet
transactions vis a vis mobile transactions).
Confirming earlier feedback about cost of devices, laptops and desktops have much
lower usage in the market,
There is growing usage of smart phones in Kenya, partly attributable to initiatives by
equipment vendors and mobile operators to avail low cost or subsidized devices into
the market. Chief among these are Android based phones from reputable Chinese
manufacturers. IDC in its research on mobile handsets sees a growth of xx% (FH -
check with Simon Baker) in this market segment.
F I G U R E 1 7
P r i m a r y pu r p o s e f o r u s i n g a PC
Source: IDC, 2011

©2011 IDC #undefined 29
Responses on primary usage of computers confirms that computers have more or
less become very commoditized items with personal use cited as the biggest use,
followed by entertainment (still personal usage technically speaking) and
communication.
Just over 35% cited use of their computers for work which largely comprises of the
self employed or teleworking demographic of the survey.
It should also be noted that nearly 45% cited the use of computers for education,
which in itself underscores the importance of computers as a medium to acquire
education and learning materials. When looking at content later, we will see that
education still plays a crucial role and can get a better understanding of this issue.
F I G U R E 1 8
S e r v i c e s a c t i v e l y u s e d o n a m o b i l e d e v i c e
Source: IDC, 2011
Confirming IDC's market sizing on telecommunications services expenditure,
feedback from residents shows that the biggest use of mobile devices, at nearly
100% is for voice services followed by texting at about the same level and at a much
lower usage level, access to social media and web sites, mainly by the younger
population.
IDC believes that should more locally developed content be availed for mobile,
specifically for social networking, websites and entertainment, plus higher bandwidth
speeds be availed, a greater appetite can be realized. Presently such consumption is
via computers and mainly at shared access points or work places.

30 #undefined ©2011 IDC
F I G U R E 1 9
C o n f i d en c e i n U s i n g a P C
Source: IDC, 2011
By and large, and thinking of basic end user skills, residents who use computers are
confident users of PCs and only citing difficulties with infrequent uses such as
problem solving and writing programmes. This in itself, more so when looking at text
processing, creating presentations, etc shows that the use base is already fertile for
development of local content and that the missing link to enhance or later realize this
would lie in connectivity.
Out of all the respondents, only 31% have never used a computer and the majority
possesses fairly solid basic computer usage skills.

©2011 IDC #undefined 31
F I G U R E 2 0
C o n f i d en c e i n U s i n g t h e I n t e r n e t
Source: IDC, 2011
Compared to online skills (i.e. internet usage) offline skills (i.e. computer usage
alone), are higher confirming feedback that fewer residents have access to the
internet as they do to computers and therefore less experience or need for internet
skills.
Thus if internet penetration was higher, the requisite skills needed online e.g. for
creating blogs and downloading content, could be enhanced and in turn also lead to
greater local content and an increased online community available for the business
enterprises that wish to target them via that medium.
The high usage of search engines demonstrates that there is a high demand for
information and perhaps a study on what type of information sought could inform any
initiatives to develop and avail local content.
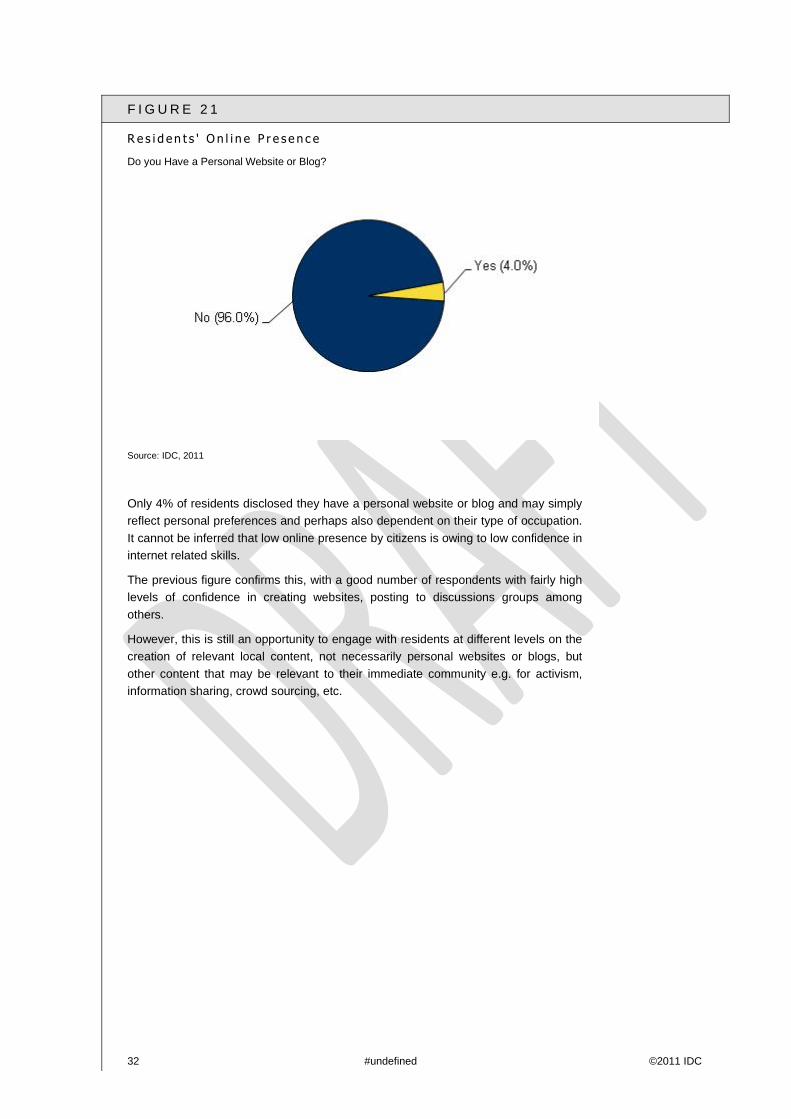
32 #undefined ©2011 IDC
F I G U R E 2 1
R e s i d en t s ' O n l i n e P r e s e n c e
Do you Have a Personal Website or Blog?
Source: IDC, 2011
Only 4% of residents disclosed they have a personal website or blog and may simply
reflect personal preferences and perhaps also dependent on their type of occupation.
It cannot be inferred that low online presence by citizens is owing to low confidence in
internet related skills.
The previous figure confirms this, with a good number of respondents with fairly high
levels of confidence in creating websites, posting to discussions groups among
others.
However, this is still an opportunity to engage with residents at different levels on the
creation of relevant local content, not necessarily personal websites or blogs, but
other content that may be relevant to their immediate community e.g. for activism,
information sharing, crowd sourcing, etc.

©2011 IDC #undefined 33
F I G U R E 2 2
I n t e r n e t u s a g e
Source: IDC, 2011
Given the level of awareness cited elsewhere, about online government services, and
coupled with the possibility that government websites remain rather static and
perhaps hard to navigate, there could be increased usage of the internet to get
information from government organizations. Aside from websites, and despite rather
widespread adoption of email in different government departments, anecdotal
information suggests that email is the least effective way of corresponding with
government and perhaps it may also be rooted in the culture and norms in
government.
In terms of using the internet to communicate with customers, citizens and residents,
greater usage could occur with greater adoption and penetration. Presently only 21%
of the residents polled use the internet for this. Thus, increased overall internet
penetration among residents would result in an increase in this use (as
customers/consumers of other residents).
IDC believes a greater number of users, above the current 40%, would engage in
using the internet for online learning if more education institutions, including
secondary level (given that the biggest number of internet users includes the 15-24
segment) had relevant content to allow PCs and the internet to become an additional
medium to access courses and learning curriculum.
Purchasing goods online shows a rather low usage rate but it must be borne in mind
the users of such services would be the ones with access to an online payment
medium (PesaPal, PayPal, credit card, etc). With recent developments among
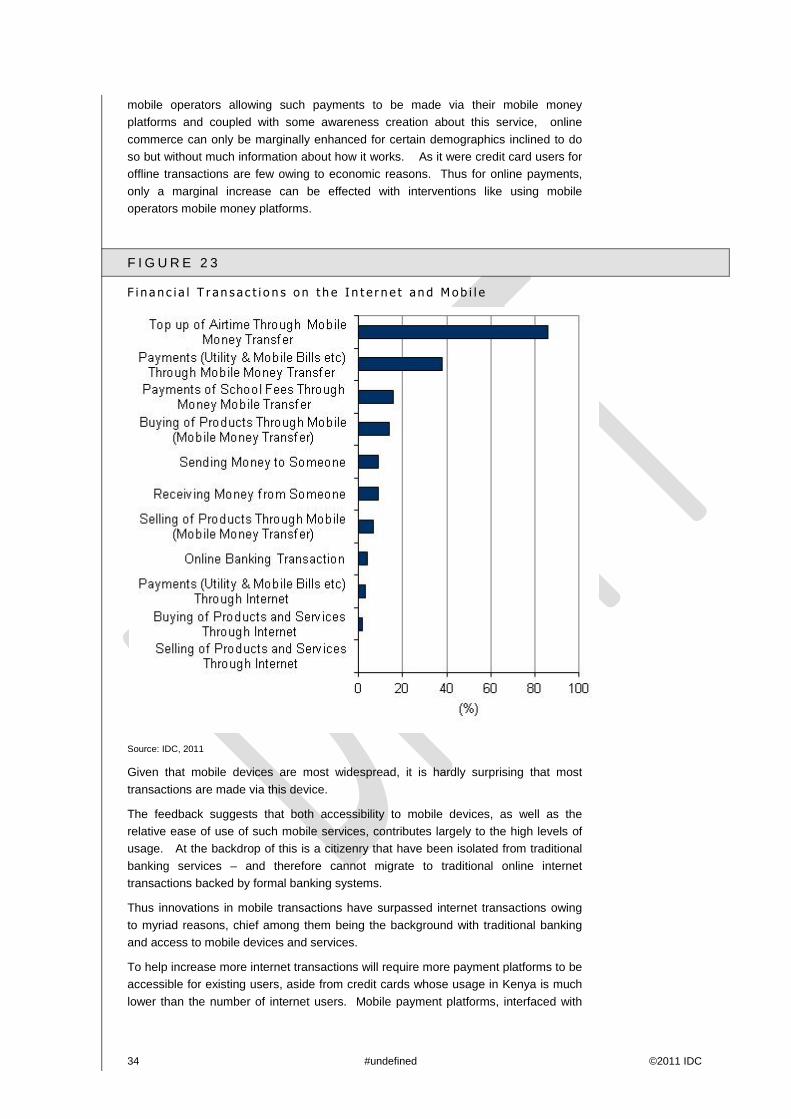
34 #undefined ©2011 IDC
mobile operators allowing such payments to be made via their mobile money
platforms and coupled with some awareness creation about this service, online
commerce can only be marginally enhanced for certain demographics inclined to do
so but without much information about how it works. As it were credit card users for
offline transactions are few owing to economic reasons. Thus for online payments,
only a marginal increase can be effected with interventions like using mobile
operators mobile money platforms.
F I G U R E 2 3
F i n a n c i a l T r a n s a c t i o n s o n t h e I n t e r n e t a n d M o b i l e
Source: IDC, 2011
Given that mobile devices are most widespread, it is hardly surprising that most
transactions are made via this device.
The feedback suggests that both accessibility to mobile devices, as well as the
relative ease of use of such mobile services, contributes largely to the high levels of
usage. At the backdrop of this is a citizenry that have been isolated from traditional
banking services – and therefore cannot migrate to traditional online internet
transactions backed by formal banking systems.
Thus innovations in mobile transactions have surpassed internet transactions owing
to myriad reasons, chief among them being the background with traditional banking
and access to mobile devices and services.
To help increase more internet transactions will require more payment platforms to be
accessible for existing users, aside from credit cards whose usage in Kenya is much
lower than the number of internet users. Mobile payment platforms, interfaced with

©2011 IDC #undefined 35
internet banking could provide the missing link to promote internet transactions. The
recent service launch by Airtel is a good example.
F I G U R E 2 4
S a t i s f a c t i o n w i t h I n t e r n e t S e r v i c e s
Source: IDC, 2011
When polled about satisfaction with internet services, a good number of respondents
were satisfied with their overall internet service as well as the support they receive.
Issues of speed were among the areas where residents were not satisfied and hardly
surprising the issue of value for money where at least 20% indicated dissatisfaction.
F I G U R E 2 5
A w a r en e s s o f o n l i n e go v e r n m e n t s e r v i c e s
Source: IDC, 2011

36 #undefined ©2011 IDC
Whereas 53% of the respondents were aware of the e-government services offered
on 23%. Indicated they have used these services.
As indicated elsewhere in the research, low usage may be as a result of concerns
relating to constant availability, security concerns and generally trying to contend with
a bureaucratic culture where the most effective transactions are offline however
tedious.
F I G U R E 2 6
O n l i n e g o v e r n m en t s e r v i c e s u s e d
Source: IDC, 2011
Out of the 23% of e-government services users, the majority sought to obtain
examination results online, followed by applications for public service jobs.

©2011 IDC #undefined 37
F I G U R E 2 7
B a r r i e r s t o I C T u s a g e
Source: IDC, 2011
Access to computers, the high costs of computers and unaffordable internet access
are the three main barriers to ICT usage in Kenya and while this is a serious
challenge, it also presents an opportunity to increase penetration through various
means including asset financing, cost subsidies and toll free dial up rates for remote
and rural areas.
It should be worth noting that the level of complication to technology as well as the
lack of skills are not major inhibitors as issues of cost, again confirming that the ICT
literacy levels among residents is adequate to allow them to consume more and move
to the next level.
Among the least cited barriers include lack of local content, security concerns and
lack of trust of ICT.
Residents' Survey Highl ights
Acquiring ICT skills in Kenya is significantly affected by the overall social status
of households and respondents
The unavailability of PC and internet at homes due mainly to their high cost and
the inability of respondents to purchase them emerges as the main barrier
against ICT knowledge

38 #undefined ©2011 IDC
Another barrier is the absence of internet infrastructure in some neighbors which
is prohibiting those who are financially capable (SCL AB) form enjoying this
service
This is leading to the fact that most internet access is done via mobile or from
places outside home where respondents are satisfied by its cost, speed and
reliability
Usage of PC, internet and mobiles is generally limited to basic features
The same main barriers (cost and unavailability of PC and internet) that are
reducing the use of internet and PC are also preventing respondents from taking
ICT training courses
With these factors pressing, only 16% of respondents have been trained on ICT
skills in the last year
Respondents are aiming to increase their general basic skills for using mobiles,
PC and internet. They reflect less desire to learn advanced features

©2011 IDC #undefined 39
B u s i n e s s
In the business survey, a total of 158 respondent organizations from five towns
(Nairobi, Kisumu, Nakuru, Mombasa and Eldoret) were polled on various aspects,
including ICT skills. Respondents were spread proportionately depending on their
sectors share of ICT spend and included government departments and agencies.
Overall ICT usage in business is fairly high though some issues remain and which if
addressed can result in heightened levels of usage.
F I G U R E 2 8
B u s i n e s s O n l i n e P r e s en c e
Source: IDC, 2011
There is considerable usage of websites among businesses in Kenya and a good
number are leveraging on other online presence including online adverts, e-
newsletters and presence on social networking cites.
In this regard, the Kenya business community can be considered to be at par with
developed countries with all that remains being the level of presence in terms of
online trading/transactions which is one aspect that this survey did not expressly
measure but which, given other areas cited as concerns, might be preventing more
Kenyan businesses from adopting a more wholesome online presence. Chief among
the concerns cited elsewhere include security.

40 #undefined ©2011 IDC
F I G U R E 2 9
I n t e r n e t C o n n e c t i o n ( B u s i n e s s I n t e r n e t S p ee d s )
Source: IDC, 2011
Given recent developments in availing high speed bandwidth, a good number of
organizations have connection speeds higher than 1Mbps but also dependent on the
number of end users that they need to provide access to.
Looking at the maturity of the market, which should be denoted by the types of
speeds, less than 20% had speeds less than 512kbps and only 1% were not
connected.
Overall, access among business stands at 99% which is a very positive indicator for
organizations in Kenya.
F I G U R E 3 0
C o n s t r a i n t s f o r I n t e r n e t U s a g e
Source: IDC, 2011
Various reasons were cited as constraints in terms of internet usage, chief among
them being availability and coverage – which helps re-state the issue of last mile
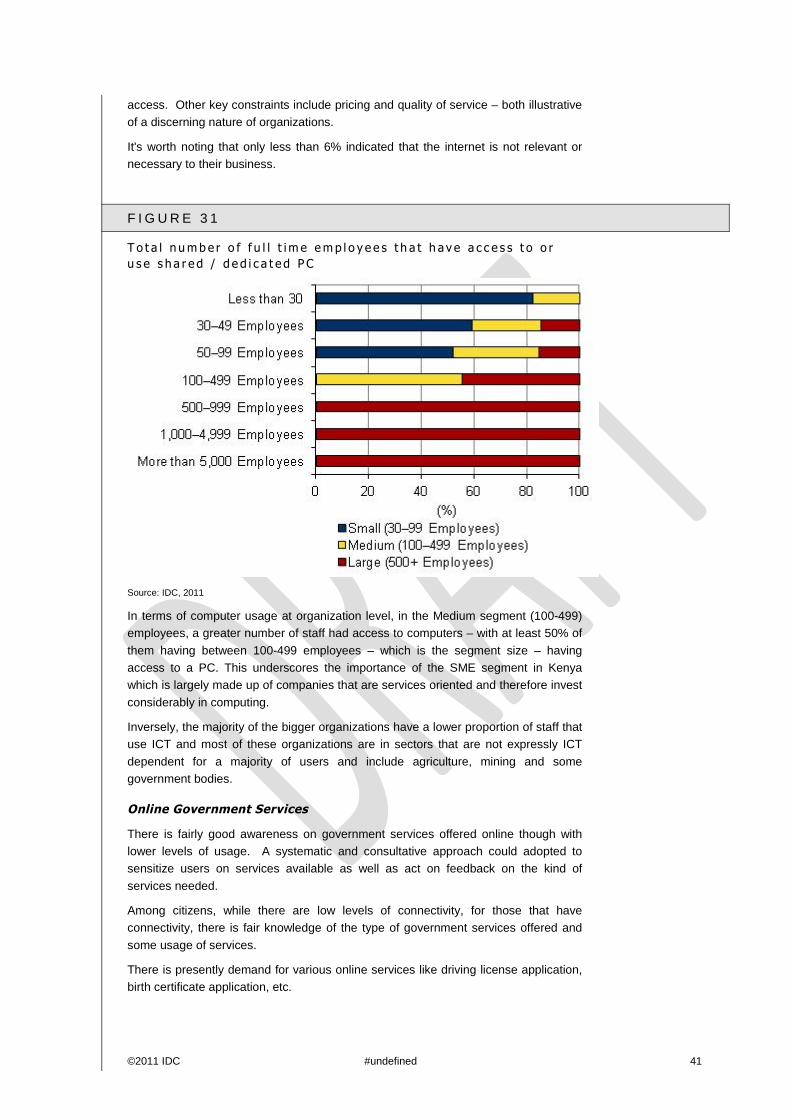
©2011 IDC #undefined 41
access. Other key constraints include pricing and quality of service – both illustrative
of a discerning nature of organizations.
It's worth noting that only less than 6% indicated that the internet is not relevant or
necessary to their business.
F I G U R E 3 1
T o t a l n u m b e r o f f u l l t i m e e m p l o y e e s t h a t h a v e a c c e s s t o o r
u s e s h a r e d / d e d i c a t e d P C
Source: IDC, 2011
In terms of computer usage at organization level, in the Medium segment (100-499)
employees, a greater number of staff had access to computers – with at least 50% of
them having between 100-499 employees – which is the segment size – having
access to a PC. This underscores the importance of the SME segment in Kenya
which is largely made up of companies that are services oriented and therefore invest
considerably in computing.
Inversely, the majority of the bigger organizations have a lower proportion of staff that
use ICT and most of these organizations are in sectors that are not expressly ICT
dependent for a majority of users and include agriculture, mining and some
government bodies.
Online Government Services
There is fairly good awareness on government services offered online though with
lower levels of usage. A systematic and consultative approach could adopted to
sensitize users on services available as well as act on feedback on the kind of
services needed.
Among citizens, while there are low levels of connectivity, for those that have
connectivity, there is fair knowledge of the type of government services offered and
some usage of services.
There is presently demand for various online services like driving license application,
birth certificate application, etc.

42 #undefined ©2011 IDC
Among citizens, the mobile device is the most common method of accessing the
internet and should more government services be issued for mobile platforms, a
greater uptake can be achieved.
F I G U R E 3 2
U s a g e o f e - go v e r n m en t s e r v i c e s
Source: IDC, 2011
There is more awareness of services like customs, business license registry and
reporting corruption online, but comparatively usage of these services is rather low
and just like with the residential segment, issues relating to culture, bureaucracy and
ease of doing business are probable reasons for low usage among the business
community.
To a certain extent, the awareness and usage of these services is contingent on the
awareness campaigns undertaken by the providers of the various services. Kenya
Revenue Authority is most notable in this regard and the results confirm this. Their
annual campaigns to encourage tax payers and importers to utilize their online
services is indicated positively here.
Overall should there be similar levels of publicity about other government services,
there could be greater adoption.
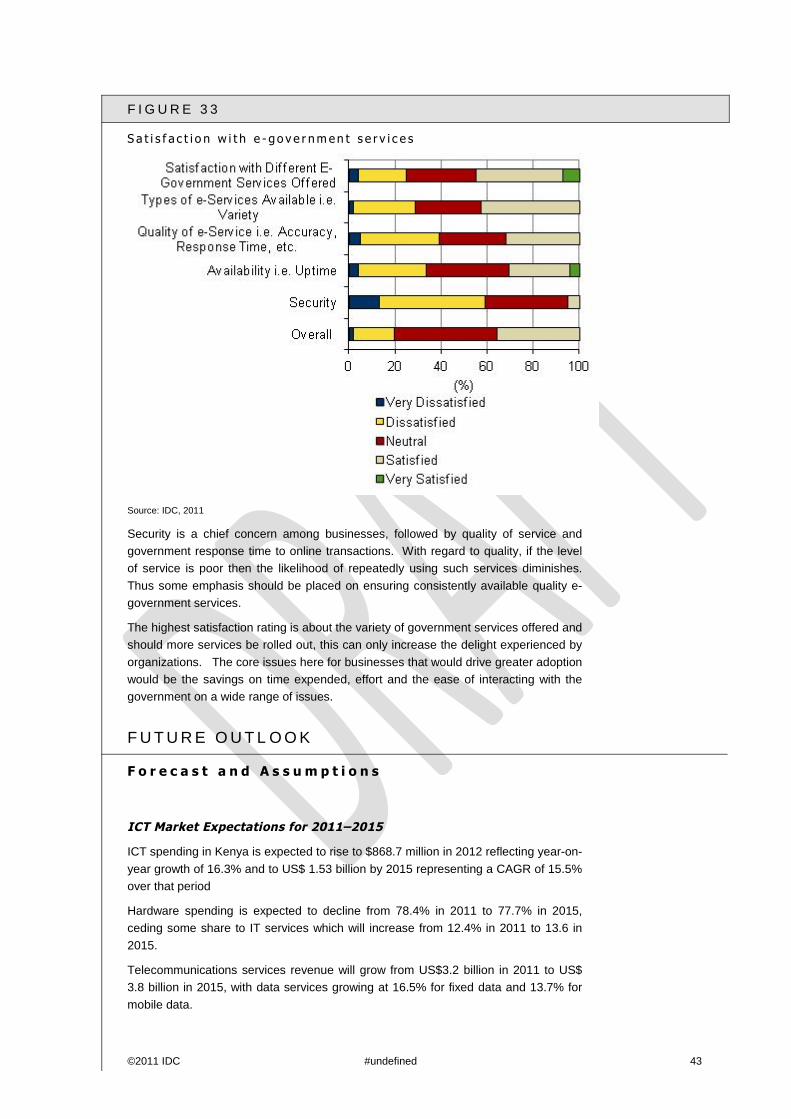
©2011 IDC #undefined 43
F I G U R E 3 3
S a t i s f a c t i o n w i t h e - go v e r n m en t s e r v i c e s
Source: IDC, 2011
Security is a chief concern among businesses, followed by quality of service and
government response time to online transactions. With regard to quality, if the level
of service is poor then the likelihood of repeatedly using such services diminishes.
Thus some emphasis should be placed on ensuring consistently available quality e-
government services.
The highest satisfaction rating is about the variety of government services offered and
should more services be rolled out, this can only increase the delight experienced by
organizations. The core issues here for businesses that would drive greater adoption
would be the savings on time expended, effort and the ease of interacting with the
government on a wide range of issues.
F U T U R E O U T L O O K
F o r e c a s t a n d A s s u m p t i o n s
ICT Market Expectations for 2011–2015
ICT spending in Kenya is expected to rise to $868.7 million in 2012 reflecting year-on-
year growth of 16.3% and to US$ 1.53 billion by 2015 representing a CAGR of 15.5%
over that period
Hardware spending is expected to decline from 78.4% in 2011 to 77.7% in 2015,
ceding some share to IT services which will increase from 12.4% in 2011 to 13.6 in
2015.
Telecommunications services revenue will grow from US$3.2 billion in 2011 to US$
3.8 billion in 2015, with data services growing at 16.5% for fixed data and 13.7% for
mobile data.

44 #undefined ©2011 IDC
In total the combined IT and Telecoms market will grow at a CAGR of 8.9% from US$
4.08 billion in 2011 to reach US$ 5.41 billion in 2015.

©2011 IDC #undefined 45
F o r e c a s t T a b l e s
ICT Spending
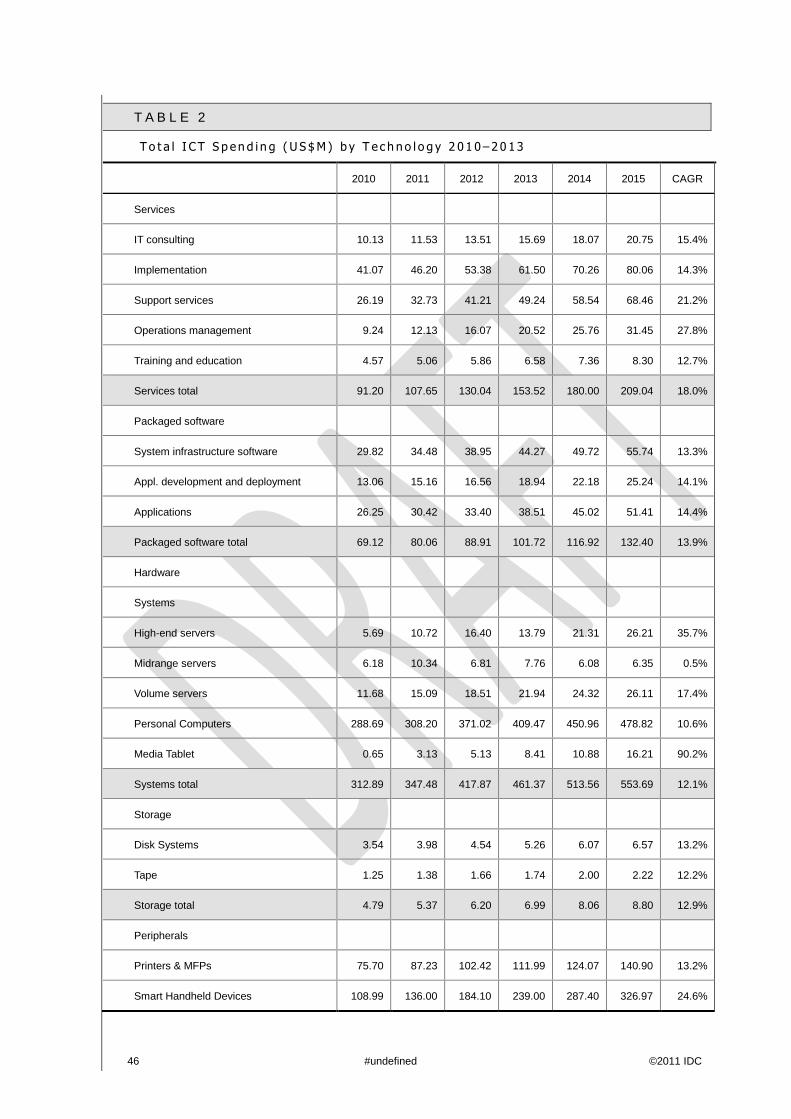
46 #undefined ©2011 IDC
T A B L E 2
T o t a l I C T S p en d i n g ( U S $ M ) b y T e c h n o l o g y 2 0 1 0 – 2 0 1 3
2010 2011 2012 2013 2014 2015 CAGR
Services
IT consulting 10.13 11.53 13.51 15.69 18.07 20.75 15.4%
Implementation 41.07 46.20 53.38 61.50 70.26 80.06 14.3%
Support services 26.19 32.73 41.21 49.24 58.54 68.46 21.2%
Operations management 9.24 12.13 16.07 20.52 25.76 31.45 27.8%
Training and education 4.57 5.06 5.86 6.58 7.36 8.30 12.7%
Services total 91.20 107.65 130.04 153.52 180.00 209.04 18.0%
Packaged software
System infrastructure software 29.82 34.48 38.95 44.27 49.72 55.74 13.3%
Appl. development and deployment 13.06 15.16 16.56 18.94 22.18 25.24 14.1%
Applications 26.25 30.42 33.40 38.51 45.02 51.41 14.4%
Packaged software total 69.12 80.06 88.91 101.72 116.92 132.40 13.9%
Hardware
Systems
High-end servers 5.69 10.72 16.40 13.79 21.31 26.21 35.7%
Midrange servers 6.18 10.34 6.81 7.76 6.08 6.35 0.5%
Volume servers 11.68 15.09 18.51 21.94 24.32 26.11 17.4%
Personal Computers 288.69 308.20 371.02 409.47 450.96 478.82 10.6%
Media Tablet 0.65 3.13 5.13 8.41 10.88 16.21 90.2%
Systems total 312.89 347.48 417.87 461.37 513.56 553.69 12.1%
Storage
Disk Systems 3.54 3.98 4.54 5.26 6.07 6.57 13.2%
Tape 1.25 1.38 1.66 1.74 2.00 2.22 12.2%
Storage total 4.79 5.37 6.20 6.99 8.06 8.80 12.9%
Peripherals
Printers & MFPs 75.70 87.23 102.42 111.99 124.07 140.90 13.2%
Smart Handheld Devices 108.99 136.00 184.10 239.00 287.40 326.97 24.6%

©2011 IDC #undefined 47
T A B L E 2
T o t a l I C T S p en d i n g ( U S $ M ) b y T e c h n o l o g y 2 0 1 0 – 2 0 1 3
2010 2011 2012 2013 2014 2015 CAGR
Other HW 30.06 38.82 42.67 55.59 62.83 69.18 18.1%
Peripherals total 214.75 262.05 329.19 406.58 474.30 537.05 20.1%
Networking equipment 53.98 66.11 76.00 81.00 83.00 92.57 11.4%
Hardware total 586.40 681.01 829.25 955.94 1078.92 1192.11 15.2%
Packaged software total 69.12 80.06 88.91 101.72 116.92 132.40 13.9%
Services total 91.20 107.65 130.04 153.52 180.00 209.04 18.0%
Total IT 746.72 868.72 1048.20 1211.18 1375.83 1533.54 15.5%
Hardware total 0.79 0.78 0.79 0.79 0.78 0.78
Packaged software total 0.09 0.09 0.08 0.08 0.08 0.09
Services total 0.12 0.12 0.12 0.13 0.13 0.14
Source: IDC

48 #undefined ©2011 IDC
T A B L E 3
T o t a l I C T S p en d i n g ( U S $ M ) b y V e r t i c a l M a r k e t s 2 0 1 0 – 2 0 1 3
2010 2011 2012 2013 2014 2015
Agriculture, Construction, and Mining 21.01 24.44 29.49 34.08 38.71 43.15
Financial 96.63 112.41 135.64 156.73 178.04 198.44
Business Services 20.36 23.69 28.58 33.03 37.52 41.82
Communications 153.19 178.21 215.03 248.47 282.24 314.60
Consumer 111.39 129.59 156.36 180.68 205.24 228.76
Discrete Manufacturing 16.63 19.35 23.34 26.97 30.64 34.15
Education 22.51 26.19 31.60 36.52 41.48 46.24
Government 109.86 127.81 154.21 178.19 202.41 225.61
Healthcare 13.45 15.64 18.88 21.81 24.78 27.62
Other 28.69 33.38 40.28 46.54 52.87 58.93
Process Manufacturing 53.78 62.57 75.49 87.23 99.09 110.45
Retail 28.34 32.97 39.78 45.97 52.22 58.20
Transport 26.57 30.91 37.30 43.10 48.96 54.57
Utilities 28.16 32.76 39.53 45.68 51.89 57.84
Wholesale 16.15 18.78 22.66 26.19 29.75 33.16
Source: IDC

©2011 IDC #undefined 49
T A B L E 4
T o t a l I C T S p en d i n g ( U S $ M ) b y B u s i n e s s S i z e 2 0 1 0 – 2 0 1 3
2010 2011 2012 2013 2014 2015
1–10 22.41 27.36 34.66 42.06 50.16 58.71
10–99 89.60 106.85 132.16 156.51 182.24 208.20
100–499 171.75 204.80 253.30 299.98 349.30 399.07
500–999 313.62 355.74 418.50 471.50 522.21 567.51
1,000–4,999 126.93 143.99 169.40 190.83 211.37 229.71
≥5,000 22.41 29.98 40.19 50.29 60.56 70.34
Total 746.72 868.72 1048.20 1211.18 1375.83 1533.54
Source: IDC

50 #undefined ©2011 IDC
K e y F o r e c a s t A s s u m p t i o n s
T A B L E 5
K e y F o r e c a s t A s s u m p t i o n s f o r t h e K en y a I C T M a r k e t 2 0 1 2 – 2 0 1 5 >
Market Force IDC Assumption Impact
Accelerator/
Inhibitor/
Neutral
Certainty of
Assumption
Macroeconomics
Political Stability Elections expected in 2012 will
stymie government spending in
the latter half of 2012.
Progress with existing and
planned ICT investment and
shared services may grind to a
halt during this period.
↓
Economy Currency stabilization can be
expected to shore up imports of
goods, including oil, and overall
help alleviate inflation and
resulting effects on consumers
(spending power and price of
goods).
Improved ability to maintain
imported inventory by channel
partners. Lower Kshs cost of
goods can be passed on to
consumers↑
Labor ICT Skills will remains a serious
challenge
The survey shows there are
gaps in demand and small wins
can only be made in terms of
soft skills and awareness
among under graduates about
the direction they should take to
be able to fit in the market.
↔
Market
Characteristics
Inflation Inflation will affect consumer
ICT Spending
Despite the fact that
communications services
comprise a considerable
portion of household spend,
increased costs of food,
transport, electricity and others,
will eat into overall budgets and
diminish priorities for non
essential ICT spend among the
lower cadres of the citizenry.
↓
Regional
Integration
Ongoing initiatives to develop
the East African Community
Ongoing developments among
the East African Community
countries will help ICT further
along the road in terms of free
movement of goods and
services. Kenya can play a
pivotal role in this, especially in
the provision of skills and ICT
related services.
↑
Vertical Focus Increased sophistication among
SMEs will graduate them to the
next level of applications
Presently SMEs, which form
the bulk of businesses in
Kenya, and who are largely in
services related industries,
↑
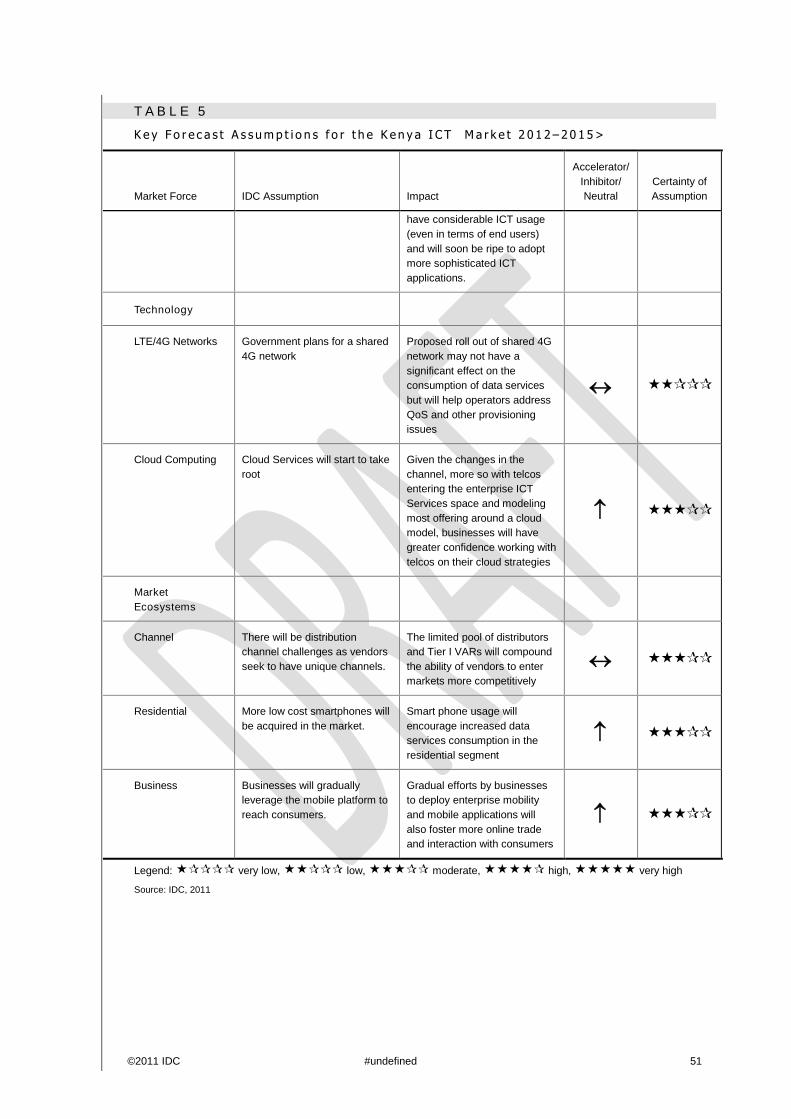
©2011 IDC #undefined 51
T A B L E 5
K e y F o r e c a s t A s s u m p t i o n s f o r t h e K en y a I C T M a r k e t 2 0 1 2 – 2 0 1 5 >
Market Force IDC Assumption Impact
Accelerator/
Inhibitor/
Neutral
Certainty of
Assumption
have considerable ICT usage
(even in terms of end users)
and will soon be ripe to adopt
more sophisticated ICT
applications.
Technology
LTE/4G Networks Government plans for a shared
4G network
Proposed roll out of shared 4G
network may not have a
significant effect on the
consumption of data services
but will help operators address
QoS and other provisioning
issues
↔
Cloud Computing Cloud Services will start to take
root
Given the changes in the
channel, more so with telcos
entering the enterprise ICT
Services space and modeling
most offering around a cloud
model, businesses will have
greater confidence working with
telcos on their cloud strategies
↑
Market
Ecosystems
Channel There will be distribution
channel challenges as vendors
seek to have unique channels.
The limited pool of distributors
and Tier I VARs will compound
the ability of vendors to enter
markets more competitively
↔
Residential More low cost smartphones will
be acquired in the market.
Smart phone usage will
encourage increased data
services consumption in the
residential segment
↑
Business Businesses will gradually
leverage the mobile platform to
reach consumers.
Gradual efforts by businesses
to deploy enterprise mobility
and mobile applications will
also foster more online trade
and interaction with consumers
↑
Legend: very low, low, moderate, high, very high
Source: IDC, 2011

52 #undefined ©2011 IDC
E S S E N T I AL G U I D A N C E
A c t i o n s t o C o n s i d e r
Promotion of locally owned distributors - There need to be efforts to grow the
distributorship pool in the market, possibly with local and regionally owned players to
offer greater diversity to any vendors that feel the need to have product and service
exclusivity. As it were, the dozen or so distributors already handle products of various
vendors who are simply keen to leverage their market reach, but should alternate
players join the market, the distribution channel can undergo some transformations.
Incentives for such players may go a long way in fostering greater local participation.
Foster Innovation: The present initiatives to incubate SMEs in ICT and provide seed
funding for startups is yet to be measured but IDC believes that these initiatives will
certainly help foster innovation especially in the younger population and more could
be done by way of awareness creation as to how young people can start participating
in a knowledge economy.
Thus a multi faceted approach, involving incubation, sensitization on technology
trends and opportunities, coupled with relevant syllabi that provide the stepping
stones to attaining this, will go a long way in providing a solid foundation for
innovation.
Growth of Tier 2 players:While incubation initiatives may foster up starts to make an
entry into the market as ICT players, perhaps the impact may be greater should Tier 2
players be suitably engaged to help them undergo consolidation by them acquiring
smaller players, increasing their resource and skills base as well as their geographic
presence.
Thus given the limited pool of players from which large enterprises, multinational
companies and government can draw from in terms of expertise, resources and
experience, there is need to nurture more local players to compete effectively with
more established players that currently dominate the market. Such measures will
both help create employment and nurture requisite skills.
Thus some focus should also be directed towards existing Tier 2 players, more so
Kenyan owned ICT companies, to allow them greater access to business
opportunities in large enterprises, government and multinational companies. As it
stands, their limited resources, ability to retain skilled staff and limited geographic
reach, serve to limit how much they can grow as businesses and employers.
Tier 2 companies, by virtue of not being foreign majority owned, if nurtured well and
helped to become more robust players, can make good candidates for foreign direct
investment by multinational MNCs and other global ICT investors that seek to grow
their markets by investing in or partially acquiring local companies in order to enter
the market and compete favorably with Tier 1 companies.
Protection of local jobs: In the survey that IDC conducted, more so to do with the
issue of ICT skills and gaps, a common thread running through most discussions
relates to a somewhat relaxed and unregulated stance towards foreign workers,
more so when the required skills are locally available already. Such has been cited
often as a reason that some positions are not accessible to Kenyans leading
sometimes to brain drain when Kenyans seek better opportunities in neighboring
countries or farther beyond.
Skills transfer: While in reality there may be various positions and skills that are not
easily available locally, for those instances where foreign workers arrive in Kenya to
©2011 IDC #undefined 53
undertake various ICT tasks, there is need to monitor whether actual skills transfer
takes place while at the same time ensuring a favorable environment for ICT
investors and end users that require such services.
Last mile access and quality of service: From the results of the business and
residential survey, as well as interactions with vendors, even though so much has
been done to develop ICT infrastructure via international connectivity, national
backbones, public access centers, the issue of reliable and affordable last mile
access will continue to inhibit the propagation and usage of ICT.

54 #undefined ©2011 IDC
S u m m a r y R e c o m m e n d a t i o n s
T A B L E 6
R ec o m m e n da t i o n s
Macro Area Details Action Broad Recommendations
IT Skills Increase output of
number of skilled staff
Focus • Awareness programmes at education institutions on:
• business needs vis a vis courses taken;
• type of skills in high demand for the next 3-5 years
• current MIXTURE of skills needed
• attract more people (especially youth and females) via
promotional campaigns
• Include middle & lower tiers of educational institutions to
get connected
IT Skills Enhance quality of
skills
Focus • Bridging programmes to involve academia, graduates and
ICT Business leaders
• Curriculum refresh and plan to do this regularly
• Inclusion of basic soft skills courses as part of the
curriculum
• Establishment of Industry Standards, Accreditation and
Ethics body
• Specialized funding for ICT courses
• Partner with training/ICT companies and ensure training
availability
IT Skills Protect local jobs &
stem brain drain
Consider • Mechanism to balance the need for expat labor vs skills
transfer value
• Incentivize Diaspora to reverse brain drain
• More attachment programs and internships with technology
companies to learn and apply
Residential
Usage
increase e-
government services
awareness
Focus • Awareness programmes on services currently offered and
follow up on suggested online government services
Residential
Usage
increase e-
government services
usage
Focus • Leverage mobile operators to update citizens on
government services vis SMS (subsidized cost for
government for bulk SMS).
• Deploy relevant USSD driven services for citizens
Residential
Usage
ICT Adoption Consider • Content - solicit feedback on content of interest, especially
from non-users
• awareness on other content and services (business
services, online trade, etc)
• Content - review feedback on content most used and share
with beneficiaries of digital content funds to take
action/innovate/respond
• Close collaboration with media to pursue the internet as a
channel for delivery.
• Address costs - See macro item COST below
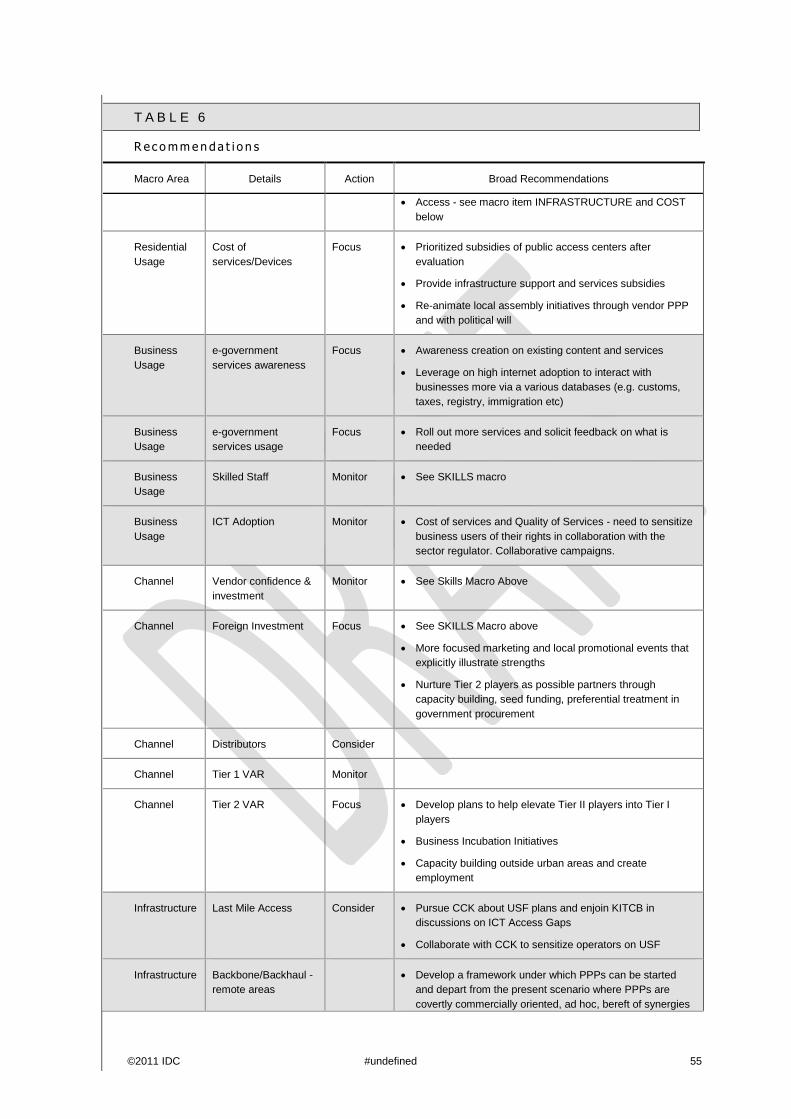
©2011 IDC #undefined 55
T A B L E 6
R ec o m m e n da t i o n s
Macro Area Details Action Broad Recommendations
• Access - see macro item INFRASTRUCTURE and COST
below
Residential
Usage
Cost of
services/Devices
Focus • Prioritized subsidies of public access centers after
evaluation
• Provide infrastructure support and services subsidies
• Re-animate local assembly initiatives through vendor PPP
and with political will
Business
Usage
e-government
services awareness
Focus • Awareness creation on existing content and services
• Leverage on high internet adoption to interact with
businesses more via a various databases (e.g. customs,
taxes, registry, immigration etc)
Business
Usage
e-government
services usage
Focus • Roll out more services and solicit feedback on what is
needed
Business
Usage
Skilled Staff Monitor • See SKILLS macro
Business
Usage
ICT Adoption Monitor • Cost of services and Quality of Services - need to sensitize
business users of their rights in collaboration with the
sector regulator. Collaborative campaigns.
Channel Vendor confidence &
investment
Monitor • See Skills Macro Above
Channel Foreign Investment Focus • See SKILLS Macro above
• More focused marketing and local promotional events that
explicitly illustrate strengths
• Nurture Tier 2 players as possible partners through
capacity building, seed funding, preferential treatment in
government procurement
Channel Distributors Consider
Channel Tier 1 VAR Monitor
Channel Tier 2 VAR Focus • Develop plans to help elevate Tier II players into Tier I
players
• Business Incubation Initiatives
• Capacity building outside urban areas and create
employment
Infrastructure Last Mile Access Consider • Pursue CCK about USF plans and enjoin KITCB in
discussions on ICT Access Gaps
• Collaborate with CCK to sensitize operators on USF
Infrastructure Backbone/Backhaul -
remote areas
• Develop a framework under which PPPs can be started
and depart from the present scenario where PPPs are
covertly commercially oriented, ad hoc, bereft of synergies

56 #undefined ©2011 IDC
T A B L E 6
R ec o m m e n da t i o n s
Macro Area Details Action Broad Recommendations
and leveraging value.
• Consider wireless/satellite technology elements in national
infrastructure plans for economically unviable areas to mix
with Wi-Fi and other technologies for last mile access
Infrastructure Power • Offer subsidies (and reward schemes) to operators with
renewable energy focus or innovation that address power
issues
Cost Internet Services Consider • Further subsidize public access areas, secondary schools
Cost PC Costs Consider • Revive local assembly initiatives (e.g. Nigeria with Zinox)
Cost Handset Costs
(Smart/WAP)
Consider • Partnerships with vendors of low cost devices, tap into local
application community
Source: IDC
T A B L E 7
A c t i o n s b y M ac r o A r e a s
Intervention Type Macro areas addressed
Financial Infrastructure Skills Residential Channel Cost
Private Public Partnerships Infrastructure Skills Residential Cost
Regulation Infrastructure Business Residential Channel
Awareness Skills Business Residential
Content Skills Business Residential
Curriculum reform Skills
Source: IDC
L E AR N M O R E
R e l a t e d R e s e a r c h

©2011 IDC #undefined 57
A P P E N D I X I – I N T E R N AT I O N AL B E N C H M AR K I N G
T A B L E 8
B e n c h m a r k i n g
Kenya RSA Nigeria Rwanda Ukraine Philippines Egypt Morocco
International Internet Bandwidth - Mb/sec per 10000 population 4.2 0.7 0 0.035 2.1 1.1 12 16
Computers per 100 inhabitants 1.4 8.4 0.9 0.3 4.5 7.2 3.9 5.7
Proportion of households with a computer 0.063 0.17 0.12 0.025 0.212 0.144 0.28 0.32
Total Internet user penetration 0.225 0.14 0.2834 0.12719 0.333 0.291749 0.295 0.414201
Internet subscribers percentage of total population 0.084 0.123 0.0515 0.04332 0.23 0.02947 0.267 0.025078
Internet Access Tariff - Broadband 39.8 26.9 105 88 7.2 21.5 8.2 16.8
Internet Usage Tariff - Dial Up $29.5 10.9713 63.29 61.25 $13.4 10.23 NA* 18.33
Price of Internet Access for 512 Kbps $22 $51 83 1050 NA 10.5 $43 24
Proportion of households with internet access 0.022 0.0883 0.001 0.0147 0.207 0.18 0.314 0.162
Extent of Business Internet Use - WEF Indicator 4.77 5.14 4.5 1.75 4.72 4.5 4.72 4.6
ICT Use and Government Efficiency - WEF Indicator 4.35 4.07 3.8 3.56 3.6 4.43 4.2
Government Online Service Index - WEF Indicator 0.24 0.31 0.1 0.17 0.35 0.39 0.53 0.24
Laws Related to ICT - Laws relating to the use of information
technology (electronic commerce, digital signatures, consumer
protection) - WORLDBANK Indicator
3.9 4.8 3.4 NA 3.4 3.6 3.4 3.6
Number of BPO jobs 12,500 38,300-
40,000
NA * NA * NA * 600,000 NA * 100,000
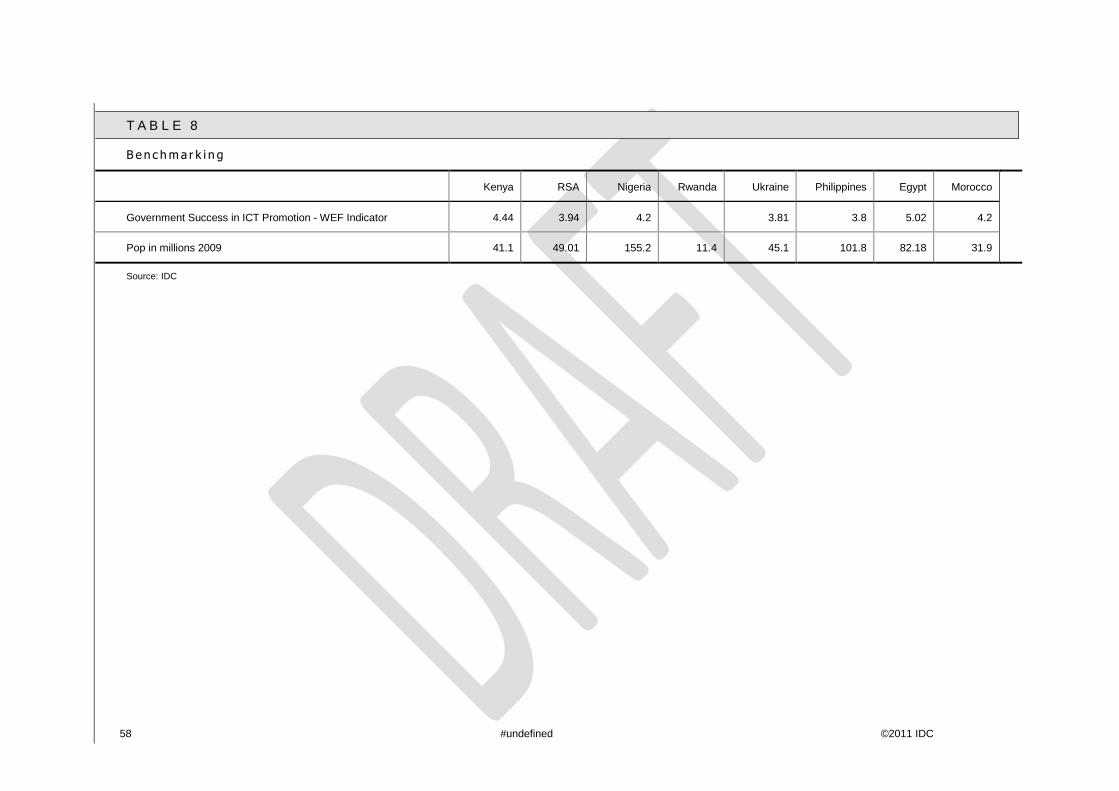
58 #undefined ©2011 IDC
T A B L E 8
B e n c h m a r k i n g
Kenya RSA Nigeria Rwanda Ukraine Philippines Egypt Morocco
Government Success in ICT Promotion - WEF Indicator 4.44 3.94 4.2 3.81 3.8 5.02 4.2
Pop in millions 2009 41.1 49.01 155.2 11.4 45.1 101.8 82.18 31.9
Source: IDC

©2011 IDC #undefined 59
A P P E N D I X I I – K E Y P E R F O R M A N C E I N D I C AT O R S
T A B L E 9
K e y P e r f o r m a n c e I n d i c a t o r s
Description Indicator
Volume of international traffic (Mbps) 20,209.56 Mbps
International Internet bandwidth, Mbps per 10,000 population 4.2
Computers per 100 inhabitants 1.4
% of households with a personal computer 0.063
Total number of Internet Subscriptions 4716977
Total number of internet users 10199836
% of population with Internet Access 0.259
Internet subscribers as % of total population 0.115
Total number of main fixed lines (fixed lines plus fixed wireless) 380748
Total Fixed line penetration (per 100 inhabitants) 0.97
Total number of mobile subscriptions 24968891
Total penetration of mobile services (per 100 inhabitants) 0.632
Total teledensity 0.642
Number of .Ke domain names 18000
% of organizations with a website 0.9
% of full time employees who use internet for work at least once a week 0.5214
Satisfaction of residents with government services received through electronic
delivery
46% satisfied or very satisfied
Satisfaction of organizations with government services received through electronic
delivery
36% satisfied or very satisfied
Intellectual property protection (Out of a 1–7 (best) scale) 2.9
Software Piracy Rate 0.79
Commercial value of unlicensed software US$ 85 Mn
Intellectual Property Protection Ranking 94 (out of 130 countries)
Are Kenyan laws adequate to address legal matters related to electronic
transactions such as cybercrime and online dispute resolution?
52% of Organizations Disagree
Is enforcement in Kenya with regards to intellectual property and electronic
transactions adequate?
59% of Organizations Disagree

60 #undefined ©2011 IDC
T A B L E 9
K e y P e r f o r m a n c e I n d i c a t o r s
Description Indicator
Organization is comfortable with transacting online for business purposes from the
point of view of privacy and data protection
65% of Organizations Agree
Number of operators buying capacity at the landing station or Number of operators
with access to the landing station
11 major operators & others
Global Networked Readiness Index 2011 Ranking 81 (out of 139)
Price of Internet Access for 512 Kbps US$ 22
Fixed broadband Internet access tariff ($ per month) US$ 39.8
Dial up Internet tariff ($ per Month) U$ 29.5
Number of BPO jobs 12500
Number of BPO seats 5000
Number of educational institutions connected to national network 60
Number of educational campuses connected to national network 74
Number of students connected to broadband 176000
Number of universities connected to broadband 15
Number of networked PCs per 100 students 6
Number of Government institutions connected to the government virtual network 64 Ministries and departments
connected to a capacity of 80Mbps
% of Government organizations connected to Government virtual network 0.56
Share of documents with security classification in Government Organizations 0.34
% employees with email account in the Government Organization 0.43
ICT use &Government efficiency (Out of a 1–7 (best) scale) 4.3
% of archived High Court registry digitized 0.2
Volume of work digitized in the Judiciary 216,000 case files or 60,000,000
pages
% employees with email account in the Judiciary 0.5
Number of government domain names (.go.ke) 344
High-tech exports as % of goods exports 0.021
Government Success in ICT Promotion 4.4
Government Online Service Index, 0–1 (best) 0.24

©2011 IDC #undefined 61
T A B L E 9
K e y P e r f o r m a n c e I n d i c a t o r s
Description Indicator
E-Participation Index, 0–1 (best) 0.23
Computer, communications, & other services imports, as % of services imports 0.263
Source: IDC, CCK, e-Gov, WEF, World Bank, Kenic

62 #undefined ©2011 IDC
A P P E N D I X I I I - P R O J E C T B AC K G R O U N D
With an aim to improve service delivery, transparency and efficiency, the project
wishes to conduct a two phased survey (an initial phase I and a follow-up by phase II,
one year later)as per the scope of the services below, as part of the overall
monitoring and evaluation plan to:
Establish data based information for assessing equity of ICT access, penetration
and usage;
Establish the baseline data for the M&E ICT indicators tracked by the KICTB;
Identify the current size of Kenyan ICT market for 2009, broken down by sub-
segment such as PC/Servers/Storage/Software/Services/Telecom Services;
Understand the growth trends of the ICT market and the role of Kenya as a hub
of ICT in the region;
Understand the role of Local Kenyan IT companies in the growth of ICT in the
country and key challenges towards their development;
Identify criteria to create a benchmark for the development of ICT in Kenya in
comparison to surrounding region;
Understand the current and planned usage of various ICT technologies in critical
industry sectors;
Understand the current supply, usage and future demand of different types of IT
skills by organizations in Kenya; and
Analyze the current fulfillment strategy employed by organizations in Kenya of
their IT skill needs, evaluation of the supply of IT skills in the country and thereby
the expected gap in the coming years.
Project Benefits
The project deliverables will engender a range of benefits supporting the primary and
secondary project objectives. The major benefits can be summarized as:
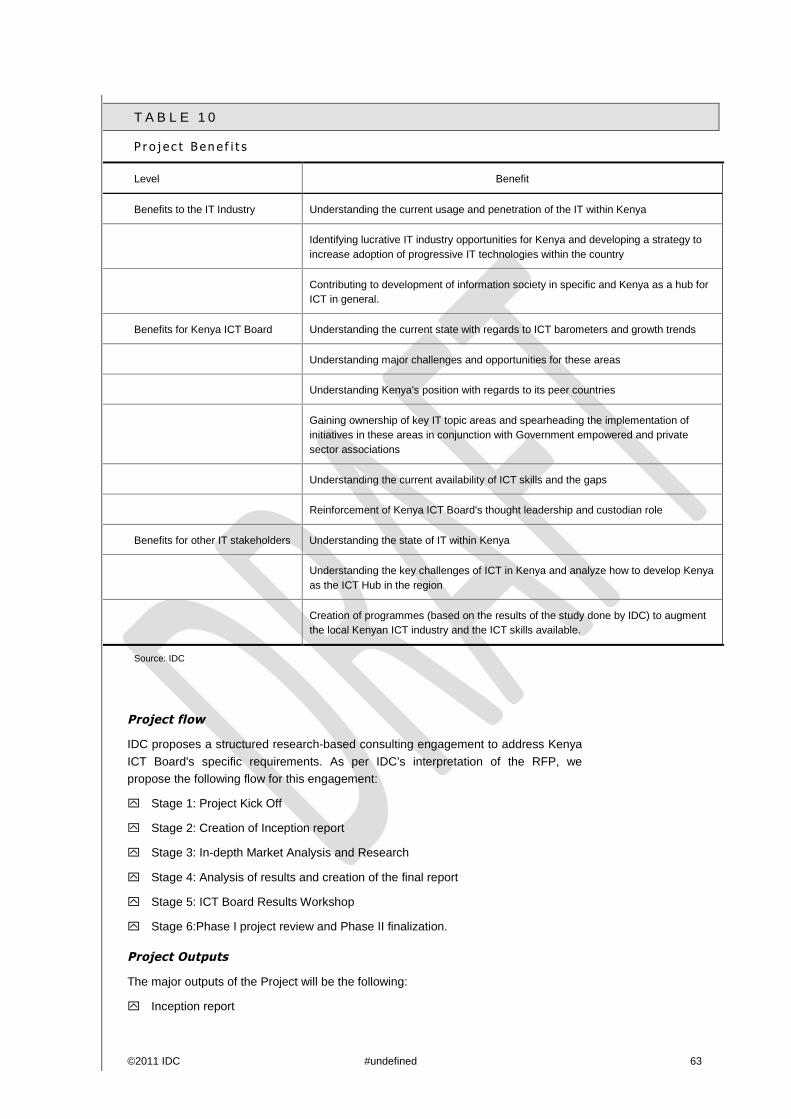
©2011 IDC #undefined 63
T A B L E 1 0
P r o j e c t B en e f i t s
Level Benefit
Benefits to the IT Industry Understanding the current usage and penetration of the IT within Kenya
Identifying lucrative IT industry opportunities for Kenya and developing a strategy to
increase adoption of progressive IT technologies within the country
Contributing to development of information society in specific and Kenya as a hub for
ICT in general.
Benefits for Kenya ICT Board Understanding the current state with regards to ICT barometers and growth trends
Understanding major challenges and opportunities for these areas
Understanding Kenya's position with regards to its peer countries
Gaining ownership of key IT topic areas and spearheading the implementation of
initiatives in these areas in conjunction with Government empowered and private
sector associations
Understanding the current availability of ICT skills and the gaps
Reinforcement of Kenya ICT Board's thought leadership and custodian role
Benefits for other IT stakeholders Understanding the state of IT within Kenya
Understanding the key challenges of ICT in Kenya and analyze how to develop Kenya
as the ICT Hub in the region
Creation of programmes (based on the results of the study done by IDC) to augment
the local Kenyan ICT industry and the ICT skills available.
Source: IDC
Project flow
IDC proposes a structured research-based consulting engagement to address Kenya
ICT Board's specific requirements. As per IDC’s interpretation of the RFP, we
propose the following flow for this engagement:
Stage 1: Project Kick Off
Stage 2: Creation of Inception report
Stage 3: In-depth Market Analysis and Research
Stage 4: Analysis of results and creation of the final report
Stage 5: ICT Board Results Workshop
Stage 6:Phase I project review and Phase II finalization.
Project Outputs
The major outputs of the Project will be the following:
Inception report

64 #undefined ©2011 IDC
ICT Ecosystem report
Benchmarking table
KPI table
IT skills report
Final reports
Delivery workshop

©2011 IDC #undefined 65
A P P E N D I X I I I - M E T H O D O L O G Y
F I G U R E 3 4
E c o s y s t e m
Source: IDC, 2011
I n - d e p t h M a r k e t A n a l y s i s a n d R e s e a r c h
3 A: Understanding of the State of IT in Kenya and Local Kenya IT
ecosystem
Description:The purpose of this module is to understand the current state of IT
in Kenya and the role of Kenya as an ICT hub in the region. This module consists of
two distinct components:
Kenya ICT ecosystem analysis
Scope: The objective of this module is to understand the following:
1. Analyze the size and 5 year growth forecast for the Kenyan ICT industry.
2. Breakdown of the ICT industry by multiple categories such asHardware(PC’s/Servers/Storage)/Software/Services/Telecom
3. Understanding the drivers and inhibitors of the ICT investments in Kenya
4. Understanding the key sectors driving ICT investments
5. Understanding the role of local Kenya ICT companies within the Kenyan ICT market ecosystem
6. Understanding the key challenges faced by Kenyan ICT Companies in developing and support neededfrom the government
Methodology:The analysis will be derived from the following sources:
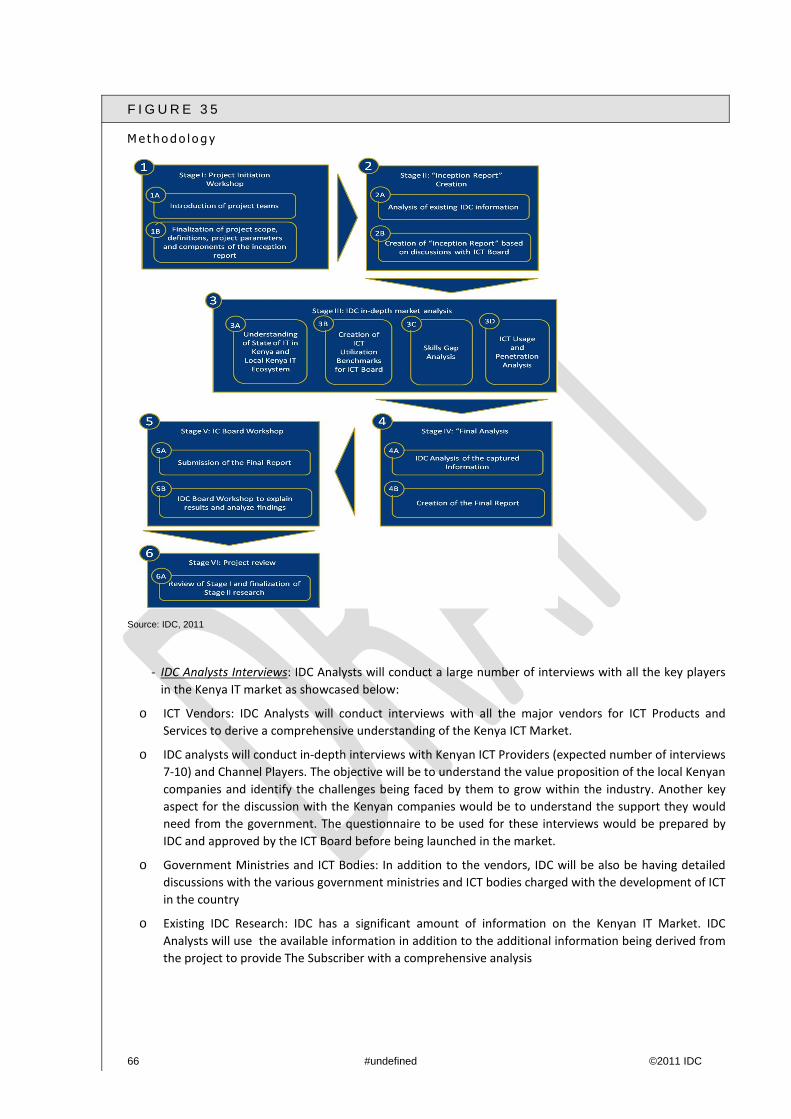
66 #undefined ©2011 IDC
F I G U R E 3 5
M e t h o d o l o g y
Source: IDC, 2011
- IDC Analysts Interviews: IDC Analysts will conduct a large number of interviews with all the key players
in the Kenya IT market as showcased below:
o ICT Vendors: IDC Analysts will conduct interviews with all the major vendors for ICT Products and
Services to derive a comprehensive understanding of the Kenya ICT Market.
o IDC analysts will conduct in-depth interviews with Kenyan ICT Providers (expected number of interviews
7-10) and Channel Players. The objective will be to understand the value proposition of the local Kenyan
companies and identify the challenges being faced by them to grow within the industry. Another key
aspect for the discussion with the Kenyan companies would be to understand the support they would
need from the government. The questionnaire to be used for these interviews would be prepared by
IDC and approved by the ICT Board before being launched in the market.
o Government Ministries and ICT Bodies: In addition to the vendors, IDC will be also be having detailed
discussions with the various government ministries and ICT bodies charged with the development of ICT
in the country
o Existing IDC Research: IDC has a significant amount of information on the Kenyan IT Market. IDC
Analysts will use the available information in addition to the additional information being derived from
the project to provide The Subscriber with a comprehensive analysis

©2011 IDC #undefined 67
Benchmarking of Kenya with key peer countries
Scope: The objective of this module is as follows:
1. Benchmarking of Kenya with regards to key peer countries.
2. The countries to be selected would be Kenya, Nigeria, Uganda, Tanzania, Ethiopia, South Africa, and 1additional country
F I G U R E 3 6
B e n c h m a r k i n g
Source: IDC, 2011
Methodology: The analysis to be derived from the benchmarking study would be:
To provide Kenya ICT Board with a comparative analysis of Kenya with its peer countries such as Kenya,
Nigeria, Uganda, Tanzania, Ethiopia, South Africa, Egypt and 1 additional countries (to be discussed) with
regards to the ICT industry. IDC will benchmark key parameters such as installed base of PC’s, IT market
developments, comparative analysis of the local markets and growth projections. The objective would be
creating a SWOT analysis of Kenya in comparison to these countries. The parameters to be used for the
benchmarking will based on available IDC research and additional secondary research as necessary.
3 B: Benchmarking of KPIs of Kenya ICT Board
Description:Establish baseline data for M&E ICT indicators to be tracked by KICTB
Scope: The scope is to create quantitative indicators/data points for the list of
parameters as listed in Appendix H of the RFP shared by ICT Board.
Methodology:IDC proposes to derive the requested information using a combination
of secondary research and interviews with identified bodies in Kenya. These would be
bodies such as e-Government Directorate (Lands, Judiciary and Company Registry),
Kenya Education Network Trust (KENET), Communication Commission of Kenya
(CCK), Business Processing and Outsourcing (BPO) Industry and the Ministry of
Information (MoIC). IDC will also conduct comprehensive secondary research to
68 #undefined ©2011 IDC
derive the requested information from international accepted resources such as ITU,
UN, World Bank etc. Identification of a quantitative parameter for each point listed on
Appendix H will happen in a mutually agreeable manner during the Stage 1 and
Stage 2 of the proposed project. The deliverables would be limited to information
available with IDC Knowledgebase, information derived from interviews with the
stated government bodies and add on secondary research.
Note: For this module, IDC requests the assistance of the Kenya ICT Board for the
following:
1. Sharing of key contacts in government ministries from the Kenya ICT Board
2. Provision of a letter indicating your support and thereby a request to share information by the reader ofthe letter
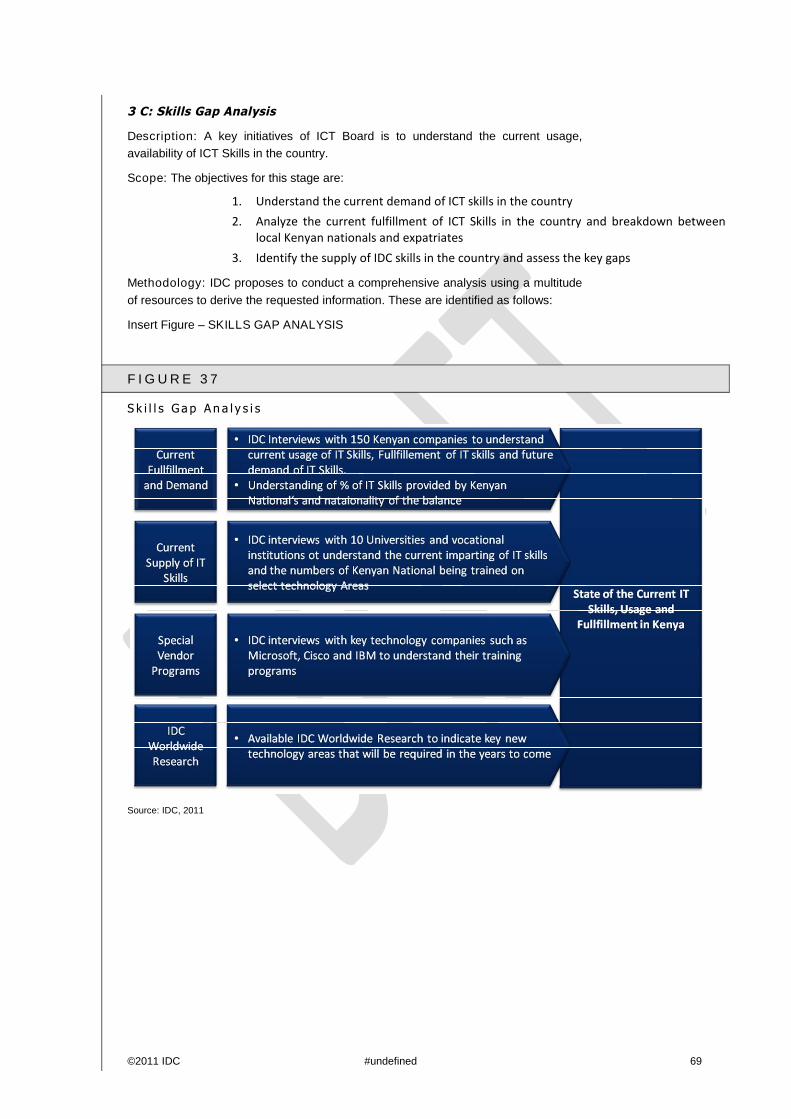
©2011 IDC #undefined 69
3 C: Skills Gap Analysis
Description: A key initiatives of ICT Board is to understand the current usage,
availability of ICT Skills in the country.
Scope: The objectives for this stage are:
1. Understand the current demand of ICT skills in the country
2. Analyze the current fulfillment of ICT Skills in the country and breakdown betweenlocal Kenyan nationals and expatriates
3. Identify the supply of IDC skills in the country and assess the key gaps
Methodology: IDC proposes to conduct a comprehensive analysis using a multitude
of resources to derive the requested information. These are identified as follows:
Insert Figure – SKILLS GAP ANALYSIS
F I G U R E 3 7
S k i l l s G a p A n a l y s i s
Source: IDC, 2011
70 #undefined ©2011 IDC
End-user interviews:IDC will conduct in-depth research with a representative number of end user
companies to understand the following:
o Current usage of IT Skills and future demand
o Plans given the influx of managed and cloud services
o % of National Kenyans providing IT Services as compared to expatriates
o Understanding of preferences of choosing IT specialists
o Understanding IT training budgets and areas of investments
o Key challenges and pain areas when it comes to IT support
IDC will be interviewing ~150 organizations across identified (top 3-5) sectors in Kenya. IDC will prepare
the questionnaire which will be approved by ICT Board before being rolled out in the field.
- Interviews with Educational and Training Institutions: Analysts will also interview the educational
institutions at a university and vocational level to understand:
o Current student strengths and enrolment trends within technology areas
o Mapping the demand of specific sills and imparting of the same to students
o Availability of required trainings and drivers/inhibitors/pricings for the same
IDC will be interviewing ~10 universities and vocational institutions
- Interviews with IT Vendors and Special Programs:Analysts will also interview key IT vendors such as
Microsoft/Cisco/Oracle etc to understand:
o Programs for providing specialist trainings to IT professionals
o Understanding of the gaps in terms of skills availability and impact on business
IDC will be interviewing ~5 technology companies

©2011 IDC #undefined 71
3 D: ICT Usage and Penetration analysis
xDescription: With a view of understanding the ICT Usage and penetration within the
country, IDC proposes to conduct extensive and statistically representative number of
interviews to derive the required results.
F I G U R E 3 8
U s a g e a n d p e n e t r a t i o n A n a l y s i s
Source: IDC, 2011
Scope: The objectives for this stage are:
1. Understand the current usage and penetration of ICT products and services in the country
2. Familiarity of ICT Products and services and perceptions with regards to the benefits to be derived fromthe same.
3. Understand the key drivers and inhibitors towards usage of IDC products and services
4. Analyze the breakdown of ICT usage and penetration broken down by demographic parameters such asRegion/age/income etc
5. Understand the current level of satisfaction with regards ICT spending and prices being charged.
IDC proposes to conduct 1000 telephonic interviews. IDC will prepare the
questionnaire for the research which will be approved by ICT Board before being
rolled out in the field.

72 #undefined ©2011 IDC
C o p y r i g h t N o t i c e
This IDC research document was published as part of an IDC continuous intelligence
service, providing written research, analyst interactions, telebriefings, and
conferences. Visit www.idc.com to learn more about IDC subscription and consulting
services. To view a list of IDC offices worldwide, visit www.idc.com/offices. Please
contact the IDC Hotline at 800.343.4952, ext. 7988 (or +1.508.988.7988) or
[email protected] for information on applying the price of this document toward the
purchase of an IDC service or for information on additional copies or Web rights.
Copyright 2011 IDC. Reproduction is forbidden unless authorized. All rights reserved.