5th annual brazil investment forum bradesco bbi presentation bradesco... · 3 the information...
TRANSCRIPT

5th Annual Brazil Investment Forum – Bradesco BBIApril, 2018

3
The information contained in this presentation may include statements whichconstitute forward-looking statements, within the meaning of Section 27A of the U.S.Securities Act of 1933, as amended, and Section 21E of the U.S. Securities ExchangeAct of 1934, as amended. Such forward-looking statements involve a certain degree ofrisk and uncertainty with respect to business, financial, trend, strategy and otherforecasts, and are based on assumptions, data or methods that, although consideredreasonable by the company at the time, may turn out to be incorrect or imprecise, ormay not be possible to realize. The company gives no assurance that expectationsdisclosed in this presentation will be confirmed. Prospective investors are cautionedthat any such forward-looking statements are not guarantees of future performanceand involve risks and uncertainties, and that actual results may differ materially fromthose in the forward-looking statements, due to a variety of factors, including, but notlimited to, the risks of international business and other risks referred to in thecompany’s filings with the CVM and SEC. The company does not undertake, andspecifically disclaims any obligation to update any forward-looking statements, whichspeak only for the date on which they are made.
Disclaimer
4
Pulp and Paper Market2Financial and Operational Highlights3
Company Overview1
2018 Outlook – CAPEX and Cash Cost4Expansion Project – Horizonte 2
Back up65

5
Company Overview

6
Shareholder Structure and Corporate Governance
(1) Controlling group (2) Free Float 41.36% + Treasury 0.14%
Votorantim S.A. (1)
29.42%
BNDESParticipações (1)
29.08%
FreeFloat (2)
41.36%
► Only 1 class of shares → 100% voting rights
► 100% tag along rights (Brazilian corporate law establishes 80%)
► Board of Directors with minimum 20% independent members
► Financial Statements in International Standards – IFRS
► Adoption of Arbitration Chamber
► SEC Registered ADR Level III program
Listed on Novo Mercado, highest level at B3:
Policies approved by the Board of Directors:
Fiscal Council
Board of Directors
20% independent members
Role of CEO andchairman is split
Personnel and Remuneration
Committee
Statutory Audit
Committee
Finance Committee
Sustainability Committee
Innovation Committee
30% independent
members
100% independent
members
50% independent members
45% independent members -
General Meeting
► Indebtedness and Liquidity
► Market Risk Management
► Risk Management
► Corporate Governance
► Related Parties Transactions
► Anti-Corruption
► Information Disclosure
► Securities Trading
► Antitrust
► Genetically Modified Eucalyptus
► Dividend Policy
► Sustainability

7
A Winning Player
Port Terminal Pulp Unit
Três Lagoas I and II
Santos
AracruzPortocel
Caravelas
BelmonteVeracel
Jacareí
Superior Asset Combination Main Figures – 2017
Pulp capacity(1) million tons 7.250
Net revenues US$ billion 3.677
Total Forest Base(2) thousand hectares 1,092
Planted area(2) thousand hectares 656
Net Debt US$ billion 3.728
Net Debt/EBITDA (in Dollars)(3) X 2.41
Source: Fibria(1) Includes Horizonte 2 pulp capacity.(2) Including 50% of Veracel, excluding forest partnership areas and forest bases linked to the sales of Losango and forest assets in Southern Bahia State; As of December 31, 2017. (3) For covenants purposes, the Net Debt/EBITDA ratio is calculated in Dollars.

8
Fibria’s Units Industrial Capacity
(1) Veracel is a joint operation between Fibria (50%) and Stora Enso (50%) and the total capacity is 1,120 thousand ton/year
(1)
Três Lagoas– Mato Grosso do Sul – 3,250 thousand t/year

9
Worldwide presence
Strong global customer base
Long-term relationships
Focus on customers with stable business
Customized pulp products and services
Sound forestry and industrial R&D
Focus on less volatile end-use markets such as tissue
Lower dependence on volatile markets such as China
Efficient logistics set up
Low counterparty credit risk
100% certified pulp (FSC and PEFC/Cerflor)
Revenues by Region and by End Use - Fibria Highlights
Fibria’s Commercial Strategy
Net Revenues by Region - Fibria
Region – 4Q17 End Use – 4Q17
39% 41% 43%36% 32%
28% 24% 24%
22%20%
24% 25% 24%32% 39%
9% 10% 9% 10% 9%
2013 2014 2015 2016 2017
Europe North America Asia LatAm
28%
20%
43%
9%
Europe
North America
Asia
LatinAmerica
51%
33%
16%
TissuePrinting
& Writing
Specialties
10
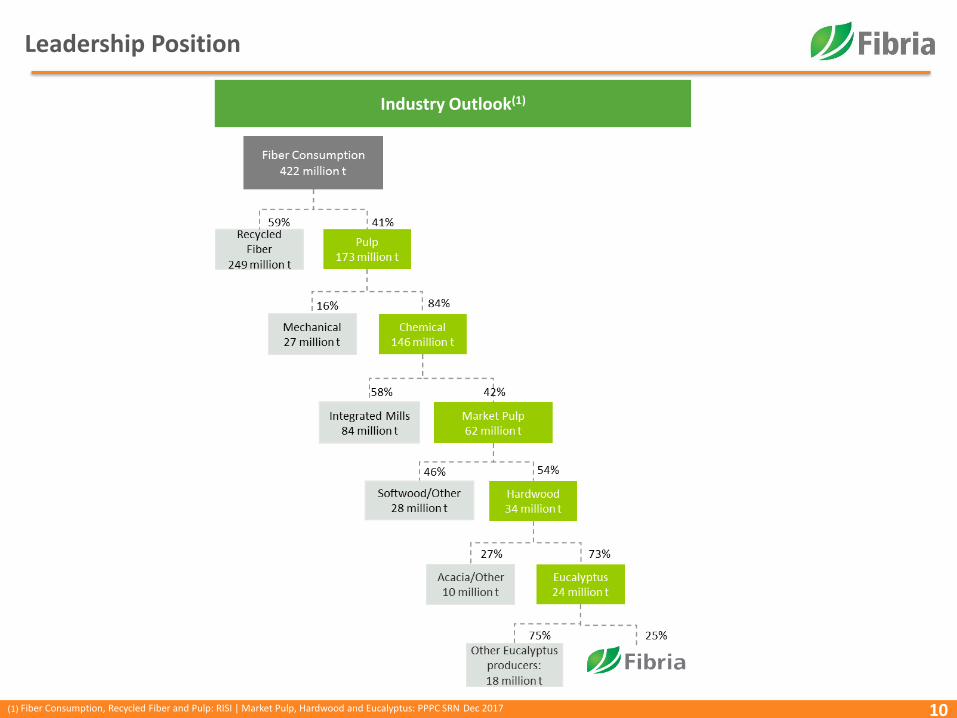
Leadership Position
(1) Fiber Consumption, Recycled Fiber and Pulp: RISI | Market Pulp, Hardwood and Eucalyptus: PPPC SRN Dec 2017
Industry Outlook(1)
11
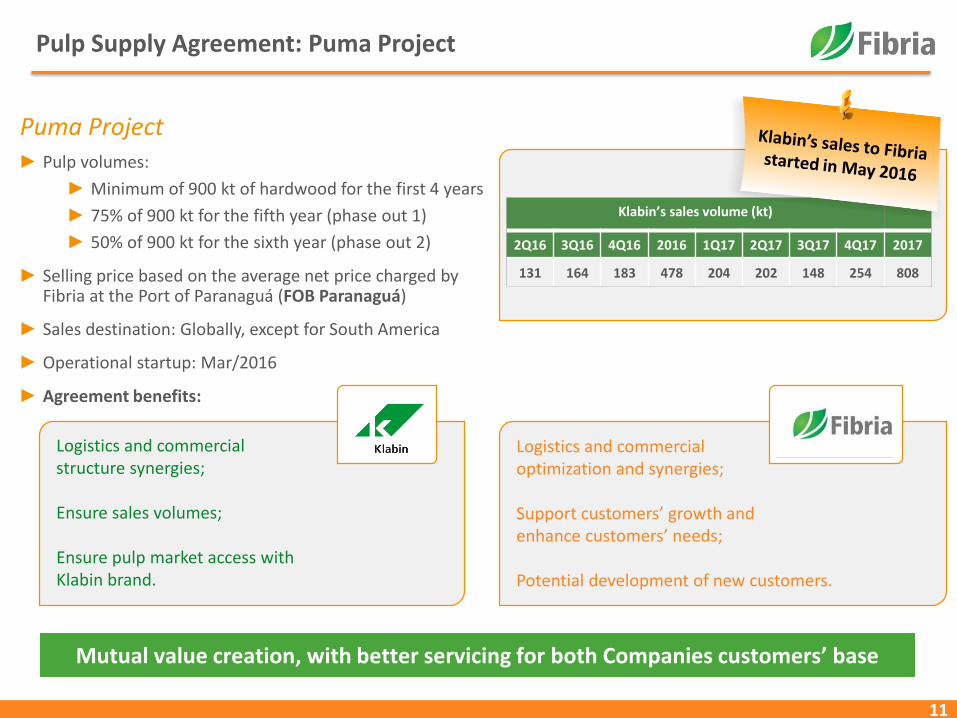
Pulp Supply Agreement: Puma Project
► Pulp volumes:
► Minimum of 900 kt of hardwood for the first 4 years
► 75% of 900 kt for the fifth year (phase out 1)
► 50% of 900 kt for the sixth year (phase out 2)
► Selling price based on the average net price charged by Fibria at the Port of Paranaguá (FOB Paranaguá)
► Sales destination: Globally, except for South America
► Operational startup: Mar/2016
► Agreement benefits:
Puma Project
Mutual value creation, with better servicing for both Companies customers’ base
Logistics and commercial structure synergies;
Ensure sales volumes;
Ensure pulp market access with Klabin brand.
Logistics and commercial optimization and synergies;
Support customers’ growth and enhance customers’ needs;
Potential development of new customers.
Klabin’s sales volume (kt)
2Q16 3Q16 4Q16 2016 1Q17 2Q17 3Q17 4Q17 2017
131 164 183 478 204 202 148 254 808

12
Pulp and Paper Market

13
What has been the 2017 Supply & Demand scenario?Also, compared to our forecast…
BHKP CAPACITY CHANGES
(‘000 t)
FIBRIA EXPECTED SCENARIO FOR 2017 AT THE END 2016
1,350
720
-500
-60
-40
-80
-300
-100
300
1,000
500
BHKP demand growth**
Net Supply Availability
Unexpected Closures and Downtime
Navigator Cacia
Resolute Calhoun
Taiwan P&P
APRIL Rizhao
APRIL Kerinci
Fibria TLS II
APP OKI
Klabin
1,027*
-230
-960
-85
-40
-60
-400
-300
-115
25
35
470
700
500
390BHKP demand growth**
Net Supply Availability
Unexpected Closures and Downtime
Fibria Aracruz
Resolute Calhoun
Taiwan P&P
APRIL Jiangmen
APRIL Rizhao
APRIL Kerinci
Altri Celbi
Ence Pontevedra & Navia
Fibria TLS II
APP OKI
Klabin
SCENARIO YTD 2017
** Fibria’s estimates | *Source: PPPC Global 100 Jan-Sep 2017

14
…and what has been the price scenario?
669 672 676 666 670
680
783
873940
818
1Q17 2Q17 3Q17 4Q17 Annual 2017
Consultants average at the end previous year Realized PIX/FOEX price
▐ BHKP Delivered to Europe (USD/t)
Consultants: Hawkins Wright, RISI and Brian McClay (published at the end 2016 for 2017 prices)

15
A firm global demand but more importantly... driven by all the regions
2013 2014 2015
2016
5.3%
5.5%
-0.2%
19.0%
-300
0
300
600
900
1200
1500
Global NA WE China
3.3%
5.2% 2.0%5.2%
Global NA WE China
3.3%
-3.5%
3.7%6.2%
Global NA WE China
4.3%
-4.4% -2.6%
20.2%
-300
0
300
600
900
1200
1500
Global NA WE China
Source: PPPC Global 100
BHKP DEMAND (KT AND % CHANGE, Y-O-Y)
2017
4.3%
0.2%
-0.6%
11.7%
Global NA Europe China

16
So, what could be next year’s scenario in terms of supply and demand?
FIBRIA EXPECTED SCENARIO FOR 2018 AT THE END 2017
(‘000 t)
2,950
2,930
-500
-50
-500
-200
30
25
85
135
100
100
1,360
1,300
960 85 (Aracruz)
BHKP demand growth
Net Supply Availability
Unexpected Closures and Downtime
Navigator Cacia
APRIL
Fibria Aracruz
Suzano Maranhão
Altri Celbi
Ence Pontevedra & Navia
UPM Kymi
Svetlogorsky P&B
Metsä Äänekoski
Fibria TLS II
APP OKI
Unexpected Downtimes 2017

17
New Paper capacities “Worldwide”
2016 2017 2018F
Woodfree -360 150 715
China 155 890 510
Rest of the World -510 -740 205
Tissue 1,535 2,380 3,525
China 1,000 1,170 1,945
Rest of the World 535 1,210 1,580
Cartonboard & Specialty 2,630 110 765
China 1,550 0 100
Rest of the World 1,080 110 665
Sources: Fibria and Independent Consultants

18
Why could HW demand still increase significantly in China ?
Total HW demand increase in 2018 could be around 2,215 kt... Just in China!
Waste paper ban imports reduction in 2018 should be around 5 million tons of Mixed Waste Paper. Let’s consider that:
▐ 60% MIGHT be sourced from domestic market and improved quality through sorting coming from overseas suppliers
▐ 40% MIGHT switch to virgin pulp: 2 million tons / 1.4 = 1.4 million tons
– 80% benefits SW demand: 1.1 million tons
– 20% benefits HW demand: 300Kt
Closures of inefficient Pulp & Paper mills might increase HW demand by 540Kt
New Paper capacities should increase HW demand by 1,375Kt
1
2
3
kt2017Q3 &
Q4
2018Q1 &
Q2Total
New Tissue Machines
715 810 1,525
New Woodfree Machines
400 510 910
70% of HW furnish @ 75% O.R. for Tissue and 90%
O.R. for P&W
Total:
2,435kt 1,375kt

19
Low inventories at the Chinese Paper & Board producers
20
40
60
80
100
120
140
160
Jan-14 Jul-14 Jan-15 Jul-15 Jan-16 Jul-16 Jan-17 Jul-17
65
70
75
80
85
90
95
100
105
Jan-14 Jul-14 Jan-15 Jul-15 Jan-16 Jul-16 Jan-17 Jul-17
80
90
100
110
120
130
140
150
160
Jan-14 Jul-14 Jan-15 Jul-15 Jan-16 Jul-16 Jan-17 Jul-17
40
60
80
100
120
140
160
180
200
May-15 Sep-15 Jan-16 May-16 Sep-16 Jan-17 May-17 Sep-17
Fibria Index for Paper & Board inventories @ Paper & Board producers
Fibria Index for Chemical Pulp inventories @ Paper & Board producers
Fibria Index for Pulp inventory @ Changshu Fibria Index for Pulp inventory @ Qingdao
Source: Fibria according to company’s estimates

20
Shipments of Hardwood and Eucalyptus Pulp
Global Market BEKP Demand
(1) Source: PPPC G100– Dec/2017 (2) Source: PPPC Global 100 – December/2017 (3)Source: FOEX China (in US$)
CAGR BEKP 2012-2017(2)
2,269kt
140 kt354 kt
1,337kt
438 kt
13%
8%5%
30%
9%
Total NorthAmerica
WesternEurope
China Others
Hardwood inventories – in days(1)
12M17 vs. 12M16(1)
37
33
35
37
39
41
43
45
47
49
Ap
r-1
3Ju
n-1
3A
ug-
13
Oct
-13
De
c-1
3Ja
n-1
4A
pr-
14
Jun
-14
Au
g-1
4O
ct-1
4D
ec-
14
Feb
-15
Ap
r-1
5Ju
n-1
5A
ug-
15
Oct
-15
De
c-1
5Fe
b-1
6A
pr-
16
Jun
-16
Au
g-1
6O
ct-1
6D
ec-
16
Feb
-17
Ap
r-1
7Ju
n-1
7A
ug-
17
Oct
-17
Avg=40
1,586kt
-5 kt
1,386kt
255 kt124 kt
10 kt 319kt
Total NorthAmerica
WesternEurope
China Other
BHKP BEKP
579kt
126kt-50 kt
2%
5%
6%0% -1%
0%
13%
2%3% 6%
Pulp Price China – BHKP vs. NBSK (3)
400 450 500 550 600 650 700 750 800 850 900 950 1.000
0255075
100125150175200225250
Jan
-16
Feb
-16
Mar
-16
Ap
r-1
6M
ay-1
6Ju
n-1
6Ju
l-1
6A
ug-
16
Sep
-16
Oct
-16
No
v-1
6D
ec-1
6Ja
n-1
7Fe
b-1
7M
ar-1
7A
pr-
17
May
-17
Jun
-17
Jul-
17
Au
g-1
7Se
p-1
7O
ct-1
7N
ov-
17
Dec
-17
Jan
-18
Feb
-18
Mar
-18
Spread BHKP NBSK

21
Technical Age and Scale in the Pulp IndustryFurther closures are expected due to lack of adequate investments in the industry…
Hardwood (BHKP) Producers – Integrated and Market Pulp Mills
Softwood (BSKP) Producers – Integrated and Market Pulp Mills
STRONG
Weighted average
technical age 12.3 years
Weighted average
capacity 1,350,000 t/a
Aracruz
Três Lagoas
Veracel
Jacareí
WEAK
STRONGWeighted average
technical age 21 years
Weighted average
capacity 534,000 t/a
North American Pulp Mills Other Pulp Mills
WEAK
More than 6.6 million tons of capacity above 25 years and with annual capacity below 500,000 t/y.
PM Capacity, 1000 t/a
0
100
200
300
400
500
600
700
800
900
1000
051015202530
Technical age, years
Source: Poyry
PM Capacity, 1000 t/a
0
500
1000
1500
2000
051015202530
Technical age, years
3000

22Source: Poyry, PPPC, RISI and Public information.
Closures of Hardwood Market Pulp Capacity Worldwide(000 ton)
Capacity closures DO happen
-910
-85
-1,260-1,180
-540-500
-105
-1,085
-445
-315
-670
-1,115
-910
2006 2007 2008 2009 2010 2011 2012 2013 2014 2015 2016 2017 2018-2019
(1) Closures/conversion/integration 2018: April Rzhao (-500 kt), Navigator (-50 kt) and 2019: April Rizhao (360 kt).
(1)
Closures do not include temporary movements.(960 kt in 2017)
Potential Additional
Conversions

23
452 437
361 358309 302
208 203165
5855
116
32
62 56
61 55
60
43
36
2
20
11198
40
15
3
456
395
USA China Canada Iberia Chile/Uruguay Indonesia Brazil Fibria 2017 Fibria w/ H2Structural pro-
forma
Cash Production Cost (US$/t) Delivery CIF Europe
More Competitive Cash Cost with H2BHKP (US$/t)
Sources: Hawkins Wright (Production Costs September 2017) and Fibria’s 4Q17 Earnings Release. FX considered at R$/US$ = 3.12 (also assumed by Hawkins Wright). Fibria with Horizonte 2 (H2) cash production cost was estimated according to weighted average cost, after mill balance, converted at R$/US$ = 3.12. Includes energy sales. Pro-forma figures are in real terms (considering IPCA inflation up to 2018).
Interest
Capex
Income taxSG&A
-US$61
BHKP capacity (‘000 t)
1,140 1,875 1,100 2,285 4,795 3,830 16,265 TOTAL: 31,290
Assuming WC release = 0
WC

24
New Capacity Investment PipelineNo major new capacity announced after OKI and H2 projects
Cap
acit
y A
dd
itio
ns
(‘0
00
to
n)(2
)
Pu
lp p
rice
s -
CIF
Eu
rop
e (U
S$/t
on
)(2)
(1) Partially integrated production.(2) Sources: Hawkins Wright, Poyry and Fibria Analysis.
0
0,5
1
1,5
2
2,5
-
200
400
600
800
1.000
1.200
2000 2001 2002 2003 2004 2005 2006 2007 2008 2009 2010 2011 2012 2013 2014 2015 2016 2017 2018 2019 2020
BHKP BHKP adjusted by CPI
Metsa
Horizonte 2
APP South Sumatra(1)
Klabin
Guaíba II
OjiNantong
Montes del
Plata
Eldorado
Maranhão
ChenmingZhanjiangAPP
Guangxi
RizhaoTrês
Lagoas
KerinciPL3
Fray
BentosSanta
Fé
Mucuri
Nueva Aldea
Veracel
APP Hainan
Valdivia
JacareiAracruz
7,400 kt 5,250 kt

In the last 15 years, pulp volatility has been just 8%...why?
25
► Market price closer to producer’s marginal cost
► The marginal cost producers are based in Europe and North America
► Flattish industry cost curve
► Higher flexibility to adjust supply side during imbalanced market
► Market end users are linked to consumer goods, such as tissue
► Incipient pulp price futures market and low liquidity
Source: Bloomberg – Mar 29, 2018
0
40
80
120
160
200
De
c-0
0M
ar-0
1Ju
n-0
1Se
p-0
1D
ec-
01
Mar
-02
Jun
-02
Sep
-02
De
c-0
2M
ar-0
3Ju
n-0
3Se
p-0
3N
ov-
03
Feb
-04
May
-04
Au
g-0
4N
ov-
04
Feb
-05
May
-05
Au
g-0
5N
ov-
05
Feb
-06
May
-06
Au
g-0
6N
ov-
06
Feb
-07
May
-07
Au
g-0
7N
ov-
07
Feb
-08
May
-08
Au
g-0
8N
ov-
08
Feb
-09
May
-09
Jul-
09
Oct
-09
Jan
-10
Ap
r-1
0Ju
l-1
0O
ct-1
0Ja
n-1
1A
pr-
11
Jul-
11
Oct
-11
Jan
-12
Ap
r-1
2Ju
l-1
2O
ct-1
2Ja
n-1
3A
pr-
13
Jul-
13
Oct
-13
Jan
-14
Ap
r-1
4Ju
l-1
4O
ct-1
4Ja
n-1
5A
pr-
15
Jun
-15
Sep
-15
De
c-1
5M
ar-1
6Ju
n-1
6Se
p-1
6D
ec-
16
Mar
-17
Jun
-17
Sep
-17
De
c-1
7
BHKP - FOEX Europe (base 100) CPI (base 100)

26
Lowest volatility among commodities¹
(1) Bloomberg – up to Mar 29, 2018
Low volatility of hardwood pulp price, even thoughnew capacities have come on stream during the period.
20
50
80
110
140
170
200
230Ja
n-1
2Fe
b-1
2M
ar-1
2A
pr-
12
May
-12
Jun
-12
Jul-
12
Au
g-1
2Se
p-1
2O
ct-1
2N
ov-
12
Dec
-12
Jan
-13
Feb
-13
Mar
-13
Ap
r-1
3M
ay-1
3Ju
n-1
3Ju
l-1
3A
ug-
13
Sep
-13
Oct
-13
No
v-1
3D
ec-1
3Ja
n-1
4Fe
b-1
4M
ar-1
4A
pr-
14
May
-14
Jun
-14
Jul-
14
Au
g-1
4Se
p-1
4O
ct-1
4N
ov-
14
Dec
-14
Jan
-15
Feb
-15
Mar
-15
Ap
r-1
5M
ay-1
5Ju
n-1
5Ju
l-1
5A
ug-
15
Sep
-15
Oct
-15
No
v-1
5D
ec-1
5Ja
n-1
6Fe
b-1
6M
ar-1
6A
pr-
16
May
-16
Jun
-16
Jul-
16
Au
g-1
6Se
p-1
6O
ct-1
6N
ov-
16
Dec
-16
Jan
-17
Feb
-17
Mar
-17
Ap
r-1
7M
ay-1
7Ju
n-1
7Ju
l-1
7A
ug-
17
Sep
-17
Oct
-17
No
v-1
7D
ec-1
7Ja
n-1
8Fe
b-1
8M
ar-1
8
Iron Ore Soy Bean Crude Oil Sugar BHKP - FOEX Europe Exchange Rate (R$/US$)
142
174
66
4559
100 = January 1, 2012
36%28% 28% 26%
23% 22% 20% 18% 17%14%
5%
WTI Crude Oil Nickel Sugar Iron Ore Ibovespa Soy Copper Cattle LME Metals FX BHKP
(2) Since January 1, 2012 up to Mar 29, 2018
Historical Volatility of Commodities (US$)2 – Lower than FX
83

27
Financial and Operational Highlights
28
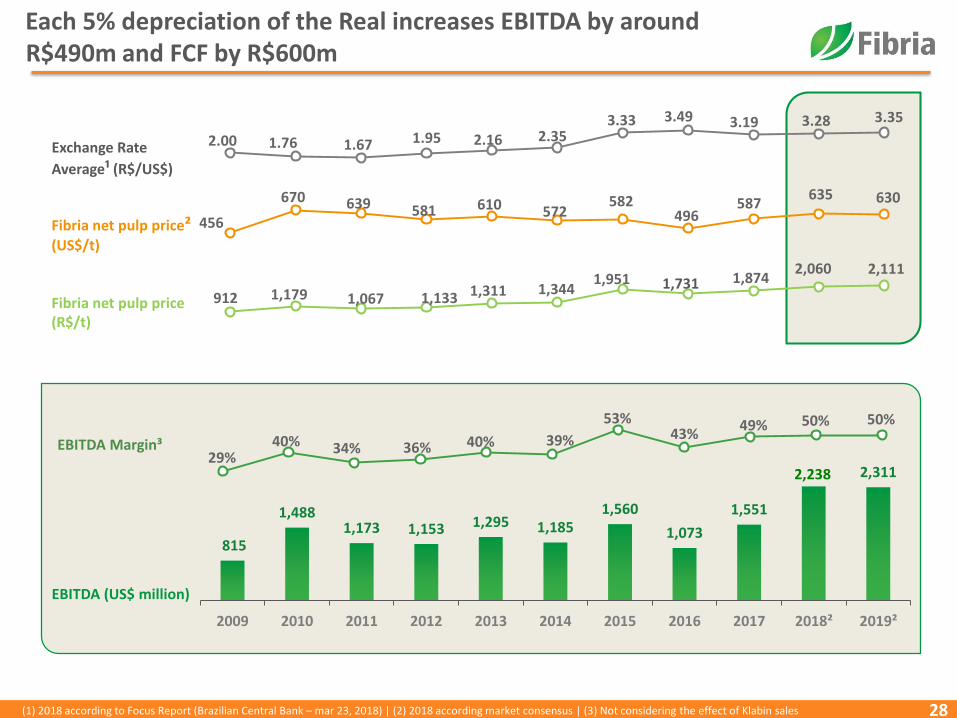
Each 5% depreciation of the Real increases EBITDA by around R$490m and FCF by R$600m
815
1,4881,173 1,153 1,295 1,185
1,560
1,073
1,551
2,311
2009 2010 2011 2012 2013 2014 2015 2016 2017 2018² 2019²
Exchange Rate
Average¹ (R$/US$)
EBITDA Margin³
EBITDA (US$ million)
Fibria net pulp price²(US$/t)
Fibria net pulp price(R$/t)
2.00 1.76 1.67 1.95 2.16 2.35 3.33 3.49 3.19 3.28 3.35
456
670 639 581 610 572 582
496587
635 630
29%40% 34% 36% 40% 39%
53%43%
49% 50% 50%
912 1,179 1,067 1,133 1,311 1,3441,951 1,731 1,874
2,060 2,111
(1) 2018 according to Focus Report (Brazilian Central Bank – mar 23, 2018) | (2) 2018 according market consensus | (3) Not considering the effect of Klabin sales
2,238

29
Cash Production Cost (R$/t) – 4Q17
4Q17 vs 4Q16 Ex-downtimes
Significant H2 contribution
197 171US$/tUtilities Results
4Q16: R$ 11/t | 3Q17: R$ 44/t | 4Q17: R$ 61/t
221 168
727
648
546 556(79)
(49)
(50)(29)
24 2 10
4Q16 Maintenancedowntimes
4Q16ex-downtimes
Wood Energysales
Fixed costdilution
Chemicals andenergy
Others 4Q17ex-downtimes
Maintenancedowntime
4Q17
680660
610
546(46)
(16)(16)
77
1Q17 2Q17 3Q17 Wood Energysales
Fixed costdilution
Otherfixed costs
FX/Others
4Q17
Cash production cost ex-downtimes (R$/t) 4Q17 vs. 3Q17
-10%
54
80
3Q17 4Q17
H2 energy surplus(MWh)
260
Avg. distance
(km):205
+48%
308 328

30
Cash Production Cost in dollars
But lately, it has been influencedby non-recurring effects:
Wood Energy price Input consumption
Consistently controlling the cash production cost
Fibria’s Cash Production Cost(1) (USD/ton)
231
264281
242 234220
186195 199
2009 2010 2011 2012 2013 2014 2015 2016 2017
1.99 1.76 1.67 1.95 2.16 2.35 3.33 3.49AverageFX
(BRL/USD)
(1) Excludes Conpacel
3.19

31
Net Results (R$ million)
1,981
280
(475)(128)
(207)
(687) (60)
(144)
AdjustedEBITDA
FX debt MtMhedge
Net interest Deprec., amortiz. and
depletion
Income taxes Others Net income∆
Non-recurring effects
∆(1)
4Q17
20174,952
1,093
(233)
238
(625)
(2,205)(442)
(592)
AdjustedEBITDA
FX debt MtMhedge
Net interest Deprec., amortiz. and
depletion
Income taxes Others Net income∆
Non-recurring effects
(1) Includes other Exchange rate/monetary variations other financial income/expense and other operating income/expenses.
∆(1)

32
Free Cash Flow 1 - 4Q17 and 2017 (R$ million)
1,981
791 (597)
(255)
(338) (9)
8
Adjusted EBITDA Capex(ex-H2 and
logistics projects)
Net interest Working capital Income taxes Others FCF
4Q17
2017
4,952
2,025(2,081)
(771) (50) (36)
11
Adjusted EBITDA Capex(ex-H2 and
logistics projects)
Net interest Working capital Income taxes Others FCF
(1) Not considering Horizonte 2 capex (4Q17: R$ 348 mn | 2017: R$ 2,538 mn), pulp logistics projects (4Q17: R$ 20 mn) | 2017: R$ 54 mn) and dividends payment (2017: R$ 395 mn).

33
4Q17 Indebtedness
473414 408
350268
200144
209
347
96143
108 78 45 39 39 59108
2009 2010 2011 2012 2013 2014 2015 2016 2017
12,238 12,331
3.863 3,728
Sep/17 Dec/17R$ US$
3.63.5
3.4
Interest gross expenseAverage cost in US$ (% a.a.)
Net debt (million) and Leverage
Interest expense/revenue (US$ million) and Interest coverage
Net debt/EBITDA (R$) Net debt/EBITDA (US$)
Interest on financial investments
6.3 5.95.5
5.24.6
3.4 3.3(1)
Cost of debt
Gross debt and cash position (million)
3.24
2.49
3.28
2.41
19,051 19,299
6,013 5,834
Sep/17 Dec/17
Gross debt
R$ US$
6,813 6,968
2,151 2,106
Sep/17 Dec/17
Cash position
R$ US$
5154
60
4Q16 3Q17 4Q17
H2CRA
H2
CRA
Average maturity (in months)
Cost of Debt in US$(1) and debt maturity
2.75.1 4.1 4.3
5.87.3 15.4 7.2 6.5
Interest coverage (x)(2)
6.3 5.95.5
5.24.6
3.4 3.3(1)
Cost of debt
CRA CRA
H2
CRA
H2CRA
(1) Considering the portion of debt in reais fully adjusted by the market swap curves at the end of each period | (2) LTM EBITDA/LTM net interest – excludes capitalized interest effect

34
Agribusiness Credit Receivable Certificates (CRAs)CRA accounted for 25% of the total debt
The largest CRA issuer in Brazil (R$ 4,915 million; Av. cost 98%)
Av. interest rate of financial investments(1)
(1) Refer to note 7 – cash and cash equivalents in 4Q17 Financial Statements
82%
84%
86%
88%
90%
92%
94%
96%
98%
100%
102%
104%
106%
R$ 675 million-(15/oct)
R$ 880 million-1°tranche (16/jun)
R$ 470 million-2°tranche (16/jun)
R$ 374 million-1°tranche (16/aug)
R$ 326 million -2°tranche (16/aug)
R$ 1,250 million-(16/dec)
R$ 675 million
Tenor: 6 yOct, 15
R$ 880 million
Tenor: 7 yJun, 16
R$ 470 million
Tenor: 7 yJun, 16
R$ 374 million
Tenor: 7 yAug, 16
R$ 326 million
Tenor: 4 yAug, 16
R$ 1,250 million
Tenor: 7 yDec, 16
R$ 757million
Tenor: 5 ySep, 17
R$ 184million
Tenor: 6 ySep, 17
%CDI
R$ 941 million

35
Robust Liquidity – USD million(@December 31, 2017)
Liquidity(1) and debt amortization schedule (US$ million)
Capex H2 (2):
2,066
302
2,368
512 475623 642 696 642 730 741
72
703
Liquidez 2018 2019 2020 2021 2022 2023 2024 2025 2026 2027
Pre-payment BNDES NCE Bonds Finnvera CRA and others
Cash(1)
Revolver
Horizonte 2 Funding (US$ billion)
(1) Not including US$ 41 million related to MtM of hedging transactions. | (2) Financial execution of US$ 1,858 million (cash) capex up to Dec/2017. FX (R$/US$) 3.34.
339
0.39
2.11
0.200.41
0.16
0.21
Pre-payment CRA BNDES FDCO ECA Working capital (4) Total
0.12 - 2018
0.51
0.09
3Q153Q15
2Q17
0.43
2.32
0.09 – 2018
4Q17
0.12
Horizonte 2Project
US$ 2.2 bi
0.12 M excess cash
(3) Capex to be disbursed (cash) related to Horizonte 2. | (4) Related to the agreement with Klabin.

36
Financial StrategyNow focusing on liability management ...
▐ Amortization concentrated in 2019
▐ Higher volatility in 2018 combined with the
current market opportunity for funding in US$
▐ Balance and extend the debt repayment schedule
▐ Ensure low average cost of debt
▐ Exclude financial covenants
▐ Initiate reduction of gross debt using US$ 200 million cash
Market Scenario Goals
3636
138
581
957
827
665628 642
721
11439
703
2017 2018 2019 2020 2021 2022 2023 2024 2025 2026 2027
BNDES Bond PPE Finnvera NCE ARC Finame Others BNBAmortization schedule (as-is)US$ mn (@Sep. 2017)
EPP
37
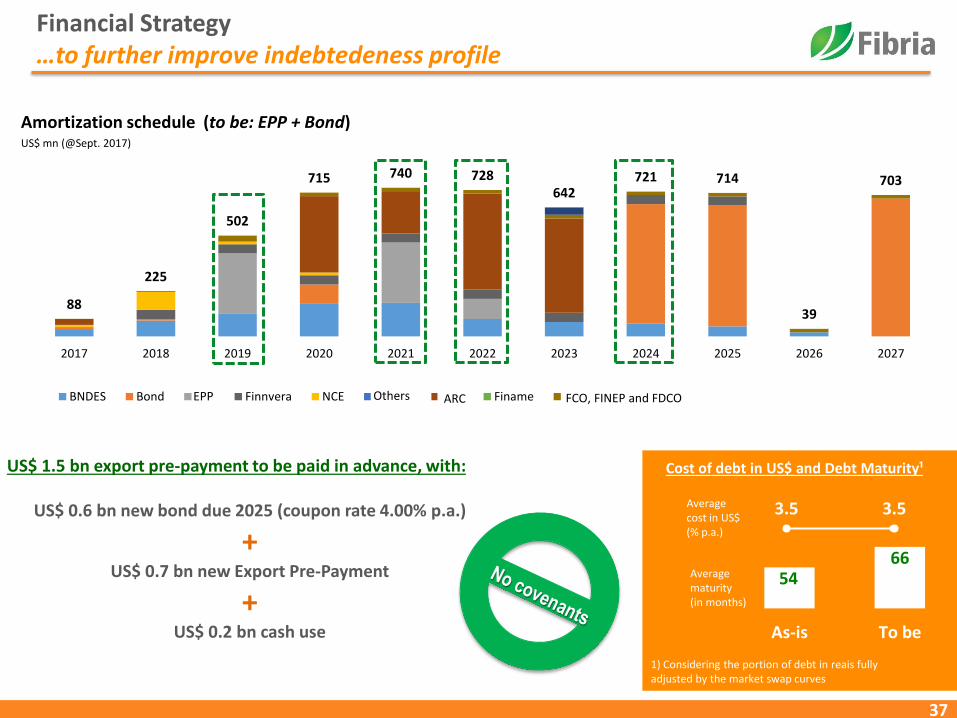
Financial Strategy…to further improve indebtedeness profile
US$ 1.5 bn export pre-payment to be paid in advance, with:
US$ 0.6 bn new bond due 2025 (coupon rate 4.00% p.a.)
+US$ 0.7 bn new Export Pre-Payment
+US$ 0.2 bn cash use
5466
As-is To be
Average maturity(in months)
Average cost in US$ (% p.a.)
3.5 3.5
1) Considering the portion of debt in reais fully adjusted by the market swap curves
Cost of debt in US$ and Debt Maturity¹
Amortization schedule (to be: EPP + Bond)US$ mn (@Sept. 2017)
88
225
502
715 740 728642
721 714
39
703
2017 2018 2019 2020 2021 2022 2023 2024 2025 2026 2027
BNDES Bond PPE Finnvera NCE Outros CRA Finame Agência de Fomento (FCO, Finep e FDCO) BNBOthers FCO, FINEP and FDCOEPP ARC
38
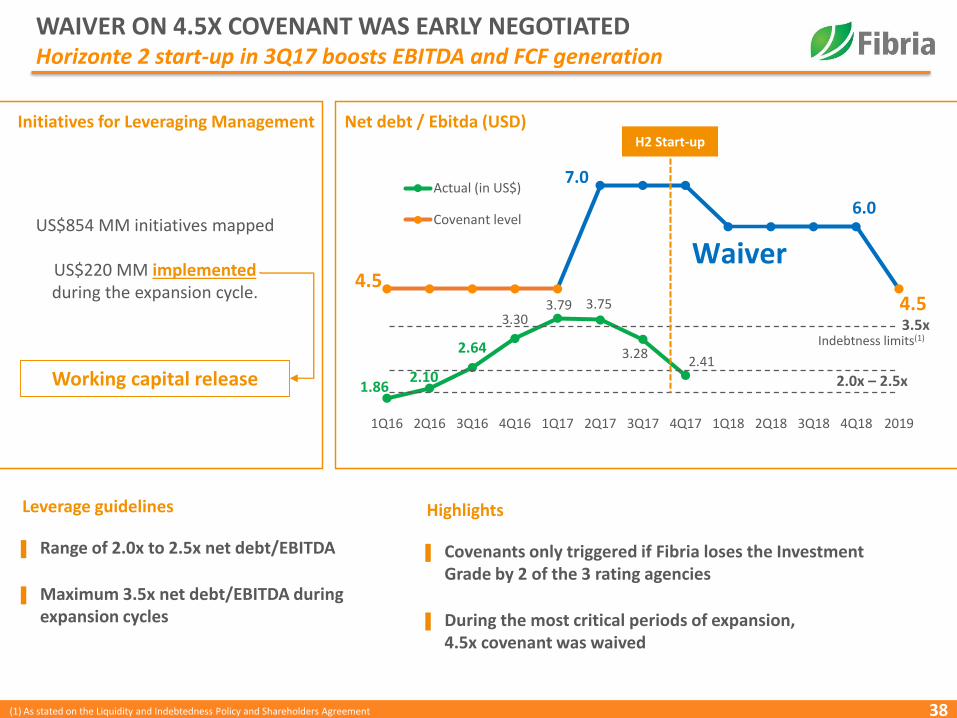
WAIVER ON 4.5X COVENANT WAS EARLY NEGOTIATEDHorizonte 2 start-up in 3Q17 boosts EBITDA and FCF generation
Net debt / Ebitda (USD)Initiatives for Leveraging Management
US$854 MM initiatives mapped
US$220 MM implementedduring the expansion cycle.
Working capital release
▐ Range of 2.0x to 2.5x net debt/EBITDA
▐ Maximum 3.5x net debt/EBITDA during expansion cycles
Leverage guidelines
▐ Covenants only triggered if Fibria loses the Investment Grade by 2 of the 3 rating agencies
▐ During the most critical periods of expansion, 4.5x covenant was waived
Highlights
1.862.10
2.64
3.303.79 3.75
3.282.41
4.5
7.0
6.0
4.5
1Q16 2Q16 3Q16 4Q16 1Q17 2Q17 3Q17 4Q17 1Q18 2Q18 3Q18 4Q18 2019
Actual (in US$)
Covenant level
3.5x
2.0x – 2.5x
Indebtness limits(1)
Waiver
H2 Start-up
(1) As stated on the Liquidity and Indebtedness Policy and Shareholders Agreement

39
Net Debt/EBITDA (R$)(1)
Dividends and interest on equity paid during expansion projects:
Fibria R$ 2,840 MM
Suzano R$ 222 MM
Klabin R$ 741 MM
2.4
5.2
2.1
6.3
4.1
8.1
3.8
1Q12 2Q12 3Q12 4Q12 1Q13 2Q13 3Q13 4Q13 1Q14 2Q14 3Q14 4Q14 1Q15 2Q15 3Q15 4Q15 1Q16 2Q16 3Q16 4Q16 1Q17 2Q17 3Q17 4Q17
Fibria Suzano Klabin Eldorado
Horizonte 2
Maranhão
Puma
Lowest leverage peak during the largest expansion project in LatAmwith the lowest cash production cost and lowest cost of funding
(1) Fibria’s historical data in BRL. The period in bold represents companies’ expansion capex execution.

40
One of the best performances among Brazilian corporate issuers(1)
(1) G-spread on Mar 16, 2018
Historical G-spread (bps)
BBB-
BBB-
Rating Outlook
Stable
Positive
100 116160 163 177 177 183 192 208 217
261302
349379
137159 175
203 209 216
343
Issuance with maturity in 2024 Issuance with maturity in 2027
0
200
400
600
800
1000
1200
1400
2010 2011 2012 2013 2014 2015 2016 2017
Fibria 2020 - 7.5% Fibria 2021 - 6.75%
Fibria 2024 - 5.25% Fibria 2027 - 5.50%

41
ROE and ROIC (R$)
ROE = Adjusted EBIT(1)/ Equity before IAS 41(2) and ROIC = Adjusted EBIT(3)/ Invested Capital before IAS 41(2)
Average FX(R$/US$)
Average Net Pulp Price
(US$)
1.95 2.16 2.35 3.33
581 610 561 586
3.49
496
3.38(4)
546(5)
3.4%5.7% 6.2%
25.1%
9.8%
15.0%
30.8%
4.7%6.1% 5.6%
15.6%
6.9%9.7%
12.8%
2012 2013 2014 2015 2016 2017 Fibria after H2Structural
(pro-forma)
ROE ROIC
3.19
653
(1) Adjusted EBITDA – CAPEX – Net Interest – Taxes (2) International accounting standards for biological assets. (3) Adjusted EBITDA – CAPEX – Taxes (4) FX for H2 cash cost and sustaining capex (5) Fibria’s actual net realized pulp price – average last 3 years @3Q17 (6) Considers the cost structure presented on slide 27 and 4Q17 balance sheet (invested capital and equity)
42
ROIC and ROE Fibria’s case going forward…
▐ Horizonte 2: capacity increase, cash cost lower than expected, efficient ramp-up with
high energy surplus
▐ Deleveraging and interest expense/ton reduction
▐ Pulp price: up to 2021 without any significant capacity – we have not seen such positive
scenario since late 1990s and early 2000s
▐ Wood cost: despite pressures, wood cost reduction moves towards structural level
▐ FX upside risk more than downside risk
▐ Sustainability: listed in the Dow Jones Sustainability EM Index and B3 Corporate
Sustainability Index (ISE)

43
2018 OUTLOOK – CAPEX AND CASH COST

Fibria CAPEX 2018 – BRL million
44
2,175
2,897
3,687
88
460174
346
444
2017 GuidanceUpdate
∆ Inflation / FX H2 Sustaining Modernization &Non-recurring
2018 Guidance(ex-pulp logistics
and H2 expansion)
Pulp logistics H2 Expansion 2018 Guidance(3)
USD121/t(5)
USD678 mn(1)
USD878 mn(2)
USD1,117 mn(2)
USD128/t
(6)
1,131
2018
H2 capex (cash basis - R$ million)
(1) Converted at 3Q17 LTM FX – BRL/USD 3.21 | (2) Converted at 2018 average FX - BRL/USD 3.30, according to Focus Report (Brazilian Central Bank – November 24, 2017) (3) Subject to Board approval | (4) IPCA estimate @4.5% and FX @3.15 | (5) Capacity 7,250 kt. | (6) Forestry base adjustment, environmental, other projects (PIFF, Pentatrem, TG’s overhauls, etc.).

Structural CAPEX – BRL million
45
2,897
2,285
2018Guidance
(sust+moderniz)
Non-recurringwood purchase
Modernization Non-recurringprojects / SSMA
Turbogeneratoroverhaul
Others Structuralcapex
(includes TLS 2)
USD878 M(1)
USD692 M(1)
USD121/t USD96/t
(1) Converted at 2018 average FX - BRL/USD 3.30 - According to Focus Report (Brazilian Central Bank – November 24, 2017) | (2) Subject to Board approval

Cash Cost (USD/t) BRL/USD 3.12
46
218
165(27)
(19) (10)
3
LTM 3Q17 Horizonte 2 Project Wood cost reduction Modernization Payroll tax Structuralcash-cost
12%
90%100%
2017 2018 2019
24%
49%
71% 75%
100%
2019 2020 2021 2022 2023
FX Cash cost (US$/t)
3.00 171
3.10 166
3.12 165
3.30 157
3.50 150
FX Sensitivity

47
Expansion Project – Horizonte 2

48
• Follow the growth of strategic customers
• Developing new customers
• Distribution to new geographic markets
• Efficiency and competitiveness gains in logistics
• Higher quality in customer service
• Greater ability to capture new expansion market windows
• Strong M&A position
Competitiveness
Commercial positioning
Long-term growthpotential
What is the importance of growth for Fibria?
• Wider fixed costs dilution
• Cost curve position improvement
• Greater bargaining power with suppliers
49
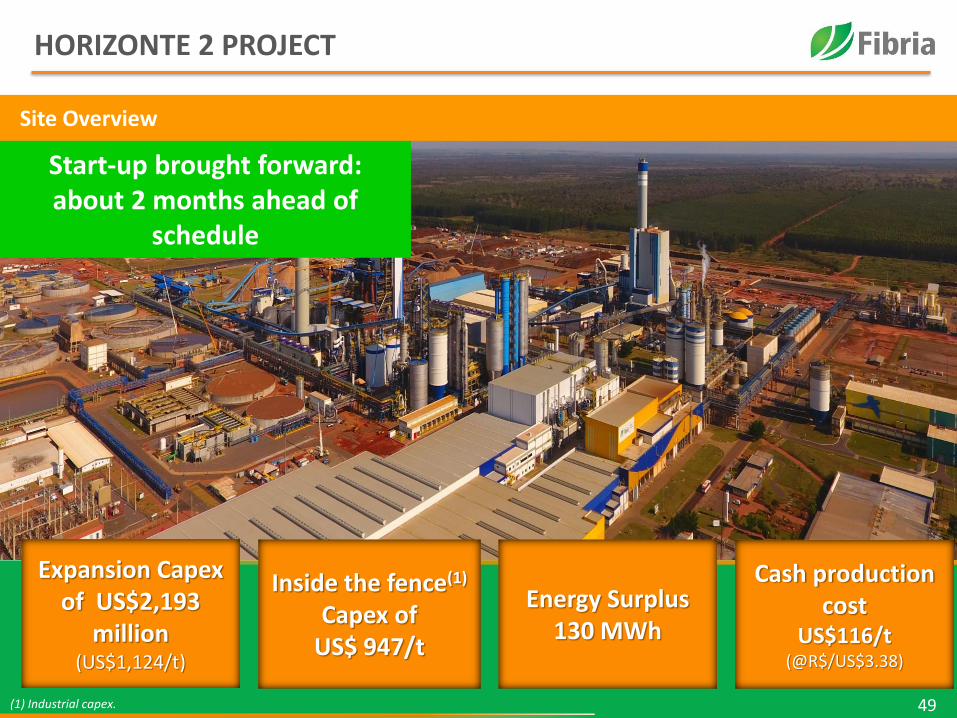
HORIZONTE 2 PROJECT
49
Site Overview
(1) Industrial capex.
Start-up brought forward: about 2 months ahead of
schedule
Inside the fence(1)
Capex of US$ 947/t
Cash production cost
US$116/t(@R$/US$3.38)
Energy Surplus130 MWh
Expansion Capex of US$2,193
million (US$1,124/t)
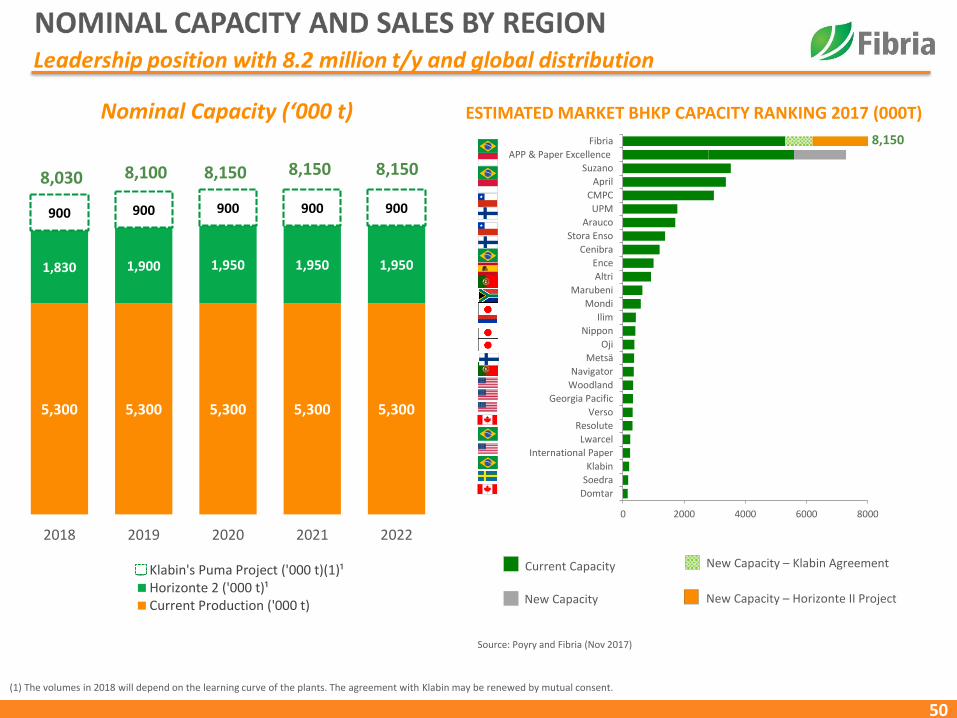
50
5,300 5,300 5,300 5,300 5,300
1,830 1,900 1,950 1,950 1,950
900 900 900 900 900
2018 2019 2020 2021 2022
Klabin's Puma Project ('000 t)(1)¹Horizonte 2 ('000 t)¹Current Production ('000 t)
Nominal Capacity (‘000 t)
8,030 8,100 8,150 8,150 8,150
(1) The volumes in 2018 will depend on the learning curve of the plants. The agreement with Klabin may be renewed by mutual consent.
ESTIMATED MARKET BHKP CAPACITY RANKING 2017 (000T)
Source: Poyry and Fibria (Nov 2017)
0 2000 4000 6000 8000
Domtar
Soedra
Klabin
International Paper
Lwarcel
Resolute
Verso
Georgia Pacific
Woodland
Navigator
Metsä
Oji
Nippon
Ilim
Mondi
Marubeni
Altri
Ence
Cenibra
Stora Enso
Arauco
UPM
CMPC
April
Suzano
APP & Paper Excellence
Fibria 8,150
Current Capacity
New Capacity
New Capacity – Klabin Agreement
New Capacity – Horizonte II Project

51
Pulp sales destination: Fibria growing where the market grows
(1) Considers 2017 | (2) Includes Klabin’s sales volume
34%
40%
32%
39%
18%20%
8%9%
Total sales volume distributionafter H2 start up(2)
Current net revenue distribution(1)

52
Average distance from forest to mill H1 + H2 up to 100 km
Horizonte 2 Forestry BaseForestry base secured as planned
TOTAL TRÊS LAGOAS UNIT FOREST BASE:
308,000 ha
HORIZONTE 1 FOREST BASE:
121,000 ha
HORIZONTE 2 FOREST BASE:
187,000 ha
ALREADY PLANTED (87%):
162,000 ha

53
LogisticsIntegrated logistics - outbound and shipping
Mato Grosso
Mato Grosso do Sul
Goiás
Brasília
Railway export corridor with high reliability and capacity
Less transit time from mill to the Port of Santos
Higher productivity per train
With T32, Fibria becomes the pulp player with the highest storage capacity in Port of Santos
Port Terminal 32

54
HORIZONTE 2 CAPEXDisbursement flexibility and reduction from 2015
75%
21%
4%
BRL EUR USD
Breakdown by currencyCash Capex (R$ million)(1)
(1) As of December 2017. R$/US$ @ 3.34.
1348 144
888801
9841,100
596 601 579
1,005
126
459
2Q15 3Q15 4Q15 1Q16 2Q16 3Q16 4Q16 1Q17 2Q17 3Q17 4Q17 1Q18 2Q18
To be disbursed Executed
US$million
4 14 43 265 239 294 328 178 179 138 173 301 38
7,7066,705
1,131
58
(478)(453) (184)
56 59 275 306
6,214
7,345
Initial budget(May 2015)
Capacityincrease
Contingencies Savings Indirect costs Change ofscope
Updated(in real terms)
Paymentnegotiation
Inflation FX December2017 Budget
US$2.8 bn US$2.2 bnR$/US$=2.80 R$/US$=3.34
To be disbursed
55
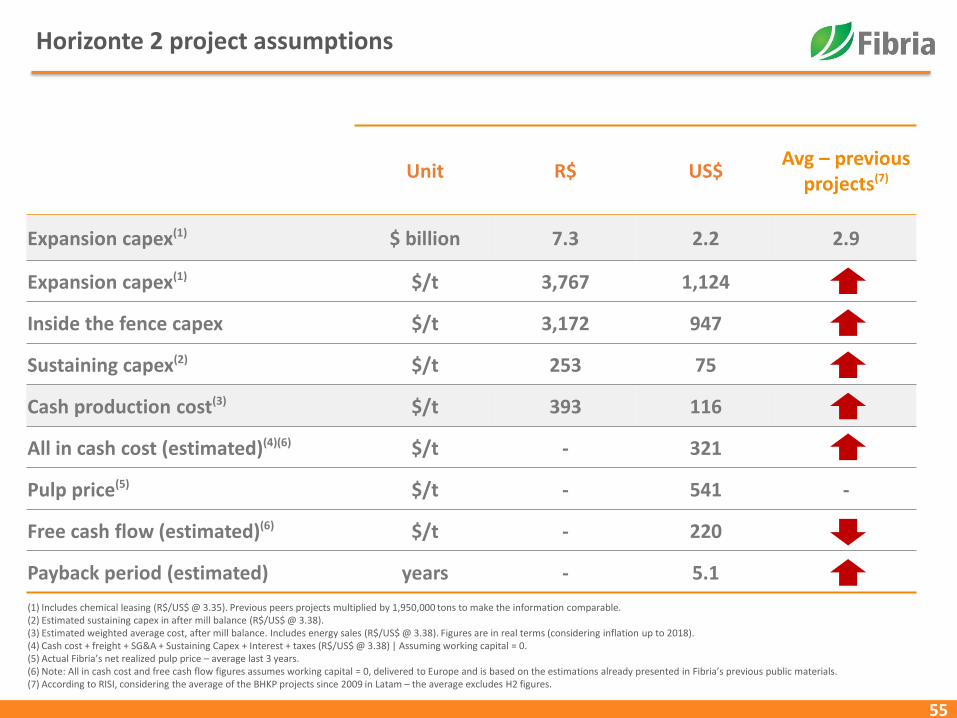
Horizonte 2 project assumptions
Unit R$ US$Avg – previous
projects(7)
Expansion capex(1) $ billion 7.3 2.2 2.9
Expansion capex(1) $/t 3,767 1,124
Inside the fence capex $/t 3,172 947
Sustaining capex(2) $/t 253 75
Cash production cost(3) $/t 393 116
All in cash cost (estimated)(4)(6) $/t - 321
Pulp price(5) $/t - 541 -
Free cash flow (estimated)(6) $/t - 220
Payback period (estimated) years - 5.1
(1) Includes chemical leasing (R$/US$ @ 3.35). Previous peers projects multiplied by 1,950,000 tons to make the information comparable. (2) Estimated sustaining capex in after mill balance (R$/US$ @ 3.38). (3) Estimated weighted average cost, after mill balance. Includes energy sales (R$/US$ @ 3.38). Figures are in real terms (considering inflation up to 2018).(4) Cash cost + freight + SG&A + Sustaining Capex + Interest + taxes (R$/US$ @ 3.38) | Assuming working capital = 0. (5) Actual Fibria’s net realized pulp price – average last 3 years.(6) Note: All in cash cost and free cash flow figures assumes working capital = 0, delivered to Europe and is based on the estimations already presented in Fibria’s previous public materials.(7) According to RISI, considering the average of the BHKP projects since 2009 in Latam – the average excludes H2 figures.

56
Free cash flow – H2 Project (US$/t)
FCF/t(2) sensibility to net pulp price and FXFCF/t from net pulp price (US$/t)(1)
(1) FX @ 3.38 and assuming working capital = 0. (2) Size of the bubble = FCL/t in US$
546
336
226
116
94
75
1520
Last 3 yrsFibria's
pulp price
Cash cost Freightdelivery toEurope and
SG&A
EBITDA Sustainingcapex
Interest Income taxafter tax
shield
PerpetuityFCF
170
226
287
369
443
400
450
500
550
600
650
700
750
1,50 2,50 3,50 4,50 5,50
FCF (US$/t)
FX (R$/US$)
Pu
lp p
rice
(U
S$/t
)6.6 yrs
5.1 yrs
3.9 yrs
3.0 yrs
2.5 yrs
Payback (Capex @US$1,124/t)

57
H2 cash production cost decrease
12%
90%
100%
2017 2018 2019
Accumulated benefit per year (US$/t)
US$116/t cash cost(1)
(1) R$/US$ @ 3.38
▐ Wood competitiveness (distance forest-mill):
– Current Fibria: 328 km | Structural Fibria: ~166 km
– H1+H2: up to 100 km
▐ Energy surplus:
– Current Fibria: ~70 MW | Structural Fibria: 200 MW
– H2: 130 MW
▐ Synergies with Line 1 – fixed cost dilution
▐ Automated nursery
▐ High technology and scale
Why so low?

58
Final Remarks
• Economies of scale
• Synergies with current operations
• Wood availability and low distance from forest to mill
• Fibria’s total energy surplus to be increased by 130 MWh
• Cash cost competitiveness
• Meet customers’ demand growth
• Attractive returns even in adverse scenarios of pulp price and BRL
• Solid financial profile

59
A winning strategySo far, better than expected
Actual 559 th. tons
Expected 477 th. tons
(status: December 31, 2017)
+17%
Digesterfeeding
Aug. 23
08
/23
/17
08
/26
/17
08
/29
/17
09
/01
/17
09
/04
/17
09
/07
/17
09
/10
/17
09
/13
/17
09
/16
/17
09
/19
/17
09
/22
/17
09
/25
/17
09
/28
/17
10
/01
/17
10
/04
/17
10
/07
/17
10
/10
/17
10
/13
/17
10
/16
/17
10
/19
/17
10
/22
/17
10
/25
/17
10
/28
/17
10
/31
/17
11
/03
/17
11
/06
/17
11
/09
/17
11
/12
/17
11
/15
/17
11
/18
/17
11
/21
/17
11
/24
/17
11
/27
/17
11
/30
/17
12
/03
/17
12
/06
/17
12
/09
/17
12
/12
/17
12
/15
/17
12
/18
/17
12
/21
/17
12
/24
/17
12
/27
/17
12
/30
/17
Actual Expected
Plannedstoppage

60
BACK UP

Maritime Wood Shipping Project
► Capex and Opex reduction;
► Increase in cargo handling due to increase in
stack height volume
► Reduction in heavy truck road traffic
► Capex: R$ 54 million (accomplished in 2016)
► Start-up: Sep/2017
► Saving OPEX: R$ 24 million/year
PROJECT DESCRIPTION (ARACRUZ UNIT)
Forestry operations productivity
Transportation
61

Third-party wood reductionNon-recurring pressure decreasing towards the structural level
62
788Thir
d-p
arty
wo
od
¹ (%
)
225180 185 175 169 181
225
283 267 265 265231
202 202160 160
160153
0
50
100
150
200
250
300
0%
5%
10%
15%
20%
25%
30%
35%
40%
45%
50%
2009 2010 2011 2012 2013 2014 2015 2016 2017 2018 2019 2020 2021 2022 2023 2024 2025 2026
Average distance from forest to mill
Third-party wood
Ave
rage d
istance
from
fore
st to m
ill ¹ (km)
68%34% 63% 73% 67% 75% 72%% Planting 84%
Total NPV (2):R$ 3.5 billion (US$ 1.1 billion)
In 2016 climate change materialized in the most severe rain shortage in Aracruz forestry base in the last 40 years, but in 2017…
▐ Rain volumes in Aracruz region improved, more close to historical average
▐ Higher productivity was obtained in Jacareí and Três Lagoas forestry bases
▐ Forest productivity long term goal (MAICel) achieved 11.75 adt/ha/year for the new eucalyptus clones effectively planted in 2017
(1) Includes Veracel | (2) FX @ BRL/USD3.30.

Industrial: maintenance downtimes schedule change
► Regulatory Standard 13 (Boiler and Pressure Vessel Inspection) extended the maximum period between recovery boiler inspections from 12 to 15 months.
► Fibria was the first company to use the extended period benefit
► NPV: R$385 million
63
1Q16 2Q16 3Q16 4Q16 1Q17 2Q17 3Q17 4Q17 1Q18 2Q18 3Q18 4Q18 1Q19 2Q19 3Q19 4Q19
Mills - capacity
Aracruz A - 590 kt
Aracruz B - 830 kt
Aracruz C - 920 kt
Jacareí - 1.100 kt
Três Lagoas L1 - 1.300 kt
Três Lagoas L2 - 1.950 kt
Veracel - 560(1) kt
12 months 15 months
(1) Veracel is a joint operation between Fibria (50%) and StoraEnso (50%) and the total capacity is 1,120 thousand ton/year
No maintenance downtime
20192016 2017 2018
No maintenance downtime
No maintenance downtime
No maintenance downtime
No maintenance downtime

64
41
31333537394143454749
Mar
-13
May
-13
Jul-
13
Au
g-1
3O
ct-1
3D
ec-
13
Mar
-14
May
-14
Jul-
14
Sep
-14
No
v-1
4Ja
n-1
5M
ar-1
5M
ay-1
5Ju
l-1
5Se
p-1
5N
ov-
15
Jan
-16
Mar
-16
May
-16
Jul-
16
Sep
-16
No
v-1
6Ja
n-1
7M
ar-1
7M
ay-1
7Ju
l-1
7Se
p-1
7N
ov-
17
Jan
-18
Shipments of Hardwood and Eucalyptus Pulp
Global Market BHKP/BEKP Demand – W20 Jan/2018
(1) Source: PPPC W20 – Feb/2018
Hardwood inventories – in days(1)
2M18 vs. 2M17(1)
Avg=41
5Kt
70Kt
-38Kt-2Kt -25Kt
48Kt
74Kt
-21Kt
36Kt
-41Kt
Total NorthAmerica
WesternEurope
China Other
BHKP BEKP
2%
0%
29%17%
-2% 0%
4%
-2%-5%
3.090 3.0663.419 3.455
3.744 3.749
2M/13 2M/14 2M/15 2M/16 2M/17 2M/18
BHKP 2M Shipments(1)(‘000 t)
542 544
788849
1.100 1.098
2M/13 2M/14 2M/15 2M/16 2M/17 2M/18
China BHKP 2M Shipments(1) (‘000 t)
+8%
+30%
-3%

65
Global Market Pulp Demand
Hardwood demand will continue to increase at a faster pace than Softwood
Paper Production – Runnability with BHKP
Source: RISI conference, August 2014.
Demand growth rateHardwood (BHKP) vs. Softwood (BSKP) (000 ton)
Source: PPPC reports. Excludes Sulphite and UKP market pulp (Nov./16)
000 ton 2000 2010 2020Growth 2000-2010
Growth 2010-2020
Hardwood 16.2 25.1 35.6 55% 42%
Eucalyptus 6.6 15.9 25.2 140% 58%
Softwood 18.9 22.2 25.8 17% 16%
Market Pulp 35.1 47.3 61.4 35% 30%
0
5.000
10.000
15.000
20.000
25.000
30.000
35.000
40.000
19
98
19
99
20
00
20
01
20
02
20
03
20
04
20
05
20
06
20
07
20
08
20
09
20
10
20
11
20
12
20
13
20
14
20
15
20
16
20
17
20
18
20
19
20
20
20
21
Hardwood Softwood
Source: PPPC report (May 2017)
2016 - 2021 CAGR:Hardwood: +3.04%Softwood: +1.24%

66
China's Share of Market Pulp(2)
10% 10%12% 14%
21%
17%
22%23% 23% 24%
25% 26%
29%
0
2
4
6
8
10
12
14
16
0%
5%
10%
15%
20%
25%
30%
35%
2005 2006 2007 2008 2009 2010 2011 2012 2013 2014 2015 2016 2017
Eucalyptus Hardwood Total % Compared to the global Market Pulp
Benefiting From China’s Growth
(1) PPPC – Pulp China – Flash Report – Dec/2017(2) PPPC – W20. Coverage for chemical market pulp is 80% of world capacity (3) RISI
(million t)
Latin America is the leading exporter of BHKP to China, accounting to approximately 54% of China's total imports in 2017
(‘000s t)
(1) includes South Africa and New Zealand. | (2) Includes China, Japan, Malaysia, Russia, Thailand and Vietnam.
China’s Hardwood Imports of BHKP by Country(1)
10,751
6,159
1,9042,193
209 194 92
12,137
6,567
2,846
2,068259 251
146
BHKP Total LatinAmerica (1)
Indonesia Others(2) USA Canada WesternEurope
2016 2017
World Tissue Consumption, 1995-2016(3)
Per Capita Consumption of Tissue by World Region(3)
(Kg/capita/year)
(million t)
0
5
10
15
20
25
30
35
40
1995 2000 2005 2010 2011 2012 2013 2014 2015 2016N.America W.Europe E.Europe JapanChina Asia FE Middle East LatAmAfrica Oceania
Annual Growth Rate +3.7%
24.9
15.9 15.3
11.2
6.0 6.2 5.6
0.6
N.America
WestEurope
Japan Oceania EastEurope
LatAm China Africa

67
Global Paper Consumption
CAGR 2000 – 2010Developed Markets: - 2.1%Emerging Markets : + 5.6%
P&W Consumption (000 tons)(1)
Tissue Consumption (000 tons)(1)
CAGR 2010 – 2020Developed Markets: - 3.1%Emerging Markets : + 0.9%
CAGR 2000 – 2010Developed Markets: + 1.5%Emerging Markets : + 6.6%
CAGR 2010 – 2020Developed Markets: + 1.4%Emerging Markets : + 5.9%
Source: RISI
20
00
20
01
20
02
20
03
20
04
20
05
20
06
20
07
20
08
20
09
20
10
20
11
20
12
20
13
20
14
20
15
20
16
20
17
E
20
18
E
20
19
E
20
20
E
Developed Markets Emerging Markets
99,977103,286117,611 109,758
20
00
20
01
20
02
20
03
20
04
20
05
20
06
20
07
20
08
20
09
20
10
20
11
20
12
20
13
20
14
20
15
20
16
20
17
E
20
18
E
20
19
E
20
20
E
Developed Markets Emerging Markets
20,979
30,357
41,712

68
Benefiting From China’s Growth
Ship
men
ts (
00
0 t
on
)
BH
KP
pri
ces
-C
IF C
hin
a (U
S$/t
on
)
(‘000s t)
China: Eucalyptus pulp shipments
2010
average:
250 ktons
2011
Average
379 ktons
2012
Average
370 ktons
2013
Average
439 ktons
2014
Average
504 ktons
2015
Average
531 ktons
2016
Average
612 ktons
Source: PPPC Global 100 December 2017
0
200
400
600
800
1000
1200
0
100
200
300
400
500
600
700
800
900
mai
-10
jun
-10
jul-
10
ago
-10
set-
10
ou
t-1
0n
ov-
10
dez
-10
jan
-11
fev-
11
mar
-11
mai
-11
jun
-11
jul-
11
ago
-11
set-
11
ou
t-1
1n
ov-
11
dez
-11
jan
-12
fev-
12
mar
-12
abr-
12
jun
-12
jul-
12
ago
-12
set-
12
ou
t-1
2n
ov-
12
dez
-12
jan
-13
fev-
13
mar
-13
abr-
13
mai
-13
jul-
13
ago
-13
set-
13
ou
t-1
3n
ov-
13
dez
-13
jan
-14
fev-
14
mar
-14
abr-
14
mai
-14
jun
-14
ago
-14
set-
14
ou
t-1
4n
ov-
14
dez
-14
jan
-15
fev-
15
mar
-15
abr-
15
mai
-15
jun
-15
jul-
15
set-
15
ou
t-1
5n
ov-
15
dez
-15
jan
-16
fev-
16
mar
-16
abr-
16
mai
-16
jun
-16
jul-
16
ago
-16
ou
t-1
6n
ov-
16
dez
-16
jan
-17
fev-
17
mar
-17
abr-
17
mai
-17
jun
-17
jul-
17
ago
-17
set-
17
no
v-1
7d
ez-1
7ja
n-1
8
BHKP Price
Shipments
2017
Average
683 ktons

69
Global BHKP Market Pulp Supply Cost Curve
Source: Pöyry.
COST CURVE EVOLUTION
USD
/Ad
t, 2
01
3 c
ost
leve
l
Cumulative Capacity Million t/a
Cost position of marginal
producer

70
Tightening plantation wood and chip supply could add to the cash cost of Asian pulp mills
Source: Pöyry.
Cumulative Capacity Million t/a
USD
/Ad
t, 2
01
3 c
ost
leve
l

71
Growth in Asia is empowered by urbanization and increasing disposable income
Source: Pöyry.

72
The share of non-wood pulp will decline
Source: Pöyry.

73
Current Zero Cost Collars
(1) As of Mar 29, 2017.
Zero Cost Collars:
▐ No leverage
▐ No margin call
▐ No threshold
▐ CETIP registered
2Q18 3Q18 4Q18 1Q19 2Q19 3Q19 Total
Nocional US$ 544 MM US$ 515 MM US$ 570 MM US$ 235 MM US$ 75 MM US$ 25 MM US$ 1,964 MM
Strike Put 3.15 3.13 3.14 3.08 3.12 3.15 3.13
Strike Call 4.48 4.28 4.34 4.12 4.06 4.04 4.32
FWD 3.59 3.49 3.51 3.41 3.43 3.46 3.51

Free cash flow(1)
Positive quarterly FCF in the last 5 years, even during appreciated FX
74
FCF (USD million)
EBITDA Margin
Average FX
125
29
77
194
84113
53
329
4
111
51
103130
112
317
225
158118 124 135
174
243
3Q12 4Q12 1Q13 2Q13 3Q13 4Q13 1Q14 2Q14 3Q14 4Q14 1Q15 2Q15 3Q15 4Q15 1Q16 2Q16 3Q16 4Q16 1Q17 2Q17 3Q17 4Q17
2.03 2.06 2.00 2.07 2.29 2.27 2.37 2.23 2.27 2.55 2.87 3.07 3.45 3.84 3.90 3.51 3.25 3.26 3.15 3.22 3.16 3.25
37% 41% 39% 39% 41% 42% 41% 35% 35% 45% 50% 50% 56% 54% 52% 43% 43% 36% 37% 45% 49% 57%
Average Net Price
597 591 605 630 612 592 577 562 554 552 559 581 600 589 536 503 487 481 499 557 604 653
Nominal Capacity (‘000 t)
5,300 7,250
(1) Excluding H2 Project, dividends, pulp logistics and land purchase effects.

75
Fibria’s tax structure
(1) Considering FX Dec 2017 | (2) Considering average FX for the period
Description and Amount¹ Maturity
(a) EBT As stated in the income statement
(-)(b) Goodwill (Aracruzacquisition)
- Annual tax deduction: US$ 27 million (tax)
- Remaining Balance Dec/17: US$ 0.113 billion (base)2018
(-)(c) Forestry Capex in MS state (net)
2017 tax deduction related to depletion: US$ 70.6 million Undefined
(+/-)(d) Exchange variation(cash)
---------- ----------
(+/-)(e) Other ---------- ----------
Tax base beforecompensations
(a) + (b) + (c) + (d) + (e)
(f) (-) Tax loss carryforward- Up to 30% of tax base before compensations
- Balance up to Dec/17: US$ 153 million (base)Undefined
(g) Tax base Tax base before compensations – tax loss carryforward (f) ----------
(h) Income tax Tax base (g) * 34% ----------
(i) (-) Federal tax credits
Balance Dec/2017:- PIS/COFINS: US$ 223 million
- Withholding tax (IR and CSLL): US$ 348 million- Reintegra: US$ 62 million
Undefined
Cash Tax Income Tax (h) – tax credits (i)
2010 2011 2012 2013 2014 2015 2016 2017
US$ 9 million US$ 2 million US$ 8 million US$ 14 million US$ 12 million US$ 23 million US$ 36 million US$ 12 million
TAX PAYMENT2 (cash basis)