5q h - nasa · independent of hydrostatic stress) and the drucker-prager (yielding is linearly...
TRANSCRIPT

5q H
HYDROSTATIC STRESS EFFECT ON THE YIELD BEHAVIOR OF INCONEL 100
Phillip A. AHen and Christopher D. Wilson
Departmem of Mechanical Engineering
Tennessee Technological UniversityP.O. Box 5014
Cookeville, TN 38505-0001
931-372-3102 voice
931-372-6340 fax
paa5443 @tmectLedu
ABSTRACT
Classical metal plasticity theory assumes that hydrostatic stress has no effect on the yield
and postyield behavior of metals. Recent reexaminations of classical theory have revealed a
significant effect of hydrostatic stress on the yield behavior of notched geometries. New
experiments and nonlinear finite element analyses (FEA) of Inconel 100 (IN 100) equal-arm
bend and double-edge notch tension (DENT) test specimens have revealed the effect of internal
hydrostatic tensile stresses on yielding. Nonlinear FEA using the von Mises (yielding isindependent of hydrostatic stress) and the Drucker-Prager (yielding is linearly dependent on
hydrostatic stress) yield functions was performed. In all test cases, the yon Mises constitutive
model, which is independent of hydrostatic pressure, overestimated the load for a given
displacement or strain. Considering the failure displacements or strains, the Drucker-Prager
FEM's predicted loads that were 3% to 5% lower than the von Mises values. For the failure
loads, the Drucker Prager FEM's predicted strains that were 20% to 35% greater than the yon
Mises values. The Drucker-Prager yield function seems to more accurately predict the overall
specimen response of geometries with significant internal hydrostatic stress influence.
Phillip A. Allen 1
https://ntrs.nasa.gov/search.jsp?R=20020066137 2020-01-17T19:47:36+00:00Z

INTRODUCTION
Since the 1940's, many have considered Bridgman's experiments on the effects of
hydrostatic pressure on rr_tals the definitive study. In his study, Bridgman tested smooth
(uanotched) tensile bars made from a variety of common metals including aluminum, copper,
brass, bronze, and various steels. He conducted tensile tests under the conditions of externally
applied hydrostatic pressures up to 3100 MPa (450 ksi) and found that there was no significant
effect on the yield point until the higher pressures were reached. His studies revealed that the
primary effect of hydrostatic pressure was increased ductility. Bridgman also measured the
volume of the material in the gage section and found that this volume did not change, even for
very large changes in plastic strai_ Since the volume in the gage section did not change, he
concluded that metals have incompressible plastic Strains. His two observations about metal
behavior--no effect of hydrostatic pressure on yielding and incompressibility for plastic strain
changes---have become the standard tenets for studies of metal plasticity [1].
Because of the influence of Bridgman's work, plasticity textbooks from the earliest (e.g.
Hill [2]) to the most modem (e.g. Lubliner [3]) infer that there is negligible hydrostatic stress
effect on the yielding of metals. Even modem finite element programs such as ANSYS [4] and
ABAQUS [5] direct the user to assume the same. Engineers often make calculations based on
the assumption that the effect of hydrostatic stress is negligible, when in reality the effects of
hydrostatic stress can have a significant influence on material yield behavior. It is well
docun_nted that large tensile hydrostatic stresses develop in sharply notched or cracked
geometries [6-9].
In the 1970's Spitzig and Richmond [10] found that hydrostatic pressure had a significant
effect on the stress-strain response of four steels: 4310, 4330, maraging steel and HY80. For
Phillip A. Allen 2

example, Spitzig reported that the compressive yield strength of 4330 steel increased from 1520
MPa to 1610 MPa as pressure was increased to 1100 MPa and that the compressive yield
strength of the aged maraging steel increased from 1810 MPa to 1890 MPa as pressure was
increased to 1100 MPa.
Recently, Wilson [] 1] has conducted experiments and nonlinear fiuite element analyses
of 2024-T351 notched roui_d bars (NRB) to investigate the effect of hydrostatic tensile stresses
on yielding. He modeled the loading of a NRB to failure using the finite element rr_thod and the
traditional, accepted approach combining a pressure-independent yield function with isotropic
hardening. His yon Mises (yielding is independent of hydrostatic stress) results overestimated
experimental load-displacement curves by 10 to 65% depending on the notch root acuity.
Wilson then conducted f-mite element analyses (FEA) using a yield function that is linearly
dependent on hydrostatic stress, the Drucker-Prager yield function. The Drucker-Prager yield
function has often been used for soil mechanics calculations but not for metals. The possibility
of using the Drucker-Prager yield function for metals was hinted at by Richmond [12] and is
discussed later in this paper. Wilson' s Drucker-Prager FEA results essentially matched the
experimental test data.
The objective of this study is to examine the effect of hydrostatic stress on the yield
behavior of Inconel 100 (IN100). The first research task is to compile load-displacement or
load-microstrain test data from IN100 test geometries with varying amounts of hydrostatic
tensile stress. The second part of the research is to determine the accurate material properties for
IN100 for use in nonlinear f'mite element analyses. The final research task is to model the
behavior of the specimeus using hydrostatic independent and hydrostatic dependent constitutive
Phfllip A. Allen 3

models in nonlinear finite element analyses and to compare the FEA resuks with the actual test
data.
CLASSICAL METAL PLASTICITY
Plastic material behavior is a more complex phenomenon than elastic material behavior.
In the elastic range, the strains are linearly related to the stresses by Hooke's law, and the strains
are uniquely determined by the stresses. In general, plastic strains are not uniquely determined
by the stresses. Plastic strains depend on the whole loading history or how the stress state was
reached [13]. Therefore, to completely describe material behavior in the plastic range, one must
determine the appropriate yield function, hardening rule, and flow rule.
Yield Functions
In classical metal plasticity theory, a yield function, f, is a function of the three principal
stresses 0-t, c_, and o's (the characteristic values or eigenvalues of the stress tensor) [13]. The
hydrostatic or mean stress is
1°_ =311 =_(°1 +o'2 +°3),
and the hydrostatic pressure, p is -0-m. The term 11 is the first invariant of the stress tensor.
Assuming that yield is independent of mean stress leads to a yield function
where,
J2 "'I[(°"i-°"2)2 "["(0"2-0"3) 2 +(0-3-0-1) 2 ]
(1)
(2)
(3)
and
Phillip A.Alien 4

.I 3 =(o I- 0-.,X0-2- o-.,Xo-3- o-.,). (4)
The terms ,I2 and ,I3 are the second and third invariants of the deviatoric stress tensor. When
f < 0 the material behaves elastically, and when f = 0 yielding occurs.
The von Mises yieht function is often used for classical metal plasticity calculations.
This function states that yield is independent of hydrostatic stress and only depends on J2 in the
form of
f(J2)=Jz-k 2, (5)
where k is the yield strength in pure shear and is a function of plastic strain for hardening
materials. The von Mises or effective stress is def'med as
O'eff = 3_= _2[(O" 1 --0"2) 2 +(0"2--0"3) 2 "1"(0"3--O"1)2] . (6)
Setting f(J2)equal to zero in Equation (5) leads to
J2 = k2, (7)
which can be interpreted as the von Mises yield surface in Haigh-Westergaard (principal stress)
space. The yield surface for the von Mises yield function is a circular cylinder of radius, k,
whose axis is def'med in tht; direction of the hydrostatic pressure (Fig. 1). A yield locus is a
curve made by intersecting the yield surface with a plane perpendicular to the cylinder axis. For
the von Mises yield function, a yield locus taken anywhere along the hydrostatic pressure axis is
a circle of radius k, thus de,:nonstrating the function's hydrostatic independence. The hydrostatic
stress is zero on the plane passing through principal stress space origin. This plane is denoted as
the _plane and is given by the equation 0-1+ c_ + 0-3 = 0.
Phillip A. Allen 5

Hardening Rules
If a material exhibits strain hardening, the yield surface may change shape or location or
both as the material deforms plastically. This effect can be approximated for many materials by
using isotropic hardening wherein the yield surface expands equally in all directions.
Considering the yon Mises yield function, the radius of the yield surface increases from kl to k2
as the material hardens.
A material that obeys isotropic hardening has the san_ yield behavior in both tension and
compression. This is approximately true for some materials, but it is not an accurate description
of material behavior in general. Many materials exhibit a behavior referred to as the
Bauschinger effect, wherein the yield strength for tension is different than that for compression.
This effect is very important when a reversal of loading (locally or globally) is to he considered.
A kinematic hardening model can describe the behavior of materials with a significant
Bauschinger effect. This is accomplished by shifting the axis of the yield surface in principal
stress space while maintaining the same radius as the initial yield surface. Since almost no
material hardens in a pure isotropic or kinematic fashion, a linear combination of both models is
often used to describe materials.
How Rules
Flow rules for plastic behavior are somewhat analogous to Hooke's law for elastic
behavior. Hooke's law defines the relationship between stress and elastic strains, while flow
rules define the relationship between stresses and plastic strain increments. A general form of a
flow rule relating stresses to plastic strain increments is given by
Phillip A. Allen 6

de_- ag d_,0o" 0
where dei_ are the plastic :;train increments, g is the plastic potential function, and dq_ is a
positive constant [13]. Associated flow occurs when g =f, wherefis the yield function.
For an incompressible material, the sum of the plastic strain increments (or plastic
dilatation rate) must be zero.
de2, and de3 as
(8)
This can be written in terms of the principal strain increruents de, r.
d_;,_ =d_ +de_ +d_ =0. _9)
where de( _is the plastic portion of de1. Equation (9) is written in associated form as
de_f _ Of drp. (10)0or 0
Drucker and Prager [14] showed that dei_ can be summed from Equation (10) to obtain
de,_ = 3ddp __f . (11)011
Since the hydrostatic stress is Y3 11' delhi
on hydrostatic stress.
must equal zero if the yield function does not depend
PRESSURE-DEPENDENT PLASTICITY
Bridgman continued to study the effects of external hydrostatic pressure for many years,
and, in 1952, he wrote a comprehensive summary of his work in his book "Studies in Large
Plastic Flow and Fracture with Special Emphasis on the Effects of Hydrostatic Pressure [15]." In
this book, he reexamined his earlier results and made observations that many plasticity books
failed to notice. On p. 64 of his book, Bridgman writes:
Phillip A. Allen 7

"By the time the last series of measurements was being made under the arsenal
contract, however, skill in making the rmasurements had so increased, and
probably also the honx)geneity of the material of the specimens had also increased
because of care in preparation, that it was possible to establish a definite effect of
pressure on the strain hardening curve [15]."
For example, Bridgman's tests found that the flow stress for tempered pearlite at a strain
of 2.75 increased from 1758 MPa (255 ksi) at atmospheric pressure to 2171 MPa (315 ksi) when
pressurized to approximately 2482 MPa (360 ksi). Therefore, Bridgman clearly demonstrated
in his later work a definite external hydrostatic pressure effect on yielding. Unfortunately, he
failed to consider the effect of intemaUy generated hydrostatic stresses.
In the 1970's Richmond, Spitzig, and Sober [10,12,16] also conducted experiments that
challenged the basic tenets of classic metal plasticity. They studied the effects of hydrostatic
pressure on yield strength for four steels: 4310, 4330, maraging steel, and HY80. They
conducted compression and tension tests on smooth specimens in a Harwood hydrostatic-
pressure unit at pressures up to 1100 MPa (160 ksi).
Richmond found that the yield strength was a linear function of hydrostatic pressure as
shown in Fig. 2. Richmond proposed that for high-strength steels the yielding process is
described by the yield function
f(I1,J2) = 3_2 + all - d, (12)
where d is the modified yield strength in absence of mean stress and a is a material constant
related to the theoretical cohesive strength of the material, _. Equation (12) is identical to the
yield function originally proposed by Drucker and Prager [14] to solve soil mechanics problems.
The material constant a is determined graphically as the slope of the graph of _# versus Ii, as
illustrated in Figure 3. The value of/1 for _H = 0 is equal to the theoretical cohesive strength of
the material, and the value of I_ = o'_a corresponds to the yield strength for a tensile test.
Phi[lip A. Alleaa 8

Also, the value of/l = 0 leads to _g= d. Values of a and d reported by Richmond [10] and Chert
[17] are listed in Table 1.
Another interesting result that emerged from Richmond's tests was a strong correlation
between the coefficients a and d. He found that the ratio of a/d was nearly constant for all of the
steels as listed in Table 1. Richmond also suggested that the ratio a/d is a property of the bulk
iron lattice similar to the elastic constants E and v.
Richmond also conducted pressurized compression and tension tests on two polymers--
crystalline polyethylene and an_rphous polycarbonate. These tests were perforn_d to see if the
plasticity theories devek_tx;d for metals were compatible with other materials. He found that
hydrostatic pressure had a significant effect on the stress-strain response of the polymers and that
the effective stress was a linear function of hydrostatic pressure. In other words, Richmond
established that the polyrra,.rs' plastic response could be described by the same plasticity theories
that he developed for metals. Therefore, the fact that soils, metals, and polymers are all affected
in a similar manner by hydrostatic pressure is a unifying concept.
The Drucker-Prager yield surface is a right-circular cone in principal stress space as
shown in Fig. 1. The axis of the cone is the hydrostatic pressure axis, and the apex of the cone is
located at a hydrostatic stress equal to the cohesive strength. The yield surface for an actual
material probably does not come to a sharp apex as the linear Drucker-Prager model predicts.
The sharp point of the cone could cause numerical difficulty in calculating derivatives for flow
calculations, and, therefi_re, the finite element code ABAQUS provides hyperbolic and
exponential Drucker-Prager constitutive models that round off the end of the cone [5]. For small
anaounts of hydrostatic stre, ss, the cylinder of the yon Mises yield criterion can approximate the
cone. As the hydrostatic stress increases, the deviation from the cylinder can be considerable,
Phillip A. Allen 9
and the Drucker-Prager yield surface is preferable (Fig. 1). Because of its hydrostatic
dependency, the Drucker-Prager yield criterion should result in more accurate modeling of
geometries that have a high hydrostatic stress influence such as cracks and notches.
RESEARCH PROGRAM
Accurate load-displacement or load-microstrain test data was obtained from Pratt &
Whitney [18] and NASA [19] for two IN100 test geometries: an equal-arm bend specimen (Fig.
4) and a double-edge notch tension (DENT) specimen (Fig. 5). Several nonlinear finite element
analyses were then conducted in order to assess how well the yon Mises and Drucker-Prager
failure FEM's could match the IN100 specimen test data. The FEM's meshes were created using
the modeling program Patran [20]. The Patran meshes were translated into an ABAQUS [5]
input file, and the job control commands and material properties were added using a text editor.
All of the f'mite elements rr_dels were loaded in displacement control with full integration and
large strain effects activated. Details of the FEM's are given by Allen [21].
Equal-Arm Bend Specimen
The fh-st specimen nx)deled was an IN100 equal-arm bend specimen (Fig. 4). This
specimen was used by Pratt & Whitney [18] in low cycle fatigue testing to simulate the geometry
and loading condition of a highly stresses area in the Space Shuttle main rocket engine fuel
turbopump housing. The equal-arm bend FEM was created using Q4 plane strain elements (type
CPE4 in ABAQUS) and one symmetry plane resulting in a total of 1339 elements. The
symmetry plane and boundary conditions are illustrated in Fig. 6. Plane strain elements were
used because the thickness to width ratio in the fillet region was approximately 5 to 1. The
Phillip A. Alleal 10

loading was applied to the finite element n'_del by filling the hole for the loading-pin with
elements and applying a displacement to the node ha the center of the loading-pin hole. An
illustration of the finite element model is given in Fig. 7. The mesh in the fillet region in Fig. 7
is difficult to see and, therefore, a closer view of the mesh in the fillet region is shown in Fig. 8.
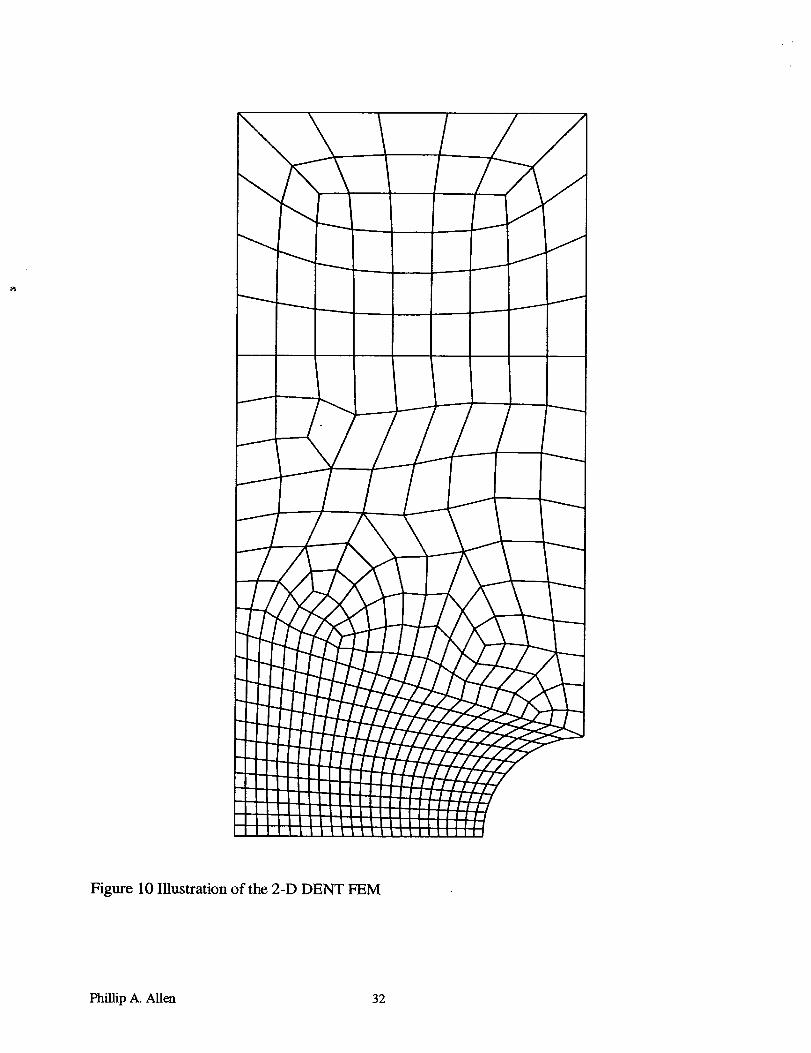
Double-Edge Notch Tension Specimen
The next geometry analyzed was an IN100 double-edge notch tension (DENT) specimen
tested by NASA's Marshall Space Flight Center (Fig. 5). Both two-dimensional (2-D) and three-
dimensional (3-D) FEM's were created since the thickness to width ratio was approximately
unity in the notch region. Three 2-D DENT models were created by utilizing a coarse, medium,
and fine mesh in the notch region. The 2-D models were created using Q4 plane stress elements
(type CPS4 in ABAQUS). Only the gage section of the specimen was modeled by utilizing two
planes of symmetry as illu,,;trated in Fig. 9. The coarse, medium and fine meshes had
approximately 150, 300, al_d 630 elements in the notch region, respectively. A convergence
study was perforn_ed comparing the performance of the three mesh densities, and the medium
mesh was chosen as a good balance between computational speed and accuracy. An illustration
of the medium density mesh 2-D FEM is given in Fig. 10.
The 3-D DENT fini.te element model was created using 4740 H8 elements (type C3D8 in
ABAQUS). Three symmer.ry planes were utilized in creating this FEM by dividing the specimen
along the longitudinal axis, along the transverse axis, and through one-half of the thickness. The
3-D DENT mesh was created by extruding the 2-D medium density mesh with 10 elements
through the thickness.
Phillip A. Allen 11
Required Material Properties
Several material properties are required as input for the yon Mises and Drucker-Prager
constitutive models in ABAQUS. Both constitutive models require the elastic material
properties of Young's rr_dulus, E, and Poisson's ratio, v. The yon Mises model with hardening
also necessitates a table of true stress, or, versus plastic strain, _l. The elastic material properties
and the table of cr versus ept for Inconel 100 (IN100) were gathered from Pratt and Whimey
tensile test data [22]. The true stress versus true strain plots for IN100 at room temperature is
given in Fig. 11. It is notable that IN100 has an upper and lower yield point.
The plastic material properties for the Drucker-Prager constitutive nx)del require careful
explanation and, therefore, will be discussed in some detail. The linear Drucker-Prager yield
function is written in ABAQUS as
f =t-ptanfl-d, (13)
where
1K K)_3xf_2 J (14)
fl is the slope of the linear yield surface in the p-t stress plane, p is the hydrostatic pressure, d is
the effective cohesion of the material, and K is the ratio of the yield stress in triaxial tension to
the yield stress in triaxial compression. The variables used by the linear Drucker-Prager yield
function are shown graphically in Fig. 12.
The flow potential, g, for the linear Drucker-Prager medel is defined as
g =t-ptanv/, (15)
Phillip A. Alleaa 12

where ¥is the dilation angle in thep-t plane (Fig. 12). The dilation angle controls the movement
of an arbitrary point on the yield surface during the hardening process. Setting g= fl results in
associated flow. Therefore, the original Drucker-Prager model is available by setting g= fl and
K = 1 [5]. Associated flow was used in this research as a first-order approximation.
In order to conveniently compare ABAQUS Drucker-Prager material property variables
with those used by Richinond, et al. in their material testing, one must correlate the variables in
Equations (12) and (13). Recalling that p = -_311 and t = 3,_2 forK=l, Equation (13) canbe
written as
1
f = _ +-_I1 tanfl-d. (16)
Comparing Equations (12) and (16) leads to the conclusion that
all = 3 I1 tan ft. (17)
Solving for [3 yields
fl = tan-1 (3a), (18)
thus demonstrating how tht: material constants of the original Drucker-Prager theory and the
material constants used in the ABAQUS linear Drucker-Prager constitutive model are be related.
The linear Drucker-Prager constitutive model in ABAQUS requires, in addition to the
elastic constants, values for/_, _, K, and a table of modified effective stress, _,g, versus ept. The
modified effective stress is defined as
_e_ = crg (1 - a). (19)
The factor (l-a) is a small correction to account for the presence of hydrostatic stress in a
smooth tensile test data. Since the values of a for a metal are typically very small, the correction
Phillip A. Allen 13

to the ore# versus err curve is correspondingly small. For example, using Richmond's reported
value of a for 4310 steel (Table 1) results in a 2.5 percent lower _#versus _t curve.
The challenge comes in calculating a value for a. It was reported earlier that the ratio of
a/d in Richmond's tests [10] was nearly constant for the high strength steels, and, therefore, a/d
is possibly a material constant similar to Young's modulus or Poisson's ratio. Since Young's
modulus for IN100 is similar to that of high strength steels, it was assumed that a for IN100 is
approximately equal to the values of a reported by Richmond (Table 1). Estimating a value for a
for other metals can be more difficult though because no extensive test data of _# versus Iz is
readily available. The value for a can be estimated for any metal by conducting uniaxial tension
and uniaxial compression tests and plotting the yield results in _# versus It space. The slope a
of the line connecting the compressive yield, cry,c, and the tensile yield, Cry,, in Fig. 3 is
t3ry:c -- t3ry sa - (20)
O'ysc -b O'y s
Dieter [23] suggests that for many metals the material cohesive strength, _, can be estimated as
El15 to E/4 with a typical value of E/5.5. Therefore, a can also be estimated as initial yield
strength divided by an approximate cohesive strength.
RESULTS AND CONCLUSIONS
INIO0 Material Properties
Poisson's ratio for IN100 was assumed to be 0.30. The Ltider effect from the upper and
lower yield strength was neglected in constructing the true stress versus plastic strain curve, and,
therefore, the lower yield stress was used for o_,. To use the original form of the linear Drucker-
Phillip A. Allen 14

Prager constitutive model, K was set equal to one, and fl and _were equated. Richmond's test
results (Table 1) for high strength steels was used to estimate a value for a of 0.022. Using
Equation (18), flwas calculated to be approximately 3.8 °. The values of t_# were calculated for
increments of eel using Fzluation (19).
Pratt and Whitney 1122] tensile test data for IN100 has widely scattered values for E
ranging from 172.4 to 241.3 GPa (25×106 to 35×106 psi). Young's modulus was assumed to be
227.5 GPa (33.0><106 psi) tbr the DENT models to match the test data in the linear range and
179.3 GPa (26.0x10⁶ psi) tier the equal-arm bend model. The reason for the change in E is a
matter of debate, but it is possible that the measured value of E for IN100 changes with loading
type [24]. This is supported by the fact that in addition to normal stresses, the equal-arm bend
specimen was under the influence of large bending stresses.
Equal-Arm Bend Comparisons
Pratt & Whitney tt:st data [18] was provided for a five-cycle proof test, but only the
initial loading portion of the first cycle was considered in this research. Load versus micro strain
FEM curves for the equal-m'm bend specimen are plotted alongside the Pratt & Whitney test data
in Fig. 13. The FEM strah_ data is the maximum strain at the integration points of the element at
the fillet root. The von Mises model overestimates the load for a given value of strain in the
postyield region. Consider tng the strain at load reversal, the Drucker-Prager FEM predicts loads
that are about 5% lower than the von Mises values. For the maximum load, the Drucker Prager
FEM predicts strains that are approximately 20% greater than the von Mises values, and,
therefore, does a much better job of matching the overall specimen response.
Phillip A. Allen 15

Double-Edge Notch Tension Comparisons
Load-displacement data for the medium mesh 2-D and 3-D DENT finite element medels
are plotted alongside NASA test data [19] in Fig. 14. The test data crosses the FEM curves at a
strain of approximately 0.0003. For all of the FEM's, the yon Mises yield criterion
overestimates the load for a given value of displacement in the postyield region. Considering the
failure displacement, the Drucker-Prager FEM's predict loads that are about 3% lower than the
yon Mises values. For the failure load, the Drucker Prager FEM's predict strains that are about
35% greater than the yon Mises values. The 2-D plane stress model gives load values that are
about 2% lower than those given by the 3-D model, illustrating the lower stiffness of the 2-D
medel. A plane strain model was also tried, but the results of this FEM greatly overestimated the
test data load for a given value of displacement in the postyield region. Overall, the DENT f'mite
element models did not predict test specimen behavior as well as the equal-arm bend FEM.
Conclusions
The following are the conclusions reached from this study of hydrostatic stress effects in
yield behavior of IN100.
1. Internally generated hydrostatic pressure does have a significant effect on the yield and
postyield behavior of IN100.
2. In all test cases, the yon Mises constitutive model, which is independent of hydrostatic
pressure, overestimated the load for a given displacement or strain.
3. The Drucker-Prager constitutive nlodel, which is a function of hydrostatic stress,
produced results that better matched the test data. Considering the failure displacements
or strains, the Drucker-Prager FEM's predicted loads that were 3% to 5% lower than the
Phillip A. Allen 16

von Mises values. For the failure loads, the Drucker-Prager FEM's predicted strains that
were 20% to 35% g:reater than the yon Mises values.
4. This level of increa,_e in accuracy may be of little interest to the designer using large
factors of safety, bt:_t, to the high performance designer, a 10% increase in accuracy is
significant.
5. The Drucker-Prager yield function seems to more accurately predict the overall specimen
response of geometries with significant hydrostatic influence.
ACKNOWLEDGEMENTS
We would like to tlkank Greg Swanson and numerous other members of the Strength
Analysis Group at Marshall Space Flight Center for their help and guidance in conducting this
study. Funding for this research was provided by the National Aeronautics and Space
Administration (NASA) Graduate Student Researchers Program (GSRP).
Philhp A. Allen 17

NOMENCLATURE
Symbol
a
d
f
gk
Pt
E
/1J2, J3P
E
El, ez, c3
eelp_
E eq
ge
V
_3r
cr1,_, cr3
crc
creff
cg,
O'xx, O'yy, O'zz
¥DENT
FlEA
FEM
NASA
Description
Slope of Effective Stress Versus the First Stress Invariant
Modified Yield StrengthYield Function
Plastic Potential Function
Yield Strength in Pure Shear
Hydrostatic Pressure
Variable in Drucker-Prager Yield Function in ABAQUS
Young's ModulusFirst Stress Invariant
Second and Third Deviatoric Stress lnvariants
Load
Angle of the Slope of the Yield Surface in the p-t stress plane
Positive Constant in General Flow Rule
True Strain
Principal StrainsPlastic Strain
Equivalent Plastic Strain
Microstrain
Poisson's Ratio
True Stress
Principal StressesTheoretical Cohesive StrengthEffective Stress
Modified Effective Stress
Mean Stress
Normal Stresses
Yield Strength
Compressive Yield Strength
Shear Stresses
Dilation Angle
Double-Edge Notch Tension
Finite Element AnalysisFinite Element Model
National Aeronautics and Space Administration
Phillip A. Alien 18

REFERENCES
[1] Bridgman, P.W., 1947,"The Effect of Hydrostatic Pressure on the Fracture of Brittle
Substances," Journal of Applied Physics, Vol. 18, p. 246.
[2] Hill, R., 1950, "The Mathematical Theory of Plasticity," Clarendon Press, Oxford.
[3] Lubliner, J., 1990, "Plasticity Theory," Macmillan, New York.
[4] Kohnke, Peter, ed., 1994, "ANSYS User's Manual for Revision 5.0," Volume IV: Theory.
[5] ABAQUS Theory Manual, Version 5.5, 1995, Hibbit, Karlsson, and Sorensen, Inc.
[6] Neuber, Heinz, 1958, "Theory of Notch Stresses: Principles for Exact Calculation of Strength
with Reference to Structural Form and Material," U.S. Atomic Energy Commission, ACE-tr-
4547, Translated from publication of Springer-Verlag, Berlin, Gottingen, Heidelberg.
[7] Hertzberg, Richard W.. 1996, 'q)eformation and Fracture Mechanics of Engineering
Materials," John Wiley & Sons, Inc., New York.
[8] Rice, J.R., and D.M. Tracey, 1969, "On the Ductile Enlargement of Voids in Triaxial Stress
Fields," Journal of the Mechanics and Physics of Solids, Volume 17, pp. 201-217.
[9] Gurson, A.L., 1977, "Continuum Theory of Ductile Rupture by Void Nucleation andGrowth: Part 1 - Yield Criteria and Flow Rules for Porous Ductile Media," Journal of
Engineering Materials and Technology, Volume 99, pp 2-15.
[10] Richmond, O., and W.A. Spitzig, 1980, ''Pressure Dependence and Dilatancy of Plastic
Flow," International Unior of Theoretical and Applied Mechanics Conference Proceedings, pp.377-386.
[ 11] Wilson, Christopher D., 2002, "A Critical Reexamination of Classical Metal Plasticity,"
The Journal of Applied Mechanics, Volume 69, pp. 63-68.
[12] Spitzig, W.A., R.J. Sober, and O. Richmond, 1975, "Pressure Dependence of Yielding and
Associated Volume Expansion in Tempered Martensite," ACTA Metallurgica, Volume 23, pp.885-893.
[13] Mendelson, Alexander, 1983, ''Plasticity: Theory and Application," Krieger Publishing,
Florida, originally published by Macmillan, 1968.
[14] Drucker, D.C., and W. Prager, 1952, "Soil Mechanics and Plastic Analysis for Limit
Design," Quarterly of Applied Mathematics, Volume 10, pp. 157-165.
[15] Bridgman, P.W., 1952, "Studies in Large Plastic Flow and Fracture with Special Emphasis
on the Effects of Hydrostatic Pressure," McGraw-Hill, New York.
[16] Spitzig, W.A., R.J. Sober, and O. Richmond, 1976, 'q'he Effect of Hydrostatic Pressure on
the Deformation Behavior of Maraging and HY-80 Steels and its Implications for Plasticity
Theory," Metallurgical Transactions A, Volume 7A, pp. 377-386.
[17] Chen, W.F., and X.L. Liu, 1990, 'q_,imit Analysis in Soil Mechanics," Elsiver, New York.
[18] Pratt & Whitney, Nov 16, 1999, Report Number MME 42030.
[ 19] McGill, Preston, August 1999, DENT Test Data, ED33 Metallic Materials and Processes
Group, NASA George C. Marshall Space Flight Center.
[20] MSC Software Corporation, 2000, "Patran Users Manual", Version 9.0.
[21] Allen, Phillip A., 2000, "Hydrostatic Stress Effects in Metal Plasticity," Masters Thesis,
Tennessee Technology University.
[22] Pratt and Whitney, 1991, "Alternate Turbopump Development (ATD) Materials Manual."
[23] Dieter, G.E., 1976, "Mechanical Metallurgy," McGraw-Hill, New York.
Phillip A. Allen 19

[24] American Society for Testing and Materials, 2000, "E855-90, Standard Test Methods for
Bend Testing of Metallic Hat Materials for Spring Applications Involving Static Loading,"
Annual Book of ASTM Standards, ASTM, PA.
Phillip A. Allen 20

LIST OF TABLES AND FIGURES
Table 1 Summary of Experimental Results for Constants in Equation (12) [[10],[17]]
Figure
Figure
Figure
FigureFigure
Figure
Figure
Figure
Figure
Figure
Figure
1 Drucker-Prager and von Mises Yield Surfaces in Principal Stress Space
2 Dependence of Yielding on Mean Stress in 4330 Steel [10]
3 Schematic of or,# versus I1
4 Engineering Drawing of the Equal Arm Bend Specimen (Dimensions in mm)
5 Engineering Drawing of the DENT Specimen (Dimensions in mm)
6 Schematic of the l_ual-Arm Bend FEM Utilizing One Symmetry Plane
7 Equal Arm Bend Finite Element Model Utilizing One Plane of Symmetry
8 Mesh in the Fillet Region of the Equal Arm Bend Specimen
9 Schematic of the 2-D DENT FEM Utilizing Two Symmetry Planes10 Illustration of the 2-D DENT FEM
11 True Stress versus True Strain Curve for IN100 at Room Temperature [22]
Figure 12 Linear Drucker-Prager Model: Yield Surface and Flow Direction in the p-t Plane
(Adapted from [5])
Figure 13 Load-Microstrain Results for the Equal-Arm Bend Specimen
Figure 14 Load-Displacement Results for the DENT Specimen
Phillip A. Allen 21
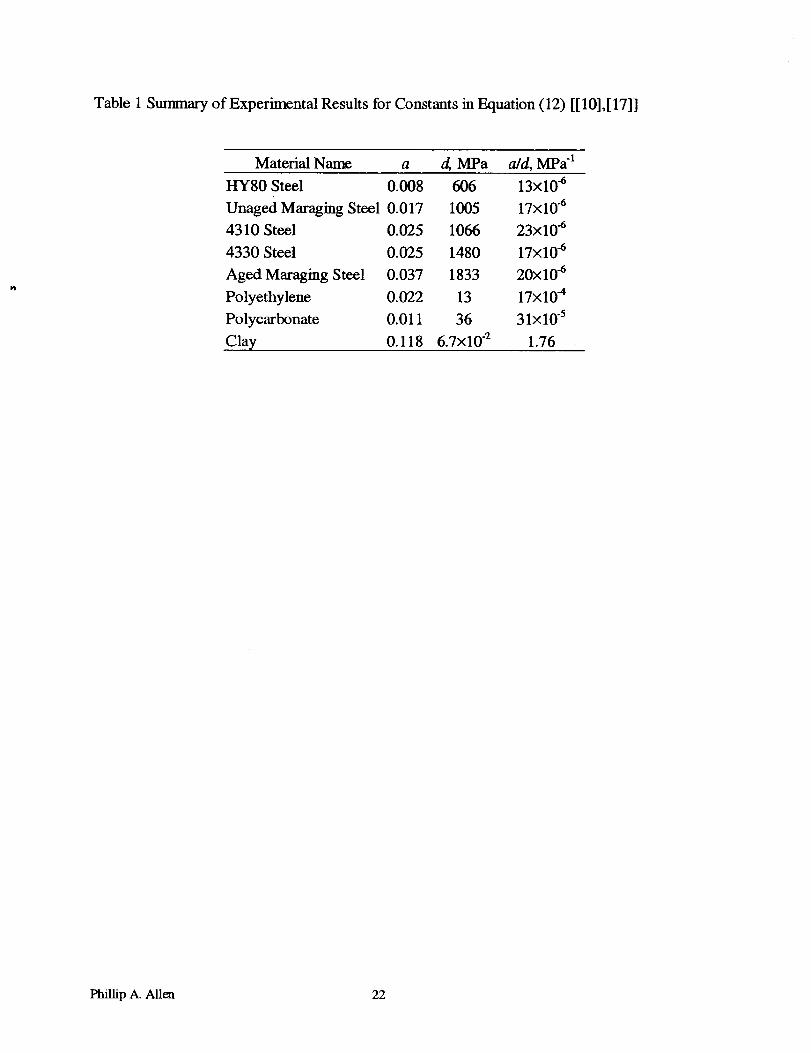
Table 1 Summary of Experimental Results for Constants in Equation (12) [[10],[17]]
Material Name a d, MPa a/d, MPa "1
HY80 Steel 0.008 606 13x10 -6
Unaged Maraging Steel 0.017 1005 17x10 -6
4310 Steel 0.025 1066 23x10 -6
4330 Steel 0.025 1480 17x10 -6
Aged Maraging Steel 0.037 1833 20x10 -6
Polyethylene 0.022 13 17×10 "4
Polycarbonate 0.01 ! 36 3 lxlff 5
Clay 0.118 6.7x10 a 1.76
Phillip A. Allen 22

Drucker-Prager
von Mises
m
m 1/31 1
Figure 1 Drucker-Prager and yon Mises Yield Surfaces in Principal Stress Space
Phillip A. Allen 23

0
1.000 --
1_0--
1,500 -
1.450 --
,,i
-5000
08
0 o
0C3
0
I I I I I I I I I
-4.(XX) -3.000 -2.000 -1.000
i,. MPa
o Tens_n
o Cornpr_
0D
0 00 0
0
! I I q0 1.000
Figure 2 Dependence of Yielding on Mean Stress in 4330 Steel [10]
Phillip A. Allen 24

Uniaxial Compression Test
aUniaxial Tensile Test
0_js
(_ I1
Figure 3 Schematic of a,.ff versus Il
Phillip A. Allen 25

LOADING
6.35
o_ "_-
I'-- "--LO LO
7-O3LO
%---.-
O,4
II ,
'_lx _...___ ¢ 6.38 6.48
\
/>-\t = 12.83 - 12.57
R2.54
51.44 =%0
= 57.79 -_
0p..
cq%-.-..
\
Figure 4 Engineering Drawing of the Equal Arm Bend Specimen (Dimensions in mm)
Phillip A. Alle_a 26

R 25.4
R 1.27
R 12.70
-- 76.20 v
Figure 5 Engineering Drawing of the DENT Specimen (Dimensions in mm)
Phillip A. Alle_ 27

Figure6 Schematicof theEqual-ArmBendFEM Utilizing OneSymmetryPlane
PhillipA.Altoa 28
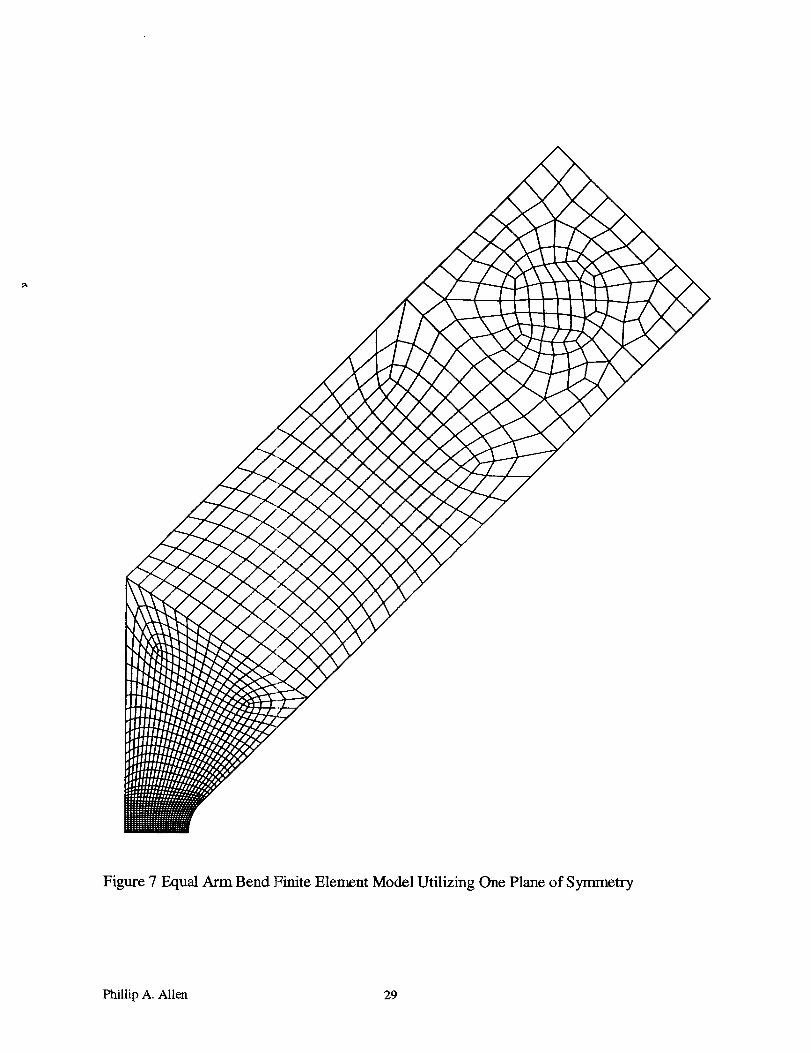
Figure7 EqualArm BendFiniteElementModelUtilizing OnePlaneof Symmetry
PhillipA.Allen 29

__.._v I
Jill ;J,J,///IIIIIIIIII
11111111/7,,,i,iiiii
#1#I #I I
I I I I
Figure 8 Mesh in the Fillet Region of the Equal Arm Bend Specimen
Phillip A. Allen 30

Figure9 Schematicof tile 2-DDENT FEMUtilizing Two SymmetryPlanes
PhillipA.Allen 31
\\
\
L
-. I
I
I
.-.. ---.-7_
.._....--.-4\
,,,/
-- /,
/A--\ L
7<,I_ _i
"t-a_,.._" _. "b4-
_ "-t"-t--
T
/1
Illl
/,II
i
J_i
J
J
I
i
I
/xA
IIII-
Figure 10 Illustration of the 2-D DENT FEM
Phillip A. Allen 32

200000
180000
160000
140000
120000
1000000
80000
60000
40000
20000
0 I _ I I I I I I I
0.000 0.010 0.020 0.030 0.040
Microstrain,_
- 800
- 700
- 600
z- 500 "--
13.
- 400 o
- 300
- 200
- 100
0
0.050
Figure 11 True Stress versus True Strain Curve for IN100 at Room Temperature [22]
Phillip A. Allen 33

t
d/.J
pl
0 P
Figure 12 Linear Drucker-Prager Model: Yield Surface and Flow Direction in thep-t Plane
(Adapted from [5])
PhiHipA. Allen 34

600
500
r_
v 40013..
0
J 300
200
100
0
_ fl j
1=i[3"
_ [
[] Test Data
--von Mises FEA
-- -- Drucker-Prager FEA
I I Ii _ I I I
3000
5000 10000 15000 20000 25000 30000 35000 40000
250O
2000z
1500OJ
1000
500
M icrostrain, _E
Figure 13 Load-Microstrahl Results for the Equal-Arm Bend Specimen
Phillip A. Allen 35

Gage Displacement, v (mm)
14000
12000
10000
v 8000
0
6000
4000
2000
0
0 0.1 0.2 0.3
I I I
0
I
0.004
[] [] [][] [] []
0.4
O Test Data
--von Mises FEA
Drucker-Prager FEA3D yon Mises FEA
--o-- 3D Drucker-Prager FEA
Gage Length = 0.5 in.
I I I
0.008 0.012 0.016
Gage Displacement, v (in)
Figure 14 Load-Displacement Results for the DENT Specimen
60000
50000
40000
30000
20000
10000
0
Zv
0..
_30
_1
Phillip A. Alle_ 36