#5/9: a plea for survey precision
TRANSCRIPT

Presentation title
Natasha Rowlands, Dr Mark Rehfisch & Dr Stephanie McGovern
with the support of Bronagh Byrne and Emma Heywood
18th March 2015
A Plea for Survey Precision To Grid or Transect Post-Consent?
Offshore wind post-consent monitoring seminar

Introduction to London Array Offshore Windfarm Surveys
• London Array Ltd was one of the first organisations to use grid-based survey
designs.
• Currently finalising data for the second post-construction survey period (2014 / 15).

Year Survey
2009 / 2010 Pre-construction
2010 / 2011 Pre-construction
2011 / 2012 Construction
2012 / 2013 Construction
2013 / 2014 Post-construction
2014 / 2015 Post-construction (ongoing)
• Winter surveys of the London Array wind farm development have been undertaken
by APEM using a grid-based design since 2009.
• The main species of concern is red-throated diver, a species known to be highly
sensitive to disturbance (King et al. 2009 etc).
• Grid scale was selected to achieve a target precision or CV of 0.16 for this key
species. A CV of 0.16 makes it possible to detect a halving or doubling in numbers
between surveys.
Introduction to London Array Offshore Windfarm Surveys

Why use grid-based survey design?
• APEM’s grid-based survey methodology is based on first principles:
- Aim to collect sufficient independent estimates of seabird density to achieve a
pre-defined level of confidence (London Array target precision 0.16).
• Fundamental approach is that the sampling unit is at the image level.
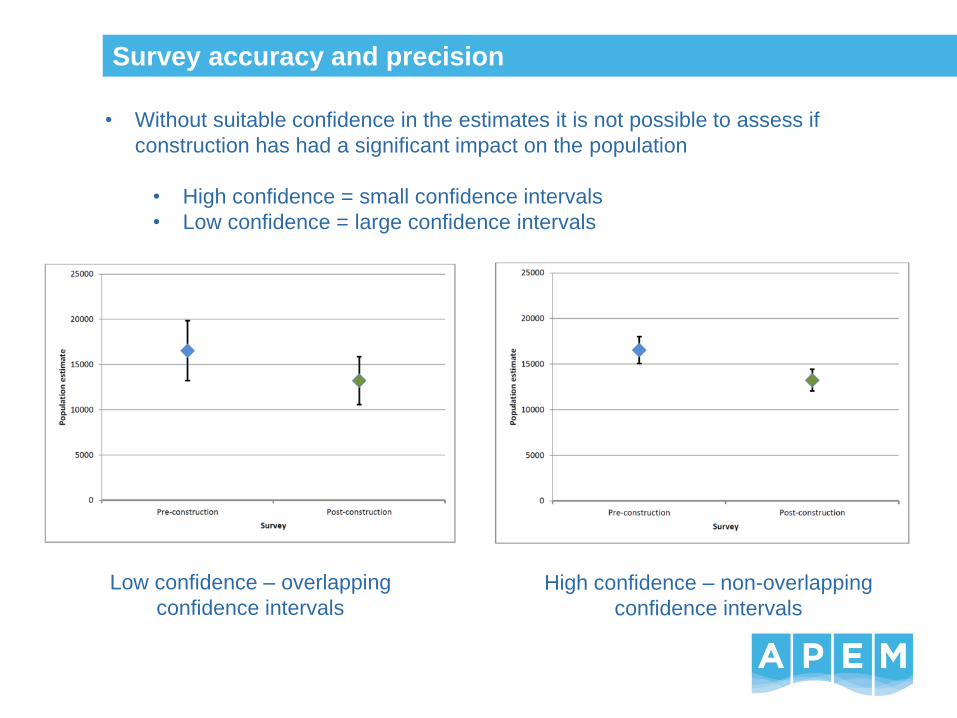
Survey accuracy and precision
• Without suitable confidence in the estimates it is not possible to assess if
construction has had a significant impact on the population
• High confidence = small confidence intervals
• Low confidence = large confidence intervals
Low confidence – overlapping
confidence intervals
High confidence – non-overlapping
confidence intervals

Survey accuracy
• Grids can present distinct advantages when surveying species with clumped
distributions, such as wintering red-throated diver aggregating in the Thames
Estuary.
• The following simulations are for demonstration purposes only; the birds are not
drawn to scale; 11% average coverage targeted for both survey approaches.

Population = 282 Grid estimate = 217 (11.1% coverage) Transect estimate = 121 (14% coverage)

Population = 282 Grid estimate = 426 (9.9% coverage) Transect estimate = 657 (14% coverage).

Population = 282 Grid estimate = 295 (9.9% coverage) Transect estimate = 658 (14% coverage).

Population = 282 Grid estimate = 337 Transect estimate = 0
Population = 282 Grid estimate = 337 (11.3% coverage) Transect estimate = 0 (7.2% coverage).

Survey accuracy
Estimate 1 2 3 4 Average
n-1
Population Error
Grid 217 426 295 337 318.8
43.5
282 -36.8
Transect 121 657 658 0 348.2
174.1
282 -77
• The above table is based on a few simulations. Had very many
simulations been carried out for both sampling strategies the average
estimated population size (column 6) would have been close to the real
population size (column 7), but the confidence intervals for the grid-based
approach would have been smaller. The smaller the confidence the more
reliable the population estimate.
• Transect methods provide less reliable population estimates with real
world sampling effort.

Survey accuracy – Markov Chain Monte Carlo Simulation
Grids achieved the target precision and tighter confidence
intervals at a much lower percentage coverage than transects.
A simulation based on Carmarthen Bay SPA common scoters, a difficult to survey
clumped species
Dashed grey lines show where the grid method achieved the same confidence intervals as the transect method with 10.5% coverage

Grid Coverage
• Often, the exact area to be developed for a wind farm is not finalised until surveying
has commenced or been completed.
• If coarse scale transects are used to achieve the desired coverage across the study
area, transects may not be ideally placed if the wind farm boundaries move.
• Surveying with a grid ensures even coverage even if boundaries move.

Wind farm coverage Grid = 11.10% Transect = 17.47 %
Wider area coverage Grid = 10.16% Transect = 14%

Wind farm coverage Grid = 11.10% Transect = 0 %
Wider area coverage Grid = 10.16% Transect = 14%

Habitat coverage
• Without knowledge of the habitat (yellow
bar) prior to surveying, areas of interest
may be over- or under-sampled by a
transect leading to skewed estimates.
Such as transient sandbars in the Outer
Thames Estuary.
• Oblique image taken
during survey of
transient sandbank,
often utilised by seals
as haul out sites.

Habitat coverage
• With the regular sampling of a grid
spatial coverage of habitats (yellow bar)
should be sampled in proportion to its
presence even with no prior knowledge
of the area

Assessment of displacement
• Transect-based options may only provide 1 or
2 transects on each side of the buffer area.
This makes it difficult to estimate any bird
displacement due to the wind farm in one
direction as displacement will only be
measured at 1 or 2 distances to the nearest
turbine.
• As data on a grid are collected at a finer spatial
scale, samples are collected at multiple
distances from the turbines, allowing a more
detailed assessment of displacement to be
undertaken.

Assessment of diver displacement at London Array
• The use of a grid-based survey design allowed for the assessment of the density
profile of divers during pre-, during-, and post-construction within the London Array
Offshore Windfarm and surrounding buffer (Zone 1).
• Diver density has changed within Zone 1 over the last 5 years of winter survey.
• Although the period of construction appears to have led to a change in diver
distribution, there is no clear evidence that this change in distribution continued
post-construction.

Assessment of diver displacement at London Array
New data subject to review

• Results of analysis carried out following the first year of post-construction
monitoring for red-throated diver are as follows:
• The repeated measures ANOVA showed a significant effect of construction
(p<0.05, F=30.94).
• This suggested a significant decrease between pre- and during-construction diver
density (p<0.05) and a significant increase between during- and post-construction
diver density (p<0.05).
• There was no significant difference between pre- and post-construction
diver density (p>0.05).
• Surveying using a grid design provided accurate population estimates and
sufficient statistical power to successfully detect any possible change in numbers.
Assessing the effect of construction
Windfarm
development stage
Pre-construction
Construction p < 0.05 Significant difference
Post-construction p > 0.05 No significant difference
New data subject to review

Summary
• The London Array dataset provides an important longitudinal dataset for
the assessment of bird populations post-construction.
• Grid sampling has provided accurate population estimates (smaller
confidence intervals) of red-throated divers and sufficient statistical
power to detect change in estimates and distributions during the
construction stages of London Array.
• Habitats have been sampled in proportion to presence producing more
reliable population estimates.
• Grid-sampling has allowed more detailed assessment of displacement of
red-throated divers during-construction.
• Future proofing – surveying with a grid ensures even coverage if wind
farm boundaries move, allowing more reliable comparison post-
construction.
Why are girds important for post-consent monitoring?

Thank you for listening – any questions?
Special thanks to London Array Limited and DONG Energy