document
TRANSCRIPT

Nature © Macmillan Publishers Ltd 1998
8
letters to nature
936 NATURE | VOL 392 | 30 APRIL 1998
phenol red or riboflavins and supplemented with 25 mM HEPES and 0.2%BSA. Solutions were maintained at 4 8C until immediately before each experi-ment, when they were warmed to 37 8C and supplemented with 50 nM PdBUand either 0.5 mM EGTA (,50 mM free Ca2+) or 1 mM Ca2+ (1.5 mM totalCa2+).Transfection of the reporter genes. NF-AT, NF-kB, Oct-1/OAP and IL-2reporter constructs were provided by J. Goldberg and G. Crabtree and werederived from constructs described previously16. Multimeric copies of NFAT (3copies), NF-kB (4) or Oct/Oap (4) binding sites, linked to a minimal (non-inducible) IL-2 promoter (−74 to þ47), were inserted between the SmaI andHindIII sites in the multiple cloning region of the pGL-3 luciferase reportervector (Promega). The construct with the intact IL-2 promoter region wasmade by inserting 371 bp of the IL-2 initiation region (−324 to þ47) into thepGL-3 vector. The IL-8 reporter construct was provided by K. P. LeClair27.
Transfection of 107 cells was by electroporation with 10 mg of the reportervector, 1 mg of a vector containing large-T antigen and 2 mg of a vectorencoding the transmembrane and extracellular domains of CD8. Large-Tantigen was used to increase the number of copies of the reporter construct ineach cell, and the CD8 construct was used to determine the transfectionefficiency. Transfection efficiencies were 30–40%; viability following centrifu-gation to remove cells killed during electroporation was 85–95%. Experimentswere conducted 24–48 h after transfection when the expression of reportergenes was maximal.Ca2+ clamp and Ca2+ measurements. Transfected cells were loaded with2 mM Fura-PE3/AM (Teflabs) for 1 h at 37 8C in loading medium (RPMI 1640,25 mM HEPES, 2% fetal bovine serum), washed, and incubated for anotherhour to allow complete de-esterification of the dye. Loaded cells (2–3 3 105)were allowed to adhere to a polylysine-coated laminar flow chamber and wereplaced on the heated stage of a Zeiss Axiovert 35 inverted microscope. Thelaminar flow chamber (60 ml volume) was connected to two heated reservoirscontaining 1.5 mM and 0 mM Ca2+ solutions, and pressurized with a mixture of95% air and 5% CO2. At the start of each experiment, cells were treated with1 mM thapsigargin in 0 mM Ca2+ solution for 5 min to deplete internal Ca2+
stores and irreversibly activate CRAC channels. A computer-controlled sole-noid valve (General Valve) was used to switch rapidly between the Ca2+-containing and Ca2+-free solutions flowing into the chamber and over the cells.The solution in the chamber was fully exchanged about once per second andwas maintained at 37 8C. Cells were stimulated for 3 h while [Ca2+]i wasmeasured every 5–10 s by video microscopy as described10. Fura-PE3 wascalibrated on the microscope in a microcuvette using solutions containing1 mM EGTA and 10 mM Ca2+ according to ref. 10.Reporter gene assays. Following stimulation cells were washed from thechamber, lysed by freeze/thawing and subjected to a luciferase assay usingstandard methods. All measurements were done in triplicate and normalized tothe total number of cells determined using a Coulter Counter (CoulterElectronics). b-Galactosidase (b-gal) expression was measured by flowcytometry using the FACS–Gal protocol13. Steady-state [Ca2+]i dependenceof luciferase reporter genes (Fig. 3) was determined after 3 h stimulation with1 mM thapsigargin, 50 nM PdBU and variable extracellular [Ca2+]. Luciferaseactivity was normalized to values between 0 and 100%, given by the responsesto TG þ PdBU in medium containing 0.5 mM EGTA or 1.5 mM Ca2+,respectively.
Received 16 December 1997; accepted 12 February 1998.
1. Berridge, M. J. & Galione, A. Cytosolic calcium oscillators. FASEB J. 2, 3074–3082 (1988).2. Tsien, R. W. & Tsien, R. Y. Calcium channels, stores, and oscillations. Annu. Rev. Cell Biol. 6, 715–760
(1990).3. Fewtrell, C. Ca2+ oscillations in non-excitable cells. Annu. Rev. Physiol. 55, 427–454 (1993).4. Thomas, A. P., Bird, G. S. J., Hajnoczky, G., Robb-Gaspers, L. D. & Putney, J. W. Jr Spatial and
temporal aspects of cellular calcium signaling. FASEB J. 10, 1505–1517 (1996).5. Negulescu, P. A., Shastri, N. & Cahalan, M. D. Intracellular calcium dependence of gene expression in
single T lymphocytes. Proc. Natl Acad. Sci. USA 91, 2873–2877 (1994).6. Dolmetsch, R. E. & Lewis, R. S. in Imaging Living Cells: A Laboratory Manual (eds Konnerth, A., Lanni,
F. & Yuste, R.) (CSHL Press, Cold Spring Harbor, in the press).7. Lewis, R. S. & Cahalan, M. D. Potassium and calcium channels in lymphocytes. Annu. Rev. Immunol.
13, 623–653 (1995).8. Zweifach, A. & Lewis, R. S. Mitogen-regulated Ca2+ current of T lymphocytes is activated by depletion
of intracellular Ca2+ stores. Proc. Natl Acad. Sci. USA 90, 6295–6299 (1993).9. Lewis, R. S. & Cahalan, M. D. Mitogen-induced oscillations of cytosolic Ca2+ and transmembrane
Ca2+ current in human leukemic T cells. Cell Reg. 1, 99–112 (1989).10. Dolmetsch, R. & Lewis, R. S. Signaling between intracellular Ca2+ stores and depletion-activated Ca2+
channels generates [Ca2+]i oscillations in T lymphocytes. J. Gen. Physiol. 103, 365–388 (1994).
11. Crabtree, G. R. & Clipstone, N. A. Signal transmission between the plasma membrane and nucleus ofT lymphocytes. Annu. Rev. Biochem. 63, 1045–1083 (1994).
12. Rao, A. NF-ATp: a transcription factor required for the coordinate induction of several cytokinegenes. Immunol. Today 15, 274–281 (1994).
13. Fiering, S. et al. Single cell assay of a transcription factor reveals a threshold in transcription activatedby signals emanating from the T-cell antigen receptor. Genes Dev. 4, 1823–1834 (1990).
14. Donnadieu, E. et al. Imaging early steps of human T cell activation by antigen-presenting cells.J. Immunol. 148, 2643–2653 (1992).
15. Frantz, B. et al. Calcineurin acts in synergy with PMA to inactivate IkB/MAD3, an inhibitor of NF-kB.EMBO J. 13, 861–870 (1994).
16. Mattila, P. S. et al. The actions of cyclosporin A and FK506 suggest a novel step in the activation of Tlymphocytes. EMBO J. 9, 4425–4433 (1990).
17. Baeuerle, P. A. & Henkel, T. Function and activation of NF-kB in the immune system. Annu. Rev.Immunol. 12, 141–179 (1994).
18. Clipstone, N. A. & Crabtree, G. R. Identification of calcineurin as a key signalling enzyme in T-lymphocyte activation. Nature 357, 695–697 (1992).
19. Liu, J. et al. Calcineurin is a common target of cyclophilin-cyclosporin A and FKBP-FK506 complexes.Cell 66, 807–815 (1991).
20. Fanger, C. M., Hoth, M., Crabtree, G. R. & Lewis, R. S. Characterization of T cell mutants with defectsin capacitative calcium entry: Genetic evidence for the physiological roles of CRAC channels. J. CellBiol. 131, 655–667 (1995).
21. Dolmetsch, R. E., Lewis, R. S., Goodnow, C. C. & Healy, J. I. Differential activation of transcriptionfactors induced by Ca2+ response amplitude and duration. Nature 386, 855–858 (1997).
22. Li, W.-h., Llopis, J., Whitney, M., Zlokarnik, G. & Tsien, R. Y. Cell-permeant caged InsP3 ester showsthat Ca2+ spike frequency can optimize gene expression. Nature 392, 936–941 (1998).
23. Shibasaki, F., Price, E., Milan, D. & McKeon, F. Role of kinases and the phosphatase calcineurin in thenuclear shuttling of transcription factor NF-AT4. Nature 382, 370–373 (1996).
24. Durand, D. B., Bush, M. R., Morgan, J. G., Weiss, A. & Crabtree, G. R. A 275 base pair fragment at the59 end of the interleukin 2 gene enhances expression from a heterologous promoter in response tosignals from the T cell antigen receptor. J. Exp. Med. 165, 395–407 (1987).
25. Okamoto, S. et al. The interleukin-8 AP-1 and kB-like sites are genetic end targets of FK506-sensitivepathway accompanied by calcium mobilization. J. Biol. Chem. 269, 8582–8589 (1994).
26. Durand, D. B. et al. Characterization of antigen receptor response elements within the interleukin-2enhancer. Mol. Cell. Biol. 8, 1715–1724 (1988).
27. Wechsler, A. S., Gordon, M. C., Dendorfer, U. & LeClair, K. P. Induction of IL-8 expression in T cellsuses the CD28 costimulatory pathway. J. Immunol. 153, 2515–2523 (1994).
28. Prussin, C. & Metcalfe, D. D. Detection of intracytoplasmic cytokine using flow cytometry anddirectly conjugated anti-cytokine antibodies. J. Immunol. Meth. 188, 117–128 (1995).
29. Gu, X. & Spitzer, N. C. Distinct aspects of neuronal differentiation encoded by frequency ofspontaneous Ca2+ transients. Nature 375, 784–787 (1995).
30. Fields, R. D., Eshete, F., Stevens, B. & Itoh, K. Action potential-dependent regulation of geneexpression: temporal specificity in Ca2+, cAMP-responsive element binding proteins, and mitogen-activated protein kinase signaling. J. Neurosci. 17, 7252–7266 (1997).
Acknowledgements. We thank J. Goldberg for NF-AT-, Oct/OAP- and NF-kB-luciferase constructs;K. LeClair and G. Crabtree for IL-8 and IL-2 luciferase constructs; C. Fanger for creating the large Tantigen and CD8 constructs; G. Crabtree and L. Herzenberg for use of the luminometer and electro-porator; S. Finkbeiner, Y. Gotoh and M. Greenberg for comments on the manuscript; and J. Walton forhelp in preparing constructs. This work was supported by a grant from the NIH (R.S.L.) and by apredoctoral fellowship from the American Heart Association, California Affiliate (R.E.D.).
Correspondence and requests for materials should be addressed to R.S.L. (e-mail: [email protected]).
Cell-permeant cagedInsP3 estershowsthatCa2+ spike frequencycanoptimizegeneexpressionWen-hong Li*†‡, Juan Llopis*, Michael Whitney§,Gregor Zlokarnik§ & Roger Y. Tsien*†¶
Departments of * Pharmacology and † Chemistry & Biochemistry,and ¶ Howard Hughes Medical Institute, University of California, San Diego,9500 Gilman Drive, La Jolla, California 92093-0647, USA§ Aurora Biosciences Corporation, 11010 Torreyana Road, San Diego,California 92121, USA. . . . . . . . . . . . . . . . . . . . . . . . . . . . . . . . . . . . . . . . . . . . . . . . . . . . . . . . . . . . . . . . . . . . . . . . . . . . . . . . . . . . . . . . . . . . . . . . . . . . . . . . . . . . . . . . . . . . . . . . .
Inositol 1,4,5-trisphosphate (InsP3) releases calcium from intra-cellular stores and triggers complex waves and oscillations inlevels of cytosolic free calcium1–5. To determine which longer-term responses are controlled by oscillations in InsP3 and cyto-solic free calcium, it would be useful to deliver exogenous InsP3,under spatial and temporal control, into populations of unper-meabilized cells. Here we report the 15-step synthesis of a
‡ Present address: Division of Biology 139-74, Beckman Institute, California Institute of Technology,Pasadena, California 91125, USA.
Nature © Macmillan Publishers Ltd 1998
8
letters to nature
NATURE | VOL 392 | 30 APRIL 1998 937
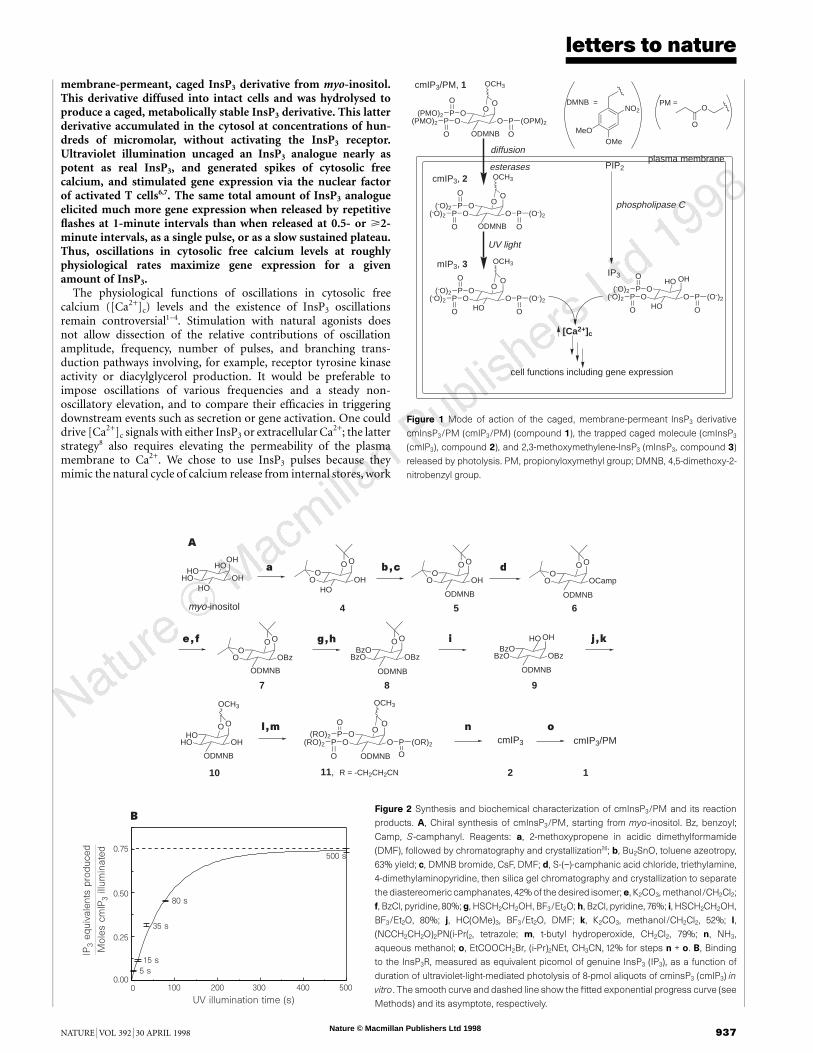
membrane-permeant, caged InsP3 derivative from myo-inositol.This derivative diffused into intact cells and was hydrolysed toproduce a caged, metabolically stable InsP3 derivative. This latterderivative accumulated in the cytosol at concentrations of hun-dreds of micromolar, without activating the InsP3 receptor.Ultraviolet illumination uncaged an InsP3 analogue nearly aspotent as real InsP3, and generated spikes of cytosolic freecalcium, and stimulated gene expression via the nuclear factorof activated T cells6,7. The same total amount of InsP3 analogueelicited much more gene expression when released by repetitiveflashes at 1-minute intervals than when released at 0.5- or >2-minute intervals, as a single pulse, or as a slow sustained plateau.Thus, oscillations in cytosolic free calcium levels at roughlyphysiological rates maximize gene expression for a givenamount of InsP3.
The physiological functions of oscillations in cytosolic freecalcium ([Ca2+]c) levels and the existence of InsP3 oscillationsremain controversial1–4. Stimulation with natural agonists doesnot allow dissection of the relative contributions of oscillationamplitude, frequency, number of pulses, and branching trans-duction pathways involving, for example, receptor tyrosine kinaseactivity or diacylglycerol production. It would be preferable toimpose oscillations of various frequencies and a steady non-oscillatory elevation, and to compare their efficacies in triggeringdownstream events such as secretion or gene activation. One coulddrive [Ca2+]c signals with either InsP3 or extracellular Ca2+; the latterstrategy8 also requires elevating the permeability of the plasmamembrane to Ca2+. We chose to use InsP3 pulses because theymimic the natural cycle of calcium release from internal stores, work
O
O P (OPM)2
O
OO
PP
O
(PMO)2
O
(PMO)2
O
OCH3
O
O P (O-)2
O
OO
PP
O
(-O)2
O
(-O)2
O
OCH3
O
O P (O-)2
O
OO
PP
O
(-O)2
O
(-O)2
O
OCH3
HO
ODMNB
ODMNBOMe
MeO
NO2
diffusion
PIP2
IP3
PM =
[Ca2+]c
DMNB =
UV light
esterases
OH
O P (O-)2
OHO
OO
PP
O
(-O)2
O
(-O)2
HO
cmIP3/PM, 1
cmIP3, 2
mIP3, 3
O
phospholipase C
O
cell functions including gene expression
plasma membrane
Figure 1 Mode of action of the caged, membrane-permeant InsP3 derivative
cmInsP3/PM (cmIP3/PM) (compound 1), the trapped caged molecule (cmInsP3
(cmIP3), compound 2), and 2,3-methoxymethylene-InsP3 (mInsP3, compound 3)
released by photolysis. PM, propionyloxymethyl group; DMNB, 4,5-dimethoxy-2-
nitrobenzyl group.
O
OBz
OO
O
O
OBz
OBzO
BzO
OH
OBzBzO
BzO
O
O P (OR)2
O
OO
PP
O
(RO)2
O
(RO)2
O
OCH3
7
O
OH
OHO
HO
OCH3
10
8 9
O
OH
O
HO
OO
O
OH
OO
O
o
O
OCamp
OO
O
ODMNB
ODMNB ODMNB
myo-inositol
ODMNB
cmIP3
ODMNB
ODMNB
2
HO
1
ODMNB
cmIP3/PMl , m n
11, R = -CH2CH2CN
5 6
e , f
OH
OHHO
HOHO
g , h i
HO
4
a b , c d
j , k
A
Figure 2 Synthesis and biochemical characterization of cmInsP3/PM and its reaction
products. A, Chiral synthesis of cmInsP3/PM, starting from myo-inositol. Bz, benzoyl;
Camp, S-camphanyl. Reagents: a, 2-methoxypropene in acidic dimethylformamide
(DMF), followed by chromatography and crystallization26; b, Bu2SnO, toluene azeotropy,
63% yield; c, DMNB bromide, CsF, DMF; d, S-(−)-camphanic acid chloride, triethylamine,
4-dimethylaminopyridine, then silica gel chromatography and crystallization to separate
the diastereomeric camphanates, 42% of the desired isomer;e, K2CO3, methanol/CH2Cl2;
f, BzCl, pyridine, 80%; g, HSCH2CH2OH, BF3/Et2O; h, BzCl, pyridine, 76%; i, HSCH2CH2OH,
BF3/Et2O, 80%; j, HC(OMe)3, BF3/Et2O, DMF; k, K2CO3, methanol/CH2Cl2, 52%; l,
(NCCH2CH2O)2PN(i-Pr(2, tetrazole; m, t-butyl hydroperoxide, CH2Cl2, 79%; n, NH3,
aqueous methanol; o, EtCOOCH2Br, (i-Pr)2NEt, CH3CN, 12% for steps n + o. B, Binding
to the InsP3R, measured as equivalent picomol of genuine InsP3 (IP3), as a function of
duration of ultraviolet-light-mediated photolysis of 8-pmol aliquots of cminsP3 (cmIP3) in
vitro. The smooth curve and dashed line show the fitted exponential progress curve (see
Methods) and its asymptote, respectively.
Mole
s c
mlP
3 illu
min
ate
d
IP3 e
quiv
ale
nts
pro
duced
UV illumination time (s)
0.75
0.50
0.25
0.000 100 200 300 400 500
500 s
80 s
35 s
15 s
5 s
B

Nature © Macmillan Publishers Ltd 1998
8
letters to nature
938 NATURE | VOL 392 | 30 APRIL 1998
at normal extracellular calcium levels, incorporate the complexrelationship between InsP3 and [Ca2+]c, and may be useful for manyother studies.
Standard techniques for delivering the highly charged InsP3
molecule across cell membranes, such as membrane permeabiliza-tion, microinjection, or patch clamping, would not allow reliablemeasurement of subsequent complex events, such as gene expres-sion, in enough cells. To achieve precise temporal control withoutdisrupting the plasma membrane, we needed a membrane-permeant derivative of caged InsP3, such as cmInsP3/PM (com-pound 1 in Fig. 1). All three phosphates of this compound wereesterified with propionyloxymethyl (PM) groups, which hydrolysein the cytoplasm to produce cmInsP3 (compound 2 in Fig. 1). Free2- and 3-hydroxyl groups are not obligatory9–11 for binding to theInsP3 receptor (InsP3R), so we masked these groups with a methoxy-methylene group, which is relatively small and should not interferewith binding to the InsP3R. Blockage of the 3-hydroxyl shouldprevent the released InsP3 analogue from being phosphorylated byInsP3 3-kinase to inositol 1,3,4,5-tetrakisphosphate. The 6-hydroxylof InsP3 interacts specifically with the InsP3R and is essential10,11 forrelease of calcium, yet is difficult to regenerate from a permeantester, perhaps because the bulky flanking 1- and 5-phosphate groupshinder the hydrolysis12. Therefore we protected the 6-hydroxyl witha photolabile caging group, a 4,5-dimethoxy-2-nitrobenzyl(DMNB) ether13. Ultraviolet-mediated photolysis of the DMNBgroup should be independent of steric shielding by the flankingphosphates and should abruptly switch on biological activitythrough formation of compound 3 (2,3-methoxymethylene-InsP3,or mInsP3). Also, in the absence of ultraviolet light, the ether linkageshould be more resistant to metabolism or hydrolysis than thephosphodiester linkage previously used14 to cage InsP3.
CmInsP3 was synthesized from myo-inositol in 14 steps, thenesterified to produce cmInsP3/PM (Fig. 2A). Binding of cmInsP3 tothe InsP3R (assayed by displacement of 3H-labelled InsP3) was
negligible (,0.5% of binding of real InsP3). However, ultravioletillumination of cmInsP3 progressively released material that boundtightly to the InsP3R (Fig. 2B). The product of exhaustive photolysisbound to the InsP3R equivalently to 75% of an equimolar amount ofreal InsP3. Assuming that mInsP3 was formed at 100% chemicalyield, it is 75% as potent as InsP3, making mInsP3 the most potentsynthetic InsP3 analogue known5. The quantum yield of photolysiswas 0:09 6 0:013. At 365 nm, the uncaging cross-section ofcmInsP3, 450 M−1 cm−1, slightly exceeded the 325 M−1 cm−1 reportedfor an earlier caged InsP3, a P4(5)-1-(2-nitrophenyl)ethyl ester14.
Incubation of 1321N1 astrocytoma cells with 2 mM extracellularcmInsP3/PM for 5, 30 and 60 min resulted in 33 6 5, 201 6 9 and260 6 10 pmol (mean 6 s:e:m:), respectively, of trapped cmInsP3,per million cells. The final values were equivalent to intracellularconcentrations of hundreds of micromolar. The ability of cmInsP3
to accumulate to a much higher concentration inside the cells thanthe concentration of cmInsP3/PM outside the cells confirmed thatcmInsP3 was being trapped by irreversible ester hydrolysis, andimplied that unphotolysed cmInsP3 must be quite stable insideliving cells. The trapped cmInsP3 had no effect on [Ca2+]c even afterprolonged incubation, as monitored15 by the calcium indicatorFluo-3. Subsequent brief exposure of the cells to ultraviolet light(345–355 nm) caused a sudden increase in [Ca2+]c levels whetherextracellular calcium was present or not (Fig. 3a,b), showing thatcalcium was released from internal stores. Ultraviolet illuminationwas ineffective if applied less than two minutes after application ofcmInsP3/PM, as would be expected from the time required for theester to cross membranes and release cmInsP3. We routinely allowed>30 min to ensure complete de-esterification of cmInsP3/PM afterwashing away excess ester. Once cmInsP3 was loaded into cells, itremained well trapped and non-metabolized. At room temperature,an additional incubation time of 8 h in the dark had almost no effecton the size of the subsequent flash-induced [Ca2+]c transient.Incubation for 8 h at 37 8C did weaken the response, but theamplitude could be restored by a roughly threefold increase inexposure to ultraviolet light, indicating that about one-third of thecmInsP3 remained. Other control experiments with the same ormore than ten times stronger ultraviolet light, in the absence orpresence of 100 mM 4,5-dimethoxy-2-nitrobenzyl methyl ether as acontrol for DMNB photolysis byproducts gave no detectable rise in[Ca2+]c levels, either in normal calcium-containing or in calcium-free medium, showing that the response was specific to cmInsP3.CmInsP3/PM behaved similarly in other cell lines, including HeLacells, human embryonic kidney 293 cells, REF-52 fibroblasts, T84colonic epithelial cells, RBL-2H3 rat basophilic leukaemia cells (seebelow), and P388D1 macrophage-like cells, so its biological efficacyseems to be fairly general, at least in cultured mammalian cells.
[Ca2+]c signals are essential for the activation of lymphoid cells,a process involving gene expression, differentiation andproliferation6. Non-invasive loading of cmInsP3/PM into cellsallowed assessment of the effect of different temporal patterns ofInsP3R activation on [Ca2+]c signals and gene expression. We usedactivation of the NF-AT (nuclear factor of activated T cells)transcription factor complex in RBL-2H3 cells as a model system.Increased [Ca2+]c stimulates calcineurin to dephosphorylate pre-existing cytosolic NF-AT proteins (NF-ATc), which then migrateinto the nucleus, bind to nuclear proteins and NF-AT-responseelements, and activate downstream genes. Although NF-ATwas firstcharacterized in lymphocytes as a crucial element in interleukin-2gene expression6, it is widespread in lymphoid cells, including RBLcells7. We assayed NF-AT-driven gene expression at the level of singlecells, using a stably transfected reporter construct in which a trimerof NF-AT-response elements drove expression of the bacterialenzyme b-lactamase. b-Lactamase activity can be assayed with anewly developed membrane-permeant fluorogenic substrate, whichbecomes trapped in individual live cells. In the absence of b-lactamase, the cells fluoresce at 520 nm, whereas expression of the
UV 350 nm0.5 s each
CCh200 µM
Iono5 µM
a
fluo-3
F/F
0fluo-3
F/F
0
5
4
3
2
1
00 500 1,000 1,500 2,000
UV 350 nm0.5 s each CCh
200 µMIono
5 µM
5
4
3
2
1
00 500 1,000 1,500
Time (s)
b
Figure 3 Cytosolic calcium transients evoked by photolysis of cmInsP3 in 1321N1
astrocytoma cells. Transients were evoked in HBS medium containing normal
levels of calcium (a) and in calcium-freeDPBS saline containing 0.5mM EGTA (b).
UV 350nmdenotes uncaging flashesdelivered through the microscope objective
in which the excitation filter was switched for 0.5 s to a 345–355nm bandpass.
CCh, carbachol; Iono, ionomycin.

Nature © Macmillan Publishers Ltd 1998
8
letters to nature
NATURE | VOL 392 | 30 APRIL 1998 939
Figure 4 Expression of the b-lactamase reporter gene induced by uncaged
cmInsP3/PM. a, Unstimulated cells. b, Cells stimulated by 1 mM ionomycin for
20min at 37 8C. c, d, Cells loaded with 10 mM cmInsP3/PM were illuminated with
four pulses each of ultraviolet light of 0.3, 0.6,1 and 1.4 s duration, spaced 1min (c)
or 3min (d) apart. The cellswere then incubated for 3.5 h at 37 8C, and then stained
for b-lactamase gene expression16. The ratio of 420–460 nm to 512–558nm
emissions while exciting at 392–408 nm is displayed in false colours calibrated
by the colour scale at the right, which also indicates the threshold ratio (0.35) for a
cell to be scored as positive for reporter gene expression.
0
10
20
30
c d e gf
hf
79 89 79 89
0 10
F/F0 1
2
3Fluo -3
b c d
e
0.80.3 1.5 s
a b
a
g
Cells
activa
ted (%
)
Time (min) 10.4s UV 0.3 0.8 1.5s 0.3 0.8 1.5s0.3 0.8 1.5s
103 µW per cm2103 µW per cm2
Antigen Antigen Antigen Stimulus protocol
flashes
Figure 5 [Ca2+]c levels measured by Fluo-3 fluorescence and NF-AT-driven b-
lactamase gene expression evoked by different temporal patterns of photolysing
the same total amount of cmInsP3 in RBL cells. a–g, The time and Fluo-3 intensity
scales at the upper left apply to all traces. a, 3:5 3 102 8 einstein⋅cm2 2 s2 1 or
11.4mWcm−2 was delivered for 10.4 s where indicated. b–e,12 Pulses of the same
intensity were delivered in three groups of four flashes, each of 0.3, 0.8, and 1.5 s
duration, spaced 30 s (b), 1min (c), 2min (d), and 8min (e) apart. f, Continuous
illumination with (2.42, 2.7, or 3.1) 3 102 10 einstein⋅cm2 2 s2 1, each for 7min,
represented by dotted, dashed, and solid lines, respectively. g, 50 ngml−1 DNP-
BSA was added at the point indicated by the arrow. Traces in f, g are from
representative single cells, whereas traces in a–e are averages of 25 cells
because the responses were much more homogeneous and synchronous. g,
The average frequency of spikes of amplitude DF=F0 . 0:5 was 2.09, 0.66, and
0.39min−1 at the left, centre and right, respectively. h, NF-AT-driven b-lactamase
gene expression. Percentage of cells is shown with suprathreshold b-lactamase
activity resulting from protocols a–g.

Nature © Macmillan Publishers Ltd 1998
8
letters to nature
940 NATURE | VOL 392 | 30 APRIL 1998
enzyme cleaves the substrate and changes the fluorescence maximumto 447 nm16. As this new reporter gene assay leaves the cells fullyviable, we could use fluorescence-activated cell sorting to isolate asubclone of RBL cells in which NF-AT-driven gene expression wasmaximally responsive to sustained elevation of [Ca2+]c levels. Figure4 shows pseudocolour images of b-lactamase expression levels inthis subclone under various stimulation conditions. Hues from blueto magenta indicate low to high levels of NF-AT-driven expressionof b-lactamase, monitored by ratios of emissions at 447 nm and520 nm. The responsiveness of NF-AT activity to [Ca2+]c levels wasshown by the contrast between the blue-green pseudocolour ofunstimulated cells (Fig. 4a) and the predominant magenta pseudo-colour of cells treated with a calcium ionophore (Fig. 4b). Uncagingof cmInsP3 with 16 ultraviolet pulses spaced 1 min apart causedsignificant gene activation (a 3.5-fold increase in ratio, correspond-ing to a pseudocolour of orange or redder) in ,30% of the cells (Fig.4c), whereas the same flashes spaced 3 min apart only activated,10% of the cells (Fig. 4d).
To confirm and extend this preliminary finding of frequencyselectivity, we used a wider variety of uncaging protocols and madeparallel measurements of [Ca2+]c in the experiments shown in Fig. 5.For Fig. 5a, the ultraviolet light was applied in a single pulse of11.4 mW per cm2 that lasted 10.4 s, enough to photolyse ,30% ofthe loaded cmInsP3. This generated a big [Ca2+]c spike, whichgradually returned to the resting level in ,5 min. For Fig. 5b–e,the same intensity of ultraviolet light was applied in four pulses of0.3 s, then four pulses of 0.8 s, and finally four pulses of 1.5 sduration; flashes were spaced 30 s (Fig. 5b), 1 min (Fig. 5c), 2 min(Fig. 5d), or 8 min (Fig. 5e) apart. Each flash produced a separatesynchronized [Ca2+]c spike; the increasing durations in the secondand third groups of four pulses acted to maintain roughly constantspike amplitudes. In Fig. 5f, dim continuous illumination of 79, 89and 103 mW per cm2 was applied for 7 min each, with no gaps. Eachof the three 7-min episodes contained enough ultraviolet light tophotolyse ,10% of the initial cmInsP3. Even though the cumulativeamount of mInsP3 released in this protocol was similar to theamount of mInsP3 released in the other protocols, and the overallduration of mInsP3 release was intermediate between that of Fig. 5cand d, individual cells (for example, Fig. 5f) gave at most a few[Ca2+]c transients, typically three to four, before subsiding. Aroughly optimal dose of a relatively physiological agonist, surfaceimmunoglobulin E crosslinked by dinitrophenylated albumin,evoked oscillations of extremely heterogeneous amplitude andfrequency17,18 (Fig. 5g). Figure 5h summarizes the gene expressionresulting from these different protocols. The most effective protocolused 12 flashes spaced 1 min apart; this activated NF-AT in 26% ofthe cells. This protocol was almost as effective as maintainingelevated [Ca2+]c levels for 15 min with a calcium ionophore; thisactivated 28% of the cells. Spacings of 0.5 min and 2 min were eachabout half as effective as spacings of 1 min. The single 10.4 s pulse,the 12 pulses spaced 8 min apart, and the dim continuous illumina-tion for 21 min all activated NF-AT in only 3–5% of cells. Wheneither the cmInsP3/PM or the ultraviolet illumination, or both, werewithheld, negligible activation (,1%) resulted. Antigen stimula-tion was only modestly effective (6%), perhaps because the hetero-geneous calcium responses matched optimal patterns in only asmall fraction of the cells.
These results indicate that one of the best defined signal-trans-duction cascades into the nucleus may be tuned to the frequency of[Ca2+]c spikes. The single burst of InsP3 or excessively frequentoscillations of InsP3 (Fig. 5a, b) may have failed to maintain elevated[Ca2+]c levels for enough time19,20. The lower-frequency oscillations(Fig. 5d,e) may have allowed too much time for rephosphorylationand nuclear exit of NF-ATc between pulses19. Slow, steady produc-tion of InsP3 (Fig. 5f) was remarkably ineffective at increasing[Ca2+]c levels for prolonged periods, perhaps because of InsP3Rdesensitization21,22. This observation may help to explain why cells
generate oscillations in [Ca2+]c and perhaps InsP3 as well2,18. Cellsmight only be able to generate a limited total amount of InsP3,because InsP3 biosynthesis use many ATP molecules and depletesstores of the scarce lipid phosphatidylinositol-4,5-bisphosphate.Repetitive pulses (Fig. 5c) were much better than continuousdribbling of the same total amount of InsP3 (Fig. 5f) for producingbig and reliable [Ca2+]c spikes, which in turn optimally activated atleast one prototypic calcium-responsive transcription factor (seealso ref. 8). Other genes20 and cell functions23 dependent on InsP3
and [Ca2+]c should also be investigated by this new, convenientmethod to activate the InsP3R under spatiotemporal control in largepopulations of fully intact cells. M. . . . . . . . . . . . . . . . . . . . . . . . . . . . . . . . . . . . . . . . . . . . . . . . . . . . . . . . . . . . . . . . . . . . . . . . . . . . . . . . . . . . . . . . . . . . . . . . . . . . . . . . . . . . . . . . . . . . . . . . .
Methods
Synthesis of cmInsP3 and cmInsP3/PM. See Fig. 2A. Fast atom bombard-ment mass spectroscopy showed an exact mass for compound 1 þ Csþ of1,305.1481 compared with 1,305.1444 calculated for C41H62O32NP3 þ Csþ. 1Hand 31P magnetic resonance spectra were also satisfactory.Determination of the photolysis quantum yield of cmInsP3 and affinity of
binding of mInsP3 to the InsP3R. 1 mM cmInsP3 in Hanks’ balanced salts(HBS) buffer plus 1 mg ml−1 bovine serum albumin and 2 mM 2-mercapto-ethanol was photolysed at 365 nm at 0 8C. Binding of mInsP3 to the InsP3R wasmeasured (InsP3 assay kit, Amersham) at the indicated times. The quantumyield, Q, of the photolysis was calculated from the exponential progresscurve the extinction coefficient (5 3 106 cm2 mol 2 1) of cmInsP3 at 365 nm,and the ultraviolet intensity (1:41 3 102 8 einstein⋅cm2 s 2 1) measured byferrioxalate actinometry24.Determination of loadingefficiencyof cmInsP3/PM. Confluent monolayersof astrocytoma cells in 35-mm tissue culture dishes were incubated with 2 mMcmInsP3/PM for the indicated time. After washing and 30 min incubation, thesaline was aspirated and the cells were quenched with 0.5 ml ice-cold perchloricacid containing 2 mM EDTA and 20 mM HEPES. The cmInsP3 was thenthoroughly photolysed at 0 8C with 365 nm ultraviolet light. The sampleswere neutralized with KOH, centrifuged to remove KClO4, and assayed forInsP3 normalized to the number of cells. Experiments were done in duplicateon separate dishes of cells.Monitoring cytosolic Ca2+ transients produced by uncaging cmInsP3.
1321N1 astrocytoma cells were loaded with cmInsP3/PM (2 mM) andFluo-3/AM (2 mM) in HBS containing 0.05% Pluronic F-127 for 1 h at roomtemperature. Cells were then washed and incubated for another 30 min. Fluo-3intensity15 (F, 480 6 15 nm excitation, 535 6 22:5 nm emission) was moni-tored every 7 s by digital-imaging microscopy and was plotted, after back-ground subtraction, as a ratio against the Fluo-3 intensity at the resting calciumlevel (F0). Ultraviolet pulses for the experiments of Fig. 3 were from a 150 Wxenon arc, attenuated by a neutral density filter of 4% nominal transmission,filtered by a 345–355 nm bandpass filter, and delivered through a ×40/1.3 NAoil-immersion objective. Typically, at least 13 cells were averaged, and theresults shown are representative of three experiments. The same procedure wasused for the RBL cells transfected with the reporter gene, except that thecmInsP3/PM and Fluo-3/AM concentrations were 6 mM and 1 mM, respectively,365 nm ultraviolet light was delivered to the entire dish of cells from a mercurylamp clamped above the stage of the inverted microscope, and the [Ca2+]c
responses of at least 25 cells were averaged. The short uncaging pulses of11.4 mW per cm2 or 3:5 3 102 8 einstein⋅cm 2 2 s−1 were gated by an electronicshutter. The [Ca2+]c traces shown were obtained at room temperature.Responses at 37 8C to uncaging pulses were essentially the same as shown,and the asynchronous oscillations in response to the continuous illuminationlasted a few more cycles but still terminated well before the end of the first 7 minof exposure to ultraviolet light.Generation of an RBL cell line stably incorporating the NF-AT–b-lactamase
transcriptional reporter. The pZeo–NF-AT–BLA vector was constructed bycloning a trimer of NF-AT-response-element promoters25 upstream of acytoplasmic form of b-lactamase16. This construct was made using thepZeoSV (Invitrogen) expression vector minus its SV40 promoter. RBL-2H3cells were transfected by electroporation with pZeo–NF-AT–BLA DNA andselected in RPMI-1640 medium with 10% fetal bovine serum and 250 mg ml−1
zeocin for 2 weeks. The stably transfected population of RBL cells was

Nature © Macmillan Publishers Ltd 1998
8
letters to nature
NATURE | VOL 392 | 30 APRIL 1998 941
subcloned by stimulating with 1 mM ionomycin for 3 h, vital staining with themembrane-permeant b-lactamase substrate CCF2/AM16, and fluorescence-activated cell sorting. The best clone gave 95–100% b-lactamase-positivecells with such stimulation and was used for all the subsequent studies onRBL cells.Uncaging cmInsP3 and measurement of reporter gene expression. TheRBL cells were loaded with 10 mM cmInsP3/PM for 30 min (Fig. 4) or with6 mM ester for 1 h (Fig. 5h), and were then incubated in ester-free medium for0.5 h at room temperature. Uncaging of cmInsP3 was performed at 37 8C inculture medium in a sealed thermostated perfusion chamber (Bioptechs,Butler, PA) with the same shuttered mercury lamp as for the [Ca2+]c measure-ments. The cells were left for 3.5 h at 37 8C, loaded for 30 min at roomtemperature with 5 mM of the b-lactamase substrate CCF2/AM in HBScontaining 0.05% Pluronic F-127, and finally washed and incubated for30 min at room temperature. b-Lactamase expression was scored by excitingat 392–408 nm wavelength and viewing the ratio of 420–460 to 512–558 nmemissions16. A charge-coupled-device camera (Photometrics) and ratio-imaging software (Metafluor, Universal Imaging) were used to obtain the datashown in Fig. 4 and to score borderline cells for Fig. 5h. Cells whose 420–460 nm to 512–558 nm ratio was .0.35, that is, 2.3 times that of control non-stimulated cells, were counted as activated. Over 200 cells were counted for eachexperiment, and the data shown in Fig. 5h are averages of three separateexperiments. Over 1,200 cells were counted for each stimulation conditionshown in Fig. 4.Control stimuli for gene expression. For exposures to ultraviolet light in theabsence of cmInsP3/PM, we used the uncaging protocols of Fig. 5b or Fig. 5c.Ionomycin (1 mM) treatments at 37 8C were terminated by washing with freshmedium containing 5 mg ml−1 bovine serum albumin to sequester the iono-phore. The cells were then incubated with 1.3 mM Ca2+ (Fig. 4b) or 3 mMEGTA. In the latter case, 15 and 30 min incubations with ionophore activatedb-lactamase in 28 6 5 and 65 6 9% of the cells, respectively. To stimulate withantigen, the RBL cells were passively sensitized for 12 h with monoclonalmurine IgE antibodies against dinitrophenyl (DNP) (Sigma). The cells werewashed five times with fresh medium and incubated at 37 8C for 45 min beforeantigen stimulation. Dinitrophenylated bovine serum albumin (DNP-BSA,Calbiochem) was added at a final concentration of 50 or 500 ng ml−1.50 ng ml−1 DNP-BSA caused the highest degree (in both amplitude andduration) of intracellular calcium mobilization, though the calcium transientsin individual cells were heterogenous. 500 ng ml−1 DNP-BSA caused negligiblemobilization of intracellular calcium and activated b-lactamase in only2:1 6 0:9% of cells.
Received 5 December 1997; accepted 6 March 1998.
1. Berridge, M. J. Inositol triphosphate and calcium signalling. Nature 361, 315–325 (1993).2. Tsien, R. W. & Tsien, R. Y. Calcium channels, stores, and oscillations. Annu. Rev. Cell Biol. 6, 715–760
(1990).3. Jacob. R. Calcium oscillations in electrically nonexcitable cells. Biochim. Biophys. Acta 1052, 427–438
(1900).4. Fewtrell, C. Ca2+ oscillations in non-excitable cells. Annu. Rev. Physiol. 55, 427–454 (1993).5. Potter, B. V. L. & Lampe, D. Chemistry of inositol lipid mediated cellular signaling. Angew. Chemie Int.
Edn Engl. 34, 1933–1972 (1995).6. Crabtree, G. R. & Clipstone, N. A. Signal transmission between the plasma membrane and nucleus of
T lymphocytes. Annu. Rev. Biochem. 63, 1045–1083 (1994).7. Hutchinson, L. E. & McCloskey, M. A. FceRI-mediated induction of nuclear factor of activated T-cells.
J. Biol. Chem. 270, 16333–16338 (1995).8. Dolmetsch, R. E., Xu, K. & Lewis, R. S. Calcium oscillations increase the efficacy and specificity of gene
expression. Nature 392, 933–936 (1998).9. Hirata, M. et al. Stereospecific recognition of inositol 1,4,5-triphosphate analogs by the phosphatase,
kinase, and binding proteins. J. Biol. Chem. 265, 8404–8407 (1990).10. Hirata, M., Watanabe, Y., Yoshida, M., Koga, T. & Ozaki, S. Roles for hydroxyl groups of D-myo-
inositol 1,4,5-triphosphate in the recognition by its receptor and metabolic enzymes. J. Biol. Chem.268, 19260–19266 (1993).
11. Kozikowski, A. P., Ognyanov, V. I., Fauq, A. H., Nahorski, S. R. & Wilcox, R. A. Synthesis of 1D-3-deoxy-, 1D-2,3-dideoxy-, and 1D-2,3,6-trideoxy-myo-inositol 1,4,5-trisphosphate from quebrachitol,their binding affinities, and calcium release activity. J. Am. Chem. Soc. 115, 4429–4434 (1993).
12. Li, W.-h., Schultz, C., Llopis, J. & Tsien, R. Y. Membrane-permeant esters of inositol polyphosphates,chemical synthesis and biological applications. Tetrahedron 53, 12017–12040 (1997).
13. Adams, S. R. & Tsien, R. Y. Controlling cell chemistry with caged compounds. Annu. Rev. Physiol. 55,755–784 (1993).
14. Walker, J. W., Feeney, J. & Trentham, D. R. Photolabile precursors of inositol phosphates. Preparationand properties of 1-(2-nitrophenyl)ethyl esters of myo-inositol 1,4,5-trisphosphate. Biochemistry 28,3272–3280 (1989).
15. Kao, J. P. Y., Harootunian, A. T. & Tsien, R. Y. Photochemically generated cytosolic calcium pulses andtheir detection by fluo-3. J. Biol. Chem. 264, 8179–8184 (1989).
16. Zlokarnik, G. et al. Quantitation of transcription and clonal selection of single living cells with b-lactamase as reporter. Science 279, 84–88 (1998).
17. Kuchtey, J. & Fewtrell, C. Subcloning of RBL-2H3 mucosal mast cell line reduces Ca2+ responseheterogeneity as the single-cell level. J. Cell. Physiol. 166, 643–652 (1996).
18. Smith, G. D., Lee, R. J., Oliver, J. M. & Keizer, J. Effect of Ca2+ influx on intracellular free Ca2+ responsesin antigen-stimulated RBL-2H3 cells. Am. J. Physiol. 270, C939–C952 (1996).
19. Timmerman, L. A., Clipstone, N. A., Ho, S. N., Northrop, J. P. & Crabtree, G. R. Rapid shuttling of NF-AT in discrimination of Ca2+ signals and immunosuppression. Nature 383, 837–840 (1996).
20. Dolmetsch, R. E., Lewis, R. S., Goodnow, C. G. & Healy, J. I. Differential activation of transcriptionfactors induced by Ca2+ response amplitude and duration. Nature 386, 855–858 (1997).
21. Hajnoczky, G. & Thomas, A. P. The inositol trisphosphate calcium channel is inactivated by inositoltrisphosphate. Nature 370, 474–477 (1994).
22. Oancea, E. & Meyer, T. Reversible desensitization of inositol trisphosphate-induced calcium releaseprovides a mechanism for repetitive calcium spikes. J. Biol. Chem. 271 17253–17260 (1996).
23. Gu, X. & Spitzer, N. C. Distinct aspects of neuronal differentiation encoded by frequency ofspontaneous Ca2+ transients. Nature 375, 784–787 (1995).
24. Hatchard, C. G. & Parker, C. A. A new sensitive chemical actinometer. II. Potassium ferrioxalate as astandard chemical actinometer. Proc. R. Soc. Lond. A 235, 518–536 (1956).
25. Fiering, S. et al. Single cell assay of a transcription factor reveals a threshold in transcription activatedby signals emanating from the T-cell antigen receptor. Genes Dev. 4, 1823–1834 (1990).
26. Vacca, J. P. et al. The total synthesis of myo-inositol polyphosphates. Tetrahedron 45, 5679–5702(1989).
Acknowledgements. We thank E. A. Dennis for loan of facilities and S. R. Adams, A. Miyawaki, T. J. Rinkand P. A. Negulescu for advice. This work was funded by the NIH and HHMI.
Correspondence and requests for materials should be addressed to R.Y.T.
NMRstructureandmutagenesisof theFADD(Mort1)death-effectordomainMatthias Eberstadt, Baohua Huang, Zehan Chen,Robert P. Meadows, Shi-Chung Ng, Lixin Zheng*,Michael J. Lenardo* & Stephen W. Fesik
Pharmaceutical Discovery Division, Abbott Laboratories, Abbott Park,Illinois 60064, USA* Laboratory of Immunology, National Institutes of Health, Bethesda,Maryland 20892, USA. . . . . . . . . . . . . . . . . . . . . . . . . . . . . . . . . . . . . . . . . . . . . . . . . . . . . . . . . . . . . . . . . . . . . . . . . . . . . . . . . . . . . . . . . . . . . . . . . . . . . . . . . . . . . . . . . . . . . . . . .
When activated, membrane-bound receptors for Fas and tumour-necrosis factor initiate programmed cell death by recruiting thedeath domain of the adaptor protein FADD1 (Mort1; ref. 2) to themembrane. FADD then activates caspase 8 (ref. 3) (also known asFLICE4 or MACH5) through an interaction between the death-effector domains of FADD and caspase 8. This ultimately leads tothe apoptotic response. Death-effector domains and homologousprotein modules known as caspase-recruitment domains6 havebeen found in several proteins1–14 and are important regulators ofcaspase (FLICE) activity and of apoptosis. Here we describe thesolution structure of a soluble, biologically active mutant of theFADD death-effector domain. The structure consists of six anti-parallel, amphipathic a-helices and resembles the overall fold ofthe death domains of Fas15 and p75 (ref. 16). Despite thisstructural similarity, mutations that inhibit protein–proteininteractions involving the Fas death domain have no effect whenintroduced into the FADD death-effector domain. Instead, ahydrophobic region of the FADD death-effector domain that isnot present in the death domains is vital for binding to FLICE andfor apoptotic activity.
As neither the wild-type death-effector domain (DED) ofFADD nor full-length FADD could be obtained in a form thatwas suitable for study by nuclear magnetic resonance (NMR), weprepared several site-directed mutants and screened them for theirability to be expressed as a soluble protein, induce apoptosis andbind to FLICE. On the basis of its high solubility in a monomericform (0.7 mM) and wild-type-like biological activities (Fig. 1),we chose the Phe 25 → Tyr ðF25YÞ mutant protein for structuredetermination.
The structure of the F25Y FADD DED is well defined by the 1,102experimentally derived NMR restraints (Fig. 2a) and consists of sixantiparallel, amphipathic a-helices (Fig. 2b). The a-helices are