document
TRANSCRIPT
© 1999 Macmillan Magazines Ltd
letters to nature
84 NATURE | VOL 399 | 6 MAY 1999 | www.nature.com
corrections
Experimental veri®cationofthequasi-unit-cellmodel ofquasicrystal structurePaul J. Steinhardt, H.-C. Jeong, K. Saitoh, M. Tanaka,E. Abe & A. P. Tsai
Nature 396, 55±57 (1998)..................................................................................................................................Figure 3 of this Letter wrongly shows all cobalt sites as yellow ®lledcircles, indicating that they lie on the same c � 0 level, whereas thetwo lower sites in the ®gure were intended to be open circles,indicating cobalt sites on the c � 1=2 level. A corrected version of the®gure can be found on Nature's website.
ExtremeTh1biasof invariantVa24JaQTcells in type1diabetesS. Brian Wilson, Sally C. Kent, Kurt T. Patton,Tihamer Orban, Richard A. Jackson, Mark Exley,Steven Porcelli, Desmond A. Schatz, Mark A. Atkinson,Steven P. Balk, Jack L. Strominger & David A. Ha¯er
Nature 391, 177±181 (1998)..................................................................................................................................In this Letter, we reported that invariant Va24JaQ T cells frommonozygotic diabetic twins/triplets were reduced in number andproduced only interferon-g on appropriate stimulation, whereasthose cloned from at-risk non-diabetic twins/triplets and controlsproduced both interferon-g and interleukin(IL)-4. We also reported(see our Fig. 4) that 50% (7/14) of high-risk diabetes non-progressors had markedly raised levels of serum IL-4, as measuredby ELISA. However, we now ®nd that measurement of serum IL-4by ELISA is confounded by the presence in some serum samples of aheterophile-like substance(s) that gives false positive estimations forIL-4 by crosslinking the capture and detection antibodies used in theassay1,2. This is not the case when IL-4 is measured in the tissue-culture medium of in vitro activated T cells. Details will be publishedonce the source of error is determined, a method for accuratemeasurement of serum IL-4 is established, and the apparentassociation of production of the heterophile substance and/or IL-4 with diabetic non-progression has been clari®ed. M
1. Redondo, M. et al. Diabetes 48 (suppl. 1) Abstr. (1999).2. Ellis, T. et al. Diabetes 48 (suppl. 1) Abstr. (1999).
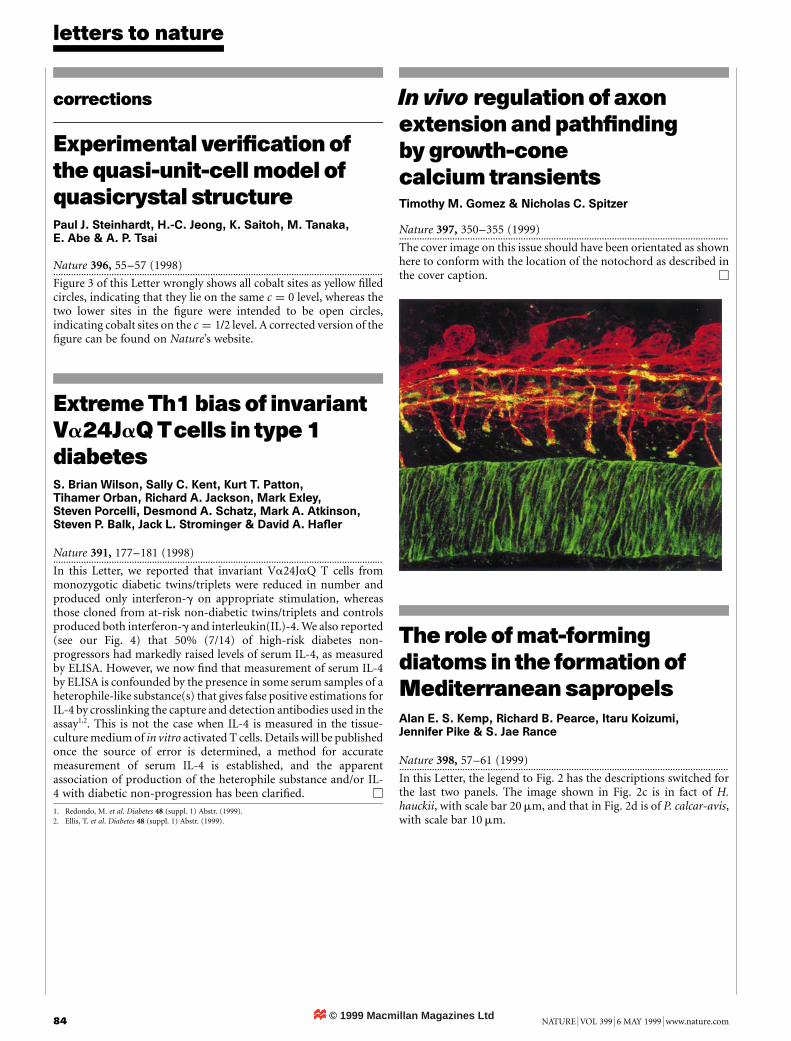
In vivo regulationof axonextensionandpath®ndingbygrowth-conecalcium transientsTimothy M. Gomez & Nicholas C. Spitzer
Nature 397, 350±355 (1999)..................................................................................................................................The cover image on this issue should have been orientated as shownhere to conform with the location of the notochord as described inthe cover caption. M
The roleofmat-formingdiatoms in the formationofMediterraneansapropelsAlan E. S. Kemp, Richard B. Pearce, Itaru Koizumi,Jennifer Pike & S. Jae Rance
Nature 398, 57±61 (1999)..................................................................................................................................In this Letter, the legend to Fig. 2 has the descriptions switched forthe last two panels. The image shown in Fig. 2c is in fact of H.hauckii, with scale bar 20 mm, and that in Fig. 2d is of P. calcar-avis,with scale bar 10 mm.
Nature © Macmillan Publishers Ltd 1998
8
letters to nature
NATURE | VOL 396 | 5 NOVEMBER 1998 | www.nature.com 55
10. Ernst, R., Bodenhausen, G. & Wokaun, A. Principles of Nuclear Magnetic Resonance in One and Two
Dimensions (Oxford Univ. Press, 1990).11. Grant, D. M. & Harris, R. K. (eds) Encyclopedia of Nuclear Magnetic Resonance (Wiley, New York,
1996).
12. Gershenfeld, N. & Chuang, I. L. Bulk spin resonance quantum computation. Science 275, 350±356
(1997).
13. Cory, D. G., Price, M. D. & Havel, T. F. Nuclear magnetic resonance spectroscopy: An experimentallyaccessible paradigm for quantum computing. Physica D 120, 82±101 (1998).
14. La¯amme, R., Knill, E., Zurek, W. H., Catasti, P. & Mariappan, S. V. S. NMR Greenberger-Horne-
Zeilinger states. Phil. Trans. R. Soc. Lond. A 356, 1941±1947 (1998).
15. Cory, D. G. et al. Experimental quantum error correction. Phys. Rev. Lett. 81, 2152±2155 (1998).
16. Chuang, I. L., Gershenfeld, N. & Kubinec, M. Experimental implementation of fast quantumsearching. Phys. Rev. Lett. 18, 3408±3411 (1998).
17. Jones, J. A. & Mosca, M. Implementation of a quantum algorithm on a nuclear magnetic resonance
quantum computer. J. Chem. Phys. 109, 1648±1653 (1998).
18. Chuang, I. L., Vandersypen, L. M. K., Zhou, X. L., Leung, D. W. & Lloyd, S. Experimental realization of
a quantum algorithm. Nature 393, 143±146 (1998).19. Jones, J. A., Mosca, M. & Hansen, R. H. Implementation of a quantum search algorithm on a nuclear
magnetic resonance quantum computer. Nature 393, 344±346 (1998).
20. Brassard, G., Braunstein, S. & Cleve, R. Teleportation as a quantum computation. Physica D 120, 43±
47 (1998).21. Zurek, W. H. Decoherence and the transition from quantum to classical. Phys. Today 44, 36±44 (1991).
22. Schumacher, B. W. Sending entanglement through noisy quantum channels. Phys. Rev. A 54, 2614±
2628 (1996).
23. Barnum, H., Nielsen, M. A. & Schumacher, B. W. Information transmission through a noisy quantum
channel. Phys. Res. A 57, 4153±4175 (1998).24. Poyatos, J. F., Cirac, J. I. & Zoller, P. Complete characterization of a quantum process: the two-bit
quantum gate. Phys. Rev. Lett. 78, 390±393 (1997).
25. Chuang, I. L. & Nielsen, M. A. Prescription for experimental determination of the dynamics of a
quantum black box. J. Mod. Opt. 44, 2455±2467 (1997).
26. Nielsen, M. A. & Caves, C. M. Reversible quantum operations and their application to teleportation.Phys. Rev. A 55, 2547±2556 (1997).
27. Furusawa, A. et al. Unconditional quantum teleportation. Science (in the press).
Acknowledgements. We thank D. Cory, C. Jarzynski, J. Ye and W. Zurek for discussions, the Stable IsotopeLaboratory at Los Alamos for use of their facility, and the National Security Agency and Of®ce of NavalResearch for support.
Correspondence and requests for materials should be addressed to M.A.N. (e-mail: [email protected]).
Experimental veri®cationofthequasi-unit-cellmodel ofquasicrystal structurePaul J. Steinhardt*, H.-C. Jeong², K. Saitoh³, M. Tanaka³,E. Abe§ & A. P. Tsai§
* Department of Physics, Princeton University, Princeton, New Jersey 08544, USA² Department of Physics, Sejong University, Kwangjin, Seoul 143-747, Korea³ Research Institute for Scienti®c Measurements, Tohoku University,
2-1-1 Katahira, Aoba-ku, Sendai 980-8577, Japan
§ National Research Institute for Metals, 1-2-1 Sengen, Tsukuba,Ibaraki 305-0047, Japan. . . . . . . . . . . . . . . . . . . . . . . . . . . . . . . . . . . . . . . . . . . . . . . . . . . . . . . . . . . . . . . . . . . . . . . . . . . . . . . . . . . . . . . . . . . . . . . . . . . . . . . . . . . . . . . . . . . . . . . . .
The atomic structure of quasicrystals1Ðsolids with long-rangeorder, but non-periodic atomic lattice structureÐis oftendescribed as the three-dimensional generalization of the planartwo-tile Penrose pattern2. Recently, an alternative model has beenproposed3±5 that describes such structures in terms of a singlerepeating unit3±5Ðthe three-dimensional generalization of apattern composed of identical decagons. This model is similarin concept to the unit-cell description of periodic crystals, withthe decagon playing the role of a `quasi-unit cell'. But, unlike theunit cells in periodic crystals, these quasi-unit cells overlap theirneighbours, in the sense that they share atoms. Nevertheless, thebasic concept of unit cells in both periodic crystals and quasi-crystals is essentially the same: solving the entire atomic structureof the solid reduces to determining the distribution of atoms inthe unit cell. Here we report experimental evidence for the quasi-unit-cell model by solving the structure of the decagonal quasi-crystal Al72Ni20Co8. The resulting structure is consistent withimages obtained by electron and X-ray diffraction, and agreeswith the measured stoichiometry, density and symmetry of thecompound. The quasi-unit-cell model provides a signi®cantlybetter ®t to these results than all previous alternative models,including Penrose tiling.
The fact that the entire structure reduces to a single repeating unitmeans that quasicrystals have a simplicity more like that of crystalsthan previously recognized. The quasi-unit-cell picture also sug-gests reasons why quasicrystals may form instead of crystals undersome conditions. For the two-dimensional analogue, a patterncomposed of overlapping decagonal quasi-unit cells, Gummelt3
and Steinhardt and Jeong4,5 have proved that the quasicrystalpattern is uniquely forced if decagons only overlay according tothe rules shown in Fig. 1a. Steinhardt and Jeong4,5 have furtherproved that the quasi-unit-cell structure can arise simply by max-imizing the density of a chosen cluster of atoms. If one imagines thatthe atomic cluster is energetically preferred, then the quasicrystalcould be the ground-state con®guration as minimizing the freeenergy maximizes the cluster density. Establishing the correspon-dence between quasi-unit cells and real atomic structures opens thedoor to theoretical and empirical tests of these notions.
The quasi-unit-cell and Penrose-tile pictures are examples of real-space descriptions of quasicrystals in which the structure is de®nedby decorating each quasi-unit cell or each type of tile identically.Some Penrose-tile models are based on the two-tile rhombus orkite-and-dart sets; others are based on the six-tile pentagonal set. Inthe hyperspace description, the quasicrystal is viewed as a projectionfrom a higher-dimensional periodic, hypercubic lattice and theatomic decoration is de®ned in terms of atomic surfaces in thehigher-dimensional space (®ve or six dimensions) which projectinto point atoms in three dimensions6. The surfaces may becontinuous, discontinuous, or even fractal. Depending on thesurfaces, the surfaces may produce a structure equivalent to dec-orating all tiles (or quasi-unit cells) identically or to decorating tilesdifferently depending on their local environment. Although thedescriptions are mathematically related, the quasi-unit-cell pictureis simpler in practice: it is much easier to solve for the structure byconsidering atomic rearrangements within a single quasi-unit cell inreal, three-dimensional space than by considering simultaneouslydecorations or two or more tiles or by imagining surfaces in ®ve orsix dimensions.
To test the quasi-unit-cell hypothesis, we consider Al72Ni20Co8,one of the best-characterized quasicrystal materials. Al72No20Co8 isan example of a decagonal phase; that is, a structure consisting of aperiodic stack of ten-fold symmetric quasiperiodically orderedlayers. Viewed along the periodic axis, the solid has the samesymmetry as a Penrose tiling or an overlapping decagon structure.Hence it can be modelled as a columnar stacking of prisms with theshapes of Penrose tiles or decagons. Although quasicrystalline Al±Ni±Co has been studied for nearly a decade, deciphering itsstructure has been challenging for materials science reasons. Thequasicrystal phase was originally found in a wide compositionalrange7. High-resolution transmission electron microscopy revealeddecagonal cluster columns roughly 2 nm across8. Models of thestructure based on two Penrose rhombus tiles, the Penrose six-tilepentagonal set9,10 and random packing of decagons were proposedon the basis of this early data11. In random packing, there are norules which force the decagons into a unique structure, so in®nitelymany distinct con®gurations are possible. (Similar random clusterpacking models have been developed for other quasicrystallinematerials with decagonal and icosahedral symmetry12±14.) Althoughthe random cluster packing models and the quasi-unit-cell picturediscussed here share the idea of building the atomic structure from arepeating unit, they differ in three important ways: ®rst, the randomdecagon clusters do not cover the entire structure; second, therandom decagon clusters are imperfectly ordered and their arrange-ment is not unique; and third (in most cases), the random decagonclusters contain an atomic con®guration that is ®ve- or ten-foldsymmetric.
But it has recently become apparent that, over most of thecompositional and temperature range, one obtains an inhomoge-neous mixture of structures15±17. The ideal, high-perfection phase
Nature © Macmillan Publishers Ltd 1998
8
letters to nature
56 NATURE | VOL 396 | 5 NOVEMBER 1998 | www.nature.com
has a composition Al72Ni20Co8, signi®cantly different from thesamples on which previous models were based. Whereas earliersamples exhibited diffuse scattering and superlattice re¯ections inthe diffraction patterns, Al72Ni20Co8 does not. The phase is stableand reproducible at temperatures of about 800 8C, and highlyperfect water-quenched samples can be grown as large as 1 mm.So it is only now that precise measurements of the structure,stoichiometry and density of this material have become possible,which provide powerful new constraints on models. Previousmodels fail badly on all counts. (Saitoh has recently developed amodel based on two kinds of pentagon clusters18,19Ðthe ®rst toreproduce the observed breaking of ten-fold symmetry inside the 2-nmclusters and to obtain the correct space-group symmetryÐbut hismodel does not match the measured density or stoichiometry.)
To test the quasi-unit-cell picture, we have performed thefollowing tests.(1) Decagon overlap test. In the quasi-unit-cell picture, the structure
B
A
a b
.
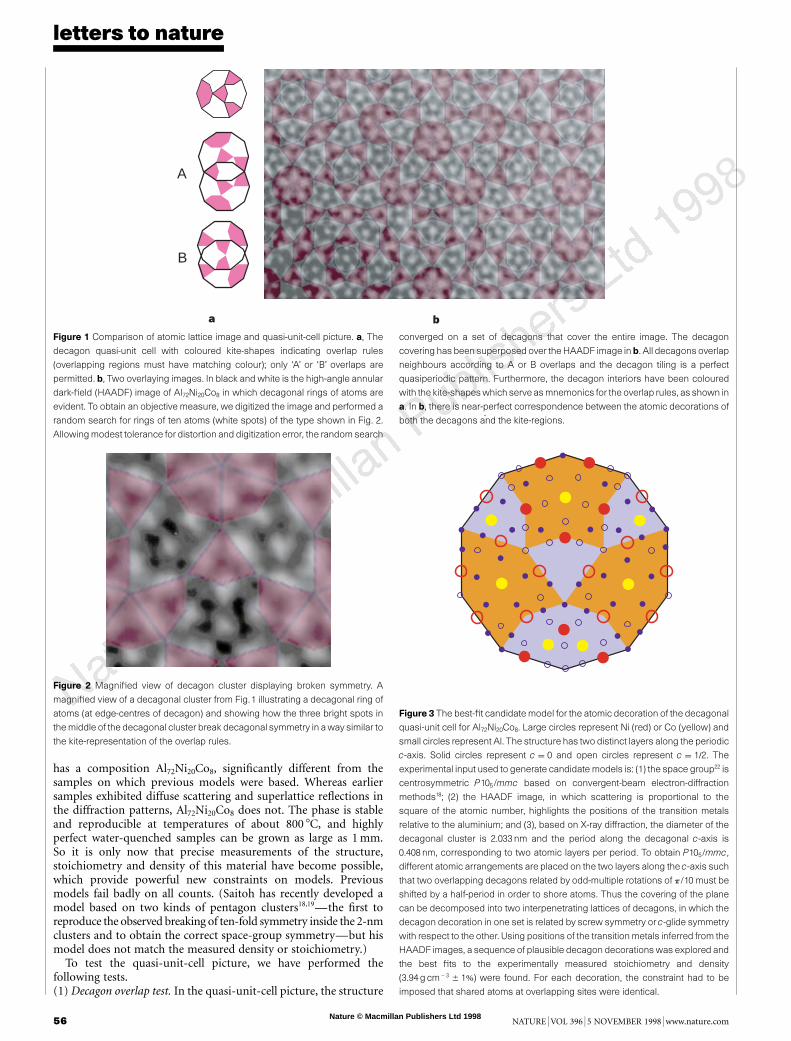
Figure 1 Comparison of atomic lattice image and quasi-unit-cell picture. a, The
decagon quasi-unit cell with coloured kite-shapes indicating overlap rules
(overlapping regions must have matching colour); only `A' or `B' overlaps are
permitted. b, Two overlaying images. In black and white is the high-angle annular
dark-®eld (HAADF) image of Al72Ni20Co8 in which decagonal rings of atoms are
evident. To obtain an objective measure, we digitized the image and performed a
random search for rings of ten atoms (white spots) of the type shown in Fig. 2.
Allowing modest tolerance for distortion and digitization error, the random search
converged on a set of decagons that cover the entire image. The decagon
covering has been superposed over the HAADF image in b. All decagons overlap
neighbours according to A or B overlaps and the decagon tiling is a perfect
quasiperiodic pattern. Furthermore, the decagon interiors have been coloured
with the kite-shapes which serve as mnemonics for the overlap rules, as shown in
a. In b, there is near-perfect correspondence between the atomic decorations of
both the decagons and the kite-regions.
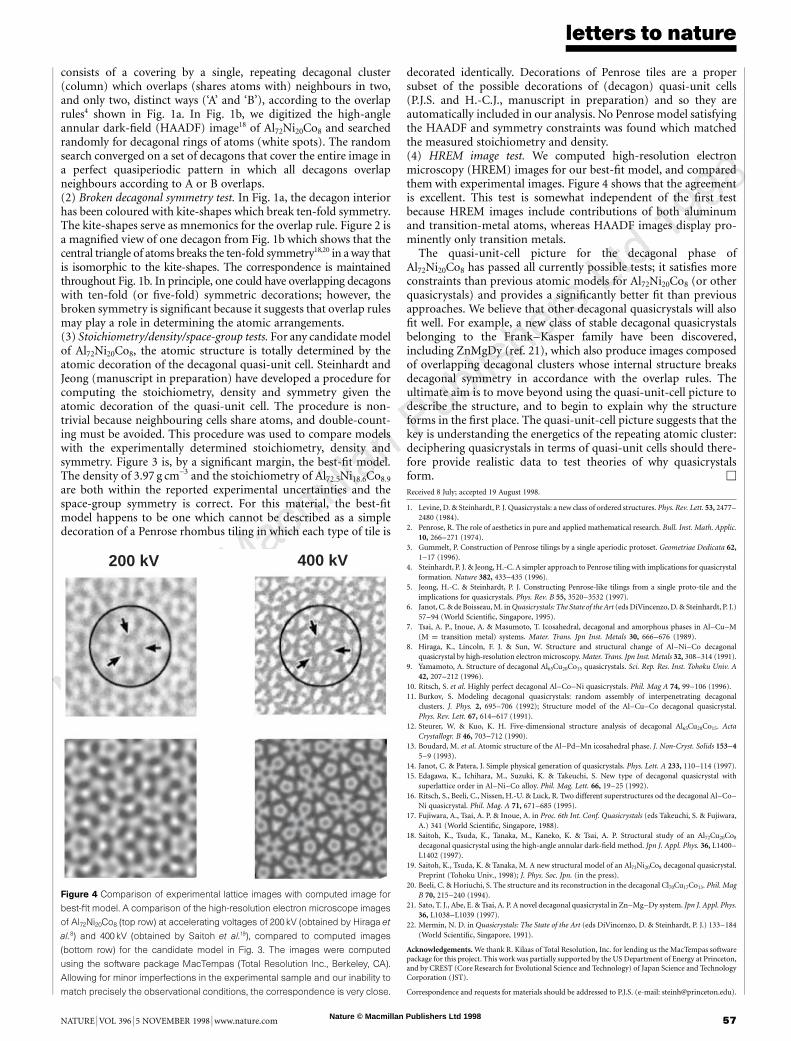
Figure 2 Magni®ed view of decagon cluster displaying broken symmetry. A
magni®ed view of a decagonal cluster from Fig.1 illustrating a decagonal ring of
atoms (at edge-centres of decagon) and showing how the three bright spots in
the middle of the decagonal cluster break decagonal symmetry in a way similar to
the kite-representation of the overlap rules.
Figure 3 The best-®t candidate model for the atomic decoration of the decagonal
quasi-unit cell for Al72Ni20Co8. Large circles represent Ni (red) or Co (yellow) and
small circles represent Al. The structure has two distinct layers along the periodic
c-axis. Solid circles represent c � 0 and open circles represent c � 1=2. The
experimental input used to generate candidate models is: (1) the space group22 is
centrosymmetric P105/mmc based on convergent-beam electron-diffraction
methods18; (2) the HAADF image, in which scattering is proportional to the
square of the atomic number, highlights the positions of the transition metals
relative to the aluminium; and (3), based on X-ray diffraction, the diameter of the
decagonal cluster is 2.033 nm and the period along the decagonal c-axis is
0.408 nm, corresponding to two atomic layers per period. To obtain P105/mmc,
different atomic arrangements are placed on the two layers along the c-axis such
that two overlapping decagons related by odd-multiple rotations of p/10 must be
shifted by a half-period in order to shore atoms. Thus the covering of the plane
can be decomposed into two interpenetrating lattices of decagons, in which the
decagon decoration in one set is related by screw symmetry or c-glide symmetry
with respect to the other. Using positions of the transition metals inferred from the
HAADF images, a sequence of plausible decagon decorations was explored and
the best ®ts to the experimentally measured stoichiometry and density
(3:94g cm2 3 6 1%) were found. For each decoration, the constraint had to be
imposed that shared atoms at overlapping sites were identical.
Nature © Macmillan Publishers Ltd 1998
8
letters to nature
NATURE | VOL 396 | 5 NOVEMBER 1998 | www.nature.com 57
consists of a covering by a single, repeating decagonal cluster(column) which overlaps (shares atoms with) neighbours in two,and only two, distinct ways ( A' and `B'), according to the overlaprules4 shown in Fig. 1a. In Fig. 1b, we digitized the high-angleannular dark-®eld (HAADF) image18 of Al72Ni20Co8 and searchedrandomly for decagonal rings of atoms (white spots). The randomsearch converged on a set of decagons that cover the entire image ina perfect quasiperiodic pattern in which all decagons overlapneighbours according to A or B overlaps.(2) Broken decagonal symmetry test. In Fig. 1a, the decagon interiorhas been coloured with kite-shapes which break ten-fold symmetry.The kite-shapes serve as mnemonics for the overlap rule. Figure 2 isa magni®ed view of one decagon from Fig. 1b which shows that thecentral triangle of atoms breaks the ten-fold symmetry18,20 in a way thatis isomorphic to the kite-shapes. The correspondence is maintainedthroughout Fig. 1b. In principle, one could have overlapping decagonswith ten-fold (or ®ve-fold) symmetric decorations; however, thebroken symmetry is signi®cant because it suggests that overlap rulesmay play a role in determining the atomic arrangements.(3) Stoichiometry/density/space-group tests. For any candidate modelof Al72Ni20Co8, the atomic structure is totally determined by theatomic decoration of the decagonal quasi-unit cell. Steinhardt andJeong (manuscript in preparation) have developed a procedure forcomputing the stoichiometry, density and symmetry given theatomic decoration of the quasi-unit cell. The procedure is non-trivial because neighbouring cells share atoms, and double-count-ing must be avoided. This procedure was used to compare modelswith the experimentally determined stoichiometry, density andsymmetry. Figure 3 is, by a signi®cant margin, the best-®t model.The density of 3.97 g cm-3 and the stoichiometry of Al72.5Ni18.6Co8.9
are both within the reported experimental uncertainties and thespace-group symmetry is correct. For this material, the best-®tmodel happens to be one which cannot be described as a simpledecoration of a Penrose rhombus tiling in which each type of tile is
decorated identically. Decorations of Penrose tiles are a propersubset of the possible decorations of (decagon) quasi-unit cells(P.J.S. and H.-C.J., manuscript in preparation) and so they areautomatically included in our analysis. No Penrose model satisfyingthe HAADF and symmetry constraints was found which matchedthe measured stoichiometry and density.(4) HREM image test. We computed high-resolution electronmicroscopy (HREM) images for our best-®t model, and comparedthem with experimental images. Figure 4 shows that the agreementis excellent. This test is somewhat independent of the ®rst testbecause HREM images include contributions of both aluminumand transition-metal atoms, whereas HAADF images display pro-minently only transition metals.
The quasi-unit-cell picture for the decagonal phase ofAl72Ni20Co8 has passed all currently possible tests; it satis®es moreconstraints than previous atomic models for Al72Ni20Co8 (or otherquasicrystals) and provides a signi®cantly better ®t than previousapproaches. We believe that other decagonal quasicrystals will also®t well. For example, a new class of stable decagonal quasicrystalsbelonging to the Frank±Kasper family have been discovered,including ZnMgDy (ref. 21), which also produce images composedof overlapping decagonal clusters whose internal structure breaksdecagonal symmetry in accordance with the overlap rules. Theultimate aim is to move beyond using the quasi-unit-cell picture todescribe the structure, and to begin to explain why the structureforms in the ®rst place. The quasi-unit-cell picture suggests that thekey is understanding the energetics of the repeating atomic cluster:deciphering quasicrystals in terms of quasi-unit cells should there-fore provide realistic data to test theories of why quasicrystalsform. M
Received 8 July; accepted 19 August 1998.
1. Levine, D. & Steinhardt, P. J. Quasicrystals: a new class of ordered structures. Phys. Rev. Lett. 53, 2477±2480 (1984).
2. Penrose, R. The role of aesthetics in pure and applied mathematical research. Bull. Inst. Math. Applic.
10, 266±271 (1974).
3. Gummelt, P. Construction of Penrose tilings by a single aperiodic protoset. Geometriae Dedicata 62,1±17 (1996).
4. Steinhardt, P. J. & Jeong, H.-C. A simpler approach to Penrose tiling with implications for quasicrystal
formation. Nature 382, 433±435 (1996).
5. Jeong, H.-C. & Steinhardt, P. J. Constructing Penrose-like tilings from a single proto-tile and the
implications for quasicrystals. Phys. Rev. B 55, 3520±3532 (1997).6. Janot, C. & de Boisseau, M. in Quasicrystals: The State of the Art (eds DiVincenzo, D. & Steinhardt, P. J.)
57±94 (World Scienti®c, Singapore, 1995).
7. Tsai, A. P., Inoue, A. & Masumoto, T. Icosahedral, decagonal and amorphous phases in Al±Cu±M
(M � transition metal) systems. Mater. Trans. Jpn Inst. Metals 30, 666±676 (1989).
8. Hiraga, K., Lincoln, F. J. & Sun, W. Structure and structural change of Al±Ni±Co decagonalquasicrystal by high-resolution electron microscopy. Mater. Trans. Jpn Inst. Metals 32, 308±314 (1991).
9. Yamamoto, A. Structure of decagonal Al65Cu20Co15 quasicrystals. Sci. Rep. Res. Inst. Tohoku Univ. A
42, 207±212 (1996).
10. Ritsch, S. et al. Highly perfect decagonal Al±Co±Ni quasicrystals. Phil. Mag A 74, 99±106 (1996).
11. Burkov, S. Modeling decagonal quasicrystals: random assembly of interpenetrating decagonalclusters. J. Phys. 2, 695±706 (1992); Structure model of the Al±Cu±Co decagonal quasicrystal.
Phys. Rev. Lett. 67, 614±617 (1991).
12. Steurer, W. & Kuo, K. H. Five-dimensional structure analysis of decagonal Al65Cu20Co15. Acta
Crystallogr. B 46, 703±712 (1990).
13. Boudard, M. et al. Atomic structure of the Al±Pd±Mn icosahedral phase. J. Non-Cryst. Solids 153±45±9 (1993).
14. Janot, C. & Patera, J. Simple physical generation of quasicrystals. Phys. Lett. A 233, 110±114 (1997).
15. Edagawa, K., Ichihara, M., Suzuki, K. & Takeuchi, S. New type of decagonal quasicrystal with
superlattice order in Al±Ni±Co alloy. Phil. Mag. Lett. 66, 19±25 (1992).
16. Ritsch, S., Beeli, C., Nissen, H.-U. & Luck, R. Two different superstructures od the decagonal Al±Co±Ni quasicrystal. Phil. Mag. A 71, 671±685 (1995).
17. Fujiwara, A., Tsai, A. P. & Inoue, A. in Proc. 6th Int. Conf. Quasicrystals (eds Takeuchi, S. & Fujiwara,
A.) 341 (World Scienti®c, Singapore, 1988).
18. Saitoh, K., Tsuda, K., Tanaka, M., Kaneko, K. & Tsai, A. P. Structural study of an Al72Cu20Co8
decagonal quasicrystal using the high-angle annular dark-®eld method. Jpn J. Appl. Phys. 36, L1400±L1402 (1997).
19. Saitoh, K., Tsuda, K. & Tanaka, M. A new structural model of an Al72Ni20Co8 decagonal quasicrystal.
Preprint (Tohoku Univ., 1998); J. Phys. Soc. Jpn. (in the press).
20. Beeli, C. & Horiuchi, S. The structure and its reconstruction in the decagonal Cl70Cu17Co13. Phil. Mag
B 70, 215±240 (1994).21. Sato, T. J., Abe, E. & Tsai, A. P. A novel decagonal quasicrystal in Zn±Mg±Dy system. Jpn J. Appl. Phys.
36, L1038±L1039 (1997).
22. Mermin, N. D. in Quasicrystals: The State of the Art (eds DiVincenzo, D. & Steinhardt, P. J.) 133±184
(World Scienti®c, Singapore, 1991).
Acknowledgements. We thank R. Kilaas of Total Resolution, Inc. for lending us the MacTempas softwarepackage for this project. This work was partially supported by the US Department of Energy at Princeton,and by CREST (Core Research for Evolutional Science and Technology) of Japan Science and TechnologyCorporation (JST).
Correspondence and requests for materials should be addressed to P.J.S. (e-mail: [email protected]).
200 kV 400 kV
Figure 4 Comparison of experimental lattice images with computed image for
best-®t model. A comparison of the high-resolution electron microscope images
of Al72Ni20Co8 (top row) at accelerating voltages of 200 kV (obtained by Hiraga et
al.8) and 400 kV (obtained by Saitoh et al.19), compared to computed images
(bottom row) for the candidate model in Fig. 3. The images were computed
using the software package MacTempas (Total Resolution Inc., Berkeley, CA).
Allowing for minor imperfections in the experimental sample and our inability to
match precisely the observational conditions, the correspondence is very close.
Nature © Macmillan Publishers Ltd 1998
8
letters to nature
NATURE | VOL 391 | 8 JANUARY 1998 177
type (+/+) sibling of the same sex from the same litter. Locomotion experi-ments were run by an observer blind to the genotype of the animals beingtested. Tests were run from 10 a.m. to 2 p.m. Data are presented asmean 6 s:e:m: Statistical analysis was performed using ANOVA (* P , 0:05mutant compared with wild type).Self-administration. Adult male mice (wild-type and mutant siblings ofparents backcrossed 3 generations to C57 B1/6 inbred mice) were implantedwith a silastic catheter in the jugular vein under halothane anaesthesia andtested in operant cages equipped with two nose-poke detectors, one active, theother inactive (V. Deroche et al., manuscript in preparation). All mice were firsttrained with cocaine (0.8 mg kg−1 per injection, delivered in 50 ml per 2 s, with20-s time-out period) under fixed-ratio (FR) 1 for 2–4 sessions, then underFR2 until stable baseline was reached. Spontaneous nose-poke behaviour,measured in naive, sham-operated mice when both detectors were inactive, waslow and non-discriminatory (2:6 6 0:6 per h), and did not differ betweenb2−/− mice and wild-type mice (not shown). The baseline for each mouse wasdefined as 3 consecutive sessions with less than 30% deviation from the meanand at least 75% active-specific response. During 5 consecutive daily sessions,cocaine was replaced with nicotine (0.03 mg kg−1 per injection, delivered in50 ml per 2 s, 20-s time-out period, under FR 2 schedule) in wild-type mice(n ¼ 5) and b2−/− mice (n ¼ 5). In a second group of wild-type mice (n ¼ 5),cocaine was replaced with saline, forcing the operant responding to extinction.Cocaine and nicotine bitartrate (Sigma) were freshly dissolved in saline beforeeach experiment.Equilibrium binding. Receptor autoradiography was done as described19–21.Briefly, following 30 min preincubation in the appropriate buffer, 14-mmcoronal brain sections from wild-type and b2-mutant mice were incubatedat room temperature for 120 min with 5 nM [3H]WIN35,428 (84.5 Ci mmol−1;NEN)19 or for 60 min with either 1.5 nM SCH23390 (70 Ci mmol−1; NEN)20 or3 nM raclopride (82.4 Ci mmol−1; NEN)21. Slides were washed in ice-cold buffertwice for 1 min (WIN35,428) or for 5 min (SCH23390 or raclopride), andexposed to hyperfilm together with appropriate standards ([3H]microscale;Amersham). Nonspecific labelling was determined in the presence of 30 mMcocaine for the dopamine transporter and 1 mM (+)butaclamol for D1 and D2.Siblings of the same sex and litter were used for all experiments (n, 4–6 per group).Cyclase and tyrosine hydroxylase assays. Dopamine-stimulated cyclaseactivity was measured in striatal homogenates from wild-type and b2-mutantsiblings of the same sex and same litter by following published protocols22 andusing the Amersham Biotrak scintillation proximity assay to determine cAMPlevels. For each animal (n ¼ 6 per group), the striatum from one side of thebrain was used for dopamine-stimulated cyclase assays, and the striatum fromthe other side of the brain was used to measure tyrosine hydroxylase activity asdescribed23. Briefly, after homogenization, samples were incubated with[3H]tyrosine and tetrahydrobiopterin. End products were separated fromunreacted [3H]tyrosine by treatment with activated charcoal. Results arereported as the number of counts incorporated minus background per mgprotein assayed.
Received 7 August; accepted 25 September 1997.
1. Dani, J. A. & Heinemann, S. Molecular and cellular aspects of nicotine abuse. Neuron 16, 905–908 (1996).2. Role, L. W. & Berg, D. K. Nicotinic receptors in the development and modulation of CNS synapses.
Neuron 16, 1077–1085 (1996).3. Picciotto, M. R. et al. Abnormal avoidance learning in mice lacking functional high-affinity nicotine
receptor in the brain. Nature 374, 65–67 (1995).4. Koob, G. F. Drugs of abuse: anatomy, pharmacology and function of reward pathways. Trends
Pharmacol. Sci. 13, 177–184 (1992).5. Stolerman, I. P., Mirza, N. R. & Shoaib, M. Nicotine psychopharmacology: Addiction, cognition and
neuroadaptation. Med. Res. Rev. 15, 47–72 (1995).6. Pontieri, F. E., Tanda, G., Orzi, F. & Di Chiara, G. Effects of nicotine on the nucleus accumbens and
similarity to those of addictive drugs. Nature 382, 255–257 (1996).7. Grady, S., Marks, M. J., Wonnacott, S. & Collins, A. C. Characterization of nicotinic receptor-
mediated [3H]dopamine release form synaptosomes prepared from mouse striatum. J. Neurochem.59, 848–856 (1992).
8. Clarke, P. B., Fu, D. S., Jakubovic, A. & Fibiger, H. C. Evidence that mesolimbic dopaminergicactivation underlies the locomotor stimulant action of nicotine in rats. J. Pharmacol. Exp. Ther. 246,701–708 (1988).
9. Corrigall, W. A., Franklin, K. B., Coen, K. M. & Clarke, P. B. The mesolimbic dopaminergic system isimplicated in the reinforcing effects of nicotine. Psychopharmacology (Berlin) 107, 285–289 (1992).
10. Le Novere, N., Zoli, M. & Changeux, J.-P. Neuronal nicotinic receptor a6 subunit mRNA is selectivelyconcentrated in catecholaminergic nuclei of the rat brain. Eur. J. Neurosci. 8, 2428–2439 (1996).
11. Reavill, C., Walther, B., Stolerman, I. P. & Testa, B. Behavioural and pharmacokinetic studies onnicotine, cytisine and lobeline. Neuropharmacology 29, 619–624 (1990).
12. Risinger, F. O. & Oakes, R. A. Nicotine-induced conditioned place preference and conditioned placeaversion in mice. Pharmacol. Biochem. Behav. 51, 457–461 (1995).
13. Nisell, M., Nomikos, G. G. & Svensson, T. H. Systemic nicotine-induced dopamine release in the rat nucleusaccumbens is regulated by nicotinic receptors in the ventral tegmental area. Synapse 16, 36–44 (1994).
14. Henningfield, J. E., Miyasato, K. & Jasinski, D. R. Cigarette smokers self-administer intravenousnicotine. Pharmacol. Biochem. Behav. 19, 887–890 (1983).
15. Reavill, C., Walther, B., Stolerman, I. P. & Testa, B. Behavioural and pharmacokinetic studies onnicotine, cytisine and lobeline. Neuropharmacology 29, 619–624 (1990).
16. Grace, A. A. & Onn, S. P. Morphology and electrophysiological properties of immunocytochemicallyidentified rat dopamine neurons recorded in vitro. J. Neurosci. 9, 3463–3481 (1989).
17. Luetje, C. W. & Patrick, J. Both a- and b-subunits contribute to the agonist sensitivity of neuronalnicotinic acetylcholine receptors. J. Neurosci. 11, 837–845 (1991).
18. Izenwasser, S., Jacocks, H. M., Rosenberger, J. G. & Cox, B. M. Nicotine indirectly inhibits[3H]dopamine uptake at concentrations that do not directly promote [3H]dopamine release in ratstriatum. J. Neurochem. 56, 603–610 (1991).
19. Kaufman, M. J., Spealman, R. D. & Madras, B. K. Distribution of cocaine recognition sites in monkeybrain: I. In vitro autoradiography with [3H]CFT. Synapse 9, 177–187 (1991).
20. Dawson, T. M., Gehlert, D. R., McCabe, R. T., Barnett, A. & Wamsley, J. K. D1 dopamine receptors inthe rat brain: a quantitative autoradiographic analysis. J. Neurosci. 6, 2352–2365 (1986).
21. Mansour, A. et al. Localization of dopamine D2 receptor mRNA and D1 and D2 receptor binding inthe rat brain and pituitary: an in situ hybridization-receptor autoradiographic analysis. J. Neurosci. 10,2587–2600 (1990).
22. Memo, M. et al. Dopaminergic inhibition of prolactin release and calcium influx induced byneurotensin in anterior pituitary is independent of cyclic AMP system. J. Neurochem. 47, 1689–1695 (1986).
23. Rheinhard, J. F., Smith, G. K. & Nichol, C. A. A rapid and sensitive assay for tyrosine-3-monooxygenase based upon the release of [3H]-H2O and adsorption of [3H]-tyrosine by charcoal.Life Sci. 39, 2185–2189 (1986).
24. Blaha, C. D. et al. Modulation of dopamine efflux in the nucleus accumbens after cholinergicstimulation of the ventral tegmental area in intact, pedunculopontine tegmental nucleus-lesioned,and laterodorsal tegmental nucleus-lesioned rats. J. Neurosci. 16, 714–722 (1996).
25. Calabresi, P., Lacey, M. G. & North, R. A. Nicotinic excitation of rat ventral tegmental neurones in vitrostudies by intracellular recording. Br. J. Pharmacol. 98, 135–140 (1989).
26. Merlo Pich, E. et al. Common neural substrates for the addictive properties of nicotine and cocaine.Science 275, 83–86 (1997).
27. Grahame, N. J., Phillips, T. J., Burkhart-Kasch, S. & Cunningham, C. L. Intravenous cocaine self-administration in the C57BL/6J mouse. Pharmacol. Biochem. Behav. 51, 827–834 (1995).
28. Tessari, M., Valerio, E., Chiamulera, C. & Beardsley, P. M. Nicotine reinforcement in rats with historiesof cocaine self-administration. Psychopharmacology 121, 282–283 (1995).
29. McGehee, D. S., Heath, M. J., Gelber, S., Devay, P. & Role, L. W. Nicotine enhancement of fastexcitatory synaptic transmission in CNS by presynaptic receptors. Science 269, 1692–1696 (1995).
30. Rimondini, R. et al. PEC-60 increases dopamine but not GABA release in the dorsolateral neostriatumof the halothane anaesthetized rat. An in vivo microdialysis study. Neurosci. Lett. 177, 53–57 (1994).
Supplementary information is available on Nature’s World-Wide Web site (http://www.nature.com) oras paper copy form Mary Sheehan at the London editorial office of Nature.
Acknowledgements. We thank M. Memo and D. Uberti for help and advice with DA-stimulated cyclaseassays; M. Epping-Jordan for help with self-administration experiments; P. Sattonnet-Roche for technicalassistance; L. Gold, F. Caine and C. Chiamulera for discussing the behavioural results; and E. Ratti, D. Tristand A. North (GlaxoWellcome) for supporting part of the project. This work was supported by theCollege de France, the Centre National de la Recherche Scientifique, the Association Francaise contre laMyopathie, the Council for Tobacco Research, Biomed and Biotech contract from the Commission of theEuropean Communities, a grant from the Human Frontiers Science Program, a Roux grant from theInstitut Pasteur for C.L., a young investigator award from NARSAD and a grant from NIDA to M.R.P.
Correspondence and requests for materials should be addressed to J.P.C.
ExtremeTh1biasof invariantVa24JaQTcells in type1diabetesS. Brian Wilson*†, Sally C. Kent†‡, Kurt T. Patton‡,Tihamer Orban§, Richard A. Jackson§, Mark Exleyk,Steven Porcelli¶, Desmond A. Schatz#, Mark A. Atkinson#,Steven P. Balkk, Jack L. Strominger* & David A. Hafler‡
* Department of Molecular and Cellular Biology, Harvard University, Cambridge,Massachusetts 02138, USA‡ Center for Neurologic Diseases, Brigham and Women’s Hospital; § ImmunologySection, Joslin Diabetes Center; kCancer Biology Program, Hematology/OncologyDivision, Beth Israel Deaconess Medical Center; ¶ Lymphocyte Biology Section,Division of Rheumatology, Immunology and Allergy, Brigham and Women’sHospital; Harvard Medical School, Boston, Massachusetts 02115, USA# Departments of Pathology and Pediatrics, University of Florida, Gainesville,Florida 32610, USA† These authors contributed equally to this work.. . . . . . . . . . . . . . . . . . . . . . . . . . . . . . . . . . . . . . . . . . . . . . . . . . . . . . . . . . . . . . . . . . . . . . . . . . . . . . . . . . . . . . . . . . . . . . . . . . . . . . . . . . . . . . . . . . . . . . . . .
Type 1 diabetes (insulin-dependent diabetes mellitus, IDDM) is adisease controlled by the major histocompatibility complex(MHC) which results from T-cell-mediated destruction of pan-creatic b-cells1. The incomplete concordance in identical twinsand the presence of autoreactive T cells and autoantibodies inindividuals who do not develop diabetes suggest that other
Nature © Macmillan Publishers Ltd 1998
8
letters to nature
178 NATURE | VOL 391 | 8 JANUARY 1998
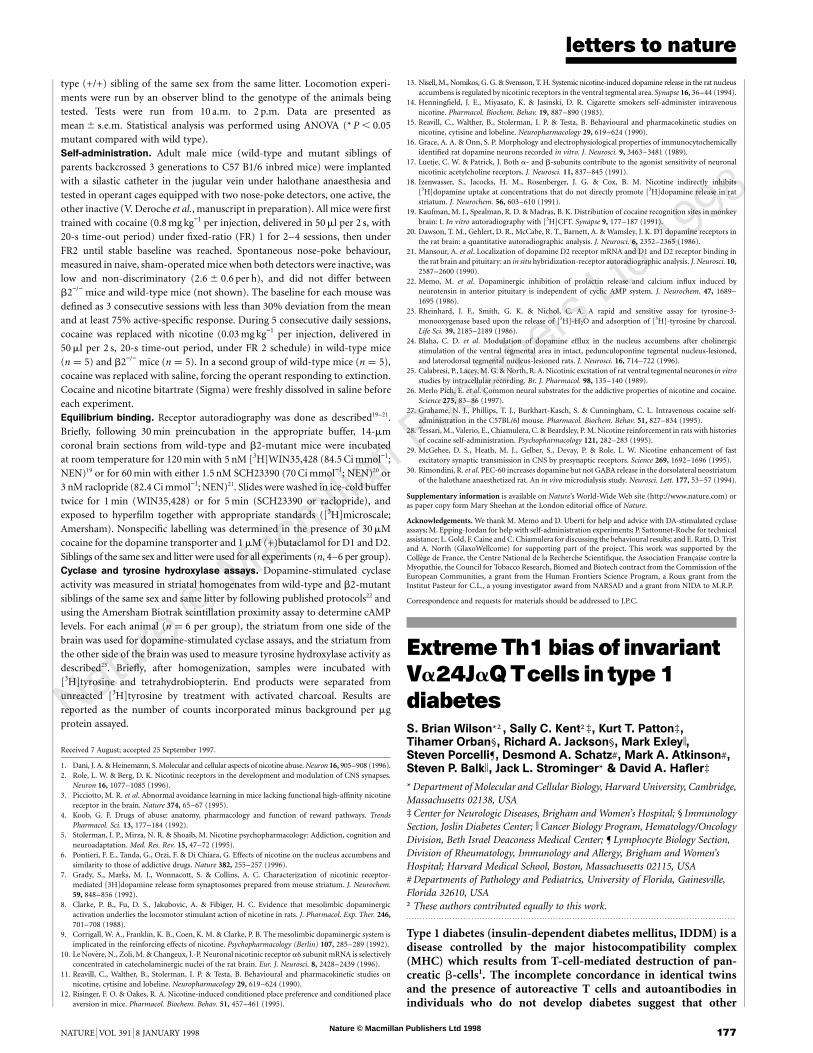
abnormalities must occur in the immune system for disease toresult2,3. We therefore investigated a series of at-risk non-pro-gressors and type 1 diabetic patients (including five identicaltwin/triplet sets discordant for disease). The diabetic siblings hadlower frequencies of CD4−CD8− Va24JaQ+ T cells compared withtheir non-diabetic sibling. All 56 Va24JaQ+ clones isolated fromthe diabetic twins/triplets secreted only interferon (IFN)-g uponstimulation; in contrast, 76 of 79 clones from the at-risk non-progressors and normals secreted both interleukin (IL)-4 andIFN-g. Half of the at-risk non-progressors had high serum levelsof IL-4 and IFN-g. These results support a model for IDDM inwhich Th1-cell-mediated tissue damage is initially regulated byVa24JaQ+ T cells producing both cytokines; the loss of theircapacity to secrete IL-4 is correlated with IDDM.
The discovery of Th1 and Th2 subsets of CD4+ T cells has helpedto explain the cellular basis for the diversity of T-cell responses inautoimmunity4. Th1 cells promote inflammatory cellular immuneresponses and are biased towards secretion of IFN-g, tumour-necrosis factor (TNF)-b and IL-2. Th2 cells are biased towardssecretion of interleukins 4, 5, 6, 10 and 13, induce humoralimmunity, and inhibit Th1 responses. Lymphocyte cytokine pro-duction in type 1 diabetes is known to exhibit a bias towards the Th1cytokine IFN-g (ref. 5), but the cellular mechanisms integrating thedrive to Th1 or Th2 effector cell differentiation are poorly under-stood. In the mouse, one mechanism by which Th2 rather than Th1T-cell bias may be promoted is by activation of invariant (no N/Pnucleotide additions within the CDR3 of the TCRA gene)Va14Ja281 TCR+ NK 1.1+ T cells capable of early secretory burstsof IL-4 and IFN-g. The ligand for this family of T cells is CD1.1 onthe surface of antigen-presenting cells6,7.
CD4−CD8− T cells in humans expressing the invariant Va24JaQT-cell antigen receptor (TCR) which has close sequence homologyto the murine Va14Ja281 TCR have been described8. To determinewhether there could be a relationship between the number ofcirculating CD4−CD8− Va24JaQ+ T cells and type 1 diabetes, wedid a frequency analysis on a set of type 1 diabetic discordantmonozygotic twins and triplets. The numbers of circulating CD4−
CD8− Va24JaQ+ T cells in diabetes-free twins/triplets were com-pared with those present in their siblings with disease. The percen-tage of circulating invariant CD4−CD8− Va24JaQ T cells could bedetermined by multiplying the frequency of invariant Va24JaQsequences present in the total CD4−CD8− Va24+population by thepercentage of CD4−CD8− Va24+ T cells, as measured by flowcytometric analysis (Table 1). No CD4−CD8− Va24JaQ+ T cellswere detected in three diabetics, despite at least three sortingattempts for each subject. The percentage of CD4−CD8−
Va24JaQ+ T cells in a previously disease-free diabetic twin (patient6A; Table 1), studied during the week of IDDM diagnosis, was similarto that in the long-term IDDM twin and in the other diabetics. In allsets of family pairings, the IDDM sibling had markedly lowerpercentages of CD4−CD8− Va24JaQ+ T cells (P ¼ 0:015, pairedsign test using only the discordant twins/triplets data).
To determine whether human Va24JaQ+ T cells were function-ally altered in type 1 diabetics and those at risk for the disease, singleCD4−/CD8− mononuclear cells expressing Va24+ TCR were cloned.The initial analysis was carried out on clones generated from theIDDM non-progressing member of a sibling pair, subject 7A(Table 1). All clones expressed the invariant Va24JaQ junctionalsequences conserving the germ-line-encoded amino acids Va24(-CVVS:) and JaQ (:DRGST-). Eight of ten clones were Vb11+ andtwo were Vb13+. All of the clones were CD4− and uniformlynegative when stained for CD8 b-chain. Surface expression ofCD8aa+ appeared to reflect the activation state, as staining forthis marker reverted to negative 2–3 weeks post-stimulation. AllT-cell clones expressed the human homologue of the murine NK1.1molecule, NKR-P1A (ref. 9), and the C-type lectins encoded by thenatural killer (NK) locus, CD69 and CD94 (data not shown).
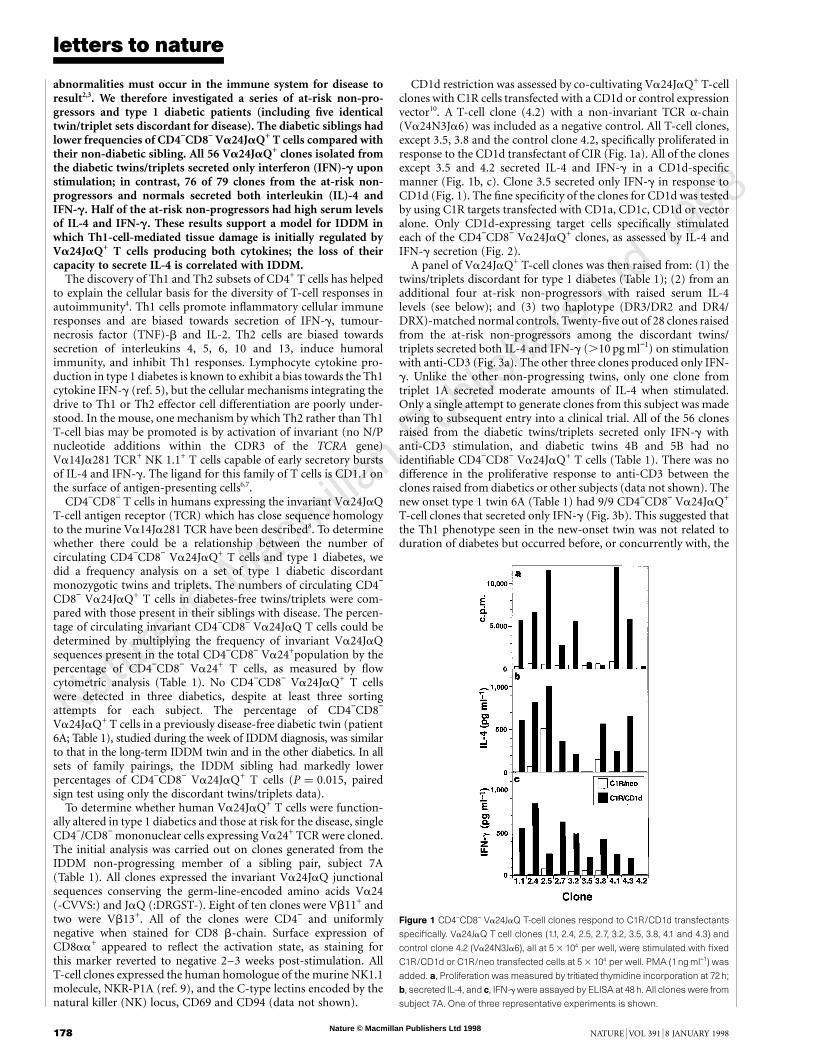
CD1d restriction was assessed by co-cultivating Va24JaQ+ T-cellclones with C1R cells transfected with a CD1d or control expressionvector10. A T-cell clone (4.2) with a non-invariant TCR a-chain(Va24N3Ja6) was included as a negative control. All T-cell clones,except 3.5, 3.8 and the control clone 4.2, specifically proliferated inresponse to the CD1d transfectant of CIR (Fig. 1a). All of the clonesexcept 3.5 and 4.2 secreted IL-4 and IFN-g in a CD1d-specificmanner (Fig. 1b, c). Clone 3.5 secreted only IFN-g in response toCD1d (Fig. 1). The fine specificity of the clones for CD1d was testedby using C1R targets transfected with CD1a, CD1c, CD1d or vectoralone. Only CD1d-expressing target cells specifically stimulatedeach of the CD4−CD8− Va24JaQ+ clones, as assessed by IL-4 andIFN-g secretion (Fig. 2).
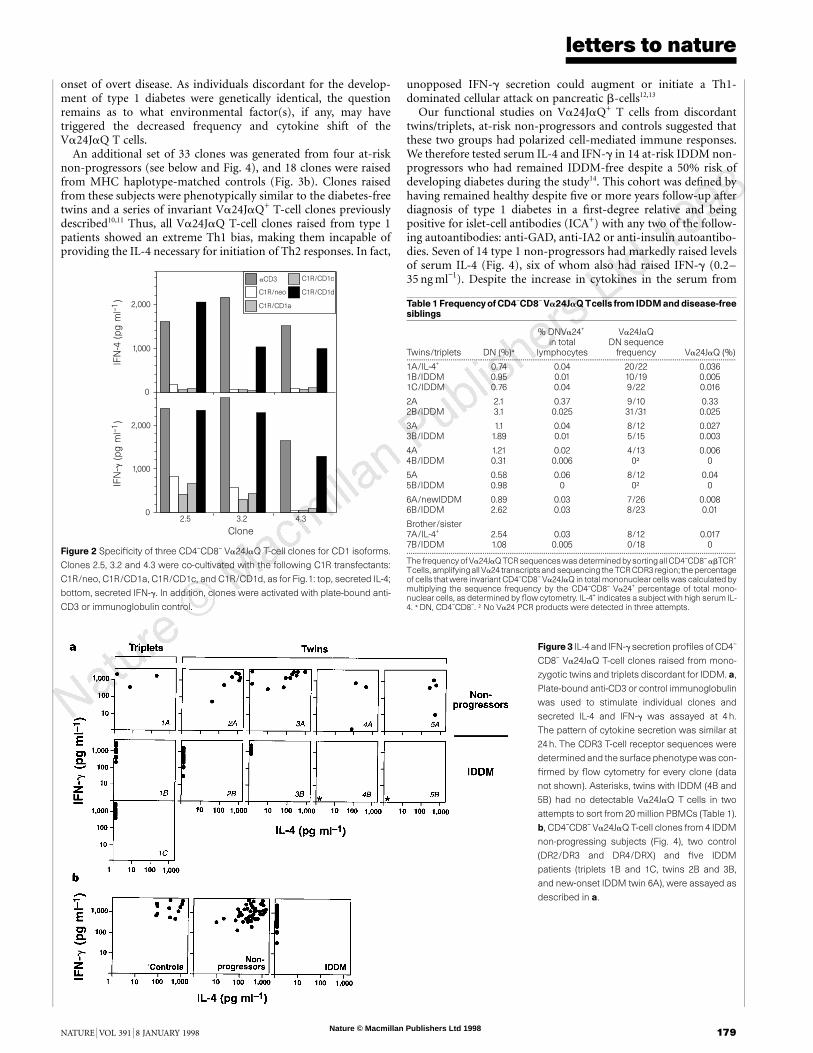
A panel of Va24JaQ+ T-cell clones was then raised from: (1) thetwins/triplets discordant for type 1 diabetes (Table 1); (2) from anadditional four at-risk non-progressors with raised serum IL-4levels (see below); and (3) two haplotype (DR3/DR2 and DR4/DRX)-matched normal controls. Twenty-five out of 28 clones raisedfrom the at-risk non-progressors among the discordant twins/triplets secreted both IL-4 and IFN-g (.10 pg ml−1) on stimulationwith anti-CD3 (Fig. 3a). The other three clones produced only IFN-g. Unlike the other non-progressing twins, only one clone fromtriplet 1A secreted moderate amounts of IL-4 when stimulated.Only a single attempt to generate clones from this subject was madeowing to subsequent entry into a clinical trial. All of the 56 clonesraised from the diabetic twins/triplets secreted only IFN-g withanti-CD3 stimulation, and diabetic twins 4B and 5B had noidentifiable CD4−CD8− Va24JaQ+ T cells (Table 1). There was nodifference in the proliferative response to anti-CD3 between theclones raised from diabetics or other subjects (data not shown). Thenew onset type 1 twin 6A (Table 1) had 9/9 CD4−CD8− Va24JaQ+
T-cell clones that secreted only IFN-g (Fig. 3b). This suggested thatthe Th1 phenotype seen in the new-onset twin was not related toduration of diabetes but occurred before, or concurrently with, the
Figure 1 CD4−CD8− Va24JaQ T-cell clones respond to C1R/CD1d transfectants
specifically. Va24JaQ T cell clones (1.1, 2.4, 2.5, 2.7, 3.2, 3.5, 3.8, 4.1 and 4.3) and
control clone 4.2 (Va24N3Ja6), all at 5 3 104 per well, were stimulated with fixed
C1R/CD1d or C1R/neo transfected cells at 5 3 104 per well. PMA (1ngml−1) was
added. a, Proliferation was measured by tritiated thymidine incorporation at 72h;
b, secreted IL-4, and c, IFN-g were assayed by ELISA at 48 h. All clones were from
subject 7A. One of three representative experiments is shown.
Nature © Macmillan Publishers Ltd 1998
8
letters to nature
NATURE | VOL 391 | 8 JANUARY 1998 179
onset of overt disease. As individuals discordant for the develop-ment of type 1 diabetes were genetically identical, the questionremains as to what environmental factor(s), if any, may havetriggered the decreased frequency and cytokine shift of theVa24JaQ T cells.
An additional set of 33 clones was generated from four at-risknon-progressors (see below and Fig. 4), and 18 clones were raisedfrom MHC haplotype-matched controls (Fig. 3b). Clones raisedfrom these subjects were phenotypically similar to the diabetes-freetwins and a series of invariant Va24JaQ+ T-cell clones previouslydescribed10,11 Thus, all Va24JaQ T-cell clones raised from type 1patients showed an extreme Th1 bias, making them incapable ofproviding the IL-4 necessary for initiation of Th2 responses. In fact,
unopposed IFN-g secretion could augment or initiate a Th1-dominated cellular attack on pancreatic b-cells12,13
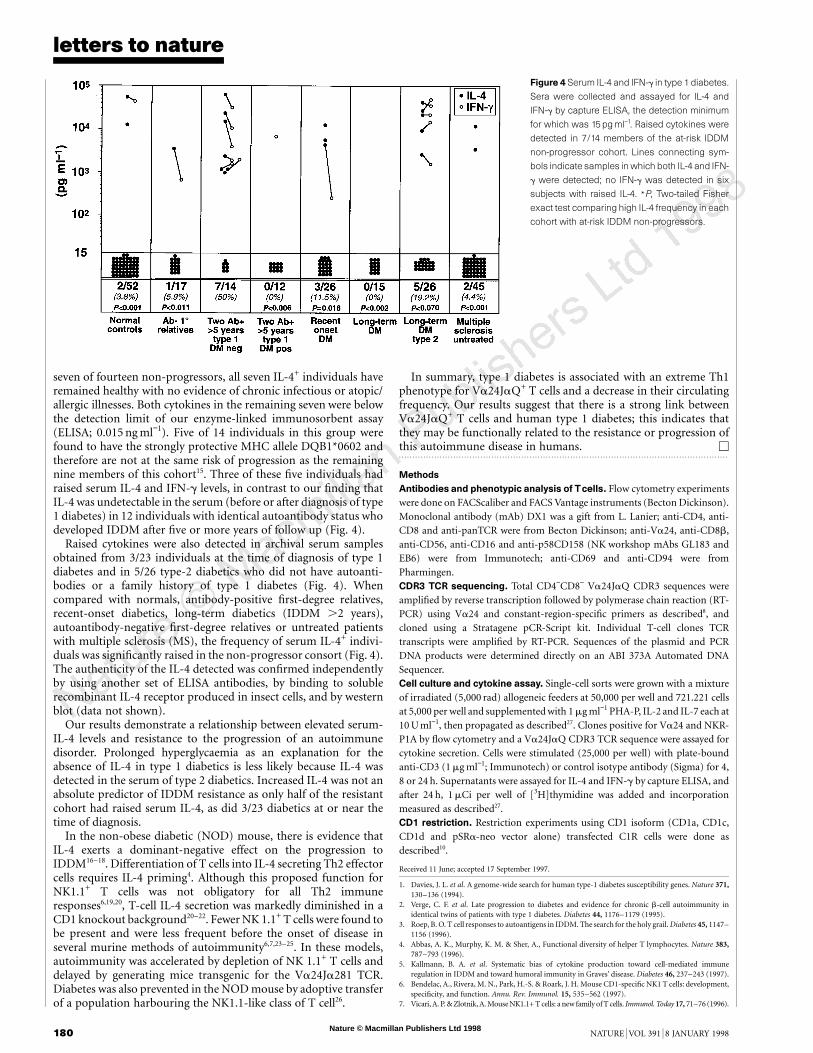
Our functional studies on Va24JaQ+ T cells from discordanttwins/triplets, at-risk non-progressors and controls suggested thatthese two groups had polarized cell-mediated immune responses.We therefore tested serum IL-4 and IFN-g in 14 at-risk IDDM non-progressors who had remained IDDM-free despite a 50% risk ofdeveloping diabetes during the study14. This cohort was defined byhaving remained healthy despite five or more years follow-up afterdiagnosis of type 1 diabetes in a first-degree relative and beingpositive for islet-cell antibodies (ICA+) with any two of the follow-ing autoantibodies: anti-GAD, anti-IA2 or anti-insulin autoantibo-dies. Seven of 14 type 1 non-progressors had markedly raised levelsof serum IL-4 (Fig. 4), six of whom also had raised IFN-g (0.2–35 ng ml−1). Despite the increase in cytokines in the serum from
2,000
1,000
0
αCD3
C1R/neo
C1R/CD1a
C1R/CD1c
C1R/CD1d
2.5 3.2 4.30
1,000
2,000
Clone
IFN
-4 (pg m
l–1)
IFN
-γ (pg m
l–1)
Figure 2 Specificity of three CD4−CD8− Va24JaQ T-cell clones for CD1 isoforms.
Clones 2.5, 3.2 and 4.3 were co-cultivated with the following C1R transfectants:
C1R/neo, C1R/CD1a, C1R/CD1c, and C1R/CD1d, as for Fig.1: top, secreted IL-4;
bottom, secreted IFN-g. In addition, clones were activated with plate-bound anti-
CD3 or immunoglobulin control.
Table 1FrequencyofCD4−CD8− Va24JaQTcells from IDDManddisease-freesiblings
Twins/triplets DN (%)*
% DNVa24+
in totallymphocytes
Va24JaQDN sequence
frequency Va24JaQ (%).............................................................................................................................................................................1A/IL-4+ 0.74 0.04 20/22 0.0361B/IDDM 0.95 0.01 10/19 0.0051C/IDDM 0.76 0.04 9/22 0.016
2A 2.1 0.37 9/10 0.332B/IDDM 3.1 0.025 31/31 0.025
3A 1.1 0.04 8/12 0.0273B/IDDM 1.89 0.01 5/15 0.003
4A 1.21 0.02 4/13 0.0064B/IDDM 0.31 0.006 0† 0
5A 0.58 0.06 8/12 0.045B/IDDM 0.98 0 0† 0
6A/newIDDM 0.89 0.03 7/26 0.0086B/IDDM 2.62 0.03 8/23 0.01
Brother/sister7A/IL-4+ 2.54 0.03 8/12 0.0177B/IDDM 1.08 0.005 0/18 0.............................................................................................................................................................................The frequencyof Va24JaQ TCRsequenceswasdeterminedbysortingallCD4−CD8− abTCR+
Tcells, amplifyingall Va24 transcriptsand sequencing the TCRCDR3 region; the percentageof cells that were invariant CD4−CD8− Va24JaQ in total mononuclear cells was calculated bymultiplying the sequence frequency by the CD4−CD8− Va24+ percentage of total mono-nuclear cells, as determined by flow cytometry. IL-4+ indicates a subject with high serum IL-4. * DN, CD4−CD8−. † No Va24 PCR products were detected in three attempts.
Figure 3 IL-4 and IFN-g secretion profiles of CD4−
CD8− Va24JaQ T-cell clones raised from mono-
zygotic twins and triplets discordant for IDDM. a,
Plate-bound anti-CD3 or control immunoglobulin
was used to stimulate individual clones and
secreted IL-4 and IFN-g was assayed at 4 h.
The pattern of cytokine secretion was similar at
24h. The CDR3 T-cell receptor sequences were
determined and the surface phenotype was con-
firmed by flow cytometry for every clone (data
not shown). Asterisks, twins with IDDM (4B and
5B) had no detectable Va24JaQ T cells in two
attempts to sort from 20 million PBMCs (Table 1).
b, CD4−CD8− Va24JaQ T-cell clones from 4 IDDM
non-progressing subjects (Fig. 4), two control
(DR2/DR3 and DR4/DRX) and five IDDM
patients (triplets 1B and 1C, twins 2B and 3B,
and new-onset IDDM twin 6A), were assayed as
described in a.
Nature © Macmillan Publishers Ltd 1998
8
letters to nature
180 NATURE | VOL 391 | 8 JANUARY 1998
seven of fourteen non-progressors, all seven IL-4+ individuals haveremained healthy with no evidence of chronic infectious or atopic/allergic illnesses. Both cytokines in the remaining seven were belowthe detection limit of our enzyme-linked immunosorbent assay(ELISA; 0.015 ng ml−1). Five of 14 individuals in this group werefound to have the strongly protective MHC allele DQB1*0602 andtherefore are not at the same risk of progression as the remainingnine members of this cohort15. Three of these five individuals hadraised serum IL-4 and IFN-g levels, in contrast to our finding thatIL-4 was undetectable in the serum (before or after diagnosis of type1 diabetes) in 12 individuals with identical autoantibody status whodeveloped IDDM after five or more years of follow up (Fig. 4).
Raised cytokines were also detected in archival serum samplesobtained from 3/23 individuals at the time of diagnosis of type 1diabetes and in 5/26 type-2 diabetics who did not have autoanti-bodies or a family history of type 1 diabetes (Fig. 4). Whencompared with normals, antibody-positive first-degree relatives,recent-onset diabetics, long-term diabetics (IDDM .2 years),autoantibody-negative first-degree relatives or untreated patientswith multiple sclerosis (MS), the frequency of serum IL-4+ indivi-duals was significantly raised in the non-progressor consort (Fig. 4).The authenticity of the IL-4 detected was confirmed independentlyby using another set of ELISA antibodies, by binding to solublerecombinant IL-4 receptor produced in insect cells, and by westernblot (data not shown).
Our results demonstrate a relationship between elevated serum-IL-4 levels and resistance to the progression of an autoimmunedisorder. Prolonged hyperglycaemia as an explanation for theabsence of IL-4 in type 1 diabetics is less likely because IL-4 wasdetected in the serum of type 2 diabetics. Increased IL-4 was not anabsolute predictor of IDDM resistance as only half of the resistantcohort had raised serum IL-4, as did 3/23 diabetics at or near thetime of diagnosis.
In the non-obese diabetic (NOD) mouse, there is evidence thatIL-4 exerts a dominant-negative effect on the progression toIDDM16–18. Differentiation of T cells into IL-4 secreting Th2 effectorcells requires IL-4 priming4. Although this proposed function forNK1.1+ T cells was not obligatory for all Th2 immuneresponses6,19,20, T-cell IL-4 secretion was markedly diminished in aCD1 knockout background20–22. Fewer NK 1.1+ T cells were found tobe present and were less frequent before the onset of disease inseveral murine methods of autoimmunity6,7,23–25. In these models,autoimmunity was accelerated by depletion of NK 1.1+ T cells anddelayed by generating mice transgenic for the Va24Ja281 TCR.Diabetes was also prevented in the NOD mouse by adoptive transferof a population harbouring the NK1.1-like class of T cell26.
In summary, type 1 diabetes is associated with an extreme Th1phenotype for Va24JaQ+ T cells and a decrease in their circulatingfrequency. Our results suggest that there is a strong link betweenVa24JaQ+ T cells and human type 1 diabetes; this indicates thatthey may be functionally related to the resistance or progression ofthis autoimmune disease in humans. M. . . . . . . . . . . . . . . . . . . . . . . . . . . . . . . . . . . . . . . . . . . . . . . . . . . . . . . . . . . . . . . . . . . . . . . . . . . . . . . . . . . . . . . . . . . . . . . . . . . . . . . . . . . . . . . . . . . . . . . . .
Methods
Antibodies and phenotypic analysis of Tcells. Flow cytometry experimentswere done on FACScaliber and FACS Vantage instruments (Becton Dickinson).Monoclonal antibody (mAb) DX1 was a gift from L. Lanier; anti-CD4, anti-CD8 and anti-panTCR were from Becton Dickinson; anti-Va24, anti-CD8b,anti-CD56, anti-CD16 and anti-p58CD158 (NK workshop mAbs GL183 andEB6) were from Immunotech; anti-CD69 and anti-CD94 were fromPharmingen.CDR3 TCR sequencing. Total CD4−CD8− Va24JaQ CDR3 sequences wereamplified by reverse transcription followed by polymerase chain reaction (RT-PCR) using Va24 and constant-region-specific primers as described8, andcloned using a Stratagene pCR-Script kit. Individual T-cell clones TCRtranscripts were amplified by RT-PCR. Sequences of the plasmid and PCRDNA products were determined directly on an ABI 373A Automated DNASequencer.Cell culture and cytokine assay. Single-cell sorts were grown with a mixtureof irradiated (5,000 rad) allogeneic feeders at 50,000 per well and 721.221 cellsat 5,000 per well and supplemented with 1 mg ml−1 PHA-P, IL-2 and IL-7 each at10 U ml−1, then propagated as described27. Clones positive for Va24 and NKR-P1A by flow cytometry and a Va24JaQ CDR3 TCR sequence were assayed forcytokine secretion. Cells were stimulated (25,000 per well) with plate-boundanti-CD3 (1 mg ml−1; Immunotech) or control isotype antibody (Sigma) for 4,8 or 24 h. Supernatants were assayed for IL-4 and IFN-g by capture ELISA, andafter 24 h, 1 mCi per well of [3H]thymidine was added and incorporationmeasured as described27.CD1 restriction. Restriction experiments using CD1 isoform (CD1a, CD1c,CD1d and pSRa-neo vector alone) transfected C1R cells were done asdescribed10.
Received 11 June; accepted 17 September 1997.
1. Davies, J. L. et al. A genome-wide search for human type-1 diabetes susceptibility genes. Nature 371,130–136 (1994).
2. Verge, C. F. et al. Late progression to diabetes and evidence for chronic b-cell autoimmunity inidentical twins of patients with type 1 diabetes. Diabetes 44, 1176–1179 (1995).
3. Roep, B. O. T cell responses to autoantigens in IDDM. The search for the holy grail. Diabetes 45, 1147–1156 (1996).
4. Abbas, A. K., Murphy, K. M. & Sher, A., Functional diversity of helper T lymphocytes. Nature 383,787–793 (1996).
5. Kallmann, B. A. et al. Systematic bias of cytokine production toward cell-mediated immuneregulation in IDDM and toward humoral immunity in Graves’ disease. Diabetes 46, 237–243 (1997).
6. Bendelac, A., Rivera, M. N., Park, H.-S. & Roark, J. H. Mouse CD1-specific NK1 T cells: development,specificity, and function. Annu. Rev. Immunol. 15, 535–562 (1997).
7. Vicari, A. P. & Zlotnik, A. Mouse NK1.1+ T cells: a new family of T cells. Immunol. Today 17, 71–76 (1996).
Figure 4 Serum IL-4 and IFN-g in type 1 diabetes.
Sera were collected and assayed for IL-4 and
IFN-g by capture ELISA, the detection minimum
for which was 15pg ml−1. Raised cytokines were
detected in 7/14 members of the at-risk IDDM
non-progressor cohort. Lines connecting sym-
bols indicate samples in which both IL-4 and IFN-
g were detected; no IFN-g was detected in six
subjects with raised IL-4. * P, Two-tailed Fisher
exact test comparing high IL-4 frequency in each
cohort with at-risk IDDM non-progressors.
Nature © Macmillan Publishers Ltd 1998
8
letters to nature
NATURE | VOL 391 | 8 JANUARY 1998 181
8. Porcelli, S., Yockey, C. E., Brenner, M. B. & Balk, S. P. Analysis of T cell antigen receptor (TCR)expression by human peripheral blood CD4−8− a/b T cells demonstrates preferential use of several Vb
genes and an invariant TCR a chain. J. Exp. Med. 178, 1–16 (1993).9. Lanier, L. L., Chang, C. & Phillips, J. H. Human NKR-P1A. A dilsulfide-linked homodimer of the C-
type lectin superfamily expressed by a subset of NK and T lymphocytes. J. Immunol. 153, 2417–2428(1994).
10. Exley, M., Garcia, J., Balk, S. P. & Porcelli, S. Requirements for CD1d recognition by human invariantVa24+ CD4−CD8− T cells. J. Exp. Med. 186, 1–11 (1997).
11. Davodeau, F. et al. Close phenotypic and functional similarities between human and murine ab cellsexpressing invariant TCR a-chains. J. Immunol. 158, 5603–5611 (1997).
12. von Herrath, M. G. & Oldstone, M. B. A. Interferon-g is essential for destruction of b cells anddevelopment of insulin-dependent diabetes mellitus. J. Exp. Med. 185, 531–539 (1997).
13. Denkers, E. Y., Scharton-Kersten, T., Barbieri, S., Caspar, P. & Sher, A. A role for CD4+NK1.1+ Tlymphocytes as major histocompatibility complex class II independent helper cells in the generationof CD8+ effector function against intracellular infection. J. Exp. Med. 184, 131–139 (1996).
14. Verge, C. F. et al. Prediction of type 1 diabetes in first-degree relatives using a combination of insulin,GAD, and ICA512bdc/IA-2 autoantibodies. Diabetes 45, 926–933 (1996).
15. Pugliese, A. et al. HLA-DQB1p0602 is associated with dominant protection from diabetes even amongislet cell antibody-positive first-degree relatives of patients with IDDM. Diabetes 44, 608–613 (1995).
16. Rapoport, M. J. et al. Interleukin 4 reverses T cell proliferative unresponsiveness and prevents theonset of diabetes in nonobese diabetic mice. J. Exp. Med. 178, 87–99 (1993).
17. Mueller, R., Krahl, T. & Sarvetnick, N. Pancreatic expression of interleukin-4 abrogates insulitis andautoimmune diabetes in nonobese diabetic (NOD) mice. J. Exp. Med. 184, 1093–1099 (1996).
18. Fox, C. J. & Danska, J. S. IL-4 expression at the onset of islet inflammation predicts nondestructiveinsulitis in nonobese diabetic mice. J. Immunol. 158, 2414–2424 (1997).
19. Brown, D. R. et al. b2-microglobulin-dependent NK1.1+ T cells are not essential for T helper cell 2immune responses. J. Exp. Med. 184, 1295–1304 (1996).
20. Smiley, S. T., Kaplan, M. H. & Grusby, M. J. Immunoglobulin E production in the absence ofinterleukin-4-secreting CD1-dependent cells. Science 275, 977–979 (1997).
21. Chen, Y.-H., Chiu, N. M., Mandal, M., Wang, N. & Wang, C.-R. Impaired NK1+ T cell developmentand early IL-4 production in CD1-deficient mice. Immunity 6, 459–467 (1997).
22. Mendiratta, S. K. et al. CD1d1 mutant mice are deficient in natural T cells that promptly produce IL-4.Immunity 6, 469–477 (1997).
23. Takeda, K. & Dennert, G. The development of autoimmunity in C57BL/6 lpr mice correlates with thedisappearance of natural killer type 1-positive cells: evidence for their suppressive action on bonemarrow stem cell proliferation, B cell immunoglobulin secretion, and autoimmune symptoms. J. Exp.Med. 177, 155–164 (1993).
24. Mieza, M. A. et al. Selective reduction of Va14+ NK T cells associated with disease development inautoimmune-prone mice. J. Immunol. 156, 4035–4040 (1996).
25. Gombert, J.-M. et al. IL-7 reverses NK1+ T cell-defective IL-4 production in the non-obese diabeticmouse. Int. Immunol. 8, 1751–1758 (1996).
26. Baxter, A. G., Kinder, S. J., Hammond, K. J. L., Scollay, R. & Godfrey, D. I. Association betweenabTCR+CD4−CD8− T cell deficiency and IDDM in NOD/Lt mice. Diabetes 46, 572–582 (1997).
27. Fukaura, H. et al. Induction of circulating myelin basic protein and proteolipid-specific transforminggrowth factor-b-secreting Th3 cells by oral administration of myelin in multiple sclerosis patients. J.Clin. Invest. 98, 70–77 (1996).
Acknowledgements. We thank the DFCI flow cytometry facility for cell sorting, T. Smith for patientsupport, J. Orov for statistical analysis and A. LaMothe for clerical support. We wish to specifically thankthe patients for their generosity without which these studies could not have been performed. These studieswere supported by grants from the NIAID of the NIH.
Correspondence and requests for materials should be addressed to D.A.H.
DrosophilaShaking-Bproteinformsgap junctions inpairedXenopusoocytesPauline Phelan, Lucy A. Stebbings, Richard A. Baines†,Jonathan P. Bacon, Jane A. Davies & Chris Ford*
Sussex Centre for Neuroscience and *Department of Genetics and Development,School of Biological Sciences, University of Sussex, Brighton BN1 9QG, UK. . . . . . . . . . . . . . . . . . . . . . . . . . . . . . . . . . . . . . . . . . . . . . . . . . . . . . . . . . . . . . . . . . . . . . . . . . . . . . . . . . . . . . . . . . . . . . . . . . . . . . . . . . . . . . . . . . . . . . . . .
In most multicellular organisms direct cell–cell communication ismediated by the intercellular channels of gap junctions. Thesechannels allow the exchange of ions and molecules that arebelieved to be essential for cell signalling during development andin some differentiated tissues. Proteins called connexins, whichare products of a multigene family, are the structural componentsof vertebrate gap junctions1,2. Surprisingly, molecular homo-logues of the connexins have not been described in any inverte-brate. A separate gene family, which includes the Drosophila genesshaking-B and l(1)ogre, and the Caenorhabditis elegans genes unc-7 and eat-5, encodes transmembrane proteins with a predictedstructure similar to that of the connexins3–9. shaking-B and eat-5are required for the formation of functional gap junctions8,10. Totest directly whether Shaking-B is a channel protein, we expressed
† Present address: Zoology Department, University of Cambridge, Cambridge CB2 3EJ, UK.
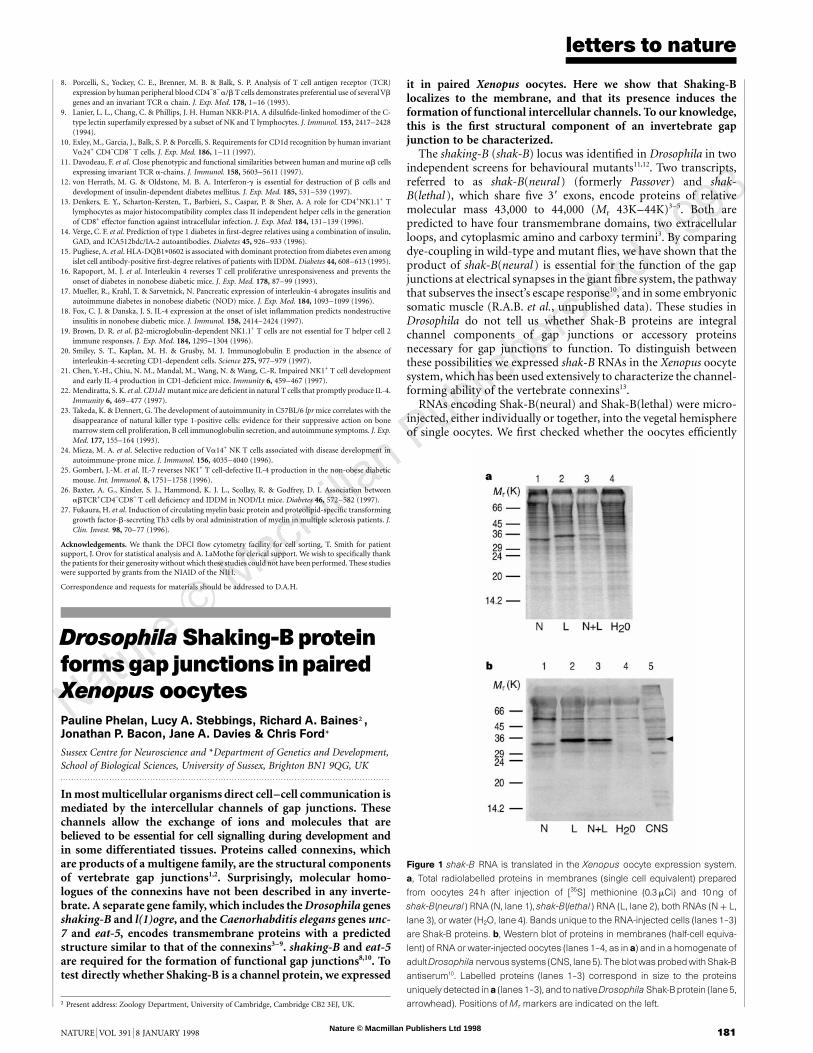
it in paired Xenopus oocytes. Here we show that Shaking-Blocalizes to the membrane, and that its presence induces theformation of functional intercellular channels. To our knowledge,this is the first structural component of an invertebrate gapjunction to be characterized.
The shaking-B (shak-B) locus was identified in Drosophila in twoindependent screens for behavioural mutants11,12. Two transcripts,referred to as shak-B(neural) (formerly Passover) and shak-B(lethal ), which share five 39 exons, encode proteins of relativemolecular mass 43,000 to 44,000 (Mr 43K–44K)3–5. Both arepredicted to have four transmembrane domains, two extracellularloops, and cytoplasmic amino and carboxy termini3. By comparingdye-coupling in wild-type and mutant flies, we have shown that theproduct of shak-B(neural ) is essential for the function of the gapjunctions at electrical synapses in the giant fibre system, the pathwaythat subserves the insect’s escape response10, and in some embryonicsomatic muscle (R.A.B. et al., unpublished data). These studies inDrosophila do not tell us whether Shak-B proteins are integralchannel components of gap junctions or accessory proteinsnecessary for gap junctions to function. To distinguish betweenthese possibilities we expressed shak-B RNAs in the Xenopus oocytesystem, which has been used extensively to characterize the channel-forming ability of the vertebrate connexins13.
RNAs encoding Shak-B(neural) and Shak-B(lethal) were micro-injected, either individually or together, into the vegetal hemisphereof single oocytes. We first checked whether the oocytes efficiently
Figure 1 shak-B RNA is translated in the Xenopus oocyte expression system.
a, Total radiolabelled proteins in membranes (single cell equivalent) prepared
from oocytes 24 h after injection of [35S] methionine (0.3 mCi) and 10 ng of
shak-B(neural) RNA (N, lane 1), shak-B(lethal) RNA (L, lane 2), both RNAs (N þ L,
lane 3), or water (H2O, lane 4). Bands unique to the RNA-injected cells (lanes 1–3)
are Shak-B proteins. b, Western blot of proteins in membranes (half-cell equiva-
lent) of RNA or water-injected oocytes (lanes 1–4, as in a) and in a homogenate of
adult Drosophila nervoussystems (CNS, lane 5). Theblot wasprobed with Shak-B
antiserum10. Labelled proteins (lanes 1–3) correspond in size to the proteins
uniquely detected ina (lanes1–3), and to nativeDrosophila Shak-B protein (lane 5,
arrowhead). Positions of Mr markers are indicated on the left.
© 1999 Macmillan Magazines Ltd
letters to nature
350 NATURE | VOL 397 | 28 JANUARY 1999 | www.nature.com
responsible for ocular-dominance plasticity, why is there ever anyshift in ocular dominance after monocular inactivation? There areseveral possible reasons why plasticity can be observed with pro-longed monocular inactivation in younger animals. First, some levelof noise almost certainly converges on cortical neurons even afterretinal TTX treatment. Monocular inactivation does not completelyeliminate activity in the LGN afferents serving the deprived eye,and even spontaneous presynaptic release of glutamate canactivate NMDA-receptor-mediated postsynaptic currents at somesynapses22. It is possible that such weak presynaptic activity couldcause synaptic depression, given enough time (especially in younganimals, in which the mechanisms of LTD are highly expressed17,18).Second, because ocular dominance is a measurement of relativeresponse magnitude, part of the shift could be accounted for byhomosynaptic potentiation of the non-deprived afferents4. Finally,it is possible that the mechanisms of ocular-dominance plasticityare different in animals of less than ®ve weeks in age.
The synaptic depression induced by visual deprivation is morepronounced when one eye is deprived (monocular deprivation)than when both eyes are deprived (binocular deprivation)23. Thisobservation led to the early suggestion24,25 that heterosynaptic LTDoccurs in visual cortex (that is, a depression of inactive deprived-eyesynapses that is triggered by the strong activation of the post-synaptic neuron by the non-deprived eye). The BCM theory offersan alternative explanation for the difference between the effects ofmonocular and binocular deprivation. According to this theory, theamount of homosynaptic depression induced by presynaptic activityvaries depending on the average level of cortical activity, which ishigher during monocular deprivation than during binoculardeprivation4. Indeed, in agreement with the theory, it has beenshown experimentally that homosynaptic LTD is signi®cantlyreduced in binocularly deprived cortex26.
The occurrence of homosynaptic depression may, therefore, besuf®cient to account for the initial loss of cortical responsiveness tovisual inputs to an eye that was deprived of normal vision for aperiod of time. If this hypothesis is correct, we could be on thethreshold of unprecedented insight into the detailed molecularmechanisms of one form of visual cortical plasticity. M. . . . . . . . . . . . . . . . . . . . . . . . . . . . . . . . . . . . . . . . . . . . . . . . . . . . . . . . . . . . . . . . . . . . . . . . . . . . . . . . . . . . . . . . . . . . . . . . . . . . . . . . . . . . . . . . . . . . . . . . .
Methods
Injection and lid suture. Kittens were anaesthetized by continuous admin-
istration of iso¯urane gas (2±3% in 100% O2 at 11 min-1). Ten animals received
an injection of TTX (4 ml of 1.25 mM TTX in 5% citrate buffer; Calbiochem)
into the vitreous humour of the left eye; ten others received an injection of 4 ml
saline. Injections were performed without experimenter knowledge of the
contents of the injection syringe; experimenters remained blind until the
analysis of all experiments had been completed. Following the injection, the
margins of the upper and lower lids of the injected eye were trimmed and
sutured together. The entire procedure was completed in less than 20 min and
the kittens then recovered rapidly. Previous work10 and pilot studies in our
laboratory indicated that the TTX inactivates the retina completely for two
days, after which the retina recovers gradually over another two days.
Electrophysiology and visual stimulation. Animals were prepared for
electrophysiology and visual stimulation as described27. Multiunit activity
was recorded using glass-covered tungsten electrodes with an impedance of
0.8±1.5 MQ. The visual stimulation used to quantify responses consisted of
high-contrast, drifting sinusoidal gratings with a spatial frequency of 1 cycle per
degree and a temporal frequency of 1 Hz. These stimulus parameters were
chosen because, in our experience, they elicit a response from most cortical
cells. The grating stimuli were 198 tall 3 288 wide, and extended well beyond
the receptive ®elds of both eyes. Gratings were presented at 16 different
orientations/directions that varied by 22.58 around a full 3608. Each grating
orientation/direction was presented 5 times for 5 s each. Data were also
collected during 5 blank-screen trials (5 sec each) to measure spontaneous
activity. To ensure that we did not oversample from the ®rst ocular-dominance
column, the electrode penetrations were highly oblique, beginning medial to
the crown of the lateral gyrus and running parallel to the cortical surface, down
the medial wall of the hemisphere. The tracks were always long enough to
sample complete ipsi-contra eye cycles of ocular dominance.
Received 27 October; accepted 1 December 1998.
1. Bienenstock, E. L., Cooper, L. N. & Munro, P. W. Theory for the development of neuron selectivity:orientation speci®city and binocular interaction in visual cortex. J. Neurosci. 2, 32±48 (1982).
2. Bear, M. F., Cooper, L. N. & Ebner, F. F. A physiological basis for a theory of synaptic modi®cation.
Science 237, 42±48 (1987).
3. Bear, M. F. in Mechanistic Relationships between Development and Learning (eds Carew, T. J., Menzel,
R. & Shatz, C. J.) 205±225 (Wiley, New York, 1998).4. Blais, B. S., Shouval, H. Z. & Cooper, L. N. The role of presynaptic activity on the ocular dominance
shift in monocular deprivation: comparison of homosynaptic and heterosynaptic mechanisms. Proc.
Natl Acad. Sci. USA 96, 1083±1087 (1999).
5. Greuel, J. M., Luhman, H. J. & Singer, W. Evidence for a threshold in experience-dependent long-term
changes of kitten visual cortex. Dev. Brain Res. 34, 141±149 (1987).6. Chapman, B., Jacobson, M. D., Reiter, H. O. & Stryker, M. P. Ocular dominance shift in kitten visual
cortex caused by imbalance in retinal electrical activity. Nature 324, 154±156 (1986).
7. Mower, G. D. The effect of dark rearing on the time course of the critical period in cat visual cortex.
Dev. Brain Res. 58, 151±158 (1991).
8. Hubel, D. H. & Wiesel, T. N. The period of susceptibility ot the physiological effects of unilateral eyeclosure in kittens. J. Physiol. 206, 419±436 (1970).
9. Kaplan, E., Purpura, K. & Shapley, R. M. Contrast affects the transmission of visual information
through the mammalian lateral geniculate nucleus. J. Physiol. (Lond.) 391, 267±288 (1987).
10. Stryker, M. P. & Harris, W. A. Binocular impulse blockade prevents the formation of ocular
dominance columns in cat visual cortex. J. Neurosci. 6, 2117±2133 (1986).11. Reiter, H. O. & Stryker, M. P. Neural plasticity without postsynaptic action potentials: less active
inputs become dominant when kitten visual cortical cells are pharmacologically inhibited. Proc. Natl
Acad. Sci. USA 85, 3623±3627 (1988).
12. Bear, M. F., Kleinschmidt, A., Gu, Q. & Singer, W. Disruption of experience-dependent synaptic
modi®cations in striate cortex by infusion of an NMDA receptor antagonist. J. Neurosci. 10, 909±925(1990).
13. Ramoa, A. S., Paradiso, M. A. & Freeman, R. D. Blockade of intracortical inhibition in the kitten striate
cortex: effect on receptive ®eld proper;ties and associated loss of ocular dominance plasticity. Exp.
Brain Res. 73, 285±296 (1988).
14. Artola, A. & Singer, W. Long-term depression of excitatory synaptic transmission and its relationshipto long-term potentiation. Trends Neurosci. 16, 480±487 (1993).
15. Bear, M. F. & Kirkwood, A. in Cortical Plasticity: LTP and LTD (eds Fazeli, M. S. & Collingridge, G. L.)
191±205 (Bios Scienti®c, Oxford, 1996).
16. Bear, M. F. & Singer, W. Modulation of visual cortical plasticity by acetylcholine and noradrenaline.Nature 320, 172±176 (1986).
17. Dudek, S. M. & Friedlander, M. J. Developmental down-regulation of LTD in cortical layer IV and its
independence of modulation by inhibition. Neuron 16, 1±20 (1996).
18. Kirkwood, A., Silva, A. & Bear, M. F. Age-dependent decrease of synaptic plasticity in the neocortex of
aCaMKII mutant mice. Proc. Natl Acad. Sci. USA 94, 3380±3383 (1997).19. Kirkwood, A. & Bear, M. F. Homosynaptic long-term depression in the visual cortex. J. Neurosci. 14,
3404±3412 (1994).
20. Kojic, L., Gu, Q., Douglas, R. M. & Cynader, M. S. Serotonin facilitates synaptic plasticity in kitten
visual cortex: an in vitro study. Dev. Brain Res. 101, 299±304 (1997).
21. Kirkwood, A., Rozas, C., Kirkwood, J., Perez, F. & Bear, M. F. Modulation of long-term synapticdepression in visual cortex by acetylcholine and norepinephrine. J. Neurosci. (in the press).
22. Sah, P., Hestrin, S. & Nicoll, R. A. Tonic activation of NMDA receptors by ambient glutamate enhances
excitability of neurons. Science 246, 815±818 (1989).
23. Wiesel, T. N. & Hubel, D. H. Comparison of the effects of unilateral and bilateral eye closure on
cortical unit responses in kittens. J. Neurophysiol. 28, 1060±1072 (1965).24. Stent, G. S. A physiological mechanism for Hebb's postulate of learning. Proc. Natl Acad. Sci. USA 70,
997±1001 (1973).
25. von der Malsburg, C. Self-organization of orientation-sensitive columns in the striate cortex.
Kybernetik 14, 85±100 (1973).
26. Kirkwood, A., Rioult, M. G. & Bear, M. F. Experience-dependent modi®cation of synaptic plasticity invisual cortex. Nature 381, 526±528 (1996).
27. Rossi, A. F., Rittenhouse, C. D. & Paradiso, M. A. The representation of brightness in primary visual
cortex. Science 273, 1104±1107 (1996).
Acknowledgements. This work was supported by the Howard Hughes Medical Institute, the NIH and theDana Foundation.
Correspondence and requests for materials should be addressed to M.F.B. (e-mail:[email protected]).
In vivo regulationof axonextensionandpath®ndingbygrowth-conecalcium transientsTimothy M. Gomez & Nicholas C. Spitzer
Department of Biology and Center for Molecular Genetics,
University of California at San Diego, La Jolla, California 92093-0357, USA. . . . . . . . . . . . . . . . . . . . . . . . . . . . . . . . . . . . . . . . . . . . . . . . . . . . . . . . . . . . . . . . . . . . . . . . . . . . . . . . . . . . . . . . . . . . . . . . . . . . . . . . . . . . . . . . . . . . . . . . .
Growth cones at the tips of extending neurites migrate throughcomplex environments in the developing nervous system andguide axons to appropriate target regions using local cues1,2. Theintracellular calcium concentration ([Ca2+]i) of growth conescorrelates with motility in vitro3±7, but the physiological links
© 1999 Macmillan Magazines Ltd
letters to nature
NATURE | VOL 397 | 28 JANUARY 1999 | www.nature.com 351
between environmental cues and axon growth in vivo areunknown. Here we report that growth cones generate transientelevations of [Ca2+]i as they migrate within the embryonic spinalcord and that the rate of axon outgrowth is inversely proportionalto the frequency of transients. Suppressing Ca2+ transients byphotorelease of a Ca2+ chelator accelerates axon extension,whereas mimicking transients with photorelease of Ca2+ slowsotherwise rapid axonal growth. The frequency of Ca2+ transientsis cell-type speci®c and depends on the position of growth conesalong their pathway. Furthermore, growth-cone stalling and axonretraction, which are two important aspects of path®nding8±10, areassociated with high frequencies of Ca2+ transients. Our resultsindicate that environmentally regulated growth-cone Ca2+ transientscontrol axon growth in the developing spinal cord.
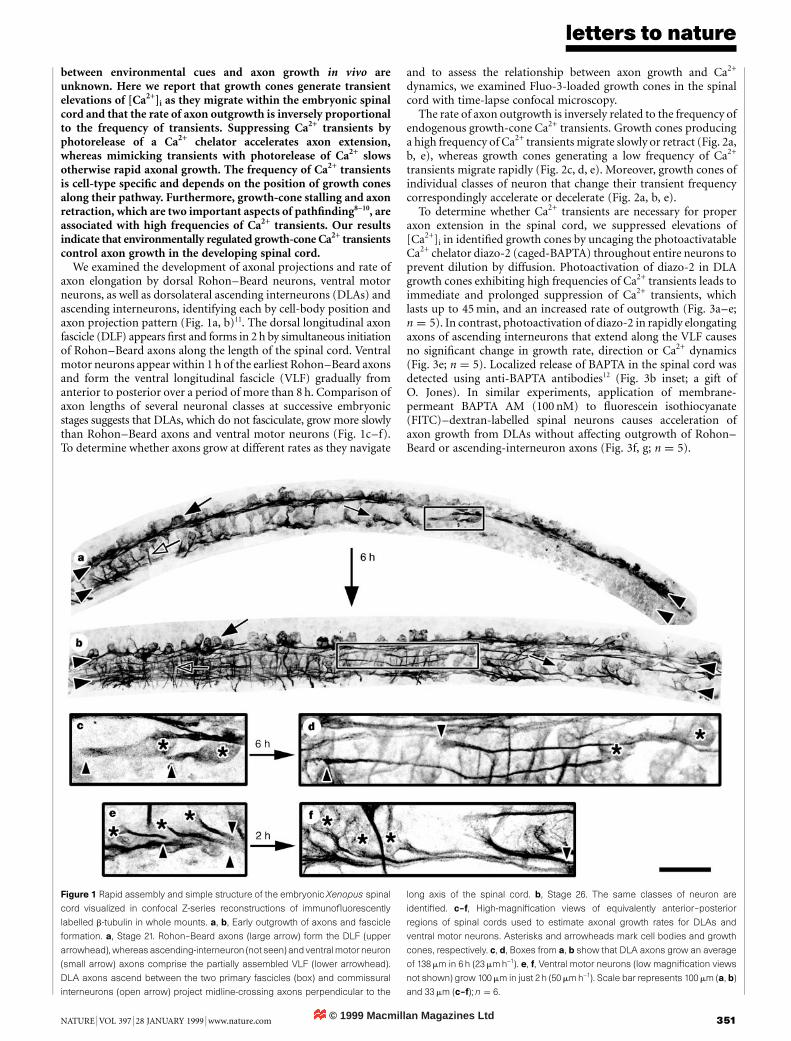
We examined the development of axonal projections and rate ofaxon elongation by dorsal Rohon±Beard neurons, ventral motorneurons, as well as dorsolateral ascending interneurons (DLAs) andascending interneurons, identifying each by cell-body position andaxon projection pattern (Fig. 1a, b)11. The dorsal longitudinal axonfascicle (DLF) appears ®rst and forms in 2 h by simultaneous initiationof Rohon±Beard axons along the length of the spinal cord. Ventralmotor neurons appear within 1 h of the earliest Rohon±Beard axonsand form the ventral longitudinal fascicle (VLF) gradually fromanterior to posterior over a period of more than 8 h. Comparison ofaxon lengths of several neuronal classes at successive embryonicstages suggests that DLAs, which do not fasciculate, grow more slowlythan Rohon±Beard axons and ventral motor neurons (Fig. 1c±f).To determine whether axons grow at different rates as they navigate
and to assess the relationship between axon growth and Ca2+
dynamics, we examined Fluo-3-loaded growth cones in the spinalcord with time-lapse confocal microscopy.
The rate of axon outgrowth is inversely related to the frequency ofendogenous growth-cone Ca2+ transients. Growth cones producinga high frequency of Ca2+ transients migrate slowly or retract (Fig. 2a,b, e), whereas growth cones generating a low frequency of Ca2+
transients migrate rapidly (Fig. 2c, d, e). Moreover, growth cones ofindividual classes of neuron that change their transient frequencycorrespondingly accelerate or decelerate (Fig. 2a, b, e).
To determine whether Ca2+ transients are necessary for properaxon extension in the spinal cord, we suppressed elevations of[Ca2+]i in identi®ed growth cones by uncaging the photoactivatableCa2+ chelator diazo-2 (caged-BAPTA) throughout entire neurons toprevent dilution by diffusion. Photoactivation of diazo-2 in DLAgrowth cones exhibiting high frequencies of Ca2+ transients leads toimmediate and prolonged suppression of Ca2+ transients, whichlasts up to 45 min, and an increased rate of outgrowth (Fig. 3a±e;n � 5). In contrast, photoactivation of diazo-2 in rapidly elongatingaxons of ascending interneurons that extend along the VLF causesno signi®cant change in growth rate, direction or Ca2+ dynamics(Fig. 3e; n � 5). Localized release of BAPTA in the spinal cord wasdetected using anti-BAPTA antibodies12 (Fig. 3b inset; a gift ofO. Jones). In similar experiments, application of membrane-permeant BAPTA AM (100 nM) to ¯uorescein isothiocyanate(FITC)±dextran-labelled spinal neurons causes acceleration ofaxon growth from DLAs without affecting outgrowth of Rohon±Beard or ascending-interneuron axons (Fig. 3f, g; n � 5).
Figure 1 Rapid assembly and simple structure of the embryonic Xenopus spinal
cord visualized in confocal Z-series reconstructions of immuno¯uorescently
labelled b-tubulin in whole mounts. a, b, Early outgrowth of axons and fascicle
formation. a, Stage 21. Rohon±Beard axons (large arrow) form the DLF (upper
arrowhead),whereas ascending-interneuron (not seen) and ventral motor neuron
(small arrow) axons comprise the partially assembled VLF (lower arrowhead).
DLA axons ascend between the two primary fascicles (box) and commissural
interneurons (open arrow) project midline-crossing axons perpendicular to the
long axis of the spinal cord. b, Stage 26. The same classes of neuron are
identi®ed. c±f, High-magni®cation views of equivalently anterior±posterior
regions of spinal cords used to estimate axonal growth rates for DLAs and
ventral motor neurons. Asterisks and arrowheads mark cell bodies and growth
cones, respectively. c, d, Boxes from a, b show that DLA axons grow an average
of 138 mm in 6h (23 mmh-1). e, f, Ventral motor neurons (low magni®cation views
not shown) grow 100 mm in just 2 h (50 mmh-1). Scale bar represents 100 mm (a, b)
and 33 mm (c±f); n � 6.
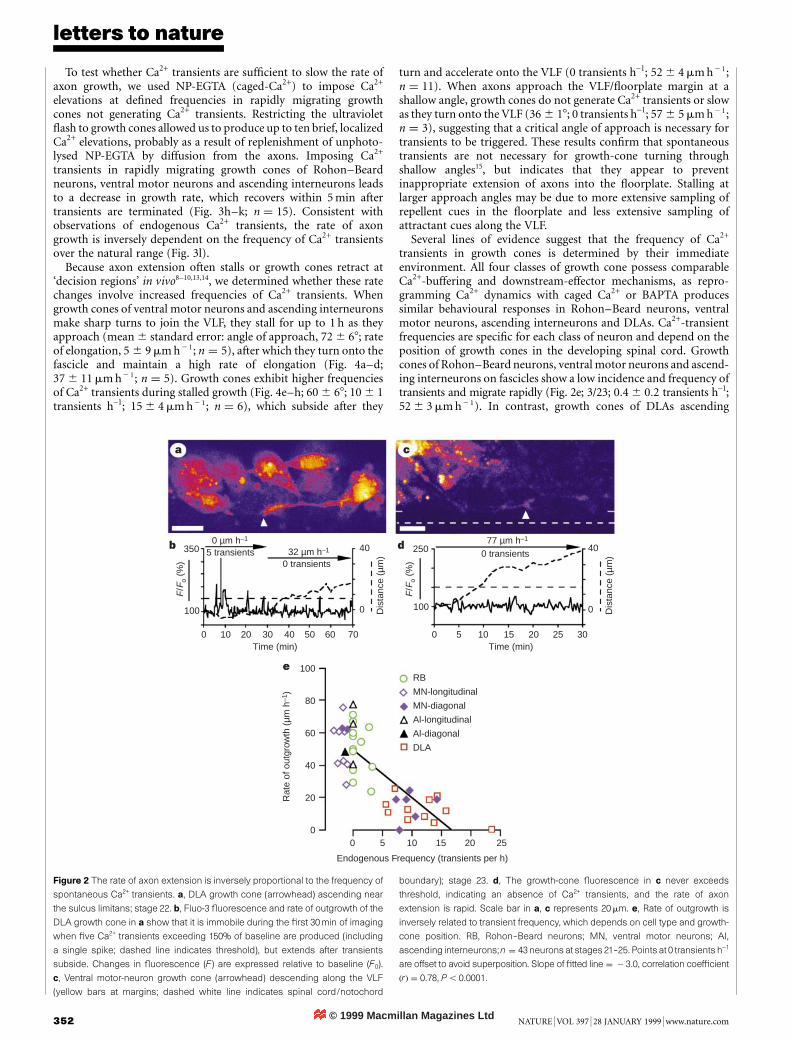
© 1999 Macmillan Magazines Ltd
letters to nature
352 NATURE | VOL 397 | 28 JANUARY 1999 | www.nature.com
To test whether Ca2+ transients are suf®cient to slow the rate ofaxon growth, we used NP-EGTA (caged-Ca2+) to impose Ca2+
elevations at de®ned frequencies in rapidly migrating growthcones not generating Ca2+ transients. Restricting the ultraviolet¯ash to growth cones allowed us to produce up to ten brief, localizedCa2+ elevations, probably as a result of replenishment of unphoto-lysed NP-EGTA by diffusion from the axons. Imposing Ca2+
transients in rapidly migrating growth cones of Rohon±Beardneurons, ventral motor neurons and ascending interneurons leadsto a decrease in growth rate, which recovers within 5 min aftertransients are terminated (Fig. 3h±k; n � 15). Consistent withobservations of endogenous Ca2+ transients, the rate of axongrowth is inversely dependent on the frequency of Ca2+ transientsover the natural range (Fig. 3l).
Because axon extension often stalls or growth cones retract at`decision regions' in vivo8±10,13,14, we determined whether these ratechanges involve increased frequencies of Ca2+ transients. Whengrowth cones of ventral motor neurons and ascending interneuronsmake sharp turns to join the VLF, they stall for up to 1 h as theyapproach (mean 6 standard error: angle of approach, 72 6 68; rateof elongation, 5 6 9 mm h 2 1; n � 5), after which they turn onto thefascicle and maintain a high rate of elongation (Fig. 4a±d;37 6 11 mm h 2 1; n � 5). Growth cones exhibit higher frequenciesof Ca2+ transients during stalled growth (Fig. 4e±h; 60 6 68; 10 6 1transients h-1; 15 6 4 mm h 2 1; n � 6), which subside after they
turn and accelerate onto the VLF (0 transients h-1; 52 6 4 mm h 2 1;n � 11). When axons approach the VLF/¯oorplate margin at ashallow angle, growth cones do not generate Ca2+ transients or slowas they turn onto the VLF (36 6 18; 0 transients h-1; 57 6 5 mm h 2 1;n � 3), suggesting that a critical angle of approach is necessary fortransients to be triggered. These results con®rm that spontaneoustransients are not necessary for growth-cone turning throughshallow angles15, but indicates that they appear to preventinappropriate extension of axons into the ¯oorplate. Stalling atlarger approach angles may be due to more extensive sampling ofrepellent cues in the ¯oorplate and less extensive sampling ofattractant cues along the VLF.
Several lines of evidence suggest that the frequency of Ca2+
transients in growth cones is determined by their immediateenvironment. All four classes of growth cone possess comparableCa2+-buffering and downstream-effector mechanisms, as repro-gramming Ca2+ dynamics with caged Ca2+ or BAPTA producessimilar behavioural responses in Rohon±Beard neurons, ventralmotor neurons, ascending interneurons and DLAs. Ca2+-transientfrequencies are speci®c for each class of neuron and depend on theposition of growth cones in the developing spinal cord. Growthcones of Rohon±Beard neurons, ventral motor neurons and ascend-ing interneurons on fascicles show a low incidence and frequency oftransients and migrate rapidly (Fig. 2e; 3/23; 0:4 6 0:2 transients h-1;52 6 3 mm h 2 1). In contrast, growth cones of DLAs ascending
0 10 20 30 40 50 60 70Time (min)
0 5 10 15 20 25 30Time (min)
350
100
F/F
o (%
)
250
100
F/F
o (%
)
5 transients0 µm h–1
0 transients32 µm h–1 0 transients
77 µm h–1
Dis
tanc
e (µ
m)
Dis
tanc
e (µ
m)
40
0
40
0
Endogenous Frequency (transients per h)
0 5 10 15 20 25
100
80
60
40
20
0
RB
MN-longitudinal
MN-diagonal
Al-longitudinal
Al-diagonal
DLA
Rat
e of
out
grow
th (
µm h
–1)
a c
b d
e
Figure 2 The rate of axon extension is inversely proportional to the frequency of
spontaneous Ca2+ transients. a, DLA growth cone (arrowhead) ascending near
the sulcus limitans; stage 22. b, Fluo-3 ¯uorescence and rate of outgrowth of the
DLA growth cone in a show that it is immobile during the ®rst 30min of imaging
when ®ve Ca2+ transients exceeding 150% of baseline are produced (including
a single spike; dashed line indicates threshold), but extends after transients
subside. Changes in ¯uorescence (F) are expressed relative to baseline (F0).
c, Ventral motor-neuron growth cone (arrowhead) descending along the VLF
(yellow bars at margins; dashed white line indicates spinal cord/notochord
boundary); stage 23. d, The growth-cone ¯uorescence in c never exceeds
threshold, indicating an absence of Ca2+ transients, and the rate of axon
extension is rapid. Scale bar in a, c represents 20 mm. e, Rate of outgrowth is
inversely related to transient frequency, which depends on cell type and growth-
cone position. RB, Rohon±Beard neurons; MN, ventral motor neurons; AI,
ascending interneurons; n � 43 neurons at stages 21±25. Points at 0 transients h-1
are offset to avoid superposition. Slope of ®tted line � 2 3:0, correlation coef®cient
�r� � 0:78, P , 0:0001.
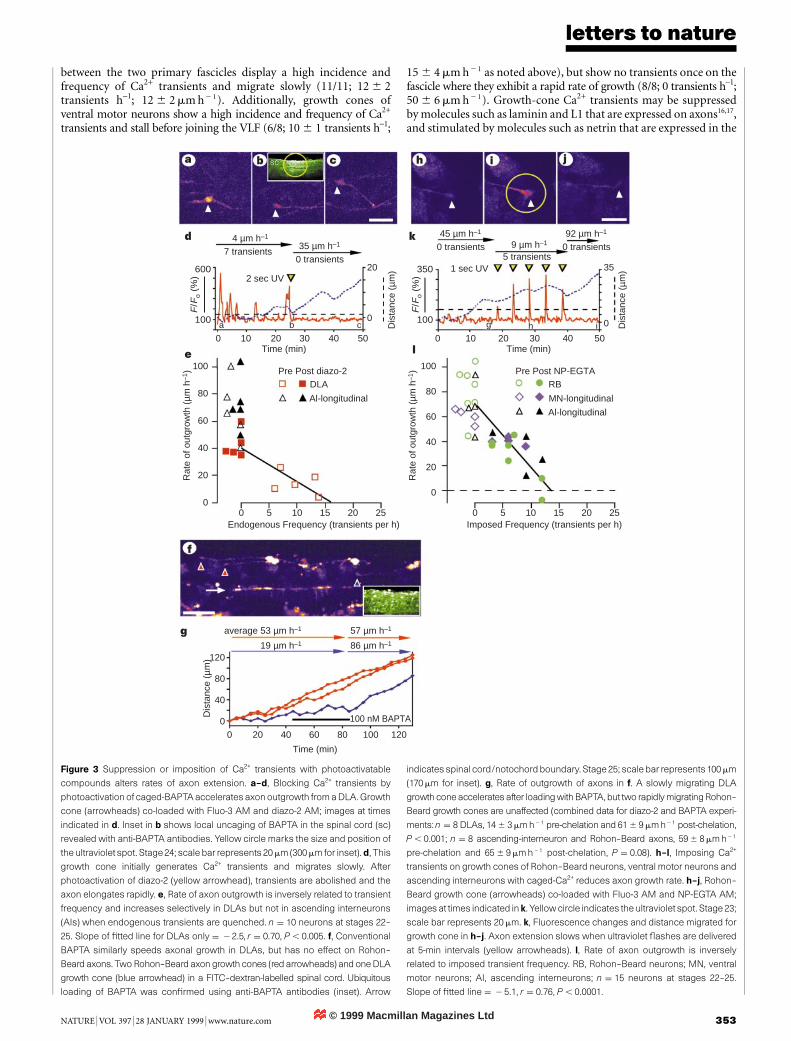
© 1999 Macmillan Magazines Ltd
letters to nature
NATURE | VOL 397 | 28 JANUARY 1999 | www.nature.com 353
between the two primary fascicles display a high incidence andfrequency of Ca2+ transients and migrate slowly (11/11; 12 6 2transients h-1; 12 6 2 mm h 2 1). Additionally, growth cones ofventral motor neurons show a high incidence and frequency of Ca2+
transients and stall before joining the VLF (6/8; 10 6 1 transients h-1;
15 6 4 mm h 2 1 as noted above), but show no transients once on thefascicle where they exhibit a rapid rate of growth (8/8; 0 transients h-1;50 6 6 mm h 2 1). Growth-cone Ca2+ transients may be suppressedby molecules such as laminin and L1 that are expressed on axons16,17,and stimulated by molecules such as netrin that are expressed in the
sc
4 µm h–1
7 transients35 µm h–1
0 transients
45 µm h–1
0 transients92 µm h–1
0 transients9 µm h–1
5 transients1 sec UV
2 sec UV
Dis
tanc
e (µ
m)
Dis
tanc
e (µ
m)
Dis
tanc
e (µ
m)20
0
35
0
350
100
600
100
0 10 20 30 40 50 0 10 20 30 40 50Time (min)
0 20 40 60 80 100 120
100 nM BAPTA
Time (min)
g h ia b c
F/F
o (
%)
F/F
o (
%)
Endogenous Frequency (transients per h) Imposed Frequency (transients per h)0 5 10 15 20 25 0 5 10 15 20 25
120
80
40
0
19 µm h–1 86 µm h–1
average 53 µm h–1 57 µm h–1
100
80
60
40
20
0
100
80
60
40
20
0
Rat
e of
out
grow
th (
µm h
–1)
Rat
e of
out
grow
th (
µm h
–1)Pre Post diazo-2
DLA
Al-longitudinal
Pre Post NP-EGTARB
MN-longitudinal
Al-longitudinal
f
e
a b c h i j
d k
l
g
Time (min)
Figure 3 Suppression or imposition of Ca2+ transients with photoactivatable
compounds alters rates of axon extension. a±d, Blocking Ca2+ transients by
photoactivation of caged-BAPTA accelerates axon outgrowth from a DLA.Growth
cone (arrowheads) co-loaded with Fluo-3 AM and diazo-2 AM; images at times
indicated in d. Inset in b shows local uncaging of BAPTA in the spinal cord (sc)
revealed with anti-BAPTA antibodies. Yellow circle marks the size and position of
the ultraviolet spot. Stage24; scale bar represents 20 mm (300 mmfor inset).d, This
growth cone initially generates Ca2+ transients and migrates slowly. After
photoactivation of diazo-2 (yellow arrowhead), transients are abolished and the
axon elongates rapidly. e, Rate of axon outgrowth is inversely related to transient
frequency and increases selectively in DLAs but not in ascending interneurons
(AIs) when endogenous transients are quenched. n � 10 neurons at stages 22±
25. Slope of ®tted line for DLAs only � 2 2:5, r � 0:70, P , 0:005. f, Conventional
BAPTA similarly speeds axonal growth in DLAs, but has no effect on Rohon±
Beard axons. Two Rohon±Beard axon growth cones (red arrowheads) and one DLA
growth cone (blue arrowhead) in a FITC±dextran-labelled spinal cord. Ubiquitous
loading of BAPTA was con®rmed using anti-BAPTA antibodies (inset). Arrow
indicates spinal cord/notochord boundary. Stage25; scale bar represents 100 mm
(170 mm for inset). g, Rate of outgrowth of axons in f. A slowly migrating DLA
growth coneaccelerates after loading with BAPTA, but two rapidlymigratingRohon±
Beard growth cones are unaffected (combined data for diazo-2 and BAPTA experi-
ments: n � 8 DLAs, 14 6 3 mmh2 1 pre-chelation and 61 6 9 mmh2 1 post-chelation,
P , 0:001; n � 8 ascending-interneuron and Rohon±Beard axons, 59 6 8 mmh2 1
pre-chelation and 65 6 9 mmh2 1 post-chelation, P � 0:08). h±l, Imposing Ca2+
transients on growth cones of Rohon±Beard neurons, ventral motor neurons and
ascending interneurons with caged-Ca2+ reduces axon growth rate. h±j, Rohon±
Beard growth cone (arrowheads) co-loaded with Fluo-3 AM and NP-EGTA AM;
images at times indicated in k. Yellowcircle indicates the ultraviolet spot. Stage 23;
scale bar represents 20 mm. k, Fluorescence changes and distance migrated for
growth cone in h±j. Axon extension slows when ultraviolet ¯ashes are delivered
at 5-min intervals (yellow arrowheads). l, Rate of axon outgrowth is inversely
related to imposed transient frequency. RB, Rohon±Beard neurons; MN, ventral
motor neurons; AI, ascending interneurons; n � 15 neurons at stages 22±25.
Slope of ®tted line � 2 5:1, r � 0:76, P , 0:0001.
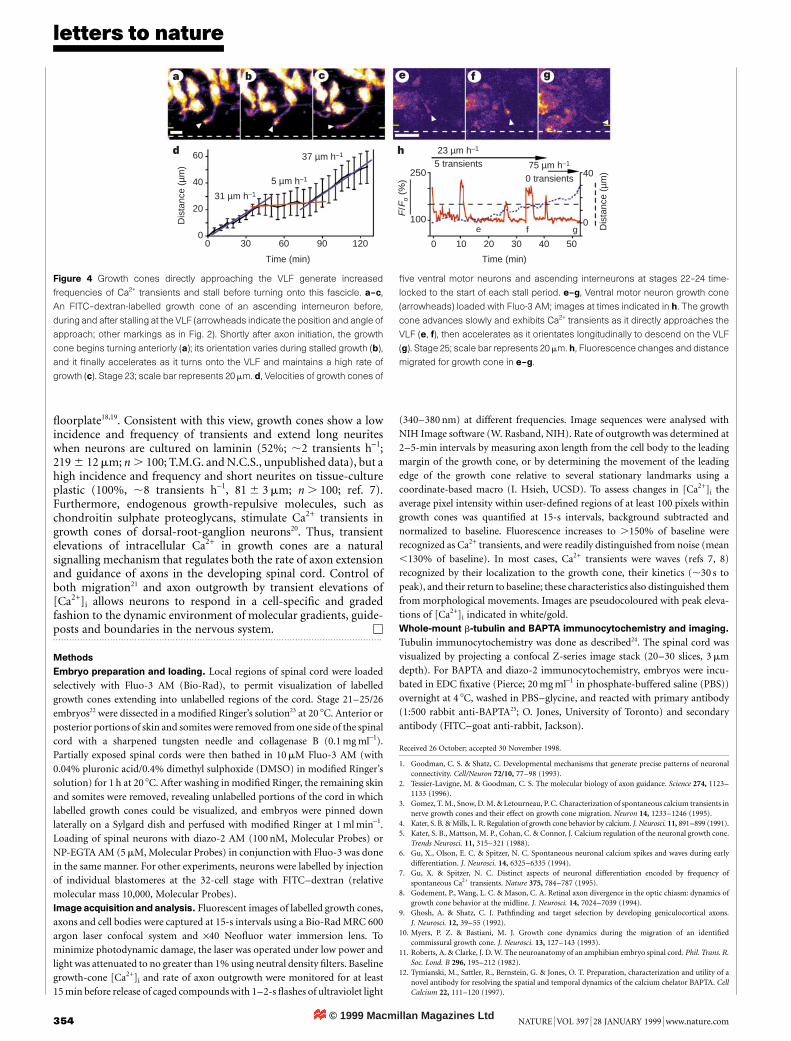
© 1999 Macmillan Magazines Ltd
letters to nature
354 NATURE | VOL 397 | 28 JANUARY 1999 | www.nature.com
¯oorplate18,19. Consistent with this view, growth cones show a lowincidence and frequency of transients and extend long neuriteswhen neurons are cultured on laminin (52%; ,2 transients h-1;219 6 12 mm; n . 100; T.M.G. and N.C.S., unpublished data), but ahigh incidence and frequency and short neurites on tissue-cultureplastic (100%, ,8 transients h-1, 81 6 3 mm; n . 100; ref. 7).Furthermore, endogenous growth-repulsive molecules, such aschondroitin sulphate proteoglycans, stimulate Ca2+ transients ingrowth cones of dorsal-root-ganglion neurons20. Thus, transientelevations of intracellular Ca2+ in growth cones are a naturalsignalling mechanism that regulates both the rate of axon extensionand guidance of axons in the developing spinal cord. Control ofboth migration21 and axon outgrowth by transient elevations of[Ca2+]i allows neurons to respond in a cell-speci®c and gradedfashion to the dynamic environment of molecular gradients, guide-posts and boundaries in the nervous system. M. . . . . . . . . . . . . . . . . . . . . . . . . . . . . . . . . . . . . . . . . . . . . . . . . . . . . . . . . . . . . . . . . . . . . . . . . . . . . . . . . . . . . . . . . . . . . . . . . . . . . . . . . . . . . . . . . . . . . . . . .
Methods
Embryo preparation and loading. Local regions of spinal cord were loaded
selectively with Fluo-3 AM (Bio-Rad), to permit visualization of labelled
growth cones extending into unlabelled regions of the cord. Stage 21±25/26
embryos22 were dissected in a modi®ed Ringer's solution23 at 20 8C. Anterior or
posterior portions of skin and somites were removed from one side of the spinal
cord with a sharpened tungsten needle and collagenase B (0.1 mg ml-1).
Partially exposed spinal cords were then bathed in 10 mM Fluo-3 AM (with
0.04% pluronic acid/0.4% dimethyl sulphoxide (DMSO) in modi®ed Ringer's
solution) for 1 h at 20 8C. After washing in modi®ed Ringer, the remaining skin
and somites were removed, revealing unlabelled portions of the cord in which
labelled growth cones could be visualized, and embryos were pinned down
laterally on a Sylgard dish and perfused with modi®ed Ringer at 1 ml min-1.
Loading of spinal neurons with diazo-2 AM (100 nM, Molecular Probes) or
NP-EGTA AM (5 mM, Molecular Probes) in conjunction with Fluo-3 was done
in the same manner. For other experiments, neurons were labelled by injection
of individual blastomeres at the 32-cell stage with FITC±dextran (relative
molecular mass 10,000, Molecular Probes).
Image acquisition and analysis. Fluorescent images of labelled growth cones,
axons and cell bodies were captured at 15-s intervals using a Bio-Rad MRC 600
argon laser confocal system and ´40 Neo¯uor water immersion lens. To
minimize photodynamic damage, the laser was operated under low power and
light was attenuated to no greater than 1% using neutral density ®lters. Baseline
growth-cone [Ca2+]i and rate of axon outgrowth were monitored for at least
15 min before release of caged compounds with 1±2-s ¯ashes of ultraviolet light
(340±380 nm) at different frequencies. Image sequences were analysed with
NIH Image software (W. Rasband, NIH). Rate of outgrowth was determined at
2±5-min intervals by measuring axon length from the cell body to the leading
margin of the growth cone, or by determining the movement of the leading
edge of the growth cone relative to several stationary landmarks using a
coordinate-based macro (I. Hsieh, UCSD). To assess changes in [Ca2+]i the
average pixel intensity within user-de®ned regions of at least 100 pixels within
growth cones was quanti®ed at 15-s intervals, background subtracted and
normalized to baseline. Fluorescence increases to .150% of baseline were
recognized as Ca2+ transients, and were readily distinguished from noise (mean
,130% of baseline). In most cases, Ca2+ transients were waves (refs 7, 8)
recognized by their localization to the growth cone, their kinetics (,30 s to
peak), and their return to baseline; these characteristics also distinguished them
from morphological movements. Images are pseudocoloured with peak eleva-
tions of [Ca2+]i indicated in white/gold.
Whole-mount b-tubulin and BAPTA immunocytochemistry and imaging.
Tubulin immunocytochemistry was done as described24. The spinal cord was
visualized by projecting a confocal Z-series image stack (20±30 slices, 3 mm
depth). For BAPTA and diazo-2 immunocytochemistry, embryos were incu-
bated in EDC ®xative (Pierce; 20 mg ml-1 in phosphate-buffered saline (PBS))
overnight at 4 8C, washed in PBS±glycine, and reacted with primary antibody
(1:500 rabbit anti-BAPTA25; O. Jones, University of Toronto) and secondary
antibody (FITC±goat anti-rabbit, Jackson).
Received 26 October; accepted 30 November 1998.
1. Goodman, C. S. & Shatz, C. Developmental mechanisms that generate precise patterns of neuronal
connectivity. Cell/Neuron 72/10, 77±98 (1993).
2. Tessier-Lavigne, M. & Goodman, C. S. The molecular biology of axon guidance. Science 274, 1123±1133 (1996).
3. Gomez, T. M., Snow, D. M. & Letourneau, P. C. Characterization of spontaneous calcium transients in
nerve growth cones and their effect on growth cone migration. Neuron 14, 1233±1246 (1995).
4. Kater, S. B. & Mills, L. R. Regulation of growth cone behavior by calcium. J. Neurosci. 11, 891±899 (1991).
5. Kater, S. B., Mattson, M. P., Cohan, C. & Connor, J. Calcium regulation of the neuronal growth cone.Trends Neurosci. 11, 315±321 (1988).
6. Gu, X., Olson, E. C. & Spitzer, N. C. Spontaneous neuronal calcium spikes and waves during early
differentiation. J. Neurosci. 14, 6325±6335 (1994).
7. Gu, X. & Spitzer, N. C. Distinct aspects of neuronal differentiation encoded by frequency of
spontaneous Ca2+ transients. Nature 375, 784±787 (1995).8. Godement, P., Wang, L. C. & Mason, C. A. Retinal axon divergence in the optic chiasm: dynamics of
growth cone behavior at the midline. J. Neurosci. 14, 7024±7039 (1994).
9. Ghosh, A. & Shatz, C. J. Path®nding and target selection by developing geniculocortical axons.
J. Neurosci. 12, 39±55 (1992).
10. Myers, P. Z. & Bastiani, M. J. Growth cone dynamics during the migration of an identi®edcommissural growth cone. J. Neurosci. 13, 127±143 (1993).
11. Roberts, A. & Clarke, J. D. W. The neuroanatomy of an amphibian embryo spinal cord. Phil. Trans. R.
Soc. Lond. B 296, 195±212 (1982).
12. Tymianski, M., Sattler, R., Bernstein, G. & Jones, O. T. Preparation, characterization and utility of a
novel antibody for resolving the spatial and temporal dynamics of the calcium chelator BAPTA. CellCalcium 22, 111±120 (1997).
23 µm h–1
31 µm h–1
5 µm h–1
37 µm h–1
5 transients 75 µm h–1
0 transientsD
ista
nce
(µm
)
Dis
tanc
e (µ
m)40
0
250
100
0 10 20 30 40 500 30 60 90 120
Time (min)Time (min)
e f g
F/F
o (
%)
hd
a b c e f g
60
40
20
0
Figure 4 Growth cones directly approaching the VLF generate increased
frequencies of Ca2+ transients and stall before turning onto this fascicle. a±c,
An FITC±dextran-labelled growth cone of an ascending interneuron before,
during and after stalling at the VLF (arrowheads indicate the position and angle of
approach; other markings as in Fig. 2). Shortly after axon initiation, the growth
cone begins turning anteriorly (a); its orientation varies during stalled growth (b),
and it ®nally accelerates as it turns onto the VLF and maintains a high rate of
growth (c). Stage 23; scale bar represents 20 mm. d, Velocities of growth cones of
®ve ventral motor neurons and ascending interneurons at stages 22±24 time-
locked to the start of each stall period. e±g, Ventral motor neuron growth cone
(arrowheads) loaded with Fluo-3 AM; images at times indicated in h. The growth
cone advances slowly and exhibits Ca2+ transients as it directly approaches the
VLF (e, f), then accelerates as it orientates longitudinally to descend on the VLF
(g). Stage 25; scale bar represents 20 mm. h, Fluorescence changes and distance
migrated for growth cone in e±g.
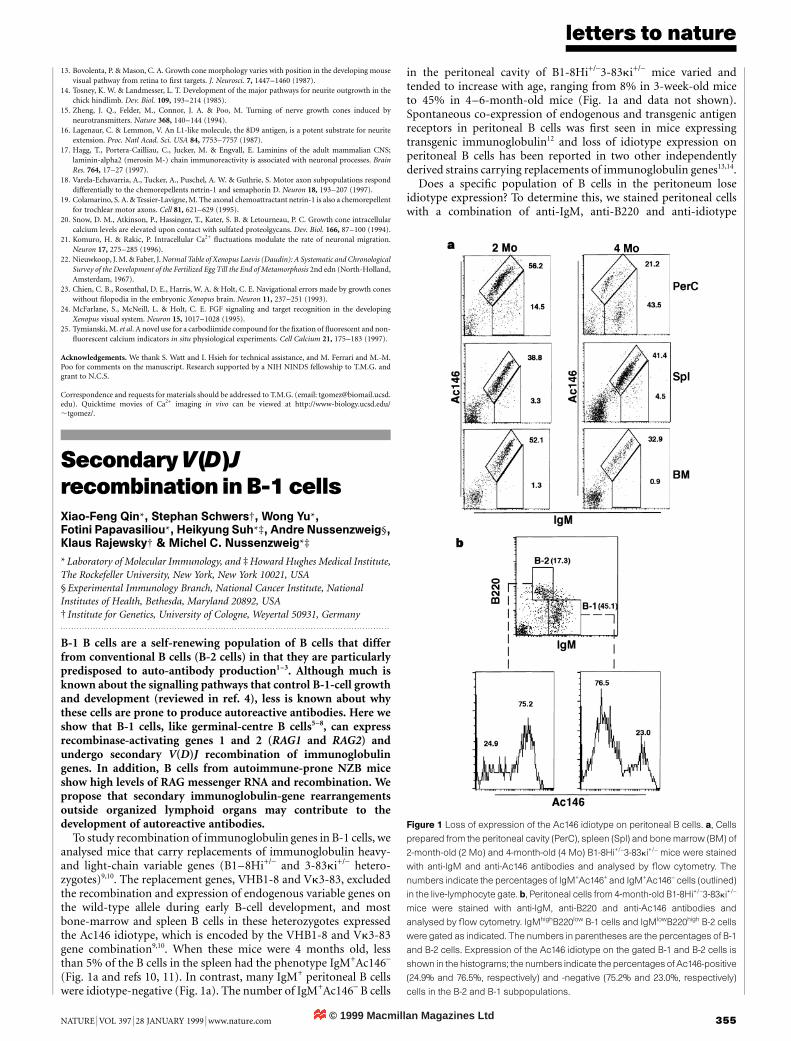
© 1999 Macmillan Magazines Ltd
letters to nature
NATURE | VOL 397 | 28 JANUARY 1999 | www.nature.com 355
13. Bovolenta, P. & Mason, C. A. Growth cone morphology varies with position in the developing mouse
visual pathway from retina to ®rst targets. J. Neurosci. 7, 1447±1460 (1987).14. Tosney, K. W. & Landmesser, L. T. Development of the major pathways for neurite outgrowth in the
chick hindlimb. Dev. Biol. 109, 193±214 (1985).
15. Zheng, J. Q., Felder, M., Connor, J. A. & Poo, M. Turning of nerve growth cones induced by
neurotransmitters. Nature 368, 140±144 (1994).
16. Lagenaur, C. & Lemmon, V. An L1-like molecule, the 8D9 antigen, is a potent substrate for neuriteextension. Proc. Natl Acad. Sci. USA 84, 7753±7757 (1987).
17. Hagg, T., Portera-Cailliau, C., Jucker, M. & Engvall, E. Laminins of the adult mammalian CNS;
laminin-alpha2 (merosin M-) chain immunoreactivity is associated with neuronal processes. Brain
Res. 764, 17±27 (1997).
18. Varela-Echavarria, A., Tucker, A., Puschel, A. W. & Guthrie, S. Motor axon subpopulations responddifferentially to the chemorepellents netrin-1 and semaphorin D. Neuron 18, 193±207 (1997).
19. Colamarino, S. A. & Tessier-Lavigne, M. The axonal chemoattractant netrin-1 is also a chemorepellent
for trochlear motor axons. Cell 81, 621±629 (1995).
20. Snow, D. M., Atkinson, P., Hassinger, T., Kater, S. B. & Letourneau, P. C. Growth cone intracellular
calcium levels are elevated upon contact with sulfated proteolgycans. Dev. Biol. 166, 87±100 (1994).21. Komuro, H. & Rakic, P. Intracellular Ca2+ ¯uctuations modulate the rate of neuronal migration.
Neuron 17, 275±285 (1996).
22. Nieuwkoop, J. M. & Faber, J. Normal Table of Xenopus Laevis (Daudin): A Systematic and Chronological
Survey of the Development of the Fertilized Egg Till the End of Metamorphosis 2nd edn (North-Holland,Amsterdam, 1967).
23. Chien, C. B., Rosenthal, D. E., Harris, W. A. & Holt, C. E. Navigational errors made by growth cones
without ®lopodia in the embryonic Xenopus brain. Neuron 11, 237±251 (1993).
24. McFarlane, S., McNeill, L. & Holt, C. E. FGF signaling and target recognition in the developing
Xenopus visual system. Neuron 15, 1017±1028 (1995).25. Tymianski, M. et al. A novel use for a carbodiimide compound for the ®xation of ¯uorescent and non-
¯uorescent calcium indicators in situ physiological experiments. Cell Calcium 21, 175±183 (1997).
Acknowledgements. We thank S. Watt and I. Hsieh for technical assistance, and M. Ferrari and M.-M.Poo for comments on the manuscript. Research supported by a NIH NINDS fellowship to T.M.G. andgrant to N.C.S.
Correspondence and requests for materials should be addressed to T.M.G. (email: [email protected]). Quicktime movies of Ca2+ imaging in vivo can be viewed at http://www-biology.ucsd.edu/,tgomez/.
SecondaryV(D)Jrecombination inB-1cellsXiao-Feng Qin*, Stephan Schwers², Wong Yu*,Fotini Papavasiliou*, Heikyung Suh*³, Andre Nussenzweig§,Klaus Rajewsky² & Michel C. Nussenzweig*³
* Laboratory of Molecular Immunology, and ³ Howard Hughes Medical Institute,
The Rockefeller University, New York, New York 10021, USA
§ Experimental Immunology Branch, National Cancer Institute, NationalInstitutes of Health, Bethesda, Maryland 20892, USA² Institute for Genetics, University of Cologne, Weyertal 50931, Germany. . . . . . . . . . . . . . . . . . . . . . . . . . . . . . . . . . . . . . . . . . . . . . . . . . . . . . . . . . . . . . . . . . . . . . . . . . . . . . . . . . . . . . . . . . . . . . . . . . . . . . . . . . . . . . . . . . . . . . . . .
B-1 B cells are a self-renewing population of B cells that differfrom conventional B cells (B-2 cells) in that they are particularlypredisposed to auto-antibody production1±3. Although much isknown about the signalling pathways that control B-1-cell growthand development (reviewed in ref. 4), less is known about whythese cells are prone to produce autoreactive antibodies. Here weshow that B-1 cells, like germinal-centre B cells5±8, can expressrecombinase-activating genes 1 and 2 (RAG1 and RAG2) andundergo secondary V(D)J recombination of immunoglobulingenes. In addition, B cells from autoimmune-prone NZB miceshow high levels of RAG messenger RNA and recombination. Wepropose that secondary immunoglobulin-gene rearrangementsoutside organized lymphoid organs may contribute to thedevelopment of autoreactive antibodies.
To study recombination of immunoglobulin genes in B-1 cells, weanalysed mice that carry replacements of immunoglobulin heavy-and light-chain variable genes (B1±8Hi+/- and 3-83ki+/- hetero-zygotes)9,10. The replacement genes, VHB1-8 and Vk3-83, excludedthe recombination and expression of endogenous variable genes onthe wild-type allele during early B-cell development, and mostbone-marrow and spleen B cells in these heterozygotes expressedthe Ac146 idiotype, which is encoded by the VHB1-8 and Vk3-83gene combination9,10. When these mice were 4 months old, lessthan 5% of the B cells in the spleen had the phenotype IgM+Ac146-
(Fig. 1a and refs 10, 11). In contrast, many IgM+ peritoneal B cellswere idiotype-negative (Fig. 1a). The number of IgM+Ac146- B cells
in the peritoneal cavity of B1-8Hi+/-3-83ki+/- mice varied andtended to increase with age, ranging from 8% in 3-week-old miceto 45% in 4±6-month-old mice (Fig. 1a and data not shown).Spontaneous co-expression of endogenous and transgenic antigenreceptors in peritoneal B cells was ®rst seen in mice expressingtransgenic immunoglobulin12 and loss of idiotype expression onperitoneal B cells has been reported in two other independentlyderived strains carrying replacements of immunoglobulin genes13,14.
Does a speci®c population of B cells in the peritoneum loseidiotype expression? To determine this, we stained peritoneal cellswith a combination of anti-IgM, anti-B220 and anti-idiotype
Figure 1 Loss of expression of the Ac146 idiotype on peritoneal B cells. a, Cells
prepared from the peritoneal cavity (PerC), spleen (Spl) and bone marrow (BM) of
2-month-old (2 Mo) and 4-month-old (4 Mo) B1-8Hi+/-3-83ki+/- mice were stained
with anti-IgM and anti-Ac146 antibodies and analysed by ¯ow cytometry. The
numbers indicate the percentages of IgM+Ac146+ and IgM+Ac146- cells (outlined)
in the live-lymphocyte gate. b, Peritoneal cells from 4-month-old B1-8Hi+/-3-83ki+/-
mice were stained with anti-IgM, anti-B220 and anti-Ac146 antibodies and
analysed by ¯ow cytometry. IgMhighB220low B-1 cells and IgMlowB220high B-2 cells
were gated as indicated. The numbers in parentheses are the percentages of B-1
and B-2 cells. Expression of the Ac146 idiotype on the gated B-1 and B-2 cells is
shown in the histograms; the numbers indicate the percentages of Ac146-positive
(24.9% and 76.5%, respectively) and -negative (75.2% and 23.0%, respectively)
cells in the B-2 and B-1 subpopulations.
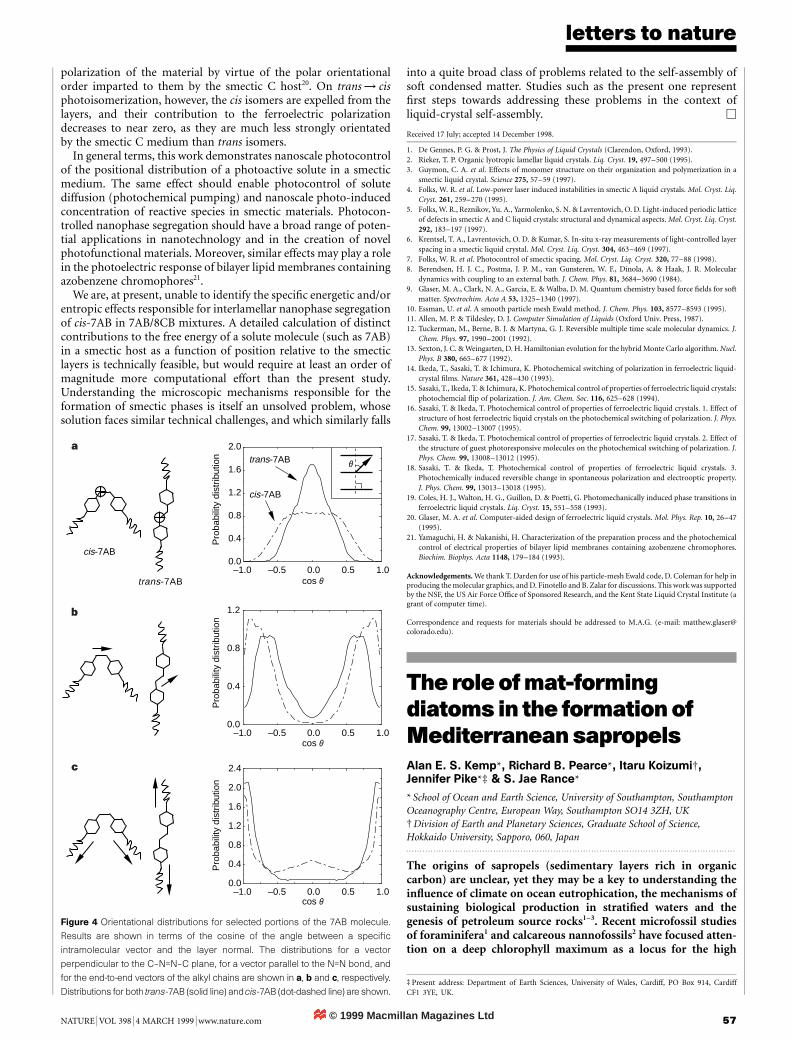
© 1999 Macmillan Magazines Ltd
letters to nature
NATURE | VOL 398 | 4 MARCH 1999 | www.nature.com 57
polarization of the material by virtue of the polar orientationalorder imparted to them by the smectic C host20. On trans ! cisphotoisomerization, however, the cis isomers are expelled from thelayers, and their contribution to the ferroelectric polarizationdecreases to near zero, as they are much less strongly orientatedby the smectic C medium than trans isomers.
In general terms, this work demonstrates nanoscale photocontrolof the positional distribution of a photoactive solute in a smecticmedium. The same effect should enable photocontrol of solutediffusion (photochemical pumping) and nanoscale photo-inducedconcentration of reactive species in smectic materials. Photocon-trolled nanophase segregation should have a broad range of poten-tial applications in nanotechnology and in the creation of novelphotofunctional materials. Moreover, similar effects may play a rolein the photoelectric response of bilayer lipid membranes containingazobenzene chromophores21.
We are, at present, unable to identify the speci®c energetic and/orentropic effects responsible for interlamellar nanophase segregationof cis-7AB in 7AB/8CB mixtures. A detailed calculation of distinctcontributions to the free energy of a solute molecule (such as 7AB)in a smectic host as a function of position relative to the smecticlayers is technically feasible, but would require at least an order ofmagnitude more computational effort than the present study.Understanding the microscopic mechanisms responsible for theformation of smectic phases is itself an unsolved problem, whosesolution faces similar technical challenges, and which similarly falls
into a quite broad class of problems related to the self-assembly ofsoft condensed matter. Studies such as the present one represent®rst steps towards addressing these problems in the context ofliquid-crystal self-assembly. M
Received 17 July; accepted 14 December 1998.
1. De Gennes, P. G. & Prost, J. The Physics of Liquid Crystals (Clarendon, Oxford, 1993).
2. Rieker, T. P. Organic lyotropic lamellar liquid crystals. Liq. Cryst. 19, 497±500 (1995).3. Guymon, C. A. et al. Effects of monomer structure on their organization and polymerization in a
smectic liquid crystal. Science 275, 57±59 (1997).
4. Folks, W. R. et al. Low-power laser induced instabilities in smectic A liquid crystals. Mol. Cryst. Liq.
Cryst. 261, 259±270 (1995).
5. Folks, W. R., Reznikov, Yu. A., Yarmolenko, S. N. & Lavrentovich, O. D. Light-induced periodic latticeof defects in smectic A and C liquid crystals: structural and dynamical aspects. Mol. Cryst. Liq. Cryst.
292, 183±197 (1997).
6. Krentsel, T. A., Lavrentovich, O. D. & Kumar, S. In-situ x-ray measurements of light-controlled layer
spacing in a smectic liquid crystal. Mol. Cryst. Liq. Cryst. 304, 463±469 (1997).
7. Folks, W. R. et al. Photocontrol of smectic spacing. Mol. Cryst. Liq. Cryst. 320, 77±88 (1998).8. Berendsen, H. J. C., Postma, J. P. M., van Gunsteren, W. F., Dinola, A. & Haak, J. R. Molecular
dynamics with coupling to an external bath. J. Chem. Phys. 81, 3684±3690 (1984).
9. Glaser, M. A., Clark, N. A., Garcia, E. & Walba, D. M. Quantum chemistry based force ®elds for soft
matter. Spectrochim. Acta A 53, 1325±1340 (1997).
10. Essman, U. et al. A smooth particle mesh Ewald method. J. Chem. Phys. 103, 8577±8593 (1995).11. Allen, M. P. & Tildesley, D. J. Computer Simulation of Liquids (Oxford Univ. Press, 1987).
12. Tuckerman, M., Berne, B. J. & Martyna, G. J. Reversible multiple time scale molecular dynamics. J.
Chem. Phys. 97, 1990±2001 (1992).
13. Sexton, J. C. & Weingarten, D. H. Hamiltonian evolution for the hybrid Monte Carlo algorithm. Nucl.
Phys. B 380, 665±677 (1992).14. Ikeda, T., Sasaki, T. & Ichimura, K. Photochemical switching of polarization in ferroelectric liquid-
crystal ®lms. Nature 361, 428±430 (1993).
15. Sasaki, T., Ikeda, T. & Ichimura, K. Photochemical control of properties of ferroelectric liquid crystals:
photochemcial ¯ip of polarization. J. Am. Chem. Soc. 116, 625±628 (1994).
16. Sasaki, T. & Ikeda, T. Photochemical control of properties of ferroelectric liquid crystals. 1. Effect ofstructure of host ferroelectric liquid crystals on the photochemical switching of polarization. J. Phys.
Chem. 99, 13002±13007 (1995).
17. Sasaki, T. & Ikeda, T. Photochemical control of properties of ferroelectric liquid crystals. 2. Effect of
the structure of guest photoresponsive molecules on the photochemical switching of polarization. J.Phys. Chem. 99, 13008±13012 (1995).
18. Sasaki, T. & Ikeda, T. Photochemical control of properties of ferroelectric liquid crystals. 3.
Photochemically induced reversible change in spontaneous polarization and electrooptic property.
J. Phys. Chem. 99, 13013±13018 (1995).
19. Coles, H. J., Walton, H. G., Guillon, D. & Poetti, G. Photomechanically induced phase transitions inferroelectric liquid crystals. Liq. Cryst. 15, 551±558 (1993).
20. Glaser, M. A. et al. Computer-aided design of ferroelectric liquid crystals. Mol. Phys. Rep. 10, 26±47
(1995).
21. Yamaguchi, H. & Nakanishi, H. Characterization of the preparation process and the photochemical
control of electrical properties of bilayer lipid membranes containing azobenzene chromophores.Biochim. Biophys. Acta 1148, 179±184 (1993).
Acknowledgements. We thank T. Darden for use of his particle-mesh Ewald code, D. Coleman for help inproducing the molecular graphics, and D. Finotello and B. Zalar for discussions. This work was supportedby the NSF, the US Air Force Of®ce of Sponsored Research, and the Kent State Liquid Crystal Institute (agrant of computer time).
Correspondence and requests for materials should be addressed to M.A.G. (e-mail: [email protected]).
–1.0 –0.5 0.0 0.5 1.0cos θ
cos θ
cos θ
0.0
0.4
0.8
1.2
1.6
2.0
Pro
babi
lity
dist
ribut
ion
–1.0 –0.5 0.0 0.5 1.00.0
0.4
0.8
1.2
Pro
babi
lity
dist
ribut
ion
–1.0 –0.5 0.0 0.5 1.00.0
0.4
0.8
1.2
1.6
2.0
2.4
Pro
babi
lity
dist
ribut
ion
cis-7AB
trans-7AB
trans-7AB
cis-7AB
θ
a
b
c
Figure 4 Orientational distributions for selected portions of the 7AB molecule.
Results are shown in terms of the cosine of the angle between a speci®c
intramolecular vector and the layer normal. The distributions for a vector
perpendicular to the C±N=N±C plane, for a vector parallel to the N=N bond, and
for the end-to-end vectors of the alkyl chains are shown in a, b and c, respectively.
Distributions for both trans-7AB (solid line) and cis-7AB (dot-dashed line) are shown.
The roleofmat-formingdiatoms in the formationofMediterraneansapropelsAlan E. S. Kemp*, Richard B. Pearce*, Itaru Koizumi²,Jennifer Pike*³ & S. Jae Rance*
* School of Ocean and Earth Science, University of Southampton, Southampton
Oceanography Centre, European Way, Southampton SO14 3ZH, UK² Division of Earth and Planetary Sciences, Graduate School of Science,Hokkaido University, Sapporo, 060, Japan. . . . . . . . . . . . . . . . . . . . . . . . . . . . . . . . . . . . . . . . . . . . . . . . . . . . . . . . . . . . . . . . . . . . . . . . . . . . . . . . . . . . . . . . . . . . . . . . . . . . . . . . . . . . . . . . . . . . . . . . .
The origins of sapropels (sedimentary layers rich in organiccarbon) are unclear, yet they may be a key to understanding thein¯uence of climate on ocean eutrophication, the mechanisms ofsustaining biological production in strati®ed waters and thegenesis of petroleum source rocks1±3. Recent microfossil studiesof foraminifera1 and calcareous nannofossils2 have focused atten-tion on a deep chlorophyll maximum as a locus for the high
³ Present address: Department of Earth Sciences, University of Wales, Cardiff, PO Box 914, Cardiff
CF1 3YE, UK.
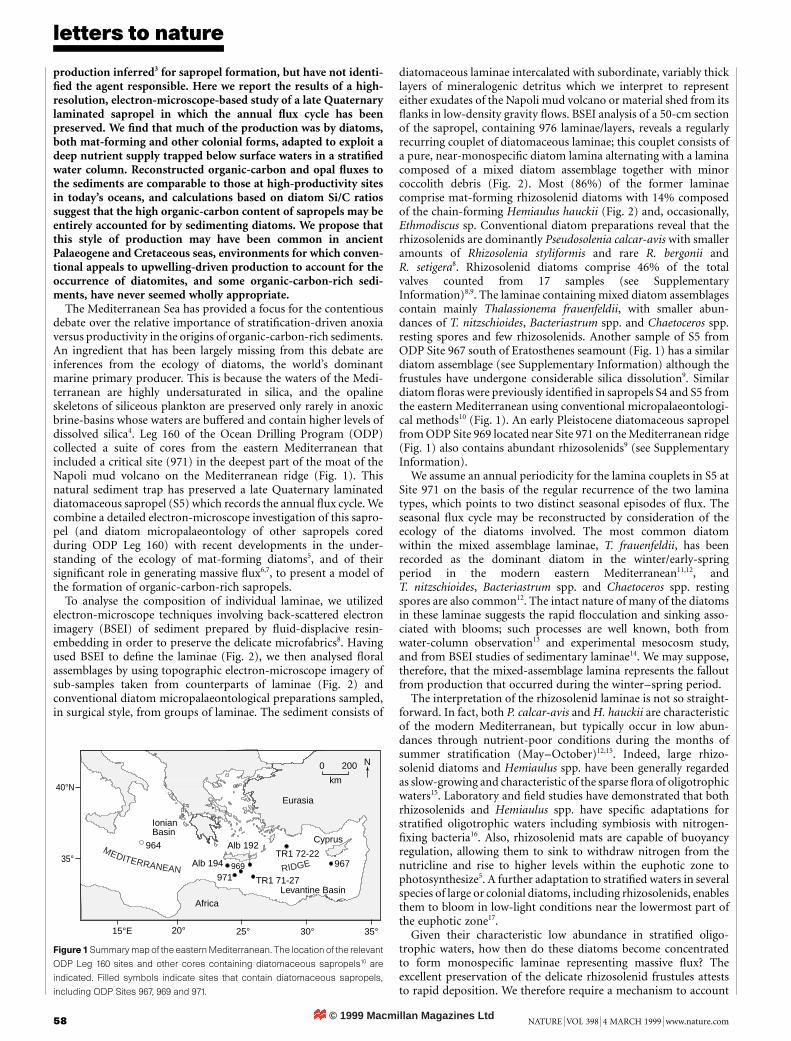
© 1999 Macmillan Magazines Ltd
letters to nature
58 NATURE | VOL 398 | 4 MARCH 1999 | www.nature.com
production inferred3 for sapropel formation, but have not identi-®ed the agent responsible. Here we report the results of a high-resolution, electron-microscope-based study of a late Quaternarylaminated sapropel in which the annual ¯ux cycle has beenpreserved. We ®nd that much of the production was by diatoms,both mat-forming and other colonial forms, adapted to exploit adeep nutrient supply trapped below surface waters in a strati®edwater column. Reconstructed organic-carbon and opal ¯uxes tothe sediments are comparable to those at high-productivity sitesin today's oceans, and calculations based on diatom Si/C ratiossuggest that the high organic-carbon content of sapropels may beentirely accounted for by sedimenting diatoms. We propose thatthis style of production may have been common in ancientPalaeogene and Cretaceous seas, environments for which conven-tional appeals to upwelling-driven production to account for theoccurrence of diatomites, and some organic-carbon-rich sedi-ments, have never seemed wholly appropriate.
The Mediterranean Sea has provided a focus for the contentiousdebate over the relative importance of strati®cation-driven anoxiaversus productivity in the origins of organic-carbon-rich sediments.An ingredient that has been largely missing from this debate areinferences from the ecology of diatoms, the world's dominantmarine primary producer. This is because the waters of the Medi-terranean are highly undersaturated in silica, and the opalineskeletons of siliceous plankton are preserved only rarely in anoxicbrine-basins whose waters are buffered and contain higher levels ofdissolved silica4. Leg 160 of the Ocean Drilling Program (ODP)collected a suite of cores from the eastern Mediterranean thatincluded a critical site (971) in the deepest part of the moat of theNapoli mud volcano on the Mediterranean ridge (Fig. 1). Thisnatural sediment trap has preserved a late Quaternary laminateddiatomaceous sapropel (S5) which records the annual ¯ux cycle. Wecombine a detailed electron-microscope investigation of this sapro-pel (and diatom micropalaeontology of other sapropels coredduring ODP Leg 160) with recent developments in the under-standing of the ecology of mat-forming diatoms5, and of theirsigni®cant role in generating massive ¯ux6,7, to present a model ofthe formation of organic-carbon-rich sapropels.
To analyse the composition of individual laminae, we utilizedelectron-microscope techniques involving back-scattered electronimagery (BSEI) of sediment prepared by ¯uid-displacive resin-embedding in order to preserve the delicate microfabrics8. Havingused BSEI to de®ne the laminae (Fig. 2), we then analysed ¯oralassemblages by using topographic electron-microscope imagery ofsub-samples taken from counterparts of laminae (Fig. 2) andconventional diatom micropalaeontological preparations sampled,in surgical style, from groups of laminae. The sediment consists of
diatomaceous laminae intercalated with subordinate, variably thicklayers of mineralogenic detritus which we interpret to representeither exudates of the Napoli mud volcano or material shed from its¯anks in low-density gravity ¯ows. BSEI analysis of a 50-cm sectionof the sapropel, containing 976 laminae/layers, reveals a regularlyrecurring couplet of diatomaceous laminae; this couplet consists ofa pure, near-monospeci®c diatom lamina alternating with a laminacomposed of a mixed diatom assemblage together with minorcoccolith debris (Fig. 2). Most (86%) of the former laminaecomprise mat-forming rhizosolenid diatoms with 14% composedof the chain-forming Hemiaulus hauckii (Fig. 2) and, occasionally,Ethmodiscus sp. Conventional diatom preparations reveal that therhizosolenids are dominantly Pseudosolenia calcar-avis with smalleramounts of Rhizosolenia styliformis and rare R. bergonii andR. setigera8. Rhizosolenid diatoms comprise 46% of the totalvalves counted from 17 samples (see SupplementaryInformation)8,9. The laminae containing mixed diatom assemblagescontain mainly Thalassionema frauenfeldii, with smaller abun-dances of T. nitzschioides, Bacteriastrum spp. and Chaetoceros spp.resting spores and few rhizosolenids. Another sample of S5 fromODP Site 967 south of Eratosthenes seamount (Fig. 1) has a similardiatom assemblage (see Supplementary Information) although thefrustules have undergone considerable silica dissolution9. Similardiatom ¯oras were previously identi®ed in sapropels S4 and S5 fromthe eastern Mediterranean using conventional micropalaeontologi-cal methods10 (Fig. 1). An early Pleistocene diatomaceous sapropelfrom ODP Site 969 located near Site 971 on the Mediterranean ridge(Fig. 1) also contains abundant rhizosolenids9 (see SupplementaryInformation).
We assume an annual periodicity for the lamina couplets in S5 atSite 971 on the basis of the regular recurrence of the two laminatypes, which points to two distinct seasonal episodes of ¯ux. Theseasonal ¯ux cycle may be reconstructed by consideration of theecology of the diatoms involved. The most common diatomwithin the mixed assemblage laminae, T. frauenfeldii, has beenrecorded as the dominant diatom in the winter/early-springperiod in the modern eastern Mediterranean11,12, andT. nitzschioides, Bacteriastrum spp. and Chaetoceros spp. restingspores are also common12. The intact nature of many of the diatomsin these laminae suggests the rapid ¯occulation and sinking asso-ciated with blooms; such processes are well known, both fromwater-column observation13 and experimental mesocosm study,and from BSEI studies of sedimentary laminae14. We may suppose,therefore, that the mixed-assemblage lamina represents the falloutfrom production that occurred during the winter±spring period.
The interpretation of the rhizosolenid laminae is not so straight-forward. In fact, both P. calcar-avis and H. hauckii are characteristicof the modern Mediterranean, but typically occur in low abun-dances through nutrient-poor conditions during the months ofsummer strati®cation (May±October)12,15. Indeed, large rhizo-solenid diatoms and Hemiaulus spp. have been generally regardedas slow-growing and characteristic of the sparse ¯ora of oligotrophicwaters15. Laboratory and ®eld studies have demonstrated that bothrhizosolenids and Hemiaulus spp. have speci®c adaptations forstrati®ed oligotrophic waters including symbiosis with nitrogen-®xing bacteria16. Also, rhizosolenid mats are capable of buoyancyregulation, allowing them to sink to withdraw nitrogen from thenutricline and rise to higher levels within the euphotic zone tophotosynthesize5. A further adaptation to strati®ed waters in severalspecies of large or colonial diatoms, including rhizosolenids, enablesthem to bloom in low-light conditions near the lowermost part ofthe euphotic zone17.
Given their characteristic low abundance in strati®ed oligo-trophic waters, how then do these diatoms become concentratedto form monospeci®c laminae representing massive ¯ux? Theexcellent preservation of the delicate rhizosolenid frustules atteststo rapid deposition. We therefore require a mechanism to account
IonianBasin
15°E 20° 25°
35°
40°N
Africa
Eurasia
N
Cyprus
Levantine Basin
30° 35°
Alb 194
Alb 192
969971
967
964TR1 72-22
TR1 71-27
0 200
km
MEDITERRANEAN RIDGE
Figure1Summary map of the eastern Mediterranean. The location of the relevant
ODP Leg 160 sites and other cores containing diatomaceous sapropels10 are
indicated. Filled symbols indicate sites that contain diatomaceous sapropels,
including ODP Sites 967, 969 and 971.
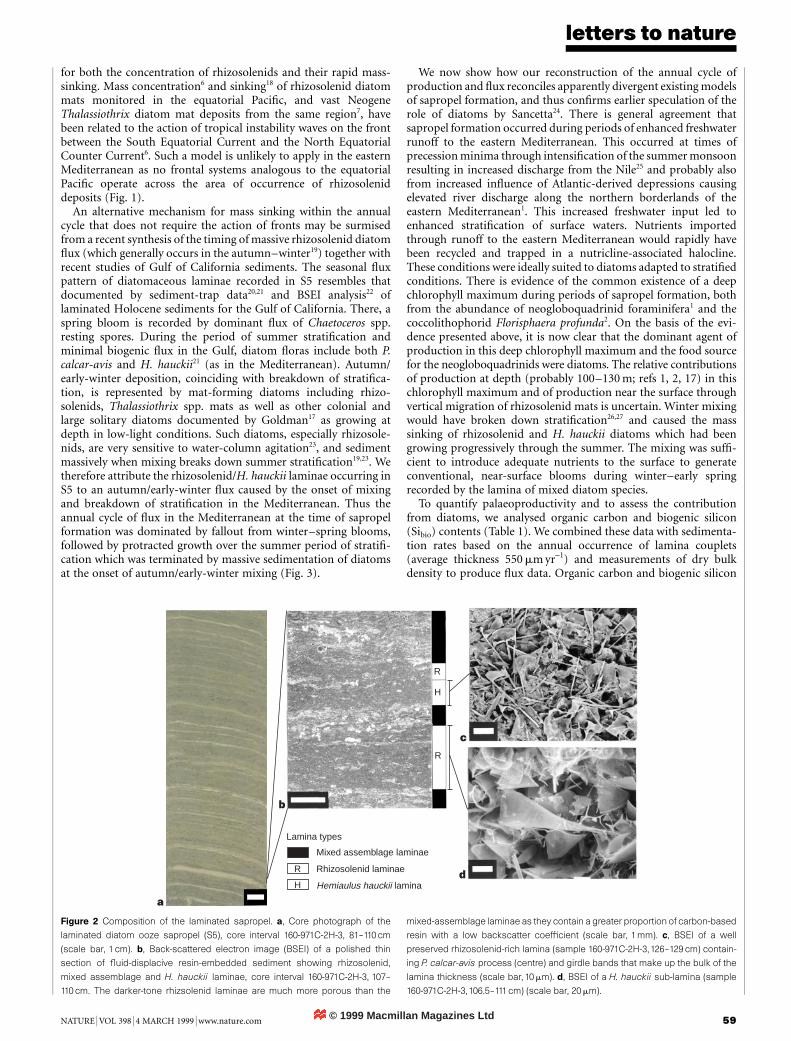
© 1999 Macmillan Magazines Ltd
letters to nature
NATURE | VOL 398 | 4 MARCH 1999 | www.nature.com 59
for both the concentration of rhizosolenids and their rapid mass-sinking. Mass concentration6 and sinking18 of rhizosolenid diatommats monitored in the equatorial Paci®c, and vast NeogeneThalassiothrix diatom mat deposits from the same region7, havebeen related to the action of tropical instability waves on the frontbetween the South Equatorial Current and the North EquatorialCounter Current6. Such a model is unlikely to apply in the easternMediterranean as no frontal systems analogous to the equatorialPaci®c operate across the area of occurrence of rhizosoleniddeposits (Fig. 1).
An alternative mechanism for mass sinking within the annualcycle that does not require the action of fronts may be surmisedfrom a recent synthesis of the timing of massive rhizosolenid diatom¯ux (which generally occurs in the autumn±winter19) together withrecent studies of Gulf of California sediments. The seasonal ¯uxpattern of diatomaceous laminae recorded in S5 resembles thatdocumented by sediment-trap data20,21 and BSEI analysis22 oflaminated Holocene sediments for the Gulf of California. There, aspring bloom is recorded by dominant ¯ux of Chaetoceros spp.resting spores. During the period of summer strati®cation andminimal biogenic ¯ux in the Gulf, diatom ¯oras include both P.calcar-avis and H. hauckii21 (as in the Mediterranean). Autumn/early-winter deposition, coinciding with breakdown of strati®ca-tion, is represented by mat-forming diatoms including rhizo-solenids, Thalassiothrix spp. mats as well as other colonial andlarge solitary diatoms documented by Goldman17 as growing atdepth in low-light conditions. Such diatoms, especially rhizosole-nids, are very sensitive to water-column agitation23, and sedimentmassively when mixing breaks down summer strati®cation19,23. Wetherefore attribute the rhizosolenid/H. hauckii laminae occurring inS5 to an autumn/early-winter ¯ux caused by the onset of mixingand breakdown of strati®cation in the Mediterranean. Thus theannual cycle of ¯ux in the Mediterranean at the time of sapropelformation was dominated by fallout from winter±spring blooms,followed by protracted growth over the summer period of strati®-cation which was terminated by massive sedimentation of diatomsat the onset of autumn/early-winter mixing (Fig. 3).
We now show how our reconstruction of the annual cycle ofproduction and ¯ux reconciles apparently divergent existing modelsof sapropel formation, and thus con®rms earlier speculation of therole of diatoms by Sancetta24. There is general agreement thatsapropel formation occurred during periods of enhanced freshwaterrunoff to the eastern Mediterranean. This occurred at times ofprecession minima through intensi®cation of the summer monsoonresulting in increased discharge from the Nile25 and probably alsofrom increased in¯uence of Atlantic-derived depressions causingelevated river discharge along the northern borderlands of theeastern Mediterranean1. This increased freshwater input led toenhanced strati®cation of surface waters. Nutrients importedthrough runoff to the eastern Mediterranean would rapidly havebeen recycled and trapped in a nutricline-associated halocline.These conditions were ideally suited to diatoms adapted to strati®edconditions. There is evidence of the common existence of a deepchlorophyll maximum during periods of sapropel formation, bothfrom the abundance of neogloboquadrinid foraminifera1 and thecoccolithophorid Florisphaera profunda2. On the basis of the evi-dence presented above, it is now clear that the dominant agent ofproduction in this deep chlorophyll maximum and the food sourcefor the neogloboquadrinids were diatoms. The relative contributionsof production at depth (probably 100±130 m; refs 1, 2, 17) in thischlorophyll maximum and of production near the surface throughvertical migration of rhizosolenid mats is uncertain. Winter mixingwould have broken down strati®cation26,27 and caused the masssinking of rhizosolenid and H. hauckii diatoms which had beengrowing progressively through the summer. The mixing was suf®-cient to introduce adequate nutrients to the surface to generateconventional, near-surface blooms during winter±early springrecorded by the lamina of mixed diatom species.
To quantify palaeoproductivity and to assess the contributionfrom diatoms, we analysed organic carbon and biogenic silicon(Sibio) contents (Table 1). We combined these data with sedimenta-tion rates based on the annual occurrence of lamina couplets(average thickness 550 mm yr-1) and measurements of dry bulkdensity to produce ¯ux data. Organic carbon and biogenic silicon
a
b
c
d
R
R
H
Lamina types
R
H
Mixed assemblage laminae
Rhizosolenid laminae
Hemiaulus hauckii lamina
Figure 2 Composition of the laminated sapropel. a, Core photograph of the
laminated diatom ooze sapropel (S5), core interval 160-971C-2H-3, 81±110 cm
(scale bar, 1 cm). b, Back-scattered electron image (BSEI) of a polished thin
section of ¯uid-displacive resin-embedded sediment showing rhizosolenid,
mixed assemblage and H. hauckii laminae, core interval 160-971C-2H-3, 107±
110 cm. The darker-tone rhizsolenid laminae are much more porous than the
mixed-assemblage laminae as they contain a greater proportion of carbon-based
resin with a low backscatter coef®cient (scale bar, 1mm). c, BSEI of a well
preserved rhizosolenid-rich lamina (sample 160-971C-2H-3,126±129 cm) contain-
ing P. calcar-avis process (centre) and girdle bands that make up the bulk of the
lamina thickness (scale bar, 10 mm). d, BSEI of a H. hauckii sub-lamina (sample
160-971C-2H-3,106.5±111 cm) (scale bar, 20 mm).
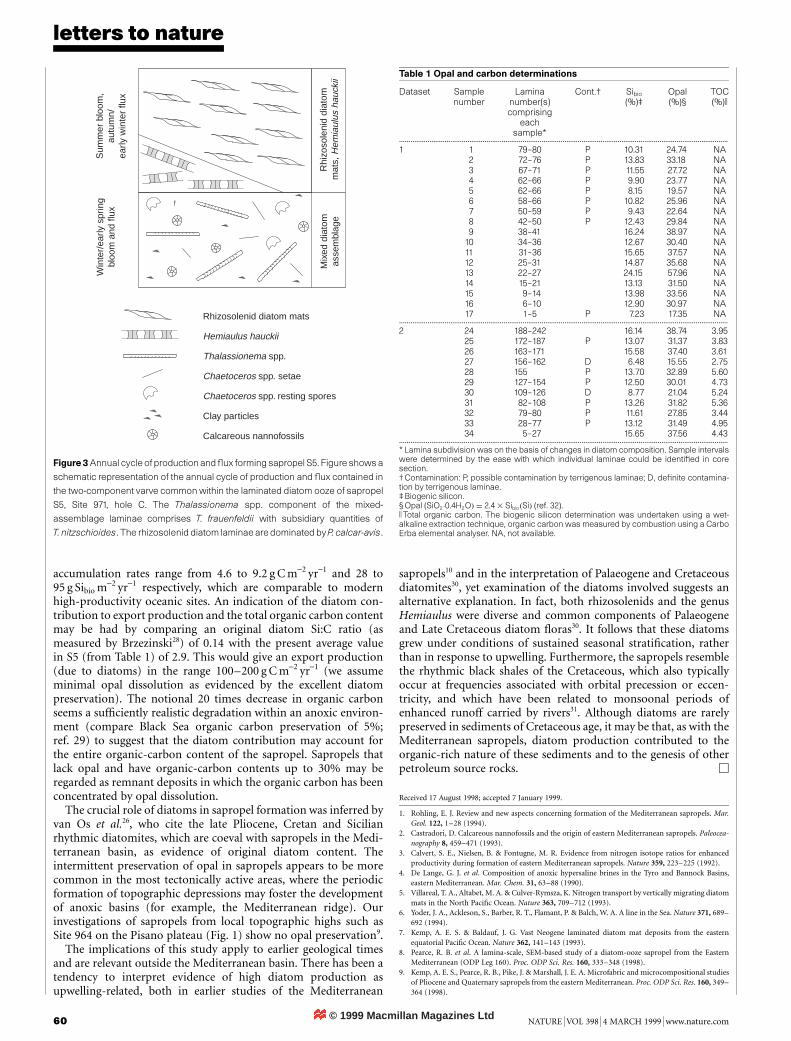
© 1999 Macmillan Magazines Ltd
letters to nature
60 NATURE | VOL 398 | 4 MARCH 1999 | www.nature.com
accumulation rates range from 4.6 to 9.2 g C m-2 yr-1 and 28 to95 g Sibio m-2 yr-1 respectively, which are comparable to modernhigh-productivity oceanic sites. An indication of the diatom con-tribution to export production and the total organic carbon contentmay be had by comparing an original diatom Si:C ratio (asmeasured by Brzezinski28) of 0.14 with the present average valuein S5 (from Table 1) of 2.9. This would give an export production(due to diatoms) in the range 100±200 g C m-2 yr-1 (we assumeminimal opal dissolution as evidenced by the excellent diatompreservation). The notional 20 times decrease in organic carbonseems a suf®ciently realistic degradation within an anoxic environ-ment (compare Black Sea organic carbon preservation of 5%;ref. 29) to suggest that the diatom contribution may account forthe entire organic-carbon content of the sapropel. Sapropels thatlack opal and have organic-carbon contents up to 30% may beregarded as remnant deposits in which the organic carbon has beenconcentrated by opal dissolution.
The crucial role of diatoms in sapropel formation was inferred byvan Os et al.26, who cite the late Pliocene, Cretan and Sicilianrhythmic diatomites, which are coeval with sapropels in the Medi-terranean basin, as evidence of original diatom content. Theintermittent preservation of opal in sapropels appears to be morecommon in the most tectonically active areas, where the periodicformation of topographic depressions may foster the developmentof anoxic basins (for example, the Mediterranean ridge). Ourinvestigations of sapropels from local topographic highs such asSite 964 on the Pisano plateau (Fig. 1) show no opal preservation9.
The implications of this study apply to earlier geological timesand are relevant outside the Mediterranean basin. There has been atendency to interpret evidence of high diatom production asupwelling-related, both in earlier studies of the Mediterranean
sapropels10 and in the interpretation of Palaeogene and Cretaceousdiatomites30, yet examination of the diatoms involved suggests analternative explanation. In fact, both rhizosolenids and the genusHemiaulus were diverse and common components of Palaeogeneand Late Cretaceous diatom ¯oras30. It follows that these diatomsgrew under conditions of sustained seasonal strati®cation, ratherthan in response to upwelling. Furthermore, the sapropels resemblethe rhythmic black shales of the Cretaceous, which also typicallyoccur at frequencies associated with orbital precession or eccen-tricity, and which have been related to monsoonal periods ofenhanced runoff carried by rivers31. Although diatoms are rarelypreserved in sediments of Cretaceous age, it may be that, as with theMediterranean sapropels, diatom production contributed to theorganic-rich nature of these sediments and to the genesis of otherpetroleum source rocks. M
Received 17 August 1998; accepted 7 January 1999.
1. Rohling, E. J. Review and new aspects concerning formation of the Mediterranean sapropels. Mar.
Geol. 122, 1±28 (1994).
2. Castradori, D. Calcareous nannofossils and the origin of eastern Mediterranean sapropels. Paleocea-
nography 8, 459±471 (1993).
3. Calvert, S. E., Nielsen, B. & Fontugne, M. R. Evidence from nitrogen isotope ratios for enhancedproductivity during formation of eastern Mediterranean sapropels. Nature 359, 223±225 (1992).
4. De Lange, G. J. et al. Composition of anoxic hypersaline brines in the Tyro and Bannock Basins,
eastern Mediterranean. Mar. Chem. 31, 63±88 (1990).
5. Villareal, T. A., Altabet, M. A. & Culver-Rymsza, K. Nitrogen transport by vertically migrating diatom
mats in the North Paci®c Ocean. Nature 363, 709±712 (1993).6. Yoder, J. A., Ackleson, S., Barber, R. T., Flamant, P. & Balch, W. A. A line in the Sea. Nature 371, 689±
692 (1994).
7. Kemp, A. E. S. & Baldauf, J. G. Vast Neogene laminated diatom mat deposits from the eastern
equatorial Paci®c Ocean. Nature 362, 141±143 (1993).
8. Pearce, R. B. et al. A lamina-scale, SEM-based study of a diatom-ooze sapropel from the EasternMediterranean (ODP Leg 160). Proc. ODP Sci. Res. 160, 333±348 (1998).
9. Kemp, A. E. S., Pearce, R. B., Pike, J. & Marshall, J. E. A. Microfabric and microcompositional studies
of Pliocene and Quaternary sapropels from the eastern Mediterranean. Proc. ODP Sci. Res. 160, 349±
364 (1998).
Rhizosolenid diatom mats
Hemiaulus hauckii
Thalassionema spp.
Chaetoceros spp. setae
Chaetoceros spp. resting spores
Clay particles
Calcareous nannofossils
Mix
ed d
iato
mas
sem
blag
eR
hizo
sole
nid
diat
omm
ats,
Hem
iaul
us h
auck
ii
Win
ter/
early
spr
ing
bloo
m a
nd fl
uxS
umm
er b
loom
,au
tum
n/ea
rly w
inte
r flu
x
Figure3Annual cycle of production and ¯ux forming sapropel S5. Figure shows a
schematic representation of the annual cycle of production and ¯ux contained in
the two-component varve common within the laminated diatom ooze of sapropel
S5, Site 971, hole C. The Thalassionema spp. component of the mixed-
assemblage laminae comprises T. frauenfeldii with subsidiary quantities of
T. nitzschioides. The rhizosolenid diatom laminae are dominated by P. calcar-avis.
Table 1 Opal and carbon determinations
Dataset Samplenumber
Laminanumber(s)comprising
eachsample*
Cont.² Sibio
(%)³Opal(%)§
TOC(%)k
.............................................................................................................................................................................
1 1 79±80 P 10.31 24.74 NA2 72±76 P 13.83 33.18 NA3 67±71 P 11.55 27.72 NA4 62±66 P 9.90 23.77 NA5 62±66 P 8.15 19.57 NA6 58±66 P 10.82 25.96 NA7 50±59 P 9.43 22.64 NA8 42±50 P 12.43 29.84 NA9 38±41 16.24 38.97 NA
10 34±36 12.67 30.40 NA11 31±36 15.65 37.57 NA12 25±31 14.87 35.68 NA13 22±27 24.15 57.96 NA14 15±21 13.13 31.50 NA15 9±14 13.98 33.56 NA16 6±10 12.90 30.97 NA17 1±5 P 7.23 17.35 NA
.............................................................................................................................................................................
2 24 188±242 16.14 38.74 3.9525 172±187 P 13.07 31.37 3.8326 163±171 15.58 37.40 3.6127 156±162 D 6.48 15.55 2.7528 155 P 13.70 32.89 5.6029 127±154 P 12.50 30.01 4.7330 109±126 D 8.77 21.04 5.2431 82±108 P 13.26 31.82 5.3632 79±80 P 11.61 27.85 3.4433 28±77 P 13.12 31.49 4.9534 5±27 15.65 37.56 4.43
.............................................................................................................................................................................* Lamina subdivision was on the basis of changes in diatom composition. Sample intervalswere determined by the ease with which individual laminae could be identi®ed in coresection.²Contamination: P, possible contamination by terrigenous laminae; D, de®nite contamina-tion by terrigenous laminae.³ Biogenic silicon.§Opal (SiO2 ×0:4H2O� � 2:4 3 Sibio�Si� (ref. 32).kTotal organic carbon. The biogenic silicon determination was undertaken using a wet-alkaline extraction technique, organic carbon was measured by combustion using a CarboErba elemental analyser. NA, not available.
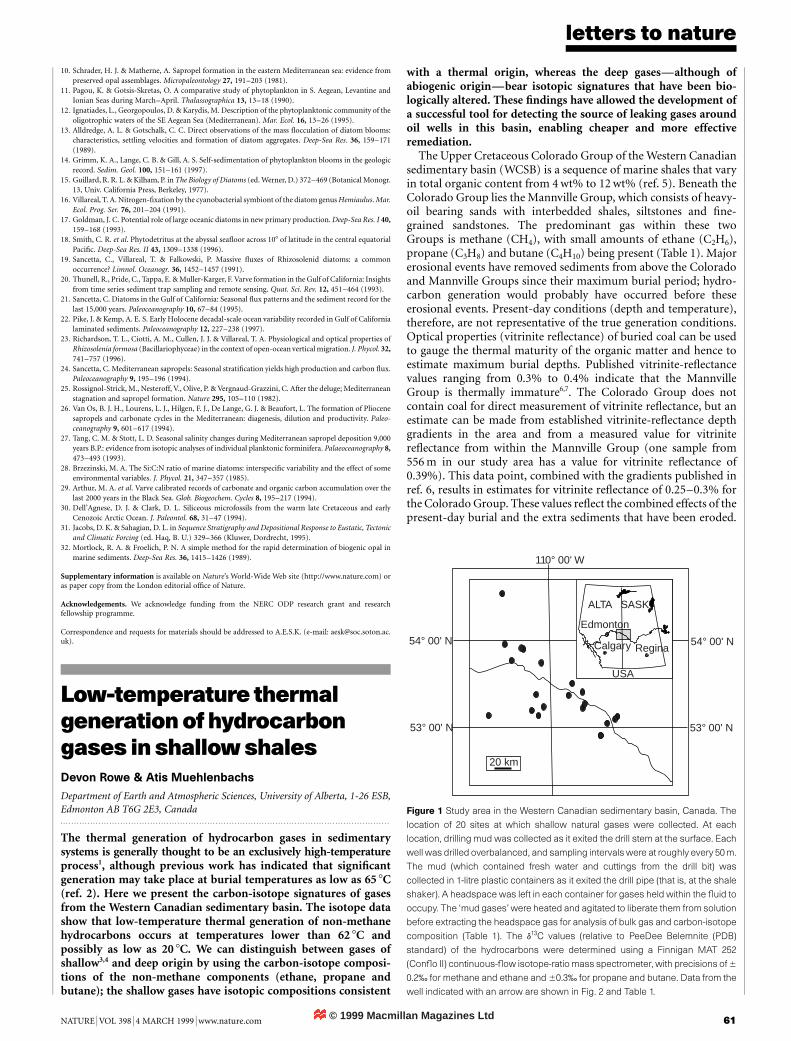
© 1999 Macmillan Magazines Ltd
letters to nature
NATURE | VOL 398 | 4 MARCH 1999 | www.nature.com 61
10. Schrader, H. J. & Matherne, A. Sapropel formation in the eastern Mediterranean sea: evidence from
preserved opal assemblages. Micropaleontology 27, 191±203 (1981).11. Pagou, K. & Gotsis-Skretas, O. A comparative study of phytoplankton in S. Aegean, Levantine and
Ionian Seas during March±April. Thalassographica 13, 13±18 (1990).
12. Ignatiades, L., Georgopoulos, D. & Karydis, M. Description of the phytoplanktonic community of the
oligotrophic waters of the SE Aegean Sea (Mediterranean). Mar. Ecol. 16, 13±26 (1995).
13. Alldredge, A. L. & Gotschalk, C. C. Direct observations of the mass ¯occulation of diatom blooms:characteristics, settling velocities and formation of diatom aggregates. Deep-Sea Res. 36, 159±171
(1989).
14. Grimm, K. A., Lange, C. B. & Gill, A. S. Self-sedimentation of phytoplankton blooms in the geologic
record. Sedim. Geol. 100, 151±161 (1997).
15. Guillard, R. R. L. & Kilham, P. in The Biology of Diatoms (ed. Werner, D.) 372±469 (Botanical Monogr.13, Univ. California Press, Berkeley, 1977).
16. Villareal, T. A. Nitrogen-®xation by the cyanobacterial symbiont of the diatom genus Hemiaulus. Mar.
Ecol. Prog. Ser. 76, 201±204 (1991).
17. Goldman, J. C. Potential role of large oceanic diatoms in new primary production. Deep-Sea Res. I 40,
159±168 (1993).18. Smith, C. R. et al. Phytodetritus at the abyssal sea¯oor across 108 of latitude in the central equatorial
Paci®c. Deep-Sea Res. II 43, 1309±1338 (1996).
19. Sancetta, C., Villareal, T. & Falkowski, P. Massive ¯uxes of Rhizosolenid diatoms: a common
occurrence? Limnol. Oceanogr. 36, 1452±1457 (1991).20. Thunell, R., Pride, C., Tappa, E. & Muller-Karger, F. Varve formation in the Gulf of California: Insights
from time series sediment trap sampling and remote sensing. Quat. Sci. Rev. 12, 451±464 (1993).
21. Sancetta, C. Diatoms in the Gulf of California: Seasonal ¯ux patterns and the sediment record for the
last 15,000 years. Paleoceanography 10, 67±84 (1995).
22. Pike, J. & Kemp, A. E. S. Early Holocene decadal-scale ocean variability recorded in Gulf of Californialaminated sediments. Paleoceanography 12, 227±238 (1997).
23. Richardson, T. L., Ciotti, A. M., Cullen, J. J. & Villareal, T. A. Physiological and optical properties of
Rhizosolenia formosa (Bacillariophyceae) in the context of open-ocean vertical migration. J. Phycol. 32,
741±757 (1996).
24. Sancetta, C. Mediterranean sapropels: Seasonal strati®cation yields high production and carbon ¯ux.Paleoceanography 9, 195±196 (1994).
25. Rossignol-Strick, M., Nesteroff, V., Olive, P. & Vergnaud-Grazzini, C. After the deluge; Mediterranean
stagnation and sapropel formation. Nature 295, 105±110 (1982).
26. Van Os, B. J. H., Lourens, L. J., Hilgen, F. J., De Lange, G. J. & Beaufort, L. The formation of Pliocene
sapropels and carbonate cycles in the Mediterranean: diagenesis, dilution and productivity. Paleo-ceanography 9, 601±617 (1994).
27. Tang, C. M. & Stott, L. D. Seasonal salinity changes during Mediterranean sapropel deposition 9,000
years B.P.: evidence from isotopic analyses of individual planktonic forminifera. Palaeoceanography 8,
473±493 (1993).
28. Brzezinski, M. A. The Si:C:N ratio of marine diatoms: interspeci®c variability and the effect of someenvironmental variables. J. Phycol. 21, 347±357 (1985).
29. Arthur, M. A. et al. Varve calibrated records of carbonate and organic carbon accumulation over the
last 2000 years in the Black Sea. Glob. Biogeochem. Cycles 8, 195±217 (1994).
30. Dell'Agnese, D. J. & Clark, D. L. Siliceous microfossils from the warm late Cretaceous and early
Cenozoic Arctic Ocean. J. Paleontol. 68, 31±47 (1994).31. Jacobs, D. K. & Sahagian, D. L. in Sequence Stratigraphy and Depositional Response to Eustatic, Tectonic
and Climatic Forcing (ed. Haq, B. U.) 329±366 (Kluwer, Dordrecht, 1995).
32. Mortlock, R. A. & Froelich, P. N. A simple method for the rapid determination of biogenic opal in
marine sediments. Deep-Sea Res. 36, 1415±1426 (1989).
Supplementary information is available on Nature's World-Wide Web site (http://www.nature.com) oras paper copy from the London editorial of®ce of Nature.
Acknowledgements. We acknowledge funding from the NERC ODP research grant and researchfellowship programme.
Correspondence and requests for materials should be addressed to A.E.S.K. (e-mail: [email protected]).
Low-temperature thermalgenerationof hydrocarbongases in shallowshalesDevon Rowe & Atis Muehlenbachs
Department of Earth and Atmospheric Sciences, University of Alberta, 1-26 ESB,
Edmonton AB T6G 2E3, Canada. . . . . . . . . . . . . . . . . . . . . . . . . . . . . . . . . . . . . . . . . . . . . . . . . . . . . . . . . . . . . . . . . . . . . . . . . . . . . . . . . . . . . . . . . . . . . . . . . . . . . . . . . . . . . . . . . . . . . . . . .
The thermal generation of hydrocarbon gases in sedimentarysystems is generally thought to be an exclusively high-temperatureprocess1, although previous work has indicated that signi®cantgeneration may take place at burial temperatures as low as 65 8C(ref. 2). Here we present the carbon-isotope signatures of gasesfrom the Western Canadian sedimentary basin. The isotope datashow that low-temperature thermal generation of non-methanehydrocarbons occurs at temperatures lower than 62 8C andpossibly as low as 20 8C. We can distinguish between gases ofshallow3,4 and deep origin by using the carbon-isotope composi-tions of the non-methane components (ethane, propane andbutane); the shallow gases have isotopic compositions consistent
with a thermal origin, whereas the deep gasesÐalthough ofabiogenic originÐbear isotopic signatures that have been bio-logically altered. These ®ndings have allowed the development ofa successful tool for detecting the source of leaking gases aroundoil wells in this basin, enabling cheaper and more effectiveremediation.
The Upper Cretaceous Colorado Group of the Western Canadiansedimentary basin (WCSB) is a sequence of marine shales that varyin total organic content from 4 wt% to 12 wt% (ref. 5). Beneath theColorado Group lies the Mannville Group, which consists of heavy-oil bearing sands with interbedded shales, siltstones and ®ne-grained sandstones. The predominant gas within these twoGroups is methane (CH4), with small amounts of ethane (C2H6),propane (C3H8) and butane (C4H10) being present (Table 1). Majorerosional events have removed sediments from above the Coloradoand Mannville Groups since their maximum burial period; hydro-carbon generation would probably have occurred before theseerosional events. Present-day conditions (depth and temperature),therefore, are not representative of the true generation conditions.Optical properties (vitrinite re¯ectance) of buried coal can be usedto gauge the thermal maturity of the organic matter and hence toestimate maximum burial depths. Published vitrinite-re¯ectancevalues ranging from 0.3% to 0.4% indicate that the MannvilleGroup is thermally immature6,7. The Colorado Group does notcontain coal for direct measurement of vitrinite re¯ectance, but anestimate can be made from established vitrinite-re¯ectance depthgradients in the area and from a measured value for vitrinitere¯ectance from within the Mannville Group (one sample from556 m in our study area has a value for vitrinite re¯ectance of0.39%). This data point, combined with the gradients published inref. 6, results in estimates for vitrinite re¯ectance of 0.25±0.3% forthe Colorado Group. These values re¯ect the combined effects of thepresent-day burial and the extra sediments that have been eroded.
110° 00' W
54° 00' N
53° 00' N
54° 00' N
53° 00' N
20 km
Calgary Regina
Edmonton
USA
SASKALTA
Figure 1 Study area in the Western Canadian sedimentary basin, Canada. The
location of 20 sites at which shallow natural gases were collected. At each
location, drilling mud was collected as it exited the drill stem at the surface. Each
well was drilled overbalanced, and sampling intervals were at roughly every 50 m.
The mud (which contained fresh water and cuttings from the drill bit) was
collected in 1-litre plastic containers as it exited the drill pipe (that is, at the shale
shaker). A headspace was left in each container for gases held within the ¯uid to
occupy. The `mud gases' were heated and agitated to liberate them from solution
before extracting the headspace gas for analysis of bulk gas and carbon-isotope
composition (Table 1). The d13C values (relative to PeeDee Belemnite (PDB)
standard) of the hydrocarbons were determined using a Finnigan MAT 252
(Con¯o II) continuous-¯ow isotope-ratio mass spectrometer, with precisions of 6
0.2½ for methane and ethane and 60.3½ for propane and butane. Data from the
well indicated with an arrow are shown in Fig. 2 and Table 1.