573presentation
TRANSCRIPT

LOGOEarth, Ocean and Atmospheric Sciences
Water mass analysis and comparison with upwelling year in Trevor Channel
Jie Liu EOSC 573

LOGO
page1
Earth, Ocean and Atmospheric Sciences
Motivation Material & Method
Water mass features
Influence of wind
Outline
Conclusions

LOGO
page2
Earth, Ocean and Atmospheric Sciences
Motivation
Help understanding the water spreading and mixing(Tomcazk, 1999).
Enhance local circulation studies(Linder, 2010).
Instructive to the effectiveness of biological and chemistry research.

LOGO
page3
Earth, Ocean and Atmospheric Sciences
Material and Method
Station Name
Latitude(°) Longitude(°) Depth(m) Time
TC19 48.7989 -125.2983 87 Feb 18 2015TC20 48.8157 -125.2818 98 Feb 18 2015TC21 48.8191 -125.2167 42 Feb 18 2015TC22 48.8246 -125.1924 69 Feb 18 2015Rbr1 48.8460 -125.1618 94 Feb 19 2015Rbr2 48.8402 -125.1517 65 Feb 19 2015Rbr3 48.8378 -125.1469 34 Feb 19 2015Rbr4 48.8420 -125.1360 35 Feb 19 2015Rbr5 48.8495 -125.1482 101 Feb 19 2015Rbr6 48.8572 -125.1573 25 Feb 19 2015
Mouth11 48.8397 -125.1384 44 Feb 16 2015Grapp10 48.8369 -125.1341 32 Feb 16 2015
Bam4 48.8312 -125.1379 28 Feb 16 2015S12 48.8986 -125.0198 33 Feb 17 2015S14 48.9037 -125.0182 15 Feb 17 2015S15 48.9075 -125.0126 20 Feb 17 2015S16 48.9045 -125.0236 55 Feb 17 2015S17 48.9065 -125.0297 138 Feb 17 2015S18 48.9085 -125.0328 61 Feb 17 2015
Temperature & Salinity Conservative Temperature & Absolute Salinity
Potential Density Contours T-S diagram
Depth, Pressure, T & S are all smoothed

LOGO
page4
Earth, Ocean and Atmospheric Sciences
Material and Method
(Local wind rose diagram from Bamfiled Marine Sciences Centre)
(Daily upwelling index from Pacific Fisheries Environmental Laboratory)
(Environment Canada, Marine Buoy Observations)
Location:48.835N, 125.998W
LOGO
page5
Earth, Ocean and Atmospheric Sciences
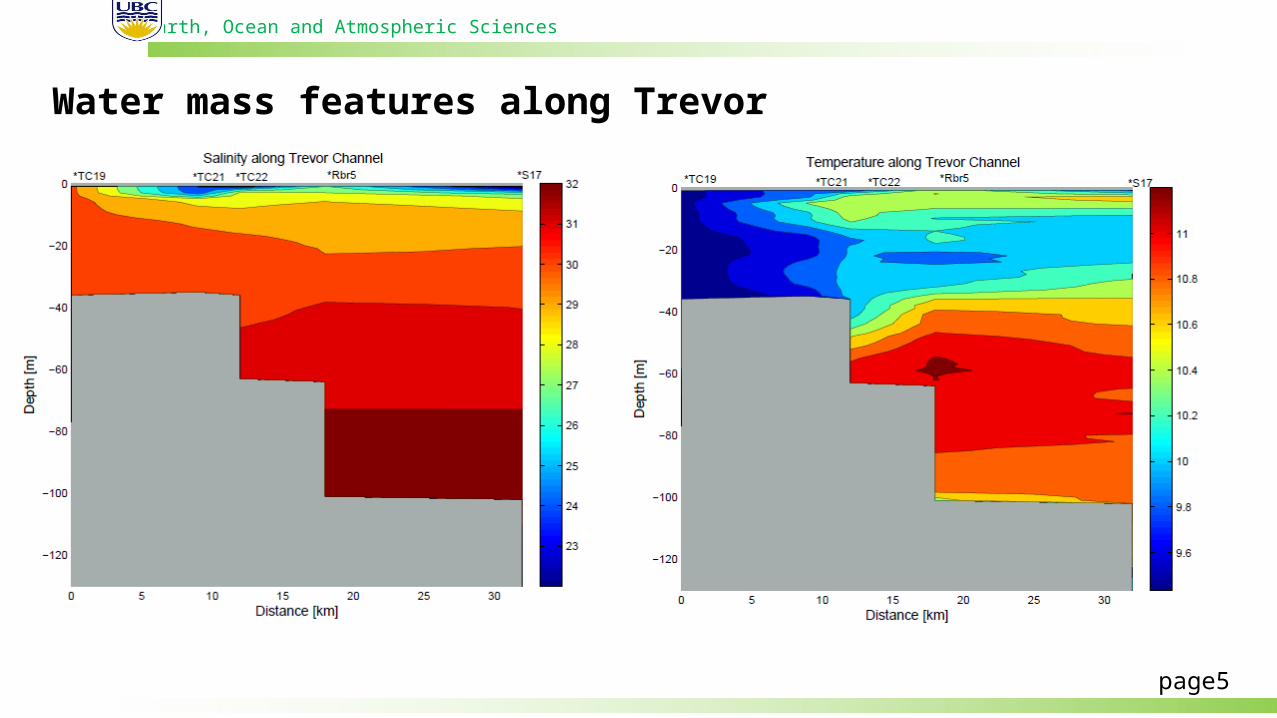
Water mass features along Trevor Channel

LOGO
page6
Earth, Ocean and Atmospheric Sciences

LOGO
page7
Earth, Ocean and Atmospheric Sciences
a b
c d

LOGO
page8
Earth, Ocean and Atmospheric Sciences
Influence of wind
With reference of D.M.Farmer ,Fresh-water thickness =
PE difference=
Correlation with current day wind speed:
R =
= -0.6920
Correlation with last day wind speed: R = 0.0434
-
,
5
1
25
1
2
5
1wi
surfacesurfacewindwind
surfacesurfacewindnd
H
dzzSHS
HH 0f
1
HHH ssgdzzzgfs
H
m
222
0 2
1

LOGO
page9
Earth, Ocean and Atmospheric Sciences
Influence of wind
(Local wind rose diagram from Bamfiled Marine Sciences Centre)
Rbr3Rbr4

LOGO
page10
Earth, Ocean and Atmospheric Sciences
Conclusions
Water mass features
Salinity contours along Trevor Channel verifies it is a fjord estuary which is correspond with observations by Riley in 2010.
Three types of water masses are identified in most stations from T-S diagrams with potential density contours and further demonstrate there exists stratification in the Trevor Channel.
Surface water may come from rivers in Alberni Inlet, intermediate water is possibly from open ocean, relatively warm bottom water inside Trevor Channel may due to the summer water residence.
Stratification is further indicated in the common trend of different layer water mixing.

LOGO
page11
Earth, Ocean and Atmospheric Sciences
Conclusions
Influence of wind
Very weak positive correlation coefficience between wind speed from buoy of last day and current surface layer thickness.
Little obvious relationship was indicated between upwelling or downwelling favorable wind and water mass features near the Bamfield mouth.
Local wind possibly plays a more important role in changing the water mass characteristics near the inlet mouth.

LOGO
page12
Earth, Ocean and Atmospheric Sciences
Reference
[1] Linder R J. Estuarine circulation in Barkley Sound; observed characteristics and processes[J]. 2010. [2] Farmer D M, Osborn T R. The influence of wind on the surface layer of a stratified inlet: Part I. Observations[J]. Journal of Physical Oceanography, 1976, 6(6): 931-940. [3] Tomczak M. Some historical, theoretical and applied aspects of quantitative water mass analysis[J]. Journal of Marine Research, 1999, 57(2): 275-303. [4] McClatchie S, Middleton J F, Ward T M. Water mass analysis and alongshore variation in upwelling intensity in the eastern Great Australian Bight[J]. Journal of Geophysical Research: Oceans (1978–2012), 2006, 111(C8). [5] Hansen D V, Rattray M. New dimensions in estuary classification[J]. Limnology and Oceanography, 1966, 11(3): 319-326. [6] Stronach J A, Ng M K, Foreman M G, et al. Tides and currents in Barkley sound and Alberni Inlet[J]. Marine Geodesy, 1993, 16(1): 1-41.

LOGO
page13
Earth, Ocean and Atmospheric Sciences
Acknowledgement
Dr Mark Halverson, Dr Evgeny Pakhomov, Dr Matie Maldonado
Chris , Jan and all my peers in EOSC 573!

LOGOEarth, Ocean and Atmospheric Sciences
Thanks for your attention!