56518 standard chartered cover r.ps, page 1-2 @ … · our website contains comprehensive...
TRANSCRIPT

At Standard Chartered, Diversity &Inclusion (D&I) lies at the heart of ourvalues and is a distinctive part of ourbrand. As one of the world’s mostinternational banks, we employ over60,000 people, representing more than 100 nationalities worldwide.
Given our geographic diversity and growth
ambitions, we are committed to attracting,
developing and engaging the very best talent.
With tougher competition across our markets,
D&I can give us a distinctive advantage over
our competitors. We strive to become the
world’s best international bank, by offering
new ideas, different perspectives and
anticipating changing expectations.
From locally-driven D&I councils to global D&I
forums, we have made significant progress.
The strength of our diversity has helped us
achieve great results and we are confident
that our focused attention on D&I will continue
to deliver benefits to our people, our customers,
our shareholders and to the communities
in which we operate.
Diversity&Inclusion
Competitive advantage through...
www.standardchartered.com/sustainability/greatplace_homeTo find out more about Diversity & Inclusion visit
Here you will find information on Diversity & Inclusion, employee engagement and how we develop, reward and recognise our employees.
Interim Report 2007
Leading�thewayin Asia, Africa and the Middle East
Sta
nd
ard
Charte
red
Inte
rim R
ep
ort 2
007

Contents
SUMMARY OF RESULTSFor six months ended 30 June 2007
Financial Highlights 1Chairman’s Statement 2Group Chief Executive’s Review 3 Financial ReviewGroup Summary 7Consumer Banking 8Wholesale Banking 11Risk Review 14 Capital 31
Financial StatementsCondensed Consolidated Interim
Income Statement 32Condensed Consolidated Interim
Balance Sheet 33Condensed Consolidated Interim
Statement of Recognised
Income and Expense 34Condensed Consolidated Interim
Cash Flow Statement 35Notes 36Independent Review Report 62Additional Information 63Index 72
Throughout this document unless another currency is specified, the word
“dollar” or symbol “$” means United States dollar and the word “cents”
or symbol “c” means one-hundredth of one United States dollar.
Within this document, the Hong Kong Special Administrative Region of the
People’s Republic of China is referred to as ‘Hong Kong’; ‘Middle East and Other
South Asia’ (MESA) includes: United Arab Emirates (UAE), Bahrain, Jordan,
Pakistan and Bangladesh; and ‘Other Asia Pacific’ includes: China, Indonesia,
Thailand, Taiwan and the Philippines.
Standard Chartered PLC – Stock Code: 2888
© Standard Chartered PLC. All rights reserved. The STANDARD CHARTERED
word mark, its logo device and associated product brand names are owned by
Standard Chartered PLC and centrally licensed to its operating entities.
Registered Office: 1 Aldermanbury Square, London EC2V 7SB. Telephone +44 (0)
20 7280 7500. Principal place of business in Hong Kong: 32nd Floor, 4-4a Des
Voeux Road, Central, Hong Kong. Registered in England No. 966425.
6 months 6 months 6 months
ended ended ended
30.06.07 30.06.06 31.12.06
$million $million $million
Results
Operating income 5,263 4,112 4,508
Impairment losses on loans and advances (361) (349) (280)
Profit before taxation 1,980 1,527 1,651
Profit attributable to equity interests 1,399 1,103 1,175
Profit attributable to ordinary shareholders* 1,370 1,088 1,165
Balance Sheet
Total assets 296,826 238,148 266,049
Total equity 19,583 13,850 17,397
Capital base 24,826 19,164 21,877
Information per Ordinary Share Cents Cents Cents
Earnings per share – normalised basis** 100.7 84.1 87.3
– basic 98.5 82.8 86.9
Dividend per share 23.12 20.83 50.21
Net asset value per share 1,250.7 983.5 1,208.9
Ratios % % %
Return on ordinary shareholders’ equity – normalised basis** 16.7 17.9 16.2
Cost income ratio – normalised basis** 54.7 53.6 56.6
Capital ratios:
Tier 1 capital 9.7 8.4 8.3
Total capital 15.6 14.2 14.3
* Profit attributable to ordinary shareholders is after the deduction of dividends payable to the holders of the non-cumulative redeemable preference shares
(see note 6 on page 43).
** Results on a normalised basis reflect the results of Standard Chartered PLC and its subsidiaries (the “Group”) excluding items presented in note 7 on page 44.
www.standardchartered.comFor information on the GroupOur website contains comprehensive information on Standard Chartered. Log on to find out more about our innovative product offerings and financial solutions. You will also have access to our Media Centre where you will find our latest and archived press releases as well as a photo library.
www.investors.standardchartered.comFor investor informationYou will find detailed information on our corporate governance practices, current debt ratings and recent press releases on this section of our website. Here is also where the online version of our Annual Report and Accounts and Annual Review can be found.
www.standardchartered.com/sustainabilityFor information on building a sustainable business We have just re-launched the sustainability section of our website. On this site you will find details of our approach to building a sustainable business, policies and procedures and progress against our priorities.
www.standardchartered.com/sustainability/ourpeopleFor our approach to people managementTo find out more about our approach to people management and career opportunities at Standard Chartered, please log onto our People section. The information here includes Diversity and Inclusion, employee engagement and how we develop, reward and recognise our employees.
Goonline
GogreenThis document is fully recyclableThis document has been printed in the UK by Park Communications, a CarbonNeutral® company certified with Environmental Management System ISO14001:2004.
In producing this report, 100% of the electricity used is generated from renewable sources, 95% of the press chemicals used are recycled for further use, on average 99% of any waste will be recycled and vegetable inks have been used throughout.
This document is printed on Revive 75, an FSC certified paper containing 50% de-inked post consumer waste, 25% pre-consumer waste and 25% virgin fibre. The pulp is a mix, using partly Elemental Chlorine Free (ECF) and partly Totally Chlorine Free (TCF) processes.
Produced by Black Sun Plc
1
Significant Achievements
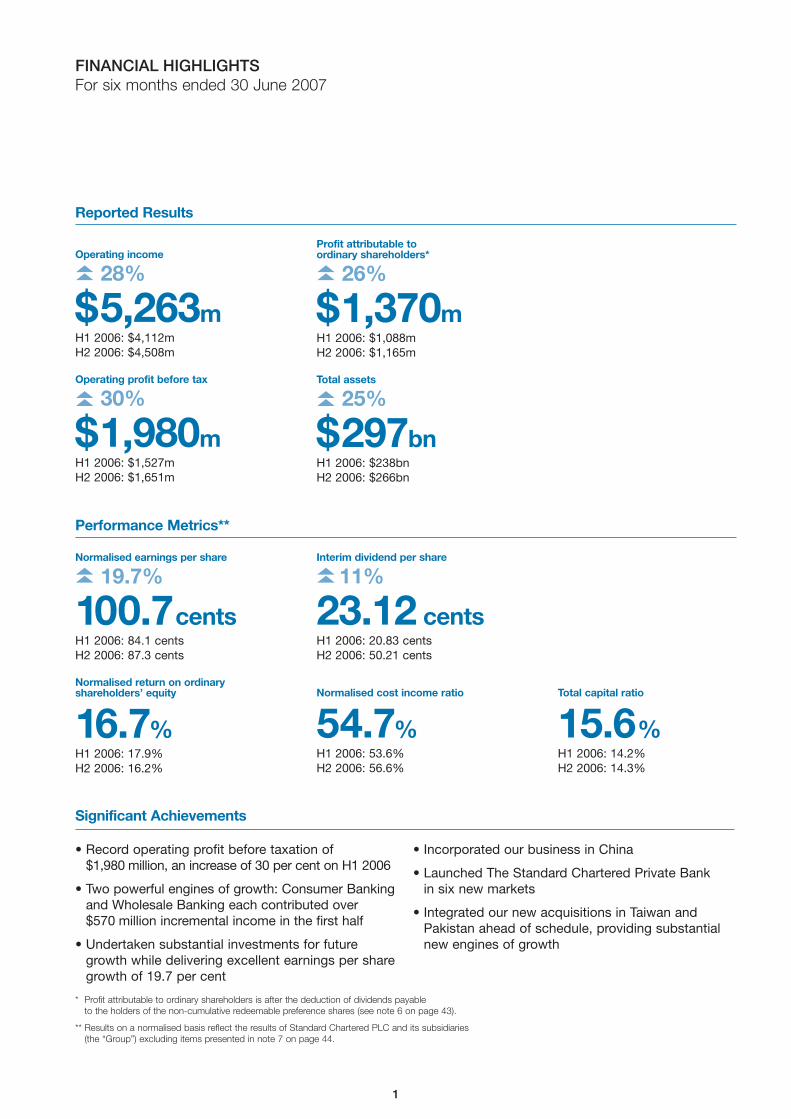
Operating income
28%
$5,263mH1 2006: $4,112m
H2 2006: $4,508m
Reported Results
Performance Metrics**
Operating profit before tax
30%
$1,980mH1 2006: $1,527m
H2 2006: $1,651m
��
��
Profit attributable to ordinary shareholders*
26%
$1,370mH1 2006: $1,088m
H2 2006: $1,165m
��
Total assets
25%
$297bnH1 2006: $238bn
H2 2006: $266bn
��
Normalised earnings per share
19.7%
100.7centsH1 2006: 84.1 cents
H2 2006: 87.3 cents
Normalised return on ordinaryshareholders’ equity
16.7%H1 2006: 17.9%
H2 2006: 16.2%
��
Interim dividend per share
11%
23.12 centsH1 2006: 20.83 cents
H2 2006: 50.21 cents
��
Normalised cost income ratio
54.7%H1 2006: 53.6%
H2 2006: 56.6%
Total capital ratio
15.6%H1 2006: 14.2%
H2 2006: 14.3%
• Record operating profit before taxation of
$1,980 million, an increase of 30 per cent on H1 2006
• Two powerful engines of growth: Consumer Banking
and Wholesale Banking each contributed over
$570 million incremental income in the first half
• Undertaken substantial investments for future
growth while delivering excellent earnings per share
growth of 19.7 per cent
• Incorporated our business in China
• Launched The Standard Chartered Private Bank
in six new markets
• Integrated our new acquisitions in Taiwan and
Pakistan ahead of schedule, providing substantial
new engines of growth
FINANCIAL HIGHLIGHTSFor six months ended 30 June 2007
* Profit attributable to ordinary shareholders is after the deduction of dividends payable
to the holders of the non-cumulative redeemable preference shares (see note 6 on page 43).
** Results on a normalised basis reflect the results of Standard Chartered PLC and its subsidiaries
(the “Group”) excluding items presented in note 7 on page 44.

2
CHAIRMAN’S STATEMENT
I am pleased to report that Standard Chartered has had an
excellent first six months in 2007 driven by strong organic
growth in both Consumer Banking and Wholesale Banking.
• Operating profit before taxation is up 30 per cent to $1.98 billion
• Income has increased 28 per cent to $5.26 billion
• Normalised earnings per share (“EPS”) growth is 19.7 per cent
The Board has declared an interim dividend of 23.12 cents
per share, up 11 per cent.
Over the last few years we have consistently produced record
results while building a strong foundation for growth. Today we are
seeing the rewards of our balanced and diverse business, leading
the way in the dynamic markets of Asia, Africa and the Middle East.
Capturing the OpportunitiesThese results come from the quality of our people and our
disciplined approach to managing our resources over the last
few years. In turn they allow us to invest in opportunities that
will produce continued strong growth in the years to come.
I see this potential first hand on my travels and no visitor can be
left in any doubt about the huge wealth that is being generated in
China, India and the Middle East. In other words, in our markets.
This is an historic time for the Group and our management must
be bold enough to invest in the growth opportunities. In China,
as it opens its market. In India, as its companies explore
overseas. In the Middle East, as its economies diversify and in
Africa, as it benefits from a rich resource base. And we must also
invest in the Group’s core infrastructure as we expand at pace.
Balancing the investment for the future with today’s shareholder
returns is a challenge we, as a public company, must face.
I believe these results show that we are getting this balance right.
Governance and RiskAs I travel around and talk to experienced bankers and
investment managers, it is quite clear they share our concerns
over the level of asset prices, the amount of debt in leveraged
deals, loose covenants and the degree to which some people
believe this market will last forever.
We know that risks can emerge quickly: the sub-prime lending
issue in the US is a classic example of this. We are not exposed
to that and, indeed, we are seeing no significant credit
deterioration in our markets. However we need to be vigilant and
we remain extremely disciplined on our loan and credit standards.
Standard Chartered has high standards of risk management
and governance. As we announced a few months ago our Board
is being bolstered by the appointments from 1 August of John
Peace as Deputy Chairman and Senior Independent Director
and Sunil Mittal as a Non-Executive Director. I am also delighted
to announce that Gareth Bullock has been appointed Group
Executive Director with effect from 6 August. Gareth is a highly
experienced banker who has been with the Group for 11 years
and is a great addition to the Board. All of these individuals have
outstanding business experience and add further depth and
diversity to our Board. I am looking forward to working with them.
SummaryWe have had an excellent first half performance and are keeping
up the pace.
Mervyn Davies, CBEChairman7 August 2007
Over the last few years we haveconsistently produced record results whilebuilding a strong foundation for growth
“Today we are seeing therewards of a balanced anddiverse business, leading the wayin the dynamic markets of Asia,Africa and the Middle East.”
Mervyn Davies, CBE, Chairman
$5,263mOperating income
100.7centsNormalised earnings
per share
23.12 centsInterim dividend per share
$1,980mOperating profit before
taxation
16.7%Normalised return on ordinary
shareholders’ equity
Highlights

3
GROUP CHIEF EXECUTIVE’S REVIEW
We are extraordinarily wellpositioned in some of the mostexciting markets in the world
“We have done what we said we would do and we have made good progress on every
Peter Sands, Group Chief Executive
2007 Management Agenda
Over the last five years the Group has changed significantly.
Then we had just over 500 branches, now we have 1,450.
Then we had 28,000 staff, now we have 64,000. Our income
growth figure was six per cent to $2.2 billion and our EPS was
down 10 per cent to 36.1c. Today’s figures are rather different
with our income up 28 per cent to over $5 billion and EPS up
19.7 per cent to 100.7c.
My predecessor as Group Chief Executive, Mervyn Davies, gave
the Group leadership, direction and a new performance edge.
I am proud to have taken on the baton to lead the Group on
the next phase of the journey.
My first eight months as Chief Executive have been very busy.
I wanted to visit as many of our markets as possible to spend time
with our customers, staff and regulators. So far this year I have
made twelve country visits in Asia, including four trips to China.
I have also been twice to both the Middle East and the US.
It is clear that we are extraordinarily well positioned in some
of the most exciting markets in the world. We have wonderful
relationships with our customers, who both support and
challenge us every day. And we have superbly talented and
committed staff. Their professionalism, energy, teamwork and
values are inspiring.
At Standard Chartered, the step change in pace is really exciting.
We are investing more and growing faster than ever before.
We are launching new products, expanding distribution, building
new businesses at a new pace.
This acceleration, or change in the “metabolic rate” of the Group,
means we can make the most of the many opportunities across
our markets.
Of course there are challenges. But many of them are great
challenges to have. How to prioritise investment across our many
growth opportunities? How to build the infrastructure fast enough
to support rapidly growing businesses? How to attract and
develop the talent to make it all happen?
We have to be alert to the changes in global financial markets
and the broader global economy, anticipating and adapting our
approach. But the turbulence in the credit markets is not all bad
news. A bit more rationality and more differentiation in credit
spreads is a good thing.
We do not believe such events should deter us from investing
for growth. In our markets, economic growth is strong, liquidity
remains abundant, demand for financial services is growing
extremely rapidly. The window of opportunity is now and we are
determined to seize it.
This does not mean we will ignore what’s going on, or fail to
watch out for new problems. But we are convinced that investing
�Accelerate organic growth
�Deliver growth from our acquisitions
�Continuously improve the way we work
�Building leadership
�Reinforce the brand
part of the agenda for 2007.”

for growth in the world’s most exciting markets will create huge
value for our shareholders.
Performance HighlightsIn the first half of 2007 we have made rapid progress against
our strategic agenda. We incorporated our business in China
and launched Renminbi Consumer Banking; and we integrated
our two new acquisitions – in Pakistan and Taiwan – creating new
engines of growth; we launched The Standard Chartered Private
Bank in six new markets; and we launched our new Islamic
Banking brand, Saadiq.
In short, we have done what we said we would do and we have
made good progress on every part of the agenda for 2007 that
I presented in February.
Let me give a bit more detail on three of these agenda items:
accelerating organic growth, delivering on acquisitions and
building leadership.
Organic GrowthNothing demonstrates the change in pace of the Group as
powerfully as the pace of underlying income growth. Stripping
out the impact of acquisitions, underlying income grew by
13 per cent in 2004, 14 per cent in 2005, and 18 per cent in
2006. The pace has increased to 21 per cent in the first half
of 2007 compared to 15 per cent in the first half of 2006.
We accelerated investment in order to boost organic growth,
and that is happening. The acceleration is not from just one
business, or one geography; we have built multiple engines
of growth and we are driving them harder.
Consumer Banking – SME Five years ago our presence in Small and Medium Enterprise
(“SME”) banking was very limited – we only offered two SME
specific products in three countries. Since then we have rapidly
built the business into a new engine of growth for Consumer
Banking, expanding our geographic coverage and offering a
complete suite of SME specific products and services.
We are constantly innovating and introducing new products
and we have built specialist risk capabilities and infrastructure.
Our business is now well positioned to benefit from the growing
SME segment and we offer SME banking at over 1,000 of our
branches to over half a million customers in 24 markets. In the
first half of this year, income grew by 45 per cent.
Wholesale Banking – Client RelationshipsIn Wholesale Banking it is the increasing depth of our client
relationships that drives our income growth.
We have enhanced our client relationship model and invested in
broadening our product capabilities. We are deepening our client
relationships, cross-selling more, focusing more on strategic and
value-added solutions. All of our client segments and products
are performing extremely well.
It is always tempting, when talking about Wholesale Banking, to
talk about the big, well-known clients and the biggest deals and
we have some great stories to tell here. But we are also having
great success in the Local Corporates segment. By this we mean
local and regional companies, typically with turnover between
$25 million and $500 million.
In the first half of 2007, we grew income in this segment by
42 per cent, with an increase of more than 20 per cent in the
number of clients. Our performance was particularly strong in
India, up 85 per cent, China, up 92 per cent and Korea, up
36 per cent.
We have developed a relationship management model, product
set and risk management approach specifically for this segment.
It is not lending driven: lending income accounts for only 15 per
cent of total income for the segment.
A good example of how we are innovating to build non-lending
income streams is Straight2Bank, our integrated electronic
delivery channel system. Launched in May, Straight2Bank has
already won numerous industry awards and attracted thousands
of clients.
Another benefit from our success with Local Corporates is that
these clients are also potential customers for our new Private
Bank. We are already seeing a good flow of referrals. It is a great
example of how well our businesses can work together.
The Private BankThe launch of The Private Bank was a key milestone in the
first half of 2007.
We are now operating in 10 locations across seven markets:
Singapore, Hong Kong, Shanghai, Beijing, Seoul, Mumbai, New
Delhi, Dubai, London and Jersey. It is very early days yet – most
of our offices have been open only a matter of weeks – but we
already have 150 relationship managers and we are attracting
new customers and up-tiering existing relationships. To start from
scratch and launch a sophisticated Private Bank in this many
markets simultaneously is an achievement we are proud of.
Whilst we do not underestimate the strength of competition in
this space, we have some powerful advantages. Our history and
scale in these markets provides a strong foundation. We can
offer a distinctive combination of onshore and offshore wealth
management services. And we can provide an extremely broad
range of products through a truly open architecture approach.
In the second half of 2007 and into 2008 we will continue to
expand our geographic coverage, relationship manager team
and product capabilities. But the real focus will be on attracting
customers and their assets. The Private Bank has the potential
to be yet another powerful engine of organic growth.
Islamic BankingAnother source of organic growth is Islamic Banking which
we launched in April under the sub-brand “Saadiq”, which
means “truthful”.
We are already very active in Islamic Banking across many
of our markets. But with the launch of Saadiq we are making
clear the depth of our commitment to Islamic Banking and our
determination to be a real leader in this space.
Our dedicated Islamic Banking teams have stepped up the pace
in building the business and in product innovation. In the first half
of 2007, for example: we launched Islamic credit cards in the
UAE, Pakistan and Bangladesh; we opened dedicated Islamic
Banking centres in a number of markets; and by the end of June
2007 we were lead arranger for four out of the five local currency
sukuk bond issues in Pakistan.
4
GROUP CHIEF EXECUTIVE’S REVIEW continued
KoreaKorea’s performance in the first half of 2007 is disappointing.
However, if you look beyond the noise of central cost allocations
and fair value adjustment write-backs, the businesses are making
good progress. In Wholesale Banking, we have built out the
product range and are now getting good traction in developing
the client franchise. In Consumer Banking, the regulatory and
competitive pressures on the mortgage market – by far the
largest part of SC First Bank’s business – continue to represent
a significant challenge, but the Wealth Management and SME
businesses continue to grow rapidly.
This is a very good business. A large platform in a big, growing
market. We still have work to do to realise the full potential of SC
First Bank and I am confident it will be a powerful engine of
sustainable profit growth for the Group.
Building LeadershipTo sustain our accelerated organic growth and to ensure we can
continue to deliver on our acquisitions, we need to continue to
build more and more leadership capacity across the Group.
This means making more and better leaders faster and turning
managers into true leaders.
To achieve this objective we are doing a lot of different things:
increasing international graduate recruitment this year by 27 per
cent; more than doubling MBA recruitment; revamping our
leadership development programmes; hiring exceptional talent
from outside; and ensuring we have a diverse pipeline of
leaders that reflect the markets we operate in and the
customers we serve.
Standard Chartered is a great place to work. It is incredibly
diverse and full of opportunity. It is friendly and supportive but
with a real performance edge. It is confident not arrogant and
committed to a shared set of values.
Our culture represents a real competitive advantage. It attracts
staff, it attracts customers and it enables us to work together
across business and geographic boundaries. One of my big
challenges as CEO is to make sure that as we grow and develop
we do not lose what makes us special.
Continued Investment for GrowthIn the second half of 2007 we will continue to deliver against
the priorities laid out at the beginning of the year.
To sustain our rapid growth, we will continue to invest in new
products, new markets and expanded distribution. Amongst
other things we will: extend our Global Markets product range
by launching equity derivatives; expand our Principal Finance
business; expand our network to about 40 locations in China
and add at least 70 branches and over 300 ATMs across other
markets; and incorporate our business in Vietnam to enable us
to expand and grow there rapidly. We see Vietnam as a market
of enormous potential for both businesses.
As we have demonstrated before, we can and will flex the pace
of investment to ensure we strike the right balance between
delivering performance today and investment for future growth.
We will also continue to ensure we deliver on our acquisitions,
realizing the potential of Taiwan and Korea, sustaining the growth
momentum in Pakistan and Permata. We will continue to look
for new acquisition opportunities, new platforms for growth,
This business is growing extremely rapidly – in both Wholesale
and Consumer Banking – and has huge potential for further
growth. For example, we do not yet offer such products in
India and Africa.
ChinaIn April, we were one of the first foreign banks to incorporate
our business in China and later that month we launched
Renminbi services for Chinese citizens.
Responding to the demand for a broader array of savings and
investment solutions, we have launched 38 new Wealth
Management products.
We are on track with our branch expansion, with 30 locations
in 15 cities, and still plan to have about 40 locations by year end,
subject to the regulatory approvals.
Income and profits are growing rapidly. In the first half of 2007
our China business more than doubled income.
To support such growth we are investing in people and
infrastructure. We began the year with about 2,100 staff in China,
and expect to end the year with more than 3,500. Two weeks
ago I attended the opening of our operations hub in Tianjin.
We want to ensure that right from the start we build a scalable,
efficient systems and operations infrastructure to support our
business as it grows.
We are also making the most of our international network.
Helping China’s leading corporates as they seek to expand
internationally – for example, in Africa – and working with
companies from other parts of Asia – such as Korea and
Taiwan – as they build their businesses in China.
Standard Chartered is now distinctively placed across Greater
China, being strongly positioned in Hong Kong and Taiwan as
well as China itself. We are superbly positioned to take advantage
of the trade and investment dynamics across the region such as
the accelerating convergence of Hong Kong with the rest of the
Pearl River Delta and the massive investment flows between
Taiwan and the mainland.
TaiwanWe are still at the early stages of realising the opportunity from
Hsinchu International Bank in Taiwan. We are making great
progress on the integration; we are roughly three months ahead
of schedule. On 30 June, with the amalgamation of Hsinchu and
our branch, Standard Chartered became the first international
bank to gain an island-wide presence, with a network of 86
branches and 377 ATMs.
I was there for the occasion; and the scale of the opportunity
and the excitement of our staff, was inspiring.
There is still much to do. We have already renovated four flagship
branches and will renovate over 50 more by the end of the year,
injecting some $50 million in branch renovation and new ATMs to
bring a world class consumer banking experience to Taiwan. We
will also add some 250 frontline sales staff to drive new customer
acquisition and income growth.
There is a huge opportunity in Taiwan to win market share and
grow; and there is a massive opportunity to support Taiwan’s
trade and investment flows across the rest of our network.
5
GROUP CHIEF EXECUTIVE’S REVIEW continued

6
• In Consumer Banking, we expect the impairment charge
for the full year to reflect the improved environment in Taiwan
although this will be balanced by the inclusion of our most
recent acquisitions and the effects of the change in the mix
and maturity of the portfolio.
In summary, we are doing what we said we would do.
SummaryWe have had an excellent first half in 2007 and we have great
momentum as we begin the second half. Our investments are
delivering and there are many exciting opportunities across
our markets.
The world is an uncertain place. There is a lot of volatility in the
markets. That makes it all the more important for us to be very
clear on our strategy and priorities, to always be looking ahead
to what might happen and to know exactly what levers we can
pull if we have to respond to changing circumstances.
This combination of strategic clarity and management flexibility
is critical to being able to continue to grow at pace, whilst
navigating the risks.
The Group is in great shape and we are excited and confident
about the future.
Peter SandsGroup Chief Executive7 August 2007
new capabilities. But, as always, we will remain very disciplined.
We have to be convinced that any potential acquisition is both
strategically and financially compelling.
OutlookLet me give you a sense of the outlook for the Group for 2007.
We enter the second six months of 2007 in good shape with
great momentum. The businesses are performing strongly and
we are clear about our strategy and priorities.
IncomeWhilst we remain mindful of the changes in the external
environment in the past few weeks, we have a high degree
of confidence in our ability to continue to deliver high levels
of income growth.
• Consumer Banking has a good level of income momentum
as the business continues to broaden its income streams.
• In Wholesale Banking, we have strong income momentum
across virtually all client segments and product groups, albeit
that as in previous years, we expect some impact of seasonality
in the second half.
Expenses• We will continue to accelerate our investment as we seek to
capture the opportunities seen in our franchise and to support
our growth. For the full year, and for the Group as a whole,
we expect the growth in expenses to be broadly in line with
the growth in income.
Risk Management• In Wholesale Banking, we are not as yet seeing any
deterioration in our portfolio, but do anticipate a further
reduction in recoveries as the stock of impaired assets falls.
GROUP CHIEF EXECUTIVE’S REVIEW continued

STANDARD CHARTERED PLC - FINANCIAL REVIEW
7
GROUP SUMMARY The Group has delivered a very strong performance for the six
months ended 30 June 2007. Profit before taxation of $1,980
million was up 30 per cent over the equivalent period in 2006,
with operating income up 28 per cent. The normalised cost
income ratio was 54.7 per cent compared to 53.6 per cent in
2006 reflecting continued investment in the franchise.
Normalised earnings per share increased by 19.7 per cent to
100.7 cents. Refer to note 7 on page 44 for details of basic
and diluted earnings per share.
The underlying results of the Group exclude the results of the
following: Standard Chartered Bank (Pakistan) Limited,
comprising the Standard Chartered Bank branches in
Pakistan and Union Bank Limited (“Union”), Hsinchu
International Bank (“HIB”) and the incremental stake in PT
Bank Permata Tbk (“Permata”).
Operating income and profit 6 months ended 30.06.07 6 months ended 30.06.06 6 months ended 31.12.06
$million $million $million
Net interest income 2,952 2,510 2,818
Fees and commissions income, net 1,228 894 987
Net trading income 649 531 389
Other operating income 434 177 314
2,311 1,602 1,690
Operating income 5,263 4,112 4,508
Operating expenses (2,918) (2,225) (2,571)
Operating profit before impairment
losses and taxation
2,345 1,887 1,937
Impairment losses on loans and advances
and other credit risk provisions (361) (349) (280)
Other impairment (3) (8) (7)
(Loss)/profit from associates (1) (3) 1
Profit before taxation 1,980 1,527 1,651
Operating income growth was well balanced across client
segments, products and geographies. Operating income grew
$1,151 million, or 28 per cent, to $5,263 million. Underlying
operating income grew 21 per cent.
Net interest income grew $442 million, or 18 per cent, to
$2,952 million. On an underlying basis, net interest income
grew nine per cent. Net interest margin was 2.5 per cent, in
line with the first half of last year.
Non interest income grew $709 million, or 44 per cent, to
$2,311 million. On an underlying basis, non interest income
grew 38 per cent. Fees and commissions increased by $334
million, or 37 per cent, to $1,228 million. This increase can be
attributed to higher transaction volumes in investment
services and insurance products, in cash management,
securities services and trade, as well as from significantly
higher fees earned from increased activities in loan
syndications, debt capital markets and from corporate
advisory transactions. Net trading income increased by $118
million, or 22 per cent, to $649 million. Client income from
interest rates and foreign exchange derivatives sales grew as
a result of improved product cross-selling efforts, offset, in
part, by lower own account trading income. Other operating
income increased $257 million, or 145 per cent, to $434
million, arising from income on structured finance
transactions, and gains realised from the sale of private equity
investments and other investment securities. Other operating
income also included $55 million of recoveries in respect of
assets in Korea that had been fair valued at acquisition,
compared to $42 million in the first half of 2006 and $64
million in the second half of 2006.
Operating expenses increased $693 million, or 31 per cent, to
$2,918 million. Underlying expenses grew 23 per cent.
Expenses rose as additional investments were made to
improve and extend distribution channels, launch The Private
Bank in six new markets, add product capabilities such as
commodity derivatives, improve transaction banking
infrastructure and enhance regulatory compliance and control
systems. Expenses also increased because of higher
incentive compensation and personnel costs.
Operating profit before impairment increased $458 million, or
24 per cent, to $2,345 million.
The credit environment remained generally favourable during
the period. Impairment losses on loans and advances
increased $12 million to $361 million. The underlying
impairment losses decreased by $94 million, or 27 per cent,
to $253 million. This reflected the improved consumer credit
environment in Taiwan where the loan impairment in the
branch fell by $179 million. Overall delinquency indicators for
the Consumer Banking loan portfolio were in line with
expectations. The fall in the loan impairment in Taiwan was
partly offset by the recent acquisitions and there was a small
increase in Thailand and the UAE as a result of the change in
the mix and maturity of the portfolio. In Wholesale Banking,
new impairments remained low and recoveries and releases
continued to be achieved, albeit at lower levels than last year.

STANDARD CHARTERED PLC – FINANCIAL REVIEW continued
8
Operating income and profit continued The Group made a number of acquisitions in the second half
of 2006. It has owned Union since 5 September 2006 and HIB
since 19 October 2006. On 30 December 2006, the assets
and business of Union and the Standard Chartered Bank
branches in Pakistan were amalgamated into Standard
Chartered Bank (Pakistan) Limited. On 30 June 2007, the
assets and business of the Standard Chartered Bank branch
in Taiwan were amalgamated into HIB, and the combined
entity was renamed Standard Chartered Bank (Taiwan)
Limited. On 5 September 2006, the Group acquired an
additional stake of 12.96 per cent in Permata.
To facilitate effective review of the Group’s results, the table
below shows the underlying results of the Group.
6 months ended
30.06.07 H1 2007 v H1 2006 6 months ended
30.06.06 H1 2007 v H2 2006 6 months ended
31.12.06
Underlying$million
Increase/(decrease)%
Underlying$million
Increase/(decrease) %
Underlying$million
Net interest income 2,684 9 2,452 1 2,658
Fees and commissions
income, net 1,134 29 880 22 926
Net trading income 630 20 523 68 376
Other operating income 419 137 177 37 306
2,183 38 1,580 36 1,608
Operating income 4,867 21 4,032 14 4,266
Operating expenses (2,692) 23 (2,188) 10 (2,439)
Operating profit before impairment
losses and taxation 2,175 18 1,844 19 1,827
Impairment losses on loans
and advances and other
credit risk provisions (253) (27) (347) 3 (245)
Other impairment (3) (63) (8) (57) (7)
(Loss)/profit from associates (1) (67) (3) (200) 1
Profit before taxation 1,918 29 1,486 22 1,576
CONSUMER BANKING The following tables provide an analysis of operating profit by geographic segment for Consumer Banking:
6 months ended 30.06.07
Asia Pacific
Hong Kong
$million
Singapore $million
Malaysia $million
Korea $million
OtherAsia
Pacific$million
India
$million
Middle East &Other
S Asia$million
Africa $million
Americas UK &
Group Head
Office $million
Underlying $million
Consumer Banking
Total $million
Operating income 545 206 129 607 564 184 352 140 45 2,439 2,772
Operating expenses (232) (88) (54) (444) (360) (115) (189) (103) (27) (1,426) (1,612)
Loan impairment (30) (8) (23) (46) (172) (29) (56) (8) – (270) (372)
Operating profit 283 110 52 117 32 40 107 29 18 743 788
6 months ended 30.06.06
Asia Pacific
Hong Kong
$million
Singapore $million
Malaysia $million
Korea $million
OtherAsia
Pacific$million
India$million
Middle East &Other
S Asia$million
Africa $million
Americas UK &
Group Head Office
$million
Underlying
$million
Consumer Banking
Total $million
Operating income 505 170 112 530 317 158 238 128 37 2,146 2,195
Operating expenses (203) (66) (49) (378) (186) (90) (116) (94) (28) (1,186) (1,210)
Loan impairment (22) (16) (16) (33) (275) (20) (16) (9) 2 (402) (405)
Operating profit 280 88 47 119 (144) 48 106 25 11 558 580
STANDARD CHARTERED PLC – FINANCIAL REVIEW continued
9
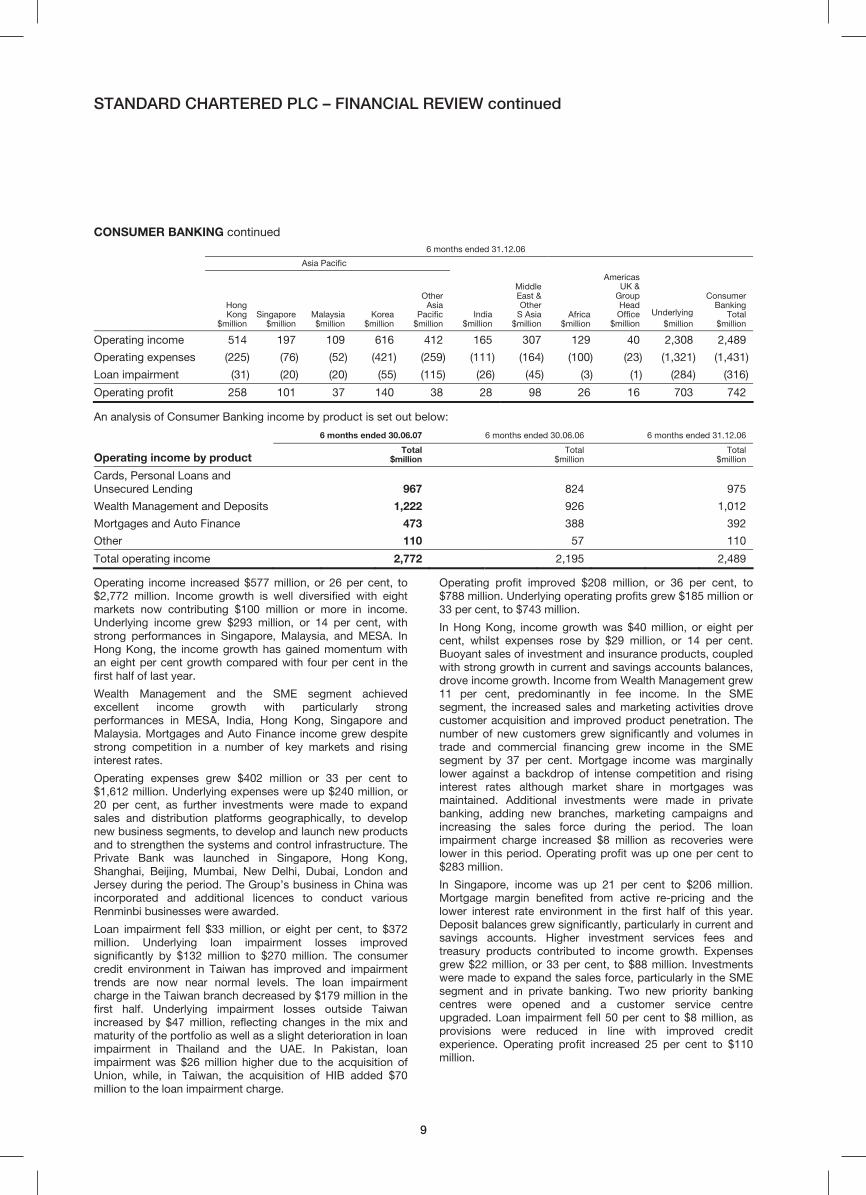
CONSUMER BANKING continued 6 months ended 31.12.06
Asia Pacific
Hong Kong
$million
Singapore $million
Malaysia $million
Korea $million
OtherAsia
Pacific$million
India$million
Middle East &Other
S Asia$million
Africa$million
Americas UK &
Group Head Office
$million
Underlying
$million
Consumer Banking
Total $million
Operating income 514 197 109 616 412 165 307 129 40 2,308 2,489
Operating expenses (225) (76) (52) (421) (259) (111) (164) (100) (23) (1,321) (1,431)
Loan impairment (31) (20) (20) (55) (115) (26) (45) (3) (1) (284) (316)
Operating profit 258 101 37 140 38 28 98 26 16 703 742 An analysis of Consumer Banking income by product is set out below:
6 months ended 30.06.07 6 months ended 30.06.06 6 months ended 31.12.06
Operating income by product Total
$million Total
$million Total
$million
Cards, Personal Loans and
Unsecured Lending 967 824 975
Wealth Management and Deposits 1,222 926 1,012
Mortgages and Auto Finance 473 388 392
Other 110 57 110
Total operating income 2,772 2,195 2,489 Operating income increased $577 million, or 26 per cent, to
$2,772 million. Income growth is well diversified with eight
markets now contributing $100 million or more in income.
Underlying income grew $293 million, or 14 per cent, with
strong performances in Singapore, Malaysia, and MESA. In
Hong Kong, the income growth has gained momentum with
an eight per cent growth compared with four per cent in the
first half of last year.
Wealth Management and the SME segment achieved
excellent income growth with particularly strong
performances in MESA, India, Hong Kong, Singapore and
Malaysia. Mortgages and Auto Finance income grew despite
strong competition in a number of key markets and rising
interest rates.
Operating expenses grew $402 million or 33 per cent to
$1,612 million. Underlying expenses were up $240 million, or
20 per cent, as further investments were made to expand
sales and distribution platforms geographically, to develop
new business segments, to develop and launch new products
and to strengthen the systems and control infrastructure. The
Private Bank was launched in Singapore, Hong Kong,
Shanghai, Beijing, Mumbai, New Delhi, Dubai, London and
Jersey during the period. The Group’s business in China was
incorporated and additional licences to conduct various
Renminbi businesses were awarded.
Loan impairment fell $33 million, or eight per cent, to $372
million. Underlying loan impairment losses improved
significantly by $132 million to $270 million. The consumer
credit environment in Taiwan has improved and impairment
trends are now near normal levels. The loan impairment
charge in the Taiwan branch decreased by $179 million in the
first half. Underlying impairment losses outside Taiwan
increased by $47 million, reflecting changes in the mix and
maturity of the portfolio as well as a slight deterioration in loan
impairment in Thailand and the UAE. In Pakistan, loan
impairment was $26 million higher due to the acquisition of
Union, while, in Taiwan, the acquisition of HIB added $70
million to the loan impairment charge.
Operating profit improved $208 million, or 36 per cent, to
$788 million. Underlying operating profits grew $185 million or
33 per cent, to $743 million.
In Hong Kong, income growth was $40 million, or eight per
cent, whilst expenses rose by $29 million, or 14 per cent.
Buoyant sales of investment and insurance products, coupled
with strong growth in current and savings accounts balances,
drove income growth. Income from Wealth Management grew
11 per cent, predominantly in fee income. In the SME
segment, the increased sales and marketing activities drove
customer acquisition and improved product penetration. The
number of new customers grew significantly and volumes in
trade and commercial financing grew income in the SME
segment by 37 per cent. Mortgage income was marginally
lower against a backdrop of intense competition and rising
interest rates although market share in mortgages was
maintained. Additional investments were made in private
banking, adding new branches, marketing campaigns and
increasing the sales force during the period. The loan
impairment charge increased $8 million as recoveries were
lower in this period. Operating profit was up one per cent to
$283 million.
In Singapore, income was up 21 per cent to $206 million.
Mortgage margin benefited from active re-pricing and the
lower interest rate environment in the first half of this year.
Deposit balances grew significantly, particularly in current and
savings accounts. Higher investment services fees and
treasury products contributed to income growth. Expenses
grew $22 million, or 33 per cent, to $88 million. Investments
were made to expand the sales force, particularly in the SME
segment and in private banking. Two new priority banking
centres were opened and a customer service centre
upgraded. Loan impairment fell 50 per cent to $8 million, as
provisions were reduced in line with improved credit
experience. Operating profit increased 25 per cent to $110
million.
STANDARD CHARTERED PLC – FINANCIAL REVIEW continued
10
CONSUMER BANKING continued In Malaysia, income increased 15 per cent to $129 million.
Higher average deposit balances drove income growth with
strong volume growth achieved in current and savings
accounts, time deposits and structured deposits. Operating
expenses increased $5 million or 10 per cent to $54 million.
Loan impairment increased by $7 million reflecting a higher
portfolio impairment charge. Operating profit increased 11 per
cent to $52 million.
In Korea, income grew $77 million, or 15 per cent, to $607
million. Wealth Management and the SME segment achieved
over 10 per cent and 40 per cent income growth respectively.
Investment and insurance fees were higher. During the period,
unprofitable bulk deposit accounts were reduced resulting in
lower liability balances. Mortgage income was marginally
lower as a result of lending constraints, intense competition
and rising interest rates affecting both volumes and margins.
Mortgage margins have halved in the last couple of years. The
successful exiting of certain accounts in the SME segment
and the realisation of collateral resulted in a further $42 million
(30 June 2006: $11 million) of recoveries in respect of assets
that had been fair valued at acquisition. Expenses grew $66
million, or 17 per cent, to $444 million. Investments have been
increased with four additional new branches opened, two
branches relocated, 24 branches upgraded, and over 400
ATMs upgraded. During the period, a charge for a voluntary
retirement programme was also incurred as part of the
productivity improvement plan and there was an increased
allocation of corporate overheads. Loan impairment was $13
million higher. Operating profit fell $2 million, or two per cent,
to $117 million.
In Other Asia Pacific, income grew $247 million, or 78 per
cent, to $564 million. Expenses grew $174 million, or 94 per
cent, to $360 million. Underlying income grew $39 million, or
12 per cent with particularly strong income growth in China
and Indonesia. Underlying expenses grew $52 million, or 28
per cent. In China, income more than doubled, with the SME
segment growing the number of customers, driving asset
growth in commercial loans and average deposit balances.
Income in the SME segment grew in total by over 80 per cent.
Mortgage income grew over 50 per cent, benefiting from
wider spreads as well as higher volumes, with growth in
mortgage assets of over 30 per cent. Investments were
accelerated, in customising retail banking products and
services for the local market, in extending branch and ATM
distribution infrastructure, in hiring additional sales, and in
marketing and support staff. In Taiwan, higher expenses were
incurred to integrate HIB and for the amalgamation of the
branches. Loan impairment for the period was $103 million
lower. Underlying loan impairment fell by $176 million due
primarily to the improving credit environment in Taiwan, and
lower impairment in the Philippines and Indonesia. Loan
impairment in Thailand, however, increased as a result of
political uncertainty and increasing consumer debt. Operating
profit improved to $32 million.
India’s income increased $26 million, or 16 per cent, to $184
million, driven by growth in Wealth Management products and
the SME segment. Investment in new products, premises,
private banking and hiring of additional sales staff increased
expenses by $25 million or 28 per cent. Loan impairment
increased $9 million, in part due to volume growth. Operating
profit fell $8 million, to $40 million.
Operating income in the MESA region increased by $114
million, or 48 per cent to $352 million. Underlying income
grew $38 million or 20 per cent, driven by strong sales
performance in the SME segment, with significant growth in
trade finance, business instalment loans and cash
management balances. Investment services and deposit
accounts continued to drive income growth in Wealth
Management. Expenses grew by $73 million, or 63 per cent to
$189 million. Underlying expenses grew $32 million, or 34 per
cent. Investments were targeted at improving infrastructure,
expanding distribution channels and increasing the sales
force. Higher expenses were also incurred for the integration
of the Union acquisition and the amalgamation of the
businesses in Pakistan. Loan impairment increased $40
million to $56 million, reflecting higher charge offs in Pakistan
following the acquisition, and in the UAE in relation to the
credit cards and unsecured lending portfolios. Operating
profit increased slightly to $107 million.
In Africa, operating profit grew $4 million, or 16 per cent to
$29 million, predominantly due to lower loan impairment.
Income growth of nine per cent was negatively impacted by
foreign exchange movements in Zambia and Botswana.
Double-digit income growth was achieved in Kenya, Ghana
and Nigeria. Wealth Management income grew driven by
increased product launches and more effective sales
penetration, whilst expenses grew 10 per cent with further
investments made in increasing staff strength.
The Americas, UK and Group Head Office saw an increase in
operating profit of $7 million to $18 million. Income grew $8
million, or 22 per cent, to $45 million, driven primarily by
higher deposits balances at better margin.
Product Performance Credit Cards, Personal Loans and Unsecured Lending grew
operating income by $143 million, or 17 per cent, to $967
million. Underlying income grew eight per cent. Asset growth
was controlled with stricter credit underwriting and approval
policies to ensure the balance between good growth and
credit quality was maintained.
Wealth Management grew operating income by $296 million,
or 32 per cent, to $1,222 million. Underlying income grew 18
per cent. An improved product range generated higher fee
income and the product portfolio mix during the period
improved profitability. Current and savings accounts now
represent almost half of the deposit base. Consequently, net
interest margins improved slightly in the period.
Mortgages and Auto income grew by $85 million, or 22 per
cent, to $473 million. Underlying income grew nine per cent.
Mortgage outstanding balances were marginally lower as
lending constraints in Korea hindered growth. Competitive
pricing pressure resulting in high attrition levels posed
challenges to growth in other key markets.

STANDARD CHARTERED PLC – FINANCIAL REVIEW continued
11
WHOLESALE BANKING
The following tables provide an analysis of operating profit by geographic segment for Wholesale Banking:
6 months ended 30.06.07
Asia Pacific
Hong Kong
$million
Singapore $million
Malaysia $million
Korea $million
OtherAsia
Pacific$million
India
$million
Middle East &Other
S Asia$million
Africa$million
Americas UK &
Group Head
Office $million
Underlying$million
Wholesale Banking
Total $million
Operating income 383 194 80 190 464 379 323 201 273 2,424 2,487
Operating expenses (166) (99) (35) (116) (199) (96) (139) (115) (333) (1,258) (1,298)
Loan impairment 14 – – – (7) (3) (2) (3) 12 17 11
Other impairment – – – – – – – (1) (2) (3) (3)
Operating profit 231 95 45 74 258 280 182 82 (50) 1,180 1,197
6 months ended 30.06.06
Asia Pacific
Hong Kong
$million Singapore
$million Malaysia $million
Korea $million
OtherAsia
Pacific$million
India$million
Middle East &Other
S Asia$million
Africa$million
Americas UK &
Group Head Office
$million Underlying
$million
Wholesale Banking
Total
$million
Operating Income 289 120 76 204 265 222 244 187 310 1,886 1,917
Operating expenses (141) (71) (30) (82) (150) (70) (109) (107) (255) (1,002) (1,015)
Loan impairment 30 (3) 4 (7) (2) 13 2 (8) 27 55 56
Other impairment – – – – – – – (6) (2) (8) (8)
Operating profit 178 46 50 115 113 165 137 66 80 931 950
6 months ended 31.12.06
Asia Pacific
Hong Kong
$million
Singapore $million
Malaysia $million
Korea $million
OtherAsia
Pacific$million
India$million
Middle East &Other
S Asia$million
Africa$million
Americas UK &
Group Head Office
$million
Underlying
$million
Wholesale Banking
Total $million
Operating income 307 135 74 176 390 272 281 196 175 1,945 2,006
Operating expenses (151) (81) (33) (91) (186) (104) (125) (112) (253) (1,114) (1,136)
Loan impairment 16 – 3 (1) 8 (6) 6 (6) 16 39 36
Other impairment – – – – (3) – – (3) (1) (7) (7)
Operating profit 172 54 44 84 209 162 162 75 (63) 863 899
An analysis of Wholesale Banking operating income by product is set out below:
6 months ended 30.06.07 6 months ended 30.06.06 6 months ended 31.12.06
Operating income by product Total
$million Total
$million Total
$million
Trade and Lending 532 511 495
Global Markets* 1,346 925 970
Cash Management and Custody 609 481 541
Total operating income 2,487 1,917 2,006
* Global markets comprises the following businesses: derivatives and foreign exchange, debt capital markets, corporate finance and Asset and Liability
Management (“ALM”).
STANDARD CHARTERED PLC – FINANCIAL REVIEW continued
12
WHOLESALE BANKING continued
Wholesale Banking had a very strong first half with
significantly higher business volumes and income momentum.
The investments made in a number of businesses and
products have driven growth across key geographies. The
external environment remained favourable, with new trade
flows emerging, a good operating environment and benign
credit conditions. Income grew $570 million, or 30 per cent, to
$2,487 million. Underlying income grew 29 per cent.
Client revenues grew 30 per cent. Client income represents
around four fifths of total income and remains the key driver
of growth. The focus in nurturing key client relationships,
attracting new clients, improving product cross-sell
and investing in higher-value and strategic products have
resulted in a very broad based income momentum across all
client segments.
Operating expenses grew $283 million, or 28 per cent, to
$1,298 million. Underlying expenses grew 26 per cent.
Investment was targeted at expanding product capability,
upgrading systems infrastructure in transaction banking,
expanding client coverage, improving sales incentives, and
reinforcing compliance and control.
Operating profit before impairment grew 32 per cent to
$1,189 million. Loan impairment net recoveries were $45
million lower at $11 million, reflecting a declining stock of
distressed assets. Operating profit grew $247 million, or 26
per cent, to $1,197 million. Underlying profit grew $249 or 27
per cent, to $1,180 million.
In Hong Kong, income grew $94 million, or 33 per cent, to
$383 million. Client revenues grew strongly in the Local
Corporates and Financial Institutions segments. Global
Markets revenue contributed significantly to income growth,
with higher foreign exchange and derivatives sales and
corporate finance fees, while improved ALM performance
drove own account income growth. Income from Cash
Management benefited from higher volumes in securities
services and the higher average cash balances, marginally
offset by a decline in margins. Trade and Lending income was
marginally higher. Expenses grew $25 million or 18 per cent,
to $166 million with this increase primarily directed towards
building the sales force, improving sales incentives and
enhancing product capabilities. Loan impairment recoveries
were 53 per cent lower at $14 million. Operating profit grew
30 per cent to $231 million.
Income in Singapore grew $74 million, or 62 per cent to $194
million. Operating profit grew $49 million, or 107 per cent, to
$95 million. Commodity Corporates and Financial Institution
segments led the growth in client revenues. Global Markets
revenues were driven by derivatives and foreign exchange
products together with strong contributions from debt capital
markets and corporate finance. Expenses grew $28 million, or
39 per cent, to $99 million reflecting increased recruitment,
higher salary and performance related incentives and
continued investments in product capabilities.
In Malaysia, income increased $4 million, or five per cent, to
$80 million with good growth in Cash Management, corporate
finance and foreign exchange sales. Expenses increased $5
million, to $35 million reflecting higher performance related
incentives.
Income in Korea fell $14 million, or seven per cent, to $190
million. Expenses grew $34 million, or 41 per cent, to $116
million. During the period, there were $13 million (30 June
2006: $31 million) of recoveries on assets that had been fair
valued at acquisition. Expenses have been affected by the
increased allocation of corporate centre overheads as well as
a voluntary retirement charge.
Other Asia Pacific delivered strong income growth of $199
million, or 75 per cent, to $464 million, with expenses rising
33 per cent, to $199 million. Underlying income grew $184
million, or 69 per cent, to $449 million. Strong income growth
was achieved in China across all client segments and most
product categories. In Indonesia, income grew over 70 per
cent. Underlying expenses grew $32 million, or 21 per cent,
primarily in China, reflecting the continued investments in
more staff, higher performance related incentives, product
development and systems infrastructure. Loan impairment
was $5 million higher, mainly due to the absence of the loan
impairment releases and recoveries seen in the first half of
last year. Operating profit grew $145 million, or 128 per cent,
to $258 million.
In India, income grew $157 million, or 71 per cent to $379
million. Operating income was driven by strong foreign
exchange income and transaction banking revenues which
benefited from increased volumes and better margins in cash
management, and higher trade volumes. Increased fee
income was also generated from corporate finance and debt
capital markets transactions, and private equity gains
realised, partly offset by weaker own account trading income.
Expenses increased by $26 million, or 37 per cent, with
investment in new product specialists and sales staff,
improving premises and systems infrastructure. Operating
profit increased 70 per cent to $280 million.
Operating income in the MESA region rose $79 million, or 32
per cent, to $323 million. Income grew over 30 per cent in the
UAE, Bahrain, Qatar and Jordan. Client revenues increased
across most products, notably in interest rate and foreign
exchange derivatives sales, debt capital markets and
transaction banking. In Bangladesh, income grew over 15 per
cent while income in Pakistan grew 55 per cent, reflecting
good underlying growth as well as the impact of the Union
acquisition. Expenses grew $30 million, or 28 per cent, to
$139 million due to higher recruitment levels, premises and
infrastructure costs as well as integration costs in Pakistan.
Loan impairment was marginally higher. Operating profit grew
$45 million, or 33 per cent, to $182 million.
In Africa, income grew $14 million, or seven per cent, to $201
million. Operating income improvements were driven by
growth in transaction banking revenues, with average
wholesale deposit balances increasing significantly, more
than offsetting a small decline in margins. Higher fees were
earned on corporate advisory and debt financing
transactions. Expenses increased seven per cent to $115
million. Operating profit increased $16 million, or 24 per cent,
to $82 million.
Operating income in the Americas, UK and Group Head
Office decreased by $37 million, or 12 per cent, to $273
million, primarily due to lower own account trading income.
There were no private equity gains realised in the region for
this period compared to the first half of last year. Expenses
grew by $78 million, or 31 per cent, reflecting continued
investment in products and sales staff.
STANDARD CHARTERED PLC - FINANCIAL REVIEW continued
13
WHOLESALE BANKING continued Product Performance
Trade and Lending income increased four per cent to $532
million, with underlying income growing one per cent. Trade
income grew as volumes increased, driven in part by supply-
chain financing and receivables services, partially offsetting
the impact of tightening margins. While higher loan origination
activities grew lending assets, this asset growth was offset by
active loan sales and structured credit transactions to
optimise capital deployment. Lending revenues were down
three per cent.
Global Markets’ income grew 46 per cent to $1,346 million.
Underlying income grew 45 per cent. Derivatives and foreign
exchange sales and trading grew income by 43 per cent.
Client revenues grew 40 per cent on the back of improved
product cross-selling efforts and higher client penetration.
Own account trading was lower due to subdued market
volatility and trading losses in certain markets. Debt capital
markets income doubled, on the back of strong loan
syndication volumes and higher bond issuance activities.
Corporate finance income grew over 60 per cent with several
landmark cross-border corporate advisory and project finance
transactions completed in the first half. Private equity
investments have delivered high return on investments, with a
number of realisations during the first half of the year. ALM
and fund management income improved 17 per cent over the
equivalent period with better trading opportunities present in
the local currency markets.
Cash Management and Custody income was up 27 per cent
at $609 million. Underlying income grew 25 per cent, as
higher transaction volumes drove fee income growth, and
higher cash balances in a positive margin environment,
increased net interest income. Securities assets under
administration grew significantly as higher transaction
volumes drove increased income in securities services.

STANDARD CHARTERED PLC - RISK REVIEW
14
RISK Risk Management Review The Group has not experienced evidence of deterioration in
the credit environment within its key economies.
The structure and management of the Group’s portfolio has
been such that the previous low level of provisions has been
maintained. Ongoing risk management disciplines are aimed
at maintaining the Group’s desired portfolio whilst targeting
specific customers and markets.
Wholesale Banking continues to operate in a stable credit
environment, with high levels of recoveries and low provisions
due to proactive management. The portfolio remains well
diversified with no material concentrations in key business
segments. A strong risk distribution capability has been
developed which provides capacity for greater origination and
continued growth.
Consumer Banking is achieving the desired asset mix and the
debt charge is in line with that planned for the portfolio. Asset
growth has been controlled with stricter credit underwriting
and approval policies to ensure the balance between good
growth and credit quality is maintained.
Work to fully integrate risk controls and processes into recent
acquisitions is ongoing and progressing well.
Under Basel II the Group has received approval to adopt the
advanced approach to credit risk management from
1 January 2008. This approach builds on the Bank’s
sophisticated risk management practices and is the result of a
significant Group-wide regulatory exercise.
Risk Governance Through its risk management structure the Group seeks to
manage efficiently the core risks: credit, market, country and
liquidity risk. These arise directly through the Group’s
commercial activities whilst compliance and regulatory risk,
operational risk and reputational risks are normal
consequences of any business undertaking.
The basic principles of risk management followed by the
Group include:
• Balancing risk and reward: risk is taken in support of the
requirements of the Group’s stakeholders. Risk should be
taken in support of the Group strategy and within its risk
appetite.
• Responsibility: given the Group is in the business of
taking risk, it is everyone’s responsibility to ensure that
risk taking is both disciplined and focused. The Group
takes account of its social, environmental and ethical
responsibilities in taking risk to produce a return.
• Accountability: risk is taken only within agreed authorities
and where there is appropriate infrastructure and
resource. All risk taking must be transparent, controlled
and reported.
• Anticipation: the Group looks to anticipate future risks and
to maximise awareness of all risk.
• Risk management: the Group aims to have a world class
specialist risk function, with strength in depth, experience
across risk types and economic scenarios.
Ultimate responsibility for the effective management of risk
rests with the Company’s Board. Acting within an authority
delegated by the Board, the Audit and Risk Committee
(“ARC”), whose members are all Non-Executive Directors of
the Company, reviews specific risk areas and monitors the
activities of the Group Risk Committee (“GRC”) and the
Group Asset and Liability Committee (“GALCO”).
GRC, through authority delegated by the Board, is
responsible for credit risk, market risk, operational risk,
compliance and regulatory risk, legal risk and reputational
risk. GALCO, through authority delegated by the Board, is
responsible for liquidity risk, for structural interest rate and
foreign exchange exposures, and for capital ratios.
All the Group Executive Directors (“GEDs”) of Standard
Chartered PLC, members of the Standard Chartered Bank
Court and the Group Chief Risk Officer are members of the
GRC. This Committee is chaired by the Group Chief Risk
Officer. The GRC is responsible for agreeing Group standards
for risk measurement and management, and also delegating
authorities and responsibilities to risk committees and to the
Group and Regional Credit Committees and Risk Officers.
GALCO membership consists of all the GEDs of Standard
Chartered PLC and members of the Standard Chartered Bank
Court. The committee is chaired by the Group Finance
Director. GALCO is responsible for the establishment of, and
compliance with, policies relating to balance sheet
management including management of the Group’s liquidity,
capital adequacy and structural foreign exchange risk.
The committee process ensures that standards and policy are
cascaded down through the organisation from the Board
through the GRC and the GALCO to the functional, regional
and country level committees. Key information is
communicated through the country, regional and functional
committees to Group so as to provide assurance that
standards and policies are being followed.
The Group Executive Director with responsibility for Risk
(“GED Risk”) and the Group Chief Risk Officer manage a risk
function which is independent of the businesses, which:
• recommends Group standards and policies for risk
measurement and management;
• monitors and reports Group risk exposures for country,
credit, market and operational risk;
• approves market risk limits and monitors exposure;
• sets country risk limits and monitors exposure;
• chairs the credit committee and delegates credit authorities;
• validates risk models; and
• recommends risk appetite and strategy.
STANDARD CHARTERED PLC – RISK REVIEW continued
15
Risk Governance continued
Individual GEDs and members of the Standard Chartered
Bank Court are accountable for risk management in their
businesses and support functions, and for countries where
they have governance responsibilities. This includes:
• implementing the policies and standards as agreed by the
GRC across all business activity;
• managing risk in line with appetite levels agreed by the
GRC; and
• developing and maintaining appropriate risk management
infrastructure and systems to facilitate compliance with
risk policy.
The Group’s Risk Management Framework (“RMF”) identifies
18 risk types, which are managed by designated Risk Type
Owners (“RTOs”), who are all approved persons under the
FSA regulatory framework, and who have responsibility for
setting minimum standards and governance and
implementing governance and assurance processes. The
RTOs report up through specialist risk committees to the
GRC, or in the case of liquidity risk, to the GALCO.
In support of the RMF the Group uses a set of risk principles,
which are sanctioned by the GRC. These comprise a set of
statements of intent that describe the risk culture that the
Group wishes to sustain. All risk decisions and risk
management activity should be in line with, and in the spirit
of, the overall risk principles of the Group. The governance
process is designed to ensure:
• business activities are controlled on the basis of risk
adjusted return;
• risk is managed within agreed parameters with risk
quantified wherever possible;
• risk is assessed at the outset and throughout the time that
the Group continues to be exposed to it;
• applicable laws, regulations and governance standards in
every country in which the Group does business are
abided by;
• high and consistent ethical standards are applied to the
Group’s relationships with its customers, employees and
other stakeholders; and
• activities are undertaken in accordance with fundamental
control standards. These controls include the disciplines of
planning, monitoring, segregation, authorisation and approval,
recording, safeguarding, reconciliation and valuation.
The GED Risk and the Group Chief Risk Officer, together with
Group Internal Audit, provide assurance, independent from
the businesses, that risk is being measured and managed in
accordance with the Group’s standards and policies.
Stress Testing Objectives and purpose of stress testing
Stress testing and scenario analysis are important
components of the Group’s risk assessment processes, and
are used to assess the financial and management capability
of the Group to continue operating effectively under extreme
but plausible trading conditions. Such conditions may arise
from economic, legal, political, environmental, and social
factors which define the context within which the Group
operates. It is intended that stress testing and scenario
analysis will help to inform senior and middle management
with respect to:
• the nature and dynamics of the risk profile;
• the identification of potential future risks;
• the setting of the Group’s risk appetite;
• the robustness of risk management systems and controls;
• the adequacy of contingency planning; and
• the effectiveness of risk mitigants.
Stress testing framework
The framework has been designed to satisfy the following
requirements:
• identify key risks to the Group’s strategy, financial
position, and reputation;
• ensure effective governance, processes and systems are
in place to coordinate stress testing;
• integrate current stress testing and scenario analysis
procedures;
• engage and inform senior management;
• assess the impact on the Group’s profitability and
business plans;
• enable the Group to set and monitor its risk appetite; and
• satisfy regulatory requirements.
Key to the framework is the formation of a Stress Testing
Forum that is a formally constituted body deriving its powers
from the GRC. The primary objective of this forum is to
identify and assess the extreme but plausible risks to which
the Group may be subjected, and to make recommendations
to senior management for suitable scenarios.
Group-wide scenario analysis represents a wide ranging
assessment of potential impact. Therefore it is coordinated
through a Group risk function, which is responsible for
consolidating the analysis and highlighting existing mitigants,
controls, plans, and procedures to manage the identified risk,
as well as any additional management action required.
Risk appetite Risk appetite is the amount of risk the Group wants to take
pursuant to its strategic objectives.
The RMF summarises the Group’s risk appetite for each of
the identified risk types, as well as the related management
standards.
Risk appetite setting is the Group’s chosen method of
balancing risk and return, recognising a range of possible
outcomes, as business plans are implemented. The Group
adopts quantitative risk appetite statements where
applicable, and aggregates risk appetite across businesses
where appropriate.
For example, a formal quantitative statement from the Board
communicates the Group’s overall credit risk appetite and
ensures this is in line with the strategy and the desired risk-
reward trade off for the Group.
STANDARD CHARTERED PLC – RISK REVIEW continued
16
Risk appetite continued
Where risk appetite statements are qualitative, these are
supported with measures that allow business units to judge
whether existing and new business and processes fall within
the risk appetite.
The annual business planning and performance management
process and associated activities ensure the expression
of risk appetite remains appropriate, and the GRC supports
this work.
Credit Risk
Credit Risk Management
Credit risk is the risk that a counterparty will not settle its
obligations in accordance with agreed terms.
Credit exposures include both individual borrowers and
groups of connected counterparties, and portfolios in the
banking and trading books.
The GRC has clear responsibility for credit risk. Standards are
approved by the GRC, which oversees the delegation of
credit authorities.
Procedures for managing credit risk are determined at the
business levels, with specific policies and procedures being
adapted to different risk environment and business goals.
Risk officers are located in the businesses to maximise the
efficiency of decision making, but have a reporting line which
is separate from the business lines into the Group Chief
Risk Officer.
The businesses working with the Risk Officer take responsibility
for managing pricing for risk, portfolio diversification and overall
asset quality within the requirements of Group standards, policies
and business strategy.
Where appropriate, derivatives are used to reduce credit risks
in the portfolio. Due to the income statement volatility which
can result, derivatives are only used in a controlled manner
and within a pre-defined volatility expectation.
Wholesale Banking
Within the Wholesale Banking business, a numerical grading
system is used for quantifying the risk associated with a
counterparty. The grading is based on a probability of default
measure, with customers analysed against a range of
quantitative and qualitative measures. Expected Loss is used
for the further assessment of individual exposures and
portfolio analysis. There is a clear segregation of duties with
loan applications being prepared separately from the approval
chain. Significant exposures are reviewed and approved
centrally through a Group or regional level credit committee.
These committees are responsible to the GRC.
Consumer Banking For Consumer Banking, standard credit application forms are
generally used, which are processed in central units using
largely automated approval processes. Where appropriate to
the customer, the product or the market, a manual approval
process is in place. As with Wholesale Banking, origination
and approval roles are segregated.
Loan Portfolio
Loans and advances to customers have grown by $32.6
billion since 30 June 2006 to $152.8 billion.
Excluding the effect of the HIB and Union acquisitions,
growth in the Consumer Banking portfolio has been
constrained over the period as growth in secured products
has been muted by regulatory and competitive challenges in
the mortgage market.
Growth in the Wholesale Banking portfolio was $22.3 billion,
or 43 per cent since 30 June 2006. Growth was seen across
all industry sectors and geographies, with particularly strong
increases in the portfolios in Singapore, Other Asia Pacific,
India, and Americas, UK and Head Office. Financing,
insurance and business services saw an increase of $7.0
billion, driven by large increases in Hong Kong and Americas,
UK and Head Office.
The use of derivatives has partially offset the risks arising
from the growth in the balance sheet during the period.
The Wholesale Banking portfolio remains well diversified
across both geography and industry, with no significant
concentration within the industry classifications of
Manufacturing, Financing, insurance and business services,
or Commerce.

STANDARD CHARTERED PLC – RISK REVIEW continued
17
Loan Portfolio continued
30.06.07
Asia Pacific
HongKong
$million Singapore
$million Malaysia$million
Korea $million
OtherAsia
Pacific$million
India$million
MiddleEast &Other
S Asia$million
Africa $million
Americas UK &
Group Head
Office $million
Total$million
Loans to individuals
Mortgages 11,303 3,570 2,524 23,743 6,030 1,584 537 217 113 49,621
Other 2,132 1,109 807 4,719 4,050 1,108 2,721 593 563 17,802
Small and medium
enterprises 1,019 1,537 909 5,437 1,918 637 466 125 – 12,048
Consumer Banking 14,454 6,216 4,240 33,899 11,998 3,329 3,724 935 676 79,471
Agriculture, forestry
and fishing 193 22 90 20 115 51 34 204 422 1,151
Construction 75 29 23 268 238 248 395 68 20 1,364
Commerce 1,647 1,519 395 352 1,921 792 2,150 640 1,581 10,997
Electricity, gas and water 196 1 70 95 325 22 323 103 866 2,001
Financing, insurance and
business services 4,451 1,227 531 1,182 2,474 461 1,490 189 5,393 17,398
Governments – 4,131 4,012 11 18 – 20 10 249 8,451
Mining and quarrying 9 28 – 46 183 45 253 61 1,779 2,404
Manufacturing 1,881 579 188 3,757 5,476 1,754 1,757 381 3,752 19,525
Commercial real estate 1,163 681 6 1,015 739 461 2 14 – 4,081
Transport, storage
and communication 424 315 145 136 490 155 889 124 1,671 4,349
Other 116 335 7 424 524 6 573 10 84 2,079
Wholesale Banking 10,155 8,867 5,467 7,306 12,503 3,995 7,886 1,804 15,817 73,800
Portfolio impairment
provision (48) (28) (28) (93) (194) (36) (65) (13) (7) (512)
Total loans and advances to customers 24,561 15,055 9,679 41,112 24,307 7,288 11,545 2,726 16,486 152,759
Total loans and advances to banks 7,046 1,736 1,178 1,597 4,743 484 993 288 5,143 23,208
Total loans and advances to customers include $806 million held at fair value through profit or loss. Total loans and advances to banks
include $2,100 million held at fair value through profit or loss account.

STANDARD CHARTERED PLC – RISK REVIEW continued
18
Loan Portfolio continued 30.06.06
Asia Pacific
Hong Kong
$million Singapore
$million Malaysia$million
Korea $million
OtherAsia
Pacific$million
India$million
Middle East & Other
S Asia $million
Africa $million
AmericasUK &
GroupHeadOffice
$million Total
$million
Loans to individuals
Mortgages 11,281 3,903 2,562 23,240 1,096 1,440 159 214 144 44,039
Other 2,132 1,044 725 4,727 3,114 924 2,160 442 148 15,416
Small and medium enterprises 861 1,651 840 4,754 908 389 90 116 – 9,609
Consumer Banking 14,274 6,598 4,127 32,721 5,118 2,753 2,409 772 292 69,064
Agriculture, forestry and fishing 22 24 43 9 96 83 71 150 378 876
Construction 72 33 23 141 85 248 290 48 18 958
Commerce 1,291 1,132 328 278 826 469 1,530 359 1,343 7,556
Electricity, gas and water 347 16 61 50 257 26 228 54 684 1,723
Financing, insurance and
business services 2,535 1,460 687 1,748 1,178 466 1,048 119 1,589 10,830
Governments – 2,625 3,199 15 155 – 84 – 282 6,360
Mining and quarrying – – 8 64 244 28 207 104 863 1,518
Manufacturing 1,773 360 402 2,865 3,053 1,310 1,392 491 2,191 13,837
Commercial real estate 1,249 589 7 737 549 238 3 7 7 3,386
Transport, storage and
communication 567 243 106 170 231 101 647 138 1,661 3,864
Other 112 115 39 – 13 3 266 24 55 627
Wholesale Banking 7,968 6,597 4,903 6,077 6,687 2,972 5,766 1,494 9,071 51,535
Portfolio impairment
Provision (54) (26) (23) (74) (198) (30) (32) (10) (7) (454)
Total loans and advances
to customers 22,188 13,169 9,007 38,724 11,607 5,695 8,143 2,256 9,356 120,145
Total loans and advances
to banks 3,131 1,155 153 1,835 3,433 285 1,501 563 5,586 17,642
Total loans and advances to customers include $595 million held at fair value through profit or loss. Total loans and advances to banks
include $892 million held at fair value through profit or loss account.

STANDARD CHARTERED PLC – RISK REVIEW continued
19
Loan Portfolio continued
31.12.06*
Asia Pacific
Hong Kong
$million Singapore
$million Malaysia$million
Korea $million
**OtherAsia
Pacific$million
India$million
Middle East & Other
S Asia $million
Africa $million
AmericasUK &
GroupHeadOffice
$million Total
$million
Loans to individuals
Mortgages 11,245 3,551 2,593 23,954 5,968 1,492 416 239 155 49,613
Other 2,235 1,028 771 4,612 4,523 928 2,650 483 537 17,767
Small and medium enterprises 919 1,548 883 4,907 2,023 567 323 133 – 11,303
Consumer Banking 14,399 6,127 4,247 33,473 12,514 2,987 3,389 855 692 78,683
Agriculture, forestry and fishing 53 13 53 20 108 25 65 159 297 793
Construction 57 29 26 262 181 198 332 78 2 1,165
Commerce 1,986 1,320 331 348 1,407 608 1,995 457 1,269 9,721
Electricity, gas and water 176 17 56 31 314 26 193 80 815 1,708
Financing, insurance and
business services 1,817 1,664 724 1,176 1,901 479 1,245 182 3,264 12,452
Governments – 3,328 3,397 13 20 – 4 – 235 6,997
Mining and quarrying – 3 – 50 324 32 352 110 1,624 2,495
Manufacturing 2,282 701 228 3,208 4,745 1,435 1,848 406 2,504 17,357
Commercial real estate 819 708 5 849 720 231 27 7 – 3,366
Transport, storage and
communication 277 338 149 189 495 249 810 173 1,647 4,327
Other 220 406 9 496 357 5 314 39 115 1,961
Wholesale Banking 7,687 8,527 4,978 6,642 10,572 3,288 7,185 1,691 11,772 62,342
Portfolio impairment
provision (49) (28) (26) (86) (228) (33) (58) (10) (6) (524)
Total loans and advances
to customers 22,037 14,626 9,199 40,029 22,858 6,242 10,516 2,536 12,458 140,501
Total loans and advances
to banks 6,474 939 161 1,753 4,462 477 1,058 387 5,353 21,064
* Amounts have been restated as explained in note 30 on page 61.
** Restated to present on a consistent basis.
Total loans and advances to customers include $1,194 million held at fair value through profit or loss. Total loans and advances to
banks include $1,340 million held at fair value through profit or loss account.

STANDARD CHARTERED PLC – RISK REVIEW continued
20
Maturity analysis
Approximately 50 per cent of the Group’s loans and advances
are short term having a contractual maturity of one year or
less. The Wholesale Banking portfolio is predominantly short
term, with 77 per cent of loans and advances having a
contractual maturity of one year or less. In Consumer
Banking, 63 per cent of the portfolio is in the mortgage book,
traditionally longer term in nature. Whilst the Other and SME
loans in Consumer Banking have short contractual maturities,
in the normal course of business they may be renewed and
repaid over longer terms.
30.06.07
One yearor less
$million
One to five years
$million
Over fiveyears
$million Total
$million
Consumer Banking
Mortgages 3,212 8,396 38,013 49,621
Other 9,087 6,867 1,848 17,802
SME 6,944 3,059 2,045 12,048
Total 19,243 18,322 41,906 79,471
Wholesale Banking 57,080 11,319 5,401 73,800
Portfolio impairment provision (512)
Loans and advances to customers 76,323 29,641 47,307 152,759
30.06.06
One yearor less
$million
One to five years
$million
Over fiveyears
$million Total
$million
Consumer Banking
Mortgages 3,513 9,201 31,325 44,039
Other 8,527 5,882 1,007 15,416
SME 5,827 2,038 1,744 9,609
Total 17,867 17,121 34,076 69,064
Wholesale Banking 40,942 7,443 3,150 51,535
Portfolio impairment provision (454)
Loans and advances to customers 58,809 24,564 37,226 120,145
31.12.06*
One yearor less
$million
One to five years
$million
Over fiveyears
$million Total
$million
Consumer Banking
Mortgages 4,378 8,729 36,506 49,613
Other 9,141 6,393 2,233 17,767
SME 6,299 2,812 2,192 11,303
Total 19,818 17,934 40,931 78,683
Wholesale Banking 48,569 9,211 4,562 62,342
Portfolio impairment provision (524)
Loans and advances to customers 68,387 27,145 45,493 140,501
* Amounts have been restated as explained in note 30 on page 61.
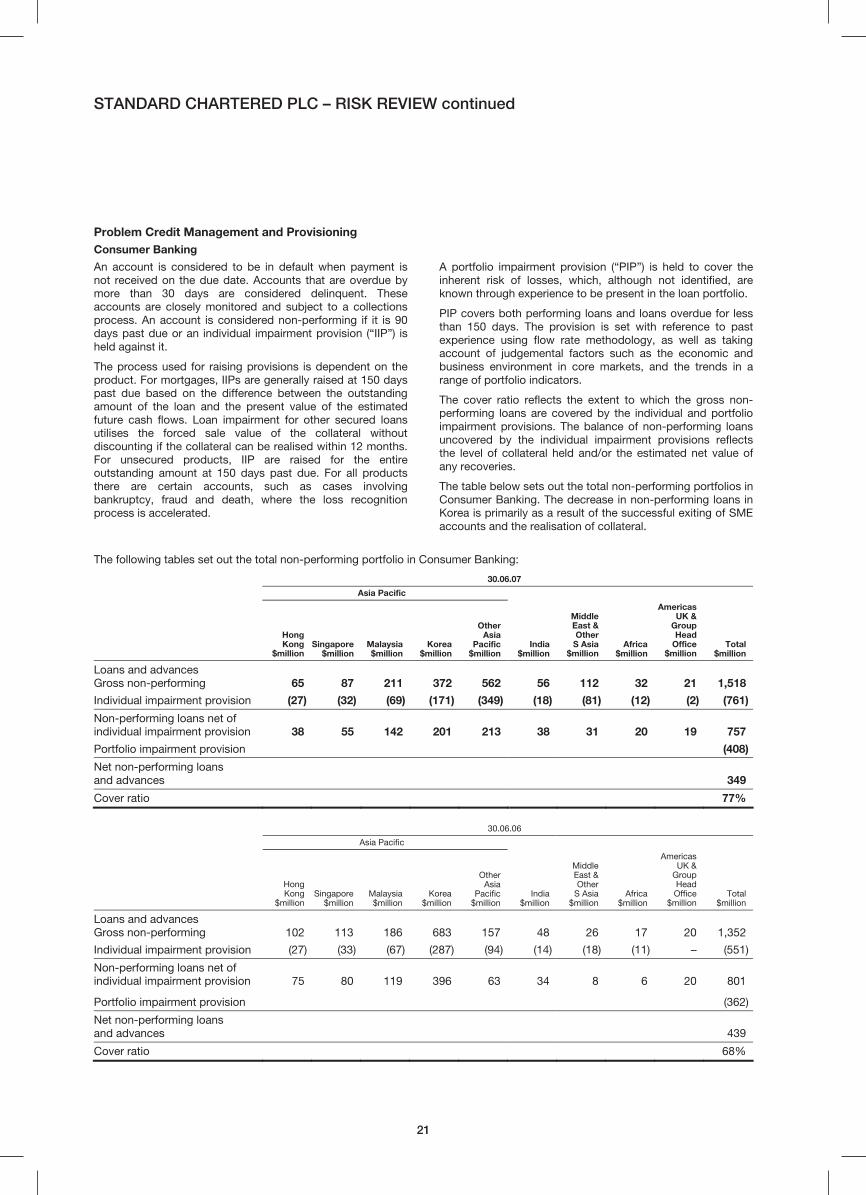
STANDARD CHARTERED PLC – RISK REVIEW continued
21
Problem Credit Management and Provisioning Consumer Banking
An account is considered to be in default when payment is
not received on the due date. Accounts that are overdue by
more than 30 days are considered delinquent. These
accounts are closely monitored and subject to a collections
process. An account is considered non-performing if it is 90
days past due or an individual impairment provision (“IIP”) is
held against it.
The process used for raising provisions is dependent on the
product. For mortgages, IIPs are generally raised at 150 days
past due based on the difference between the outstanding
amount of the loan and the present value of the estimated
future cash flows. Loan impairment for other secured loans
utilises the forced sale value of the collateral without
discounting if the collateral can be realised within 12 months.
For unsecured products, IIP are raised for the entire
outstanding amount at 150 days past due. For all products
there are certain accounts, such as cases involving
bankruptcy, fraud and death, where the loss recognition
process is accelerated.
A portfolio impairment provision (“PIP”) is held to cover the
inherent risk of losses, which, although not identified, are
known through experience to be present in the loan portfolio.
PIP covers both performing loans and loans overdue for less
than 150 days. The provision is set with reference to past
experience using flow rate methodology, as well as taking
account of judgemental factors such as the economic and
business environment in core markets, and the trends in a
range of portfolio indicators.
The cover ratio reflects the extent to which the gross non-
performing loans are covered by the individual and portfolio
impairment provisions. The balance of non-performing loans
uncovered by the individual impairment provisions reflects
the level of collateral held and/or the estimated net value of
any recoveries.
The table below sets out the total non-performing portfolios in
Consumer Banking. The decrease in non-performing loans in
Korea is primarily as a result of the successful exiting of SME
accounts and the realisation of collateral.
The following tables set out the total non-performing portfolio in Consumer Banking:
30.06.07
Asia Pacific
Hong Kong
$million Singapore
$million Malaysia$million
Korea $million
OtherAsia
Pacific$million
India$million
Middle East & Other
S Asia $million
Africa $million
AmericasUK &
GroupHead
Office$million
Total$million
Loans and advances
Gross non-performing 65 87 211 372 562 56 112 32 21 1,518
Individual impairment provision (27) (32) (69) (171) (349) (18) (81) (12) (2) (761)
Non-performing loans net of
individual impairment provision 38 55 142 201 213 38 31 20 19 757
Portfolio impairment provision (408)
Net non-performing loans
and advances 349
Cover ratio 77%
30.06.06
Asia Pacific
Hong Kong
$million Singapore
$million Malaysia$million
Korea $million
OtherAsia
Pacific$million
India$million
Middle East & Other
S Asia $million
Africa $million
AmericasUK &
GroupHeadOffice
$million Total
$million
Loans and advances
Gross non-performing 102 113 186 683 157 48 26 17 20 1,352
Individual impairment provision (27) (33) (67) (287) (94) (14) (18) (11) – (551)
Non-performing loans net of
individual impairment provision 75 80 119 396 63 34 8 6 20 801
Portfolio impairment provision (362)
Net non-performing loans
and advances 439
Cover ratio 68%

STANDARD CHARTERED PLC – RISK REVIEW continued
22
Consumer Banking continued 31.12.06*
Asia Pacific
Hong Kong
$million Singapore
$million Malaysia$million
Korea $million
OtherAsia
Pacific$million
India$million
Middle East & Other
S Asia $million
Africa $million
AmericasUK &
GroupHeadOffice
$million Total
$million
Loans and advances
Gross non-performing 80 100 202 531 695 48 98 24 5 1,783
Individual impairment provision (29) (38) (67) (239) (422) (17) (64) (10) (3) (889)
Non-performing loans net of
individual impairment provision 51 62 135 292 273 31 34 14 2 894
Portfolio impairment provision (428)
Net non-performing loans
and advances 466
Cover ratio 74%
* Amounts have been restated as explained in note 30 on page 61.
Wholesale Banking
In Wholesale Banking, accounts or portfolios are placed on
Early Alert when they display signs of weakness. Such
accounts and portfolios are subject to a dedicated process
with oversight involving senior Risk Officers and Group
Special Asset Management (“GSAM”). Account plans are re-
evaluated and remedial actions are agreed and monitored
until complete. Remedial actions include, but are not limited
to, exposure reduction, security enhancement, exit of the
account or immediate movement of the account into the
control of GSAM, the specialist recovery unit.
Loans are designated as impaired and considered non-
performing where recognised weakness indicates that full
payment of either interest or principal becomes questionable
or as soon as payment of interest or principal is 90 days or
more overdue. Impaired accounts are managed by GSAM,
which is managed separately from the main businesses of the
Group. Where any amount is considered uncollectable, an
individual impairment provision is raised, being the difference
between the loan carrying amount and the present value of
estimated future cash flows. In any decision relating to the
raising of provisions, the Group attempts to balance
economic conditions, local knowledge and experience, and
the results of independent asset reviews.
Where it is considered that there is no realistic prospect of
recovering an element of an account against which an
impairment provision has been raised, then that amount will
be written off.
A portfolio impairment provision is held to cover the inherent
risk of losses, which, although not identified, are known
through experience to be present in any loan portfolio. In
Wholesale Banking, the portfolio impairment provision is set
with reference to past experience using loss rates, and
judgemental factors such as the economic environment and
the trends in key portfolio indicators.
The cover ratio reflects the extent to which gross non-
performing loans are covered by individual and portfolio
impairment provisions. At 88 per cent, the Wholesale Banking
non-performing portfolio is well covered. The balance
uncovered by individual impairment provision represents the
value of collateral held and/or the Group’s estimate of the net
value of any work-out strategy.

STANDARD CHARTERED PLC – RISK REVIEW continued
23
Wholesale Banking continued
The following tables set out the total non-performing portfolio in Wholesale Banking: 30.06.07
Asia Pacific
Hong Kong
$million Singapore
$million Malaysia$million
Korea$million
OtherAsia
Pacific$million
India$million
Middle East & Other
S Asia $million
Africa $million
AmericasUK &
GroupHead
Office$million
Total$million
Loans and advances
Gross non-performing 112 33 28 38 372 27 114 102 128 954
Individual impairment provision (83) (26) (24) (32) (276) (23) (108) (50) (116) (738)
Non-performing loans and
advances net of individual
impairment provision 29 7 4 6 96 4 6 52 12 216
Portfolio impairment provision (105)
Net non-performing loans and
advances 111
Cover ratio 88%
30.06.06
Asia Pacific
Hong Kong
$million Singapore
$million Malaysia$million
Korea$million
OtherAsia
Pacific$million
India$million
Middle East & Other
S Asia $million
Africa $million
AmericasUK &
GroupHeadOffice
$million Total
$million
Loans and advances
Gross non-performing 295 113 32 125 117 28 45 97 219 1,071
Individual impairment provision (176) (85) (31) (45) (104) (23) (30) (57) (204) (755)
Non-performing loans and
advances net of individual
impairment provision 119 28 1 80 13 5 15 40 15 316
Portfolio impairment provision (93)
Net non-performing loans and
advances 223
Cover ratio 79%
31.12.06*
Asia Pacific
Hong Kong
$million Singapore
$million Malaysia$million
Korea$million
OtherAsia
Pacific$million
India$million
Middle East & Other
S Asia $million
Africa $million
AmericasUK &
GroupHeadOffice
$million Total
$million
Loans and advances
Gross non-performing 167 69 29 110 406 24 121 100 152 1,178
Individual impairment provision (130) (46) (25) (46) (215) (22) (111) (58) (151) (804)
Non-performing loans and
advances net of individual
impairment provision 37 23 4 64 191 2 10 42 1 374
Portfolio impairment provision (97)
Net non-performing loans and
advances 277
Cover ratio 76%
* Amounts have been restated as explained in note 30 on page 61.

STANDARD CHARTERED PLC – RISK REVIEW continued
24
Wholesale Banking continued 30.06.07
Asia Pacific
Hong Kong
$million Singapore
$million Malaysia$million
Korea$million
OtherAsia
Pacific$million
India$million
Middle East & Other
S Asia $million
Africa $million
AmericasUK &
GroupHead
Office$million
Total$million
Gross impairment charge 7 3 1 2 7 7 5 4 2 38
Recoveries/provisions no longer
required (21) (3) (1) (3) (1) (4) (4) (4) (14) (55)
Net individual impairment
charge/(credit) (14) – – (1) 6 3 1 – (12) (17)
Portfolio impairment provision 6
Net impairment credit (11)
30.06.06 Asia Pacific
Hong Kong
$million Singapore
$million Malaysia
$million Korea
$million
Other Asia Pacific
$million India
$million
Middle East & Other
S Asia $million
Africa $million
Americas UK &
Group Head Office
$million Total
$million
Gross impairment charge 5 7 1 5 2 1 – 13 2 36
Recoveries/provisions no longer
required (29) (4) (4) – (3) (15) (6) (4) (30) (95)
Net individual impairment
charge/(credit) (24) 3 (3) 5 (1) (14) (6) 9 (28) (59)
Portfolio impairment provision 3
Net impairment credit (56)
31.12.06 Asia Pacific
Hong Kong
$million Singapore
$million Malaysia
$million Korea
$million
Other Asia Pacific
$million India
$million
Middle East & Other
S Asia $million
Africa $million
Americas UK &
Group Head Office
$million Total
$million
Gross impairment charge 9 2 1 2 1 8 10 6 5 44
Recoveries/provisions no longer
required (21) (2) (4) (3) (8) (4) (12) (2) (19) (75)
Net individual impairment
charge/(credit) (12) – (3) (1) (7) 4 (2) 4 (14) (31)
Portfolio impairment provision (5)
Net impairment credit (36)

STANDARD CHARTERED PLC – RISK REVIEW continued
25
Movement in Group Individual Impairment Provision The following tables set out the movements in the Group’s total individual impairment provisions against loans and advances:
30.06.07
Asia Pacific
Hong Kong
$million Singapore
$million Malaysia$million
Korea$million
OtherAsia
Pacific$million
India$million
Middle East & Other
S Asia $million
Africa $million
Americas UK &
Group Head
Office $million
Total$million
Provisions held at
1 January 2007 159 84 92 285 637 39 175 68 154 1,693
Exchange translation differences – – 2 1 1 3 1 2 – 10
Amounts written off (73) (36) (27) (60) (213) (36) (53) (12) (24) (534)
Recoveries of acquisition fair values – – – (55) – – – – – (55)
Recoveries of amounts previously
written off 15 6 7 – 7 9 10 – 1 55
Discount unwind (2) (4) (2) (13) (12) (1) – – – (34)
Other – – – (2) (6) (2) 3 – – (7)
New provisions 52 30 48 58 251 45 80 11 1 576
Recoveries/provisions
no longer required (41) (22) (27) (11) (40) (16) (27) (7) (14) (205)
Net charge against/(credit) to profit 11 8 21 47 211 29 53 4 (13) 371
Provisions held at
30 June 2007 110 58 93 203 625 41 189 62 118 1,499
30.06.06
Asia Pacific
Hong Kong
$million Singapore
$million Malaysia$million
Korea$million
OtherAsia
Pacific$million
India$million
Middle East & Other
S Asia $million
Africa $ million
Americas
UK &
Group
Head
Office
$million Total
$million
Provisions held at
1 January 2006 279 140 96 361 179 40 64 60 167 1,386
Exchange translation differences – 5 3 23 6 (1) (1) (1) 6 40
Amounts written off (37) (51) (24) (21) (185) (33) (33) (6) (4) (394)
Recoveries of acquisition fair values – – – (42) – – – – – (42)
Recoveries of amounts previously
written off 30 4 6 – 9 9 6 – 1 65
Discount unwind (2) (1) (2) (18) – – – (1) (1) (25)
Other (63) – – – – 1 – – 65 3
New provisions 59 36 49 48 203 37 27 25 2 486
Recoveries/provisions
no longer required (63) (15) (30) (19) (14) (16) (15) (9) (32) (213)
Net charge against/(credit) to profit (4) 21 19 29 189 21 12 16 (30) 273
Provisions held at
30 June 2006 203 118 98 332 198 37 48 68 204 1,306

STANDARD CHARTERED PLC – RISK REVIEW continued
26
31.12.06*
Asia Pacific
Hong Kong
$million Singapore
$million Malaysia$million
Korea$million
OtherAsia
Pacific$million
India$million
Middle East & Other
S Asia $million
Africa $ million
Americas
UK &
Group
Head
Office
$million Total
$million
Provisions held at
1 July 2006 203 118 98 332 198 37 48 68 204 1,306
Exchange translation differences – 2 3 6 2 2 (1) – 3 17
Amounts written off (82) (57) (27) (43) (218) (31) (55) (11) (44) (568)
Recoveries of acquisition fair values – – – (64) – – – – – (64)
Recoveries of amounts previously
written off 19 4 5 8 9 8 6 2 2 63
Acquisitions – – – – 475 – 143 – – 618
Discount unwind – (1) (2) (14) (7) (1) – (1) (1) (27)
Other – – – 14 1 – – – 2 17
New provisions 67 35 45 83 200 39 52 19 7 547
Recoveries/provisions
no longer required (48) (17) (30) (37) (23) (15) (18) (9) (19) (216)
Net charge against/(credit) to profit 19 18 15 46 177 24 34 10 (12) 331
Provisions held at
31 December 2006 159 84 92 285 637 39 175 68 154 1,693
* Amounts have been restated as explained in note 30 on page 61.

STANDARD CHARTERED PLC – RISK REVIEW continued
27
Country Risk
Country Risk is the risk that a counterparty is unable to meet its
contractual obligations as a result of adverse economic conditions
or actions taken by governments in the relevant country.
The GRC approves country risk and delegates the setting and
management of country limits to the Deputy Group Chief
Risk Officer.
The business and Country Chief Executive Officers manage
exposures within these limits and policies. Countries
designated as higher risk are subject to increased central
monitoring.
Cross border assets comprise loans and advances, interest
bearing deposits with other banks, trade and other bills,
acceptances, amounts receivable under finance leases,
certificates of deposit, and other negotiable paper and
investment securities, where the counterparty is resident in a
country other than that where the cross border assets are
recorded. Cross border assets also include exposures to local
residents denominated in currencies other than the local
currency.
Cross border exposure to countries in which the Group does
not have a significant presence is predominantly in relation to
money market and global corporate activity. The business is
originated in the Group’s key markets, but is conducted with
counterparties domiciled in the country against which the
exposure is reported.
The following table, based on the Bank of England Cross
Border Reporting (“CE”) guidelines, shows the Group’s cross
border assets including acceptances where they exceed one
per cent of the Group’s total assets.
30.06.07 30.06.06
Publicsector
$million
Banks
$million
Other
$million
Total
$million
Publicsector
$million
Banks $million
Other$million
Total$million
Hong Kong 5 739 5,424 6,168 1 480 3,846 4,327
USA 1,839 1,496 2,770 6,105 881 540 2,673 4,094
India 5 1,570 3,596 5,171 2 1,028 1,652 2,682
Korea 6 1,209 4,020 5,235 14 1,500 2,854 4,368
Singapore – 1,012 2,923 3,935 – 716 2,132 2,848
Australia – – – – – 2,667 259 2,926
France – – – – 137 2,530 214 2,881
China – – – – 57 1,073 1,322 2,452
31.12.06
Publicsector
$million
Banks $million
Other$million
Total$million
Hong Kong 4 576 4,531 5,111
USA 1,194 1,027 2,895 5,116
India 3 1,335 2,585 3,923
Korea 8 1,029 3,439 4,476
Singapore – 584 3,471 4,055
Australia – 2,794 258 3,052
France 62 3,591 167 3,820
China 94 1,055 1,571 2,720
Dubai – 1,504 1,413 2,917
STANDARD CHARTERED PLC – RISK REVIEW continued
28
Market Risk
The Group recognises market risk as the exposure created by
potential changes in market prices and rates. The Group is
exposed to market risk arising principally from customer
driven transactions.
Market risk is governed by the GRC, which agrees policies
and levels of risk appetite in terms of Value at Risk (“VaR”).
The Group Market Risk Committee (“GMRC”) provides market
risk oversight and guidance on policy setting. Policies cover
both trading and non-trading books of the Group. The trading
book is defined as per the FSA Handbook BIPRU. Limits by
location and portfolio are proposed by the businesses within
the terms of agreed policy.
Group Market Risk (“GMR”) approves the limits within
delegated authorities and monitors exposures against these
limits. Additional limits are placed on specific instruments and
currency concentrations where appropriate. Sensitivity
measures are used in addition to VaR as risk management
tools. Option risks are controlled through revaluation limits on
currency and volatility shifts, limits on volatility risk by
currency pair and other variables that determine the options’
value.
VaR models are back tested against actual results to ensure
pre-determined levels of accuracy are maintained. GMR
complements the VaR measurement by regularly stress
testing market risk exposures to highlight potential risk that
may arise from extreme market events that are rare
but plausible.
Stress testing is an integral part of the market risk
management framework and considers both historical market
events and forward looking scenarios. Ad hoc scenarios are
also prepared reflecting specific market conditions. A
consistent stress testing methodology is applied to trading
and non-trading books.
Stress scenarios are regularly updated to reflect changes in
risk profile and economic events. GMRC has responsibility for
reviewing stress exposures and, where necessary, enforcing
reductions in overall market risk exposure. GRC considers
stress testing results as part of its supervision of risk appetite.
The stress test methodology assumes that management
action would be limited during a stress event, reflecting the
decrease in liquidity that often occurs.
Value at Risk
The Group uses historic simulation to measure VaR on all
market risk related activities.
The total VaR for trading and non-trading books combined at
30 June 2007 was $10.0 million (30 June 2006: $9.7 million,
31 December 2006: $10.3 million), with a maximum exposure
of $14.0 million.
Interest rate related VaR was $9.5 million (30 June 2006: $9.2
million, 31 December 2006: $9.3 million) and foreign
exchange related VaR was $2.2 million (30 June 2006: $2.9
million, 31 December 2006: $1.5 million).
The average total VaR for trading and non-trading books
during the first half of 2007 was $10.3 million (30 June 2006:
$10.7 million, 31 December 2006: $10.6 million).
VaR for interest rate risk in the non-trading books of the
Group totalled $7.9 million at 30 June 2007 (30 June 2006:
$8.4 million, 31 December 2006: $8.0 million).
The Group has no significant trading exposure to equity or
commodity price risk.
The average daily income earned from market risk related
activities during the six months to 30 June 2007 was $7.0
million, compared with $5.5 million during the six months to
30 June 2006.
Foreign Exchange Exposure
The Group’s foreign exchange exposures comprise trading
and non-trading foreign currency translation exposures and
structural currency exposures in net investments in non-US
dollar units.
Foreign exchange trading exposures are principally derived
from customer driven transactions. The average daily income
from foreign exchange trading businesses during the six
months ended 30 June 2007 was $3.0 million (30 June 2006:
$2.6 million).
Interest Rate Exposure
The Group’s interest rate exposures arise from trading and
non-trading activities.
Structural interest rate risk arises from the differing re-pricing
characteristics of commercial banking assets and liabilities.
The average daily income from interest rate trading
businesses during the six months to 30 June 2007 was $4.0
million (30 June 2006: $2.9 million).
Derivatives
Derivatives are contracts whose characteristics and value
derive from underlying financial instruments, interest and
exchange rates or indices. They include futures, forwards,
swaps and options transactions in the foreign exchange,
credit and interest rate markets. Derivatives are an important
risk management tool for banks and their customers because
they can be used to manage the risk of price, interest rate and
exchange rate movements.
The Group’s derivative transactions are principally in instruments
where the mark-to-market values are readily determinable by
reference to independent prices and valuation quotes or by using
standard industry pricing models.
The Group enters into derivative contracts in the normal
course of business to meet customer requirements and to
manage its own exposure to fluctuations in interest, credit
and exchange rates.
Derivatives are carried at fair value and shown in the balance
sheet as separate totals of assets and liabilities. Recognition
of fair value gains and losses depends on whether the
derivatives are classified as trading or for hedging purposes.
The Group applies a future exposure methodology to manage
counterparty credit exposure associated with derivative
transactions.
STANDARD CHARTERED PLC – RISK REVIEW continued
29
Hedging
In accounting terms, hedges are classified into three types:
fair value hedges, where fixed rates of interest or foreign
exchange are exchanged for floating rates; cash flow hedges,
where variable rates of interest or foreign exchange are
exchanged for fixed rates, and hedges of net investments in
overseas operations translated to the parent company’s
functional currency, US dollars.
The Group uses futures, forwards, swaps and options
transactions in the foreign exchange and interest rate markets
to hedge risk.
The Group occasionally hedges the value of its foreign
currency denominated investments in subsidiaries and
branches. Hedges may be taken where there is a risk of a
significant exchange rate movement but, in general,
management believes that the Group’s reserves are sufficient
to absorb any foreseeable adverse currency depreciation.
The effect of exchange rate movements on the capital risk
asset ratio is mitigated by the fact that both the net asset
value of these investments and the risk weighted value of
assets and contingent liabilities follow substantially the same
exchange rate movements.
Liquidity Risk
The Group defines liquidity risk as the risk that the bank either
does not have sufficient financial resources available to meet
all its obligations and commitments as they fall due, or can
access them only at excessive cost.
It is the policy of the Group to maintain adequate liquidity at
all times, in all geographical locations and for all currencies.
Hence the Group aims to be in a position to meet all
obligations, to repay depositors, to fulfil commitments to lend
and to meet any other commitments.
Liquidity risk management is governed by GALCO, which is
chaired by the Group Finance Director. GALCO is responsible
for both statutory and prudential liquidity. These
responsibilities are managed through the provision of
authorities, policies and procedures that are co-ordinated by
the Liquidity Management Committee (“LMC”) with country
Asset and Liability Committees (“ALCO”).
Due to the diversified nature of the Group’s business, the
Group’s policy is that liquidity is more effectively managed
locally, in-country. Each ALCO is responsible for ensuring that
the country is self-sufficient and is able to meet all its
obligations to make payments as they fall due. The ALCO has
primary responsibility for compliance with regulations and
Group policy and maintaining a country liquidity crisis
contingency plan.
A substantial portion of the Group’s assets are funded by
customer deposits made up of current and savings accounts
and other deposits. These customer deposits, which are
widely diversified by type and maturity, represent a stable
source of funds. Lending is normally funded by liabilities in
the same currency.
The Group also maintains significant levels of marketable
securities either for compliance with local statutory
requirements or as prudential investments of surplus funds.
The GALCO also oversees the structural foreign exchange
and interest rate exposures that arise within the Group. These
responsibilities are managed through the provision of
authorities, policies and procedures that are co-ordinated by
the Capital Management Committee. Policies and guidelines
for the maintenance of capital ratio levels are approved by
GALCO. Compliance with Group ratios is monitored centrally
by Group Corporate Treasury, while local requirements are
monitored by the local ALCO.
Operational Risk
Operational risk is the risk of direct or indirect loss due to an
event or action resulting from the failure of internal processes,
people, and systems, or from external events. The Group
seeks to ensure that key operational risks are managed in a
timely and effective manner through a framework of policies,
procedures and tools to identify, assess, monitor, control, and
report such risks.
The Group Operational Risk Committee (“GORC”) has been
established to supervise and direct the management of
operational risks across the Group. GORC is also responsible
for ensuring adequate and appropriate policies and
procedures are in place for the identification, assessment,
monitoring, control and reporting of operational risks.
A Group operational risk function, independent from the
businesses is responsible for establishing and maintaining the
overall operational risk framework, and for monitoring the
Group’s key operational risk exposures. This unit is supported by
Wholesale Banking and Consumer Banking Operational Risk
units. These units are responsible for ensuring compliance with
policies and procedures in the business, monitoring key
operational risk exposures, and the provision of guidance to the
respective business areas on operational risk.
Compliance with operational risk policies and procedures is
the responsibility of all managers. Every country operates a
Country Operational Risk Group (“CORG”). The CORG has in-
country governance responsibility for ensuring that an
appropriate and robust risk management framework is in
place to monitor and manage operational risk.
Compliance and Regulatory Risk
Compliance and Regulatory risk includes the risk of non-
compliance with regulatory requirements in a country in which
the Group operates. The Group Compliance and Regulatory
Risk function is responsible for establishing and maintaining
an appropriate framework of Group compliance policies and
procedures. Compliance with such policies and procedures is
the responsibility of all managers.
Legal Risk
Legal risk is the risk of unexpected loss, including
reputational loss, arising from defective transactions or
contracts, claims being made or some other event resulting in
a liability or other loss for the Group, failure to protect the title
to and ability to control the rights to assets of the Group
(including intellectual property rights), changes in the law, or
jurisdictional risk. The Group manages legal risk through the
Group Legal Risk Committee, Legal Risk policies and
procedures and effective use of its internal and external
lawyers.
STANDARD CHARTERED PLC – RISK REVIEW continued
30
Reputational Risk
Reputational risk is any material adverse effect on the
relations between the Group and any one of its significant
stakeholders. It is Group policy that the protection of the
Bank’s reputation should take priority over all activities
including revenue generation at all times.
Reputational risk is not a primary risk, but will arise from the
failure to effectively mitigate one or more of country, credit,
liquidity, market, legal and regulatory and operational risk.
It may also arise from the failure to comply with Social,
Environmental and Ethical standards. All staff are responsible
for day to day identification and management of reputational
risk.
From an organisational perspective the Group manages
reputational risk through the Group Reputational Risk and
Responsibility Committee (“GRRRC”) and Country
Management Committees. Wholesale Banking has a
specialised Responsibility and Reputational Risk Committee
which reviews individual transactions. In Consumer Banking,
potential reputational risks resulting from transactions or
products are reviewed by the Product and Reputational Risk
Committee. Issues are then escalated to the GRRRC.
A critical element of the role of the GRRRC is to act as a radar
for the Group in relation to the identification of emerging or
thematic risks. The GRRRC also ensures that effective risk
monitoring is in place for Reputational Risk and reviews
mitigation plans for significant risks.
At a country level, the Country CEO is responsible for the
Group’s reputation in their market. The Country CEO and their
Management Committee must actively:
• promote awareness and application of the Group’s policy
and procedures regarding reputational risk;
• encourage business and functions to take account of the
Group’s reputation in all decision making, including
dealings with customers and suppliers;
• implement effective functioning of the in country reporting
system to ensure their management committee is alerted
of all potential issues; and
• promote effective, proactive stakeholder management.
Monitoring Group Internal Audit is a separate function that reports to the
Group Chief Executive and the Audit and Risk Committee.
Group Internal Audit provides independent confirmation that
Group and business standards, policies and procedures are
being complied with. Where necessary, corrective action
is recommended.

STANDARD CHARTERED PLC - CAPITAL
31
CAPITAL The GALCO targets Tier 1 and Total capital ratios within a range of 7-9 per cent and 12-14 per cent respectively. The ratios at 30
June 2007 are higher than this range. This reflects the strong pace of organic growth and the deployment of capital across the
Group.
30.06.07 $million
30.06.06
$million 31.12.06*
$million
Tier 1 capital
Called up ordinary share capital and preference shares 8,544 6,067 7,771
Eligible reserves 10,367 7,510 8,937
Minority interests 227 165 211
Innovative Tier 1 securities 2,303 2,186 2,262
Less: Restriction on innovative Tier 1 securities – (492) (343)
Goodwill and other intangible assets (6,217) (4,459) (6,179)
Unconsolidated associated companies 253 226 229
Other regulatory adjustments (2) 90 (94)
Total Tier 1 capital 15,475 11,293 12,794
Tier 2 capital
Eligible revaluation reserves 522 191 509
Portfolio impairment provision 513 455 525
Qualifying subordinated liabilities:
Perpetual subordinated debt 3,415 3,260 3,368
Other eligible subordinated debt 6,382 4,325 5,387
Less: Amortisation of qualifying subordinated liabilities (863) (496) (518)
Restricted innovative Tier 1 securities – 492 343
Total Tier 2 capital 9,969 8,227 9,614
Investments in other banks (148) (149) (211)
Other deductions (470) (207) (320)
Total capital base 24,826 19,164 21,877
Banking book
Risk weighted assets 123,007 104,466 120,028
Risk weighted contingents 22,003 21,477 21,106
145,010 125,943 141,134
Trading book
Market risks 7,820 4,249 5,834
Counterparty/settlement risks 6,416 4,906 6,475
Total risk weighted assets and contingents 159,246 135,098 153,443
Capital ratios
Tier 1 capital 9.7% 8.4% 8.3%
Total capital 15.6% 14.2% 14.3%
* Amounts have been restated as explained in note 30 on page 61.

STANDARD CHARTERED PLC
Condensed Consolidated Interim Income Statement For the six months ended 30 June 2007
32
Notes
6 months ended
30.06.07 $million
6 months ended
30.06.06 $million
6 months ended
31.12.06$million
Interest income 7,473 5,970 7,017
Interest expense (4,521) (3,460) (4,199)
Net interest income 2,952 2,510 2,818
Fees and commission income 1,478 1,103 1,172
Fees and commission expense (250) (209) (185)
Net trading income 3 649 531 389
Other operating income 4 434 177 314
2,311 1,602 1,690
Operating income 5,263 4,112 4,508
Staff costs (1,884) (1,381) (1,532)
Premises costs (274) (206) (238)
General administrative expenses (610) (519) (652)
Depreciation and amortisation (150) (119) (149)
Operating expenses (2,918) (2,225) (2,571)
Operating profit before impairment losses and taxation 2,345 1,887 1,937
Impairment losses on loans and advances and
other credit risk provisions 11 (361) (349) (280)
Other impairment (3) (8) (7)
(Loss)/profit from associates (1) (3) 1
Profit before taxation 1,980 1,527 1,651
Taxation 5 (533) (395) (429)
Profit for the period 1,447 1,132 1,222
Profit attributable to:
Minority interests 22 48 29 47
Parent company’s shareholders 1,399 1,103 1,175
Profit for the period 1,447 1,132 1,222
Earnings per share:
Basic earnings per ordinary share 7 98.5c 82.8c 86.9c
Diluted earnings per ordinary share 7 97.1c 82.2c 86.0c
Dividends per ordinary share:
Interim dividend declared 6 23.12c – –
Interim dividend paid 6 – 20.83c –
Final dividend paid 6 – – 50.21c
Total interim dividend payable $324m – –
Total interim dividend (paid 11 October 2006) – $277m –
Total final dividend (paid 11 May 2007) – – $695m

STANDARD CHARTERED PLC
Condensed Consolidated Interim Balance Sheet As at 30 June 2007
33
Notes
30.06.07 $million
30.06.06 $million
31.12.06*$million
Assets
Cash and balances at central banks 8,991 11,813 7,698
Financial assets held at fair value through profit or loss 9 19,344 13,082 15,715
Derivative financial instruments 10 18,441 12,721 13,154
Loans and advances to banks 11 21,108 16,750 19,724
Loans and advances to customers 11 151,953 119,550 139,307
Investment securities 13 52,230 46,037 49,497
Interests in associates 257 206 218
Goodwill and intangible assets 6,217 4,459 6,179
Property, plant and equipment 2,302 1,767 2,169
Deferred tax assets 522 492 519
Other assets 11,890 7,653 8,601
Prepayments and accrued income 3,571 3,618 3,268
Total assets 296,826 238,148 266,049
Liabilities
Deposits by banks 14 26,846 21,994 26,233
Customer accounts 15 160,242 130,176 147,382
Financial liabilities held at fair value through profit or loss 8 13,117 8,420 9,969
Derivative financial instruments 10 19,235 13,390 13,703
Debt securities in issue 16 27,254 24,953 23,514
Current tax liabilities 131 410 68
Other liabilities 17 13,733 11,198 11,357
Accruals and deferred income 3,008 2,430 3,210
Provisions for liabilities and charges 42 56 45
Retirement benefit obligations 18 356 466 472
Subordinated liabilities and other borrowed funds 19 13,279 10,805 12,699
Total liabilities 277,243 224,298 248,652
Equity
Share capital 20 701 667 692
Reserves 21 18,324 12,683 16,161
Total parent company shareholders’ equity 19,025 13,350 16,853
Minority interests 22 558 500 544
Total equity 19,583 13,850 17,397
Total equity and liabilities 296,826 238,148 266,049
* Amounts have been restated as explained in note 30 on page 61.

STANDARD CHARTERED PLC
Condensed Consolidated Interim Statement of Recognised Income and Expense For the six months ended 30 June 2007
34
Notes
6 months ended
30.0607 $million
6 monthsended
30.06.06$million
6 monthsended
31.12.06$million
Exchange differences on translation of foreign operations 257 364 306
Actuarial gains on retirement benefits 149 68 36
Available-for-sale investments:
Valuation gains taken to equity 197 134 548
Transferred to income on disposal/redemption (227) (52) (138)
Cash flow hedges:
Gains taken to equity 6 45 34
(Gains)/losses transferred to income for the period (28) 6 14
Taxation on items recognised directly in equity (38) (56) (75)
Other 7 3 4
Net income recognised in equity 323 512 729
Profit for the period 1,447 1,132 1,222
Total recognised income and expense for the period 1,770 1,644 1,951
Attributable to:
Parent company’s shareholders 21 1,681 1,615 1,869
Minority interests 22 89 29 82
1,770 1,644 1,951
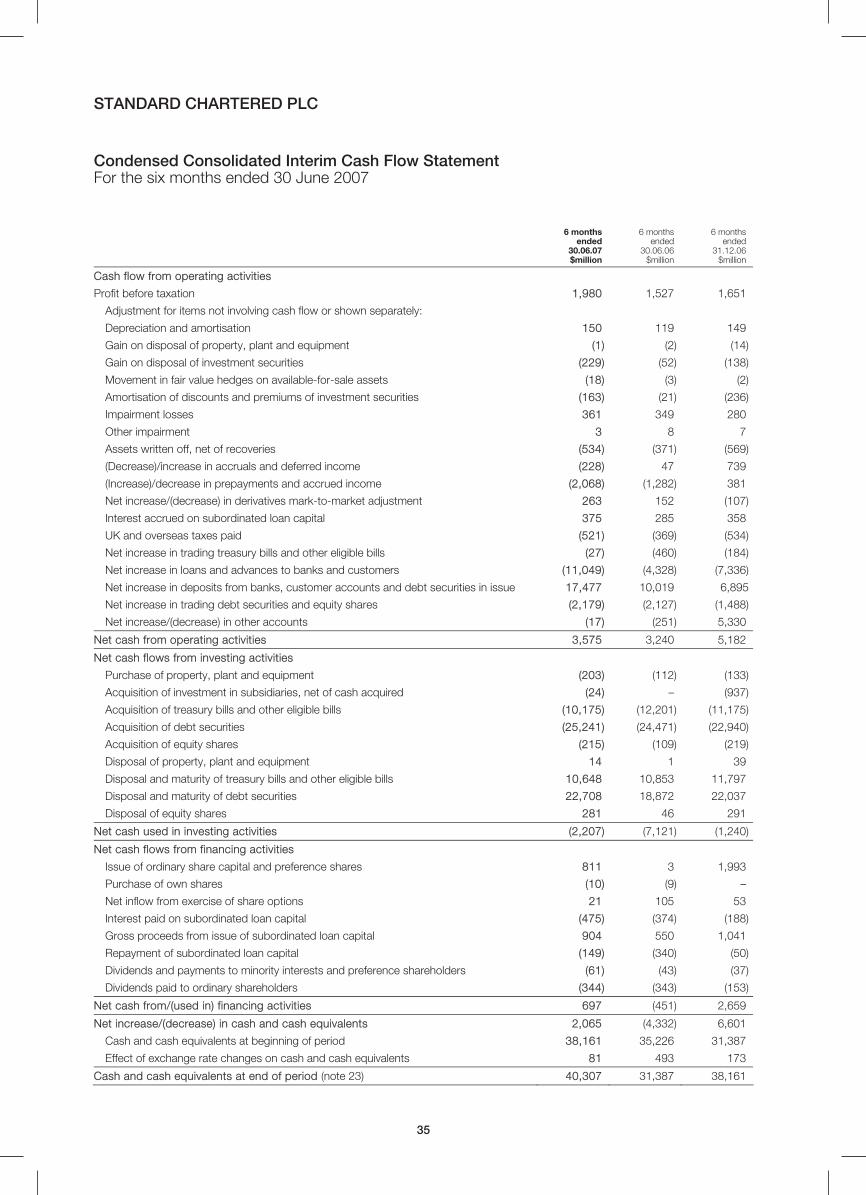
STANDARD CHARTERED PLC
Condensed Consolidated Interim Cash Flow Statement For the six months ended 30 June 2007
35
6 months ended
30.06.07 $million
6 months ended
30.06.06 $million
6 monthsended
31.12.06$million
Cash flow from operating activities
Profit before taxation 1,980 1,527 1,651
Adjustment for items not involving cash flow or shown separately:
Depreciation and amortisation 150 119 149
Gain on disposal of property, plant and equipment (1) (2) (14)
Gain on disposal of investment securities (229) (52) (138)
Movement in fair value hedges on available-for-sale assets (18) (3) (2)
Amortisation of discounts and premiums of investment securities (163) (21) (236)
Impairment losses 361 349 280
Other impairment 3 8 7
Assets written off, net of recoveries (534) (371) (569)
(Decrease)/increase in accruals and deferred income (228) 47 739
(Increase)/decrease in prepayments and accrued income (2,068) (1,282) 381
Net increase/(decrease) in derivatives mark-to-market adjustment 263 152 (107)
Interest accrued on subordinated loan capital 375 285 358
UK and overseas taxes paid (521) (369) (534)
Net increase in trading treasury bills and other eligible bills (27) (460) (184)
Net increase in loans and advances to banks and customers (11,049) (4,328) (7,336)
Net increase in deposits from banks, customer accounts and debt securities in issue 17,477 10,019 6,895
Net increase in trading debt securities and equity shares (2,179) (2,127) (1,488)
Net increase/(decrease) in other accounts (17) (251) 5,330
Net cash from operating activities 3,575 3,240 5,182
Net cash flows from investing activities
Purchase of property, plant and equipment (203) (112) (133)
Acquisition of investment in subsidiaries, net of cash acquired (24) – (937)
Acquisition of treasury bills and other eligible bills (10,175) (12,201) (11,175)
Acquisition of debt securities (25,241) (24,471) (22,940)
Acquisition of equity shares (215) (109) (219)
Disposal of property, plant and equipment 14 1 39
Disposal and maturity of treasury bills and other eligible bills 10,648 10,853 11,797
Disposal and maturity of debt securities 22,708 18,872 22,037
Disposal of equity shares 281 46 291
Net cash used in investing activities (2,207) (7,121) (1,240)
Net cash flows from financing activities
Issue of ordinary share capital and preference shares 811 3 1,993
Purchase of own shares (10) (9) –
Net inflow from exercise of share options 21 105 53
Interest paid on subordinated loan capital (475) (374) (188)
Gross proceeds from issue of subordinated loan capital 904 550 1,041
Repayment of subordinated loan capital (149) (340) (50)
Dividends and payments to minority interests and preference shareholders (61) (43) (37)
Dividends paid to ordinary shareholders (344) (343) (153)
Net cash from/(used in) financing activities 697 (451) 2,659
Net increase/(decrease) in cash and cash equivalents 2,065 (4,332) 6,601
Cash and cash equivalents at beginning of period 38,161 35,226 31,387
Effect of exchange rate changes on cash and cash equivalents 81 493 173
Cash and cash equivalents at end of period (note 23) 40,307 31,387 38,161
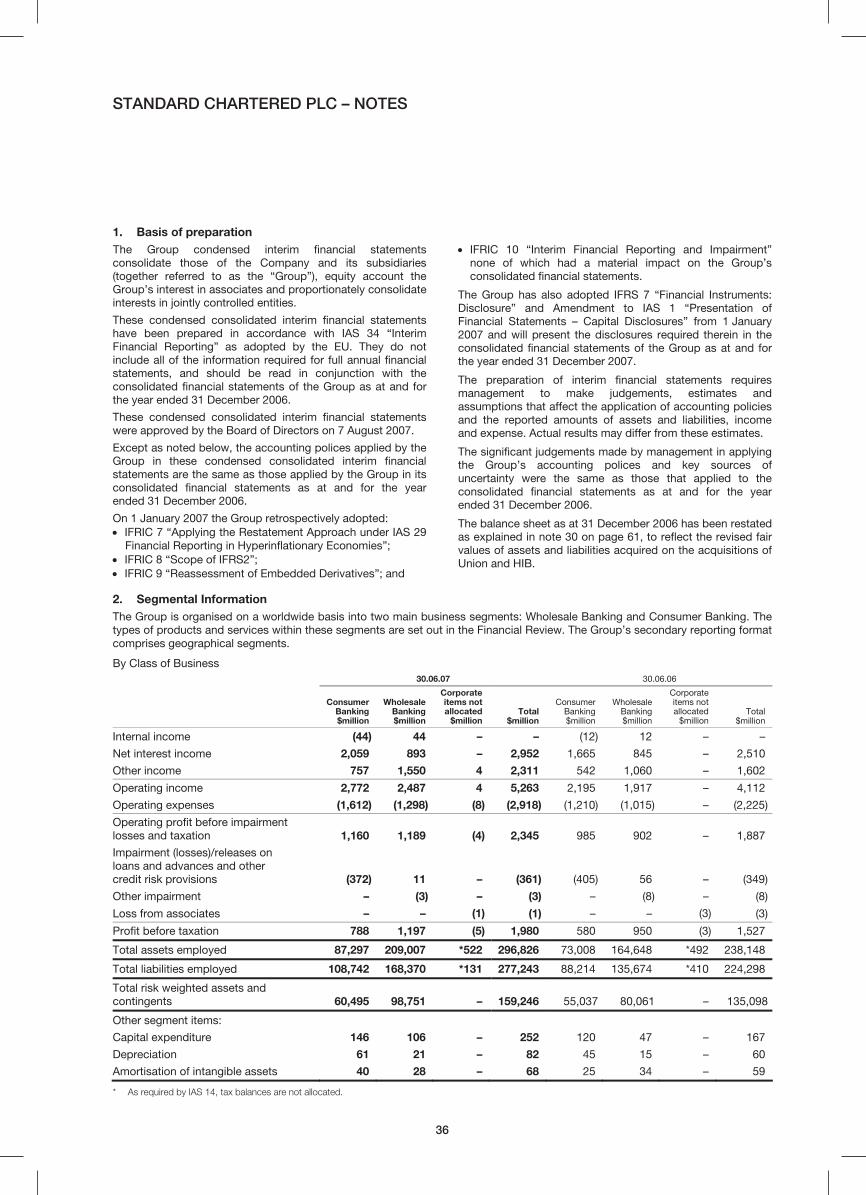
STANDARD CHARTERED PLC – NOTES
36
1. Basis of preparation The Group condensed interim financial statements
consolidate those of the Company and its subsidiaries
(together referred to as the “Group”), equity account the
Group’s interest in associates and proportionately consolidate
interests in jointly controlled entities.
These condensed consolidated interim financial statements
have been prepared in accordance with IAS 34 “Interim
Financial Reporting” as adopted by the EU. They do not
include all of the information required for full annual financial
statements, and should be read in conjunction with the
consolidated financial statements of the Group as at and for
the year ended 31 December 2006.
These condensed consolidated interim financial statements
were approved by the Board of Directors on 7 August 2007.
Except as noted below, the accounting polices applied by the
Group in these condensed consolidated interim financial
statements are the same as those applied by the Group in its
consolidated financial statements as at and for the year
ended 31 December 2006.
On 1 January 2007 the Group retrospectively adopted:
• IFRIC 7 “Applying the Restatement Approach under IAS 29
Financial Reporting in Hyperinflationary Economies”;
• IFRIC 8 “Scope of IFRS2”;
• IFRIC 9 “Reassessment of Embedded Derivatives”; and
• IFRIC 10 “Interim Financial Reporting and Impairment”
none of which had a material impact on the Group’s
consolidated financial statements.
The Group has also adopted IFRS 7 “Financial Instruments:
Disclosure” and Amendment to IAS 1 “Presentation of
Financial Statements – Capital Disclosures” from 1 January
2007 and will present the disclosures required therein in the
consolidated financial statements of the Group as at and for
the year ended 31 December 2007.
The preparation of interim financial statements requires
management to make judgements, estimates and
assumptions that affect the application of accounting policies
and the reported amounts of assets and liabilities, income
and expense. Actual results may differ from these estimates.
The significant judgements made by management in applying
the Group’s accounting polices and key sources of
uncertainty were the same as those that applied to the
consolidated financial statements as at and for the year
ended 31 December 2006.
The balance sheet as at 31 December 2006 has been restated
as explained in note 30 on page 61, to reflect the revised fair
values of assets and liabilities acquired on the acquisitions of
Union and HIB.
2. Segmental Information The Group is organised on a worldwide basis into two main business segments: Wholesale Banking and Consumer Banking. The
types of products and services within these segments are set out in the Financial Review. The Group’s secondary reporting format
comprises geographical segments.
By Class of Business
30.06.07 30.06.06
Consumer Banking$million
WholesaleBanking$million
Corporateitems notallocated
$million Total
$million
Consumer Banking$million
Wholesale Banking $million
Corporateitems notallocated
$million Total
$million
Internal income (44) 44 – – (12) 12 – –
Net interest income 2,059 893 – 2,952 1,665 845 – 2,510
Other income 757 1,550 4 2,311 542 1,060 – 1,602
Operating income 2,772 2,487 4 5,263 2,195 1,917 – 4,112
Operating expenses (1,612) (1,298) (8) (2,918) (1,210) (1,015) – (2,225)
Operating profit before impairment
losses and taxation 1,160 1,189 (4) 2,345 985 902 – 1,887
Impairment (losses)/releases on
loans and advances and other
credit risk provisions (372) 11 – (361) (405) 56 – (349)
Other impairment – (3) – (3) – (8) – (8)
Loss from associates – – (1) (1) – – (3) (3)
Profit before taxation 788 1,197 (5) 1,980 580 950 (3) 1,527
Total assets employed 87,297 209,007 *522 296,826 73,008 164,648 *492 238,148
Total liabilities employed 108,742 168,370 *131 277,243 88,214 135,674 *410 224,298
Total risk weighted assets and
contingents 60,495 98,751 – 159,246 55,037 80,061 – 135,098
Other segment items:
Capital expenditure 146 106 – 252 120 47 – 167
Depreciation 61 21 – 82 45 15 – 60
Amortisation of intangible assets 40 28 – 68 25 34 – 59
* As required by IAS 14, tax balances are not allocated.

STANDARD CHARTERED PLC – NOTES continued
37
2. Segmental Information continued 31.12.06
Consumer Banking$million
Wholesale Banking $million
Corporate items not allocated
$million Total
$million
Internal income (63) 63 – –
Net interest income 1,880 938 – 2,818
Other income 672 1,005 13 1,690
Operating income 2,489 2,006 13 4,508
Operating expenses (1,431) (1,136) (4) (2,571)
Operating profit before impairment
losses and taxation 1,058 870 9 1,937
Impairment (losses)/releases on
loans and advances and other
credit risk provisions (316) 36 – (280)
Other impairment – (7) – (7)
Profit from associates – – 1 1
Profit before taxation 742 899 10 1,651
Total assets employed** 87,789 177,741 *519 266,049
Total liabilities employed 107,141 141,443 *68 248,652
Total risk weighted assets and
contingents 60,380 93,063 – 153,443
Other segment items:
Capital expenditure 89 103 – 192
Depreciation 55 20 – 75
Amortisation of intangible assets 27 47 – 74
* As required by IAS 14, tax balances are not allocated.
** Amounts have been restated as explained in note 30 on page 61. In addition, certain assets have been reallocated between Consumer Banking and Wholesale
Banking to present on a consistent basis.

STANDARD CHARTERED PLC – NOTES continued
38
2. Segmental Information continued
By geographic segment
The Group manages its business segments on a global basis. The operations are based in nine main geographical areas. The UK
is the home country of the parent.
30.06.07
Asia Pacific
Hong Kong
$million Singapore
$million Malaysia$million
Korea$million
**OtherAsia
Pacific$million
India$million
***Middle East & Other
S Asia $million
Africa $million
Americas UK &
GroupHead
Office$million
Total$million
Internal income (58) 34 11 2 20 10 (7) (5) (7) –
Net interest income 602 120 107 627 478 276 416 208 118 2,952
Fees and commissions
income, net 241 104 46 83 220 166 204 89 75 1,228
Net trading income 97 62 28 30 159 65 64 49 95 649
Other operating income 46 80 17 59 151 46 (2) – 37 434
Operating income 928 400 209 801 1,028 563 675 341 318 5,263
Operating expenses (398) (187) (89) (560) (567) (211) (328) (218) (360) (2,918)
Operating profit before
impairment losses and
taxation 530 213 120 241 461 352 347 123 (42) 2,345
Impairment (losses)/releases
on loans and advances and
other credit risk provisions (16) (8) (23) (46) (179) (32) (58) (11) 12 (361)
Other impairment – – – – – – – (1) (2) (3)
Loss from associates – – – – (1) – – – – (1)
Profit before taxation 514 205 97 195 281 320 289 111 (32) 1,980
Loans and advances to
customers – average 22,834 14,442 9,154 40,925 19,757 7,270 10,528 2,234 14,127 141,271
Net interest margins (%) 2.2 1.2 1.9 2.1 2.7 3.7 4.9 5.7 0.3 2.5
Loans and advances to
customers – period end 24,561 15,055 9,679 41,112 24,307 7,288 11,545 2,726 16,486 152,759
Loans and advances to banks
– period end 7,046 1,736 1,178 1,597 4,743 484 993 288 5,143 23,208
Total assets employed* 55,173 30,274 14,626 67,928 50,755 22,188 20,697 8,508 71,197 341,346
Total risk weighted assets and
contingents 22,253 12,642 5,066 36,735 26,143 11,316 14,038 3,616 31,509 163,318
Capital expenditure 15 40 5 23 44 90 25 8 2 252
* Total assets employed includes intra-group items of $45,042 million and excludes deferred tax assets of $522 million.
** Other Asia Pacific includes HIB Operating income of $196 million; Operating expenses of $119 million; and Profit before taxation of $7 million.
*** Middle East & Other S. Asia includes Pakistan Operating income of $173 million; Operating expenses of $87 million; and Profit before taxation of $51 million.

STANDARD CHARTERED PLC – NOTES continued
39
2. Segmental Information continued
30.06.06
Asia Pacific
Hong Kong
$million Singapore
$million Malaysia$million
Korea$million
**OtherAsia
Pacific$million
India$million
***Middle East & Other
S Asia $million
Africa $million
Americas UK &
GroupHeadOffice
$million Total
$million
Internal income (13) 1 1 26 5 (4) (2) (7) (7) –
Net interest income 542 164 122 522 354 210 287 196 113 2,510
Fees and commissions income,
net 198 78 23 68 130 101 141 77 78 894
Net trading income 57 32 33 51 83 59 53 47 116 531
Other operating income 10 15 9 67 10 14 3 2 47 177
Operating income 794 290 188 734 582 380 482 315 347 4,112
Operating expenses (344) (137) (79) (460) (336) (160) (225) (201) (283) (2,225)
Operating profit before
impairment losses and
taxation 450 153 109 274 246 220 257 114 64 1,887
Impairment/(losses) releases
on loans and advances and
other credit risk provisions 8 (19) (12) (40) (277) (7) (14) (17) 29 (349)
Other impairment – – – – – – – (6) (2) (8)
Loss from associates – – – – (3) – – – – (3)
Operating profit before taxation 458 134 97 234 (34) 213 243 91 91 1,527
Loans and advances to
customers – average 22,925 12,434 8,389 38,616 11,898 5,647 8,237 2,319 9,881 120,346
Net interest margins (%) 2.3 1.2 2.2 1.8 2.8 3.6 3.5 6.6 0.4 2.5
Loans and advances to
customers – period end 22,188 13,169 9,007 38,724 11,704 5,695 8,143 2,256 9,259 120,145
Loans and advances to banks
– period end 3,131 1,155 153 1,835 3,433 285 1,501 563 5,586 17,642
Total assets employed* 45,103 27,546 11,690 65,927 28,425 13,227 14,406 6,957 63,432 276,713
Total risk weighted assets and
contingents 21,938 13,912 5,503 34,610 16,386 7,549 11,782 2,955 23,328 137,963
Capital expenditure 72 23 1 8 11 7 13 4 28 167
* Total assets employed includes intra-group items of $39,057 million and excludes deferred tax assets of $492 million.
** Other Asia Pacific includes HIB Operating income of $nil million; Operating expenses of $nil million; and Profit before taxation of $nil million.
*** Middle East & Other S. Asia includes Pakistan Operating income of $80 million; Operating expenses of $37 million and Profit before taxation of $41 million.

STANDARD CHARTERED PLC – NOTES continued
40
2. Segmental Information continued
31.12.06
Asia Pacific
Hong Kong
$million Singapore
$million Malaysia$million
Korea$million
**OtherAsia
Pacific$million
India$million
***Middle East & Other
S Asia $million
Africa $million
Americas UK &
GroupHeadOffice
$million Total
$million
Internal income (1) 2 (3) 24 12 (13) (5) (3) (13) –
Net interest income 573 181 120 575 434 235 373 200 127 2,818
Fees and commissions income,
net 208 81 27 84 172 103 155 83 74 987
Net trading income 17 24 27 13 83 42 62 44 77 389
Other operating income 24 44 12 92 101 70 3 1 (33) 314
Operating income 821 332 183 788 802 437 588 325 232 4,508
Operating expenses (376) (157) (85) (512) (449) (215) (289) (212) (276) (2,571)
Operating profit before
impairment losses and
taxation 445 175 98 276 353 222 299 113 (44) 1,937
Impairment (losses)/releases
on loans and advances and
other credit risk provisions (15) (20) (17) (56) (107) (32) (39) (9) 15 (280)
Other impairment – – – – (3) – – (3) (1) (7)
Loss from associates – – – – (1) – – – 2 1
Operating profit before taxation 430 155 81 220 242 190 260 101 (28) 1,651
Loans and advances to
customers – average 22,859 12,976 8,671 38,986 12,261 5,876 9,531 2,397 10,415 123,972
Net interest margins (%) 2.3 1.3 2.1 1.9 3.0 3.4 3.8 5.7 0.3 2.5
Loans and advances to
customers – period end# 22,037 14,626 9,199 40,029 22,858 6,242 10,516 2,536 12,458 140,501
Loans and advances to banks
– period end 6,474 939 161 1,753 4,462 477 1,058 387 5,353 21,064
Total assets employed * 49,831 25,393 11,846 64,159 46,898 14,382 18,109 7,792 65,904 304,314
Total risk weighted assets and
contingents 23,784 13,681 5,315 35,330 24,876 8,450 13,572 3,287 28,282 156,577
Capital expenditure 6 42 2 27 38 15 24 9 29 192
# Amounts have been restated as explained in note 30 on page 61.
* Total assets employed includes intra-group items of $38,784 million and excludes deferred tax assets of $519 million.
** Other Asia Pacific includes HIB Operating income of $80 million; Operating expenses of $47 million; and Profit before taxation of $27 million.
*** Middle East & Other S. Asia includes Pakistan Operating income of $145 million; Operating expenses of $74 million; and Profit before taxation of $46 million.
Apart from the entities that have been acquired in the last two
years, Group central expenses have been distributed between
segments in proportion to their direct costs, and the benefit of
the Group’s capital has been distributed between segments
in proportion to their average risk weighted assets. In the year
in which an acquisition is made the Group does not charge
and allocate the benefit of the Group’s capital. The
distribution of central expenses is phased in over two years,
based on an estimate of central management costs
associated with the acquisition.
Assets held at the centre have been distributed between
geographic segments in proportion to their total assets
employed.
Total risk weighted assets and contingents include $4,072
million (30 June 2006: $2,865 million 31 December 2006:
$3,134 million) of balances which are netted in calculating
capital ratios.
Capital expenditure comprises additions to property and
equipment and intangibles, including additions resulting from
acquisitions.

STANDARD CHARTERED PLC – NOTES continued
41
2. Segmental Information continued The following tables set out the structure of the Group’s deposits by principal geographic region and business where it operates at
30 June 2007, 30 June 2006 and 31 December 2006.
By geographic segment
30.06.07
Asia Pacific
Hong Kong
$million Singapore
$million Malaysia$million
Korea$million
OtherAsia
Pacific$million
India$million
Middle East &Other
S Asia$million
Africa $million
Americas UK &
Group Head
Office $million
Total$million
Non interest bearing current
and demand accounts 4,188 2,106 536 210 2,508 2,394 4,158 1,686 504 18,290
Interest bearing current and
demand accounts 16,878 4,249 1,367 14,084 8,692 4 1,292 1,532 6,748 54,846
Savings deposits 12 3,446 962 15 7,148 1,640 2,117 791 – 16,131
Time deposits 21,075 8,318 6,917 14,437 18,064 4,566 6,689 1,506 15,476 97,048
Other deposits 22 94 254 704 1,063 648 909 62 921 4,677
Total 42,175 18,213 10,036 29,450 37,475 9,252 15,165 5,577 23,649 190,992
Deposits by banks 986 575 1,630 7,299 6,908 1,088 1,675 293 8,409 28,863
Customer accounts 41,189 17,638 8,406 22,151 30,567 8,164 13,490 5,284 15,240 162,129
42,175 18,213 10,036 29,450 37,475 9,252 15,165 5,577 23,649 190,992
Debt securities in issue 726 1,834 1,039 20,166 2,099 1,457 18 193 4,287 31,819
Total 42,901 20,047 11,075 49,616 39,574 10,709 15,183 5,770 27,936 222,811
30.06.06
Asia Pacific
Hong Kong
$million Singapore
$million Malaysia$million
Korea$million
OtherAsia
Pacific$million
India$million
Middle East & OtherS Asia
$million Africa
$million
Americas UK &
Group Head Office
$million Total
$million
Non interest bearing current
and demand accounts 2,804 796 1,277 191 2,718 1,689 3,394 1,602 445 14,916
Interest bearing current and
demand accounts 14,056 3,531 195 15,762 4,109 19 1,224 1,275 5,322 45,493
Savings deposits 8 1,617 493 13 2,991 1,334 1,433 389 – 8,278
Time deposits 19,633 9,881 5,026 16,632 9,267 3,780 5,588 1,517 11,361 82,685
Other deposits 31 78 829 691 788 464 366 51 937 4,235
Total 36,532 15,903 7,820 33,289 19,873 7,286 12,005 4,834 18,065 155,607
Deposits by banks 669 1,796 861 6,257 4,807 1,281 1,676 362 6,015 23,724
Customer accounts 35,863 14,107 6,959 27,032 15,066 6,005 10,329 4,472 12,050 131,883
36,532 15,903 7,820 33,289 19,873 7,286 12,005 4,834 18,065 155,607
Debt securities in issue 585 1,395 918 20,151 721 802 – 127 2,487 27,186
Total 37,117 17,298 8,738 53,440 20,594 8,088 12,005 4,961 20,552 182,793

STANDARD CHARTERED PLC – NOTES continued
42
2. Segmental Information continued 31.12.06
Asia Pacific
Hong Kong
$million Singapore
$million Malaysia$million
Korea$million
OtherAsia
Pacific$million
India$million
Middle East & Other S Asia
$million Africa
$million
Americas UK &
GroupHeadOffice
$million Total
$million
Non interest bearing current
and demand accounts 3,320 1,722 1,435 163 2,123 2,082 3,654 1,649 894 17,042
Interest bearing current and
demand accounts 16,894 2,964 261 15,263 5,456 5 1,300 1,136 5,529 48,808
Savings deposits 10 1,857 741 11 11,089 1,451 1,685 449 – 17,293
Time deposits 18,961 9,754 5,211 16,682 12,293 4,073 6,901 1,575 13,574 89,024
Other deposits 14 7 750 1,756 1,507 241 568 140 260 5,243
Total 39,199 16,304 8,398 33,875 32,468 7,852 14,108 4,949 20,257 177,410
Deposits by banks 734 1,276 597 9,297 5,869 871 1,968 323 7,187 28,122
Customer accounts 38,465 15,028 7,801 24,578 26,599 6,981 12,140 4,626 13,070 149,288
39,199 16,304 8,398 33,875 32,468 7,852 14,108 4,949 20,257 177,410
Debt securities in issue 627 1,087 992 17,561 1,597 932 12 171 3,820 26,799
Total 39,826 17,391 9,390 51,436 34,065 8,784 14,120 5,120 24,077 204,209
3. Net Trading Income
6 months ended 30.06.07 $million
6 months ended 30.06.06
$million
6 months ended 31.12.06
$million
Gains less losses on foreign currency 444 311 334
Gains less losses on trading securities 135 19 90
Other trading profits/(losses) 70 201 (35)
649 531 389
4. Other Operating Income
6 months ended 30.06.07 $million
6 months ended 30.06.06
$million
6 months ended 31.12.06
$million
Other operating income includes:
Gains less losses on disposal of financial assets
not held at fair value through profit or loss 229 52 138
Dividend income 116 33 44
Gains arising on assets fair valued at acquisition 55 42 64
Gains on effective part disposal of Pakistan branches – – 17
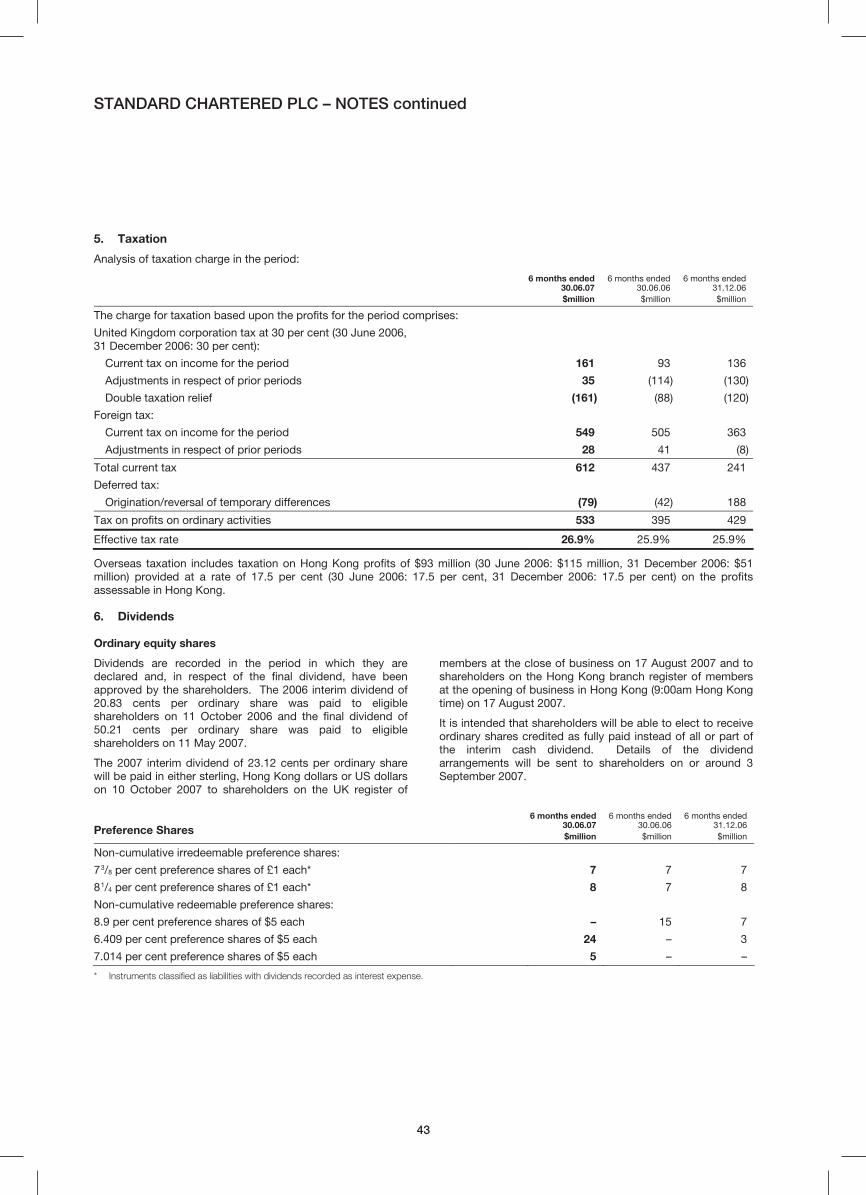
STANDARD CHARTERED PLC – NOTES continued
43
5. Taxation
Analysis of taxation charge in the period:
6 months ended 30.06.07 $million
6 months ended 30.06.06
$million
6 months ended 31.12.06
$million
The charge for taxation based upon the profits for the period comprises:
United Kingdom corporation tax at 30 per cent (30 June 2006,
31 December 2006: 30 per cent):
Current tax on income for the period 161 93 136
Adjustments in respect of prior periods 35 (114) (130)
Double taxation relief (161) (88) (120)
Foreign tax:
Current tax on income for the period 549 505 363
Adjustments in respect of prior periods 28 41 (8)
Total current tax 612 437 241
Deferred tax:
Origination/reversal of temporary differences (79) (42) 188
Tax on profits on ordinary activities 533 395 429
Effective tax rate 26.9% 25.9% 25.9%
Overseas taxation includes taxation on Hong Kong profits of $93 million (30 June 2006: $115 million, 31 December 2006: $51
million) provided at a rate of 17.5 per cent (30 June 2006: 17.5 per cent, 31 December 2006: 17.5 per cent) on the profits
assessable in Hong Kong.
6. Dividends
Ordinary equity shares Dividends are recorded in the period in which they are
declared and, in respect of the final dividend, have been
approved by the shareholders. The 2006 interim dividend of
20.83 cents per ordinary share was paid to eligible
shareholders on 11 October 2006 and the final dividend of
50.21 cents per ordinary share was paid to eligible
shareholders on 11 May 2007.
The 2007 interim dividend of 23.12 cents per ordinary share
will be paid in either sterling, Hong Kong dollars or US dollars
on 10 October 2007 to shareholders on the UK register of
members at the close of business on 17 August 2007 and to
shareholders on the Hong Kong branch register of members
at the opening of business in Hong Kong (9:00am Hong Kong
time) on 17 August 2007.
It is intended that shareholders will be able to elect to receive
ordinary shares credited as fully paid instead of all or part of
the interim cash dividend. Details of the dividend
arrangements will be sent to shareholders on or around 3
September 2007.
Preference Shares
6 months ended 30.06.07 $million
6 months ended 30.06.06
$million
6 months ended 31.12.06
$million
Non-cumulative irredeemable preference shares:
7
3/8 per cent preference shares of £1 each* 7 7 7
8
1/4 per cent preference shares of £1 each* 8 7 8
Non-cumulative redeemable preference shares:
8.9 per cent preference shares of $5 each – 15 7
6.409 per cent preference shares of $5 each 24 – 3
7.014 per cent preference shares of $5 each 5 – –
* Instruments classified as liabilities with dividends recorded as interest expense.

STANDARD CHARTERED PLC – NOTES continued
44
7. Earnings per Ordinary Share 30.06.07 30.06.06 31.12.06
Profit* $million
Weighted average
number of shares
(‘000)
Pershare
amountcents
Profit*$million
Weighted average
number of shares(‘000)
Pershare
amountcents
Profit* $million
Weighted average
number of shares(‘000)
Pershare
amountcents
Basic earnings per ordinary
share 1,370 1,391,128 98.5 1,088 1,314,467 82.8 1,165 1,340,556 86.9
Effect of dilutive potential
ordinary shares:
Options – 19,136 – 9,666 – 14,338
Diluted earnings per share 1,370 1,410,264 97.1 1,088 1,324,133 82.2 1,165 1,354,894 86.0
Normalised earnings per ordinary share
The Group measures earnings per share on a normalised basis. This differs from earnings defined in IAS 33 “Earnings per share”.
The table below provides a reconciliation.
30.06.07 $million
30.06.06$million
31.12.06$million
Profit attributable to ordinary shareholders* 1,370 1,088 1,165
Amortisation of intangible assets arising on business combinations 35 20 32
Profit on sale of property, plant and equipment – – (16)
Premium and costs paid on repurchase of subordinated debt – 4 –
Gain on effective part disposal of Pakistan branches – – (17)
Profit on sale of subsidiary (4) – –
Incorporation costs in China 8 – 4
Tax on normalised items (8) (7) 2
Normalised earnings 1,401 1,105 1,170
Normalised earnings per ordinary share (cents) 100.7 84.1 87.3
* The profit amounts represent the profit attributable to ordinary shareholders, i.e. after the deduction of dividends payable to the holders of the non-cumulative
redeemable preference shares (see note 6 on page 43).
There were no ordinary shares issued after the balance sheet date that would have significantly affected the number of ordinary
shares used in the above calculations had they been issued prior to the end of the balance sheet period.

STANDARD CHARTERED PLC – NOTES continued
45
8. Financial Instruments Classification Summary
Financial instruments are classified between four recognition
principles: at fair value through profit or loss (comprising
trading and designated), available-for-sale, held-to-maturity
and loans and receivables. The face of the balance sheet
combines financial instruments that are held at their fair value
through profit or loss and subdivided between those assets
and liabilities held for trading purposes and those that the
Group has elected to hold at fair value.
The Group’s classification of its principal financial assets and
liabilities (excluding derivatives) is summarised below:
Trading$million
Designated at fair value
through profit or loss
$million
Available-for-sale$million
Loans and receivables
$million
Held-to- maturity $million
Total$million
Loans and advances to banks 2,100 – – 21,108 – 23,208
Loans and advances to customers 474 332 – 151,953 – 152,759
Treasury bills and other eligible bills 3,693 493 12,254 – – 16,440
Debt securities 11,356 512 35,478 2,729 108 50,183
Equity shares 384 – 1,661 – – 2,045
Total assets at 30 June 2007 18,007 1,337 49,393 175,790 108 244,635
Loans and advances to banks 892 – 99 16,651 – 17,642
Loans and advances to customers 435 160 129 119,421 – 120,145
Treasury bills and other eligible bills 2,861 637 11,966 – – 15,464
Debt securities 7,626 315 31,010 1,788 164 40,903
Equity shares 74 82 1,109 – – 1,265
Total assets at 30 June 2006 11,888 1,194 44,313 137,860 164 195,419
Loans and advances to banks 1,340 – – 19,724 – 21,064
Loans and advances to customers 1,000 194 – 139,307 – 140,501
Treasury bills and other eligible bills 2,722 696 12,522 – – 15,940
Debt securities 8,906 695 32,711 2,649 137 45,098
Equity shares 162 – 1,478 – – 1,640
Total assets at 31 December 2006* 14,130 1,585 46,711 161,680 137 224,243
* Amounts have been restated as explained in note 30 on page 61.
Trading$million
Designated at fair value
through profit or loss
$million
Amortised cost
$million Total
$million
Deposits by banks 1,747 270 26,846 28,863
Customer accounts 857 1,030 160,242 162,129
Debt securities in issue 2,153 2,412 27,254 31,819
Short positions 4,648 – – 4,648
Total liabilities at 30 June 2007 9,405 3,712 214,342 227,459
Deposits by banks 1,473 257 21,994 23,724
Customer accounts 593 1,114 130,176 131,883
Debt securities in issue 1,623 610 24,953 27,186
Short positions 2,750 – – 2,750
Total liabilities at 30 June 2006 6,439 1,981 177,123 185,543
Deposits by banks 1,286 603 26,233 28,122
Customer accounts 485 1,421 147,382 149,288
Debt securities in issue 1,514 1,771 23,514 26,799
Short positions 2,889 – – 2,889
Total liabilities at 31 December 2006 6,174 3,795 197,129 207,098

STANDARD CHARTERED PLC – NOTES continued
46
9. Financial Assets Held at Fair Value through Profit or Loss
30.06.07 $million
30.06.06$million
31.12.06$million
Loans and advances to banks 2,100 892 1,340
Loans and advances to customers 806 595 1,194
Treasury bills and other eligible bills 4,186 3,498 3,418
Debt securities 11,868 7,941 9,601
Equity shares 384 156 162
19,344 13,082 15,715
Debt securities
30.06.07 $million
30.06.06$million
31.12.06$million
Issued by public bodies:
Government securities 3,199 2,326 2,321
Other public sector securities 105 – 45
3,304 2,326 2,366
Issued by banks:
Certificates of deposit 1,090 605 405
Other debt securities 2,366 1,992 2,082
3,456 2,597 2,487
Issued by corporate entities and other issuers:
Other debt securities 5,108 3,018 4,748
Total debt securities 11,868 7,941 9,601
Of which:
Listed on a recognised UK exchange 505 1,241 418
Listed elsewhere 5,799 2,284 2,819
Unlisted 5,564 4,416 6,364
11,868 7,941 9,601
Equity securities
Listed 24 20 36
Unlisted 360 136 126
384 156 162
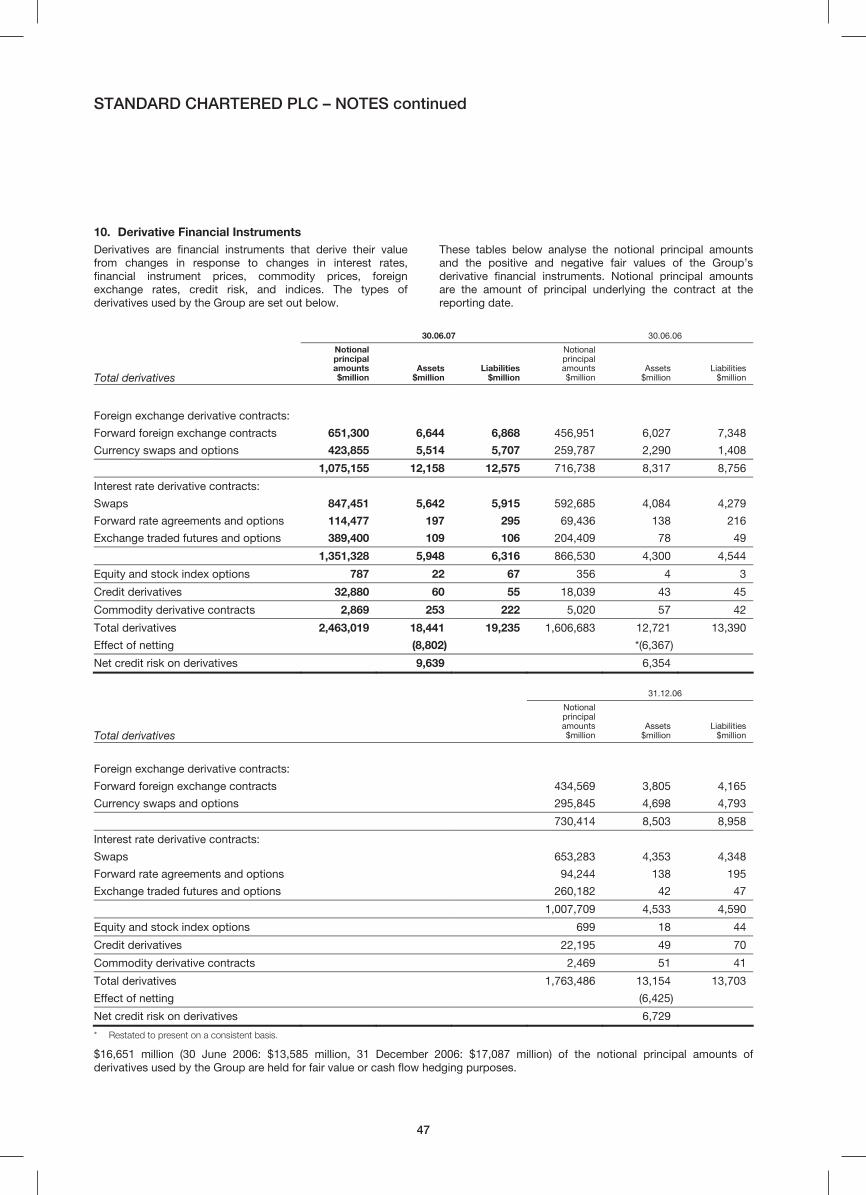
STANDARD CHARTERED PLC – NOTES continued
47
10. Derivative Financial Instruments Derivatives are financial instruments that derive their value
from changes in response to changes in interest rates,
financial instrument prices, commodity prices, foreign
exchange rates, credit risk, and indices. The types of
derivatives used by the Group are set out below.
These tables below analyse the notional principal amounts
and the positive and negative fair values of the Group’s
derivative financial instruments. Notional principal amounts
are the amount of principal underlying the contract at the
reporting date.
30.06.07 30.06.06
Total derivatives
Notionalprincipalamounts$million
Assets$million
Liabilities$million
Notionalprincipalamounts$million
Assets $million
Liabilities$million
Foreign exchange derivative contracts:
Forward foreign exchange contracts 651,300 6,644 6,868 456,951 6,027 7,348
Currency swaps and options 423,855 5,514 5,707 259,787 2,290 1,408
1,075,155 12,158 12,575 716,738 8,317 8,756
Interest rate derivative contracts:
Swaps 847,451 5,642 5,915 592,685 4,084 4,279
Forward rate agreements and options 114,477 197 295 69,436 138 216
Exchange traded futures and options 389,400 109 106 204,409 78 49
1,351,328 5,948 6,316 866,530 4,300 4,544
Equity and stock index options 787 22 67 356 4 3
Credit derivatives 32,880 60 55 18,039 43 45
Commodity derivative contracts 2,869 253 222 5,020 57 42
Total derivatives 2,463,019 18,441 19,235 1,606,683 12,721 13,390
Effect of netting (8,802) *(6,367)
Net credit risk on derivatives 9,639 6,354
31.12.06
Total derivatives
Notionalprincipalamounts$million
Assets $million
Liabilities$million
Foreign exchange derivative contracts:
Forward foreign exchange contracts 434,569 3,805 4,165
Currency swaps and options 295,845 4,698 4,793
730,414 8,503 8,958
Interest rate derivative contracts:
Swaps 653,283 4,353 4,348
Forward rate agreements and options 94,244 138 195
Exchange traded futures and options 260,182 42 47
1,007,709 4,533 4,590
Equity and stock index options 699 18 44
Credit derivatives 22,195 49 70
Commodity derivative contracts 2,469 51 41
Total derivatives 1,763,486 13,154 13,703
Effect of netting (6,425)
Net credit risk on derivatives 6,729
* Restated to present on a consistent basis.
$16,651 million (30 June 2006: $13,585 million, 31 December 2006: $17,087 million) of the notional principal amounts of
derivatives used by the Group are held for fair value or cash flow hedging purposes.

STANDARD CHARTERED PLC – NOTES continued
48
11. Loans and Advances 30.06.07 30.06.06 31.12.06*
Loans to banks$million
Loans to customers
$million
Loans
to banks$million
Loans to customers
$million
Loans
to banks $million
Loans to customers
$million
Loans and advances 23,212 154,767 17,654 121,894 21,074 142,709
Individual impairment provision (3) (1,496) (11) (1,295) (9) (1,684)
Portfolio impairment provision (1) (512) (1) (454) (1) (524)
23,208 152,759 17,642 120,145 21,064 140,501
Of which: loans and advances held at fair
value through profit or loss (2,100) (806) (892) (595) (1,340) (1,194)
21,108 151,953 16,750 119,550 19,724 139,307
* Amounts have been restated as explained in note 30 on page 61.
The Group’s exposure to credit risk is concentrated in Hong
Kong, Korea and the Asia Pacific region. The Group is
affected by the general economic conditions in the territories
in which it operates. The Group sets limits on the exposure to
any counterparty, and credit risk is spread over a variety of
different personal and commercial customers.
The Group has outstanding mortgage loans to Hong Kong
residents of approximately $11.3 billion (30 June 2006: $11.3
billion, 31 December 2006: $11.2 billion), and Korea residents
of approximately $23.7 billion (30 June 2006: $23.2 billion,
31 December 2006: $24.0 billion).
30.06.07 $million
30.06.06 $million
31.12.06*$million
Provisions held at beginning of period 2,218 1,754 1,761
Exchange translation differences 15 49 25
Acquisitions – – 736
Amounts written off (534) (394) (568)
Recoveries of acquisition fair values (55) (42) (64)
Recoveries of amounts previously written off 55 65 63
Discount unwind (34) (25) (27)
Other (6) (5) 17
New provisions 636 597 534
Recoveries/provisions no longer required (283) (238) (259)
Net charge against profit** 353 359 275
Provisions held at end of period*** 2,012 1,761 2,218
* Amounts have been restated as explained in note 30 on page 61.
** The net charge of $353 million (30 June 2006: $359 million, 31 December 2006: $275 million) comprises $371 million (30 June 2006: $273 million, 31 December
2006: $331 million) individual impairment charge and of $18 million (30 June 2006: charge of $86 million, 31 December 2006: release of $56 million) portfolio
impairment release. The charge excludes provision releases for credit commitments and other provisions of $nil million for the six months ended 30 June 2007
(30 June 2006: $10 million, 31 December 2006: $1 million) and impairment charges of $8 million (30 June 2006: $nil million, 31 December 2006: $6 million)
relating to debt securities classified as loans and receivables (note 8 on page 45). The total impairment charge on loans and advances and other credit risk
provisions is $361 million (30 June 2006: $349 million, 31 December 2006: $280 million).
*** The provision of $2,012 million (30 June 2006: $1,761 million, 31 December 2006: $2,218 million) held at 30 June 2007 comprises $1,499 million (30 June 2006:
$1,306 million, 31 December 2006: $1,693 million) individual impairment provision and $513 million (30 June 2006: $455 million, 31 December 2006: $525
million) portfolio impairment provision.

STANDARD CHARTERED PLC – NOTES continued
49
12. Non-Performing Loans and Advances
30.06.07$million
30.06.06 $million
31.12.06*$million
Non-performing loans and advances 2,472 2,423 2,961
Impairment provisions (2,012) (1,761) (2,218)
460 662 743
* Amounts have been restated as explained in note 30 on page 61.
Net non-performing loans and advances comprises loans and
advances to banks $3 million (30 June 2006: $8 million,
31 December 2006: $9 million) and loans and advances
to customers $457 million (30 June 2006: $654 million,
31 December 2006: $734 million).
Impairment provisions cover 81 per cent of non-performing
lending to customers (30 June 2006: 73 per cent,
31 December 2006: 75 per cent). The impairment provisions
above include $513 million (30 June 2006: $455 million,
31 December 2006: $525 million) of portfolio impairment
provisions.
13. Investment Securities 30.06.07
Debt Securities
Held-to-maturity$million
Available-for-sale$million
Loans and receivables
$million
Equity securities
$million
Treasury bills
$million Total
$million
Issued by public bodies:
Government securities 108 13,311 –
Other public sector securities – 1,558 –
108 14,869 –
Issued by banks:
Certificates of deposit – 7,046 2,396
Other debt securities – 10,350 18
– 17,396 2,414
Issued by corporate entities and other
issuers:
Other debt securities – 3,213 315
Total debt securities 108 35,478 2,729
Listed on a recognised UK exchange – 3,654 – 22 – 3,676
Listed elsewhere 84 14,265 111 1,202 6,145 21,807
Unlisted 24 17,559 2,618 437 6,109 26,747
108 35,478 2,729 1,661 12,254 52,230
Market value of listed securities 84 17,919 106 1,224 6,145 25,478

STANDARD CHARTERED PLC - NOTES continued
50
13. Investment Securities continued 30.06.06
Debt Securities
Held-to-
maturity$million
Available-
for-sale$million
Loans and receivables
$million
Equity securities
$million
Treasury bills
$million Total
$million
Issued by public bodies:
Government securities 164 10,237 –
Other public sector securities – 1,366 –
164 11,603 –
Issued by banks:
Certificates of deposit – 7,682 1,423
Other debt securities – 8,467 8
– 16,149 1,431
Issued by corporate entities and other
issuers:
Other debt securities – 3,258 357
Total debt securities 164 31,010 1,788
Listed on a recognised UK exchange – 5,702 7 21 – 5,730
Listed elsewhere 134 10,170 – 424 7,452 18,180
Unlisted 30 15,138 1,781 664 4,514 22,127
164 31,010 1,788 1,109 11,966 46,037
Market value of listed securities 134 15,872 7 445 7,452 23,910
31.12.06*
Debt Securities
Held-to-maturity$million
Available-for-sale$million
Loans and receivables
$million
Equity securities
$million
Treasury bills
$million Total
$million
Issued by public bodies:
Government securities 137 10,379 –
Other public sector securities – 1,403 –
137 11,782 –
Issued by banks:
Certificates of deposit – 8,433 2,280
Other debt securities – 9,505 178
– 17,938 2,458
Issued by corporate entities and other
issuers:
Other debt securities – 2,991 191
Total debt securities 137 32,711 2,649
Listed on a recognised UK exchange – 6,679 – 38 – 6,717
Listed elsewhere 113 10,183 132 795 7,027 18,250
Unlisted 24 15,849 2,517 645 5,495 24,530
137 32,711 2,649 1,478 12,522 49,497
Market value of listed securities 109 16,862 130 833 7,027 24,961
* Amounts have been restated as explained in note 30 on page 61.

STANDARD CHARTERED PLC – NOTES continued
51
13. Investment Securities continued
The change in the carrying amount of investment securities comprised:
30.06.07$million
30.06.06 $million
31.12.06*$million
Opening 49,497 37,863 46,037
Exchange translation differences 374 1,009 477
Acquisitions – – 2,018
Additions 35,631 36,781 34,334
Maturities and disposals (33,637) (29,771) (34,125)
Impairments (13) – (26)
Changes in fair value (including the effect
of fair value hedging) 215 134 546
Amortisation of discounts and premiums 163 21 236
Closing 52,230 46,037 49,497
* Amounts have been restated as explained in note 30 on page 61.
At 30 June 2007, unamortised premiums on debt securities
held for investment purposes amounted to $68 million
(30 June 2006: $134 million, 31 December 2006: $39 million)
and unamortised discounts amounted to $152 million
(30 June 2006: $110 million, 31 December 2006: $112
million).
Income from listed equity shares amounted to $5 million
(30 June 2006: $2 million, 31 December 2006: $2 million) and
income from unlisted equity shares amounted to $111 million
(30 June 2006: $31 million, 31 December 2006: $42 million).
14. Deposits by Banks
30.06.07$million
30.06.06 $million
31.12.06$million
Deposits by banks 26,846 21,994 26,233
Deposits by banks included within:
Financial liabilities held at fair value through profit or loss (note 8 on page 45) 2,017 1,730 1,889
28,863 23,724 28,122
15. Customer Accounts
30.06.07$million
30.06.06 $million
31.12.06$million
Customer accounts 160,242 130,176 147,382
Customer accounts included within:
Financial liabilities held at fair value through profit or loss (note 8 on page 45) 1,887 1,707 1,906
162,129 131,883 149,288
16. Debt Securities in Issue 30.06.07 30.06.06
Certificates of deposit of
$100,000 or more$million
Other debt securities
in issue$million
Total$million
Certificates of deposit of $100,000
or more$million
Other debt securities
in issue $million
Total$million
Debt securities in issue 8,242 19,012 27,254 12,522 12,431 24,953
Debt securities in issue within:
Financial liabilities held at fair value
through profit or loss (note 8 on
page 45) 1,373 3,192 4,565 326 1,907 2,233
9,615 22,204 31,819 12,848 14,338 27,186

STANDARD CHARTERED PLC - NOTES continued
52
16. Debt Securities in Issue continued 31.12.06
Certificates of deposit of $100,000
or more $million
Other debt securities
in issue $million
Total$million
Debt securities in issue 10,939 12,575 23,514
Debt securities in issue within:
Financial liabilities held at fair value
through profit or loss (note 8 on page 45) 1,154 2,131 3,285
12,093 14,706 26,799
17. Other Liabilities
Other liabilities include Hong Kong currency notes in circulation of $2,697 million (30 June 2006: $2,558 million, 31 December
2006: $2,605 million) which are secured by Hong Kong SAR Government certificates of indebtedness of the same amount
included in other assets.
18. Retirement Benefit Obligations
Retirement benefit obligations comprise:
30.06.07 $million
30.06.06 $million
31.12.06$million
Total market value of assets 2,405 2,036 2,339
Present value of the schemes’ liabilities (2,746) (2,493) (2,799)
Defined benefit schemes obligation (341) (457) (460)
Defined contribution schemes (15) (9) (12)
Net book amount (356) (466) (472)
Retirement benefit charge comprises:
30.06.07 $million
30.06.06 $million
31.12.06$million
Defined benefit schemes 56 43 53
Defined contribution schemes 41 32 38
97 75 91
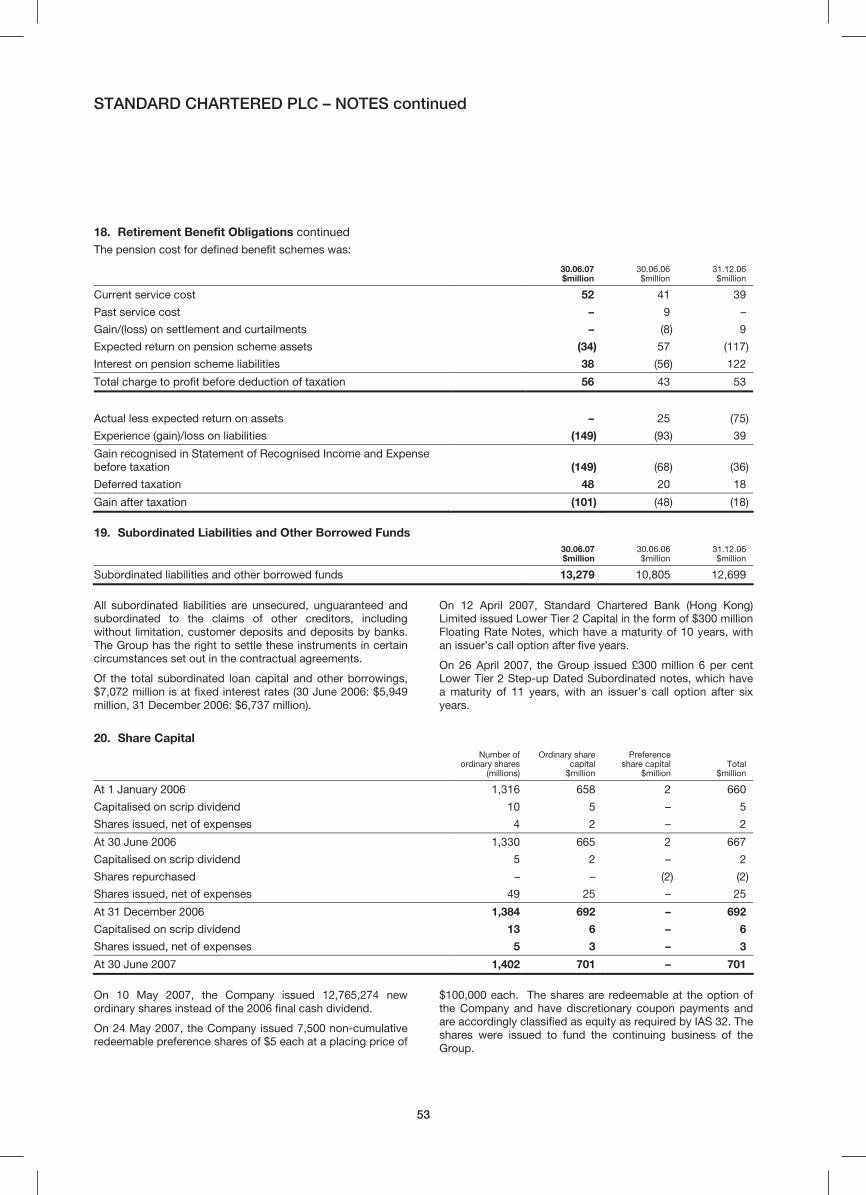
STANDARD CHARTERED PLC – NOTES continued
53
18. Retirement Benefit Obligations continued The pension cost for defined benefit schemes was:
30.06.07$million
30.06.06 $million
31.12.06$million
Current service cost 52 41 39
Past service cost – 9 –
Gain/(loss) on settlement and curtailments – (8) 9
Expected return on pension scheme assets (34) 57 (117)
Interest on pension scheme liabilities 38 (56) 122
Total charge to profit before deduction of taxation 56 43 53
Actual less expected return on assets – 25 (75)
Experience (gain)/loss on liabilities (149) (93) 39
Gain recognised in Statement of Recognised Income and Expense
before taxation (149) (68) (36)
Deferred taxation 48 20 18
Gain after taxation (101) (48) (18)
19. Subordinated Liabilities and Other Borrowed Funds
30.06.07$million
30.06.06 $million
31.12.06$million
Subordinated liabilities and other borrowed funds 13,279 10,805 12,699
All subordinated liabilities are unsecured, unguaranteed and
subordinated to the claims of other creditors, including
without limitation, customer deposits and deposits by banks.
The Group has the right to settle these instruments in certain
circumstances set out in the contractual agreements.
Of the total subordinated loan capital and other borrowings,
$7,072 million is at fixed interest rates (30 June 2006: $5,949
million, 31 December 2006: $6,737 million).
On 12 April 2007, Standard Chartered Bank (Hong Kong)
Limited issued Lower Tier 2 Capital in the form of $300 million
Floating Rate Notes, which have a maturity of 10 years, with
an issuer’s call option after five years.
On 26 April 2007, the Group issued £300 million 6 per cent
Lower Tier 2 Step-up Dated Subordinated notes, which have
a maturity of 11 years, with an issuer’s call option after six
years.
20. Share Capital
Number ofordinary shares
(millions)
Ordinary share capital
$million
Preference share capital
$million Total
$million
At 1 January 2006 1,316 658 2 660
Capitalised on scrip dividend 10 5 – 5
Shares issued, net of expenses 4 2 – 2
At 30 June 2006 1,330 665 2 667
Capitalised on scrip dividend 5 2 – 2
Shares repurchased – – (2) (2)
Shares issued, net of expenses 49 25 – 25
At 31 December 2006 1,384 692 – 692
Capitalised on scrip dividend 13 6 – 6
Shares issued, net of expenses 5 3 – 3
At 30 June 2007 1,402 701 – 701
On 10 May 2007, the Company issued 12,765,274 new
ordinary shares instead of the 2006 final cash dividend.
On 24 May 2007, the Company issued 7,500 non-cumulative
redeemable preference shares of $5 each at a placing price of
$100,000 each. The shares are redeemable at the option of
the Company and have discretionary coupon payments and
are accordingly classified as equity as required by IAS 32. The
shares were issued to fund the continuing business of the
Group.

STANDARD CHARTERED PLC - NOTES continued
54
21. Reserves
Share premium account $million
Capital reserve $million
Capital redemption
reserve$million
Merger reserve$million
Available-for-sale reserve$million
Cash flow hedge
reserve$million
Translation reserve $million
Retained earnings$million
Total $million
At 1 January 2006 3,034 5 11 1,944 23 (20) 6 6,219 11,222
Recognised income and
expense – – – – 68 38 364 1,145 1,615
Capitalised on scrip
dividend (5) – – – – – – – (5)
Shares issued, net of
expenses 80 – – – – – – 80
Net own shares adjustment – – – – – – – 96 96
Share option expense and
related taxation – – – – – – – 32 32
Dividends, net of scrip – – – – – – – (357) (357)
At 30 June 2006 3,109 5 11 1,944 91 18 370 7,135 12,683
Recognised income and
expense – – – – 319 33 308 1,209 1,869
Capitalised on scrip
dividend (2) – – – – – – – (2)
Shares issued, net of
expenses 758 – – 1,205 – – – – 1,963
Shares repurchased (326) – 2 – – – – (2) (326)
Net own shares adjustment – – – – – – – 53 53
Share option expense and
related taxation – – – – – – – 83 83
Dividends, net of scrip – – – – – – – (162) (162)
At 31 December 2006 3,539 5 13 3,149 410 51 678 8,316 16,161
Recognised income and
expense – – – – (67) (13) 254 1,507 1,681
Capitalised on scrip
dividend (6) – – – – – – – (6)
Shares issued, net of
expenses 808 – – – – – – – 808
Net own shares adjustment – – – – – – – 11 11
Share option expense and
related taxation – – – –
– – – 42 42
Dividends, net of scrip – – – – – – – (373) (373)
At 30 June 2007 4,341 5 13 3,149 343 38 932 9,503 18,324

STANDARD CHARTERED PLC - NOTES continued
55
21. Reserves continued Bedell Cristin Trustees Limited is trustee of both the 1995
Employees’ Share Ownership Plan Trust (“the 1995 trust”),
which is an employee benefit trust used in conjunction with
some of the Group’s employee share schemes, and the
Standard Chartered 2004 Employee Benefit Trust (“the 2004
trust”) which is an employee benefit trust used in conjunction
with the Group’s deferred bonus plan. The trustee has agreed
to satisfy a number of awards made under the employee
share schemes and the deferred bonus plan through the
relevant employee benefit trust. As part of these
arrangements Group companies fund, from time to time, the
trusts to enable the trustee to acquire shares to satisfy these
awards. All shares have been acquired through the London
Stock Exchange.
The 1995 trust has not acquired any shares in the period
ended 30 June 2007 (30 June 2006: nil, 31 December 2006:
nil). At 30 June 2007, the 1995 trust held 162,071 (30 June
2006: 5,104,262, 31 December 2006: 2,148,874) Standard
Chartered PLC shares, of which 162,071 (30 June 2006:
5,104,262, 31 December 2006: 2,148,874) have vested
unconditionally. The shares are held in a pool for the benefit
of participants under the Group’s Restricted Share Scheme,
Performance Share Plan and Executive Shares Option
Schemes. These shares were fully funded by the Group.
For the period ended 30 June 2007, the 2004 trust has
acquired, at market value, 351,340 (30 June 2006: 321,242,
31 December 2006: nil) Standard Chartered PLC shares for
an aggregate price of $10 million (30 June 2006: $9 million,
31 December 2006: $nil million). These shares are held in a
pool for the benefit of participants under the Group’s deferred
bonus plan. The purchase of these shares has been fully
funded by the Group. At 30 June 2007, the 2004 trust held
377,270 (30 June 2006: 311,575, 31 December 2006:
311,157) Standard Chartered PLC shares, of which none
(30 June 2006: none, 31 December 2006: none) have vested
unconditionally.
Except as disclosed above, neither the Company nor any of
its subsidiaries has bought, sold or redeemed any security of
the company listed on The Stock Exchange of Hong Kong
Limited during the period ended 30 June 2007.
22. Minority Interests
$300m7.267%HybridTier 1
Securities$million
Other minority interests $million
Total$million
At 1 January 2006 336 115 451
Additions – 50 50
Recognised income and expense 10 19 29
Distributions (11) (17) (28)
Reductions – (2) (2)
At 30 June 2006 335 165 500
Arising on acquisitions – (33) (33)
Recognised income and expense 9 73 82
Distributions (11) (16) (27)
Other increases – 22 22
At 31 December 2006 333 211 544
Recognised income and expense 9 80 89
Distributions (11) (50) (61)
Reductions – (14) (14)
At 30 June 2007 331 227 558

STANDARD CHARTERED PLC - NOTES continued
56
23. Cash and Cash Equivalents For the purposes of the cash flow statement, cash and cash equivalents comprises of the following balances with less than three
months maturity from the date of acquisition. Restricted balances comprise minimum balances to be held at central banks.
30.06.07 $million
30.06.06 $million
31.12.06$million
Cash and balances with central banks 8,991 11,813 7,698
Less restricted balances (4,694) (7,194) (3,958)
Treasury bills and other eligible bills 7,028 6,222 6,233
Loans and advances to banks 18,291 12,627 16,084
Debt securities 10,691 7,919 12,104
Total 40,307 31,387 38,161
24. Net Interest Margin and Interest Spread
30.06.07
% 30.06.06
% 31.12.06
%
Net interest margin 2.5 2.5 2.5
Interest spread 2.1 2.0 2.1
$million $million $million
Average interest earning assets 238,879 203,539 211,486
Average interest bearing liabilities 216,773 179,200 188,715
25. Remuneration The Group employed 63,762 staff at 30 June 2007 (30 June
2006: 49,255, 31 December 2006: 59,205).
Within the authority delegated by the Board of Directors, the
Board Remuneration Committee is involved in determining
the remuneration policy of the Group and specifically for
agreeing the individual remuneration packages for executive
directors and other highly remunerated individuals. No
executive directors are involved in deciding their own
remuneration. The Group’s remuneration policy is to:
• Support a strong performance-oriented culture and ensure
that individual rewards and incentives relate directly to the
performance of the individual, the operations and functions
for which they are responsible, the Group as a whole and
the interests of the shareholders; and
• Maintain competitive awards that reflect the international
nature of the Group and enable it to attract and retain
talented employees of the highest quality internationally.
The success of the Group depends upon the performance
and commitment of talented employees. In terms of applying
this policy:
• Base salaries are set at the median of the Group’s key
international competitors; and
• Annual bonus awards are made wholly on the basis of
Group and individual performance and also an individual’s
adherence to the Group’s values.
The Group believes strongly in encouraging employee share
ownership at all levels in the organisation. The Group
operates certain discretionary share plans, which are
designed to provide competitive long-term incentives. Of
these plans, the Performance Share Plan and the Executive
Share Option Scheme are only exercisable upon the
achievement of specific performance criteria. In addition, the
Group operates two all-employee sharesave schemes in
which 32 per cent of employees participate.

STANDARD CHARTERED PLC - NOTES continued
57
26. Contingent Liabilities and Commitments The table below shows the contract or underlying principal
amounts, credit equivalent amounts and risk weighted
amounts of unmatured off-balance sheet transactions at the
balance sheet date. The contract or underlying principal
amounts indicate the volume of business outstanding and do
not represent amounts at risk.
The credit equivalent and risk weighted amounts have been
calculated in accordance with the Financial Services Authority
guidelines implementing the Basel I Accord on capital
adequacy, after taking account of collateral and guarantees
received.
30.06.07 30.06.06
Contract orunderlying
principalamount$million
Creditequivalent
amount$million
Riskweighted
amount$million
Contract orunderlying
principalamount$million
Credit equivalent
amount $million
Riskweighted
amount$million
Contingent liabilities*:
Guarantees and irrevocable letters
of credit 22,777 14,745 11,137 13,561 10,320 7,641
Other contingent liabilities 8,692 7,225 5,305 12,621 8,732 6,515
31,469 21,970 16,442 26,182 19,052 14,156
Commitments*:
Documentary credits and short term
trade-related transactions 5,212 1,042 817 5,613 1,123 929
Forward asset purchases and forward
deposits placed – – – 42 42 8
Undrawn formal standby facilities, credit
lines and other commitments to lend:
One year and over 15,552 7,776 6,562 13,091 6,545 4,081
Less than one year 22,785 – – 17,073 – –
Unconditionally cancellable 33,588 – – 31,429 – –
77,137 8,818 7,379 67,248 7,710 5,018
* Includes amounts relating to the Group’s share of its joint ventures.
. 31.12.06
Contract orunderlying
principalamount$million
Credit equivalent
amount $million
Riskweighted
amount$million
Contingent liabilities*:
Guarantees and irrevocable letters
of credit 18,344 12,784 9,398
Other contingent liabilities 9,046 7,139 5,418
27,390 19,923 14,816
Commitments*:
Documentary credits and short term
trade-related transactions 5,029 1,006 845
Forward asset purchases and forward
deposits placed 31 31 10
Undrawn formal standby facilities, credit
lines and other commitments to lend:
One year and over 14,083 7,042 3,693
Less than one year 20,543 – –
Unconditionally cancellable 29,858 – –
69,544 8,079 4,548
* Includes amounts relating to the Group’s share of its joint ventures.

STANDARD CHARTERED PLC - NOTES continued
58
27. Liquidity Risk This table analyses assets and liabilities into relevant maturity
groupings based on the remaining period at balance sheet
date to the contractual maturity date. The analysis gives
contractual maturities of balance sheet amounts and does not
reflect actual repayments or cash flow.
The Risk Review on pages 14 to 30 explains the Group’s risk
management with respect to asset and liability management.
30.06.07
Threemonthsor less
$million
Between three
months andone year$million
Between one
year and five years
$million
More thanfive years
$million Total
$million
Assets
Cash and balances at central banks 4,297 – – 4,694 8,991
Derivative financial instruments 3,688 6,270 6,148 2,335 18,441
Loans and advances to banks* 18,671 3,329 1,137 71 23,208
Loans and advances to customers* 49,117 26,694 29,641 47,307 152,759
Investment securities* 18,376 22,288 18,138 9,866 68,668
Other assets 4,868 300 552 19,039 24,759
Total assets 99,017 58,881 55,616 83,312 296,826
Liabilities
Deposits by banks* 24,937 3,596 318 12 28,863
Customer accounts* 138,620 17,532 4,290 1,687 162,129
Derivative financial instruments 4,584 6,206 6,260 2,185 19,235
Debt securities in issue* 10,664 11,535 8,785 835 31,819
Other liabilities* 7,647 1,022 355 12,894 21,918
Subordinated liabilities and other borrowed funds 352 519 4,591 7,817 13,279
Total liabilities 186,804 40,410 24,599 25,430 277,243
Net liquidity gap (87,787) 18,471 31,017 57,882 19,583
* Amounts include financial instruments held at fair value through profit or loss (see note 8 on page 45).
30.06.06
Threemonthsor less
$million
Between three
months andone year$million
Between one
year and five years
$million
More thanfive years
$million Total
$million
Total assets 98,675 41,231 45,280 52,962 238,148
Total liabilities 156,760 27,331 20,070 20,137 224,298
Net liquidity gap (58,085) 13,900 25,210 32,825 13,850
31.12.06**
Threemonthsor less
$million
Between three
months andone year$million
Between one
year and five years
$million
More thanfive years
$million Total
$million
Total assets 87,353 50,723 54,360 73,613 266,049
Total liabilities 163,580 37,939 19,418 27,715 248,652
Net liquidity gap (76,227) 12,784 34,942 45,898 17,397
** Amounts have been restated as explained in note 30 on page 61.

STANDARD CHARTERED PLC - NOTES continued
59
28. Market Risk Trading book
6 months ended
30.06.07
6 months ended
30.06.06
Average $million
High $million
Low $million
Actual $million
Average $million
High $million
Low $million
Actual$million
Daily value at risk:
Interest rate risk 4.6 6.6 2.8 4.1 3.4 4.5 2.5 4.0
Foreign exchange risk 2.5 3.6 1.7 2.1 2.7 4.1 1.4 2.9
Total 5.5 8.2 3.5 5.7 4.4 5.5 3.1 4.2
6 months ended
31.12.06
Average $million
High $million
Low $million
Actual$million
Daily value at risk:
Interest rate risk 3.5 5.3 2.5 3.9
Foreign exchange risk 2.6 4.1 1.4 1.5
Total 4.3 5.6 3.1 4.0
This note should be read in conjunction with the market risk
section of the Risk Review on pages 28 and 29 which
explains the Group’s market risk management and is
incorporated in these financial statements accordingly.
The Group measures the risk of losses arising from future
potential adverse movements in interest and exchange rates,
prices and volatilities using a VaR methodology. The Group
uses historic simulation to measure VaR on all market risk
related activities.
The total Group Trading book VaR shown in the table above
is not a sum of the interest rate and exchange rate risks due
to offset. The highest and lowest VaR are independent and
could have occurred on different days.
VaR is calculated for expected movements over a minimum of
one business day and to a confidence level of 97.5 per cent.
This confidence level suggests that potential daily losses, in
excess of the VaR measure, are likely to be experienced six
times per year.
The historic simulation method is used with an observation
period of one year and involves the revaluation of all
unmatured contracts to reflect the effect of historically
observed changes in market risk factors on the valuation of
the current portfolio.
The Group recognises that there are limitations to the VaR
methodology. These limitations include the fact that the
historical data may not be the best proxy for future price
movements, either because the observation period does not
include representative price movements or, in some cases,
because of incomplete market data.
The Group performs regular back-testing, where actual profits
and losses are compared with VaR estimates to track the
statistical validity of the VaR Model.
VaR is calculated as the Group’s exposure as at the close of
business, London time. Intra-day risk levels may vary from
those reported at the end of the day.
Losses beyond the confidence interval are not captured by a
VaR calculation, which therefore gives no indication of the
size of unexpected losses in these situations. To manage the
risk arising from events, which the VaR methodology does not
capture, the Group regularly stress tests its main market risk
exposures. Stress testing involves valuing portfolios at prices,
which assume extreme changes in risk factors beyond the
range of normal experience. Positions that would give rise to
potentially significant losses under a low probability stress
event are reviewed by the GRC.
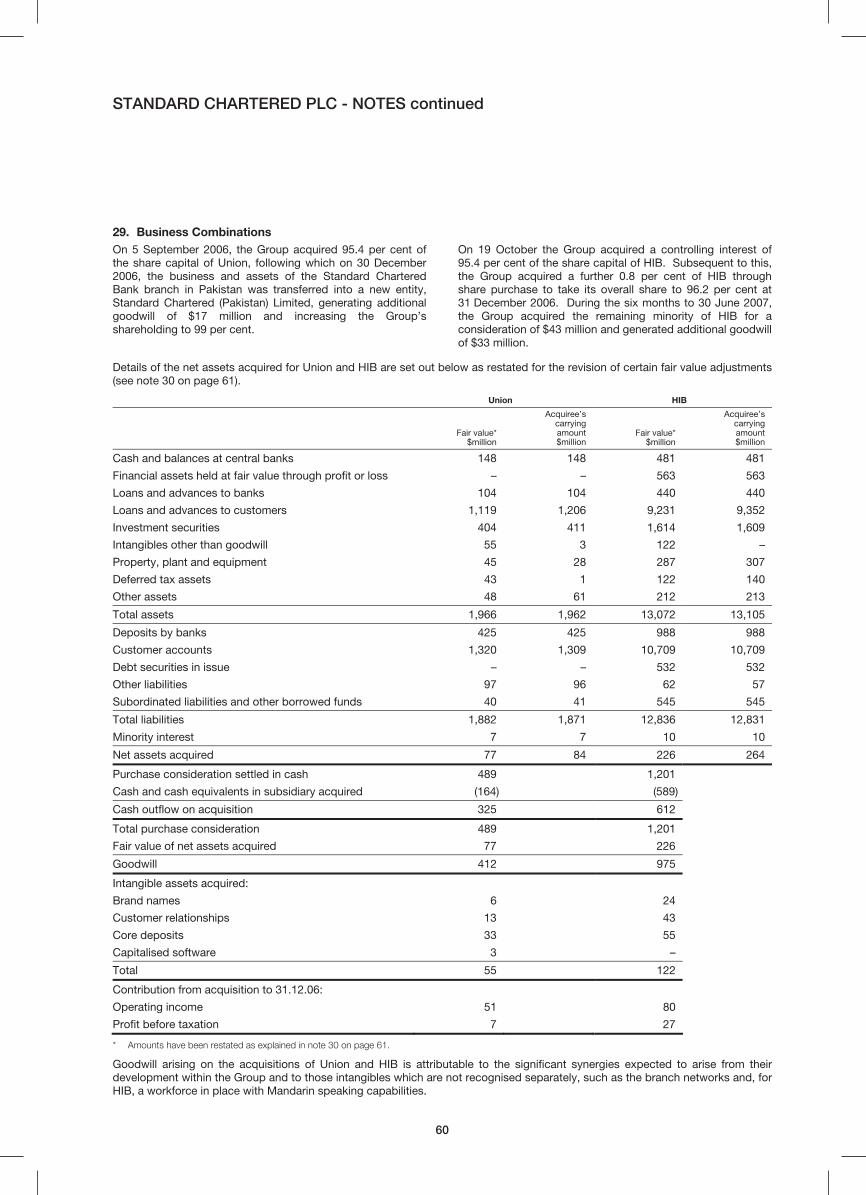
STANDARD CHARTERED PLC - NOTES continued
60
29. Business Combinations On 5 September 2006, the Group acquired 95.4 per cent of
the share capital of Union, following which on 30 December
2006, the business and assets of the Standard Chartered
Bank branch in Pakistan was transferred into a new entity,
Standard Chartered (Pakistan) Limited, generating additional
goodwill of $17 million and increasing the Group’s
shareholding to 99 per cent.
On 19 October the Group acquired a controlling interest of
95.4 per cent of the share capital of HIB. Subsequent to this,
the Group acquired a further 0.8 per cent of HIB through
share purchase to take its overall share to 96.2 per cent at
31 December 2006. During the six months to 30 June 2007,
the Group acquired the remaining minority of HIB for a
consideration of $43 million and generated additional goodwill
of $33 million.
Details of the net assets acquired for Union and HIB are set out below as restated for the revision of certain fair value adjustments
(see note 30 on page 61).
Union HIB
Fair value*
$million
Acquiree’scarryingamount$million
Fair value* $million
Acquiree’scarryingamount$million
Cash and balances at central banks 148 148 481 481
Financial assets held at fair value through profit or loss – – 563 563
Loans and advances to banks 104 104 440 440
Loans and advances to customers 1,119 1,206 9,231 9,352
Investment securities 404 411 1,614 1,609
Intangibles other than goodwill 55 3 122 –
Property, plant and equipment 45 28 287 307
Deferred tax assets 43 1 122 140
Other assets 48 61 212 213
Total assets 1,966 1,962 13,072 13,105
Deposits by banks 425 425 988 988
Customer accounts 1,320 1,309 10,709 10,709
Debt securities in issue – – 532 532
Other liabilities 97 96 62 57
Subordinated liabilities and other borrowed funds 40 41 545 545
Total liabilities 1,882 1,871 12,836 12,831
Minority interest 7 7 10 10
Net assets acquired 77 84 226 264
Purchase consideration settled in cash 489 1,201
Cash and cash equivalents in subsidiary acquired (164) (589)
Cash outflow on acquisition 325 612
Total purchase consideration 489 1,201
Fair value of net assets acquired 77 226
Goodwill 412 975
Intangible assets acquired:
Brand names 6 24
Customer relationships 13 43
Core deposits 33 55
Capitalised software 3 –
Total 55 122
Contribution from acquisition to 31.12.06:
Operating income 51 80
Profit before taxation 7 27
* Amounts have been restated as explained in note 30 on page 61.
Goodwill arising on the acquisitions of Union and HIB is attributable to the significant synergies expected to arise from their
development within the Group and to those intangibles which are not recognised separately, such as the branch networks and, for
HIB, a workforce in place with Mandarin speaking capabilities.

STANDARD CHARTERED PLC - NOTES continued
61
30. Restatement of prior periods In the consolidated financial statements as at 31 December
2006, the fair value amounts in relation to the acquisitions of
Union and HIB contained some provisional balances. During
the period to 30 June 2007, certain of these balances have
been revised. In accordance with IFRS 3 “Business
Combinations”, the adjustments to the provisional balances
have been made as at the date of acquisition and the 2006
balance sheet amounts restated, with a corresponding
adjustment to goodwill, increasing goodwill on acquisition
relating to Union and HIB respectively by $6 million to $412
million and by $27 million to $975 million. The adjustments
primarily relate to a reassessment of the value of certain loan
assets and investment debt securities, together with a
reduction in deferred tax assets following a reassessment of
their recoverability. The income statement for 2006 has not
been restated, because any effect is not material.
As reported at31.12.06$million
Adjustmentto Union$million
Adjustment to HIB
$million
Restated at31.12.06$million
Loans and advances to customers 139,330 (9) (14) 139,307
Investment securities 49,487 – 10 49,497
Goodwill and intangible assets 6,146 6 27 6,179
Property, plant and equipment 2,168 – 1 2,169
Deferred tax assets 538 3 (22) 519
Other liabilities 11,355 – 2 11,357
Union forms part of the Middle East and Other South Asia geographic segment and HIB forms part of the Other Asia Pacific
geographic segment.
31. Related Party Transactions Joint ventures At 30 June 2007 the Group had loans and advances to
Permata totalling $7 million (30 June 2006: $6 million,
31 December 2006: $8 million), and deposits of $1 million (30
June 2006: nil, 31 December 2006: nil).
Associates At 30 June 2007 the Group had no loans to China Bohai Bank
Limited (30 June 2006: $5 million, 31 December 2006: $54
million).
On 9 February 2007 the Group acquired a 30 per cent holding
in MCashback Limited for $36 million.
32. Statutory Accounts The information in this interim statement is unaudited and
does not constitute statutory accounts within the meaning of
section 240 of the Companies Act 1985. This document was
approved by the Board on 7 August 2007. The comparative
figures for the financial year ended 31 December 2006 are not
the company's statutory accounts for that financial year.
Those accounts have been reported on by the company's
auditors and delivered to the registrar of companies. The
report of the auditors was (i) unqualified, (ii) did not include a
reference to any matters to which the auditors drew attention
by way of emphasis without qualifying their report, and (iii) did
not contain a statement under section 237(2) or (3) of the
Companies Act 1985.
33. Corporate Governance The directors confirm that, throughout the period, the
Company has complied with the code provisions set out in
Appendix 14 of the Listing Rules of the Hong Kong Stock
Exchange. The directors also confirm that the announcement
of these results has been reviewed by the Company’s Audit
and Risk Committee.
The Company confirms that it has adopted a code of conduct
regarding securities transactions by directors on terms no
less exacting than required by Appendix 10 of the Listing
Rules of the Hong Kong Stock Exchange, and that the
directors of the Company have complied with this code of
conduct throughout the period.
Independent Review Report by KPMG Audit Plc to Standard Chartered PLC
62
Introduction We have been engaged by the Company to review the
financial information set out on pages 32 to 61 and we have
read the other information contained in the interim report
and considered whether it contains any apparent
misstatements or material inconsistencies with the financial
information.
This report is made solely to the Company in accordance
with the terms of our engagement to assist the Company in
meeting the requirements of the Listing Rules of the
Financial Services Authority. Our review has been
undertaken so that we might state to the Company those
matters we are required to state to it in this report and for no
other purpose. To the fullest extent permitted by law, we do
not accept or assume responsibility to anyone other than
the company for our review work, for this report, or for the
conclusions we have reached.
Directors’ responsibilities
The interim report, including the financial information
contained therein, is the responsibility of and has been
approved by the directors. The directors are responsible for
preparing the interim report in accordance with the Listing
Rules which require that the accounting policies and
presentation applied to the interim figures should be
consistent with those applied in preparing the preceding
annual financial statements except where any changes, and
the reasons for them, are disclosed.
Review work performed
We conducted our review in accordance with guidance
contained in Bulletin 1999/4 Review of interim financial
information issued by the Auditing Practices Board for use
in the United Kingdom. A review consists principally of
making enquiries of group management and applying
analytical procedures to the financial information and
underlying financial data and, based thereon, assessing
whether the accounting policies and presentation have been
consistently applied unless otherwise disclosed. A review is
substantially less in scope than an audit performed in
accordance with International Standards on Auditing (UK
and Ireland) and therefore provides a lower level of
assurance than an audit. Accordingly, we do not express an
audit opinion on the financial information.
Review conclusion
On the basis of our review we are not aware of any material
modifications that should be made to the financial
information as presented for the six months ended 30 June
2007.
KPMG Audit Plc
Chartered Accountants
London
7 August 2007

STANDARD CHARTERED PLC - ADDITIONAL INFORMATION
63
Share Awards 1994 Executive Share Option Scheme
As at 1 January 2007, there were options outstanding over 359,207 ordinary shares under the scheme granted between April 1997
and August 1999, with a weighted average exercise price of £8.18. During the first half of the year there were no lapses and
options over 212,401 ordinary shares were exercised at various prices from £8.08 to £8.88. The weighted average closing share
price on the day before the dates of exercises during the period was £15.72. There were no options granted under this scheme
during the first half of the year.
As at 30 June 2007, there were options outstanding over 146,806 ordinary shares, with a weighted average exercise price of
£7.95, which may be exercised on various dates up to 2009 under the rules of the scheme.
1997 Restricted Share Scheme
Awards made under this scheme are nil cost options. As at 1 January 2007, there were awards outstanding over 6,088,594
ordinary shares granted between February 2000 and March 2006. During the first half of the year, awards over 1,402,232 ordinary
shares were exercised and awards over 115,464 ordinary shares lapsed. The weighted average closing share price on the day
before the dates of exercises during the period was £14.92. There were no options granted under this scheme during the first half
of the year.
As at 30 June 2007, there were awards outstanding over 4,570,898 ordinary shares.
2006 Restricted Share Scheme
Awards made under this scheme are nil cost options. As at 1 January 2007, there were awards outstanding over 209,792 ordinary
shares granted between May and September 2006.
The following awards were granted under the Scheme:
Date award made Number of
shares awarded Exercise
period
Share price at
Grant date Fair value of Equity
Settled Awards
12 March 2007 2,140,975 2009 – 2014 £14.51 £13.36
During the first half of the year, awards over 313 ordinary shares were exercised and awards over 34,461 lapsed. The weighted
average closing share price on the day before the date of exercise was £14.98.
As at 30 June 2007, there were awards outstanding over 2,315,993 ordinary shares.
2006 Supplementary Restricted Share Scheme
This is a new plan introduced to supplement the 2006 Restricted Share Scheme. Awards made under this scheme are nil cost
options.
The following awards were granted under the Scheme:
Date award made Number of
shares awarded Exercise
period
Share price at
Grant date Fair value of Equity
Settled Awards
12 March 2007 9,946 2009 – 2014 £14.51 £13.36
During the first half of the year, no options lapsed and none were exercised.
As at 30 June 2007, there were awards outstanding over 9,946 ordinary shares.
2000 Executive Share Option Scheme
As at 1 January 2007, there were options outstanding over 14,974,196 ordinary shares under the scheme granted between June
2000 and June 2005, with a weighted average exercise price of £8.37. During the first half of the year, options over 64,569
ordinary shares lapsed, with exercise prices of between £9.355 and £10.395, and 4,587,176 ordinary share options were exercised
at various prices from £6.905 to £10.395. The weighted average closing share price on the day before the dates of exercises
during the period was £15.42. There were no options granted under this scheme during the first half of the year.
The exercise of options granted during the year will be linked to performance criteria.
As at 30 June 2007, there were options outstanding over 10,322,451 ordinary shares, with a weighted average exercise price of
£8.30, which may be exercised at various dates up to 2015 under the rules of the scheme.
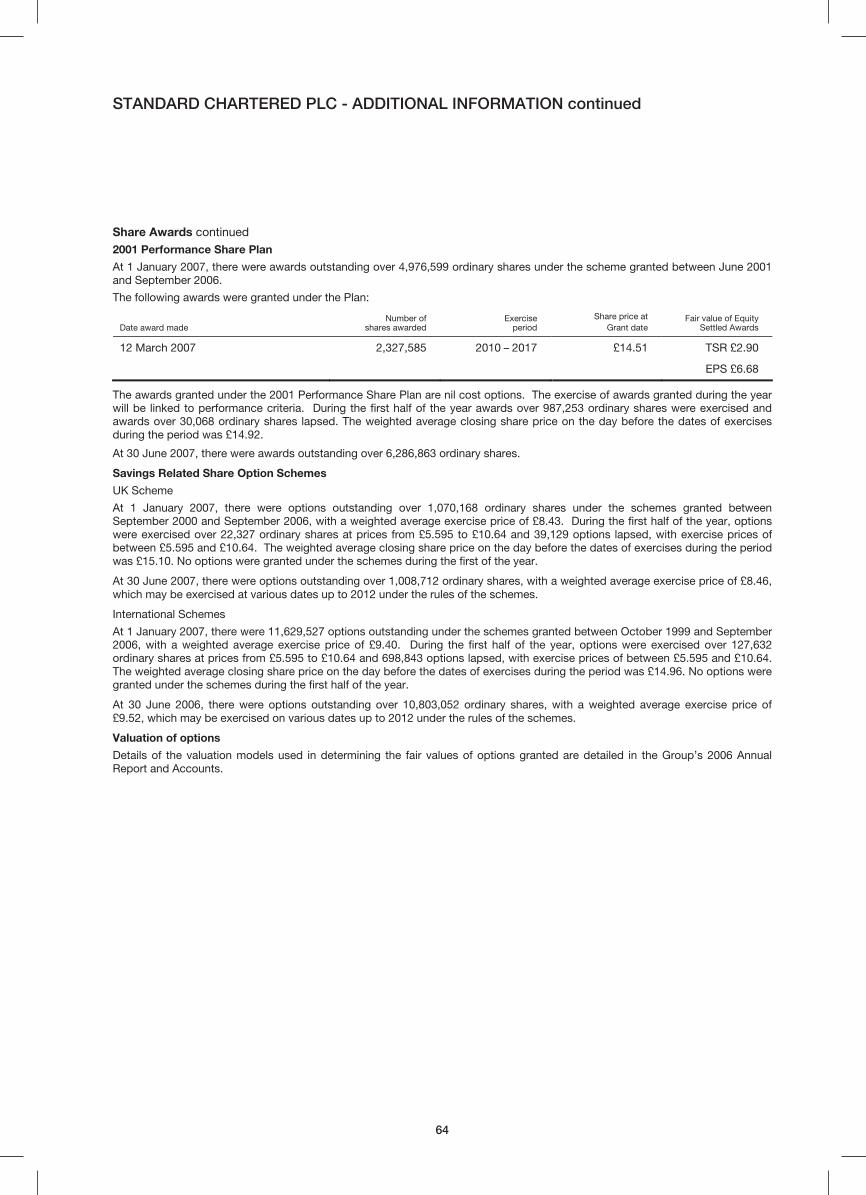
STANDARD CHARTERED PLC - ADDITIONAL INFORMATION continued
64
Share Awards continued
2001 Performance Share Plan
At 1 January 2007, there were awards outstanding over 4,976,599 ordinary shares under the scheme granted between June 2001
and September 2006.
The following awards were granted under the Plan:
Date award made Number of
shares awarded Exercise
period
Share price at
Grant date Fair value of Equity
Settled Awards
12 March 2007 2,327,585 2010 – 2017 £14.51 TSR £2.90
EPS £6.68
The awards granted under the 2001 Performance Share Plan are nil cost options. The exercise of awards granted during the year
will be linked to performance criteria. During the first half of the year awards over 987,253 ordinary shares were exercised and
awards over 30,068 ordinary shares lapsed. The weighted average closing share price on the day before the dates of exercises
during the period was £14.92.
At 30 June 2007, there were awards outstanding over 6,286,863 ordinary shares.
Savings Related Share Option Schemes
UK Scheme
At 1 January 2007, there were options outstanding over 1,070,168 ordinary shares under the schemes granted between
September 2000 and September 2006, with a weighted average exercise price of £8.43. During the first half of the year, options
were exercised over 22,327 ordinary shares at prices from £5.595 to £10.64 and 39,129 options lapsed, with exercise prices of
between £5.595 and £10.64. The weighted average closing share price on the day before the dates of exercises during the period
was £15.10. No options were granted under the schemes during the first of the year.
At 30 June 2007, there were options outstanding over 1,008,712 ordinary shares, with a weighted average exercise price of £8.46,
which may be exercised at various dates up to 2012 under the rules of the schemes.
International Schemes
At 1 January 2007, there were 11,629,527 options outstanding under the schemes granted between October 1999 and September
2006, with a weighted average exercise price of £9.40. During the first half of the year, options were exercised over 127,632
ordinary shares at prices from £5.595 to £10.64 and 698,843 options lapsed, with exercise prices of between £5.595 and £10.64.
The weighted average closing share price on the day before the dates of exercises during the period was £14.96. No options were
granted under the schemes during the first half of the year.
At 30 June 2006, there were options outstanding over 10,803,052 ordinary shares, with a weighted average exercise price of
£9.52, which may be exercised on various dates up to 2012 under the rules of the schemes.
Valuation of options
Details of the valuation models used in determining the fair values of options granted are detailed in the Group’s 2006 Annual
Report and Accounts.
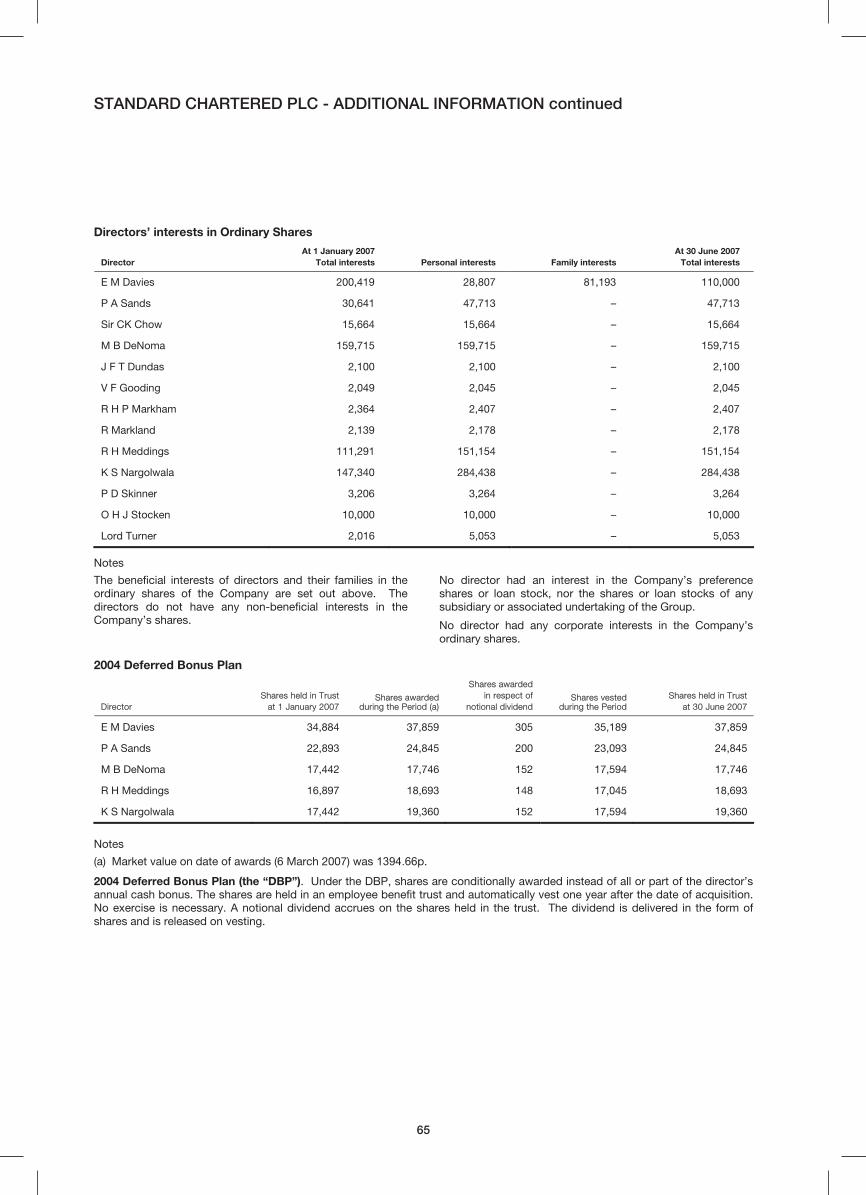
STANDARD CHARTERED PLC - ADDITIONAL INFORMATION continued
65
Directors’ interests in Ordinary Shares
Director At 1 January 2007
Total interests Personal interests Family interests At 30 June 2007
Total interests
E M Davies 200,419 28,807 81,193 110,000
P A Sands 30,641 47,713 – 47,713
Sir CK Chow 15,664 15,664 – 15,664
M B DeNoma 159,715 159,715 – 159,715
J F T Dundas 2,100 2,100 – 2,100
V F Gooding 2,049 2,045 – 2,045
R H P Markham 2,364 2,407 – 2,407
R Markland 2,139 2,178 – 2,178
R H Meddings 111,291 151,154 – 151,154
K S Nargolwala 147,340 284,438 – 284,438
P D Skinner 3,206 3,264 – 3,264
O H J Stocken 10,000 10,000 – 10,000
Lord Turner 2,016 5,053 – 5,053
Notes
The beneficial interests of directors and their families in the
ordinary shares of the Company are set out above. The
directors do not have any non-beneficial interests in the
Company’s shares.
No director had an interest in the Company’s preference
shares or loan stock, nor the shares or loan stocks of any
subsidiary or associated undertaking of the Group.
No director had any corporate interests in the Company’s
ordinary shares.
2004 Deferred Bonus Plan
Director
Shares held in Trust
at 1 January 2007 Shares awarded
during the Period (a)
Shares awarded
in respect of
notional dividend Shares vested
during the Period
Shares held in Trust
at 30 June 2007
E M Davies 34,884 37,859 305 35,189 37,859
P A Sands 22,893 24,845 200 23,093 24,845
M B DeNoma 17,442 17,746 152 17,594 17,746
R H Meddings 16,897 18,693 148 17,045 18,693
K S Nargolwala 17,442 19,360 152 17,594 19,360
Notes
(a) Market value on date of awards (6 March 2007) was 1394.66p.
2004 Deferred Bonus Plan (the “DBP”). Under the DBP, shares are conditionally awarded instead of all or part of the director’s
annual cash bonus. The shares are held in an employee benefit trust and automatically vest one year after the date of acquisition.
No exercise is necessary. A notional dividend accrues on the shares held in the trust. The dividend is delivered in the form of
shares and is released on vesting.

STANDARD CHARTERED PLC - ADDITIONAL INFORMATION continued
66
Long Term Incentives – Share Options
Director Scheme
At 1 January
2007 Granted Exercised Lapsed
At 30 June
2007
Weighted average exercise
price (pence)
Period of Exercise
E M Davies 2000 Scheme 877,853 – 720,168(a) – 157,685 970.28 2008 – 2015
Sharesave 2,957 – – – 2,957 559.50 2007 – 2008
1994 Scheme 72,365 – 72,365(a) – – – –
P A Sands 2000 Scheme 598,417 – 3,481(b) – 594,936 835.38 2007 – 2015
Sharesave 2,957 – – – 2,957 559.50 2007 – 2008
M B DeNoma 2000 Scheme 149,624 – 85,515(b) – 64,109 971.00 2008 – 2015
R H Meddings 2000 Scheme 140,267 – – – 140,267 954.43 2007 – 2015
Sharesave 878 – – – 878 1064.00 2009 - 2010
K S Nargolwala 2000 Scheme 149,624 – 85,515(c) – 64,109 971.00 2008 – 2015
Notes
(a) Market value on date of exercise (4 May 2007) 1550.60p.
(b) Market value on date of exercise (6 March 2007)
1394.66p.
(c) Market value on date of exercise (20 June 2007) 1657p.
(d) All of the options in the above table have exercise prices
that are lower than the market price on 30 June 2007
(1630p).
2000 Executive Share Option Scheme (the “2000 Scheme”)
Executive share options are exercisable after the third, but
before the tenth, anniversary of the date of grant. The
exercise price per share is at least the share price at the date
of grant and options can normally only be exercised if an EPS
linked performance condition is satisfied. For awards granted
in 2005, there is a sliding scale EPS performance condition.
EPS must increase by a minimum of 15 per cent over the
performance period for partial vesting, and by 30 per cent for
full vesting.
Sharesave
Sharesave comprises all employee share schemes in which
staff across the Group, including the executive directors, are
eligible to participate. There are two schemes - the UK
Sharesave Scheme and the International Sharesave Scheme.
Under Sharesave participants have a choice of opening a
three-year or a five-year savings contract. Within a period of
six months after the third or fifth anniversary, participants may
purchase ordinary shares in the Company. The price at which
they may purchase shares is typically at a 20 per cent
discount to the share price at the date of invitation. There are
no performance conditions attached to awards under the
Sharesave schemes.
1994 Executive Share Option Scheme (the “1994 Scheme”) (closed)
No awards have been made under the 1994 Scheme since
August 1999 as it was replaced by the 2000 Scheme.
Executive share options to purchase ordinary shares in the
Company are exercisable after the third, but before the tenth
anniversary of the date of grant. The exercise price is the
share price at the date of grant and options can only be
exercised if EPS increases by at least 15 per cent over three
consecutive years.
Further details of the share schemes mentioned above, can
be found in the Company's 2006 Report and Accounts, which
is available on the Company's website:
http://investors.standardchartered.com

STANDARD CHARTERED PLC - ADDITIONAL INFORMATION continued
67
Long Term Incentives – Shares
Director Scheme At 1 January
2007 Granted Exercised Lapsed At 30 June
2007 Period of
vesting
E M Davies Performance Share Plan 69,481 – 69,481(b) – – –
Performance Share Plan 70,575 – – – 70,575 2007 – 2014
Performance Share Plan 154,479 – – – 154,479 2008 – 2015
Performance Share Plan 111,498 – – – 111,498 2009 – 2016
Performance Share Plan 82,191 – – – 82,191 2009 – 2016
Performance Share Plan - 179,186(a) – – 179,186 2010 – 2017
P A Sands Restricted Share Scheme 52,216 – – – 52,216 2007 – 2009
Performance Share Plan 48,102 – – – 48,102 2007 – 2014
Performance Share Plan 36,644 – – – 36,644 2007 – 2014
Performance Share Plan 97,837 – – – 97,837 2008 – 2015
Performance Share Plan 73,170 – – – 73,170 2009 – 2016
Performance Share Plan 35,958 – – – 35,958 2009 – 2016
Performance Share Plan - 142,143(a) – – 142,143 2010 – 2017
M B DeNoma Performance Share Plan 42,757 – 42,757(c) – – –
Performance Share Plan 21,715 – 21,715(d) – – –
Performance Share Plan 74,794 – – – 74,794 2008 – 2015
Performance Share Plan 59,930 – – – 59,930 2009 – 2016
Performance Share Plan 22,089 – – – 22,089 2009 – 2016
Performance Share Plan - 84,424(a) – – 84,424 2010 – 2017
R H Meddings Performance Share Plan 37,413 – 37,413(d) – – –
Performance Share Plan 9,500 – 9,500(d) – – –
Performance Share Plan 74,794 – – – 74,794 2008 – 2015
Performance Share Plan 59,930 – – – 59,930 2009 – 2016
Performance Share Plan 22,089 – – – 22,089 2009 – 2016
Performance Share Plan - 87,870(a) – – 87,870 2010 – 2017
K S Nargolwala Performance Share Plan 55,032 – 55,032(c) – – –
Performance Share Plan 42,757 – 42,757(c) – – –
Performance Share Plan 21,715 – 21,715(d) – – –
Performance Share Plan 74,794 – – – 74,794 2008 – 2015
Performance Share Plan 59,930 – – – 59,930 2009 – 2016
Performance Share Plan 29,452 – – – 29,452 2009 – 2016
Performance Share Plan – 97,605(a) – – 97,605 2010 – 2017
Notes
(a) Market value on date of award (12 March 2007) was
1451p.
(b) Market value on date of exercise (4 May 2007) was
1550.60p.
(c) Market value on date of exercise (6 March 2007) was
1394.66p.
(d) Market value on date of exercise (20 June 2007) was
1657p.
2001 Performance Share Plan (the “Plan”) Under the Plan awards of nil price options to acquire shares
are granted to the director and will normally be exercised
between three and ten years after the date of grant.
Before any award can be exercised under the Plan, certain
performance conditions need to be met. The performance
conditions are set at the time of the award. 50 per cent of
each award is subject to the satisfaction of a relative total
shareholder return performance target. The remaining 50 per
cent of the award is subject to the satisfaction of an EPS
performance target. Further details of the performance
conditions can be found in the Company's 2006 Report and
Accounts, which is available on the Company's website:
http://investors.standardchartered.com
1997 Restricted Share Scheme (the “Restricted Share Scheme”)
The awards under the Restricted Share Scheme are nil cost
options and are not normally granted to executive directors
except upon their appointment. Fifty per cent of the award
vests two years after the date of grant and the remainder after
three years. There are no performance conditions attached to
awards under the Restricted Share Scheme.
Further details of the share schemes mentioned above, can
be found in the Company's 2006 Report and Accounts, which
is available on the Company's website:
http://investors.standardchartered.com

STANDARD CHARTERED PLC - ADDITIONAL INFORMATION continued
68
Share price information The middle market price of an ordinary share at the close of
business on 30 June 2007 was 1630 pence. The share price
range during the first half of 2007 was 1366 pence to 1727
pence (based on the closing middle market prices).
Substantial shareholders The Company and its shareholders have been granted partial
exemption from the disclosure requirements under Part XV of
the Securities and Futures Ordinance (“SFO”).
As a result of this exemption, shareholders no longer have an
obligation under the SFO to notify the Company of substantial
shareholding interests, and the Company is no longer
required to maintain a register of interests of substantial
shareholders under section 336 of the SFO. The Company is,
however, required to file with the Hong Kong Stock Exchange
any disclosure of interests made in the UK.
Dividend and interest payment dates 2007 Interim dividend
Ex dividend date 15 August 2007
Record date for dividend 17 August 2007
Dividend payment date 10 October 2007
2007 Final dividend (provisional only)
Results and dividend announced 26 February 2008 Preference shares
Next half- yearly dividend
7 ⅜ per cent Non-Cumulative Irredeemable preference shares of £1 each 1 October 2007
8 ¼ per cent Non-Cumulative Irredeemable preference shares of £1 each 1 October 2007
6.409 per cent Non-Cumulative preference shares of $5 each 30 July 2007
7.014 per cent Non-Cumulative preference shares of $5 each
First semi-annual dividend to be
paid on 30 January 2008
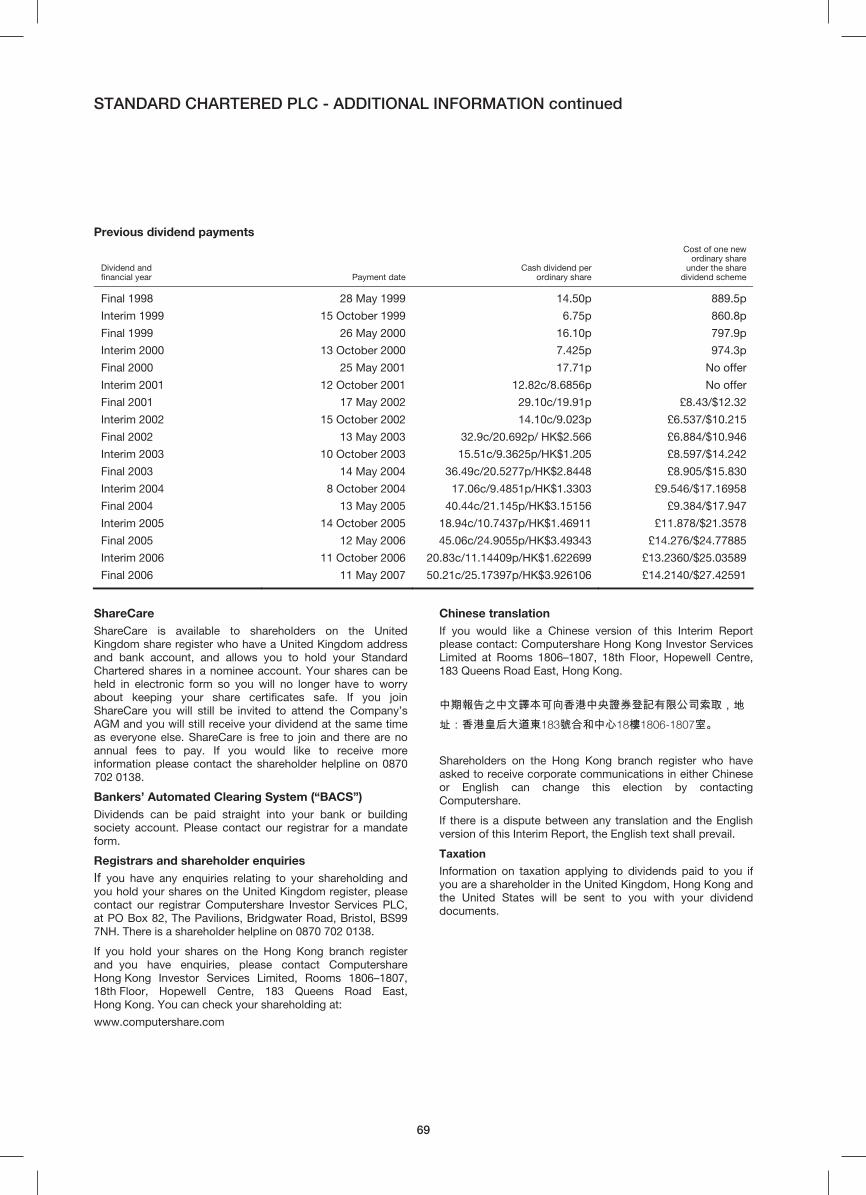
STANDARD CHARTERED PLC - ADDITIONAL INFORMATION continued
69
Previous dividend payments
Dividend and financial year Payment date
Cash dividend perordinary share
Cost of one newordinary share
under the sharedividend scheme
Final 1998 28 May 1999 14.50p 889.5p
Interim 1999 15 October 1999 6.75p 860.8p
Final 1999 26 May 2000 16.10p 797.9p
Interim 2000 13 October 2000 7.425p 974.3p
Final 2000 25 May 2001 17.71p No offer
Interim 2001 12 October 2001 12.82c/8.6856p No offer
Final 2001 17 May 2002 29.10c/19.91p £8.43/$12.32
Interim 2002 15 October 2002 14.10c/9.023p £6.537/$10.215
Final 2002 13 May 2003 32.9c/20.692p/ HK$2.566 £6.884/$10.946
Interim 2003 10 October 2003 15.51c/9.3625p/HK$1.205 £8.597/$14.242
Final 2003 14 May 2004 36.49c/20.5277p/HK$2.8448 £8.905/$15.830
Interim 2004 8 October 2004 17.06c/9.4851p/HK$1.3303 £9.546/$17.16958
Final 2004 13 May 2005 40.44c/21.145p/HK$3.15156 £9.384/$17.947
Interim 2005 14 October 2005 18.94c/10.7437p/HK$1.46911 £11.878/$21.3578
Final 2005 12 May 2006 45.06c/24.9055p/HK$3.49343 £14.276/$24.77885
Interim 2006 11 October 2006 20.83c/11.14409p/HK$1.622699 £13.2360/$25.03589
Final 2006 11 May 2007 50.21c/25.17397p/HK$3.926106 £14.2140/$27.42591
ShareCare ShareCare is available to shareholders on the United
Kingdom share register who have a United Kingdom address
and bank account, and allows you to hold your Standard
Chartered shares in a nominee account. Your shares can be
held in electronic form so you will no longer have to worry
about keeping your share certificates safe. If you join
ShareCare you will still be invited to attend the Company’s
AGM and you will still receive your dividend at the same time
as everyone else. ShareCare is free to join and there are no
annual fees to pay. If you would like to receive more
information please contact the shareholder helpline on 0870
702 0138.
Bankers’ Automated Clearing System (“BACS”) Dividends can be paid straight into your bank or building
society account. Please contact our registrar for a mandate
form.
Registrars and shareholder enquiries If you have any enquiries relating to your shareholding and
you hold your shares on the United Kingdom register, please
contact our registrar Computershare Investor Services PLC,
at PO Box 82, The Pavilions, Bridgwater Road, Bristol, BS99
7NH. There is a shareholder helpline on 0870 702 0138.
If you hold your shares on the Hong Kong branch register
and you have enquiries, please contact Computershare
Hong Kong Investor Services Limited, Rooms 1806–1807,
18th Floor, Hopewell Centre, 183 Queens Road East,
Hong Kong. You can check your shareholding at:
www.computershare.com
Chinese translation If you would like a Chinese version of this Interim Report
please contact: Computershare Hong Kong Investor Services
Limited at Rooms 1806–1807, 18th Floor, Hopewell Centre,
183 Queens Road East, Hong Kong.
中期報告之中文譯本可向香港中央證券登記有限公司索取,地址:香港皇后大道東183號合和中心18樓1806-1807室。 Shareholders on the Hong Kong branch register who have
asked to receive corporate communications in either Chinese
or English can change this election by contacting
Computershare.
If there is a dispute between any translation and the English
version of this Interim Report, the English text shall prevail.
Taxation
Information on taxation applying to dividends paid to you if
you are a shareholder in the United Kingdom, Hong Kong and
the United States will be sent to you with your dividend
documents.
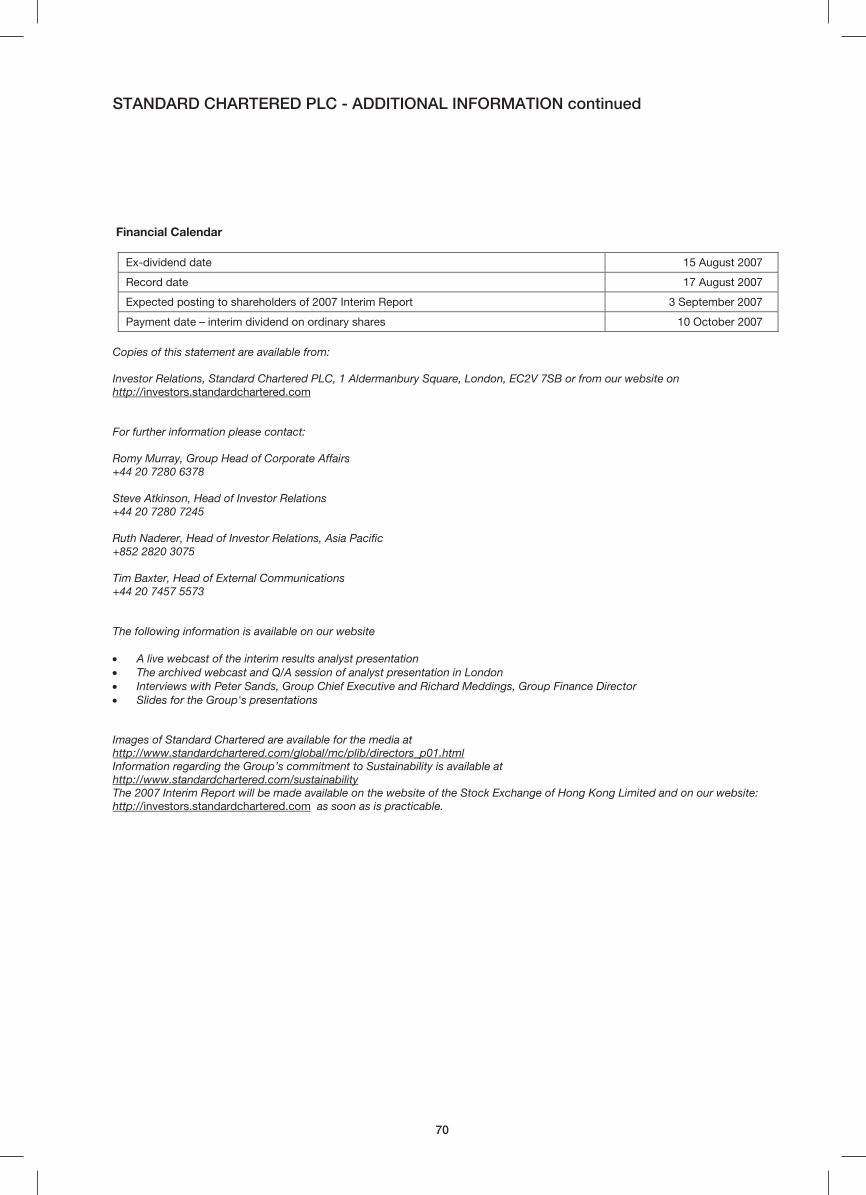
STANDARD CHARTERED PLC - ADDITIONAL INFORMATION continued
70
Financial Calendar
Ex-dividend date 15 August 2007
Record date 17 August 2007
Expected posting to shareholders of 2007 Interim Report 3 September 2007
Payment date – interim dividend on ordinary shares 10 October 2007
Copies of this statement are available from: Investor Relations, Standard Chartered PLC, 1 Aldermanbury Square, London, EC2V 7SB or from our website on http://investors.standardchartered.com For further information please contact: Romy Murray, Group Head of Corporate Affairs +44 20 7280 6378 Steve Atkinson, Head of Investor Relations +44 20 7280 7245 Ruth Naderer, Head of Investor Relations, Asia Pacific +852 2820 3075 Tim Baxter, Head of External Communications +44 20 7457 5573
The following information is available on our website • A live webcast of the interim results analyst presentation • The archived webcast and Q/A session of analyst presentation in London • Interviews with Peter Sands, Group Chief Executive and Richard Meddings, Group Finance Director • Slides for the Group's presentations Images of Standard Chartered are available for the media at http://www.standardchartered.com/global/mc/plib/directors_p01.html Information regarding the Group’s commitment to Sustainability is available at http://www.standardchartered.com/sustainability The 2007 Interim Report will be made available on the website of the Stock Exchange of Hong Kong Limited and on our website: http://investors.standardchartered.com as soon as is practicable.

STANDARD CHARTERED PLC - ADDITIONAL INFORMATION continued
71
Forward looking statements It is possible that this document could or may contain forward-looking statements that are based on current expectations or
beliefs, as well as assumptions about future events. These forward-looking statements can be identified by the fact that they do
not relate only to historical or current facts. Forward-looking statements often use words such as anticipate, target, expect,
estimate, intend, plan, goal, believe, will, may, should, would, could or other words of similar meaning. Undue reliance should not
be placed on any such statements because, by their very nature, they are subject to known and unknown risks and uncertainties
and can be affected by other factors that could cause actual results, and the Group’s plans and objectives, to differ materially
from those expressed or implied in the forward-looking statements.
There are several factors which could cause actual results to differ materially from those expressed or implied in forward looking
statements. Among the factors that could cause actual results to differ materially from those described in the forward looking
statements are changes in the global, political, economic, business, competitive, market and regulatory forces, future exchange
and interest rates, changes in tax rates and future business combinations or dispositions.
The Group undertakes no obligation to revise or update any forward looking statement contained within this document, regardless
of whether those statements are affected as a result of new information, future events or otherwise.

STANDARD CHARTERED PLC - INDEX
72
Page Page
Balance sheet 33 Legal risk 29
Business combinations 60 Liquidity risk 29, 58
Capital base and ratios 31 Loans and advances and impairment 48
Cash flow statement 35 Market risk 28, 59
Cash equivalents 56 Minority interests 55
Credit risk management 14 Net interest margins and spread 56
Compliance and Regulatory risk 29 Normalised earnings 44
Consumer Banking: Operational risk 29
• Financial review 8-10 Other operating income 42
• Loan impairment coverage ratio 21 Recognised income and expenses 34
Contingent liabilities and commitments 57 Remuneration 56
Derivatives 47 Reputational risk 30
Dividends 43 Reserves and retained earnings 54
Earnings per share 44 Restatement of prior periods 61
Financial calendar 70 Retirement benefit obligations 52
Financial instruments classification 45 Risk management framework 14
Financial review of Group 7-8 Segmental information by business 36
Foreign exchange exposure 28 Segmental information by geography 38-40
Hedging 29 Segmental information of deposits 41
Highlights 1 Share capital 53
Impairment losses on loans and advances: Shares held by share scheme trust 55
• Total individual impairment 25, 48 Subordinated debt 53
• Consumer Banking 21-22 Taxation 43
• Wholesale Banking 22-24 Trading income 42
Income statement 32 Wholesale Banking:
Industry concentration in loans and advances 17-19 • Financial review 11-13
Interest rate exposure 28 • Loan impairment coverage ratio 23
Investment securities 49

Contents
SUMMARY OF RESULTSFor six months ended 30 June 2007
Financial Highlights 1Chairman’s Statement 2Group Chief Executive’s Review 3 Financial ReviewGroup Summary 7Consumer Banking 8Wholesale Banking 11Risk Review 14 Capital 31
Financial StatementsCondensed Consolidated Interim
Income Statement 32Condensed Consolidated Interim
Balance Sheet 33Condensed Consolidated Interim
Statement of Recognised
Income and Expense 34Condensed Consolidated Interim
Cash Flow Statement 35Notes 36Independent Review Report 62Additional Information 63Index 72
Throughout this document unless another currency is specified, the word
“dollar” or symbol “$” means United States dollar and the word “cents”
or symbol “c” means one-hundredth of one United States dollar.
Within this document, the Hong Kong Special Administrative Region of the
People’s Republic of China is referred to as ‘Hong Kong’; ‘Middle East and Other
South Asia’ (MESA) includes: United Arab Emirates (UAE), Bahrain, Jordan,
Pakistan and Bangladesh; and ‘Other Asia Pacific’ includes: China, Indonesia,
Thailand, Taiwan and the Philippines.
Standard Chartered PLC – Stock Code: 2888
© Standard Chartered PLC. All rights reserved. The STANDARD CHARTERED
word mark, its logo device and associated product brand names are owned by
Standard Chartered PLC and centrally licensed to its operating entities.
Registered Office: 1 Aldermanbury Square, London EC2V 7SB. Telephone +44 (0)
20 7280 7500. Principal place of business in Hong Kong: 32nd Floor, 4-4a Des
Voeux Road, Central, Hong Kong. Registered in England No. 966425.
6 months 6 months 6 months
ended ended ended
30.06.07 30.06.06 31.12.06
$million $million $million
Results
Operating income 5,263 4,112 4,508
Impairment losses on loans and advances (361) (349) (280)
Profit before taxation 1,980 1,527 1,651
Profit attributable to equity interests 1,399 1,103 1,175
Profit attributable to ordinary shareholders* 1,370 1,088 1,165
Balance Sheet
Total assets 296,826 238,148 266,049
Total equity 19,583 13,850 17,397
Capital base 24,826 19,164 21,877
Information per Ordinary Share Cents Cents Cents
Earnings per share – normalised basis** 100.7 84.1 87.3
– basic 98.5 82.8 86.9
Dividend per share 23.12 20.83 50.21
Net asset value per share 1,250.7 983.5 1,208.9
Ratios % % %
Return on ordinary shareholders’ equity – normalised basis** 16.7 17.9 16.2
Cost income ratio – normalised basis** 54.7 53.6 56.6
Capital ratios:
Tier 1 capital 9.7 8.4 8.3
Total capital 15.6 14.2 14.3
* Profit attributable to ordinary shareholders is after the deduction of dividends payable to the holders of the non-cumulative redeemable preference shares
(see note 6 on page 43).
** Results on a normalised basis reflect the results of Standard Chartered PLC and its subsidiaries (the “Group”) excluding items presented in note 7 on page 44.
www.standardchartered.comFor information on the GroupOur website contains comprehensive information on Standard Chartered. Log on to find out more about our innovative product offerings and financial solutions. You will also have access to our Media Centre where you will find our latest and archived press releases as well as a photo library.
www.investors.standardchartered.comFor investor informationYou will find detailed information on our corporate governance practices, current debt ratings and recent press releases on this section of our website. Here is also where the online version of our Annual Report and Accounts and Annual Review can be found.
www.standardchartered.com/sustainabilityFor information on building a sustainable business We have just re-launched the sustainability section of our website. On this site you will find details of our approach to building a sustainable business, policies and procedures and progress against our priorities.
www.standardchartered.com/sustainability/ourpeopleFor our approach to people managementTo find out more about our approach to people management and career opportunities at Standard Chartered, please log onto our People section. The information here includes Diversity and Inclusion, employee engagement and how we develop, reward and recognise our employees.
Goonline
GogreenThis document is fully recyclableThis document has been printed in the UK by Park Communications, a CarbonNeutral® company certified with Environmental Management System ISO14001:2004.
In producing this report, 100% of the electricity used is generated from renewable sources, 95% of the press chemicals used are recycled for further use, on average 99% of any waste will be recycled and vegetable inks have been used throughout.
This document is printed on Revive 75, an FSC certified paper containing 50% de-inked post consumer waste, 25% pre-consumer waste and 25% virgin fibre. The pulp is a mix, using partly Elemental Chlorine Free (ECF) and partly Totally Chlorine Free (TCF) processes.
Produced by Black Sun Plc

At Standard Chartered, Diversity &Inclusion (D&I) lies at the heart of ourvalues and is a distinctive part of ourbrand. As one of the world’s mostinternational banks, we employ over60,000 people, representing more than 100 nationalities worldwide.
Given our geographic diversity and growth
ambitions, we are committed to attracting,
developing and engaging the very best talent.
With tougher competition across our markets,
D&I can give us a distinctive advantage over
our competitors. We strive to become the
world’s best international bank, by offering
new ideas, different perspectives and
anticipating changing expectations.
From locally-driven D&I councils to global D&I
forums, we have made significant progress.
The strength of our diversity has helped us
achieve great results and we are confident
that our focused attention on D&I will continue
to deliver benefits to our people, our customers,
our shareholders and to the communities
in which we operate.
Diversity&Inclusion
Competitive advantage through...
www.standardchartered.com/sustainability/greatplace_homeTo find out more about Diversity & Inclusion visit
Here you will find information on Diversity & Inclusion, employee engagement and how we develop, reward and recognise our employees.
Interim Report 2007
Leading�thewayin Asia, Africa and the Middle East
Sta
nd
ard
Charte
red
Inte
rim R
ep
ort 2
007