5/30/14 draft - united states environmental protection agency · pdf file5/30/14 draft text...
TRANSCRIPT

5/30/14 Draft text for review and deliberations by the CASAC Air Monitoring and Methods Subcommittee -- Please Do not Cite or Quote --This draft is a work in progress, does not reflect consensus advice or recommendations, has not been
reviewed or approved by the chartered CASAC and does not represent EPA policy. 5/30/14 Draft The Honorable Gina McCarthy Administrator U.S. Environmental Protection Agency 1200 Pennsylvania Avenue, N.W. Washington, D.C. 20460
Subject: Review of EPA’s Recommendation for an Additional Federal Reference Method for Ozone: Nitric Oxide-Chemiluminescence
Dear Administrator McCarthy: The Clean Air Scientific Advisory Committee (CASAC) Air Monitoring and Methods Subcommittee (AMMS) held a teleconference on April 3, 2014 to review EPA’s recommendation to add the Nitric Oxide-Chemiluminescence, or NO-CL, measurement method as a Federal Reference Method (FRM) for the measurement of Ozone. Subsequent to this call, EPA ORD carried out analyses during April 2014 in response to questions that were raised by AMMS during the April 3 teleconference. The charge questions from the Agency, the CASAC’s consensus responses to the Agency’s charge questions, and the individual review comments from the CASAC AMMS Subcommittee are enclosed. The CASAC’s key points are highlighted below. An FRM serves as the standard protocol for measuring ambient concentration of respective pollutants regulated under the National Ambient Air Quality Standards (NAAQS) program. The existing FRM for Ozone (Ethylene-Chemiluminescence Method, or ET-CL) is no longer being manufactured or supported. In 2009, EPA consulted a previous CASAC Monitoring Subcommittee (Ambient Air Monitoring and Methods Subcommittee - AAMMS) on ambient air monitoring issues related to the Ozone (O3) NAAQS, including issues related to the development of a second FRM for measuring O3. In March 2009, CASAC issued its consultation report that incorporated individual AAMMS member comments on issues related to the development of a second FRM for measuring O3. The Agency considered these comments, and is recommending that the NO-CL measurement method should be a second O3 FRM. In this current review, CASAC considered EPA’s Office of Research and Development’s (ORD) analysis and technical documentation on the NO-CL method, and ORD’s recommendation for making this measurement method a second O3 FRM. Overall, CASAC agrees with ORD that a new O3 FRM should be added. The current FRM’s ET-CL analyzing instrument is no longer commercially available for use in designating other O3 measurement methods as Federal Equivalent Methods (FEMs). CASAC also agrees that the current ET-CL FRM can remain on the ORD’s list of designated reference and equivalent methods, and notes that this approach is consistent with how most other obsolete FRMs have been treated by EPA CASAC agrees that the NO-CL method is a good candidate for FRM status, and CASAC is impressed by the laboratory evaluations, which show that the NO-CL method far exceeds current laboratory test requirements for FRM designation. Following the additional EPA ORD analyses reported in their May 5, 2014 summary, CASAC concludes that results of ORD’s field tests also make a compelling case for FRM designation of the NO-CL method.,
Commented [HE1]: Comment from Dirk Felton: I disagree; the ET-CL method should be delisted for 2 reasons:
1, The ET-CL no longer performs adequately to evaluate proposed methods. This will only be more evident in the future as ORD scientists attempt to keep the antiquated ET-CL instrument operational. 2, The ET-CL method should be eliminated now so that the method cannot be used in the future. The same issue has come up with obsolete Pb methods as evidenced by EPA’s guidance to monitoring Agencies (see EPA Office of Air Quality Planning and Standards “Technical Note –Pb Monitoring Implementation Strategy Analysis Method Issues” discussion on whether the public can continue to use one of the FEMs currently approved once an FRM is set):
Appendix G will be revised and EPA will take the necessary steps to address the use of existing FEMs moving forward. This may result in a future deadline to stop using the old FEMs. States can continue to use existing, approved methods but should consider switching to one of the newly approved FEMs.
Obsolete FRMs must be delisted when they are no longer adequate for the current NAAQS and no longer able to serve in an equivalency demonstration. The EPA should have a list of former FRMs and each should have a date range for applicable acceptable data.
Commented [HE2]: Comment from Ken Demerjian: It would seem that decommissioning FRMs when they are obsolete is the consistency we should be promoting.
Commented [ALR3]: Comment from Allen Robinson: This seems too strong given the revised data from EPA. It appears that both the NO-CL and UV-SL provide adequate performance.
Commented [HE4]: Comment from Dirk Felton: After reviewing the secondary data analysis, I think the NO-CL meets FRM requirements and should be approved as an FRM. I’d recommend the SL-UV method as a second FRM only after the noise and offset issues were resolved.
Commented [jcc5]: Comment from Judy Chow: Should specify performance criteria that are independent of the measurement method. See detailed J. Chow comments.

5/30/14 Draft text for review and deliberations by the CASAC Air Monitoring and Methods Subcommittee -- Please Do not Cite or Quote --This draft is a work in progress, does not reflect consensus advice or recommendations, has not been
reviewed or approved by the chartered CASAC and does not represent EPA policy. CASAC recommends that ORD should also consider the ultraviolet-scrubberless measurement method (UV-SL) as a FRM. The May 5th analyses carried out by ORD reveal excellent correlations between UV-SL and the ET-CL FRM, and between UV-SL and NO-CL, albeit with an unexplained ~2 ppb zero offset for the UV-SL method. The UV-SL instrument also has a modestly higher laboratory test interference from water vapor than the NO-CL monitor. Furthermore, the UV-SL method has not been tested against the FRM in the field as thoroughly as would be desired to merit FRM designation at this time. CASAC recommends that EPA ORD complete the work that would be required to assess the UV-SL method's suitability as a FRM. CASAC notes that other available systems to measure O3, including quantum cascade laser based tunable multi-pass IR absorption spectroscopy, cavity ring down spectroscopy (CRDS) and cavity attenuated phase shift spectroscopy (CAPS), and are not practical at this time as FRMs. These approaches are relatively expensive, have complex operational requirements, and are not broadly in use throughout state agencies. However, rapid technology innovation may make these methods more
practical for routine use in the near future, and if they can attain the specified performance criteria, then there is no reason why they should not be considered as candidate FRMs. Low-cost sensor-based systems that are currently available for O3 measurement are not sufficiently developed to be considered as FRMs or FEMs at this time. While these sensors are not likely to replace regulatory monitors, they can provide useful data for many non-regulatory monitoring objectives. Sensors tend to be low in cost and operate with low power, so they can be deployed where more expensive regulatory monitors are not required (e.g., saturation monitoring). One of ORD’s most important research objectives is to more accurately assess personal exposure. Low-cost sensors are ideal for assessing personal exposure because many of them can be deployed to characterize exposures for a more representative population over a larger portion of a typical day. CASAC emphasizes that these low-cost O3 sensors require very careful study design including an explicit plan to demonstrate sensor accuracy and precision. Lastly, CASAC commends the EPA staff scientists who have been involved with ORD’s evaluations associated with adding a second FRM for measuring O3. These scientists have capably assisted CASAC and AMMS and provided useful scientific input and summary information during and after the April 3, 2014 AMMS teleconference call. CASAC appreciates the opportunity to provide input to the EPA on this issue. We look forward to receiving the Agency’s response.
Sincerely, Mr. George A. Allen, Chair Dr. Christopher H. Frey, Chair CASAC Air Monitoring and Methods Clean Air Scientific Advisory Committee Subcommittee Enclosures
2

5/30/14 Draft text for review and deliberations by the CASAC Air Monitoring and Methods Subcommittee -- Please Do not Cite or Quote --This draft is a work in progress, does not reflect consensus advice or recommendations, has not been
reviewed or approved by the chartered CASAC and does not represent EPA policy.
NOTICE This report has been written as part of the activities of the EPA's Clean Air Scientific Advisory Committee (CASAC), a federal advisory committee independently chartered to provide extramural scientific information and advice to the Administrator and other officials of the EPA. CASAC provides balanced, expert assessment of scientific matters related to issues and problems facing the Agency. This report has not been reviewed for approval by the Agency and, hence, the contents of this report do not necessarily represent the views and policies of the EPA, nor of other agencies within the Executive Branch of the federal government. In addition, any mention of trade names or commercial products does not constitute a recommendation for use. CASAC reports are posted on the EPA website at: http://www.epa.gov/casac.
i

5/30/14 Draft text for review and deliberations by the CASAC Air Monitoring and Methods Subcommittee -- Please Do not Cite or Quote --This draft is a work in progress, does not reflect consensus advice or recommendations, has not been
reviewed or approved by the chartered CASAC and does not represent EPA policy.
U.S. Environmental Protection Agency Clean Air Scientific Advisory Committee
Air Monitoring and Methods Subcommittee CHAIR Mr. George A. Allen, Senior Scientist, Northeast States for Coordinated Air Use Management (NESCAUM), Boston, MA MEMBERS OF AMMS *Dr. David T. Allen, Professor, Department of Chemical Engineering, University of Texas, Austin, TX Dr. Linda J. Bonanno, Research Scientist, Division of Air Quality, New Jersey Department of Environmental Protection, Trenton, NJ *Dr. Doug Burns, Research Hydrologist, New York Water Science Center, U.S. Geological Survey, Troy, NY Dr. Judith C. Chow, Nazir and Mary Ansari Chair in Entrepreneurialism and Science, Research Professor, Division of Atmospheric Sciences, Desert Research Institute, Nevada System of Higher Education, Reno, NV Dr. Kenneth Demerjian, Emeritus Professor and Director, Atmospheric Sciences Research Center, State University of New York, Albany, NY Mr. Eric Edgerton, President, Atmospheric Research & Analysis, Inc., Cary, NC Mr. Henry (Dirk) Felton, Research Scientist, Division of Air Resources, Bureau of Air Quality Surveillance, New York State Department of Environmental Conservation, Albany, NY Dr. Philip Fine, Assistant Deputy Executive Officer, South Coast Air Quality Management District, Diamond Bar, CA Dr. Philip Hopke, Director, Institute for a Sustainable Environment and Bayard D. Clarkson Distinguished Professor, Clarkson University, Potsdam, NY Dr. Rudolf Husar, Professor of Energy, Environmental and Chemical Engineering, Washington University, St. Louis, MO *Dr. Daniel Jacob, Professor, Atmospheric Sciences, School of Engineering and Applied Sciences, Harvard University, Cambridge, MA Dr. Peter H. McMurry, Professor, Department of Mechanical Engineering, University of Minnesota, Minneapolis, MN
ii

5/30/14 Draft text for review and deliberations by the CASAC Air Monitoring and Methods Subcommittee -- Please Do not Cite or Quote --This draft is a work in progress, does not reflect consensus advice or recommendations, has not been
reviewed or approved by the chartered CASAC and does not represent EPA policy. Dr. Allen Robinson, Raymond J. Lane Distinguished Professor and Head, Department of Mechanical Engineering, and Professor, Department of Engineering and Public Policy, Carnegie Mellon University, Pittsburgh, PA Dr. Armistead (Ted) Russell, Professor, Department of Civil and Environmental Engineering, Georgia Institute of Technology, Atlanta, GA Dr. James Jay Schauer, Professor, Department of Civil and Environmental Engineering, College of Engineering, University of Wisconsin - Madison, Madison, WI Dr. Jay Turner, Associate Professor, Environmental & Chemical Engineering, Campus Box 1180, Washington University, St Louis, MO Dr. Yousheng Zeng, Board Member, Providence Holding Company, Baton Rouge, LA SCIENCE ADVISORY BOARD STAFF Mr. Edward Hanlon, Designated Federal Officer, U.S. Environmental Protection Agency, Washington, DC *Did not participate in this Review.
iii

5/30/14 Draft text for review and deliberations by the CASAC Air Monitoring and Methods Subcommittee -- Please Do not Cite or Quote --This draft is a work in progress, does not reflect consensus advice or recommendations, has not been
reviewed or approved by the chartered CASAC and does not represent EPA policy.
U.S. Environmental Protection Agency Clean Air Scientific Advisory Committee
CASAC
CHAIR Dr. H. Christopher Frey, Distinguished University Professor, Department of Civil, Construction and Environmental Engineering, College of Engineering, North Carolina State University, Raleigh, NC MEMBERS Mr. George A. Allen, Senior Scientist, Northeast States for Coordinated Air Use Management (NESCAUM), Boston, MA Dr. Ana Diez-Roux, Professor of Epidemiology, School of Public Health, University of Michigan, Ann Arbor, MI Dr. Jack Harkema, Professor, Department of Pathobiology, College of Veterinary Medicine, Michigan State University, East Lansing, MI Dr. Helen Suh, Associate Professor, Bouve School of Health Sciences, Northeastern University, Boston, MA Dr. Kathleen Weathers, Senior Scientist, Cary Institute of Ecosystem Studies, Millbrook, NY Dr. Ronald Wyzga, Technical Executive, Air Quality Health and Risk, Electric Power Research Institute, Palo Alto, CA SCIENCE ADVISORY BOARD STAFF Mr. Aaron Yeow, Designated Federal Officer, U.S. Environmental Protection Agency, Science Advisory Board (1400R), 1200 Pennsylvania Avenue, NW, Washington, DC
iv

5/30/14 Draft text for review and deliberations by the CASAC Air Monitoring and Methods Subcommittee -- Please Do not Cite or Quote --This draft is a work in progress, does not reflect consensus advice or recommendations, has not been
reviewed or approved by the chartered CASAC and does not represent EPA policy.
Abbreviations and Acronyms
AMMS Air Monitoring and Methods Subcommittee CAA Clean Air Act CASAC Clean Air Scientific Advisory Committee CRDS Cavity Ring Down Spectroscopy CAPS Cavity Attenuated Phase Shift Spectroscopy CFR Code of Federal Regulations ET-CL Method Ethylene-Chemiluminescence Method EPA U.S. Environmental Protection Agency FEM Federal Equivalent Method FRM Federal Reference Method NAAQS National Ambient Air Quality Standards NO-CL Method Nitric Oxide-Chemiluminescence Method OAQPS EPA Office of Air Quality Planning and Standards ORD EPA Office of Research and Development O3 Ozone SAB EPA Science Advisory Board UV-SL Ultraviolet-Scrubberless Method
v

5/30/14 Draft text for review and deliberations by the CASAC Air Monitoring and Methods Subcommittee -- Please Do not Cite or Quote --This draft is a work in progress, does not reflect consensus advice or recommendations, has not been
reviewed or approved by the chartered CASAC and does not represent EPA policy.
Consensus Responses to Charge Questions on EPA’s Recommended Federal Reference Method for Ozone: Nitric Oxide-Chemiluminescence
Background EPA scientists conduct methods evaluation research to assess ways of accurately and reliably measuring criteria pollutants in ambient air. These methods — called Federal Reference Methods (FRMs) — are descriptions of how to sample and analyze levels of these criteria pollutants, and are used by states and other monitoring organizations to assess implementation actions needed to attain National Ambient Air Quality Standards (NAAQS). The Clean Air Act requires EPA to set NAAQS for six common air pollutants (particulate matter, ground-level ozone, carbon monoxide, sulfur oxides, nitrogen oxides, and lead). A FRM serves as the standard protocol for measuring ambient concentration of these six criteria air pollutants, and each of the pollutants has at least one FRM. FRMs are used to assess the quality of monitoring data to determine whether a given geographic region is in compliance with NAAQS. To allow innovation and advance new technologies, EPA also reviews, tests, and approves other methods, called Federal Equivalent Methods (FEMs), which are based on different sampling and/or analyzing technologies than FRMs, but must be as accurate as FRMs. FRMs thus serve as the ‘gold standard’ against which the field- and laboratory-based performance of emerging monitoring technologies (i.e., FEM candidates) are compared. Given the importance of the roles of FRMs, when a new FRM is proposed as an additional FRM, it is crucial to ensure that that its measurement performance is as good as or exceeds that of the current FRM. The existing O3 FRM is based on the Ethylene-Chemiluminescence (ET-CL) method, and analyzers implementing this method are no longer being manufactured or supported. EPA’s Office of Research and Development (ORD) reported that the last O3 FRM analyzer was designated by EPA in 1979, and most designated O3 FRM analyzers are now either inoperative or too old to serve as a FRM. In 2009, EPA consulted a previous Clean Air Scientific Advisory Committee (CASAC) Monitoring Subcommittee (Ambient Air Monitoring & Methods Subcommittee - AAMMS) on ambient air monitoring issues related to the O3 NAAQS, including issues related to the development of a second FRM for measuring O3. In March 2009, CASAC issued its consultation report1 that incorporated individual AAMMS member comments on issues related to the development of a second FRM for measuring O3. The Agency considered these comments, and is currently recommending that the Nitric Oxide-Chemiluminescence, or NO-CL, Method should be a second O3 FRM. The NO-CL Method is currently a FEM, and ORD noted that the NO-CL method’s principle of operation is similar in concept to that of the current ET-CL FRM. ORD has also stated that its analysis of the field and laboratory performance of the NO-CL method indicated that data from the NO-CL
1 March 6, 2009 CASAC Report on “Consultation on Ambient Air Monitoring Issues Related to the Ozone NAAQS”, http://yosemite.epa.gov/sab/sabproduct.nsf/64B88B99C37A68CF852575710072D8C0/$File/EPA-CASAC-09-005-unsigned.pdf
1
5/30/14 Draft text for review and deliberations by the CASAC Air Monitoring and Methods Subcommittee -- Please Do not Cite or Quote --This draft is a work in progress, does not reflect consensus advice or recommendations, has not been
reviewed or approved by the chartered CASAC and does not represent EPA policy. method closely parallels the ET-CL FRM. ORD further stated that the NO-CL method has an added benefit in that it is a current FEM and is fully-qualified for promulgation as a FRM. ORD also recommends that the existing ET-CL FRM be retained to ensure continued authorization for the use of existing FEMs that were designated based on comparisons to the ET-CL FRM. In this current review, the CASAC Air Monitoring and Methods Subcommittee (AMMS) reviewed ORD’s analysis and technical documentation on the NO-CL method, and responded to four charge questions provided by ORD to the AMMS. The document reviewed by the CASAC AMMS is the technical portion of the package for the O3 NAAQS Review that focuses on ORD’s recommended second FRM for O3 (i.e., Appendix D-1 to 40 CFR – Reference Measurement Principle and Calibration Procedure for the Measurement of O3 in the Atmosphere – NO—Chemiluminescence, NO-CL, Method; January 2, 2013 Draft). In addition, the CASAC AMMS reviewed supplemental material that ORD presented during the April 3, 2014 CASAC AMMS teleconference call, and supplemental material that ORD provided on May 5, 2014 for the CASAC AMMS consideration. CASAC’s advice regarding its review of ORD’s analysis, review of technical documentation on the NO-CL method, and its response to ORD’s charge questions, is contained within this CASAC report. Response to Charge Questions CASAC focused on the following charge questions as part of its review, and provides the following responses to these charge questions. Request for Guidance/Opinion on Adding a New Ozone FRM Charge Question 1. What is the AMMS view on adding an additional O3 FRM (as Appendix D-1 of the 40 CFR Part 50 Federal Regulation) for the purpose of establishing a new FRM that is implemented in analyzers currently in production status? This new O3 FRM will serve as an additional FRM to supplement the current Ethylene-Chemiluminescence method, which is no longer being produced or supported. Response: CASAC agrees that the current O3 FRM is out of date because the ET-CL based instrument is no longer commercially available, and that a new O3 FRM should be added. The AMMS does not anticipate significant issues associated with having two FRM’s for O3 on the EPA list of FRM/FEM instruments; this is consistent with EPA’s approach when a new sulfur dioxide (SO2) FRM was added as part of the 2010 SO2 NAAQS revision regulation.2 Charge Question 2. What is the AMMS views on establishing the Nitric Oxide-Chemiluminescence (NO-CL) method (currently an FEM) as the new, additional O3 FRM?
2 See Federal Register Notice (Volume 75, Number 119, page 35593): Appendix A–1 to Part 50—Reference Measurement Principle and Calibration Procedure for the Measurement of Sulfur Dioxide in the Atmosphere (Ultraviolet Fluorescence Method).
Commented [HE6]: Comment from Dirk Felton: See comment from Dirk Felton to cover letter on this topic. Dirk suggests also adding the following text in this response: “It is also apparent that the ET-CL is no longer able to serve as a benchmark with which candidate methods can be compared in the future. The ET-CL method designation should be revoked and the EPA should provide the date range for when the method was valid in AQS.”
Commented [HE7]: Comment from Ken Demerjian: It would seem that decommissioning FRMs when they are obsolete is the consistency we should be promoting.
2

5/30/14 Draft text for review and deliberations by the CASAC Air Monitoring and Methods Subcommittee -- Please Do not Cite or Quote --This draft is a work in progress, does not reflect consensus advice or recommendations, has not been
reviewed or approved by the chartered CASAC and does not represent EPA policy. Response: Based upon review of all materials provided by ORD for the CASAC AMMS consideration, including supplemental material provided by ORD on May 5, 2014, CASAC agrees that the NO-CL method is a good candidate for FRM status. During the April 3, 2014 AMMS teleconference call, ORD presented data on side-by-side comparisons with the current and proposed FRM. After ORD presented this data, AMMS members noted they were impressed by the laboratory evaluations of the NO-CL method performed by ORD staff. AMMS members stated that results of these evaluations demonstrate that the candidate NO-CL method was reasonably interference-free, exceeded laboratory requirements for FRM designation, and provided support for meaningful tightening of FRM requirements in 40 CFR Part 53. However, AMMS members noted that preliminary results of field tests that occurred for approximately 1 month each at Research Triangle Park (RTP), NC and Laporte/Houston (LAP), TX did not make a compelling case for FRM designation of the NO-CL method, since comparisons between NO-CL and ET-CL show a disquieting amount of scatter at both sites and hints of drift in one or both instruments. Close inspection of scatterplots presented by ORD on April 3rd from LAP, where 4 analyzers were deployed, indicated that the drift was most likely associated with the NO-CL analyzer. The CASAC AMMS agreed on the April 3rd teleconference that results of ORD’s field tests did not make a compelling case for FRM designation of the NO-CL method, and encouraged ORD to continue assessing existing data to sort out sources of variability between candidate NO-CL analyzers and the ET-CL method. After the April 3, 2014 teleconference, ORD continued to analyze data from RTP and LAP to sort out sources of variability between candidate NO-CL analyzers and the ET-CL method. For the Houston, TX site, ORD investigated the basis for the series of points that appeared to be outliers in data presented by ORD on April 3rd to CASAC AMMS. On May 5, 2014, ORD submitted its reanalysis of this data as supplemental material for the CASAC AMMS consideration. ORD’s May 5, 2014 supplemental material indicate that scatter that was apparent in the data during the CASAC AMMS April 3, 2014 teleconference was, in fact, due to problems with operation of the ET-CL FRM instrument. Those problems included a change in instrument span that occurred on Sept. 16, 2013, and a loose particulate filter that lead to eight inaccurate measurements. When those problems were corrected, scatter was markedly reduced and correlations were found to be excellent. Subsequent to the April 3, 2014 teleconference call, ORD staff provided final data sets from the RTP and LAP field campaigns. Final data differed from preliminary data in that zero and span responses were used to adjust data from some of the analyzers, including the ET-CL FRM. Within ORD’s May 5, 2014 supplemental material, ORD staff also provided summary statistics for zero and span responses for all analyzers. Review of the final data sets indicates that the NO-CL analyzer exhibits acceptable zero and span variation, and compares extremely well with the existing ET-CL FRM. These updated results make a convincing case for designation of the NO-CL method as a FRM. CASAC also notes that water vapor is an interferent in the NO-CL method and causes reduced signal due to quenching of the excited NO2 molecule. This effect can reduce apparent O3 concentrations by
Commented [GA8]: Comment from George Allen: It is unclear if any zero adjustments were done at anytime.
3

5/30/14 Draft text for review and deliberations by the CASAC Air Monitoring and Methods Subcommittee -- Please Do not Cite or Quote --This draft is a work in progress, does not reflect consensus advice or recommendations, has not been
reviewed or approved by the chartered CASAC and does not represent EPA policy. 10%, or more (Boylan et al., 2014), but is minimized in commercial NO-CL analyzers by drying the sample. Given sensitivity to water vapor, CASAC agrees that periodic checks of onboard dryer performance may be warranted. Boylan, P., Helmig, D., and Park, J.H. Characterization and mitigation of water vapor effects in the measurement of ozone by chemiluminescence with nitric oxide. 2014. Atmos. Meas. Tech. 7: 1231-1244. doi:10.5194/amt-7-1231-2014, 2014. Charge Question 3. Do any other ozone measurement methods exist that the AMMS recommends for consideration of possible promulgation as a new (additional) O3 FRM? Overall Response: CASAC recommends that ORD should identify monitors that are suitable for routine state and local agency monitoring networks, and also are reliable, have minimal service requirements, do not require excessive operator time, and are not cost-prohibitive or resource intensive. In addition to the NO-CL method, ORD should continue to consider and vigorously evaluate the Ultraviolet-Scrubberless Method (UV-SL) as a second O3 FRM, since UV-SL monitors based on light absorption have been shown to not have the level of interference problems that exist in the current light absorbance FEM monitors. It is likely that the SL-UV method may be acceptable as a second FRM if the 2 ppb zero offset present in the ORD tests is resolved. As described further below, the 2B Tech Model 211 light absorption UV-SL O3 monitor is commercially available and has been shown through research and publications to not have the level of interference problems that exist in current light absorbance FEM monitors. The 2B Tech Model 211 is manufactured by 2B Technologies Inc. (an InDevR Company) and is described in their patent (Birks et al., 2013). There are other measurement methods available to measure O3 including quantum cascade laser based tunable multi-pass IR absorption spectroscopy, as well as cavity ring down spectroscopy (CRDS) and cavity attenuated phase shift spectroscopy (CAPS) methods. The CRDS and CAPS methods measure O3 indirectly via absorption of NO2 from reacting O3 with NO. However, monitors using these methods are relatively expensive and more complex in comparison to monitors using the UV-SL or NO-CL methods, and are not broadly in use throughout state agencies, and thus are not practical at this time for consideration as FRMs. There are also low cost/low power sensor-based monitors that have been developed for O3 measurement that are discussed in the response to Charge Question 4. These sensor-based monitors are probably not sufficiently developed to be considered as FRMs at this time. Additional Discussion Regarding the 2B Tech Model 211 Instrument: The 2B Tech Model 211 monitor has been used by Ollison et al. (2014) and Johnson et al. (2014). This method uses gas-phase scrubber technology with NO added to the sampled air to quantitatively react with O3 and remove it from the sample to generate O3 -free reference air. The light intensity is
Commented [GA9]: Comment from George Allen: Issues re: needing a 10,000 ppm cylinder of NO – toxic if leaked. OK for the lab but non-trivial for routine field use.
Commented [GA10]: Comment from George Allen: Is this where we want to comment on the revised 40cfr53 table B1 and B3 limits, need for other interference tests, etc etc.?
Commented [GA11]: Comment from George Allen: Make into a footnote.
4

5/30/14 Draft text for review and deliberations by the CASAC Air Monitoring and Methods Subcommittee -- Please Do not Cite or Quote --This draft is a work in progress, does not reflect consensus advice or recommendations, has not been
reviewed or approved by the chartered CASAC and does not represent EPA policy. measured in the reference and sample modes with a dual beam optical system so that the concentration of O3 can be calculated directly from Beer's Law (a general spectrophotometry equation which relates the absorption of light to the properties of the material through which the light is traveling). The 2B Tech Model 211 monitor has a moisture compensation and control system that removes water interference, although that control system has not been well described in their literature. 2B Technologies Inc. has submitted the material needed to qualify the Model 211 monitor as an FEM, and ORD approval is pending. Thus this improved version of their O3 monitor appears to be a strong candidate for designation as a FRM if the offset issue noted above can be resolved. CASAC also concludes that, in principle, light-absorption measurement techniques which utilize ozone-free ambient reference channel (as done in the UV-SL method) are inherently superior, in correcting for measurement interferences. In laboratory studies, the 2B Tech Model 211 UV-SL monitor reported higher but negligible interference (0.2 ppb) from water vapor (when tested in zero air) than NO-CL (0.01 ppb); the level of interference is at least an order of magnitude lower than the proposed specification of 5 ppb in 40 CFR Part 53. It should be noted that, like the NO-CL method, the UV-SL method requires a source of reagent NO. The 2B Tech Model 211 can use either a photolysis cell to produce NO from an external cartridge of pure N2O, or a cylinder of high concentration NO. In routine operation, the Model 211 consumes approximately 6 m3 per year of N2O. This should be taken into account when considering cost and space requirements for deployment. References:
Birks, J.W., Anderson, C., and Williford, J. 2013. Ozone Monitor with Gas-Phase Ozone Scrubber. U.S. Patent No.: US 8,395,776 B2. Johnson, T., Capel. J., and Ollison, W. Measurement of microenvironmental ozone concentrations in Durham, North Carolina, using a 2B Technologies 205 Federal Equivalent Method monitor and an interference-free 2B Technologies 211 monitor. 2014. Journal of the Air & Waste Management Association 64:360-371. Ollison, W.M., Crow, W., and Spicer, C.W. Field testing of new-technology ambient air ozone monitors. 2014. Journal of the Air & Waste Management Association 64: 855-863.
Charge Question 4. What is the AMMS views on the use of low-cost sensor technology to supplement regulatory ozone monitoring (i.e., in rural areas)? Response: There are many purposes for non-regulatory air quality monitoring, and some of these can be achieved with the use of low cost monitoring technologies (“sensors”). It is unlikely that these sensor-based monitors would be appropriate as an additional (or replacement) O3 FRM. The value of sensor-based instruments is their ability to provide data where it is either not cost effective or not practical to deploy a FRM or FEM monitor.
Commented [GA12]: Comment from George Allen: Superior to what? Classic Uv – yes; NO-CL - no.
Commented [PM13]: Comment from Peter McMurry: Must be substantially revised. Since Long et al. (5/5/14) do not discuss 2B Tech Model 211, I am not certan how it should be changed.
Commented [GA14]: Comment from George Allen: N20 is “laughing gas” and may be controlled in some states.
Commented [HE15]: From Rudy Husar: This section is too wordy and repetitive, needs pruning, consolidation.
5

5/30/14 Draft text for review and deliberations by the CASAC Air Monitoring and Methods Subcommittee -- Please Do not Cite or Quote --This draft is a work in progress, does not reflect consensus advice or recommendations, has not been
reviewed or approved by the chartered CASAC and does not represent EPA policy. Sensor-based monitors need to be well characterized before they are considered for use in a monitoring network, usually by deployment in a carefully designed study that incorporates collocation with regulatory monitors. Sensors do not need to meet the same performance specifications as regulatory monitors in order to add value to a monitoring program. The performance of the sensor, however, must be thoroughly understood and documented to aid in the interpretation of the sensor data. Low cost sensors are not well suited to the measurement of regional secondary pollutants such as O3 that do not vary significantly over large rural areas unless the sensor bias is understood and their precision is adequate. Taking meaningful measurements in rural areas often requires instruments that are more accurate and precise than instruments that would be used to measure concentrations where large spatial concentration variations exist. In many cases, the difference between a regulatory and sensor measurement would overwhelm the actual spatial variation of O3 measured at two different measurement locations within the same rural region. Low cost sensors are well suited for use in developing micro scale and personal exposure estimates that can be compared to data collected at neighborhood or urban scale regulatory monitors. Sensors are often inexpensive, portable and operate with low power requirements which make them ideal for measuring air quality throughout a person’s day no matter where they are. Actual exposure information is important because ambient standards are generally based on outdoor urban scale exposures which are not representative of actual exposures for a majority of the population. This is especially true for reactive pollutants such as O3 which typically have very different indoor and outdoor concentrations. As White (2009) points out, monitoring requirements for NAAQS compliance and public health tracking may not align exactly. Compliance monitoring places more weight on measurement’s absolute accuracy and pollutant specificity. For example, sensitivity to non-O3 oxidants is considered an undesirable interference. On the other hand, health tracking seeks a more complete characterization of population exposure, including all the health-relevant species. While CO and lead have specific health effects, ozone is merely an indicator for a reactive mix of ozone and other photochemical oxidants (Arnold et. al. 2007). Hence, inexpensive sensors for photochemical oxidants could contribute to better exposure assessment. Reference methods are relatively expensive to operate and are not likely to be deployed at locations that are not specifically tied to a regulatory requirement. Low cost O3 sensors are better suited for many research applications where cost, the availability of power, and instrument environmental considerations can limit or prohibit the use of a FEM or FRM monitor. For instance, applications such as high altitude balloon studies, studies of the influence of geographic features such as water bodies, mountains and canyons as well as studies of the spatial impact of NOx sources are all applications that are likely to be better suited to a low cost sensor than a FEM or FRM monitor References: Arnold, J., Meng, Q., Pinto, J., and Wilson, W. Atmospheric chemistry and physics used in Integrated Science Assessments. 2007. Presented to the Human Health Risk Assessment Subcommittee of the U.S. Environmental Protection Agency Board of Scientific Counselors, Bethesda. Available at
Commented [HE16]: Comment from Ken Demerjian: You may want to reference the work of Bart et al., 2014 - see my revised preliminary comments on charge question 4.
6

5/30/14 Draft text for review and deliberations by the CASAC Air Monitoring and Methods Subcommittee -- Please Do not Cite or Quote --This draft is a work in progress, does not reflect consensus advice or recommendations, has not been
reviewed or approved by the chartered CASAC and does not represent EPA policy. http://www.epa.gov/OSP/bosc/pdf/hhraltg3abstracts.pdf. White, W.H. Considerations in the use of ozone and PM2.5 data for exposure assessment. 2009. Air Qual Atmos Health 2:223–230.
7

5/30/14 Draft text for review and deliberations by the CASAC Air Monitoring and Methods Subcommittee -- Please Do not Cite or Quote --This draft is a work in progress, does not reflect consensus advice or recommendations, has not been
reviewed or approved by the chartered CASAC and does not represent EPA policy.
Appendix A
Agency Charge
UNITED STATES ENVIRONMENTAL PROTECTION AGENCY NATIONAL EXPOSURE RESEARCH LABORATORY
RESEARCH TRIANGLE PARK, NC 27711
March 7, 2014
OFFICE OF RESEARCH AND DEVELOPMENT
MEMORANDUM SUBJECT: Request for Peer-Review/Advisory on the Proposed Promulgation of an Additional
Federal Reference Method (FRM) for Ozone (O3) FROM: Timothy J. Buckley, Director /signed/ Human Exposure and Atmospheric Sciences Division (HEASD)
National Exposure Research Laboratory (NERL)
TO: Ed Hanlon Designated Federal Officer Clean Air Scientific Advisory Committee EPA Science Advisory Board Staff Office (1400F)
This memorandum is to request that the Clean Air Scientific Advisory Committee (CASAC) Air Monitoring and Methods Subcommittee (AMMS) conduct a peer-review/advisory of ORD’s intent to propose a new, additional Federal Reference Method (FRM) for Ozone (O3). Background
In conjunction with the O3 National Ambient Air Quality Standards (NAAQS) Review, ORD is developing the scientific and technical portion of the Federal Register (FR) rule-making notice regarding O3 monitoring methodology. It is for this purpose that ORD requests that the CASAC AMMS provide a peer-review (advisory) on our recommendation to add a second FRM for O3. ORD is proposing the addition of a new FRM for O3 because analyzers implementing the existing FRM, based on the Ethylene-Chemiluminescence method, are no longer being manufactured or supported. The last O3
A-1

5/30/14 Draft text for review and deliberations by the CASAC Air Monitoring and Methods Subcommittee -- Please Do not Cite or Quote --This draft is a work in progress, does not reflect consensus advice or recommendations, has not been
reviewed or approved by the chartered CASAC and does not represent EPA policy. FRM analyzer was designated by EPA in 1979, and most designated O3 FRM analyzers are now either inoperative or too old to serve as an FRM.
Each of the six criteria air pollutants has at least one FRM that serves as the standard protocol for measuring ambient concentration of the respective pollutant. Also, the FRM is used to assess the quality of the monitoring data to determine whether a given geographic region is in full regulatory compliance with the appropriate primary and/or secondary NAAQS. Furthermore, the FRM serves as the ‘gold standard’ against which the field- and laboratory-based performance of emerging monitoring technologies (i.e., Federal Equivalent Method [FEM] candidates) is compared. Given the importance of these three key FRM roles, it is crucial to ensure that when a new FRM is proposed as an additional (or replacement) FRM, that its measurement performance is as good or exceeds that of the current FRM.
For these reasons, we are recommending adoption of the Nitric Oxide (NO)-Chemiluminescence method as a second (additional) FRM for O3. The existing FRM needs to be retained to ensure continued authorization for the use of existing FEMs that were designated based on comparisons to it. The proposed method’s principle of operation is similar to that of the current O3 FRM (Ethylene-Chemiluminescence) and our analysis of the field and laboratory performance of the NO-Chemiluminescence method indicates that it closely parallels the FRM. The NO-Chemiluminescence method has the added benefit that it is a current FEM and is fully-qualified for promulgation as an FRM. As an FEM, the (NO)-Chemiluminescence method is a well-established method which has been validated through field and laboratory testing and designated as an equivalent method based on comparison to the current FRM.
The documents to be reviewed include the technical portion of the package for the Ozone National Ambient Air Quality Standard (NAAQS) Review that focuses on ORD’s recommended second FRM for Ozone (Recommended Method: NO-Chemiluminescence – currently a Federal Equivalent Method (FEM)). The existing FRM for Ozone (Ethylene-Chemiluminescence Method) is no longer being manufactured or supported, and has not been commercially available for more than 20 years. EPA ORD notes that it has compared the performance of the NO-Chemiluminescence Method to the Ethylene-Chemiluminescence Method, and ORD is recommending that the NO-Chemiluminescence Method be promoted to FRM Status.
The review package for the CASAC AMMS contains the following attachment:
• Draft FRM: Appendix D-1 to 40 CFR —REFERENCE MEASUREMENT PRINCIPLE AND CALIBRATION PROCEDURE FOR THE MEASUREMENT OF OZONE IN THE ATMOSPHERE – NO CHEMILUMINESCENCE (NO-CL) METHOD
Additional information may be provided upon request. Specific Request ORD and NERL request that the CASAC AMMS provide responses to the attached charge questions pertaining to the promulgation of an additional FRM for O3.
A-2

5/30/14 Draft text for review and deliberations by the CASAC Air Monitoring and Methods Subcommittee -- Please Do not Cite or Quote --This draft is a work in progress, does not reflect consensus advice or recommendations, has not been
reviewed or approved by the chartered CASAC and does not represent EPA policy. Charge Questions
1. What is the AMMS view on adding an additional O3 FRM (as Appendix D-1 of the 40 CFR Part 50 Federal Regulation) for the purpose of establishing a new FRM that is implemented in analyzers currently in production status? This new O3 FRM will serve as an additional FRM to supplement the current Ethylene-Chemiluminescence method, which is no longer being produced or supported.
2. What is the AMMS views on establishing the Nitric Oxide-Chemiluminescence (NO-CL) method (currently an FEM) as the new, additional O3 FRM?
3. Do any other ozone measurement methods exist that the AMMS recommends for consideration
of possible promulgation as a new (additional) O3 FRM?
Request for Guidance/Opinion on Emerging Measurement Methodologies
4. What is the AMMS views on the use of low-cost sensor technology to supplement regulatory ozone monitoring (i.e., in rural areas)?
If you have any questions about this request, please contact Eric S. Hall, National Exposure Research Laboratory (NERL), Human Exposure and Atmospheric Sciences Division (HEASD) at [email protected] or (919) 541-3147. Attachments Cc: Jennifer Orme-Zavaleta, Director
National Exposure Research Laboratory (NERL)
A-3

5/30/14 Draft text for review and deliberations by the CASAC Air Monitoring and Methods Subcommittee -- Please Do not Cite or Quote --This draft is a work in progress, does not reflect consensus advice or recommendations, has not been
reviewed or approved by the chartered CASAC and does not represent EPA policy.
Appendix B
Compendium of Individual Comments by CASAC Air Monitoring and Methods Subcommittee Members on EPA’s Recommendation for an Additional Federal
Reference Method for Ozone: Nitric Oxide-Chemiluminescence
MR. GEORGE A. ALLEN ................................................................................................................... B-2
DR. LINDA J. BONANNO .................................................................................................................. B-3
DR. JUDITH C. CHOW ....................................................................................................................... B-4
DR. KENNETH DEMERJIAN ......................................................................................................... B-19
MR. ERIC S. EDGERTON ................................................................................................................ B-22
MR. HENRY (DIRK) FELTON ........................................................................................................ B-24
DR. PHILIP FINE .............................................................................................................................. B-26
DR. PHILIP HOPKE.......................................................................................................................... B-27
DR. RUDOLF HUSAR ....................................................................................................................... B-30
DR. PETER H. MCMURRY ............................................................................................................. B-31
DR. ALLEN ROBINSON ................................................................................................................... B-32
DR. ARMISTEAD (TED) RUSSELL ............................................................................................... B-34
DR. JAY TURNER ............................................................................................................................. B-36
DR. YOUSHENG ZENG.................................................................................................................... B-38
ATTACHMENT A: ENVIRONMENTAL TECHNOLOGY VERIFICATION REPORT: JSC OPTEC 3.02 P-A CHEMILUMINESCENT OZONE ANALYZER ....................... B-40
B-1

5/30/14 Draft text for review and deliberations by the CASAC Air Monitoring and Methods Subcommittee -- Please Do not Cite or Quote --This draft is a work in progress, does not reflect consensus advice or recommendations, has not been
reviewed or approved by the chartered CASAC and does not represent EPA policy.
Mr. George A. Allen Clarification on not removing the old E-CL Ozone FRM. It would be helpful if EPA could be explicit as to why they are leaving the old Ethylene-CL FRM on the method list at http://www.epa.gov/ttn/amtic/criteria.html - specifically http://www.epa.gov/ttnamti1/files/ambient/criteria/reference-equivalent-methods-list.pdf It is my understanding that if the E-CL FRM was removed, all FEMs based on it (essentially all instruments in the current O3 monitoring network) would lose their FEM designation. There is clear precedent for keeping obsolete FRMs (and other obsolete FEMs) on the method list. When EPA promoted the Ultraviolet Fluorescence Method for SO2 from an FEM to an FRM as part of the most
recent SO2 NAAQS review [Appendix AB1 to Part 50, FR Vol. 75, No. 119, pg 35593, 6/22/2010], the existing manual Reference Method for SO2 (Pararosaniline Method) was retained. See the first link at: http://www.epa.gov/airquality/sulfurdioxide/actions.html The panel might find this useful as an example of what EPA did last time. The section on the new SO2 FRM starts on page 35593 of the FR notice. It is my understanding that once a method or instrument is designated as an FRM or FEM, it (so far) has never removed from the method list. EPA's current list of designated reference and equivalent monitoring methods is at: http://www.epa.gov/ttnamti1/files/ambient/criteria/reference-equivalent-methods-list.pdf It is interesting to note that even though the Fluorescence SO2 method is now an FRM (as of April 2012), none of the existing FEM Fluorescence SO2 Analyzers have been designated as FRM monitors. Description of the proposed NO-CL FRM. The proposed text for the rule that describes the NO-CL method is relatively brief. Additional detail similar to what is included for the Ultraviolet Fluorescence Method for SO2 in the FR notice cited above should be included, such as information on the measured wavelength range for this method, a “schematic diagram” (see Fig. 1 for the SO2 FRM), and relevant references to this method.
B-2

5/30/14 Draft text for review and deliberations by the CASAC Air Monitoring and Methods Subcommittee -- Please Do not Cite or Quote --This draft is a work in progress, does not reflect consensus advice or recommendations, has not been
reviewed or approved by the chartered CASAC and does not represent EPA policy.
Dr. Linda J. Bonanno Charge Question 1. What is the AMMS view on adding an additional O3 FRM (as Appendix D-1 of the 40 CFR Part 50 Federal Regulation) for the purpose of establishing a new FRM that is implemented in analyzers currently in production status? This new O3 FRM will serve as an additional FRM to supplement the current Ethylene-Chemiluminescence method, which is no longer being produced or supported. Response: Good idea since the Ethylene method is out of date and as long as the NO method shows that it’s the same or better than the FRM and it’s not more prone to interferences and is easy to implement/practical for routine monitoring. Charge Question 2. What is the AMMS views on establishing the Nitric Oxide-Chemiluminescence (NO-CL) method (currently an FEM) as the new, additional O3 FRM? Response: Is it really worth the effort to make the NO FEM method an FRM method? Charge Question 3. Do any other ozone measurement methods exist that the AMMS recommends for consideration of possible promulgation as a new (additional) O3 FRM? Response: UV method? Charge Question 4. What is the AMMS views on the use of low-cost sensor technology to supplement regulatory ozone monitoring (i.e., in rural areas)? Response:
Are there plans to designate this technology as FRM or FEM? Would measurements be used for designation purposes? I’d just want to be sure that there’s adequate evidence that the low-cost sensor technology
performs same as FRM/FEM. Monitors in rural areas can record high levels of ozone because of the low concentration of scrubber gases (NOx)
B-3

5/30/14 Draft text for review and deliberations by the CASAC Air Monitoring and Methods Subcommittee -- Please Do not Cite or Quote --This draft is a work in progress, does not reflect consensus advice or recommendations, has not been
reviewed or approved by the chartered CASAC and does not represent EPA policy.
Dr. Judith C. Chow Charge Question 1. What is the AMMS view on adding an additional O3 FRM (as Appendix D-1 of the 40 CFR Part 50 Federal Regulation) for the purpose of establishing a new FRM that is implemented in analyzers currently in production status? This new O3 FRM will serve as an additional FRM to supplement the current Ethylene-Chemiluminescence method, which is no longer being produced or supported. Response: Adding O3 FRMs would be useful since the Ethylene-Chemiluminescence FRMs (Beckman 950A, Bendix 8002, CSI 2000) that were used in U.S. monitoring networks during the 1970s–1980s, are no longer commercially available (Leston et al., 2005). Current performance criteria (Code of Federal Regulations, 2010) for O3 Federal Equivalent Methods (FEM) allow 10 ppb as a minimum detection limit, 12 or 24 hour zero-span drifts of 20 ppb, interferences of 60 ppm, and precision of 10 ppb. These criteria are outdated and need to be revised to support the current 75 ppb O3 National Ambient Air Quality Standards (NAAQS) as acknowledged in the Integrated Science Assessment for Ozone and Related Photochemical Oxidants (U.S.EPA, 2013a). EPA should consider specifying FRM performance criteria (Chow, 1995; Watson et al., 1995) rather than specifying a measurement method or instrument design, such as the NO-CL. Such performance criteria should include specifications and tolerances for: 1) baseline stability; 2) span stability; 3) response linearity; 4) minimum detectable limits; 5) tolerance of known interfering species at normal ambient and extreme ambient concentrations; 6) response time; 7) flow control; and 8) sensitivity to environmental extremes (temperature, humidity, precipitation). The specifications should be the ideal, with tolerances that can be achieved with current technology. Tolerances could be reduced as future technologies allow. As noted above, the current FEM tolerances (Code of Federal Regulations, 2010) may have been appropriate for 1980s measurement technology, but they are much too loose for current technology. Any measurement principle or instrument design that meets these criteria would qualify as a FRM. Charge Question 2. What is the AMMS views on establishing the Nitric Oxide-Chemiluminescence (NO-CL) method (currently an FEM) as the new, additional O3 FRM? Response: The light emitted by chemiluminescence from gas-phase chemical reaction of O3 with nitric oxide (NO) (Figure 2 from Clough and Thrush, 1967) has long been used to quantify NO concentrations (NOx) (Saltzman et al., 1956; Saltzman and Gilbert, 1959), and this method is defined as the FRM for NO2(Code of Federal Regulations, 1983). It seems logical, then, to use the same principle for the detection of O3 when it is properly implemented. Interferences from HNO3, PAN, and other nitrogen-containing species that are converted to NO (Dunlea et al., 2007; Villena et al., 2012; Winer et al., 1974; Xu et al., 2013) for this FRM are not an issue for O3 detection. The Teledyne Model 265E (Teledyne API, 2011) is a commercially-available NO-CL analyzer and an FEM. The wavelengths monitored by
B-4

5/30/14 Draft text for review and deliberations by the CASAC Air Monitoring and Methods Subcommittee -- Please Do not Cite or Quote --This draft is a work in progress, does not reflect consensus advice or recommendations, has not been
reviewed or approved by the chartered CASAC and does not represent EPA policy. this instrument are not specified, though Kalnajs and Avallone (2010) cite 830 nm as the detection wavelength while Stedman et al. (Stedman et al., 1972) cite 648 nm. It appears that detectors sensitive to the red to near-IR part of the spectrum are used in most method implementations (Minarro et al., 2011; Ray et al., 1986; Ulanovsky et al., 2001; Zahn et al., 2012; Zhang et al., 2010). The NO-CL method has the advantage over the ethylene-chemiluminescence method since it has faster reaction rates, higher signal to noise (m/z) ratio, the ability to work under vacuum, requires a smaller reaction volume, and accommodates flexible operating conditions (Pearson and Stedman, 1980; Ridley et al., 1992). Many compounds emit light upon reaction with O3(Hansen et al., 1977; Mihalatos and Calokerinos, 1995; Toda and Dasgupta, 2008; Zhang et al., 2010; Zhang et al., 1999), including ethylene which is the basis for the current CL FRM (Code of Federal Regulations, 1997). Light from these reactions is typically broad-band and extends from the UV to IR regions of the spectrum. These reactions do not appear to affect light from the NO-O3 reaction (Figure 2 from Clough and Thrush, 1967) when it is assumed that such reactions have already taken place in the atmosphere prior to entering the sensing zone. When the NO reactant concentration is much higher than ambient levels, the effect of ambient NO appears to be negligible. Interferences from water vapor(Pearson, 1990) are eliminated by sample drying at the inlet (Wilson and Birks, 2006) and reaction-quenching by changes in the atmospheric composition appear to be negligible. Improved sensitivity and specificity of the NO-CL method has been recognized (Parrish and Fehsenfeld, 2000), but its linear response to O3 must be externally calibrated. A few comparisons between UV absorption and NO- or ethylene-chemiluminescence methods were examined (Arshinov et al., 2002; Ryerson et al., 1998; Williams et al., 2006). Good correlations were found by Ryerson et al. (1998) based on five field measurements of urban plume, but NO-CL method reported ~5% systematically low measurements from aircraft as compared to UV absorption. The disagreement between NO-CL and UV measurements was attributed to the deficiency in photon counting efficiency of the NO-CL. There have been limited comparisons of the NO-CL method with UV absorption methods (Ollison et al., 2013; Williams et al., 2006) that are in more common use. The most recent, and interesting results, are summarized in Figures 3 and 8 of Ollison et al. (2013), demonstrating good agreement with one UV absorption system and poorer agreement with another. The disagreement was attributed to UV interferences rather than NO-CL interferences in an environment known to have high VOC levels. Although the concept is good, the proposed revision to Appendix D-1 of Part 50 needs additional work. It is a small modification to the current O3 FRM specification (Code of Federal Regulations, 1997), which is itself sketchy on the design and performance standards needed to specify a FRM. For example, UV light-emitting diodes (LEDs) and photodiode detectors are now available (Fowles and Wayne, 1981; SETI, 2014; Sglux, 2014) that might mitigate some of the temperature dependence of the mercury lamp. Modern methods of linear regression that consider errors in both variables should be considered for calculating slopes and intercepts of calibration curves (York, 1966). More modern measurements of O3 UV absorption efficiencies and their variation with temperature should be evaluated (Barnes and Mauersberger, 1987; Bass and Paur, 1981; Malicet et al., 1995; Mauersberger et al., 1987; Voigt et al., 2001). The statement in Section 3 of Appendix D-1 that “…the NO-CL measurement system is
B-5

5/30/14 Draft text for review and deliberations by the CASAC Air Monitoring and Methods Subcommittee -- Please Do not Cite or Quote --This draft is a work in progress, does not reflect consensus advice or recommendations, has not been
reviewed or approved by the chartered CASAC and does not represent EPA policy. relatively free of significant interferences from other pollutant substances that may be present in ambient air” needs to be tested under a wider variety of conditions than have been reported to date. Spicer et al. (2010) provide a good example of an array of ambient and laboratory tests that would be useful. Figures 1 and 2 of Appendix D-1 also need to be revised to specify the optics and source. Reference 8, “Transfer standards for calibration of Ambient Air Monitoring Analyzers for Ozone” dated 2010 should be replaced with the October 2013 version (U.S.EPA, 2013b) at the same website.
B-6

5/30/14 Draft text for review and deliberations by the CASAC Air Monitoring and Methods Subcommittee -- Please Do not Cite or Quote --This draft is a work in progress, does not reflect consensus advice or recommendations, has not been
reviewed or approved by the chartered CASAC and does not represent EPA policy. EPA’s May 5, 2014 PowerPoint presentation (Long et al., 2014) provides insufficient documentation to arrive at the conclusion that “based upon the work that has been done to date and this subsequent data analysis, ORD is confident that the NO-CL method meets and exceeds all requirements for proposal of a new FRM for ozone.” A full technical report, of which there are several examples (Holowecky et al., 2008; Leston, 2014; Spicer et al., 2010; U.S.EPA, 1979; U.S.EPA, 1998; U.S.EPA, 2013b), which includes: 1) specification of performance criteria (see above); 2) literature review; 3) explanation of measurement principles, interferences, and currently available instruments; 4) laboratory tests; 5) field tests (including site selection to evaluate interferences and environmental effects); 6) data analysis; and 7) recommendations. Slides 5 and 6 show that the “FRM” is inferior to the collocated FEMs, although it is unclear why this is the case; nor is it clear what specific instruments were tested, how old they were, or how they were maintained. Slides 8, 10, and 17 show that the NO-CL and UV instruments measure well within reasonable performance criteria, and there is no reason to select one method over the other as a FRM. Charge Question 3. Do any other ozone measurement methods exist that the AMMS recommends for consideration of possible promulgation as a new (additional) O3 FRM? Response: Spectrophotometric determination of atmospheric O3 also has a long history (Bravo and Lodge, 1964; Grosjean and Harrison, 1985; Stair, 1959). An additional O3 FRM by UV absorption should be considered, as most O3 monitoring networks in the U.S. (i.e., federal, state, local, and tribal) use a UV photometric FEM. Switching from ethylene-CL to the UV absorption method apparently reduced operational costs and improved safety by eliminating the compressed flammable ethylene gas. Appendix D-1 uses this principle as the transfer standard that is in turn related to UV primary standards (Norris et al., 2013; Viallon et al., 2006). These units are mostly based on the 254 nm emission line from a low pressure mercury (Hg) discharge lamp as the UV light source (Leston et al., 2005). The major objection to them as FRMs has been the potential absorption interferences at this wavelength from certain VOCs, water vapor, and mercury. As indicated in Figure 8 of Ollison et al., 2013, it appears that it is possible to compensate for these with appropriate sample pre-treatment and parallel absorbance cells. For an intercomparison in Mexico City, Dunlea et al. (2006) did not observe positive or negative interferences on UV O3 monitors, although the potential interference from oxidized or nitrated aromatics needs to be further tested. When UV O3 monitors were compared with collocated research-grade open-path instruments (i.e., DOAS and FTIR measurements), up to 18% discrepancy was found. Interferences with UV O3 measurements from fresh diesel emissions were found and attributed to fine particles (dp<0.2 µm) passing through the particulate filter and scattering/absorbing radiation within the detection cell. Ollison et al. (2013) and Johnson (2014) demonstrated the use of scrubbed O3 with excess NO generated in situ by photolysis of added nitrous oxide (N2O) in 2B Technologies Model 211. This process eliminated the need for a conventional O3 scrubber. Different scrubbers (e.g., non-heated MnO2, heated silver wool, or optimal heated metal scrubber) and interference by ultrafine particles in UV O3 systems need to be further tested prior to consideration as an additional O3 FRM.
B-7

5/30/14 Draft text for review and deliberations by the CASAC Air Monitoring and Methods Subcommittee -- Please Do not Cite or Quote --This draft is a work in progress, does not reflect consensus advice or recommendations, has not been
reviewed or approved by the chartered CASAC and does not represent EPA policy. Charge Question 4. What is the AMMS views on the use of low-cost sensor technology to supplement regulatory ozone monitoring (i.e., in rural areas)? Response: It is a good idea to consider low cost sensor technology to supplement regulatory O3 monitoring in rural or remote areas. These would also be useful for human exposure studies to determine how concentrations differ from urban-scale compliance monitors. Early O3 measurements monitored the cracks in a piece of bent rubber (Beatty and Juve, 1955; Bradley and Haagen-Smit, 1951; Soret, 1853), and these were indicative of different levels. More recently, passive samplers have been used for long-term averages and exposure studies, although variable diffusion rates increase concentration uncertainty (Bhangar et al., 2013; Cox, 2003; Geyh et al., 2000; Grosjean and Hisham, 1992; Manning et al., 1996; Monn and Hangartner, 1990; Plaisance et al., 2007; Varns et al., 2001). Ozonesondes (Brewer and Milford, 1960; Hogrefe et al., 1998; Johnson et al., 2008; Komhyr, 1969; Liu et al., 2006; Newchurch et al., 2003; Shiotani et al., 2002; Vomel and Diaz, 2010) use a buffered potassium iodide (KI) reaction (Byers and Saltzman, 1958; Hodgeson et al., 1971; Kopczynski and Bufalini, 1971) with coulometric or colorimetric detection. The disadvantage of this method is that it responds to all oxidants, not just O3, and it has a limited capacity. Longer-lived electrochemical detectors are being developed (Knake and Hauser, 2002; Williams et al., 2013). For remote environments, continuous monitors must be small, lightweight, low power, and easy to operate. Hintsa et al. (2004) tested two O3 sensors (i.e., Physical Science Inc. [PSI; Andover, MA] and 2B Technologies [Golden, CO]) for O3 monitoring at ocean buoys and towers. These sensors reported good precision (~1–1.5 ppm) and accuracy (~2%) with 4–4.5 Watts power required. The 2B Technologies O3 monitor has been applied in the National Park Service network (http://www.nature.nps.gov/air/Studies/portO3.cfm), and a modified 2B Model 202 was also found to sustain low temperature (<–60 °C) in the Antarctic (Bauguitte et al., 2011). 2B Technology Personal Ozone Monitor (POM) with a 0.34 Kg weight and 3 Watt power requirement can be considered as a low-cost sensor (~$5,000 vs. ~$9,000–13,000 for a conventional O3 monitor). An example of collocated comparisons at Sparks, NV, the monitoring site operated by the Washoe County Health Department, is shown in Figure 1 for a collocated comparison among three UV absorption O3 monitors: 1) Teledyne API Model 400E; 2) 2B Technology Personal Ozone Monitor (POM); and 3) 2B Technology Model 205 for the period of 3/1–29/13 at Sparks, NV (Green et al., 2013) The Sparks site is known to be affected by residential wood burning during cold nights (Chow et al., 1988). The effect of wood smoke VOCs (Huntzicker and Johnson, 1979) can be seen on the POM results for several nights in a higher concentration. These also seem to correspond to lower concentrations during the daytime. The three monitors tracked well, with correlations (R2) of 0.82–0.93; larger intercepts (4.87 ppb) were found between the 2B Model POM and API 400E and between the 2B Models POM and 205 (intercept of 5.32 ppb) as shown in Figure 2. (Green et al., 2013)
B-8

5/30/14 Draft text for review and deliberations by the CASAC Air Monitoring and Methods Subcommittee -- Please Do not Cite or Quote --This draft is a work in progress, does not reflect consensus advice or recommendations, has not been
reviewed or approved by the chartered CASAC and does not represent EPA policy. O’Keeffe and Lewis (2007) used an optical fiber sensor to measure O3 at both UV (254 nm) and visible (603 nm) absorption spectra. The sensitivity of optical fiber sensors is proportional to the path length of the gas cells. Optical fiber sensors minimize chemical and electromagnetic interference with relatively low cost.
Figure 1. Collocated comparison among three UV absorption O3 monitors: 1) Teledyne API Model 400E; 2) 2B Technology Personal Ozone Monitor (POM); and 3) 2B Technology Model 205 for the period of 3/1–29/13 at Sparks, NV (Green et al., 2013). The Sparks site is known to be affected by residential wood burning during cold nights (Chow et al., 1988) The effect of wood smoke VOCs (Huntzicker and Johnson, 1979) can be seen on the POM results for several nights in a higher concentration. These also seem to correspond to lower concentrations during the daytime.
B-9

5/30/14 Draft text for review and deliberations by the CASAC Air Monitoring and Methods Subcommittee -- Please Do not Cite or Quote --This draft is a work in progress, does not reflect consensus advice or recommendations, has not been
reviewed or approved by the chartered CASAC and does not represent EPA policy.
y = 0.76x + 4.87R² = 0.82
-10
0
10
20
30
40
50
60
70
-10 0 10 20 30 40 50 60 70
2B M
odel
PO
M O
3(p
pb)
API 400E O3 (ppb)
y = 0.91x - 0.63R² = 0.93
-10
0
10
20
30
40
50
60
70
-10 0 10 20 30 40 50 60 70
2B M
odel
205
O3
(ppb
)
API 400E O3 (ppb)
B-10

5/30/14 Draft text for review and deliberations by the CASAC Air Monitoring and Methods Subcommittee -- Please Do not Cite or Quote --This draft is a work in progress, does not reflect consensus advice or recommendations, has not been
reviewed or approved by the chartered CASAC and does not represent EPA policy.
Figure 2. Collocated comparison of one hour averages for three collocated O3 monitors: 1) Teledyne API Model 400E; 2) 2B Technology Personal Ozone Monitor (POM); and 3) 2B Technology Model 205 in Sparks, NV during 3/1–29/13 (Green et al., 2013).
Fowles and Wayne (1981) proposed the use of an LED to monitor O3. Laboratory tests were conducted by Kalnajs and Avallone(2010), similar to the dual-cell UV absorption technique (Proffitt and McLaughlin, 1983) in the TEI 49 O3 analyzer. The single low-pressure mercury-vapor UV light source is replaced with a pair of solid state UV LEDs. The LEDs provide a stable light source with adequate intensity without the need for temperature control and high-voltage power supply, and reduces energy consumption as compared to the conventional mercury-vapor lamp. Gubarev et al. (2013) introduced a low-cost, lightweight (2.4 Kg) microprocessor O3 meter based on UV absorption at 254 nm using corona discharge and semiconductor O3 sensor. The reported accuracy was <3% and the device required very low power (11 Watts). Washenfelder et al. (2011) measured O3 by chemical conversion to NO2 in excess NO with subsequent detection by cavity ring-down spectroscopy. Darby et al. (2012) combined cavity-enhanced absorption spectroscopy (CEAS) with a low pressure mercury lamp to achieve low detection limit (8.4 ppb) for O3. Gomez and Rosen (2013) reported a fast-response cavity-enhanced O3 monitor based on incoherent broadband CEAS (IBB-CEAS) with ~1 ppb sensitivity at 0.1 s integration time. Gao et al. (2012) documented the development and testing of the NOAA-2 O3 monitor using the polarized UV beam in the absorption cells to reduce cell length and a capillary mercury lamp to increase UV intensity. A chemiluminescence O3 detector for airborne applications is also presented by Zahn et al. (2012). Other techniques, including photoacoustic (Veres et al., 2005), solid state (Korotcenkov et al., 2007a; 2007b; 2009; 2014; Korotcenkov and Cho, 2012), and electrochemical cells cited above need to be further tested. The performance of several O3 monitors employing several different operation principles is shown in Table 1 of Gomez and Rosen (2013). These low-cost, lightweight O3 monitors need to be collocated with proven O3 monitors (e.g., FRM or FEM) to assure their equivalence and comparability during O3 measurements. Bowman (2013) calls attention to the need of an international O3 air quality monitoring system that integrates a continuum of observations from local to global scale, including both
y = 0.84x + 5.32R² = 0.89
-10
0
10
20
30
40
50
60
70
-10 0 10 20 30 40 50 60 70
2B M
odel
PO
M O
3(p
pb)
2B Model 205 O3 (ppb)
B-11

5/30/14 Draft text for review and deliberations by the CASAC Air Monitoring and Methods Subcommittee -- Please Do not Cite or Quote --This draft is a work in progress, does not reflect consensus advice or recommendations, has not been
reviewed or approved by the chartered CASAC and does not represent EPA policy. ground- and satellite-based observations of O3. Tests of low-cost O3microsensors should be part of the EPA tasks to verify the emerging technology.
B-12

5/30/14 Draft text for review and deliberations by the CASAC Air Monitoring and Methods Subcommittee -- Please Do not Cite or Quote --This draft is a work in progress, does not reflect consensus advice or recommendations, has not been
reviewed or approved by the chartered CASAC and does not represent EPA policy.
References Arshinov, M.Y.; Belan, B.D.; Fofonov, A.V.; Krasnov, O.A.; Kovalevskii, V.K.; Pirogov, V.A.;
Tolmachev, G.N. (2002). Comparison of ultraviolet and chemiluminescent ozonometers. Atmospheric and Oceanic Optics, 15:656-658.
Barnes, J.; Mauersberger, K. (1987). Temperature-dependence of the ozone absorption cross-section at the 2537 nm mercury line. Journal of Geophysical Research-Atmospheres, 92(D12):14861-14864.
Bass, A.M.; Paur, R.J. (1981). UV absorption cross-sections for ozone - the temperature dependence. Journal of Photochemistry, 17(1-2):141.
Bauguitte, S.J.B.; Brough, N.; Frey, M.M.; Jones, A.E.; Maxfield, D.J.; Roscoe, H.K.; Rose, M.C.; Wolff, E.W. (2011). A network of autonomous surface ozone monitors in Antarctica: technical description and first results. Atmos. Meas. Tech., 4(4):645-658. http://www.atmos-meas-tech.net/4/645/2011/amt-4-645-2011.pdf.
Beatty, J.R.; Juve, A.E. (1955). A simple objective method for estimatinglLow concentrations of ozone in air. Rubber Chemistry and Technology, 28(2):608-622.
Bhangar, S.; Singer, B.C.; Nazaroff, W.W. (2013). Calibration of the Ogawa passive ozone sampler for aircraft cabins. Atmos. Environ., 65:21-24.
Bowman, K.W. (2013). Toward the next generation of air quality monitoring: Ozone. Atmos. Environ., 80:571-583.
Bradley, C.E.; Haagen-Smit, A.J. (1951). The application of rubber in the quantitative determination of ozone. Rubber Chemistry and Technology, 24(4):750-755.
Bravo, H.A.; Lodge, J.P. (1964). Specific Spectrophotometric Determination of Ozone in the Atmosphere
BRAVO1964. Anal. Chem., 36(3):671-673. http://dx.doi.org/10.1021/ac60209a040. Brewer, A.W.; Milford, J.R. (1960). The Oxford-Kew ozone sonde. Proc. Roy. Soc. Lond., 256A:470-
495. Byers, D.H.; Saltzman, B.E. (1958). Determination of ozone in air by neutral and alkaline iodide
procedures. AIHA Journal, 19:251-257. Chow, J.C.; Watson, J.G.; Egami, R.T.; Frazier, C.A.; Goodrich, A.; Ralph, C. (1988). PM10 source
apportionment in Reno and Sparks, Nevada for state implementation plan development: Chemical mass balance results. Report Number DRI 8086.1F2; prepared by Desert Research Institute, Reno, NV, for State of Nevada, Carson City, NV.
Chow, J.C. (1995). Critical review: Measurement methods to determine compliance with ambient air quality standards for suspended particles. J. Air Waste Manage. Assoc., 45(5):320-382.http://www.tandfonline.com/doi/pdf/10.1080/10473289.1995.10467369.
Clough, P.N.; Thrush, B.A. (1967). Mechanism of chemiluminescent reaction between nitric oxide and ozone. Trans. Faraday Soc., 63:915.
Code of Federal Regulations (1983). Appendix F to Part 50-Measurement principle and calibration procedure for the measurement of nitrogen dioxide in the atmosphere (gas phase chemiluminescence). CFR, 40(50):26-38. http://www.ecfr.gov/cgi-bin/text-idx?SID=2497f5e7ef364619527718c988923dc0&node=40:2.0.1.1.1.0.1.19.7&rgn=div9.
Code of Federal Regulations (1997). Appendix D to Part 50-Measurement principle and calibration procedure for the measurement of ozone in the atmosphere. CFR, 40(50):26-38.
B-13

5/30/14 Draft text for review and deliberations by the CASAC Air Monitoring and Methods Subcommittee -- Please Do not Cite or Quote --This draft is a work in progress, does not reflect consensus advice or recommendations, has not been
reviewed or approved by the chartered CASAC and does not represent EPA policy.
http://www.ecfr.gov/cgi-bin/text-idx?SID=317c84d3fd074ff5d462bc9c8539784c&node=40:2.0.1.1.1.0.1.19.5&rgn=div9.
Code of Federal Regulations (2010). Test procedures for methods for SO2, CO, O3, and NO2. CFR, 40(53.32)http://www.ecfr.gov/cgi-bin/text-idx?SID=fe69264994c290cd218f61eddf2a1c4e&node=40:6.0.1.1.1.3.1.3&rgn=div8.
Cox, R.M. (2003). The use of passive sampling to monitor forest exposure to O-3, NO2 and SO2: A review and some case studies. Environ. Poll., 126(3):301-311.
Darby, S.B.; Smith, P.D.; Venables, D.S. (2012). Cavity-enhanced absorption using an atomic line source: application to deep-UV measurements. Analyst, 137:2318-2321.
Dunlea, E.J.; Herndon, S.C.; Nelson, D.D.; Volkamer, R.M.; Lamb, B.K.; Allwine, E.J.; Grutter, M.; Villegas, C.R.R.; Marquez, C.; Blanco, S.; Cardenas, B.; Kolb, C.E.; Molina, L.T.; Molina, M.J. (2006). Technical note: Evaluation of standard ultraviolet absorption ozone monitors in a polluted urban environment. Atmos. Chem. Phys., 6:3163-3180. http://www.atmos-chem-phys.net/6/3163/2006/acp-6-3163-2006.pdf.
Dunlea, E.J.; Herndon, S.C.; Nelson, D.D.; Volkamer, R.M.; San Martini, F.; Sheehy, P.M.; Zahniser, M.S.; Shorter, J.H.; Wormhoudt, J.C.; Lamb, B.K.; Allwine, E.J.; Gaffney, J.S.; Marley, N.A.; Grutter, M.; Marquez, C.; Blanco, S.; Cardenas, B.; Retama, A.; Villegas, C.R.R.; Kolb, C.E.; Molina, L.T.; Molina, M.J. (2007). Evaluation of nitrogen dioxide chemiluminescence monitors in a polluted urban environment. Atmos. Chem. Phys., 7(10):2691-2704.
Fowles, M.; Wayne, R.P. (1981). Ozone monitor using an LED source. J. Phys. E: Sci. Instrum., 14:1143-1145.
Gao, R.S.; Ballard, J.; Watts, L.A.; Thornberry, T.D.; Ciciora, S.J.; McLaughlin, R.J.; Fahey, D.W. (2012). A compact, fast UV photometer for measurement of ozone from research aircraft. Atmos. Meas. Tech., 5(9):2201-2210.
Geyh, A.S.; Xue, J.P.; Ozkaynak, H.; Spengler, J.D. (2000). The Harvard Southern California chronic ozone exposure study: Assessing ozone exposure of grade-school-age children in two Southern California communities. Environ. Health Perspect., 108(3):265-270.
Gomez, A.L.; Rosen, E.P. (2013). Fast response cavity enhanced ozone monitor. Atmos. Meas. Tech., 6(2):487-494. http://www.atmos-meas-tech.net/6/487/2013/amt-6-487-2013.pdf.
Green, M.C.; Wang, X.L.; Watson, J.G.; Chow, J.C.; Kohl, S.D. (2013). Spatial distribution of wintertime PM2.5 in Sparks, NV: Analysis of air quality and meteorological data. prepared by Desert Research Institute, Reno, NV.
Grosjean, D.; Harrison, J.F. (1985). Response of chemiluminescence NOx analyzers and ultraviolet ozone analyzers to organic air pollutants. Environ. Sci. Technol., 19(9):862-865.
Grosjean, D.; Hisham, M.W.M. (1992). A passive sampler for atmospheric ozone. J. Air Waste Manage. Assoc., 42(2):169-173.
Gubarev, S.P.; Opaleva, G.P.; Taran, V.S.; Zolototrubova, M.I. (2013). Devices for ozone concentration monitoring. Problems of Atomic Science and Technology, (1):234-236. http://vant.kipt.kharkov.ua/ARTICLE/VANT_2013_1/article_2013_1_234.pdf.
Hansen, D.A.; Atkinson, R.; Pitts, J.N. (1977). Structural effects on chemiluminescence from reaction of ozone with selected organic compounds. Journal of Photochemistry, 7(6):379-404.
Hintsa, E.J.; Allsup, G.P.; Eck, C.F.; Hosom, D.S.; Purcell, M.J.; Roberts, A.A.; Scott, D.R.; Sholkovitz, E.R.; Rawlins, W.T.; Mulhall, P.A.; Lightner, K.; McMillan, W.W.; Song, J.; Newchurch, M.J. (2004). New ozone measurement systems for autonomous operation on ocean buoys and towers. J.
B-14

5/30/14 Draft text for review and deliberations by the CASAC Air Monitoring and Methods Subcommittee -- Please Do not Cite or Quote --This draft is a work in progress, does not reflect consensus advice or recommendations, has not been
reviewed or approved by the chartered CASAC and does not represent EPA policy.
Atmos. Oceanic Technol., 21(7):1007-1016. http://journals.ametsoc.org/doi/pdf/10.1175/1520-0426(2004)021%3C1007%3ANOMSFA%3E2.0.CO%3B2.
Hodgeson, J.A.; Baumgardner, R.E.; Martin, B.E.; Rehme, K.A. (1971). Stoichiometry in the neutral iodometric procedure for ozone by gas-phase titration with nitric oxide. Anal. Chem., 43(8):1123-1126. http://dx.doi.org/10.1021/ac60303a026.
Hogrefe, C.; Rao, S.T.; Zurbenko, I.G. (1998). Detecting trends and biases in time series of ozonesonde data. Atmos. Environ., 32(14/15):2569-2586.
Huntzicker, J.J.; Johnson, R.L. (1979). Investigation of an ambient interference in the measurement of ozone by ultrviolet absorption photometry. Environ. Sci. Technol., 13(11):1414-1416.
Johnson, B.J.; Helmig, D.; Oltmans, S.J. (2008). Evaluation of ozone measurements from a tethered balloon-sampling platform at South Pole Station in December 2003. Atmos. Environ., 42(12):2780-2787.
Johnson, T.; Capel, J.; Ollison, W. (2014). Measurement of microenvironmental ozone concentrations in Durham, North Carolina, using a 2B Technologies 205 Federal Equivalent Method monitor and an interference-free 2B Technologies 211 monitor. J. Air Waste Manage. Assoc., 64(3):360-371.
Kalnajs, L.E.; Avallone, L.M. (2010). A novel lightweight low-power dual-beam ozone photometer utilizing solid-state optoelectronics. J. Atmos. Oceanic Technol., 27:869-880.
Knake, R.; Hauser, P.C. (2002). Sensitive electrochemical detection of ozone. Anal. Chim. Acta., 459(2):199-207.
Komhyr, W.D. (1969). Electrochemical concentration cells for gas analysis. Ann. Geophysicae, 25:203. Kopczynski, S.L.; Bufalini, J.J. (1971). Stoichiometry of iodometric analyses of ozone at pH 7.0. Anal.
Chem., 43(8):1126-1127. http://dx.doi.org/10.1021/ac60303a024. Korotcenkov, G.; Blinov, I.; Ivanov, M.; Stetter, J.R. (2007a). Ozone sensors on the base of SnO2 films
deposited by spray pyrolysis. Sensors and Actuators B-Chemical, 120(2):679-686. Korotcenkov, G.; Blinov, I.; Brinzari, V.; Stetter, J.R. (2007b). Effect of air humidity on gas response of
SnO2 thin film ozone sensors. Sensors and Actuators B-Chemical, 122(2):519-526. Korotcenkov, G.; Cho, B.K.; Gulina, L.; Tolstoy, V. (2009). Ozone sensors based on SnO(2) films
modified by SnO(2)-Au nanocomposites synthesized by the SILD method. Sensors and Actuators B-Chemical, 138(2):512-517.
Korotcenkov, G.; Cho, B.K. (2012). Ozone measuring: What can limit application of SnO2-based conductometric gas sensors? Sensors and Actuators B-Chemical, 161(1):28-44.
Korotcenkov, G.; Cho, B.K.; Brinzari, V.; Gulina, L.B.; Tolstoy, V.P. (2014). Catalytically active filters deposited by SILD method for inhibiting sensitivity to ozone of SnO2-based conductometric gas sensors. Ferroelectrics, 459(1):46-51.
Leston, A.R.; Ollison, W.M.; Spicer, C.W.; Satola, J. (2005). Potential interference bias in ozone standard compliance monitoring. J. Air Waste Manage. Assoc., 55(10):1464-1472.
Liu, X.; Chance, K.; Sioris, C.E.; Kurosu, T.P.; Newchurch, M.J. (2006). Intercomparison of GOME, ozonesonde, and SAGE II measurements of ozone: Demonstration of the need to homogenize available ozonesonde data sets. J. Geophys Res. - Atmospheres, 111(D14)ISI:000239579100003.
Malicet, J.; Daumont, D.; Charbonnier, J.; Parisse, C.; Chakir, A.; Brion, J. (1995). Ozone UV spectroscopy 2. Absorption cross-sections and temperature-dependence. Journal of Atmospheric Chemistry, 21(3):263-273.
B-15

5/30/14 Draft text for review and deliberations by the CASAC Air Monitoring and Methods Subcommittee -- Please Do not Cite or Quote --This draft is a work in progress, does not reflect consensus advice or recommendations, has not been
reviewed or approved by the chartered CASAC and does not represent EPA policy. Manning, W.J.; Krupa, S.V.; Bergweiler, C.J.; Nelson, K.I. (1996). Ambient ozone (O3) in three Class I
wilderness areas in the northeastern USA: Measurements with Ogawa passive samplers. Environ. Poll., 91(3):399-403.
Mauersberger, K.; Hanson, D.; Barnes, J.; Morton, J. (1987). Ozone vapor-pressure and absorption cross-section measurements - Introduction of an ozone standard. Journal of Geophysical Research-Atmospheres, 92(D7):8480-8482.
Mihalatos, A.M.; Calokerinos, A.C. (1995). Ozone chemiluminescence in environmental analysis. Anal. Chim. Acta., 303(1):127-135.
Minarro, M.D.; Ferradas, E.G.; Rico, J.B.; Alonso, F.D.; Martinez, F.J.M.; Trigueros, C.R. (2011). Study of the uncertainty in NO2 chemiluminescence measurements due to the NO-O3 reaction in sampling lines. Environmental Science and Pollution Research, 18(3):436-445.
Monn, C.; Hangartner, M. (1990). Passive sampling of ozone. J. Air Waste Manage. Assoc., 40(3):357-358.
Newchurch, M.J.; Ayoub, M.A.; Oltmans, S.; Johnson, B.; Schmidlin, F.J. (2003). Vertical distribution of ozone at four sites in the United States. J. Geophys. Res., 108(D1):ACH 9-1-ACH 9-17. doi: 10.1029/2002JD002059.
Norris, J.E.; Choquette, S.J.; Viallon, J.; Moussay, P.; Wielgosz, R.; Guenther, F.R. (2013). Temperature measurement and optical path-length bias improvement modifications to National Institute of Standards and Technology ozone reference standards. J. Air Waste Manage. Assoc., 63(5):565-574.
O'Keeffe, S.; Fitzpatrick, C.; Lewis, E. (2007). An optical fibre based ultra violet and visible absorption spectroscopy system for ozone concentration monitoring. Sensors and Actuators B-Chemical, 125(2):372-378.
Ollison, W.M.; Crow, W.; Spicer, C.W. (2013). Field testing of new-technology ambient air ozone monitors. J. Air Waste Manage. Assoc., 63(7):855-863. http://www.tandfonline.com/doi/pdf/10.1080/10962247.2013.796898.
Parrish, D.D.; Fehsenfeld, F.C. (2000). Methods for gas-phase measurements of ozone, ozone precursors and aerosol precursors. Atmos. Environ., 34(12-14):1921-1957.
Pearson, R.; Stedman, D. (1980). Instrumentation for fast-response ozone measurements from aircraft PEARSON1980. Atmospheric Technology, 12:51-54. Pearson, R. (1990). Measuring ambient ozone with high sensitivity and bandwidth PEARSON1990. Rev. Sci. Instrum., 61(2):907-916. Plaisance, H.; Gerboles, M.; Piechocki, A.; Detimmerman, F.; De Saeger, E. (2007). Radial diffusive
sampler for the determination of 8-h ambient ozone concentrations. Environ. Poll., 148(1):1-9. Proffitt, M.H.; McLaughlin, R.J. (1983). Fast-response dual-beam UV-absorption ozone photometer
suitable for use on stratospheric balloons. Rev. Sci. Instrum., 54(12):1719-1728. Ray, J.D.; Stedman, D.H.; Wendel, G.J. (1986). Fast chemiluminescent method for measurement of
ambient ozone. Anal. Chem., 58(3):598-600. Ridley, B.A.; Grahek, F.E.; Walega, J.G. (1992). A small, high-sensitivity, medium-response ozone
detector suitable for measurements from light aircraft. J. Atmos. Oceanic Technol., 9(2):142-148. Ryerson, T.B.; Buhr, M.P.; Frost, G.J.; Goldan, P.D.; Holloway, J.S.; Hubler, G.; Jobson, B.T.; Kuster,
W.C.; McKeen, S.A.; Parrish, D.D.; Roberts, J.M.; Sueper, D.T.; Trainer, M.; Williams, J.; Fehsenfeld, F.C. (1998). Emissions lifetimes and ozone formation in power plant plumes. J. Geophys Res. - Atmospheres, 103(D17):22569-22583.
B-16
5/30/14 Draft text for review and deliberations by the CASAC Air Monitoring and Methods Subcommittee -- Please Do not Cite or Quote --This draft is a work in progress, does not reflect consensus advice or recommendations, has not been
reviewed or approved by the chartered CASAC and does not represent EPA policy. Saltzman, B.E.; Byers, D.H.; Hyslop, F.L. (1956). Nitrogen oxide impurities in ozone. Industrial &
Engineering Chemistry, 48(1):115-118. Saltzman, B.E.; Gilbert, N. (1959). Iodometric microdetermination of organic oxidants and ozone.
Resolution of mixtures by kinetic colorimetry. Anal. Chem., 31(11):1914-1920. SETI (2014). Rethinking UV light sources. prepared by Sensor Electronic Technology Inc., Columbia,
SC, http://www.s-et.com/. Sglux (2014). sglux: The UV experts. prepared by sglux SolGel Technologies GmbH, Berlin, Germany,
http://www.sglux.com/Start.1.0.html?&L=1. Shiotani, M.; Fujiwara, M.; Hasebe, F.; Hashizume, H.; Vomel, H.; Oltmans, S.J.; Watanabe, T. (2002).
Ozonesonde observations in the equatorial eastern Pacific - the Shoyo-Maru survey. J. Meteorol. Soc. Japan, 80(4B):897-909. ISI:000179235300010.
Soret, J.L. (1853). Note sur la prodction de l'ozone par la decompoisition del'eau a de basses temperatures. C. R. Hebd. Seances Adad. Sci. Ser. C., 38:445-448.
Spicer, C.W.; Joseph, D.W.; Ollison, W.M. (2010). A re-examination of ambient air ozone monitor interferences. J. Air Waste Manage. Assoc., 60(11):1353-1364. http://www.tandfonline.com/doi/pdf/10.3155/1047-3289.60.11.1353.
Stair, R. (1959). Measurement of Ozone in Terms of Its Optical Absorption STAIR1959. In Ozone Chemistry and Technology, 21; American Chemical Society: 269-285.
http://dx.doi.org/10.1021/ba-1959-0021.ch038 Stedman, D.H.; Daby, E.E.; Stuhl, F.; Niki, H. (1972). Analysis of ozone and nitric oxide by a
chemiluminescent method in laboratory and atmospheric studies of photochemical smog. J. Air Poll. Control Assoc., 22(4):260-263.
Teledyne API (2011). Model 265E chemiluminescence ozone analyzer. prepared by Teledyne Advanced Pollution Instrumentation, San Diego, CA, http://www.teledyne-api.com/manuals/06626B_265E_Addendum.pdf.
Toda, K.; Dasgupta, P.K. (2008). New applications of chemiluminescence for selective gas analysis. Chemical Engineering Communications, 195(2):82-97.
U.S.EPA (2013a). Integrated science assessment for ozone and related photochemical oxidants. Report Number EPA 600/R-10/076F; prepared by Office of Research and Development, National Center for Environmental Assessment - RTP Division, U.S. Environmental Protection Agency, Research Triangle Park, NC.
U.S.EPA (2013b). Transfer standards for calibration of air monitoring analyzers for ozone: Technical assistance document. Report Number EPA-454/B-13-004; prepared by U.S. Environmental Protection Agency, Research Triangle Park, NC, http://www.epa.gov/ttnamti1/files/ambient/qaqc/OzoneTransferStandardGuidance.pdf.
Ulanovsky, A.E.; Yushkov, V.A.; Sitnikov, N.M.; Ravengnani, F. (2001). The FOZAN-II fast-response chemiluminescent airborne ozone analyzer. Instruments and Experimental Techniques, 44:249-256.
Varns, J.L.; Mulik, J.D.; Sather, M.E.; Glen, G.; Smith, L.; Stallings, C. (2001). Passive ozone network of Dallas: A modeling opportunity with community involvement. 1. Environ. Sci. Technol., 35(5):845-855.
Veres, A.H.; Sarlos, F.; Varga, A.; Szabo, G.; Bozoki, Z.; Motika, G.; Gyapjas, J. (2005). Nd : YAG laser-based photoacoustic detection of ozone: Comparison of pulsed and quasicontinuous wave operation and field tests. Spectroscopy Letters, 38(3):377-388.
B-17
5/30/14 Draft text for review and deliberations by the CASAC Air Monitoring and Methods Subcommittee -- Please Do not Cite or Quote --This draft is a work in progress, does not reflect consensus advice or recommendations, has not been
reviewed or approved by the chartered CASAC and does not represent EPA policy. Viallon, J.; Moussay, P.; Norris, J.E.; Guenther, F.R.; Wielgosz, R.I. (2006). A study of systematic
biases and measurement uncertainties in ozone mole fraction measurements with the NIST Standard Reference Photometer. Metrologia, 43(5):441-450.
Villena, G.; Bejan, I.; Kurtenbach, R.; Wiesen, P.; Kleffmann, J. (2012). Interferences of commercial NO2 instruments in the urban atmosphere and in a smog chamber. Atmos. Meas. Tech., 5(1):149-159. http://www.atmos-meas-tech.net/5/149/2012/amt-5-149-2012.pdf.
Voigt, S.; Orphal, J.; Bogumil, K.; Burrows, J.P. (2001). The temperature dependence (203-293 K) of the absorption cross sections of O3 in the 230-850 nm region measured by Fourier-transform spectroscopy. Journal of Photochemistry and Photobiology A-Chemistry, 143(1):1-9.
Vomel, H.; Diaz, K. (2010). Ozone sonde cell current measurements and implications for observations of near-zero ozone concentrations in the tropical upper troposphere. Atmos. Meas. Tech., 3(2):495-505.
Washenfelder, R.A.; Wagner, N.L.; Dube, W.P.; Brown, S.S. (2011). Environ.Sci.Technol.45(7):2938-2944.
Watson, J.G.; Thurston, G.D.; Frank, N.H.; Lodge, J.P.; Wiener, R.W.; McElroy, F.F.; Kleinman, M.T.; Mueller, P.K.; Schmidt, A.C.; Lipfert, F.W.; Thompson, R.J.; Dasgupta, P.K.; Marrack, D.; Michaels, R.A.; Moore, T.; Penkala, S.; Tombach, I.H.; Vestman, L.; Hauser, T.; Chow, J.C. (1995). Measurement methods to determine compliance with ambient air quality standards for suspended particles: Critical review discussion. J. Air Waste Manage. Assoc., 45(9):666-684. http://www.tandfonline.com/doi/pdf/10.1080/10473289.1995.10467395.
Williams, D.E.; Henshaw, G.S.; Bart, M.; Laing, G.; Wagner, J.; Naisbitt, S.; Salmond, J.A. (2013). Validation of low-cost ozone measurement instruments suitable for use in an air-quality monitoring network. Measurement Science & Technology, 24(6)http://iopscience.iop.org/0957-0233/24/6/065803/pdf/0957-0233_24_6_065803.pdf.
Williams, E.J.; Fehsenfeld, F.C.; Jobson, B.T.; Kuster, W.C.; Goldan, P.D.; Stutz, J.; McCleanny, W.A. (2006). Comparison of ultraviolet absorbance, chemiluminescence, and DOAS instruments for ambient ozone monitoring. Environ. Sci. Technol., 40(18):5755-5762.
Wilson, K.L.; Birks, J.W. (2006). Mechanism and elimination of a water vapor interference in the measurement of ozone by UV absorbance. Environ. Sci. Technol., 40(20):6361-6367.
Winer, A.M.; Peters, J.W.; Smith, J.P.; Pitts, J.N., Jr. (1974). Response of commercial chemiluminescence NO-NO2 analyzers to other nitrogen-containing compounds. Environ. Sci. Technol., 8:1118-1121.
Xu, Z.; Wang, T.; Xue, L.K.; Louie, P.K.K.; Luk, C.W.Y.; Gao, J.; Wang, S.L.; Chai, F.H.; Wang, W.X. (2013). Evaluating the uncertainties of thermal catalytic conversion in measuring atmospheric nitrogen dioxide at four differently polluted sites in China. Atmos. Environ., 76:221-226.
York, D. (1966). Least-squares fitting of a straight line. Canadian J. Phys., 44:1079-1086. Zahn, A.; Weppner, J.; Widmann, H.; Schlote-Holubek, K.; Burger, B.; Kuhner, T.; Franke, H. (2012).
A fast and precise chemiluminescence ozone detector for eddy flux and airborne application. Atmos. Meas. Tech., 5(2):363-375.
Zhang, L.C.; Hu, J.; Lv, Y.; Hou, X.D. (2010). Recent progress in chemiluminescence for gas analysis. Applied Spectroscopy Reviews, 45(6):474-489.
Zhang, X.R.; Baeyens, W.R.G.; Garcia-Campana, A.M.; Ouyang, J. (1999). Recent developments in chemiluminescence sensors. Trac-Trends in Analytical Chemistry, 18(6):384-391.
B-18

5/30/14 Draft text for review and deliberations by the CASAC Air Monitoring and Methods Subcommittee -- Please Do not Cite or Quote --This draft is a work in progress, does not reflect consensus advice or recommendations, has not been
reviewed or approved by the chartered CASAC and does not represent EPA policy.
Dr. Kenneth Demerjian Charge Question 1. What is the AMMS view on adding an additional O3 FRM (as Appendix D-1 of the 40 CFR Part 50 Federal Regulation) for the purpose of establishing a new FRM that is implemented in analyzers currently in production status? This new O3 FRM will serve as an additional FRM to supplement the current Ethylene-Chemiluminescence method, which is no longer being produced or supported. Response: It seems that referring to the development of a new O3 FRM as an additional FRM to supplement the current Ethylene-Chemiluminescence (ECL) method is confusing. If the ECL is no longer produced or supported, are we not proposing a replacement of the O3 FRM. I don’t see that we have a choice but to establish a new O3 FRM and decommission the current ECL FRM. Charge Question 2. What is the AMMS views on establishing the Nitric Oxide-Chemiluminescence (NO-CL) method (currently an FEM) as the new, additional O3 FRM? Response: Establishing the Nitric Oxide-Chemiluminescence (NO-CL) method as the new O3 FRM is a logical choice given the techniques track record and performance characteristics in NO monitoring instrumentation. That being said, much of the literature on (NO-CL) pertains to its application in NO measurement systems and not for ozone monitoring. Studies related to the design of CL reaction cells to optimize light gathering, achieve faster flows to reduce residence times and lower pressure have all improved NO detection limits and sensitivity. This collection of work has also identified interferences affecting detection limits and reported on a variety of intercomparison studies of (NO-CL) measurements related to the measurement of NO, NO2, and NOy. This work should be reviewed and relevant aspects to the proposed O3 (NO-CL) FRM cited (see references below). Operational modifications have also been introduced (Ollison et al., 2013) to existing instrumentation (UV absorption and NO-CL) that mitigates some well known interferences and improves O3 measurement accuracy. Further analyses and additional intercomparison studies performed by ORD on the NO-CL and UV-O3 scrubberless (SL-UV) methodologies with the ECL FRM, suggest very similar performance statistics, with the possible exception regarding the high zero offset (~2.0ppb) observed in the SL-UV measurement method (see slides 15-16 ORD supplemental presentation). Although nightly zeroing (slide twelve) does not seem to explain the observed results, the presentation does not indicate how the chemical zeroing was performed (i.e., using NO from a cylinder or generated from the photolysis of N2O, an option on the 2B Tech Model 211). If the photolysis of N2O was the NO source, it is conceivable that it is the source of the zero offset. For example, O(1D) generated in the photolysis of
B-19

5/30/14 Draft text for review and deliberations by the CASAC Air Monitoring and Methods Subcommittee -- Please Do not Cite or Quote --This draft is a work in progress, does not reflect consensus advice or recommendations, has not been
reviewed or approved by the chartered CASAC and does not represent EPA policy. N2O is a potential source of OH (via O(1D) reaction with H2O) which is highly reactive with other compounds (e.g., VOCs) forming oxidized products with uv absorbing properties in 254nm region. Reported SL-UV interferences (e.g. xylene, SO2, NO2, H2O) are low and do not seem likely to account for the zero offset. ORD may want to consider performing systematic zeroing (e.g., hourly) to see if this reduces the offset. Charge Question 3. Do any other ozone measurement methods exist that the AMMS recommends for consideration of possible promulgation as a new (additional) O3 FRM? Response: Based on the results presented in ORD intercomparison of the SL-UV method as discussed above, I would support its consideration as an additional O3 FRM. Other techniques available for O3 FRM status but rather expensive include Quantum Cascade Laser based tunable multi-pass IR absorption spectroscopy; cavity ring down spectroscopy (CRDS) and cavity attenuated phase shift spectroscopy (CAPS) both of the latter techniques measure ozone indirectly via NO2 from reacting O3 with NO. The JSC Optec 3.02 P-A chemiluminescent ozone analyzer looks like a promising FEM Regarding Guidance/Opinion on Emerging Measurement Methodologies: Recent application of an O3 semiconductor gas sensor array network reported by Bart et al., 2014 is an interesting example of an emerging measurement methodology. Such techniques show promise in providing expansive spatial coverage and resolution of ozone concentrations at relatively low cost with some caveats (see response to CQ#4). Charge Question 4. What is the AMMS views on the use of low-cost sensor technology to supplement regulatory ozone monitoring (i.e., in rural areas)? Response: Deployment of low-cost sensor technology to improve spatial coverage of relative ozone concentrations is a useful strategy, if it is backed-up with selective placement of O3 FEM(s) to support the absolute ozone calibration of the sensor array.
References Bart, M., D. E. Williams, B. Ainslie, I. McKendry, J. Salmond, S. K. Grange, M. Alavi-Shoshtari, D. Steyn, and G. S. Henshaw, 2014: High density ozone monitoring using gas sensitive semi-conductor sensors in the Lower Fraser Valley, British Columbia, Environmental Science & Technology, 48 (7), 3970-3977.
B-20

5/30/14 Draft text for review and deliberations by the CASAC Air Monitoring and Methods Subcommittee -- Please Do not Cite or Quote --This draft is a work in progress, does not reflect consensus advice or recommendations, has not been
reviewed or approved by the chartered CASAC and does not represent EPA policy. Drummond, J. W., A. Volz, D. H. Ehhalt, 1985: An optimized chemiluminescence detector for tropospheric NO measurements. J. Atmos Chemistry, Volume 2, Issue 3, pp 287-306 Ridley, B. A., F. E. Grahek, 1990: A small, low flow, high sensitivity reaction vessel for no chemiluminescence detectors. J. Atmos. Oceanic Technol., 7, 307–311. Fehsenfeld, F. C., et al. (1990), Intercomparison of NO2 measurement techniques, J. Geophys. Res., 95(D4), 3579–3597, doi:10.1029/JD095iD04p03579. Williams, E. J., et al. (1998), Intercomparison of ground-based NO y measurement techniques, J. Geophys. Res., 103(D17), 22261–22280, doi:10.1029/98JD00074. Ollison, W. M., W. Crow, C.W. Spicer, 2013: Field testing of new-technology ambient air ozone monitors. J. Air Waste Manage. Assoc. 63, 855-863. Additional Comments: Please include the attached document as an additional preliminary comment to post on our AMMS website. This was referred to during the April 3, 2014 AMMS Teleconference. See Attachment A: U.S. Environmental Protection Agency. Environmental Technology Verification Report: JSC Optec 3.02 P-A Chemiluminescent Ozone Analyzer. Prepared by Battelle, through Cooperative Agreement with USEPA. February 2008.
B-21

5/30/14 Draft text for review and deliberations by the CASAC Air Monitoring and Methods Subcommittee -- Please Do not Cite or Quote --This draft is a work in progress, does not reflect consensus advice or recommendations, has not been
reviewed or approved by the chartered CASAC and does not represent EPA policy.
Mr. Eric S. Edgerton Charge Question 1. What is the AMMS view on adding an additional O3 FRM (as Appendix D-1 of the 40 CFR Part 50 Federal Regulation) for the purpose of establishing a new FRM that is implemented in analyzers currently in production status? This new O3 FRM will serve as an additional FRM to supplement the current Ethylene-Chemiluminescence method, which is no longer being produced or supported. Response: This makes sense, given the status of the of the ethylene-chemiluminescence method. Charge Question #2: What is the AMMS views on establishing the Nitric Oxide-Chemiluminescence (NO-CL) method (currently an FEM) as the new, additional O3 FRM? Response: NO-CL is a good choice for a new FRM. The reaction has long been used to measure NO and other components of NOy at sub-ppb concentrations with minimal interference and good linearity over a broad dynamic range. Field tests performed by ORD show excellent agreement with the O3 FRM, when data from both analyzers are corrected for zero and span response. In addition, the NO-CL method exhibits greater zero and span stability than the current O3 FRM and the UV FEM. The one significant issue with NO-CL is variable water vapor (quenching). Boylan et al., 2014 show that water vapor interference is on the order of 4.2% per 10,000 ppm H2O. This can be very significant, given that summertime H2O concentrations can approach 40,000 ppm in the southeastern U.S. I believe the instrument design reduces this effect by drying sample air upstream of the reaction chamber. In practice, it may be advisable to verify dryer performance on a periodic basis. It might also be worthwhile revisiting the interference equivalent test procedure specified in 40 CFR Part 53. My interpretation of Table B-3, is that water vapor interference testing for the ethylene chemiluminescence (ET-CL) O3 FRM is performed in zero air (i.e., no pollutant). This may be appropriate for ET-CL, but this is not the case for NO-CL. Boylan, P., Helmig, D., and Park, J.H. Characterization and mitigation of water vapor effects in the measurement of ozone by chemiluminescence with nitric oxide. 2014. Atmos. Meas. Tech. 7: 1231-1244. doi:10.5194/amt-7-1231-2014, 2014. Charge Question #3: Do any other ozone measurement methods exist that the AMMS recommends for consideration of possible promulgation as a new (additional) O3 FRM? Response: The scruberless-UV (SL-UV) method tested by ORD shows great promise and easily exceeds current and proposed specifications for FRM status in 40 CFR Part 53. Field tests are somewhat limited to date. Further evaluation is strongly encouraged. It should be noted, however, that the commercially available SL-UV method as of May 2014 requires an external source of compressed N2O, and that this imposes cost, space and safety considerations on those who operate the method.
B-22
5/30/14 Draft text for review and deliberations by the CASAC Air Monitoring and Methods Subcommittee -- Please Do not Cite or Quote --This draft is a work in progress, does not reflect consensus advice or recommendations, has not been
reviewed or approved by the chartered CASAC and does not represent EPA policy.
Other chemical and spectroscopic methods exist for the measurement of ozone, such as cavity ringdown, but I see no reason to designate these FRM as opposed to FEM. Charge Question #4: What are the AMMS views on the use of low-cost sensor technology to supplement regulatory ozone monitoring (i.e., in rural areas)? Response: Given current capabilities, I see little value in the use of low-cost sensors to supplement regulatory ozone monitoring, except possibly when it comes to questions of site selection. In this case, screening with low-cost sensors might assist in locating appropriates sites for regulatory monitoring purposes.
B-23
5/30/14 Draft text for review and deliberations by the CASAC Air Monitoring and Methods Subcommittee -- Please Do not Cite or Quote --This draft is a work in progress, does not reflect consensus advice or recommendations, has not been
reviewed or approved by the chartered CASAC and does not represent EPA policy.
Mr. Henry (Dirk) Felton Charge Question 1: What is the AMMS view on adding an additional O3 FRM (as Appendix D-1 of the 40 CFR Part 50 Federal Regulation) for the purpose of establishing a new FRM that is implemented in analyzers currently in production status? This new O3 FRM will serve as an additional FRM to supplement the current Ethylene-Chemiluminescence method, which is no longer being produced or supported. Response:
FRMs are important and necessary for all criteria pollutants. These methods must be available to provide very accurate data no matter where they are used and no matter what concentrations of co-pollutants are in the ambient air. This is because the primary purpose of FRMs is to serve as a bench mark for developers of FEMs. Developers of new methods must be able to properly operate an FRM so they can evaluate prototypes that may lead to improved methods in the future. FRMs are also necessary to provide data for areas where inadequacies in FEMs may cause their data to be questioned. Monitoring agencies may want to deploy an FRM to obtain data that in the context of the NAAQS are free from biases or interferences. It is important that an FRM be available for every criteria pollutant even if it is not routinely deployed by regulatory agencies. The existing Ethylene-Chemiluminescence method should be revoked because it is not commercially available, it is not a method that can easily be assembled as needed and there are no vendors providing service for the few remaining instruments in existence. The existing FEMs that were approved based on comparisons to the Ethylene-Chemiluminescence should keep their approved status until a new FRM is approved that demonstrates a significant improvement over the prior method.
Charge Question 2: What is the AMMS views on establishing the Nitric Oxide-Chemiluminescence (NO-CL) method (currently an FEM) as the new, additional O3 FRM? Response:
After consideration of ORD’s follow-up data analysis it is evident that the NO-CL method is an acceptable FRM for Ozone. The variability (imprecision) in the initial data report was explained by inconsistencies in the operation of the ET-CL FRM and not the NO-CL instrument. ORD’s evaluation of several other Ozone methods is very interesting. It is likely that the SL-UV method may be acceptable as a second FRM once the noise and zero offset issues are resolved.
One disadvantage of the ET-CL and NO-CL method is the requirement for a reagent. The currently available NO-CL instrument requires a 10,000 ppm cylinder of NO in order to operate. This concentration of NO combined with the size of most cylinders for these applications represent a safety issue for personnel in the buildings where these instruments are located. In
B-24

5/30/14 Draft text for review and deliberations by the CASAC Air Monitoring and Methods Subcommittee -- Please Do not Cite or Quote --This draft is a work in progress, does not reflect consensus advice or recommendations, has not been
reviewed or approved by the chartered CASAC and does not represent EPA policy.
regulatory monitoring networks, instruments are sometimes located in schools or other public facilities where gasses with concentrations above safety thresholds are not permitted. This should not preclude the instrument from consideration as an FRM although it may limit where it can be deployed.
Charge Question 4: What is the AMMS views on the use of low-cost sensor technology to supplement regulatory ozone monitoring (i.e., in rural areas)? Response:
Low cost sensors are not well suited to the measurement of regional secondary pollutants that do not vary significantly over wide regions in ambient air. Taking meaningful measurements in rural areas often requires instruments that are more accurate and precise than instruments that are used to measure concentrations that are closer to ambient standards. The variability between a regulatory measurement and a sensor reading in many cases would overwhelm the spatial differences between Ozone measured at two different ambient locations within the same region. Low cost sensors are well suited for use in developing personal exposure estimates that can be compared to data collected at neighborhood scale regulatory monitors. Sensors are often inexpensive, portable and operate with low power requirements which make them ideal for measuring air quality throughout a person’s day no matter where they are. Actual exposure information is important because ambient standards are generally based on outdoor neighborhood scale exposures which are not representative of actual exposures for a majority of the population. This is especially true for reactive pollutants such as Ozone which typically have very different indoor and outdoor concentrations. Sensor accuracy and precision issues can be resolved with careful study design and collocation with regulatory monitors. Sensors are also likely to be better suited for many research applications where power and instrument environmental considerations can prohibit the use of a FEM or FRM. For instance, the newly installed near road NO2 monitors may provide a new opportunity to deploy low cost Ozone sensors at locations near NOx sources which can provide data that are useful for research at locations that are not well suited to regulatory monitoring.
B-25
5/30/14 Draft text for review and deliberations by the CASAC Air Monitoring and Methods Subcommittee -- Please Do not Cite or Quote --This draft is a work in progress, does not reflect consensus advice or recommendations, has not been
reviewed or approved by the chartered CASAC and does not represent EPA policy.
Dr. Philip Fine Charge Question 1. What is the AMMS view on adding an additional O3 FRM (as Appendix D-1 of the 40 CFR Part 50 Federal Regulation) for the purpose of establishing a new FRM that is implemented in analyzers currently in production status? This new O3 FRM will serve as an additional FRM to supplement the current Ethylene-Chemiluminescence method, which is no longer being produced or supported. Response: It is critically important that there be an ozone FRM that is commercially available from one or more manufacturers. Potential future ozone FEMs will need to demonstrate equivalency using an FRM, and the FRM should be readily available, affordable, and easy to use. Charge Question 2. What is the AMMS views on establishing the Nitric Oxide-Chemiluminescence (NO-CL) method (currently an FEM) as the new, additional O3 FRM? Response: Given the timeframe of the upcoming ozone NAAQs regulation, I can support the designation of this method as an FRM. However, if there is time to explore other methods that may have better performance, and look deeper into the source of error of the NO-CL comparison data, then perhaps other methods may emerge as better FRM candidates (See below). Charge Question 3. Do any other ozone measurement methods exist that the AMMS recommends for consideration of possible promulgation as a new (additional) O3 FRM? Response: While other methods are more prevalent in ambient networks (i.e the UV photometric ozone FEM) there may not be a pressing need for additional FRMs if the current one under consideration is approved. But as shown in the EPA presentation, the new UV scrubberless method may show better performance than the NO-CL method. If there is time to further test this new method and it proves superior to the NO-CL method, then I recommend strong consideration as an FRM instead of the NO-CL method. I don’t see a need for multiple new FRMs going forward, given that the FEM designation provides an adequate option for other regulatory monitoring methods. Charge Question 4. What is the AMMS views on the use of low-cost sensor technology to supplement regulatory ozone monitoring (i.e., in rural areas)? Response: Since the typical ozone measurement technologies are relatively expensive to operate, maintain, and calibrate, lower cost sensors for ozone or other ozone related-pollutants could prove very useful in assessing the spatial extent of ozone issues, especially in rural areas. However, before such technology is used for regulatory monitoring, or even as a supplement to regulatory monitoring, the sensor performance must be fully characterized in order to properly interpret the generated data. Sensor testing should include evaluations for accuracy, precision, interferences, sensitivity, longevity, drift, and calibration procedures.
B-26

5/30/14 Draft text for review and deliberations by the CASAC Air Monitoring and Methods Subcommittee -- Please Do not Cite or Quote --This draft is a work in progress, does not reflect consensus advice or recommendations, has not been
reviewed or approved by the chartered CASAC and does not represent EPA policy.
Dr. Philip Hopke Charge Question 3. Do any other ozone measurement methods exist that the AMMS recommends for consideration of possible promulgation as a new (additional) O3 FRM? Response: Light absorption There are systems based on light absorption that do not have the level of interference problems that exist in the current light absorbance FEM monitors. This commercially available system, the 2B Tech model 211, is described in their patent (Birks et al., 2013) and has been used by Ollison et al. (2014) and Johnson et al. (2014). It has a water vapor control system although that has not been well described in their literature. This system uses gas-phase scrubber technology with NO added to the sampled air to quantitatively react with ozone and remove it from the sample. A low concentration of NO is added to the sample to generate ozone-free, reference air. The light intensity is measured in the reference and sample modes with a dual beam optical system so that the concentration of ozone can be calculated directly from Beer's Law. Nitric oxide can be supplied from an external NO cylinder and will provide over a year of gas supply. Alternatively, nitric oxide can be generated inside the instrument using an optional photolytic NO generator through photolysis of nitrous oxide (N2O) that would also supplied by an external cylinder. They also have a moisture compensation system that removes any water issues. The prior versions of the 2B Tech ozone monitors had been given FEM status so this improved unit would appear to be a strong candidate to be an FRM. They have submitted the material needed to qualify the Model 211 as an FEM. In the data presented by EPA, the Model 211 provided a tighter fit to the ethylene chemiluminescence data than does the NO-CL system so in terms of being the best replacement for the current FRM, it represents superior performance relative to the proposed NO-CL system. The Birks et al. (2013) patent also includes bromine atoms as another gas phase ozone scrubber. Although normally one does not want to designate a patented technology as an FRM, this system does appear to provide a good system for ozone measurement that is worth consideration. Electrochemical An electrochemical ozone sensor uses a porous membrane that allows ozone gas to diffuse into a cell containing electrolyte and electrodes. When ozone comes into contact with the electrolyte, a change in electrochemical potential occurs between the electrodes causing electrons to flow. Korotcenkov and Cho (2012) provide a review of a major class of these sensors. In zero air, little or no electron flow occurs. As the presence of ozone increases, the electrical signal increases proportionally. The monitor interprets this signal and displays the ozone concentration in PPM (parts per million).
B-27

5/30/14 Draft text for review and deliberations by the CASAC Air Monitoring and Methods Subcommittee -- Please Do not Cite or Quote --This draft is a work in progress, does not reflect consensus advice or recommendations, has not been
reviewed or approved by the chartered CASAC and does not represent EPA policy.
Advantages Linear Response Good repeatability and accuracy Very quick response time - 1-2 Seconds Long battery life Can measure ozone accurately up to 20 ppm Moderate resistance to interference Disadvantages Humidity can affect sensor readings Sensitive to EMF/RFI Limited sensor life (often max of 12-18 months), even if in storage Decreased accuracy at low ozone levels (below 0.1 ppm) Semiconductor-Based Ozone Sensors: Heated Metal Oxide Sensor (HMOS)/Gas Sensitive Semiconductor (GSS) A heated metal oxide semiconductor (HMOS) sensor works by heating a small substrate to high temperature (around 300-deg F / 149-deg C). At this temperature, the substrate is very sensitive to ozone and exhibits a change in resistance that is proportional to the amount of ozone which contacts its surface. The circuitry of the monitor interprets this change in resistance and displays the corresponding ozone level on the display as either PPM or PPB. Advantages Very responsive to low levels of ozone (below 0.1 ppm) Least expensive monitoring technology Excellent repeatability and accuracy Long Sensor Life if stored properly Disadvantages Slow start-up (can require 8-24 hours warm-up time) Slower response time to ozone (compared to electrochemical) Very sensitive to interference Shorter battery life due to heated sensor element Not linear at ozone levels above 1 ppm Max. Temperature threshold of 122F or less (depending on model) It is not clear that either electrochemical or semiconductor sensors would be suitable for long term monitoring applications such as is needed for an FRM.
B-28

5/30/14 Draft text for review and deliberations by the CASAC Air Monitoring and Methods Subcommittee -- Please Do not Cite or Quote --This draft is a work in progress, does not reflect consensus advice or recommendations, has not been
reviewed or approved by the chartered CASAC and does not represent EPA policy.
References Birks, J.W., Anderson, C., Williford, J. (2013) Ozone Monitor with Gas-Phase Ozone Scrubber, Patent No.: US 8,395,776 B2. Johnson, T., Capel. J., Ollison, W. (2014) Measurement of microenvironmental ozone concentrations in Durham, North Carolina, using a 2B Technologies 205 Federal Equivalent Method monitor and an interference-free 2B Technologies 211 monitor, Journal of the Air & Waste Management Association, 64:360-371. Korotcenkov, G., Cho, B.K. (2012) Ozone measuring: What can limit application of SnO2-based conductometric gas sensors? Sensors and Actuators B: Chemical 161:28–44. Ollison, W.M., Crow, W., Spicer, C.W. (2014) Field testing of new-technology ambient air ozone monitors, Journal of the Air & Waste Management Association, 64: 855-863.
B-29

5/30/14 Draft text for review and deliberations by the CASAC Air Monitoring and Methods Subcommittee -- Please Do not Cite or Quote --This draft is a work in progress, does not reflect consensus advice or recommendations, has not been
reviewed or approved by the chartered CASAC and does not represent EPA policy.
Dr. Rudolf Husar Charge Question 1. What is the AMMS view on adding an additional O3 FRM (as Appendix D-1 of the 40 CFR Part 50 Federal Regulation) for the purpose of establishing a new FRM that is implemented in analyzers currently in production status? This new O3 FRM will serve as an additional FRM to supplement the current Ethylene-Chemiluminescence method, which is no longer being produced or supported. Initial Response to Charge Question 1: Overall View on Adding an Additional O3 FRM Adding the NO-CL O3 monitor as additional FRM instrument is necessary, sound and timely. The necessity arises from the fact that the aging ozone monitors need to be replaced or augmented in the regulatory monitoring network. Since the current Ethylene-based CL O3 monitors are not available (not manufactured) an additional FRM monitor is a necessity. The choice of the NO-CL O3 monitor is sound for the reasons stated by EPA: (1) It is based on the same sensing principle; (2) the data quality and operational performance is similar to the current FRM and (3) the instrument has already been approved and in use as an FEM for Ozone. Also, the chemiluminescence method has been in use since the mid 1960s. Assuring high quality and extensive O3 monitoring with the additional O3 FRM is also timely from regulatory perspective. Currently, O3 and PM2.5 are the key pollutants that are in need for significant regulatory actions. Over the recent decade, the US PM2.5 concentrations have declined dramatically and approaching the ‘natural conditions’ in many regions of the US. However, ozone remains to be a more persistent pollutant and health hazard. Intense O3 monitoring is necessary for enforcing NAAQS, for the determination of the human-‘natural’ contributions to the ambient O3 as well as the identification of the diverse and uncertain sources of the secondary O3 pollutant.
B-30

5/30/14 Draft text for review and deliberations by the CASAC Air Monitoring and Methods Subcommittee -- Please Do not Cite or Quote --This draft is a work in progress, does not reflect consensus advice or recommendations, has not been
reviewed or approved by the chartered CASAC and does not represent EPA policy.
Dr. Peter H. McMurry I have read all of the materials that Ed Hanlon attached with his earlier emails. My Background: I have not personally carried out ambient O3 measurements in recent years, but have previously used ethylene-O3 Chemiluminscence and UV absorption instruments for measuring O3 in the atmosphere and in laboratory studies. I do not have any personal experience with the proposed O3-NO Chemiluminescence FRM. Charge Question 1. What is the AMMS view on adding an additional O3 FRM (as Appendix D-1 of the 40 CFR Part 50 Federal Regulation) for the purpose of establishing a new FRM that is implemented in analyzers currently in production status? This new O3 FRM will serve as an additional FRM to supplement the current Ethylene-Chemiluminescence method, which is no longer being produced or supported. My Response to Charge Question 1: Given that: - O3 is a criteria pollutant; - ethylene-O3 Chemiluminscence method is the only existing FRM for O3; - a commercial ethylene-O3 Chemiluminscence instrument has not been available for 20 years; it seems clear to me that there is a need for either (i) a commercial version of an ethylene-O3 chemiluminescence instrument or (ii) a new FRM based on a different measurement principle. If a new FRM is to be adopted, factors that must be considered include availability, reliability, capital cost, operating cost, sensitivity, and accuracy (including potential interferences). Also, side-by-side measurements of O3 with instruments based on the new FRM and the current ethylene-O3 chemiluminescence FRM should be made in diverse environments and in all seasons to document the existence and magnitudes of any potential biases.
B-31

5/30/14 Draft text for review and deliberations by the CASAC Air Monitoring and Methods Subcommittee -- Please Do not Cite or Quote --This draft is a work in progress, does not reflect consensus advice or recommendations, has not been
reviewed or approved by the chartered CASAC and does not represent EPA policy.
Dr. Allen Robinson Charge Question 1: What is the AMMS view on adding an additional O3 FRM (as Appendix D-1 of the 40 CFR Part 50 Federal Regulation) for the purpose of establishing a new FRM that is implemented in analyzers currently in production status? This new O3 FRM will serve as an additional FRM to supplement the current Ethylene-Chemiluminescence method, which is no longer being produced or supported. Response: Given the lack of commercial availability of existing O3 FRM it seems important that the EPA establish commercially available O3 FRM. It is not clear how EPA can meet the requirements of NAAQS certification without a commercially available O3 FRM. Charge Question 2: What is the AMMS views on establishing the Nitric Oxide-Chemiluminescence (NO-CL) method (currently an FEM) as the new, additional O3 FRM? Response: The approach seems reasonable. The NO chemiluminescence instrument runs on the reaction NO + O3 --> NO2* NO2* --> NO2 + hnu Ordinarily such an instrument runs with a lot of O3 to as to completely react away the NO. So, I presume that what is being planned is to run an NO chemiluminesence instrument with a large excess of NO, so that the species being quantitatively titrated is O3 and not NO. If so, there is no immediate reason to regard it as less accurate than the NO instrument, and the calibration should transfer. Therefore this seems suitable as an FRM method. Charge Question 3: Do any other ozone measurement methods exist that the AMMS recommends for consideration of possible promulgation as a new (additional) O3 FRM? Response: No immediate suggestions come to mind.
B-32

5/30/14 Draft text for review and deliberations by the CASAC Air Monitoring and Methods Subcommittee -- Please Do not Cite or Quote --This draft is a work in progress, does not reflect consensus advice or recommendations, has not been
reviewed or approved by the chartered CASAC and does not represent EPA policy.
Charge Question 4: Guidance/Opinion on Emerging Measurement Methodologies: What is the AMMS views on the use of low-cost sensor technology to supplement regulatory ozone monitoring (i.e., in rural areas)? Response: A low cost-sensor is potentially attractive to enhance the O3 monitoring network. The key question is performance. These lower cost sensors do not have the performance of the more expensive FRM type sensors. Therefore EPA needs to carefully think about and clearly specify the required performance specifications. This seems especially important in more rural areas which may have lower O3 levels, which may require improved performance. One can overcome some of the performance limitations of an individual sensor by deploying networks, but that will erode some of the cost savings.
B-33

5/30/14 Draft text for review and deliberations by the CASAC Air Monitoring and Methods Subcommittee -- Please Do not Cite or Quote --This draft is a work in progress, does not reflect consensus advice or recommendations, has not been
reviewed or approved by the chartered CASAC and does not represent EPA policy.
Dr. Armistead (Ted) Russell Charge Question 1. What is the AMMS view on adding an additional O3 FRM (as Appendix D-1 of the 40 CFR Part 50 Federal Regulation) for the purpose of establishing a new FRM that is implemented in analyzers currently in production status? This new O3 FRM will serve as an additional FRM to supplement the current Ethylene-Chemiluminescence method, which is no longer being produced or supported. Response: It is perfectly reasonable to move away from the ethylene chemiluminescent method given the circumstances as an FRM, and to a new method. It is not apparent why one should continue to include the old method and as an FRM except for continuity, or if there are no downsides to continue its inclusion. Charge Question 2: What is the AMMS views on establishing the Nitric Oxide-Chemiluminescence (NO-CL) method (currently an FEM) as the new, additional O3 FRM? Response: This makes sense. Though, as noted below, it might be good to consider additional sensors as well. One question I would have is if the proposed approach includes the best methods to minimize the impact of artifacts and biases. Charge Question 3: Do any other ozone measurement methods exist that the AMMS recommends for consideration of possible promulgation as a new (additional) O3 FRM? Response: Given the widespread, and apparently successful, use of the UV-photometric instruments, why not consider that as an FRM? If I recall correctly, in past deliberations, we have recommended performance-based criteria for FRM status. On the other hand, if it continues as an FEM, and there are no major limitations to its use in regulatory monitoring relative to an FRM, it may not be worth making it an FRM as well. Charge Question 4: What is the AMMS views on the use of low-cost sensor technology to supplement regulatory ozone monitoring (i.e., in rural areas)? Response: The main question here is what will be the purpose of these low cost sensors? Ozone is rather homogeneously distributed geographically, so there is actually less need to monitor in as many locations as some other pollutants. Thus, the need for low cost (and likely less accurate) sensors is diminished. However, that should not be construed as saying they should not be used in such an application when one can show that the combination of cost, power requirements,, accuracy, and other factors lead one to choose a low cost sensor. More specifically, EPA should not come out against using low cost sensors in applications where they might provide some benefits. However, unless their performance is proven to justify it, they should not be used in regulatory monitoring as it is not apparent that they can provide better estimates of the local concentrations than other methods involving some sort of spatial-temporal mapping and more accurate ozone monitors. The continued development of low cost sensors is strongly supported for other purposes, e.g., personal monitoring.
B-34

5/30/14 Draft text for review and deliberations by the CASAC Air Monitoring and Methods Subcommittee -- Please Do not Cite or Quote --This draft is a work in progress, does not reflect consensus advice or recommendations, has not been
reviewed or approved by the chartered CASAC and does not represent EPA policy.
5. Comments on the additional data provided by ORD. The additional data provided by ORD provide further support for the designation of NO-CL as an FRM.
B-35

5/30/14 Draft text for review and deliberations by the CASAC Air Monitoring and Methods Subcommittee -- Please Do not Cite or Quote --This draft is a work in progress, does not reflect consensus advice or recommendations, has not been
reviewed or approved by the chartered CASAC and does not represent EPA policy.
Dr. Jay Turner Charge Question 1. What is the AMMS view on adding an additional O3 FRM (as Appendix D-1 of the 40 CFR Part 50 Federal Regulation) for the purpose of establishing a new FRM that is implemented in analyzers currently in production status? This new O3 FRM will serve as an additional FRM to supplement the current Ethylene-Chemiluminescence method, which is no longer being produced or supported. Response: The proposal to establish an additional O3 FRM is strongly supported. As clearly articulated in the supporting materials provided to the committee, instruments that conform to the existing FRM method are no longer commercially available. While it might seem convoluted to keep the obsolete FRM (Ethylene-Chemiluminescence method), the point was made that existing FEM designations were made by benchmarking against the Ethylene-Chemiluminescence method and thus it would be necessary to redesignate all of the existing FEM methods if the existing FRM was revoked. While revocation of the existing FRM would be a cleaner approach, the effort needed to redesignate the existing FRM methods is understandably difficult to justify. Charge Question 2: What is the AMMS views on establishing the Nitric Oxide-Chemiluminescence (NO-CL) method (currently an FEM) as the new, additional O3 FRM? Response: As discussed by the committee on April 3, the EPA performance evaluation (presentation materials from Russell Long et al.) demonstrates the Nitric Oxide-Chemiluminescence (NO-CL) method fared well in the laboratory evaluation (slide 9). The field data evaluated to date (slides 6-7) demonstrate small bias but considerable scatter between the methods for hourly data. The evaluation is a work in progress and I look forward to the completed ambient evaluation (e.g. the summer 2014 study in Denver). Additional statistical measures of the scatter in the field evaluations data would be helpful. Scattergrams were provided for hourly data and it would be helpful to see the results for 8-hour average data. I presume the regressions in the evaluations are ordinary least squares (OLS) regressions. If so, the FRM measurement is being treated as absolute (no error) and it might be preferred to also use approaches that consider error in both the FRM and candidate measurements. Deming regression and orthogonal regression are examples of suitable approaches and the lead discussant for this charge question (Eric Edgerton) has previously published on their use. Regardless, confidence intervals should be provided for the regression slopes and intercepts. Charge Question 3: Do any other ozone measurement methods exist that the AMMS recommends for consideration of possible promulgation as a new (additional) O3 FRM? Response: The UV method scrubberless ozone monitor (UV-SL) laboratory and field data appear quite promising. Based on the laboratory evaluation (slide 12), water vapor remains an interferent but at ~0.2 ppb equivalent is well below the current and proposed 40 CFR Part 53 specifications. Caution should be used when comparing the field data for the NO-CL and UV-SL methods because they are presumably from different evaluations and thus different environmental conditions. That stated, the UV-SL versus FRM data (slide 11) exhibit less scatter, comparable slopes, but a larger intercept than the
B-36

5/30/14 Draft text for review and deliberations by the CASAC Air Monitoring and Methods Subcommittee -- Please Do not Cite or Quote --This draft is a work in progress, does not reflect consensus advice or recommendations, has not been
reviewed or approved by the chartered CASAC and does not represent EPA policy.
NO-CL versus FRM data (slide 6-7). At this point it is not clear whether the NO-CL or UV-SL method would be the preferred FRM. Charge Question 4: What is the AMMS views on the use of low-cost sensor technology to supplement regulatory ozone monitoring (i.e., in rural areas)? Response: There is currently some activity to develop low-cost O3 sensor technologies. While they might not meet the specifications of an FEM, they could play a vital role if their performance is adequately evaluated. Next generation sensors for O3 were showcased at the EPA-sponsored Air Sensors 2013 Workshop and are briefly discussed in a recent paper by Piedrahita et al. (Atmos. Meas. Tech. Discuss., 7, 2425–2457, 2014).
B-37

5/30/14 Draft text for review and deliberations by the CASAC Air Monitoring and Methods Subcommittee -- Please Do not Cite or Quote --This draft is a work in progress, does not reflect consensus advice or recommendations, has not been
reviewed or approved by the chartered CASAC and does not represent EPA policy.
Dr. Yousheng Zeng In review of the materials provided to the AMMS committee members and the current FRM for ozone (Appendix D to 40 CFR 50), some observations are made that have influenced my comments. These observations are first discussed below, and they are followed by my comments. Observations:
1. Although this rulemaking effort is presented as adding the NO-CL as a new FRM for ozone, the draft rule (proposed Appendix D-1 to 40 CFR 50) has little to do with NO-CL. Other than mentioning the name of the method (NO-CL) in the beginning of the proposed Appendix D-1, there is no technical substance specific to the NO-CL measurement method. The technical substance is about how to accurately generate ozone standard for calibration of the NO-CL analyzer.
2. Similarly the existing FRM for ozone (Appendix D to 40 CFR 50) only mentions the ethylene-CL method in the beginning, and the rest of FRM is about how to accurately generate ozone standard to calibrate the ethylene-CL analyzer.
3. The core technical substance (i.e., procedures to generate calibration standard) of the existing FRM and the proposed new FRM is essentially same. The difference is that the proposed new FRM includes Sections 1 (Applicability), 2 (Principle), 3 (Interferences), and 5 (Frequency of Calibrations). These new sections do not add technical specifications to the reference method.
My Comments: Based on the above observations, I do not see a need to re-designate the current FRM as Appendix D-2 and add a new FRM as Appendix D-1. Instead, it makes more sense to revise the current FRM and keep it in current designation of Appendix D, i.e., maintain only one FRM and keep it in Appendix D. The revisions will include:
1. Adding Section 1 (Applicability). However, do not limit it to the NO-CL method. Make it applicable to the ethylene-CL method, NO-CL method, or other methods that meet the requirements of this FRM and quality assurance procedures and guidance provided in 40 CFR 58.
2. Adding Section 2 (Principle) as proposed except removing Subsection 2.1 (or making it more generic and not limiting to NO-CL), and making Subsections 2.3 and 2.4 more generic and not limiting to NO-CL.
3. Adding Section 3 (Interferences) as proposed except making it more generic and not limiting to NO-CL.
4. Adding Section 5 (Frequency of Calibration) as proposed. Ambient ozone monitoring methods (either current ethylene-CL FRM or proposed NO-CL FRM) consists of two parts, the analyzer and the calibration procedures that generate the standard. The analyzer part is method specific, i.e., either ethylene-CL or NO-CL. The calibration procedures are independent of the analyzers, and can be applicable to either analyzers (or even future new analyzers as long as they can pass the calibration procedures and quality assurance procedures). The focus of both the existing FRM and the proposed new FRM is the calibration procedures, which are independent of analyzers. The calibration procedures are essentially same. Why do we want to have two FRM’s?
B-38

5/30/14 Draft text for review and deliberations by the CASAC Air Monitoring and Methods Subcommittee -- Please Do not Cite or Quote --This draft is a work in progress, does not reflect consensus advice or recommendations, has not been
reviewed or approved by the chartered CASAC and does not represent EPA policy.
The advantages of revising the current FRM to allow both ethylene-CL and NO-CL based analyzer include:
1. Avoid unnecessary regulations. 2. The FRM for ozone will be more streamlined. It resolves the issue associated with obsolete
ethylene-CL based analyzers and related legacy issues. At same time, it achieves the objective of promoting the NO-CL based method to the FRM status. It will be less disruptive to operations of monitoring agencies because this is what they have been doing for many years as FEM. It will be designated as FRM without significant substantive changes.
3. If worded properly, it may also allow other methods, including emerging methods, to be qualified as FRM, making the rule more adaptive for technological advancement.
If the EPA wants to promulgate a new FRM that is truly specific to the NO-CL method, it should significantly expand the technical content of the FRM to include
• Specific descriptions of the NO-CL method, making it distinguishable from the ethylene-CL method in Appendix D-2 (which also means that Appendix D-2 needs to be expanded in the same fashion), and
• Typical specifications for an analyzer such as detection limit, linearity range, precision, accuracy, zero and calibration drift, response time, etc.
Considering the fact that the existing FRM had worked well in decades without specificity regarding the analyzer part of the method, I am not advocating the approach of expanding the FRM to include the specific descriptions of the NO-CL method and analyzer-oriented specifications. What I am advocating is what I stated earlier, i.e., keep one FRM and list both ethylene-CL and NO-CL methods in the FRM. During the April 3, 2014 AMMS public teleconference, several AMMS members expressed favorable opinions on the UV method, and some AMMS members expressed concerns on the NO-CL method. Based on the final outcome of the AMMS deliberation and consensus and the EPA’s position, if the UV method is considered as FRM in addition to the NO-CL method, my recommendation to the EPA is to keep one FRM and list all three methods (ethylene-CL, NO-CL, and UV methods) in the FRM. If the outcome is to use the UV method instead of the NO-CL method, then the EPA can keep one FRM and list two methods (ethylene-CL and UV methods) in the FRM.
B-39

5/30/14 Draft text for review and deliberations by the CASAC Air Monitoring and Methods Subcommittee -- Please Do not Cite or Quote --This draft is a work in progress, does not reflect consensus advice or recommendations, has not been
reviewed or approved by the chartered CASAC and does not represent EPA policy.
Attachment A: Environmental Technology Verification Report: JSC Optec 3.02 P-A Chemiluminescent Ozone Analyzer
Attachment to Comments from Dr. Kenneth Demerjian: U.S. Environmental Protection Agency. Environmental Technology Verification Report: JSC Optec 3.02 P-A Chemiluminescent Ozone Analyzer. Prepared by Battelle, through Cooperative Agreement with USEPA. February 2008.
B-40

February 2008
Environmental Technology Verification Report JSC OPTEC 3.02 P-A CHEMILUMINESCENT OZONE ANALYZER
Prepared by Battelle
Under a cooperative agreement with
U.S. Environmental Protection Agency
5/30/14 Draft text for review by CASAC AMMS - Do not Cite or Quote -This draft does not reflect consensus advice and does not represent EPA policy.

February 2008
Environmental Technology Verification Report
ETV Advanced Monitoring Systems Center
JSC OPTEC 3.02 P-A
CHEMILUMINESCENT OZONE ANALYZER
By
Patricia Holowecky Thomas Kelly
Zachary Willenberg Amy Dindal
Battelle Columbus, Ohio 43201
5/30/14 Draft text for review by CASAC AMMS - Do not Cite or Quote -This draft does not reflect consensus advice and does not represent EPA policy.

Notice
The U.S. Environmental Protection Agency (EPA), through its Office of Research and Development, has financially supported and collaborated in the extramural program described here. This document has been peer reviewed by the Agency. Mention of trade names or commercial products does not constitute endorsement or recommendation by the EPA for use.
5/30/14 Draft text for review by CASAC AMMS - Do not Cite or Quote -This draft does not reflect consensus advice and does not represent EPA policy.

Foreword
The U.S. Environmental Protection Agency (EPA) is charged by Congress with protecting the nation’s air, water, and land resources. Under a mandate of national environmental laws, the Agency strives to formulate and implement actions leading to a compatible balance between human activities and the ability of natural systems to support and nurture life. To meet this mandate, the EPA’s Office of Research and Development provides data and science support that can be used to solve environmental problems and to build the scientific knowledge base needed to manage our ecological resources wisely, to understand how pollutants affect our health, and to prevent or reduce environmental risks. The Environmental Technology Verification (ETV) Program has been established by the EPA to verify the performance characteristics of innovative environmental technology across all media and to report this objective information to permitters, buyers, and users of the technology, thus substantially accelerating the entrance of new environmental technologies into the marketplace. Verification organizations oversee and report verification activities based on testing and quality assurance protocols developed with input from major stakeholders and customer groups associated with the technology area. ETV consists of five environmental technology centers. Information about each of these centers can be found on the Internet at http://www.epa.gov/etv/. Effective verifications of monitoring technologies are needed to assess environmental quality and to supply cost and performance data to select the most appropriate technology for that assessment. Under a cooperative agreement, Battelle has received EPA funding to plan, coordinate, and conduct such verification tests for “Advanced Monitoring Systems for Air, Water, and Soil” and report the results to the community at large. Information concerning this specific environmental technology area can be found on the Internet at http://www.epa.gov/etv/ centers/center1.html.
5/30/14 Draft text for review by CASAC AMMS - Do not Cite or Quote -This draft does not reflect consensus advice and does not represent EPA policy.

Acknowledgments
The authors wish to acknowledge the support of all those who helped plan and conduct the verification test, analyze the data, and prepare this report. We particularly thank Will Ollison of the American Petroleum Institute, Rudy Eden of the South Coast Air Quality Management District, and Dennis Mikel of U.S. EPA’s Office of Air Quality Planning and Standards for their reviews of this verification report.
5/30/14 Draft text for review by CASAC AMMS - Do not Cite or Quote -This draft does not reflect consensus advice and does not represent EPA policy.

Contents
Page
Notice.............................................................................................................................................. ii
Foreword ........................................................................................................................................ iii
Acknowledgments.......................................................................................................................... iv
List of Abbreviations and Acronyms............................................................................................ vii
Chapter 1 Background ................................................................................................................... 1
Chapter 2 Technology Description ................................................................................................ 2
Chapter 3 Test Design and Procedures .......................................................................................... 4 3.1 Introduction...........................................................................................................................4 3.2 Test Procedures.....................................................................................................................5
3.2.1 Accuracy ................................................................................................................... 5 3.2.2 Linearity.................................................................................................................... 5 3.2.3 Interference Effects................................................................................................... 6 3.2.4 Comparability ........................................................................................................... 7 3.2.5 Data Completeness.................................................................................................... 7 3.2.6 Operational Factors................................................................................................... 7
3.3 Reference Methods ...............................................................................................................8 3.4 Verification Schedule ...........................................................................................................8
Chapter 4 Quality Assurance/Quality Control............................................................................... 9 4.1 Equipment Calibrations ........................................................................................................9 4.2 Audits....................................................................................................................................9
4.2.1 Performance Evaluation Audit.................................................................................. 9 4.2.2 Technical Systems Audit ........................................................................................ 10 4.2.3 Audit of Data Quality.............................................................................................. 10
4.3 QA/QC Reporting ...............................................................................................................10 4.4 Data Review........................................................................................................................11
Chapter 5 Statistical Methods ...................................................................................................... 12 5.1 Accuracy .............................................................................................................................12 5.2 Linearity..............................................................................................................................12 5.3 Interference Effects.............................................................................................................12 5.4 Comparability .....................................................................................................................13 5.5 Data Completeness .............................................................................................................13
Chapter 6 Test Results ................................................................................................................. 14
5/30/14 Draft text for review by CASAC AMMS - Do not Cite or Quote -This draft does not reflect consensus advice and does not represent EPA policy.

6.1 Accuracy .............................................................................................................................14 6.2 Linearity..............................................................................................................................16 6.3 Interference Effects.............................................................................................................18 6.4 Comparability .....................................................................................................................21 6.5 Data Completeness .............................................................................................................25 6.6 Operational Factors.............................................................................................................26
Chapter 7 Performance Summary................................................................................................ 27
Chapter 8 References ................................................................................................................... 29
Figures
Figure 4-1. Performance Audit of Battelle’s Dasibi 1008 UV Photometer................................. 10 Figure 6-1. Linearity of 3.02 P-A Response to Ozone in Chamber at High Humidity ............... 17 Figure 6-2. Linearity of 3.02 P-A Response to Ozone in Chamber at Low Humidity ................ 17 Figure 6-3. 3.02 P-A Response to Interferents in Chamber at Low Humidity ............................ 18 Figure 6-4. 3.02 P-A Response to Interferents in Chamber at High Humidity ........................... 19 Figure 6-5. Photochemical Interferent Test with High Precursor Concentrations....................... 20 Figure 6-6. Photochemical Interferent Test with Low Precursor Concentrations ....................... 20 Figure 6-7. 3.02 P-A Response to Ozone During Photochemical Test with High Precursor Concentrations ............................................................................................................................. 21 Figure 6-8. Photochemical Ozone Comparison with High Precursor Concentrations ................ 22 Figure 6-9. 3.02 P-A Response to Ozone During Photochemical Test with Low Precursor Concentrations ............................................................................................................................. 22 Figure 6-10. Photochemical Ozone Comparison with Low Precursor Concentrations ............... 23 Figure 6-11. 3.02 P-A and FEM Ambient Monitoring Results ................................................... 24 Figure 6-12. Linear Regression of 3.02 P-A and FEM Data During Ambient Monitoring......... 25
Tables
Table 3-1. Interference Testing Conditions ................................................................................... 6 Table 3-2. Photochemical Chamber Testing Conditions ............................................................... 7 Table 3-3. Test Activities During the Optec 3.02 P-A Verification Test ...................................... 8 Table 6-1. Percent Recoveries Relative to the Ozone Standard Concentrations ......................... 14 Table 6-2. Percent Recoveries of Ozone from High Humidity (70 to 80% RH) Chamber Tests on June 13, 2007 ............................................................................................................................... 15 Table 6-3. Percent Recoveries of Ozone from Low Humidity (<5% RH) Chamber Tests on June 14, 2007 ............................................................................................................................... 16 Table 6-4. Optec 3.02 P-A Testing Activities June 12 to 28, 2007 ............................................. 26
5/30/14 Draft text for review by CASAC AMMS - Do not Cite or Quote -This draft does not reflect consensus advice and does not represent EPA policy.

List of Abbreviations and Acronyms
AMS Advanced Monitoring Systems °C Degrees Celsius COA Chemiluminescent Ozone Analyzer cm3 Cubic centimeter EPA U.S. Environmental Protection Agency ETV Environmental Technology Verification FEM Federal Equivalent Method GC Gas chromatograph MSD Mass selective detector m3 Cubic meter μg/m3 Microgram per cubic meter µm Micrometer nm Nanometer NO2 Nitrogen dioxide O3 Ozone OEPA Ohio Environmental Protection Agency ppbC Parts per billion carbon ppbv Parts per billion by volume ppmv Parts per million by volume pptv Parts per trillion by volume %R Percent recovery RPD Relative percent difference %RR Percent relative response PE Performance evaluation QA Quality assurance QC Quality control QMP Quality Management Plan r2 Coefficient of determination RH Relative Humidity TSA Technical systems audit UV Ultraviolet VOC Volatile organic compounds V Volt
5/30/14 Draft text for review by CASAC AMMS - Do not Cite or Quote -This draft does not reflect consensus advice and does not represent EPA policy.

Chapter 1 Background
The U.S. EPA’s Environmental Technology Verification (ETV) Program verifies the performance of innovative technologies that have the potential to improve protection of human health and the environment. ETV accelerates the entrance of new environmental technologies into the domestic and international marketplaces. Verified technologies are included for all environmental media–air, water, and land. ETV works in partnership with recognized testing organizations; with stakeholder groups consisting of buyers, vendor organizations, and permitters; and with the full participation of individual technology developers. The program evaluates the performance of innovative technologies by developing test plans that are responsive to the needs of stakeholders, conducting field or laboratory tests (as appropriate), collecting and analyzing data, and preparing peer-reviewed reports. All evaluations are conducted in accordance with rigorous quality assurance (QA) protocols to ensure that data of known and adequate quality are generated and that the results are defensible. The U.S. EPA’s National Exposure Research Laboratory and its verification organization partner, Battelle, operate the Advanced Monitoring Systems (AMS) Center under ETV. The AMS Center verifies the performance of commercial-ready technologies that monitor contaminants and natural species in air, water, and soil. The center tests both field-portable and stationary monitors, as well as innovative technologies that can be used to describe the environment (site characterization). The AMS Center recently evaluated the performance of the JSC Optec Inc. 3.02 P-A chemiluminescent ozone analyzer (COA), a continuous monitor for determining ozone (O3) in air.
5/30/14 Draft text for review by CASAC AMMS - Do not Cite or Quote -This draft does not reflect consensus advice and does not represent EPA policy.
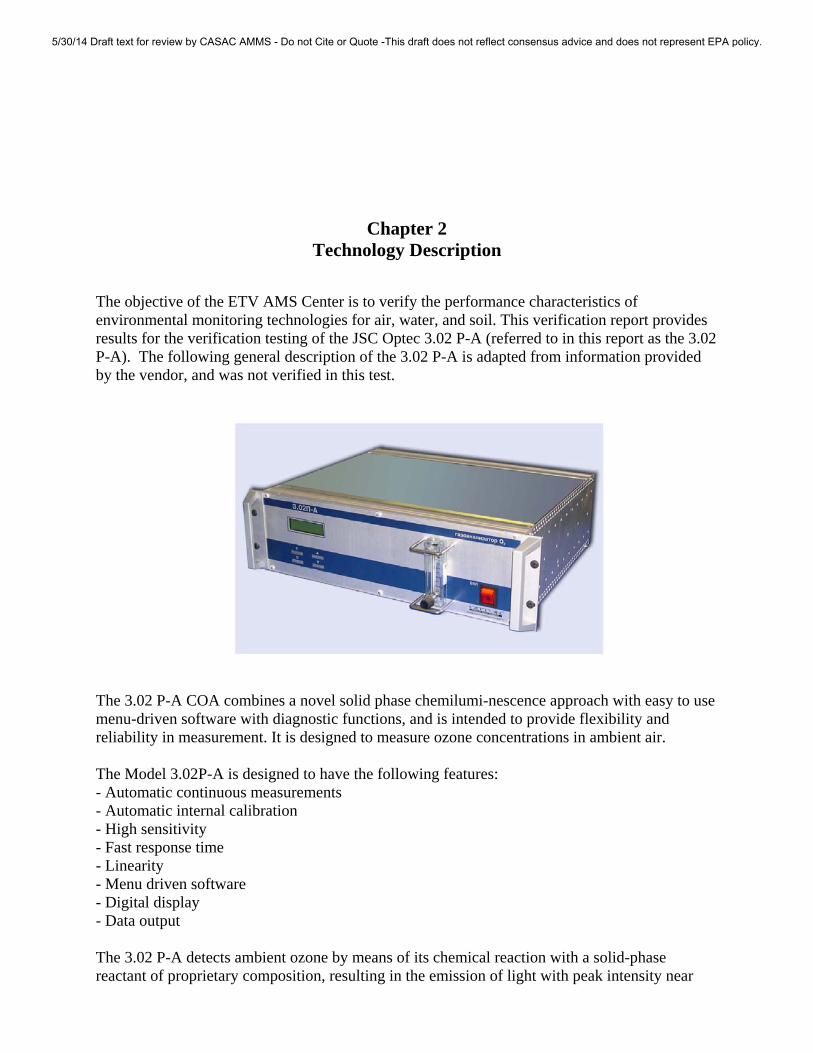
Chapter 2 Technology Description
The objective of the ETV AMS Center is to verify the performance characteristics of environmental monitoring technologies for air, water, and soil. This verification report provides results for the verification testing of the JSC Optec 3.02 P-A (referred to in this report as the 3.02 P-A). The following general description of the 3.02 P-A is adapted from information provided by the vendor, and was not verified in this test.
The 3.02 P-A COA combines a novel solid phase chemilumi-nescence approach with easy to use menu-driven software with diagnostic functions, and is intended to provide flexibility and reliability in measurement. It is designed to measure ozone concentrations in ambient air. The Model 3.02P-A is designed to have the following features: - Automatic continuous measurements - Automatic internal calibration - High sensitivity - Fast response time - Linearity - Menu driven software - Digital display - Data output The 3.02 P-A detects ambient ozone by means of its chemical reaction with a solid-phase reactant of proprietary composition, resulting in the emission of light with peak intensity near
5/30/14 Draft text for review by CASAC AMMS - Do not Cite or Quote -This draft does not reflect consensus advice and does not represent EPA policy.

560 nm wavelength. The emitted light is detected by a photomultiplier tube, and converted to a digital signal that is linearly proportional to the gaseous ozone concentration. An internal pump draws sample air through two alternating flow paths: in the measurement path sample air passes directly into contact with the solid-phase reactant, whereas in the zeroing path ozone in the sample air is removed by a selective scrubber element before the air contacts the reactant. The 3.02 P-A thus measures ozone by comparison of the signals from these two paths. An internal ozone generator (ultraviolet (UV) lamp), located in the zeroing path downstream of the selective scrubber element, provides a calibration mixture to the 3.02 P-A at 10-minute intervals, and the internal software automatically adjusts instrument response with each calibration. The measured ozone concentration is displayed on the front panel of the 3.02 P-A and can be transmitted via analog outputs. The estimated price of the base model analyzer is $5,000.
5/30/14 Draft text for review by CASAC AMMS - Do not Cite or Quote -This draft does not reflect consensus advice and does not represent EPA policy.

Chapter 3 Test Design and Procedures
3.1 Introduction
This verification test was conducted according to procedures specified in the peer-reviewed Test/QA Plan for Verification of Chemiluminescent Ozone Analyzer,(1) and was carried out at Battelle laboratories in Columbus, Ohio from June 12 to June 28, 2007. The objective of this verification test was to evaluate the performance of the Optec 3.02 P-A, in part by comparing it to the response of the UV-absorption Federal Equivalent Method (FEM) for ozone. FEMs are established by EPA to assure high quality in ambient air monitoring data. The UV-absorption FEM for ozone is the method used for virtually all ambient ozone monitoring in the U.S. The specific commercial FEM monitor used in this test was the Thermo Environmental Model 49C (method EQOA-0880-047).(2) The COA was verified by evaluating the following parameters: • Accuracy • Linearity • Interference effects • Comparability • Data completeness • Operational factors such as ease of use, maintenance and data output needs, power and other
consumables used, reliability, and operational costs. Accuracy was determined by assessing the percent recovery of the 3.02 P-A with respect to different levels of ozone challenges. Linearity was assessed by a linear regression analysis using the ozone challenge concentration as the independent variable and the results from the 3.02 P-A as the dependent variable. The interference effects were calculated in terms of the ratio of the response when challenged with the interferent, to the actual concentration of the interferent. Comparability was assessed by comparing the 3.02 P-A response to that of the FEM in selected tests. Data completeness was assessed as the percentage of maximum data return achieved by the 3.02 P-A over the test period. Operational factors were evaluated by means of observations during testing and records of needed maintenance, vendor activities, and expendables use.
5/30/14 Draft text for review by CASAC AMMS - Do not Cite or Quote -This draft does not reflect consensus advice and does not represent EPA policy.

3.2 Test Procedures
Prior to testing Battelle staff were trained in operation of the 3.02 P-A by the vendor. This training included studying the instrument manual, which had been translated into English from the original Russian.(3) All test procedures were conducted using two units of the 3.02 P-A. One unit was operated exactly as recommended by the manufacturer. Results from that unit are the primary focus of this verification. In addition, a second unit was operated with a Nafion humidifier tube (obtained from 2B Technologies, Inc.) connected to the analyzer’s air inlet. This Nafion tube is designed to equilibrate the humidity of the incoming sample stream with that of the room air in the test laboratory (i.e., about 50% relative humidity (RH)). However the Nafion modification was not optimized to the 3.02 P-A unit so complete equilibration of humidity was probably not achieved at the sample flow rate of the 3.02 P-A (i.e., 1.8 L/min). Thus the RH of the sample air entering the first 3.02 P-A unit varied with test conditions, as described below, whereas that for the second unit was equilibrated towards 50% RH. The Nafion tube was used to assess the impact of humidity and humidity control on the 3.02 P-A response. The 3.02 P-A specifications accept a humidity range for continuous operation of 15 to 95% RH. However, EPA data quality protocols for routine ambient monitoring generally require clean dry air for calibrations and daily zero and span checks. The Nafion attachment provides a means to mitigate the effects of humidity extremes. As a result, testing with the unmodified 3.02 P-A unit at low relative humidity and with the second unit modified by addition of the Nafion attachment provided information relevant to routine use of the 3.02 P-A. Following are the test procedures used to evaluate the 3.02 P-A.
3.2.1 Accuracy
The accuracy of the 3.02 P-A was evaluated by two approaches. One approach determined the degree of agreement with ozone standards produced at 100 to 300 parts per billion by volume (ppbv) in dry zero air by an Environics Model 6400 ozone generator that was quantified by a Dasibi 1008 UV photometer, itself validated by a performance audit, as described in section 4.2.1. The delivered concentrations of ozone, once shown to be stable by the Dasibi 1008 UV photometer, were monitored by the 3.02 P-A unit for 3 to 5 minutes. The 3.02 P-A reading was recorded, and the Environics generator was then adjusted to the next desired concentration. The second approach used to evaluate accuracy compared the 3.02 P-A and FEM responses to ozone generated in dry and humidified zero air in Battelle’s 17.3 m3 environmental chamber. Ozone was added stepwise to clean air in the test chamber at both low (< 5%) and high (approximately 70 to 80%) RH. The response of the 3.02 P-A to various ozone concentrations was compared to the corresponding response of the FEM.
3.2.2 Linearity
Linearity was also evaluated from the chamber test data used to assess accuracy. Linearity was determined by linear regression of the response of the 3.02 P-A against the simultaneous FEM responses.
5/30/14 Draft text for review by CASAC AMMS - Do not Cite or Quote -This draft does not reflect consensus advice and does not represent EPA policy.

3.2.3 Interference Effects
Interference effects were evaluated by three approaches in Battelle’s 17.3 m3 environmental test chamber. The first tests were conducted on June 13 and 14 to determine the response of the 3.02 P-A to ozone added stepwise to clean air in the test chamber at both low (< 5%) and high (approximately 70 to 80%) RH. Those tests, which were also used to assess 3.02 P-A accuracy and linearity relative to the FEM (Sections 3.2.1 and 3.2.2), indicated whether humidity affected 3.02 P-A response. The second approach evaluated 3.02 P-A interference effects in ozone-free air at both low and high humidity, by adding stepwise chemicals found in primary source emissions or produced by urban photochemistry that have been found to be potential interferents in ozone monitoring. The interference effects and the response of the 3.02 P-A were assessed during Tests 1 and 2 as shown in Table 3-1, on June 20 and 22, respectively. In these tests, the 3.02 P-A was challenged with a mixture of four interferents added sequentially to the environmental chamber to produce their respective designated concentrations shown in Table 3-1. Once the first interferent was supplied to the chamber, the instruments were allowed to monitor for several minutes before moving on to the next interferent injection. Once all four interferents had been added, an integrated sample was taken in the environmental chamber to determine the actual interferent concentrations. The interferent concentrations used in these tests were at elevated levels that might plausibly exist in the atmosphere near roadways or other sources, or during stagnant meteorological conditions.
Table 3-1. Interference Testing Conditions
Test
RH
Interferent Target
Concentration Actual
Concentration < 5% Naphthalene 10 ppbv 10.9 ppbv < 5% o-nitrophenol 10 ppbv 6.1 ppbv < 5% p-tolualdehyde 10 ppbv 7.3 ppbv
1 < 5% Mercury 50 ng/m3 630 ng/m3a
(78.7 pptv) b 70 to 80% Naphthalene 10 ppbv 11.0 ppbv 70 to 80% o-nitrophenol 10 ppbv 9.9 ppbv 70 to 80% p-tolualdehyde 10 ppbv 14.9 ppbv
2 70 to 80% Mercury 50 ng/m3 54 ng/m3
(6.8 pptv) b a. Mercury was injected into the environmental chamber at a higher concentration than originally planned
in this test procedure. b. pptv = parts per trillion by volume (=1x10-12 v/v)
The third approach assessed the response of the 3.02 P-A to ozone precursors and photochemical reactants during photochemical chamber Tests 3 and 4 (Table 3-2) on June 27 and 28, respectively. Both of these tests were conducted in a series of steps, starting with monitoring of clean dry air, then of humidified clean air, and then proceeding to monitoring of that air spiked with a 17-component hydrocarbon mixture and then with NO2. The response of the 3.02 P-A up to that point was used to assess the interferent effects of these ozone precursors. After the hydrocarbons and NO2 were delivered to the chamber, irradiation of the chamber took place until the maximum ozone concentration (approximately 130 ppbv for Test 3 and approximately 80
5/30/14 Draft text for review by CASAC AMMS - Do not Cite or Quote -This draft does not reflect consensus advice and does not represent EPA policy.

ppbv for Test 4) had been passed. The difference between Tests 3 and 4 was the four-fold higher hydrocarbon and NO2 concentrations used in Test 4. The hydrocarbon levels targeted in these tests (500 and 2,000 ppbC) were chosen to reflect moderate photochemical periods when ozone standards are likely to be met, and severe photochemical periods when such standards are likely to be exceeded, respectively.
Table 3-2. Photochemical Chamber Testing Conditions
Test
Step Target
Concentration Actual
Concentration Monitor dry zero air < 5% RH < 5% RH
Monitor humidified air ≈ 80% RH 82% RH Add 17-component urban hydrocarbon
mixture 500 ppbC 670 ppbC
(167 ppbv) Add NO2 50 ppbv 55 ppbv
3
Irradiate chamber contents NA NA Monitor dry zero air < 5% RH < 5% RH
Monitor humidified air ≈ 80% RH 85% RH Add 17-component urban hydrocarbon
mixture 2000 ppbC 2370 ppbC
(593 ppbv) Add NO2 200 ppbv 200 ppbv
4
Irradiate chamber contents NA NA NA = not applicable
Particle number concentrations in the photochemical tests ranged up to approximately 8 x 10⁵ per cubic centimeter (cm3) almost entirely in the 0.3 to 0.5 µm size range, and those particles were almost completely removed by the filter on the inlet manifold from which the 3.02 P-A units and the FEM drew their sample air.
3.2.4 Comparability
Comparability was evaluated by comparing the responses of the 3.02 P-A to the simultaneous response of the Thermo Environmental UV Model 49C FEM in the photochemical chamber tests and in ambient air monitoring. The comparability of the 3.02 P-A and FEM response in ambient air was evaluated during ambient air monitoring over a period of 110 hours June 22-27, 2007. During this period the 3.02 P-A units and FEM all remained inside the test laboratory, but sampled ambient air outside the laboratory window through a common inlet attached to the sampling manifold. Calibration checks were performed periodically during the test, and hourly average ozone values were recorded.
3.2.5 Data Completeness
No additional test procedures were carried out specifically to address data completeness. This parameter was assessed based on the overall data return relative to the total amount of data return possible for the technology being tested.
3.2.6 Operational Factors
Operational factors such as maintenance needs, data output, consumables used, and ease of use were evaluated based on observations by Battelle. A laboratory record book was used to enter
5/30/14 Draft text for review by CASAC AMMS - Do not Cite or Quote -This draft does not reflect consensus advice and does not represent EPA policy.

daily observations on these factors. Examples of relevant information include the daily status of diagnostic indicators for the 3.02 P-A, use or replacement of any consumables, the effort or cost associated with maintenance or repair, vendor effort (e.g., time on site) for repair or maintenance, the duration and causes of any down time or data acquisition failure, the sustainability of the analyzer (e.g., power consumed, wastes generated, disposal costs required), and operator observations about ease of use of the 3.02 P-A.
3.3 Reference Methods
Reference methods for ozone consisted of a commercial photometer, the calibration of which is traceable to the primary reference photometer at EPA Region 5 in Chicago (as described in Section 4.2), and the Model 49C FEM. The UV-absorption method is used for virtually all ambient ozone monitoring in the U.S., and the Model 49C is a commonly used instrument established as an FEM for ozone. During the interference and photochemical tests, integrated samples were taken of the injected contaminants and laboratory measurements were used to confirm the interferent compound concentrations added to the environmental chamber. Samples of naphthalene, o-nitrophenol, and p-tolualdehyde were collected from the chamber using commercially prepared sorbent traps, and their chamber concentrations were confirmed by gas chromatography with mass selective detection (GC/MSD). Mercury was confirmed by cold vapor atomic fluorescence using a Tekran Series 2600 instrument. A total hydrocarbon monitor (flame ionization, VIG Corp), was used during the photochemical tests to measure the volatile organic compounds (VOC) content.
3.4 Verification Schedule
The 3.02 P-A was verified between June 12 and June 28, 2007. Table 3-3 shows the dates of activities relevant to the 3.02 P-A verification. Table 3-3. Test Activities During the Optec 3.02 P-A Verification Test
Date Test Activity May 7 Optec 3.02 P-A arrive at Battelle
May 22 Installation of 3.02 P-A into test set up
June 12 Transfer Standard Performance Audit
June 13 Ozone Challenge High Humidity
June 14 Ozone Challenge Low Humidity
June 20 Interferent Test Low Humidity
June 22 Interferent Test High Humidity
June 22-27 Ambient Monitoring
June 27 Photochemical Test High Concentration
June 28 Photochemical Test Low Concentration
June 28 End Testing
5/30/14 Draft text for review by CASAC AMMS - Do not Cite or Quote -This draft does not reflect consensus advice and does not represent EPA policy.

Chapter 4 Quality Assurance/Quality Control
QA/QC procedures were performed in accordance with the quality management plan (QMP) for the AMS Center(4) and the test/QA plan for this verification test.(1) QA/QC procedures and results are described below.
4.1 Equipment Calibrations
Prior to the start of the environmental chamber tests a multipoint calibration was performed on the FEM using the Environics Model 6400 ozone generator and Dasibi 1008 UV photometer. The ozone calibration standards were generated in dry zero air. The FEM was also calibrated in the same manner at the start of each day before the start of any tests. The 3.02 P-A units were calibrated automatically at 10-minute intervals throughout the entire test, using their internal ozone sources. This internal calibration was the basis for all 3.02 P-A readings. The GC/MSD and mercury fluorescence instruments were calibrated prior to analyses and a minimum of a one point calibration was performed on each analysis day.
4.2 Audits
Three types of audits were performed during the verification test: a performance evaluation (PE) audit of the ozone standard used in testing, a technical systems audit (TSA) of the verification test procedures, and a data quality audit. Audit procedures are described further below.
4.2.1 Performance Evaluation Audit
A PE audit was conducted on June 12, 2007 to establish the traceability of the Battelle-owned Dasibi 1008 UV photometer relative to the standard photometer owned by the Ohio Environmental Protection Agency (OEPA), which was also a Dasibi 1008 UV photometer, and which is traceable to the primary ozone standard reference photometer located at EPA Region 5, Chicago, Illinois. In the PE audit, simultaneous measurements were made from a range of zero to 400 ppbv with the Battelle-owned and OEPA photometers using Battelle’s Environics Model 6400 ozone generator as the ozone source. The results of the audit are provided in Figure 4-1, in the form of a linear regression of the Battelle photometer response against the OEPA photometer response corrected to match the EPA Region 5 reference photometer. Figure 4-1 shows close
5/30/14 Draft text for review by CASAC AMMS - Do not Cite or Quote -This draft does not reflect consensus advice and does not represent EPA policy.

agreement of the results, with the linear regression showing Battelle O3= 0.9923 (EPA Region 5 O3) -0.7628 ppbv, with a coefficient of determination (r2) of 1.0. Ozone concentrations delivered in testing were determined using Battelle’s photometer, and corrected to the EPA Region 5 standard using this equation.
y = 0.9923x - 0.7628R2 = 1
0100200300400500
0 100 200 300 400 500Region 5 Photometer O3, ppbv
Bat
telle
Pho
tom
eter
O
3, pp
bv
Figure 4-1. Performance Audit of Battelle’s Dasibi 1008 UV Photometer.
4.2.2 Technical Systems Audit
A TSA was conducted by Battelle’s AMS Center Quality Manager during testing on June 22, 2007. Observations and findings from this audit were documented and submitted to the Battelle Verification Test Coordinator for response. No major findings were noted. All minor findings were documented, and all required corrective actions were taken. The records concerning the TSA are permanently stored with the Battelle Quality Manager. EPA’s ETV QA Officer also conducted a TSA on June 14, 2007. No adverse findings were reported from that audit.
4.2.3 Audit of Data Quality
Battelle’s Quality Manager traced the test data from the initial acquisition, through reduction and statistical analysis, to final reporting to ensure the integrity of the reported results. All calculations performed on the data undergoing the audit were checked during the technical review process.
4.3 QA/QC Reporting
Each audit was documented in accordance with Sections 3.3.4 and 3.3.5 of the QMP for the ETV AMS Center.(4) Once the audit report was prepared, the Battelle Verification Test Coordinator ensured that a response was provided for each adverse finding or potential problem and implemented any necessary follow-up corrective action. The Battelle Quality Manager ensured that follow-up corrective action was taken. The results of the TSA were sent to the EPA.
5/30/14 Draft text for review by CASAC AMMS - Do not Cite or Quote -This draft does not reflect consensus advice and does not represent EPA policy.

4.4 Data Review
Records generated in the verification test received a one-over-one review before these records were used to calculate, evaluate, or report verification results. Data were reviewed by a Battelle technical staff member involved in the verification test. The person performing the review added his/her initials and the date to a hard copy of the record being reviewed.
5/30/14 Draft text for review by CASAC AMMS - Do not Cite or Quote -This draft does not reflect consensus advice and does not represent EPA policy.

Chapter 5 Statistical Methods
The statistical methods in this chapter were used to verify the performance parameters listed in Section 3.1.
5.1 Accuracy
The accuracy of the 3.02 P-A, with respect to either delivered ozone standard concentrations or simultaneous FEM readings, was assessed as a percentage recovery (%R), using Equation 1:
1001% ×⎥⎦
⎤⎢⎣
⎡⎟⎠⎞
⎜⎝⎛ −
+=X
XYR (1)
Where Y is the 3.02 P-A reading and X is the delivered ozone standard concentration, or the FEM reading in simultaneous monitoring with the FEM and the 3.02 P-A. The average, and range (minimum, and maximum) %R values are reported for each assessment of accuracy.
5.2 Linearity
Linearity was assessed using the same 3.02 P-A and FEM data used to assess accuracy, by a linear regression of the FEM ozone concentration (independent variable) and the 3.02 P-A reading (dependent variable). Linearity was expressed in terms of slope, intercept, and r2.
5.3 Interference Effects
The interference effects of the 3.02 P-A were illustrated by comparison of the response of the 3.02 P-A when challenged with each chemical interferent. The interference effects were considered separately for each of the three sets of interferent tests. Quantitative interference effects were calculated as a percent relative response (%RR) to the interferent for the two tests in which chemical interferents were added to the test chamber, i.e.:
⎛ ppbv O response%RR 3 ⎞= ⎜ ⎟×⎜ ⎟ 100 ⎝ ppbv interferent ⎠ (2)
5/30/14 Draft text for review by CASAC AMMS - Do not Cite or Quote -This draft does not reflect consensus advice and does not represent EPA policy.

5.4 Comparability
Comparability between the 3.02 P-A results and the FEM analyzer results was illustrated by graphing the data for visual comparison and assessed by linear regressions using the FEM readings as the independent variable and results from the 3.02 P-A as the dependent variable. Linearity was expressed in terms of slope, intercept, and r2. This calculation was done for the photochemical ozone chamber tests described in Table 3-2, and for the period of ambient air monitoring. Thus comparability was assessed using complex pollutant mixtures, either prepared in the test chamber or naturally present in ambient air. The data from these tests are not the same as those used to assess accuracy or linearity (Sections 5.1 and 5.2). Comparability calculations on the photochemical chamber tests were based on minute-by-minute average data, whereas these calculations on the ambient data were based on the hourly average values. Comparability was calculated in this way for each of the 3.02 P-A units, relative to the FEM. Comparability of the 3.02 P-A to the FEM in the photochemical tests and ambient monitoring was also calculated in terms of relative percent difference (RPD), where
100FEM
FEM -)A-P (3.02RPDavg
avgavg×⎟⎠⎞
⎜⎝⎛=
(3) and 3.02 P-Aavg and FEMavg represent the corresponding average readings from the two types of monitors, i.e., short-term averages in the photochemical tests and hourly averages in the ambient monitoring. The mean and range of RPD values are reported. This calculation of RPD was conducted only for the 3.02 P-A unit operated normally (i.e., without the added Nafion tube).
5.5 Data Completeness
Data completeness was calculated as the percentage of the total possible data return that was achieved by the 3.02 P-A over the entire testing period. This calculation used the total hours of data recorded divided by the total hours of data in the entire testing period. Testing began on June 12 and ended on June 28, 2007, and both 3.02 P-A units operated continuously throughout this time, though test procedures did not occupy that entire time. For this calculation, no distinction was made between data recorded during calibration or zeroing, or in performance of linearity, interference effects, photochemical testing, or ambient monitoring. The causes of any substantial incompleteness of data were established from operator observations or vendor records.
5/30/14 Draft text for review by CASAC AMMS - Do not Cite or Quote -This draft does not reflect consensus advice and does not represent EPA policy.
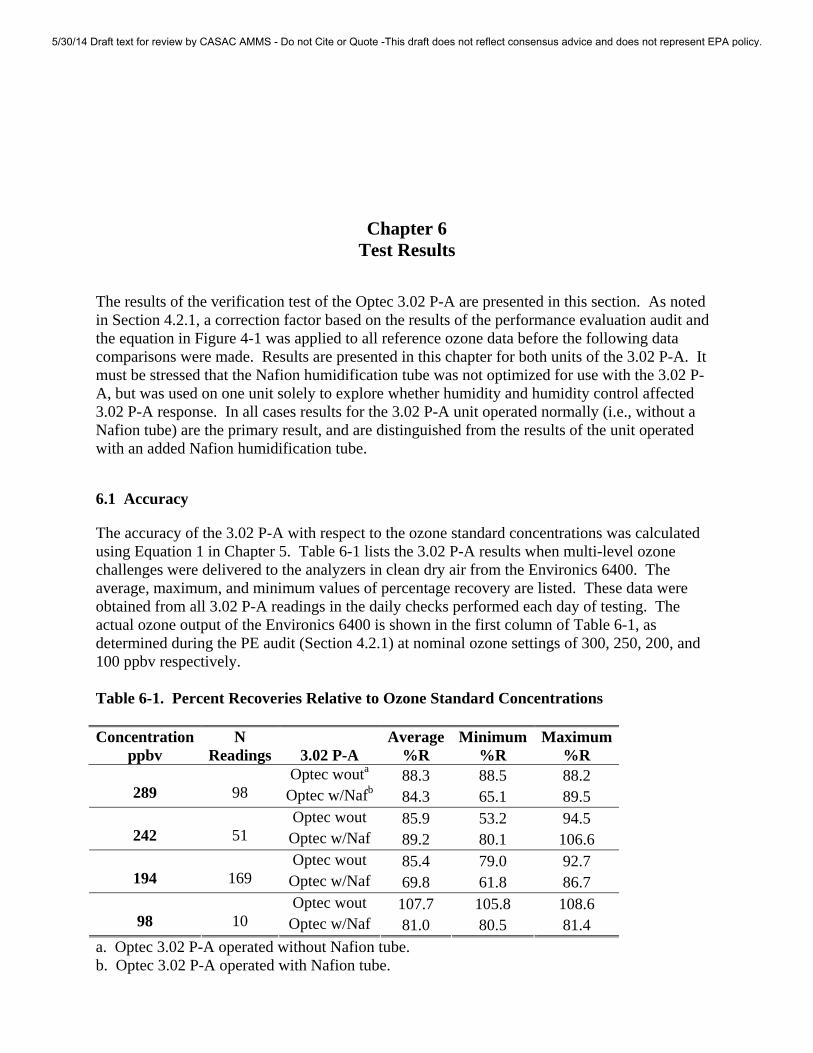
Chapter 6 Test Results
The results of the verification test of the Optec 3.02 P-A are presented in this section. As noted in Section 4.2.1, a correction factor based on the results of the performance evaluation audit and the equation in Figure 4-1 was applied to all reference ozone data before the following data comparisons were made. Results are presented in this chapter for both units of the 3.02 P-A. It must be stressed that the Nafion humidification tube was not optimized for use with the 3.02 P-A, but was used on one unit solely to explore whether humidity and humidity control affected 3.02 P-A response. In all cases results for the 3.02 P-A unit operated normally (i.e., without a Nafion tube) are the primary result, and are distinguished from the results of the unit operated with an added Nafion humidification tube.
6.1 Accuracy
The accuracy of the 3.02 P-A with respect to the ozone standard concentrations was calculated using Equation 1 in Chapter 5. Table 6-1 lists the 3.02 P-A results when multi-level ozone challenges were delivered to the analyzers in clean dry air from the Environics 6400. The average, maximum, and minimum values of percentage recovery are listed. These data were obtained from all 3.02 P-A readings in the daily checks performed each day of testing. The actual ozone output of the Environics 6400 is shown in the first column of Table 6-1, as determined during the PE audit (Section 4.2.1) at nominal ozone settings of 300, 250, 200, and 100 ppbv respectively. Table 6-1. Percent Recoveries Relative to Ozone Standard Concentrations Concentration
ppbv N
Readings
3.02 P-A Average
%R Minimum
%R Maximum
%R Optec wouta 88.3 88.5 88.2
289
98 Optec w/Nafb 84.3 65.1 89.5 Optec wout 85.9 53.2 94.5
242
51 Optec w/Naf 89.2 80.1 106.6 Optec wout 85.4 79.0 92.7
194
169 Optec w/Naf 69.8 61.8 86.7 Optec wout 107.7 105.8 108.6
98
10 Optec w/Naf 81.0 80.5 81.4 a. Optec 3.02 P-A operated without Nafion tube. b. Optec 3.02 P-A operated with Nafion tube.
5/30/14 Draft text for review by CASAC AMMS - Do not Cite or Quote -This draft does not reflect consensus advice and does not represent EPA policy.

Table 6-1 shows that the average %R value for the Optec 3.02 P-A analyzer operated normally (i.e., without the additional Nafion humidity equilibration tube) was about 85 to 88 %, except for the few readings at a delivered concentration of 98 ppbv, for which %R was over 100%. The average %R values for the 3.02 P-A with the Nafion tube ranged more widely, from about 70 to 89%. Note that the ozone standards delivered from the Environics 6400 were in dry zero air (RH of 5% or less), and that this RH is below the recommended lower RH limit (15% RH) for continuous operation of the Optec 3.02 P-A analyzer. In this case the addition of the Nafion humidity equilibration system did not appreciably improve the performance of the 3.02 P-A with ozone in dry air; however, the Nafion system was designed for sample flows about 1 liter per minute and humidity equilibration of the Optec 3.02 P-A was probably incomplete at the sample flow rate of approximately 1.8 liter per minute. Accuracy of the 3.02 P-A was also evaluated by comparison to FEM readings obtained simultaneously in monitoring of ozone in dry and humid zero air. The calculation of accuracy was done using Equation 1 in Chapter 5. Tables 6-2 and 6-3 show those accuracy results in terms of the average, maximum, and minimum %R for the ozone chamber tests conducted on June 13 and 14, 2007, at high and low RH, respectively. For these tests ozone was added to the chamber by brief injections from a high concentration source, and the ozone concentration was determined by the average response of the FEM over a series of 10 stable data points. The simultaneous 3.02 P-A readings were similarly determined as the average of 10 successive stable readings. Table 6-2. Percent Recoveries of Ozone from High Humidity (70 to 80% RH) Chamber Tests on June 13, 2007 Concentration
(ppbv)
3.02 P-A Average
%R Minimum
%R Maximum
%R Optec wouta 93.9 92.7 95.0
257 Optec w/Nafb 94.9 93.7 96.1 Optec wout 95.2 93.5 97.0
223 Optec w/Naf 99.1 92.8 101.5 Optec wout 94.0 92.8 96.2
172 Optec w/Naf 96.7 95.0 97.3 Optec wout 93.2 92.6 94.3
108 Optec w/Naf 110.3 107.3 113.3 Optec wout 109.9 108.5 111.5
51 Optec w/Naf 105.4 103.9 107.2 a. Optec 3.02 P-A operated without Nafion tube. b. Optec 3.02 P-A operated with Nafion tube.
5/30/14 Draft text for review by CASAC AMMS - Do not Cite or Quote -This draft does not reflect consensus advice and does not represent EPA policy.

Table 6-3. Percent Recoveries of Ozone from Low Humidity (<5% RH) Chamber Tests on June 14, 2007 Concentration
(ppbv)
3.02 P-A Average
%R Minimum
%R Maximum
%R Optec wouta 84.9 84.1 85.7
260 Optec w/Nafb 70.2 69.5 71.1 Optec wout 83.8 83.3 84.1
206 Optec w/Naf 74.5 72.7 81.2 Optec wout 83.6 83.4 83.9
163 Optec w/Naf 73.1 72.3 73.9 Optec wout 83.4 83.2 83.7
119 Optec w/Naf 73.9 73.3 74.2 Optec wout 88.3 87.4 90.2
69 Optec w/Naf 78.1 76.5 87.5 a. Optec 3.02 P-A operated without Nafion tube. b. Optec 3.02 P-A operated with Nafion tube. Table 6-2 shows that the average %R value for the 3.02 P-A without the Nafion tube was about 93 to 95%, when sampling ozone in humid air from the test chamber, except for a %R value of about 110% at the lowest ozone concentration The corresponding %R for the 3.02 P-A with the Nafion tube was 95 to 99% at the higher ozone levels, with values of 105 to 110% at the lowest two ozone concentrations. Table 6-3 shows that the average %R value for the 3.02 P-A without the Nafion tube was about 83 to 88%, when sampling ozone in dry air from the test chamber. The corresponding %R for the 3.02 P-A with the Nafion tube was lower, at 70 to 78%. These results show that the 3.02 P-A exhibited higher %R values with ozone in humid air than in dry air, which is consistent with the recommendation by Optec that the analyzer not operate continuously on air of RH less than about 15%. Values of %R near 100% were observed both with and without the added Nafion tube when sampling humid air, whereas %R values were much lower both with and without the Nafion when sampling dry air. These results suggest that the addition of the Nafion tube does not improve the %R results for the 3.02 P-A. It is noteworthy that in routine ambient monitoring at standard compliance network sites, it is mandatory to produce ozone calibration mixtures in clean dry air.
6.2 Linearity
The linearity of the 3.02 P-A was evaluated using the data from the chamber ozone tests at both low (< 5%) and high (70-80%) RH. Figure 6-1 shows the results from the high humidity chamber test on June 13, 2007. The responses of the 3.02 P-A with and without the Nafion tube are shown in relation to the delivered ozone as determined by the FEM. Shown in the figure are the slope, intercept, and r2 of the linear fit for each 3.02 P-A unit.
5/30/14 Draft text for review by CASAC AMMS - Do not Cite or Quote -This draft does not reflect consensus advice and does not represent EPA policy.

y = 0.9176x + 11.985R2 = 0.9931
y = 0.9138x + 6.2057R2 = 0.9978
0.0
50.0
100.0
150.0
200.0
250.0
300.0
40.0 90.0 140.0 190.0 240.0 290.0
FEM ozone (ppb)
3.02
P-A
ozo
e (p
pb)
Optec w/Naf Optec wout Optec with Naf Optec wout
Optec without Nafion
Optec with Nafion
Figure 6-1. Linearity of 3.02 P-A Response to Ozone in Chamber at High Humidity. Figure 6-2 shows the results from the low humidity chamber test on June 14, 2007. The responses of the 3.02 P-A with and without the Nafion tube are shown in relation to the delivered ozone as determined by the FEM. Shown in the figure are the slope, intercept and r2 of the linear fit for each 3.02 P-A unit.
y = 0.6876x + 7.0449R2 = 0.9928
y = 0.8378x + 1.0399R2 = 0.999
0.0
50.0
100.0
150.0
200.0
250.0
50.0 100.0 150.0 200.0 250.0 300.0
FEM ozone (ppb)
3.02
P-A
ozo
ne (p
pb)
Optec with Nafion Optec wout Naf Optec with Nafion Optec wout Naf
Optec without Nafion
Optec with Nafion
Figure 6-2. Linearity of 3.02 P-A Response to Ozone in Chamber at Low Humidity.
5/30/14 Draft text for review by CASAC AMMS - Do not Cite or Quote -This draft does not reflect consensus advice and does not represent EPA policy.

The linearity results in Figures 6-1 and 6-2 demonstrate linear response by both 3.02 P-A units, but confirm the results shown for %R in Section 6.1, in that the linear regression slopes are much closer to 1.0 when sampling humid air than when sampling dry air. The degradation of performance caused by the added Nafion tube when sampling dry air is evident in Figure 6-2, as it was in Table 6-3 (Section 6.1).
6.3 Interference Effects
The effect of humidity as an interferent is shown in the preceding sections 6.1 and 6.2. Low humidity (< 5% RH) clearly degrades the performance of the 3.02 P-A. As noted above, this RH level is below that recommended by the vendor for continuous operation of the 3.02 P-A. The responses of the two 3.02 P-A units to the interferents in Test 1 are illustrated in Figure 6-3. This test was conducted on June 20, 2007 with low humidity (< 5%) in the chamber. The interferents are noted as to the time they were injected into the chamber.
0.0
0.5
1.0
1.5
2.0
2.5
3.0
10:12:00 10:40:48 11:09:36 11:38:24 12:07:12 12:36:00 13:04:48 13:33:36 14:02:24 14:31:12
Time
3.02
P-A
resp
onse
(ppb
)
Optec w/ Nafion Optec wout Naf
Add 6.1 ppb o-nitrophenol
Add 10.9 ppb napthalene
Add 7.3 ppb p-tolualdehydeAdd 630 ng/m3
mercury
Figure 6-3. 3.02 P-A Response to Interferents in Chamber at Low Humidity. Figure 6-3 shows that the zero air ozone readings of the 3.02 P-A unit operated normally (without the added Nafion tube) were about 0.6 ppbv, and showed no significant changes associated with the successive additions of the four potential interferents. The readings of the 3.02 P-A operated with the added Nafion were higher (about 2.3 ppbv), but also showed no trends associated with the additions of the interferents. Thus the %RR values for the 3.02 P-A for these four interferents in dry air were all zero.
5/30/14 Draft text for review by CASAC AMMS - Do not Cite or Quote -This draft does not reflect consensus advice and does not represent EPA policy.

Figure 6-4 illustrates the responses of the two 3.02 P-A units to the interferents injected into the chamber in Test 2, conducted on June 22 with high (70-80 %) RH in the chamber. Figure 6-4 shows that the zero air readings of the 3.02 P-A unit without the Nafion tube were about 0.6 to 0.7 ppbv, whereas those of the unit with the Nafion tube were slightly higher and more variable, ranging from 0.5 to 1.2 ppbv. Readings affected by the analyzer’s automatic calibration at 10-minute intervals are evident in the data for the 3.02 P-A operated without the Nafion. Although there is scatter in the data, there is no clear trend associated with the addition of the potential interferents. Thus the %RR values for the 3.02 P-A for these four interferents in humidified air were all zero.
0.0
0.2
0.4
0.6
0.8
1.0
1.2
1.4
10:19:12 10:33:36 10:48:00 11:02:24 11:16:48 11:31:12 11:45:36 12:00:00 12:14:24 12:28:48
Time
3.02
P-A
resp
onse
(ppb
)
Optec w/ Nafion Optec wout Naf
Add 10 ppb o-nitrophenolAdd 11 ppb napthalene
Add 15 ppb p-tolualdehyde Add 54 ng/m3 mercury
Figure 6-4. 3.02 P-A Response to Interferents in Chamber at High Humidity. Two photochemical tests were conducted with the addition of a 17 component hydrocarbon mixture (both gas and liquid components) and NO2. These tests were performed at a humidity of approximately 80%. Figure 6-5 shows the response of the two 3.02 P-A units over time while these ozone precursors were injected into the environmental chamber on June 27, 2007 (before the chamber lights were turned on to begin ozone production). The hydrocarbon concentration injected into the chamber was approximately 2,370 ppbC (593 ppbv) and the NO2 concentration was 200 ppbv. Figure 6-5 shows that in this test the readings of the 3.02 P-A operated with no Nafion tube were about 0.6 ppbv, and those of the other unit were about 3.5 to 4.5 ppbv. Slight shifts of the readings can be seen, associated with the analyzers’ autocalibration at 10-minute intervals, and the readings of the 3.02 P-A operated with the Nafion tube exhibit some drift. However, there is no clear effect on the readings associated with the introduction of any of the ozone precursors. The 3.02 P-A unit operated normally (i.e., without the Nafion tube) showed no more than 0.1 ppbv variation in readings throughout the precursor injections.
5/30/14 Draft text for review by CASAC AMMS - Do not Cite or Quote -This draft does not reflect consensus advice and does not represent EPA policy.

0.00
0.50
1.00
1.50
2.00
2.50
3.00
3.50
4.00
4.50
5.00
10:29:17 10:36:29 10:43:41 10:50:53 10:58:05 11:05:17 11:12:29
Time
3.02
P-A
resp
onse
(ppb
)
Optec with Nafion Optec without Naf
Add multiple injectionsof light hydrocarbons Add NO2 Add liquid hydrocarbon
Figure 6-5. Photochemical Interferent Test with High Precursor Concentrations. Figure 6-6 illustrates the response of the two 3.02 P-A units over time while the interferents were injected into the environmental chamber on June 28, 2007. The hydrocarbon concentration injected into the chamber was approximately 670 ppbC (167 ppbv) and the NO2 concentration was 55 ppbv. Also shown in Figure 6-6 is a similar result to that of Figure 6-5, in that the readings of the two 3.02 P-A units are unaffected by the addition of the ozone precursors. Thus the %RR values for these ozone precursors with the 3.02 P-A appear to be zero.
0.00
0.50
1.00
1.50
2.00
2.50
3.00
3.50
4.00
4.50
10:03:22 10:06:14 10:09:07 10:12:00 10:14:53 10:17:46 10:20:38 10:23:31 10:26:24
Time
3.02
P-A
resp
onse
(ppb
)
Optec with Nafion Optec without Naf
Add multiple injections of light hydrocarbons Add NO2Add liquid hydrocarbon
Figure 6-6. Photochemical Interferent Test with Low Precursor Concentrations.
5/30/14 Draft text for review by CASAC AMMS - Do not Cite or Quote -This draft does not reflect consensus advice and does not represent EPA policy.
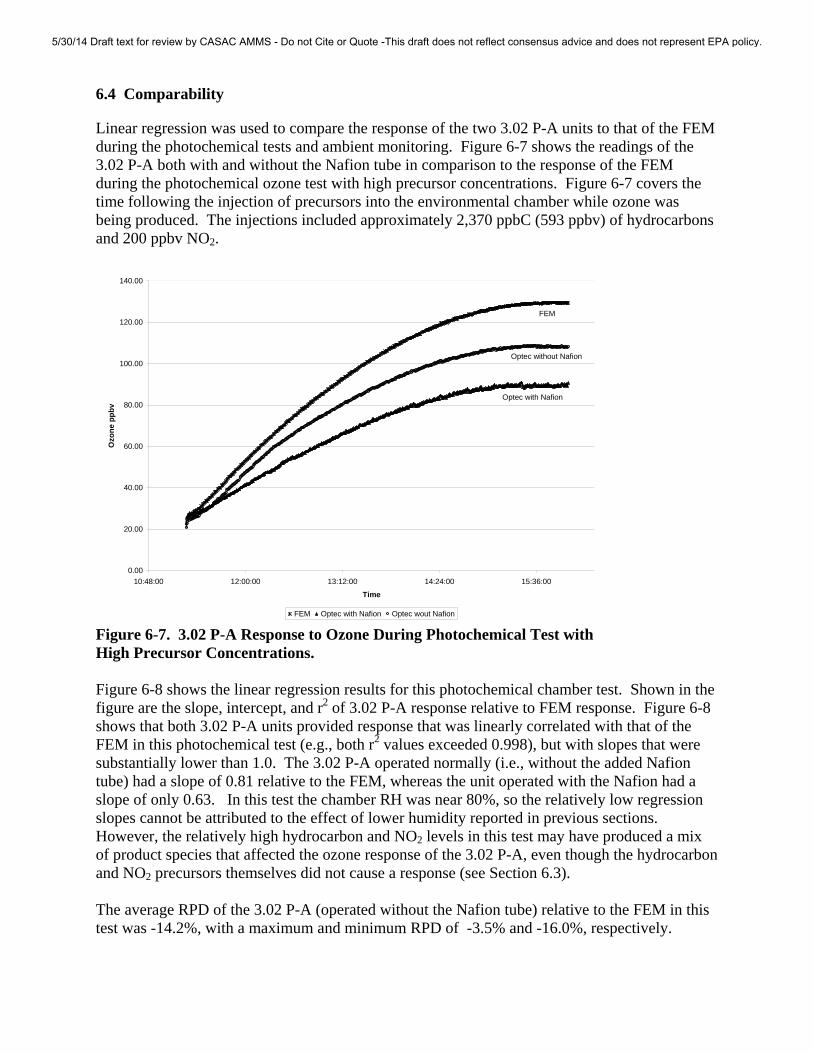
6.4 Comparability
Linear regression was used to compare the response of the two 3.02 P-A units to that of the FEM during the photochemical tests and ambient monitoring. Figure 6-7 shows the readings of the 3.02 P-A both with and without the Nafion tube in comparison to the response of the FEM during the photochemical ozone test with high precursor concentrations. Figure 6-7 covers the time following the injection of precursors into the environmental chamber while ozone was being produced. The injections included approximately 2,370 ppbC (593 ppbv) of hydrocarbons and 200 ppbv NO2.
0.00
20.00
40.00
60.00
80.00
100.00
120.00
140.00
10:48:00 12:00:00 13:12:00 14:24:00 15:36:00
Time
Ozo
ne p
pbv
FEM Optec with Nafion Optec wout Nafion
Optec with Nafion
Optec without Nafion
FEM
Figure 6-7. 3.02 P-A Response to Ozone During Photochemical Test with High Precursor Concentrations. Figure 6-8 shows the linear regression results for this photochemical chamber test. Shown in the figure are the slope, intercept, and r2 of 3.02 P-A response relative to FEM response. Figure 6-8 shows that both 3.02 P-A units provided response that was linearly correlated with that of the FEM in this photochemical test (e.g., both r2 values exceeded 0.998), but with slopes that were substantially lower than 1.0. The 3.02 P-A operated normally (i.e., without the added Nafion tube) had a slope of 0.81 relative to the FEM, whereas the unit operated with the Nafion had a slope of only 0.63. In this test the chamber RH was near 80%, so the relatively low regression slopes cannot be attributed to the effect of lower humidity reported in previous sections. However, the relatively high hydrocarbon and NO2 levels in this test may have produced a mix of product species that affected the ozone response of the 3.02 P-A, even though the hydrocarbon and NO2 precursors themselves did not cause a response (see Section 6.3). The average RPD of the 3.02 P-A (operated without the Nafion tube) relative to the FEM in this test was -14.2%, with a maximum and minimum RPD of -3.5% and -16.0%, respectively.
5/30/14 Draft text for review by CASAC AMMS - Do not Cite or Quote -This draft does not reflect consensus advice and does not represent EPA policy.

y = 0.6309x + 8.2231R2 = 0.9988
y = 0.8146x + 4.0542R2 = 0.9985
0.00
20.00
40.00
60.00
80.00
100.00
120.00
0.00 20.00 40.00 60.00 80.00 100.00 120.00
FEM response (ppb)
3.02
P-A
resp
onse
(ppb
)
Optec with Nafion Optec wout Nafion Linear (Optec with Nafion) Linear (Optec wout Nafion)
Optec without Nafion
Optec with Nafion
Figure 6-8. Photochemical Ozone Comparison with High Precursor Concentrations. Figure 6-9 shows the readings of the two 3.02 P-A units in comparison to the response of the FEM in the photochemical test with lower precursor concentrations. The data depicted are from the time following the injection of precursors into the environmental chamber while ozone was being produced. The injections were of approximately 670 ppbC (167 ppbv) of hydrocarbons and 55 ppbv of NO2. Occasional offsets are evident in the two 3.02 P-A traces, due to the automated internal calibrations performed by these units.
0.00
10.00
20.00
30.00
40.00
50.00
60.00
70.00
80.00
90.00
10:19:12 10:48:00 11:16:48 11:45:36 12:14:24 12:43:12 13:12:00 13:40:48 14:09:36 14:38:24
Time
Ozo
ne p
pbv
FEM Optec with Nafion Optec wout Nafion
FEM
Optec without Nafion
Optec with Nafion
Figure 6-9. 3.02 P-A Response to Ozone During Photochemical Test with Low Precursor Concentrations.
5/30/14 Draft text for review by CASAC AMMS - Do not Cite or Quote -This draft does not reflect consensus advice and does not represent EPA policy.
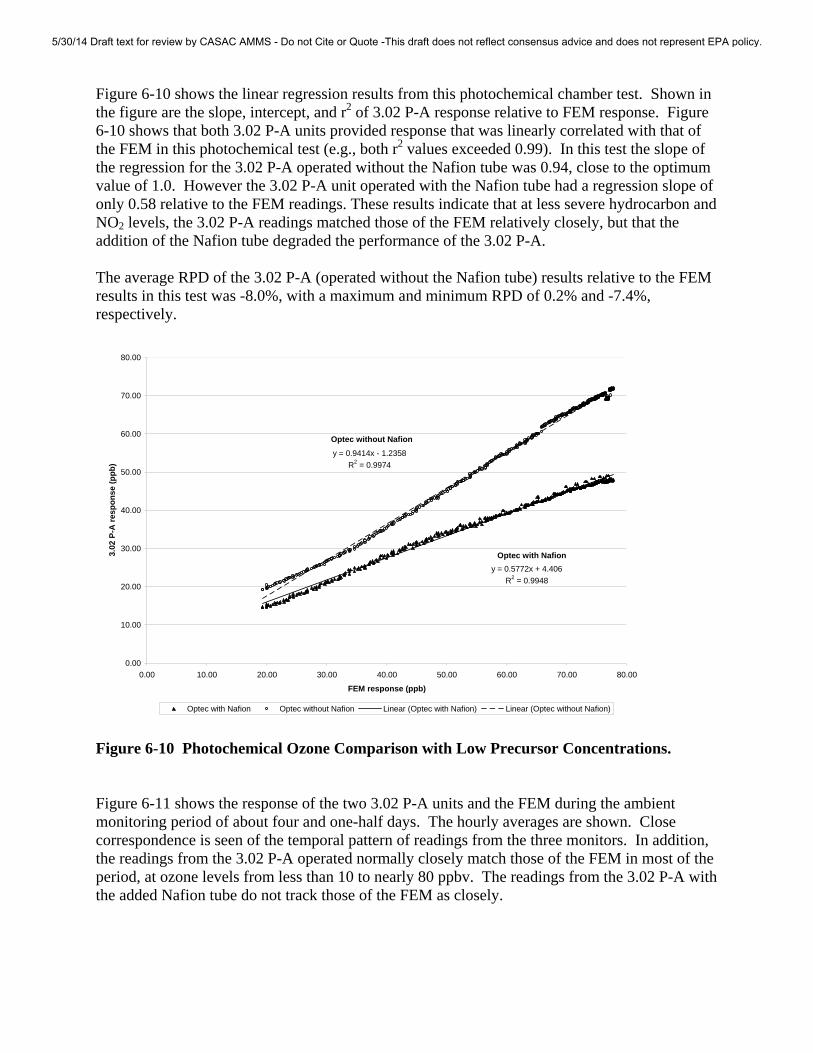
Figure 6-10 shows the linear regression results from this photochemical chamber test. Shown in the figure are the slope, intercept, and r2 of 3.02 P-A response relative to FEM response. Figure 6-10 shows that both 3.02 P-A units provided response that was linearly correlated with that of the FEM in this photochemical test (e.g., both r2 values exceeded 0.99). In this test the slope of the regression for the 3.02 P-A operated without the Nafion tube was 0.94, close to the optimum value of 1.0. However the 3.02 P-A unit operated with the Nafion tube had a regression slope of only 0.58 relative to the FEM readings. These results indicate that at less severe hydrocarbon and NO2 levels, the 3.02 P-A readings matched those of the FEM relatively closely, but that the addition of the Nafion tube degraded the performance of the 3.02 P-A. The average RPD of the 3.02 P-A (operated without the Nafion tube) results relative to the FEM results in this test was -8.0%, with a maximum and minimum RPD of 0.2% and -7.4%, respectively.
y = 0.5772x + 4.406R2 = 0.9948
y = 0.9414x - 1.2358R2 = 0.9974
0.00
10.00
20.00
30.00
40.00
50.00
60.00
70.00
80.00
0.00 10.00 20.00 30.00 40.00 50.00 60.00 70.00 80.00
FEM response (ppb)
3.02
P-A
resp
onse
(ppb
)
Optec with Nafion Optec without Nafion Linear (Optec with Nafion) Linear (Optec without Nafion)
Optec without Nafion
Optec with Nafion
Figure 6-10 Photochemical Ozone Comparison with Low Precursor Concentrations. Figure 6-11 shows the response of the two 3.02 P-A units and the FEM during the ambient monitoring period of about four and one-half days. The hourly averages are shown. Close correspondence is seen of the temporal pattern of readings from the three monitors. In addition, the readings from the 3.02 P-A operated normally closely match those of the FEM in most of the period, at ozone levels from less than 10 to nearly 80 ppbv. The readings from the 3.02 P-A with the added Nafion tube do not track those of the FEM as closely.
5/30/14 Draft text for review by CASAC AMMS - Do not Cite or Quote -This draft does not reflect consensus advice and does not represent EPA policy.

0.00
10.00
20.00
30.00
40.00
50.00
60.00
70.00
80.00
6/22/0712:00
6/23/070:00
6/23/0712:00
6/24/070:00
6/24/0712:00
6/25/070:00
6/25/0712:00
6/26/070:00
6/26/0712:00
6/27/070:00
6/27/0712:00
6/28/070:00
Date and Time
Ozo
ne p
pb
49C Opt Naf Opt w/o Figure 6-11. 3.02 P-A and FEM Ambient Monitoring Results. The results of the linear regression of ambient monitoring data are shown in Figure 6-12, where the response of each 3.02 P-A unit is compared to the response of the FEM. Shown in the figure are the slope, intercept, and r2 of the linear regression for each 3.02 P-A unit. Figure 6-12 shows that the regression of data from the 3.02 P-A operated normally against the FEM data gives a slope of 0.998, an intercept of 0.19 ppbv, and an r2 value of 0.9954. These results indicate an extremely close correspondence of the 3.02 P-A data to the FEM data in the ambient monitoring period. The data from the 3.02 P-A operated with the added Nafion tube do not agree as well with the FEM data, exhibiting a slope of 0.949, an intercept of 1.6 ppbv, and an r2 of 0.93. Several data points diverge markedly from the regression line for this unit. The average RPD of the 3.02 P-A (operated without the Nafion tube) results relative to the FEM results in this test was 0.3%, with a maximum and minimum RPD of -10.7% and 0%, respectively. The maximum RPD of -10.7% occurred at the minimum ozone concentration of approximately 3 ppbv. The agreement of the Optec 3.02 P-A with the FEM was closer in the ambient monitoring than in either photochemical chamber test; this difference was particularly pronounced for the unit operating with the added Nafion tube. Although detailed air quality measurements were not made in the ambient monitoring period, it is likely that the ambient levels of co-pollutants were lower in ambient air than in either of the photochemical chamber tests. Thus the ambient results continue the trend seen in Section 6.4 of better agreement between the FEM and 3.02 P-A with lower concentrations of ozone precursors and co-pollutants.
5/30/14 Draft text for review by CASAC AMMS - Do not Cite or Quote -This draft does not reflect consensus advice and does not represent EPA policy.

y = 0.9486x + 1.6496R2 = 0.9322
y = 0.9975x + 0.1929R2 = 0.9954
0.00
10.00
20.00
30.00
40.00
50.00
60.00
70.00
80.00
0.00 10.00 20.00 30.00 40.00 50.00 60.00 70.00 80.00
FEM repsonse (ppb)
Opt
ec R
espo
nse
(ppb
)
Opt Naf Opt w/o Linear (Opt Naf) Linear (Opt w/o)
Optec without Nafion
Optec with Nafion
Figure 6-12. Linear Regression of 3.02 P-A and FEM Data During Ambient Monitoring. 6.5 Data Completeness
The total duration of the verification test was from June 12 to June 28, 2007, a period of 16 days, and the two Optec units each operated without problems for that entire period. Testing only occurred on 6 of those days. Each 3.02 P-A unit was operational for a total of 6.07 days or 100% of the testing time. Table 6-4 shows a breakdown of the operating activities of the 3.02 P-A units over those test days. Table 6-4 shows that the 6.07 days of testing of the 3.02 P-A consisted of an approximate total of 0.27 days of calibration, zeroing, and other programmed QC procedures; 4.6 days conducting the ambient air monitoring; and a combined total of 1.2 days of chamber testing. Although the combined total of hours of testing was 6.07 days, the 3.02 P-A units were running continuously throughout June 12 to June 28.
5/30/14 Draft text for review by CASAC AMMS - Do not Cite or Quote -This draft does not reflect consensus advice and does not represent EPA policy.

Table 6-4. Optec 3.02 P-A Testing Activities June 12 to 28, 2007
Activity Number of Measurement
Intervalsa Days Percent of
Time Ambient Air Monitoring 6,668 4.6 75.8% Chamber Testing 1,687 1.2 19.7% Calibration/Zeroing/Other Checks 393 0.27 4.5%
Totals 8,748 6.07 100% a: Each measurement was a one-minute average.
6.6 Operational Factors
The Optec 3.02 P-A used only electrical power with no other consumables. The 3.02 P-A required 220 V power so a converter to 120 V was used for testing. Once the 3.02 P-A was turned on, it took approximately 1 hour for the 3.02 P-A to warm up and stabilize. The 3.02 P-A has a nominal monitoring range up to 250 ppbv. When the analyzer detects ozone above 250 ppbv a repeated alarm is sounded indicating that the analyzer is over its programmed detection range. During testing, there were occasions when ozone greater than 250 ppbv was delivered to the 3.02 P-A, however the alarm would often not sound until the sampled ozone concentration reached a range of 270 to 300 ppbv. The 3.02 P-A is programmed to internally calibrate and self adjust every 10 minutes. The outcome of the internal calibration was often apparent in the data, when the values would noticeably shift every 10 minutes. The ozone reading was displayed on the panel of the 3.02 P-A in parts per million by volume (ppmv). However, the electronic data output is programmed to report readings in micrograms per cubic meter (µg/m3) at 21 degrees Celsius (oC). The electronic data used for reporting were corrected to ppbv units after testing using the actual laboratory temperature and pressure. No repair was needed during the test and the need for vendor assistance was minimal in the operation of the 3.02 P-A. The instrument manual was provided by the vendor, translated from the original Russian to English. Although the 3.02 P-A is easy to operate, the translation of the manual from Russian to English was difficult to understand in some areas. Overall the 3.02 P-A operated as expected and required no maintenance during testing. The estimated price of the base model analyzer is $5,000.
5/30/14 Draft text for review by CASAC AMMS - Do not Cite or Quote -This draft does not reflect consensus advice and does not represent EPA policy.

Chapter 7 Performance Summary
The performance of the Optec 3.02 P-A ozone analyzer was verified by a series of tests that included comparison to the EPA-established UV-absorption FEM for ozone. The particular FEM instrument used as the reference analyzer was a Thermo Environmental Model 49C (FEM EQOA-0880-047). The Optec 3.02 P-A ozone analyzer averaged a %R of 85.4 to 107.7% over a concentration range of 98 to 289 ppbv when ozone was delivered to the analyzer in dry air from the Environics Model 6400. When ozone was added to clean air in the test chamber in stepwise concentrations of 51 to 257 ppbv at high humidity (≈ 80% RH), the average %R was 93.2 to 110% relative to the response of the FEM. In dry test conditions (< 5% RH) at concentrations of 69 to 260 ppbv, the average %R of the 3.02 P-A was 83.4 to 88.3% relative to the response of the FEM. Thus the %R of the 3.02 P-A during the high humidity ozone test was higher than its %R during the low humidity chamber test. The linearity of the 3.02 P-A under humidified (≈80% RH) chamber test conditions showed a slope of 0.914, an intercept of 6.2 ppbv, and an r2 value of 0.998 over a concentration range of 51 to 257 ppbv. The linearity of the 3.02 P-A in low humidity (<5% RH) chamber conditions showed a slope of 0.838, an intercept of 1.0 ppbv, and an r2 value of 0.999 over a concentration range of 69 to 260 ppbv. The interferents tested in the environmental chamber caused no response to the 3.02 P-A. The analyzer readings remained stable and under 1 ppbv when the organic and mercury vapor interferents were added to the chamber and also when the 17-component hydrocarbon mixture and NO2 were added. The comparison between the 3.02 P-A and FEM during the photochemical test with high precursor concentrations showed a slope of 0.815, an intercept of 4.1 ppbv, and an r2 value of 0.999 over an ozone concentration range of 20 to 130 ppbv. The photochemical test with lower precursor concentrations showed a slope of 0.941, an intercept of -1.2 ppbv, and an r2 value of 0.997 over an ozone concentration range of 20 to 80 ppbv. The ambient monitoring comparison of the 3.02 P-A and FEM readings over the four day sampling period showed a slope of 0.998, an intercept of 0.19 ppbv, and an r2 value of 0.995 over an ozone concentration range of 3 to 80 ppbv. The average RPD of the 3.02 P-A relative to the FEM in the photochemical/high precursors, photochemical/low precursors, and ambient air comparisons was -14.2%, -8.0%, and 0.3%, respectively.
5/30/14 Draft text for review by CASAC AMMS - Do not Cite or Quote -This draft does not reflect consensus advice and does not represent EPA policy.

The performance of a 3.02 P-A unit operated with an added Nafion humidity equilibration tube was reduced in nearly all performance measures, relative to that reported above for the 3.02 P-A unit operated normally. The responses of the 3.02 P-A unit with the Nafion tube were reduced in chamber tests in comparison with the FEM, and that unit agreed less well with the FEM during ambient monitoring. Data completeness for the 3.02 P-A was 100%, based on its operation over a total of 6.07 test days during a 16 day operational period. Considering only those 6.07 days on which the 3.02 P-A was tested, there were 4.6 days of ambient monitoring, 0.27 days spent in calibration/ zeroing/other instrument checks, and 1.2 days total spent conducting measurements in the environmental chamber. Both 3.02 P-A units also operated without problems throughout the 16-day period in which those 6 test days occurred. The Optec 3.02 P-A was operated on a 220 V to 120 V converter during testing. When the 3.02 P-A was turned on, it took approximately 1 hour for the 3.02 P-A to stabilize and it then remained functional throughout the entire test period. A repeated alarm sounded only when the 3.02 P-A was reading ozone concentrations over range. The analyzer calibrated itself internally every ten minutes. The ozone measurements were displayed on the front panel in ppmv. No repair was needed during the test and the need for vendor assistance was minimal. Manuals were provided and although translated from Russian to English, the manuals were somewhat difficult to understand. The estimated price of the base model Optec 3.02 P-A analyzer is $5,000.
5/30/14 Draft text for review by CASAC AMMS - Do not Cite or Quote -This draft does not reflect consensus advice and does not represent EPA policy.

Chapter 8 References
1. Test/QA Plan for Verification of Chemiluminescent Ozone Analyzer, Battelle, Columbus, Ohio, June 6, 2007.
2. List of Designated Reference and Equivalent Methods, U.S. Environmental Protection
Agency, Office of Research and Development, National Exposure Research Laboratory, Issue Date: November 13, 2007, available at http://www.epa.gov/ttn/amtic/criteria.html.
3. Operation Manual for the Optec 3.02 P-A Chemiluminescent Ozone Analyzer, Optec Ltd.,
St. Petersburg, Russia, 2005. 4. Quality Management Plan (QMP) for the ETV Advanced Monitoring Systems Center,
Version 6.0, U.S. EPA Environmental Technology Verification Program, Battelle, Columbus, Ohio, November 2005.
5/30/14 Draft text for review by CASAC AMMS - Do not Cite or Quote -This draft does not reflect consensus advice and does not represent EPA policy.