527p.; not available in hard copy due to marginal community - eric
TRANSCRIPT

DOCUMENT RESUME
ED 119 783 JC 760 176
AUTHOR Perelle, Ira B.TITLE Study of the Division of Allied Health.INSTITUTION New York City Community Coll., Brooklyn, N.Y.SPONS AGENCY Health Resources Administration (DHEW/PHS), Bethesda,
Md.PUB DATE Oct 75NOTE 527p.; Not available in hard copy due to marginal
legibility of original document
SDRS PRICE MF-$1.00 Plus Postage. HC Not Available from EDRS.DESCRIPTORS Community Colleges; Employer Attitudes; *Followup
Studies; Grades (Scholastic); *Graduate Surveys;*Health Occupations Centers; *Health OccupationsEducation; Institutional Research; *Junior Colleges;Learning Laboratories; Research Design; StudentAttitudes; Student Certification; StudentCharacteristics; Teacher Attitudes
IDENTIFIERS *New York City Community College
ABSTRACTThis study examines student outcomes in the seven
curriculum programs (chemical technology, dental hygiene, dentallaboratory, medical laboratory, nursing, opthalmic dispensing, andradiologic technology) of the Division of Allied Health and NaturalSciences at New York City Community College. The following variablesare examined: student background, college grades, performance oncertification and licensure examinations, student perceptions of thecollege experience, faculty perceptions of student development,employer perceptions of student performance, and student and facultyperceptions of the Allied Health Learning Center. These factors insingle and combined form are used to evaluate student performanceduring three stages of the student's relationship with the College:pre-tenure, tenure, and post-tenure. Ten different questionnaires,sent to graduates, current students, faculty, and employers, and theofficial college records were used to compile the information in thisreport. Data are presented in 66 tables, and the questionnaires areappended. The research design Provided in this investigation can begeneralized to studies conducted by researchers in otherinstitutions. (Author/NHM)
***********************************************************************Documents acquired by ERIC include many informal unpublished
* materials not available from other sources. ERIC makes every effort ** to obtain the best copy available. Nevertheless, items of marginal ** reproducibility are often encountered and this affects the quality *
* of the microfiche and hardcopy reproductions ERIC makes available ** via the ERIC Document Reproduction Service (EDRS). EDRS is not* responsible for the quality of the original document. Reproductions ** supplied by EDRS are the best that can be made from the original. ************************************************************************

U.S. DEPARTMENT OF HEALTH,EDUCATION& WELFARENATIONAL INSTITUTE OF
EDUCATION
THIS DOCUMENT HAS BEEN REPRO-DUCED EXACTLY AS RECEIVED FROMTHE PERSON OR ORGANIZATION ORIGIN-ATING IT POINTS OF VIEW OR OPINIONS
CX, STATED DO NOT NECESSARILY REPRE-SENT OFFICIAL NATIONAL INSTITUTE OF
f- EDUCATION POSITIONpOR POLICY
a'r-4
sr4
CI14,1
NEW YORK CITY COMMUNITY COLLEGE
Of the City University of New York
STUDY OF THE
DIVISION OF ALLIED HEALTH
Ira B. Perelle, Ph.D.
BEST COPY AVAILABLE
This project was initiated by the Dean of the Division of Allied Healthand Natural Sciences and was implemented with the guidance of the Director ofEducational and Institutional Research and with the cooperation of theCoordinator of the Allied Health Learning Center and the chairpersons andfaculty of the division. It was supported by Grant No. 2 E04NU00904-03 (RF 2030),HRA, DREW.
2
The material in this publication was supportedby a grant from the Department of Health,Education and Welfare. Points of view or opinionsare those of the author and do not represent theofficial view or opinions of the Department ofHealth, Education and Welfare.

Preface
During the formative years of the community college movement
the priority of resources focused on growth. Educational energies
were directed toward attempts to keep up with increasing numbers
of students. New programs were launched, new facilities were lo-
cated or constructed and governance structures were hastily planned
to involve the community, the faculty and the students in making
decisions.
Now, as community colleges approach the beginning of the 80's,
they are experiencing the first effects of the "steady state."
Concern is expressed less with the quantity and more with the quality
of educational programs offered to students. Quality education, with
its myriad of definitions, does not depend primarily on the numbers
of students, or on the diversity of programs, or on new devices for
decision making although these factors certainly contribute. The
quality of education depends primarily on the quality of the in-.
structional program. If the community college of the future is to
realize even a modicum of its potential, faculty and administrators
will have to begin to pay as much attention to the outputs of in-
structional programs as to the number of students, buildings, and
organizational structures.
The purpose of this study was to examine student outcomes in
the seven curriculum programs of the Division of Allied Health and
Natural Sciences at New York City Community College. Outcome
measures were defined in terms of their status as descriptors of
student achievement and measured in accord with the following
variables: student background, college achievement, student per-
ceptions of the college experience, performance on certification
4

and licensure examinations, faculty perceptions of student de-
velopment, employer perceptions of student performance, and faculty
and student perceptions of an Allied Health Learning Center. These
'factors in single and combined formwereused to evaluate student per-
formance during three stages of their relationship with the college:
pre-tenure, tenure, and post-tenure. A combination of research tech-
niques were used at various stages in the investigation to collect
data. They elicited a wealth of information concerning the nature
and quality of student outputs, all of which is reported in the
following pages.
Our indebtedness to many persons is very great. This study
would not have come to fruition were it not for the cooperation of
department chairpersons and faculty in the following programs:
Program Name
Medical Laboratory(Biological Science)
Pre-Pharmacy (Chemistry)Dental HygieneDental Lab TechnologyNursingOphtlkalmic DispensingRadiologic TechnologyAllied Health Learning
Center
Prof. M. Tolkoff
Prof. T. AlfieriProf. L. WarrenProf. MartinelliProf. McGinnisProf. EvansProf. H. WiigProf. L. Beitler
Long hours and enormous amount of work were invested in the
design and data collection stages of this investigation. We would
like to acknowledge the efforts of Dr. Ira E. Perelle and members
of his staff in the implementation, tabulation and interpretation
of research data. Probably one of the most ambitious longitudinal
studies of student outcomes ever undertaken in the community college,
the research design provided in this investigation can be made

generalizeable to studies conducted by different researchers in
different institutions.
New YorkOctober 1975
6
Richard L. Alfred
August Tuosto
Lorraine Beitler

ABSTRACT
Modification of the teaching process, whether it be in
method, course content, evaluation, or any other aspect
of the formal education structure, rarely is made as a
result of a thorough, searching investigation of pro-
cedures currently used, and the utility of such procedures
for achieving desired educational objectives. The Division
of Allied Health and Sciences (the Division) of New York
City Community College (N.Y.C.C.C.) has commenced a series
of measures that may make it one of the rare educational
institutions that do take significant but considered action
as a result of the findings of a meticulous study.
This study, an evaluation of the graduaten, their back-
ground, their perceptions of Division courses, their
faculty, their employers, and the Allied Health Learning
Center, provides a knowledge base from which to implement
change to attain the sought objectives. Insome depart-
ments, graduate performance on the pertinent licensing
and/or certification examinations could be improved
to allow them to become employed in their chosen discipline.was
The Allied Health Learning Center established to provide an
internal organization with a broad mandate to reduce deficits
in basic learning skills related to science and career
curricula in the various departments.

ii
Several significant findings were discovered. It will be
found in the Graduate Biographical section that more than
40% of graduates of the Chemical Technology, Dental Labora-
tory, and Medical Laboratory departments have left their
respective disciplines for various reasons. The Graduate
Perceptions section indicates a sizeable variation in
perceived value and difficulty of course components between
departments. Chemical Technology department graduates
perceived lectures to be excellent learning experiences;
Dental Labora:ory department graduates perceived lectures
to be less effective learning experiences. Faculty are
aware that if they downgrade the level of course content
in order to reduce the difficulty of the course, they will
reduce the quality of education and thus do the student
a disservice.
Sections 2 through 7 examine graduates' perceptions of their
N.Y.C.C.C. courses, course components, instructors, and
teaching strategies in relation to the various licensure/
certification examinations. Wide variations in scores are
shown to exist within all examinations. In all departments,
some graduates required more than one attempt to pass the
licensure/certification examination. These sections also
provide the results of correlations computed between course
Li i
grades and licensure/certification examination scores.
The Faculty Analysis section is subdivided into three sub-
sections providing an analysis of the faculty of the
Division by department, an analysis of faculty per-.
ceptions of their department and students prior to open
admissions and currently, and an analysis of instruc-
tional strategies and techniques. It will be found that
faculty perceive virtually no change in their department
between the period prior to open admissions and currently,
but do perceive a sizeable difference between "regular"
students and open admissions students. Faculty perceive
a sizeable percentage of their students to be unprepared
in basic skills. The Employer Perceptions section pro-
vides a limited analysis of perceived characteristics of
N.Y.C.C.C. graduates as employees.
The Allied Health Learning Center (AHLC) section is sub-
divided into four subsections: an analysis.of AHLC clients,
both faculty and student, patterns of utilization of AHLC
services by both faculty and students, perceived effective-
ness of AHLC, and synthesis of open ended response. Among
the findings in this section is the highly significant

v
difference in attendance at Freshman Skills Laboratory by
students whose instructors explained services'available at
AHLC and students whose instructors did not explain AHLC
services. It may also be seen in this section that AHLC
appears to be understaffed to provide all tutorial services40 +host
desired who use the service and many students were completely
unaware of the services available at AHLC until requested to
complete the questionnaire for this study.
Data for this evaluation was obtained from graduates, students,
faculty and employers, as well as from official records of
graduates. Information for the Graduate Biographical section
and Graduate Perceptions section was provided by 595 graduate
respondents to questionnaires mailed to 2700 Division gradu-
ates. Appropriate licensure/certification questionnaires were
also mailed to graduates, with their responses providing part
of the data for the licensure/certification sections. Approxi-
mately 100 telephone interviews were conducted with graduates
who did not respond in writing, to verify the validity of the
mail responses. No significant differences were found between
mailed and telephone responses.
Data for the Faculty Analysis section and the faculty subsection
of AHLC was obtained by questionnaires distributed directly
to faculty. Approximately 50% return was received. Students
provided information for the student subsections of AHLC
section by responding to a questionnaire, as did employers for
the Employer Perceptions section.
10

For convenience, all tables will be found at the end of
each section of the study. Copies of all questionnaires
will be found in the appendix.
a
11
V

TABLE OF CONTENTS
vi
Page
Graduate Biographical Section 1- 27
Graduate Perceptions Section 28- 76
Dental Hygiene Section 77-119
Medical Laboratory Section 120-144
Nursing Section 145-169
Opthalmic Dispensing Section 170-201
Radiologic Technology Section 202-235
Faculty Perceptions Section 236-296
Employer Perceptions Section 297-321
AHLC Section 322-410
Questionnaires 411-499
12
vii
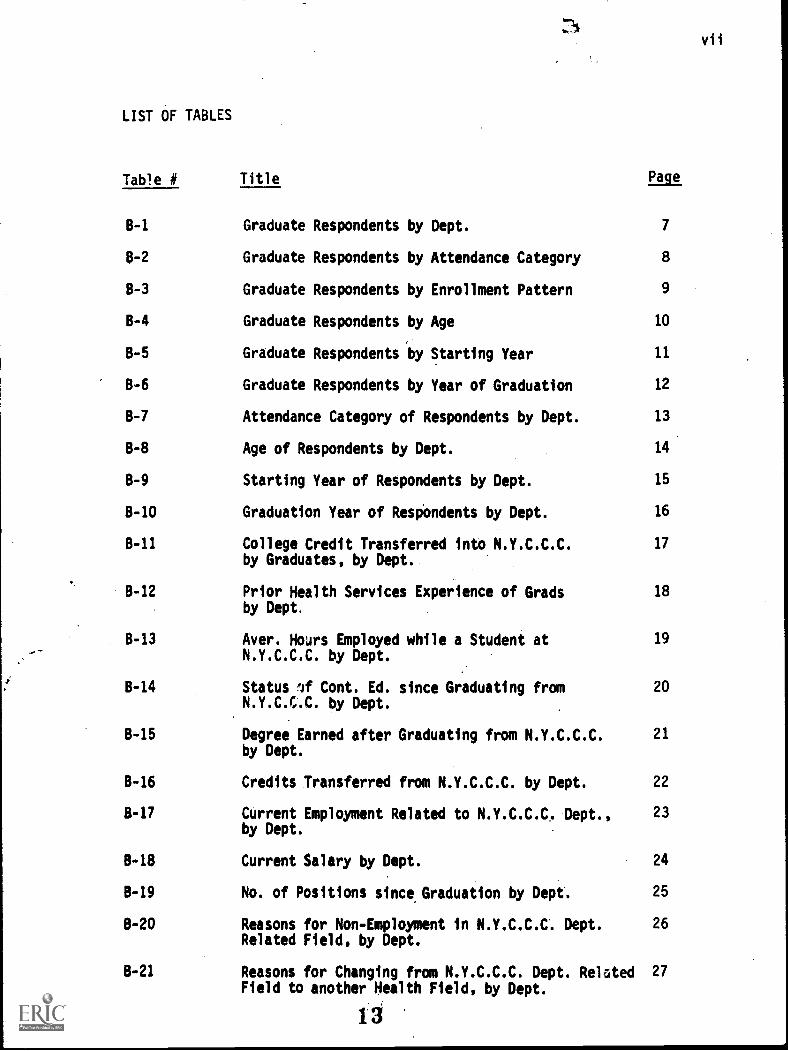
LIST OF TABLES
Table # Title Page
B-1 Graduate Respondents by Dept. 7
0-2 Graduate Respondents by Attendance Category 8
8-3 Graduate Respondents by Enrollment Pattern 9
B -4 Graduate Respondents by Age 10
B-5 Graduate Respondents by Starting Year 11
B-6 Graduate Respondents by Year of Graduation 12
B-7 Attendance Category of Respondents by Dept. 13
B-8 Age of Respondents by Dept. 14
B-9 Starting Year of Respondents by Dept. 15
B-10 Graduation Year of Respondents by Dept. 16
B-11 College Credit Transferred into N.Y.C.C.C.by Graduates, by Dept.
17
B-12
B-13
Prior Health Services Experience of Gradsby Dept,
Aver. Hours Employed while a Student at
18
19
N.Y.C.C.C. by Dept.
8-14 Status If Cont. Ed. since Graduating from 20
N.Y.C.C.C. by Dept.
8-15 Degree Earned after Graduating from N.Y.C.C.C.by Dept.
21
B-16 Credits Transferred from N.Y.C.C.C. by Dept. 22
8-17 Current Employment Related to N.Y.C.C.C. Dept.,by Dept.
23
B-18 Current Salary by Dept. 24
8-19 No. of Positions since Graduation by Dept. 25
8-20 Reasons for Non-Employment in N.Y.C.C.C. Dept. 26
Related Field, by Dept.
B-21 Reasons for Changing from N.Y.C.C.C. Dept. Related 27
Field to another Health Field, by Dept.
13

viii
Table # Title Page
GP-1 Grad. Perception of Gen. Education Lectures 40as a Learning Experience, by Dept.
GP-2 Grad. Perception of Gen. Educ. Class Discussions 41as a Learning Experience, by Dept.
GP-3 Grad. Perception of Gen. Educ. Laboratories 42as a Learning Experience, by Dept.
GP-4 Grad. Perception of Gen. Educ. Reading Materials . 43as a Learning Experience, by Dept.
GP-5 Grad. Perception of Gen. Educ. Written Assign- 44ments as a Learning Experience, by Dept.
GP-6 Grad. Perception of Gen. Educ. Teacher Comments 45as a Learning Experience, by Dept.
GP-7 Grad. Perception of Gen. Educ. Examinations 46as a Learning Experience, by Dept. 9
GP-8 Grad. Perception of Career Learning Lectures 47as a Learning Experience, by Dept.
GP-9 Grad. Perception of Career Learning Class Discus- 48sions as a Learning Experience, by Dept.
GP-10 Grad. Perception of Career Learning Laboratories 49as a Learning Experience, by Dept.
GP-11 Grad. Perception of Career Learning Reading 50Materials as a Learning Experience, by Dept.
GP-12 Grad. Perception of Career Learning Written 51
Assignments as a Learning Experience, by Dept.
GP-13 Grad. Perception of Career Learning Teacher 52
Comments as a Learning Experience, by Dept.
GP-14 Grad. Perception of Career Learning Examinations 53as a Learning Experience, by Dept.
GP-15 Grad. Perception of Difficulty of Career Learning 54Lectures, by Dept.
GP-16 Grad. Perception of Difficulty of Career Learning 55Class Discussions, by Dept.
GP-17 Grad. Perception of Difficulty of Career Learning 56Laboratories, by Dept.
GP-18 Grad. Perception of Difficulty of Career Learning 57Reading Materials, by Dept.
14

Table # Title Page
GP-19 Grad. Perception of Difficulty of Career Learning 58
Written Assignments, by Dept.
GP-20 Grad. Perception of Difficulty of Career Learning 59
Examinations, by Dept.
GP-21 Grad. Perception of Frequency of Cheating on 60Examinations, by Dept.
GP-22 Grad. Perception of Career Learning Instructorsas Teachers, by Dept.
61
GP-23 Grad. Perception of Career Learning Instructorsin Class, by Dept.
62
GP-24 Grad. Perception of Career Learning Instructors' 63Subj. Interest, by Dept.
GP-25 Grad. Perception of Career Learning Instructors' 64Stud. Interest, by Dept.
GP-26 Amount of Individual Help Sought from Instructorsby Dept.
65
GP-27 Amount of Indiv. Help Rec'd from Instructors when 66Requested, by Dept.
GP-28 Amount of Indiv. Help Offered by Instructors,by Dept.
67
GP-29 Grad. Perception of Career Learning Instructors' 68Availability for Consultation, by Dept.
GP-30 Grad. Perception of Career Learning Instructors' 69Ease of Communication, by Dept.
GP-31 Grad. Perception of Career Learning Instructors' 70
Help with Problems, by Dept.
GP-32 Grad. Perception of Career Learning Instructors' 71Help with Program Planning, by Dept.
GP-33 Grad. Perception of Career Learning Instructors' 72
Accuracy of Info., by Dept.
GP-34 Frequency of Grad. Interviews with College Coun-selor during Enrollment, byDept.
73
GP-35 Grad. Perception of EduC. Activities most Conduciveto Satisfactory Completion of N.Y.C.C.C. Curriculum
74
15
ix

x
Table # Title Page
GP-36 Perceived Difference in Techniques taught at 75N.Y.C.C.C. vs. Tech. Used, by Dept.
GP-37 Grad. Perception of N.Y.C.C.C. Curriculum as 76Career Preparation, by Dept.
DC-1 Grad. Scores on NBDHL Examination 87
DC-2 Grad. Report of # of Attempts Needed to Pass 88NBDHL
DC-3 Year of Grad. Attempts at NBDHL 89
DC-4 Grad. Report of Other Examinations Attempted 90
DC-5 Grad. Percep. of Value of Specific Courses as 91-92Prep. for Oral Inspection Section of NBDHL
DC-6 Grad. Percep. of Value of Specific Courses as 93-94Prep. for Radiographic Section of NBDHL
DC-7 Grad. Percep. of Value of Specific Courses as 95-96Prep. for Diagnostic Aids Section of NBDHL
DC-8 Grad. Percep. of Value of Specific Courses as 97-98Prep. for Prophylaxis A Section of NBDHL
DC-9 Grad. Percep. of Value of Specific Courses as 99-100Prep. for Prophylaxis B Section of NBDHL
DC-10 Grad. Percep. of Value of Specific Courses as 101-102Prep. for Topical Agents Section of NBDHL
DC-11 Grad. Percep. of Value of Specific Courses as 103-104Prep. for Oral Health Instr. Section of NBDHL
DC-12 Grad. Percep. of Value of Specific Courses as 105-106Prep. for Supportive Treatment Section of NBDHL
DC-13 Grad. Percep. of Value of Specific Courses as 107-108Prep. for Emergencies Section of NBDHL
DC-14 Grad. Percep. of Value of Specific Courses as 109-110Prep. for Community Health Section of NBDHL
DC-15 Grad. Percep. of Value of Specific Courses as 111-112Prep. for Actual Employment Conditions
DC-16 Grad. Grades for Selected Career Learning 113-114Courses
16

xi
Table # Title Page
DC-17 Grad. Percep. of Course Components for Each 115Section of NBDHL
DC-18 Grad. Percep. of Career Learning Instructors' 116
Help as Prep. for Each Section of NBDHL
DC-19 Grad. Percep. of Teaching Strategy as Best Prep. 117for Each Section of NBDHL
DC-20 Grad. Percep. of NYCCC Curriculum as Prep. for 118NBDHL
DC-21 Grad. Percep. of NYCCC Curriculum as Prep. for 119Each Section of NBDHL
MC-1 Grad. Scores on MLT/ASCP Certification Exam 127
MC-2 MLT/ASCP Certification Exam Year 128
MC-3 Grad. Report of Other Examinations Attempted 129
MC-4 Grad. Percep. of Value of Specific Courses as 130Prep. for Microbiology Section of MLT/ASCP
MC-5 Grad. Percep. of Value of Specific Courses as 131Prep. for Serology Section of MLT/ASCP
MC-6 Grad. Percep. of Value of Specific Courses as 132
Prep. for Clinical Chemistry Section of MLT/ASCP
MC-7 Grad. Percep. of Value of Specific Courses as 133Prep. for Hemotology Section of MLT/ASCP
MC-8 Grad. Percep. of Value of Specific Courses as 134Prep. for Urinalysis Section of MLT/ASCP
MC-9 Grad. Percep. of Value of Specific Courses as 135Prep. for Blood Banking Section of MLT/ASCP
MC -1O Grad. Percep. of Value of Specific Courses as 136Prep. for Parasitology Section of MLT/ASCP
MC-11 Grad. Percep. of Value of Specific Courses as 137Prep. for Actual Employment Conditions
MC-12 Grad. Grades for Selected Career Learning 138-139Courses
MC-13 Grad. Percep. of Course Component as Best Prep. 140for Each Section of MLT/ASCP

Table # Title Page
MC-14 Grad. Percep. of Career Learning Instructors' 141
Help as Prep. for Each Section of MLT/ASCP
MC-15 Grad. Percep. of Teaching Strategy as Best 142Prep. for Each Section of MLT/ASCP
MC-16 Grad. Percep. of NYCCC Curriculum as Prep. for 143MLT/ASCP
MC-17 Grad. Percep. of NYCCC Curriculum as Prep. for 144Each Section of MLT/ASCP
NC-1 Grad. Scores on Sections of NYSBLE 154
NC-2 Selected Statistics for Each Section of NYSBLE 155
NC-3 Grad. Report of # of Attempts Required to Pass 156NYSBLE
NC-4 NYSBLE Year by Attempt 157
NC-5 Grad. Percep. of Value of Specific Courses as Prep. 158for Medical Section of NYSBLE
NC-6 Grad. Percep. of Value of Specific Courses as Prep. 159for Surgical Section of NYSBLE
NC-7 Grad. Percep. of Value of Specific Courses as Prep. 160for Obstetrics Section of NYSBLE
NC-8 Grad. Percep. of Value of Specific Courses as Prep. 161for Pediatrics Section of NYSBLE
NC-9 Grad. Percep. of Value of Specific Courses as Prep. 162for Psychiatry Section of NYSBLE
NC -1O Grad. Percep. of Value of Specific Courses as Prep. 163for Actual Employment Conditions
NC-11 Grad. Grades for Selected Career Learning Courses 164
NC-12 Grad. Percep. of Course Component as Best Prep. 165for Each Section of NYSBLE
NC-13 Grad. Percep. of Career Learning Instructors' Help 166as Prep. for Each Section of NYSBLE
NC-14 Grad. Percep. of Teaching Strategy as Best Prep. 167for Each Section of NYSBLE
18
xii

Table # Title Page
NC-15 Grad. Percep. of NYCCC Curriculum as Prep. 168for NYSBLE
NC-16 Grad. Percep. of NYCCC Curriculum as Prep. 169for Each Section of NYSBLE
0C-1
OC-2
Grad. Scores on Each Section of NYSBODL
Selected Statistics Describing Sections ofNYSBODL
OC-3 No. of Attempts Necessary for Grad, to PassNYSBODL
OC-4 NYSBODL Year, by Attempt
OC-5 Grad. Attempt at Amer. Board of OpticianaryCertification Examination
180
181
182
183
184
OC-6 Grad. Percep. of Value of Specific Courses as 185Prep. for Theoretical Optics Section of NYSBODL
OC-7 Grad. Percep. of Value of Specific Courses as 186Prep. for Anatomy/Physiology Section of NYSBODL
OC-8 Grad. Percep. of Value of Specific Courses as 187Prep. for Opthalmic Disp. Section of NYSBODL
OC-9 Grad. Percep. of Value of Specific Courses as 188Prep. for Opthalmic Materials Section of NYSBODL
0C-10 Grad. Percep. of Value of Specific Courses as 189Prep. for Opthalmic Optics Section of NYSBODL
OC-11 Grad. Percep. of Value of Specific Courses as 190Prep. for Practical Dispensing Section of NYSBODL
0C-12 Grad. Percep. of Value of Specific Courses as 191Prep. for Contact Lenses Written Section of NYSBODL
0C-13 Grad. Percep. of Value of Spec. Courses as Prep. 192for Contact Lenses Oral Procedures Section of NYSBODL
0C-14 Grad. Percep. ofValue of Specific Courses as 193Prep. for Contact Lenses Fitting Section of NYSBODL
OC-15 Grad. Percep. of Value of Specific Courses as 194Prep. for Contact Lenses Practical Section of NYSBODL
0C-16 Grad. Percep. of Value of Specific Courses as 195Prep. for Actual Employment Conditions
19

xiv
Table # Title Page
OC-17 Grad. Grades for Selected Career Learning 196Courses
OC-18 Grad. Percep. of Course Component as Best Prep. 197for Fach Section of NYSBODL
OC-19 Grad. Percep. of Career Learning Instructors' 198Help as Prep. for Each Section of NYSBODL
0C-20 Grad. Percep. of Teaching. Strategy as Best 199Prep. for Each Section of NYSBODL
OC-21 Grad. Percep. of NYCCC Curriculum as Prep. for 200NYSBODL
OC-22 Grad. Percep..of NYCCC Curriculum as Prep. for 201Each Section of NYSBODL
RC-1 Grad. Scores on NYSL 210
RC-2 Grad. Percep. of Value of Specific Courses as 211-212Prep. for Radiographic Techniques Section of NYSL
RC-3 Grad. Percep. of Value of Specific Courses as 213-214Prep.. for Standard Positioning of NYSL1
RC-4 Grad. Percep. of Value of Specific Courses as 215-216Prep. for Anatomy/Physiology Section of NYSL
RC-5 Grad. Percep. of Value of Specific Courses as 217-218Prep. for X-Ray Physics Section of NYSL
RC-6 Grad. Percep. of Value of Specific Courses as ° 219-220Prep. for Radiation Therapy Section of NYSL
RC-7 Grad. Percep. of Value of Specific Courses as 221-222Prep. for Special Procedures Section of NYSL
RC-8 Grad. Percep. of Value of Specific Courses as 223-224Prep. for General Physics Section of NYSL
RC-9 Grad. Percep. of Value of Specific Courses as 225-226Prep. for Therapy Section of NYSL
RC-10 Grad. Percep. of Value of Specific Courses as 227-228Prep. for Actual Employment Conditions
RC-11 Grad. Grades for Selected Career Learning Courses 229-230
20

XV
Table # Title Page
RC-12 Grad. Percep. of Course Component as Best 231Prep. for Each Section of NYSL
RC-13 Grad. Percep. of Career Learning Instructors' 232Help as Prep. for Each Section of NYSL
RC-14 Grad. Percep. of Teaching Strategy as Best 233Prep. for Each Section of NYSL
RC-15 Grad. Percep. of NYCCC Curriculum as Prep. 234for NYSL
RC-16 Grad. Percep. of NYCCC Curriculum as Prep. for 235Each Section of NYSL
F-1 Faculty Respondents by Dept. 246
F-2 Faculty Position by Dept. 247
F-3 Faculty Rank by Dept. 248
F-4 Faculty Tenure by Dept. 249
F-5 Faculty Length of Service by Dept. 250
F-6 Faculty Prior Teaching Experience by Dept. 251
F-7 Faculty Percep. of Academic Quality of Dept. 252Prior to Open Admissions by Dept.
F-8 Faculty Percep. of Academic Quality of Dept. 253at This Time by Dept.
F-9 Faculty Percep. of Academic Quality of 254Students Prior to Open Admissions by Dept.
F-10 Faculty Percep. of Academic Quality of 255Current Regular Students by Dept.
F-11 Faculty Percep. of Academic Quality of 256Current Open Admissions Students by Dept.
F-12 Faculty Percep. of Percentage of Advanced 257Students without Necessary Knowledge or Skills
F-13 raculty Percep. of AHD Grad. with Necessary 258Knowledge and Skill for Satis. Job Performance
F-14 Faculty Percep. of Importance of Passing 259Certificatioh/Licensure Exam by Dept.
21

xvi
Table # Title Page
F-15 Fac. Perceiving Influence of Stud. Evaluation on 260
Selected Instruct. Components by Dept.
F-16 Fac. Perceiving Influence of Stud. Evaluation on 261
Selected Instruct. Components by Tenure
F-17 Fac. Percep. of Occurrence of Cheating on 262
Examinations, by Dept.
F-18 Relative Faculty Use of Lectures for General 263
Course Material by Dept.
F-19 Relative Faculty Use of Lectures for Specific 264
Certification Exam Material by Dept.
F-20 Relative Faculty Use of Seminars for General 265
Course Material by Dept.
F-21 Relative Faculty Use of Seminars for Specific 266
Certification Exam Material by Dept.
F-22 Relative Faculty Use of Laboratory for General 267
Course Material by Dept.
F-23 Relative Faculty Use of Laboratory for Specific 268
Certification Exam Material by Dept.
F-24 Relative Faculty Use of Individualized Instruction 269for General Course Material by Dept.
F-25 Relative Faculty Use of Individualized Instruction 270for Specific Certification Exam Material by Dept.
F-26 Relative Faculty Use of Evaluation and Testing for 271
General Course Material by Dept.
F-27 Relative Faculty Use of Evaluation and Testing for 272
Specific Certification Exam Material by Dept.
F-28 Relative Faculty Use of Advisement, Library Research 273
and Admin. Func. for Gen. Course Material by Dept.
F-29 Relative Faculty Use of Advisement, Library Research 274and Admin. Func. for Spec. Cert. Exam Material
F-30 Relative Faculty Use of Lectures for General 275Course Material by Rank
F-31 Relative Faculty Use of Lectures for Specific 276Certification Exam Material by Rank
F-32 Relative Faculty Use of Seminars for General 277Course Material by Rank
22

xvii
Table. # Title Page
F-33 Relative Faculty Use of Seminars for Specific 278
Certification Exam Material by Rank
F-34 Relative Faculty Use of Laboratories for 279
General Course Material by Rank
F-35 Relative Faculty Use of Laboratories for 280
Specific Certification Exam Material by Rank
F-36 Relative Faculty Use of Individualized Instruc. 281
for General Course Material by Rank
F-37 Relative Faculty Use of Indiv. Instruc. for 282
Specific Certification Exam Material by Rank
F-38 Relative Faculty Use of Evaluation and Testing 283for General Course Material by Rank
F-39 Relative Faculty Use of Evaluation and Testing 284
for Specific Certification Exam Material by Rank
F-40 Relative Fac. Use of Advisement, Libr. Research and 285Admin. Func. for General Course Material by Rank
F-41 Relative Fac, Use of Advisement, Libr. Research and 286Admin. Func. for Spec. Cert. Exam Material by Rank
F-42 Extensiveness of Use of Pass/Fail Examinations 287by Dept.
F-43 Extensiveness of Use of Curve Grading by Dept. 288
F-44 Extensiveness of Use of Behay. Objectives by Dept. 289
F-45 Extensiveness of Use of Indiv. Instr. by Dept. 290'
F-46 Extensiveness of Use of Audio/Visual Media by Dept. 291
F-47 Extensiveness of Use of Pass/Fail Exams by Rank 292
F-48 Extensiveness of Use of Curve Grading by Rank 293
F-49 Extensiveness of Use of Behay. Objectives by Rank 294
F-50 Extensiveness of Use of Indiv. Instr. by Rank 295
F-51 Extensiveness of Use of Audio/Visual Media by Rank 296
23

Table # Title .Page
EP-1 No. of NYCCC Grad. Employed by Respondents, 302by Dept.
EP-2 No. of NYCCC Grad. Previously Employed by 303Respondents, by Dept.
EP-3 Employers' Percep. of # of NYCCC Grad. Superior 304to Aver. Entry Level Employee, by Dept.
EP-4 Employers' Percep. of # of NYCCC Grad. Inferior 305to Aver. Entry Level Employee, by Dept.
EP-5 Employers' Percep. of NYCCC Graduates' Employee 306-307Characteristics
EP-6 Employers' Percep. of Chemical Technology Grad. 308-309Employeee Characteristics
EP-7 Employers' Percep. of Dental Hygiene Grad. 310-311Employee Characteristics
EP-8 Employers' Percep. of Dental Laboratory Grad. 312-313Employee Characteristics
EP-9 Employers' Percep. of Medical Laboratory Grad. 314-315Employee Characteristics
EP-10 Employers' Percep. of Nursing Grad. Employee 316-317Characteristics
EP-11 Employers' Percep. of Opthalmic Dispensing Grad. 318-319Employee Characteristics
EP-12 Employers' Percep. of Radiologic Technology Grad. 320-321Employee Characteristics
1 Faculty Respondents by Dept. 344
2 Faculty Response by Position 345
3 Faculty Response by Rank 346
4 Faculty Response by Tenure 347
5 Faculty Position by Dept. 348
6 Faculty Rank by Dept.349
7 Faculty Tenure by Dept. 350
8 Faculty Length of Service at N.Y.C.C.C. by Dept. 351
24

Table # Title Page
9 Faculty Prior Teaching Experience by Dept. 352
10 Student Respondents by Dept. 353
11 Student Attendance Category by Dept. 354
12 Student Enrollment Pattern by Dept. 355
13 Student Expected Grad. Year by Dept. 356
14 Student Starting Year by Dept. 357
15 Student Age by Dept. 358
16 Student Credits Transferred In by Dept. 359
17 Students' Prior Exper. in Health Field by Dept. 360
18 Student Salaried Employment by Dept. 361
19 Faculty Use of AHLC Services by Dept. 362
20 Faculty Use of AHLC Services by Rank 363
21 Faculty Use of AHLC Services by Tenure 364
22 Faculty Use of AHLC Services by Length of Service 365
23 Faculty Recommendation of AHLC Serv. to Studentswith Acad. Problems by Dept.
366
24 Faculty Recommendation of AHLC Serv. to Studentswith Acad. Problems by Tenure
367
25 Faculty Recommendation of AHLC Serv. to Studentswith Acad. Problems by Rank
368
26 Faculty Recommendation of AHLC Serv. to Studentswith Acad. Problems by Length of Service
369
27 Faculty Use of Modular Instr. Devel. by Dept. 370
28 Faculty Use of Modular Instr. Devel. by Tenure 371
29 Faculty Use of Modular Instr. Devel. by Rank 372
30 Fac. Use of Mod. Instr. Devel. by Length of Service 373
31 Professional Contact Between Faculty and AHLC 374Personnel per Semester by Dept.
25
xix

Table #
32
33
34
35
36
37
38
39
40
41
42
43
44
45
46
47
48
49
50
51
Title Page
Professional Contact Between Faculty and AHLC 375Personnel per Semester by Tenure
Professional Contact Between Faculty and AHLC 376Personnel per Semester by Rank
Professional Contact Between Faculty and AHLC 377Personnel per Semester by Length of Service
Faculty Awareness of AH1.0 Services by Dept. 378
Faculty Awareness of AHLC Services by Tenure 379
Faculty Awareness of AHLC Services by Rank 380
Fac. Awareness of AHLC Serv. by Length of Service 381
Explanation of AHLC Services from Instructors 382by Dept.
Recommendation of AHLC Services from Instructors 383by Dept.
Explanation of AHLC Services from Student 384Personnel Services Counselors by Dept.
Recommendation of AHLC Services from Student 385Personnel Services Counselors by Dept.
Explanation of AHLC Services from Departmental 386Acad. Advisors by Dept.
Recommendation of AHLC Services from Departmental 387Acad. Advisors by Dept.
Students Attending Freshman Learning Skills 388Laboratory by Dept.
Students Attending Effective Reading Program by Dept. 389
Students' Attendance of Effective Reading ProgramSessions by Dept.
Students Attending Open Lab Program by Dept.
Students Use of Open Lab Facility by Dept.
Students Attending Certification Seminars by Dept.
Results of 2x2 Chi Square Procedures On Source ofInformation vs. Use of AHLC Services
26
390
391
392
393
394
XX

xxi
Table # Title Page
52 Perceived Effectiveness in Instr. Aid Prep. 395
53 Perceived Benefit of Instr. Aid Prep. 396
54 Perceived Effectiveness of AHLC Stud. Serv. 391 -398
55 Perceived Effectiveness of AHLC Stud. Record 399Services
56 Perceived Effectiveness of AHLC A/V Equipment 400Services
57 Perceived Benefits of AHLC A/V Equipment 401Services
58 Perceived Effectiveness of AHLC Faculty 402Workshops
59 Perceived Effectiveness of AHLC Modular 403Instruction for Student Use
60 Perceived Value of AHLC to Students and Faculty 404of N.Y.C.C.C.
61 Student Perceived Effectiveness of Freshman 405Learning Skills Program
62 Student Perceived Effectiveness of Effective 406Reading Program
63 Student Perceived Effectiveness of Open Lab 407Program
64 Student Perceived Effectiveness of Certification 408Seminars
65 Student Perceived Responsiveness of AHLC 409
66 Student Perceived Effectiveness of AHLC by Dept. 410
27

INDEX TO QUESTIONNAIRES
Graduate Biography and Perceptions
Dental Hygiene Licensing
Medical Laboratory Certification
Nursing Licensing
Opthalmic Dispensing Licensure
Radiologic Technology Licensure
Faculty Perceptions
Employer Perceptions
Allied Health Learning Center EvaluationStudent Questionnaire
Allied Health Learning Center EvaluationFaculty Questionnaire
2
Page
412-418
419-433
434-440
441-447
448-456
457-469
470-474
475-489
490 -494
495-499

Graduate Biographical Section
29

2
Graduate Biographical Data
Graduates of the Allied Health and Natural Sciences Division of New
York City Community College (N.Y.C.C.C.) were asked to respond to
questionnaires eliciting information describing their N.Y.C.C.C.
experiences, their post-graduate education if any, their Health Services
career, their general perceptions of the various components of their
college training, and their specific perceptions of their college
training as it related to licensure/certification. This section describes
and analyzes the graduates' prior and current biographical data.
Five hundred ninety-five responses were received from graduates of
N.Y.C.C.C. Allied Health programs. An analysis of the graduates across
departments is provided in Tables B-1 through B-6. It can be seen from
Table B-1 that the greatest number of responses (271) were received from
Nursing department graduates and the smallest number (9) received from
Radiologic Technology department graduates. Table B-2 indicates that
full-time-day student graduates provided 63.9% of the responses received,
with part-time-evening student graduates providing the next highest
proportion (19.5%).

3
The enrollment pattern of almost all respondents was continuous (93.9%)
as shown in Table B-3. Data, therefore, will not be subdivided by
enrollment pattern because non-continuous enrollment graduates are too
few in number to provide meaningful results. Table B-4 provides a
distribution of graduates by age. It can be seen that the age group
containing the largest number of graduates is age 25-30 (37.8%).
Approximately 25% of the responding graduates are younger than age 25,
19.7% age 30-40, and 16.5% over age 40.
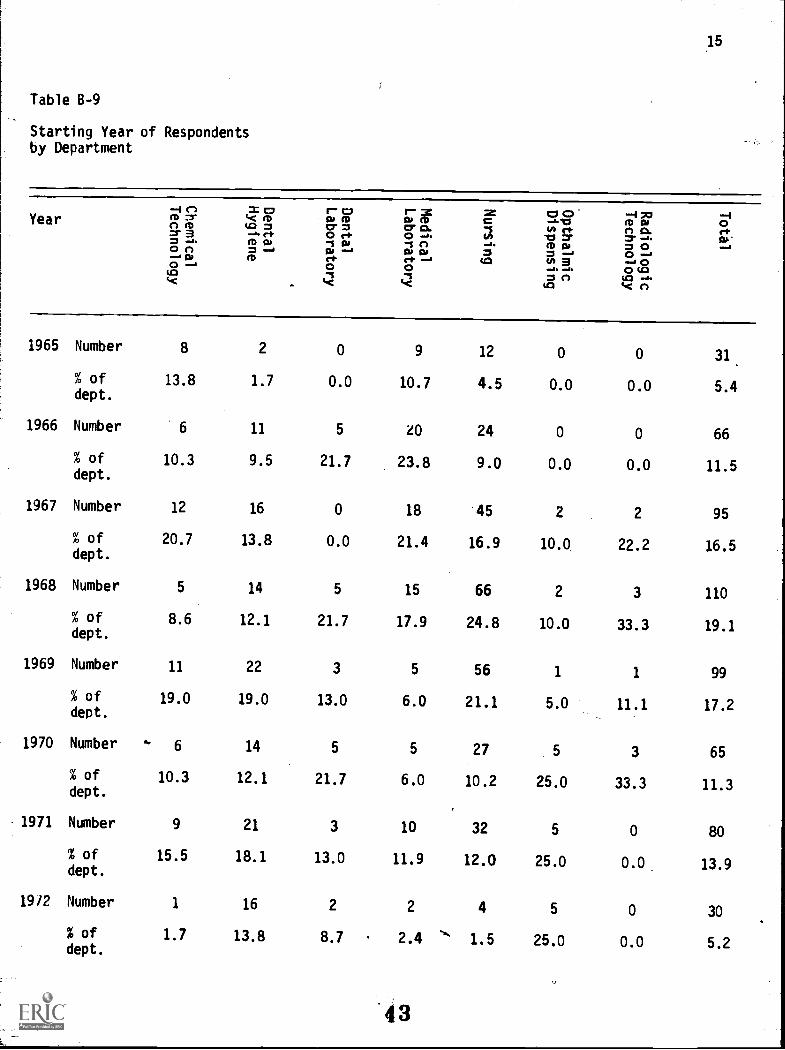
Tables B-5 and B-6 provide data describing the starting year and gradu-
ation year for responding graduates. It can be seen that the greatest
number of respondents started their training at N.Y.C.C.C. in 1968
(18.5%). The response follows a relatively normal distribution pattern
to the tails, 1965 and 1972 (5.2% and 5.0% respectively). The year
reported by the greatest number of respondents as their graduation year
was 1973 (22.2%) with a skewed distribution tapering to 1968 (8.9%).
Attendance category, age, starting year, and graduation year were
examined by department. The results are provided in Tables B-7 through
8-10. It can be seen in Table B-7 that Dental Laboratory, Opthalmic
Dispensing, and Radiologic Technology Department graduates were Full-Time-
Day students only. It may also be seen in Table B-7 that less than 50%
of the Nursing Department graduates were Full-Time-Day students. Table
B-8, providing Age data, shows that the youngest respondents tend to be
31

4
graduates of the Dental Hygiene Department; the oldest graduates tend
to be graduates of the Nursing Department. Tables 8-9 and B-10 show no
significant trends except for a slight tendency for the graduates of
1968-1970 to be from the Medical Laboratory and Nursing Departments.
Approximately 10% of responding graduates transferred 3 or more college
credits into N.Y.C.C.C. on entering, and approximately 40% of responding
graduates had prior experience in the Health Services. This data is
presented by Department in Tables B-11 and B-12. It can be seen in
Table B-11 that the total percentages of students transferring college
credit into N.Y.C.C.C. by Department tends to follow the percentages
of respondents, by Department, with the exception of Radiologic Technology
graduates who did not transfer any credits into N.Y.C.C.C. There are
no significant trends relative to credit transfer among the department.
Table 8-12.indicates that the majority of graduates with prior Health
Service experience are Nursing Department graduates with prior exper-
ience as Licensed Practical Nurses (55.6%). The next sizeable category
is Nursing Department graduates with prior experience as Aides (13.6%).
Employment during matriculation at N.Y.C.C.C. is presented in Table B-13.
It can be seen in this table that approximatelif 75% of responding
graduates were employed for a salary during their enrollment at N.Y.C.C.C.
No significant trends are evident in the data.
5
Questions eliciting information describing the graduates' post-N.Y.C.C.C.
education were included in the questionnaire. Data provided by the
responses is presented in Tables B-14 through B-16. It can be seen in
Table B-14 that of the 330 respondents (55.5%) attempting an advanced
degree program, 92 respondents (15.5%) have completed their program and
189 respondents (31.8%) are still attending. Table B-15 provides
information relative to the degrees earned, showing the B.S. degree as
that earned most often. It can also be determined from Table B-15 that
the Chemical Technology Department graduates report the largest percen-
tage of respondents receiving degrees (43.5%) and the Opthalmic Dispensing
Department graduates report the smallest percentage of respondents
receiving degrees (4.8%). Table B-16 shows that of the 303 graduates
(50.9%) transferring credit from N.Y.C.C.C. to other schools, 255 (84.2%)
transferred more than 50 credits.
Tables B-17 through B-19 describe the data relating to graduates' current
employment, and Tables B -20 and B -21 provide information indicating
reasons for current non-employment in the health field for which gradu-
ates were trained at N.Y.C.C.C. It can be noted in Table B-17 that
almost 80% of all responding graduates are employed either full time
or part time in the field for which they were trained at N.Y.C.C.C., but
this figure is deceptive. Ninety-one percent of all Nursing Department
graduates are currently employed in the nursing field, and, because
nursing graduates represent 45% of all respondents they tend to skew
the overall results. Table B-17 makes it clear that close to 50% of
33
6
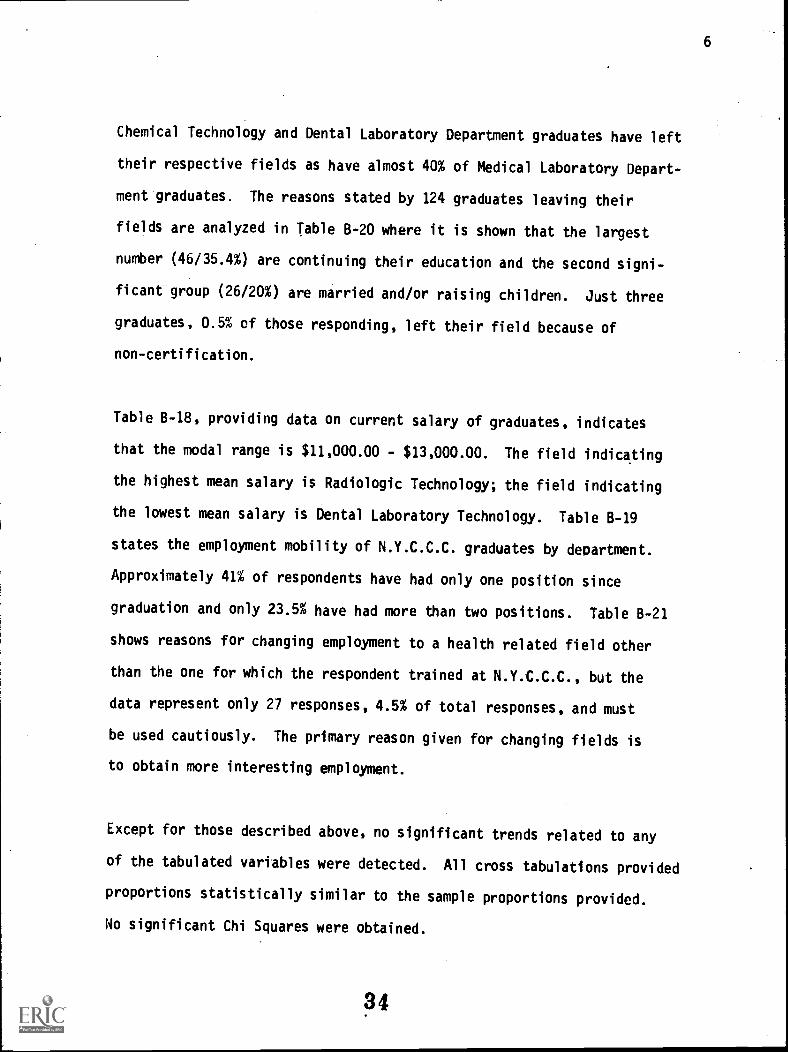
Chemical Technology and Dental Laboratory Department graduates have left
their respective fields as have almost 40% of Medical Laboratory Depart-
ment graduates. The reasons stated by 124 graduates leaving their
fields are analyzed in Table B-20 where it is shown that the largest
number (46/35.4%) are continuing their education and the second signi-
ficant group (26/20%) are married and/or raising children. Just three
graduates, 0.5% of those responding, left their field because of
non-certification.
Table B-18, providing data on current salary of graduates, indicates
that the modal range is $11,000.00 - $13,000.00. The field indicating
the highest mean salary is Radiologic Technology; the field indicating
the lowest mean salary is Dental Laboratory Technology. Table B-19
states the employment mobility of N.Y.C.C.C. graduates by department.
Approximately 41% of respondents have had only one position since
graduation and only 23.5% have had more than two positions. Table B-21
shows reasons for changing employment to a health related field other
than the one for which the respondent trained at N.Y.C.C.C., but the
data represent only 27 responses, 4.5% of total responses, and must
be used cautiously. The primary reason given for changing fields is
to obtain more interesting employment.
Except for those described above, no significant trends related to any
of the tabulated variables were detected. All cross tabulations provided
proportions statistically similar to the sample proportions provided.
No significant Chi Squares were obtained.
34

N4-ICw13C0CL
4-1ifi CG
I WC
Z E
Total
Radiologic
Technology
Opthalmic
Dispensing
Nursing
Medical
Laboratory
Dental
Laboratory
Dental
Hygiene
Chemical
Technology
01014I-I
CV
U0
CI
U,
0U1
CI..01
100
I-4
19
CV
C'el
in1- -1
.r...
U)
CN
IV
'
I-40
.r.4
0Ce)
CI.
CV
`Cr
r::.,1--I
...44-)
IW
RI
CO
4-) t04-I
MI 0.
0W
= W
S-4-I
.0to1,--
10s- ,(.0 43
.0E=4-0
ZZ
re

8
table B-2
Graduate Respondents byAttendance Category
Respondents
OS.
Full Time Part Time Full Time Part Time NoDay Day Evening Evening Response
Number 375 14 84 116 6
% of total 63.0 2.4 14.1 19.5 1.0
36
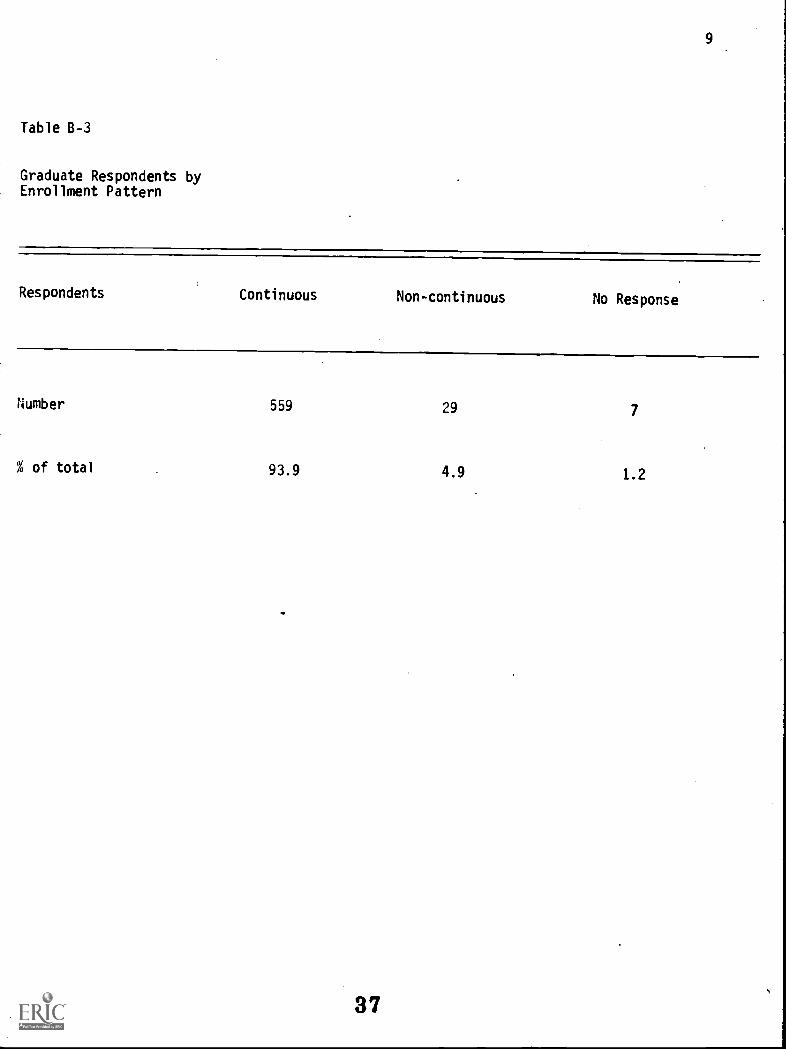
Table B-3
Graduate Respondents byEnrollment Pattern
Respondents Continuous Non-continuous No Response
Number 559 29 7
% of total 93.9 4.9 1.2
37

10
Table B-4
Graduate Respondentsby Age
Respondents 19 20 21 22 23 24 25-30 30-40 over 40 No Response
Number 1 14 19 27 43 45 225 117 98 6
% of total 0.2 2.4 3.2 4.5 7.2 7.6 37.8 19.7 16.5 1.0
38

11
Table B -5
Graduate Respondentsby Starting Year
NoRespondents 1965 1966 1967 1968 1969 1970 1971 1972 Response
Number 31 66 95 110 99 65 80 30 19
% of total 5.2 11.1 16.0 18.5 16.6 10.9 13.4 5.0 3.2
39

12
Table B-6
Graduate Respondents byYear of Graduation
NoRespondents 1968 1969 1970 1971 1972 1973 1974 1975 Response
Number 53 69 75 85 98 132 73 1 9
-% of total 8.9 11.6 12.6 14.3 16.5 22.2 12.3 0.2 1.5
40

13
Tabe 8-7
Attendance Category of Respondentsby Department
Category
-4 C, a: cp
ra7 W = V CD -4 ,D -4M -.7 4..c m
E. E . _h. . . .0 M (13 = or O. '1 W rt. 0 CL rPmr a -. eft 0 rP 0 " N 1, .75- =r -.6 ru=-a (Da "I M 'I n -A. m m 30 40 0 = .; 01 .4 M
et -a U2M Z W
= a 0 ",-. 0' m e+ a .-a 00 ..4 0 0 I :l C) UDU3"S '1 = 0 1.0 -,..
Lic Lc kic143 4.1C 0
Full time, Number 52 91 23 57 122 21 9 375Day
% ofdept.
83.9 77.1 100.0 63.3 45.9 100.0 100.0 63.7*
Part time, Number 2 5 0 1 6 0 0 14Day
% ofdept.
3,2 4,2 0.0 1.1 2.3 0.0 0.0 2.4
Full time, Number 0 12 0 13 59 0 0 84Evening
% ofdept.
0.0 10.2 0.0 14.4 22.2 0.0 0.0 14.3
Part time, Number 8 10 0 19 79 0 0 116Evening
% ofdept.
12.9 8.5 0.0 21.1 29.7 0.0 0.0 19.7
*Percent of total
41

14
Table B-8
Age of Respondentsby Department
{
Age--s (-)(D ="4CI m= a= --I.0 CI.4 0,4
0 --1<
m asI< IDUZI =. Felt) Cu= ....Am
r- asCV IDCr =0 Irt"'S0) aIre0<
r- zCV 11)Cr a.4:, I.W Wrt ....10
=C'IW..4.Z
(C)
C7 0-leoin Ft
MI =(D C1)= ...oV) a-I. -I.10
CI
-I 70ID 0n cl.= -s.= 00 a-0 (.0r
C.
..-I0Ireas
19 Number 0 1 0 0 0 0 0 1
% of dept. 0.0 0.8 0.0 0.0 0.0 0.0 0.0 0.2
20 Number 0 10 2 1 0 1 0 14
% of dept. 0.0 8.5 8.7 1.1 0.0 4.8 0.0 2.4
21 Number 1 11 0 2 3 2 0 19
% of dept. 1.6 9.3 0.0 2.2 1.1 9.5 0.0 3.2
22 Number 2 13 2 3 6 1 0 27
% of dept. 3.3 11.0 8.7 3.3 2.2 4.8 0.0 4.6
23 Number 5 17 4 4 9 '3 1 43
% of dept. 8.2 14.4 17.4 4.4 3.4 14.3 11.1 7.3
24 Number 8 15 6 4 9 1 2 45
% of dept. 13.,1 12.7 26.1 4.4 3.4 4.8 22.2 7.6
25-30 Number 31 37 8 60 72 12 5 225
% of dept. 50,8 31.4 34.8 66.7 27.0 57.1 55.6 38.2
30-40 Number 11 7 1 13 85 0 0 117
% of dept. 18.0 5.9 4.3 14.4 31.8 0.0 0.0 19.9
over 40 Number 3 7 0 3 83 1 1 98
% of dept. 4.9 5.9 0.0 3.3 31.1 4.8 11.1 16.6
15
Table 8-9
Starting Year of Respondentsby Department
Yearn
(D :7'='(-) m30 notG
1.< rDv
M
1"-' -IIN RI if 0411..0 M
73 04.4 n 0.0 et 0 12 2. dW = 0
C+ etW °-'4.0 w 9 0
o o 14. ta,*16C ta n nVC
1965 Number 8
% of 13.8dept.
1966 Number 6
% of 10.3dept.
1967 Number 12
% of 20.7dept.
1968 Number 5
% of 8.6dept.
1969 Number 11
% of 19.0dept.
1970 Number %. 6
% of 10.3dept.
1971 Number 9
% of 15.5dept.
1972 Number 1
% of 1.7dept.
2 0 9 12 0 0 31.
1.7 0.0 10.7 4.5 0.0 0.0 5.4
11 5 10 24 0 0 66
9.5 21.7 23.8 9.0 0.0 0.0 11.5
16 0 18 45 2 2 95
13.8 0.0 21.4 16.9 10.Q 22.2 16.5
14 5 15 66 2 3 110
12.1 21.7 17.9 24.8 10.0 33.3 19.1
22 3 5 56 1 1 99
19.0 13.0 6.0 21.1 5.0 11.1 17.2
14 5 5 27 5 3 65
12.1 21.7 6.0 10.2 25.0 33.3 11.3
21 3 10 32 5 0 80
18.1 13.0 11.9 12.0 25.0 0.0 13.9
16 2 2 4 5 0 30
13.8 8.7 . 2.4 "* 1.5 25.0 0.0 5.2
.43

16
Table 8-10
Graduation Year of Respondentsby Department
-1 c-)Year n mz- 3= -..
x cmU2 =-. reip Ey
:UT E
0 rob-s ss,
flis 0.o ...-s non..- cu= .....4
t'DAOre aset -a0 -... 0 0
(.G 4.( C
= v 0 -4 72 ...1c ...a. -0 I'D 121 0"I U1 re 0 O. reU) -0 = = -.. ss,.... CD 120 3o .....= >-r 0 .1
U2 a 0..o. ..s. 0 (0.
U2 l< n
1968 Number 8 12 4 18
% of 13.3 10.2 17.4 20.7dept.
1969 Number 6 14 1 17
% of 10.0 11.9 4.3 19.5dept.
1970 Number 9 9 5 12
% of 15.0 7.6 21.7 13.8dept.
1971 Number 13 14 3 10
% of 21.7 11.9 13.0 11.5dept.
1972 Number 11 19 4 4
% of 18.3 16.1 17.4 4.6dept.
1973 Number 12 25 4 16
% of 20.0 21.2 17.4 18.4dept.
1974 Number 1 25 2 9
% of 1.7 21.2 8.7 10.3dept.
1975 Number 0 0 0 1
% of 0.0 0.0 0.0 1.1dept.
14
11 0 0 53
4.1 0.0 0.0 9.0
27 2 2 69
10.0 10.0 22.2 11.8
36 1 3 75.
13.4 5.0 33.3 12.8
43 2 0 85
16.0 10.0 0.0 14.5
53 5 2 98
19.7 25.0 22.2 16.7
69 4 2 132
25.7 20.0 22.2 22.5
30 6 0 73
11.2 30.0 0.0 12.5
0 0 0 1
0.0 0.0 0.0 0.2

17
Table B-11
College Credit Transferred into N.Y.C.C.C.by Graduates, by Department
CreditsTransferred
-I (-) S 0 r- co z czt CI -4 73 .-4CD 7" 4.< at W m il c -.4.'0 CD 411 o0 CD 40 = Cr = 'I 4/1 ef 0 0. c+= 9 -I- t-+ 0 r 0 -. 0 10 ? = -.. 0,0 CI = ....A W ....6 W W = = .w..1 0 ....1..I Op CD el. el --+ CO v. a -00 -I o o o cok<to
-.sl< -.si< 10i n
3-5 Number 1 0 1 0 5 2 0 9
%* 16.7 0.0 100.0 0.0 17.9 40.0 0.0 15.0**
6-10 Number 1 5 0 2 9 1 0 18
% 16.7 41.7 0.0 25.0 .32.1 20.0 0.0 30.0
11-15 Number 0 7 0 1 6 0 0 14
% 0.0 58.3 0.0 12.5 21.4 0.0 0.0 23.3
16-20 Number 2 0 0 1 3 0 0 6
% 33.3 0.0 0.0 12.5 10.7 0.0 0.0 10.0
21-25 Number 0 0 0 3 1 0 0 4
% 0.0 0.0 0.0 37.5 3.6 0.0 0.0 6.7
26-35 Number 1 0 0 0 4 1 0 6
% 16.7 0.0 0.0 0.0 14.3 20.0 0.0 10.0
36-50 Number 1 0 0 1 0 0 0 2
% 16.7 0.0 0.0 12.5 0.0 0.0 0.0 3.3
51-75 Number 0 0 0 0 0 0 0, 0.
% 0.0 0.0 0.0 0.0 0.0 0.0 0.0 0.0
76-100 Number 0 0 0 0 0 1 0
% 0.0 0.0 0.0 0.0 0.0 20.0 0.0
Percentage of department transferring credits**Percentage of total transferring credits
45

18
Table B-12
Prior Health Services Experienceof Graduates by Department
Experiencem--i CI
7"? a0 4,.11 at
0 ....4tO
2 VP.4.0 117
...1. frt
= .....ID
r- C7DI 00 clal ....44+0'II<
11, W0 emk
CY PO(-I. ...a0'1lC
=C0=40
C7 0-e -1Z7
V 7'= .....
441 3... ..
fttLI
CD--1 70IVA O.S J.o
0...a....a0i00 J.t.c n
0..-1c+a
Aide Number 1 11 0 5 33 0 1 51
%* 8.3 73.3 0.0 20.0 18.0 0.0 50.0 20.9**
LPN Number 0 0 0 1 135 0 0 136
0.0 0.0 0.0 4.0 73.8 0.0 0.0 55.9
Technician Number 8 4 3 15 8 3 0 41
66.7 26.7 100.0 60.0 4.4 100.0 0.0 16.9
Orderly Number 0 0 0 0 1 0 1 2
0.0 0.0 0.0 0.0 0.5 0.0 50.0 0.8
Corpsman Number 3 0 0 4 6 0 0 13
25.0 0.0 0.0 16.0 3.3 0.0 0.0 5.3
*Percentage of Department with prior experience
**Percentage of total with prior experience
46

19
Table 8-13
Average Hours Employed while aStudent at N.Y.C.C.C. by Department
Hours-4 Cl T E'A \ Z F
0 rt= M 0 "1 00 gy
o 04.<
g6-. 0.0 _...0
00 00
04
1.11
ua
0 01/1 et-M aan
7JM0 0.Z 00 ...I00 10U:1 J.4C
01Cl.
1-10 Number 12 26 4 12 20 5 0 79
% ofdept.
25.5 29.9 26.7 19.7 9.6 29.4 0.0 17.9
11-20 Number 17 34 5 17 54 7 2 136
% ofdept.
36.2 39.1. 33.3 27.9 25.8 41.5 33.3 30.8
21-30 Number 6 10 6 6 28 3 1 60
% ofdept.
12.8 11.5 40.0 9.8 13.4 17.6 16.7 13.6
31-40 Number 9 15 0 21 98 1 3 147
% ofdept.
over 40 Number
19.1
3
17.2
2
0.0
0
34.4
5
46.9
9
5.9
1
50.0
0
33.3
20
% ofdept.
6.4 2.3 0.0 8.2 4.3 5.9 0.0 4.5
47

20
Table B-14
Status of Continuing Education sinceGraduating from N.Y.C.C.C. by Department
Statusr-- to z -4 x, -4., . . .... . a. .cr .
ail" Fr!-s CI 0. et0 et 0 V 7' Z" -a. a'A ...a. 0 al = 0Op -.I an 01 Z = .1 0 .1rt re tin Vi 3 -.a 0o 0 J. J. 0 tin
li< li< CI 44C n
Attending, Number 11Full time
% of 23.4dept.
Attended Number 16Full time,Completed % of 34.0
dept.
Attended Number 3Full time,Withdrew % of 6.4
dept.
AttendingPart time
AttendedPart time,Completed
Number 10
% of 21.3dept.
Number 4
% of 8.5dept.
Attended NumberPart time,Withdrew % of
dept.
Percent of total
3
6.4
7 2 11 41 4 0 76
18.4 16.7 17.5 26.3 40.0 0.0 23.0*
7 3 16 30 0 3 75
18.4 25.0 25.4 19.2 0.0 75.0 22.7
1 4 5 4 1 1 19
2.6 33.3 7.9 2.6 10.0 25.0 5.8
17 3 20 61 2 0 113
44.7 25.0 31.7 39.1 20.0 0.0 34.2
1 0 5 7 0 0 17
2.6 0.0 7.9 4.5 0.0 0.0 5.2
5 , 0 6 13 3 0 30
13.2 0.0 9.5 8.3 30.0 0.0 9.1
18

21
Table B-15
Degree Earned After Graduatingfrom N.Y.C.C.C. by Department
Degree-4 c--) 2 0 0 .-I 7;ZO -4do =" ,...f
E. F c ...a.V no a. 0el a) tr' 0. -i
En .. r,... a -..re 0 cl 0 -4. on = -I. cu
= . irto cu , cu ..o. = 0 ...aO 0 = .... al ...4 onion.= 0 ...a....I Qj M CP Ci.... U2 us 3 ....1 0O --, 0 0 ea. ...11. 0 Latta
tO= n lei .n4.%IC
16C 4.0 i.<
B.A. Number 1 2 3 3 7 0 0 16% ofdept.
3.7 14.3 60.0 10.3 14.6 0.0 0.0 12.6*
B.S. Number 24 9 2 21 34 1 3 94% of
dept.88.9 64.3 40.0 72.4 70.8 100.0 100.0 74.0
M.A. Number 0 0 0 0 1 0 0 1
% of
dept.0.0 0.0 0.0 0.0 2.1 0.0 0.0 0.8
M.S. Number 2 3 0 5 5 0 0 15% of
dept.7.4 21.4 0.0 17.2 10.4 0.0 0.0 11.8
M.D.,Ph.D. Number 0 0 0 0 1 0 0 1
% ofdept.
0.0 0.0 0.0 0.0 2.1 0.0 0.0 0.8
*Percent of total
49.

22
Table B-16
Credits Transferred from N.Y.C.C.C.by Department
_., el ,TF EFr-
tr. ff.zc c; c)_...c, -.I '2
M W..40Credits m :vs
n m-1 w er n a. r+= 0 ..... ,,. 0 r+ 0 -6 to -0 :r = -.., at= .... m DI - W -11 no A = 4,-, CU -, OW.- gy CD r+ re -0 .., 0
il42kic Q
1-10 Number 0 1 0 0
% of 0.0 3.1 0.0 0.0dept.
11-20 Number 0 2 2 0
% of O.0 6.3 20.0 0.0dept.
21-30 Number 1 3 2 1
% of 2.1 9.4 20.0 1.7dept.
31-40 Number 0 . 2 0 2
% of 0.0 6.3 0.0 3.3dept.
41-50 Number 5 1 0 3
% of 10.6 3.1 0.0 5.0dept.
Over 50 Number 41 23 6 54
% of 87.2 71.9 60.0 90.0dept.
*Percent of total
50.
_,.
=tom go7 ..-1ut 9..i. -.7
U2
= o0 --a 001.0C)"
0 1 0 2
0.0 14.3 0.0 0.7*
0 0 0 4
0.0 0.0 0.0 1.3
4 1 0 12
2.8 14.3 0.0 4.0
10 2 0 16
6.9 28.6 0.0 5.3
5 0 0 14
3.5 0.0 0.0 4.6
125 3 3 255
86.8 42.9 100.0 84.2

23
Table 8-17
Current Employment Related to N.Y.C.C.C.Department, by Department
RelatedEmployment
= pp r- CD r" x Z gm o -I 73 ....I(< (D SU tD CU fD C -t -0 toCU 0UZI 3 CT 3 0- 0. , tn et 0 0. el--8. r 0 et 0 -I. IA "0 = = ,*0a+ .41 OP .1 CI -I. tea = o= . a, ...I WP WP = = .....i 0 .,0 et r+ -1 UD H 9 - 0O 0 ..a -a. 0 t.0"I = n 4.0 .4C-1
4.< ILI 4.< n
Yes, Number 30 66 11 46 215 17 8 393Full time
% ofdept.
48.4 55.5 47.8 51.1 79.3 80.9 8.9 66.1
Yes, Number 3 28 1 10 33 2 1 78Part time
% ofdept.
4.8 23.5 4.4 11.1 12.2 9.5 1.1 13.1
No Number 29 25 11 34 23 2 0 124
% ofdept.
46.7 21:0 47.8 37.8 8.5 9.5 0.0 20.8
Percent of total
51

24
Table B-18
Current Salaryby Department
Salary(Dollars)
IT c, CD -4
obiEl El. c ,..,. m m 0.1 u, r+ n 0. e.o r+ 0 .... w -o = mr...6 w
, 110 , 0 M W 7OP 6 a sal 7 = a 0CP eir --. (In u a -, 0o o .... -I. 0 (0, 7cic 4.1c ti] 4.1C 0
Less than Number5,000
% ofdept.
5,000- Number7,000
% ofdept.
7,001- Number9,000
% ofdept.
9,001- Number11,000
% ofdept.
11,001- Number13,000
% ofdept.
13,001- Number15,000
% ofdept.
15,001- Number17,000
% ofdept.
Over Number17,000
% ofdept.
*Percent of total
1 8 4 9 10 1 0 33
2.1 8.2 20.0 12.3 3.9 5.9 0.0 6.3*
1 13 1 7 14 1 0 37
2.1 13.3 5.0 9.6 5.5 5.9 0.0 7.1
10 18 10 8 7 0 0 53
20.8 18.4 50.0 11.0 2.7 0.0 0.0 10.2
12 40 2 20 24 3 1 102
25.0 40.8 10.0 27.4 9.4 17.6 11.1 19.6
14 12 0 8 102 6 3 145
29.2 12.2 0.0 11.0 39.8 35.3 33.3 27.8
6 5 2 14 71 3 2 103
12.5 5.1 10.0 19.2 27.7 17.6 22.2 19.8
1 2 0 4 22 1 3 33
2.1 2.0 0.0 5.5 8.6 5.9 33.3 6.3
3 0 1 3 6 2 0 15
6.3 0.0 5.,0 4.1 2.3 11.8 0.0 2.9
'52

25
Table B-19
Number of Positions sinceGraduation by Department
Positions-4 (-) = C7 I- C) = C7 0 -I A, --IfD ? < fD 111 M la., cf. c .....0 m a, 0A m ,0 = 0- 0 --s u, cl. m 0. c+= a -... rt. 0 re 0 ...s. tog* "CI S 7- -I. W= e M al , 171 -"S A r. fD 1:11 = 0 --O A = -.1 as ..a W W = = .... so --e. a, m ch e+ -r tO fn a -' 0O . 0 0to
12- s 9-s = n .,< 1.c 1.c to t< n
1 Number 23 34 7 26 90 5 3 197
% ofdept.
44.2 34.7 36.8 36.6 46.9 35.7 37.5 41.6
2 Number 16 28 6 27 78 6 4 165
% ofdept.
30.8 28.6 31.6 38.0 37.0 42.9 50.0 34.9
3 Number 9 26 2 15 17 3 1 73
% ofdept.
17.3 26.5 10.5 21.1 8.1 21.4 12.5 15.4
4 Number 2 6 2 2 11 0 0 23
% ofdept.
3.8 6.1 10.5 2.8 5.2 0.0 0.0 4.9
5 Number 1 1 2 1 5 0 0 10
% ofdept.
1.9 1.0 10.5 1.4 2.4 0.0 0.0 2.1
More Numberthan
1 3 0 0 1 0 0 5
5 % ofdept.
1.9 3.1 0.0 0.0 0.5 0.0 0.0 1.1
53

26.
=
Table B-20
Reasons for Non-employment in N.Y.C.C.C.Department Related Field, by Department
Reasonsn
mmz-
0 n
i04.<
4 if
m m
CU a)
o et
et0(a<
CU ifCT O.0 -a.nCU CU
0(4c
C-5WJP.=ua
GO-6104n et"0 3"M W= ...AIn-
a= nua
-470fD Doel O.= -.I.= 00 .....0-,00 (0ua ..
nJ.
44c
-404-4*
w4
Continuing Number 15 2 2 12 12 3 0 46Education
% ofdept.
51.7 8.0 18.2 38.7 40.0 75.0 0.0 35.4
Inadequate Number 4 0 2 2 0 0 0 8Salary
% ofdept.
13.8 0.0 18.2 6.5 0.0 0.0 0.0 6.2
Marriedand/or
Number 0 12 1 8 5 0 o. 26
Raising
Children% ofdept.
0.0 48.0 9.1 25.8 16.7 0.0 0.0 20.0
Health Number 0 3 0 0 2 0 0 5
% ofdept.
0.0 12.0 0.0 0.0 6.7 0.0 0.0 3.8
Loss of Number 1 1 3 0 0 0 0 5Interest
% ofdept.
3.4 4.0 27.3 0.0 0.0 0.0 0.0 3.8
No Positions Number 5 2 3 7 3 0 0 20Available
% ofdept.
17.2 8.0 27.3 22.6 10.0 0.0 0.0 15.4
Not Number 0 3 0 0 0 0 0 3Certified
% ofdept.
0.0 12.0 0.0 0.0 0.0 0.0 0.0 2.3
Other NUmber 4 2 0 2 8 1 0 17
% ofdept.
13.8 8.0 0.0 6.5 26.7 25.0 0.0 13.1
5

.
27
Table B-21
Reasons for Changing from N.Y.C.C.C.Department Related Field to AnotherHealth Field, by Department
Reasons-1 C")M 3'0 M=. 3= J.-J 0 0al0 .."
4514C
T crCMta 3-... crMa= ....,(D
r-CU m0' 3o ,-+'"S gl,a, ....,r+0'1
4.0
a mIT CI.o -,."1 CIal alc+ -.o
l<.1
'Z..c''S(A-I.=
1.0
C2 Co-wotil chizi =M W= 4in aI IotO= CI
-I xim su0 Q.=3o0 ..'- o0 XI
ttZ -J.4C 0
-IoetW
Better Number 2 0 2 2 1 1 0 8Salary
% ofdept.
20.0 0.0 40.0 33.3 25.0 100.0 0.0 29.6
More Op-portunityfor
Advance-ment
Number
% ofdept.
4
40.0
0
0.0
1
20.0
1
16.7
1
25.0
0
0.0
0
0.0
7
25.9
More Number 2 0 0 0 0 0 0 2PositionsAvailable % of
dept.20.0 0.0 0.0 0.0 0.0 0.0 0.0 7.4
More Number 2 1 2 3 2 0 0 10InterestingEmployment % of
dept.20.0 100.0 40.0 50.0 50.0 0.0 0.0 37.0
55

28
Graduate Perception Section
56

29
414
This section of the Evaluation of the Allied Health Division of New
York City Community College analyzes the perceptions, of graduates of
the Division, of their courses, their former instructors, and their
curriculum. Graduates were asked to rate components of their courses
in terms of career preparation difficulty and value as a learning
experience, and were asked to rate their instructors in terms of
ability, interest, assistance provided, etc.
The result of graduate perception analysis is subdivided by department
and is presented in three subsections:
Course Perceptions
Instructor Perceptions
Curriculum Perceptions.
All results are provided in the appendix to this section.

Course Perceptions
30
Graduates were asked to rate components of their General Education courses
as learning experiences. The components rated were:
Lectures
Class Discussions
Laboratories
Reading Materials
Written Assignments
Teacher Comments
Examinations.
The results of these ratings by Department, can be found in Tables GP 1
through GP 7. The overall results were fairly consistent for the seven
categories; 7%-15% perceived the various components as excellent learning
experiences, 20%-35% as very good learning experiences, 35%-50% as good
learning experiences, 8%-21% as fair learning experiences, and 1%-4% as
poor learning experiences.
There were considerable variations by department. Chemical Technology
graduates perceived lectures, laboratories, and reading materials to be
excellent learning experiences at a greater rate than other department
graduates and did not perceive these same components to be poor in any
instance. Dental Laboratory graduates did not perceive lectures or written
assignments to be excellent learning experiences at all, and did perceive
lectures, class discussions, written assignments, and reading materials to
be poor learning experiences at a greater rate than other departments.
58

31
Very few respondents (10: 2-Dental Hygiene; 6-Nursing) perceived examina-
tions to be poor learning experiences, but a greater proportion of
respondents perceived them to be fair learning experiences than any other
component. Opthalmic Dispensing graduates tended to rate components
higher than graduates of any other department.
Graduates were asked to rate their perceptions of the same components
of their Career Learning courses as learning experiences. The results
of their ratings are presented in Tables GP 8 through GP 14. It can be
seen in these tables that the range of graduates' perceptions in each
category is at considerable variance from the ranges perceived in general
education courses. The range of percentage of graduates perceiving
components as excellent learning experiences was 7% to 15% for general
education courses and was 10% to 25% for Career Learning courses. The
range of percentage of graduates perceiving Career Learning components
as very good learning experiences was 25% to 35%; as good: 28% to 41%;
as fair: 6% to 20%; as poor: 0.5% to 2.8%.
Overall, the highest percentage of graduates perceived Career Learning
lectures and laboratories as excellent learning experiences, and the
lowest percentage of graduates perceived Career Learning written assign-
ments and examinations as excellent learning experiences. The highest
percentage of graduates perceived career learning laboratories and
written assignments as poor learning experiences and the lowest percentage
of graduates perceived lectures and examinations as poor learning
experiences.
59

32
By department, Chemical Technology and Opthalmic Dispensing graduates had
a higher perception of the quality of most components than other depart-
ment graduates although for the laboratory component 50% of the Dental
Laboratory graduates perceive an excellent rating. The lowest quality
rating for most components was perceived by Dental Laboratory graduates.
Graduates rated their peteptions of the difficulty of the various com-
ponents (excluding Teacher Comments) of their Career Learning courses.
These perceptions are given in Tables GP 15 through GP 20. It can be
observed that the percentage of graduates whose perception of difficulty
of the various components is extremely difficult or very difficult ranges
from 0.3% to 5.5%. The majority of graduates perceived most components
as not difficult with the exception of Career Learning laboratories and
examinations, which were perceived as somewhat difficult. Classroom
discussions was perceived as the easiest component by approximately 25%
of the responding graduates.
When analyzed by department, Chemical Technology graduates, appear to
rate the highest perceived difficulty in all components except Laboratory.
A higher percentage of Opthalmic Dispensing graduates tend to perceive
the various components as easy than do graduates of other departments.
Graduates of the division were asked their perception of the frequency
of cheating on examinations. This data is presented in Table GP 21.
It can be seen that, almost 50% of the graduates perceived cheating on
examinations as rare, while 19% perceived cheating as occurring often,
60

33
very often, or always. By department, Dental Hygiene graduates perceived
cheating to a significantly greater level than any other department
(p <.04).
When compared with faculty perceptions of cheating on examinations (see
Table F-17, Faculty Perception Section), the graduate perceptions appear
more widely dispersed. Faculty reporting perceptions greater than "some-
times" was 3.3%; graduates 17.6%. Faculty reporting perceptions of
"sometimes" was 58.1%; graduates 32.9%. Faculty reporting perceptions
less than "sometimes" was 35.5%; graduates 47.5%. Graduates generally
perceived a greater amount of cheating than did faculty. As indicated
above, Dental Hygiene graduates perceived significantly more cheating
than did other departments. Similarly, Dental Hygiene faculty perceived
more cheating than did faculty of other departments.
Instructor Perceptions
34
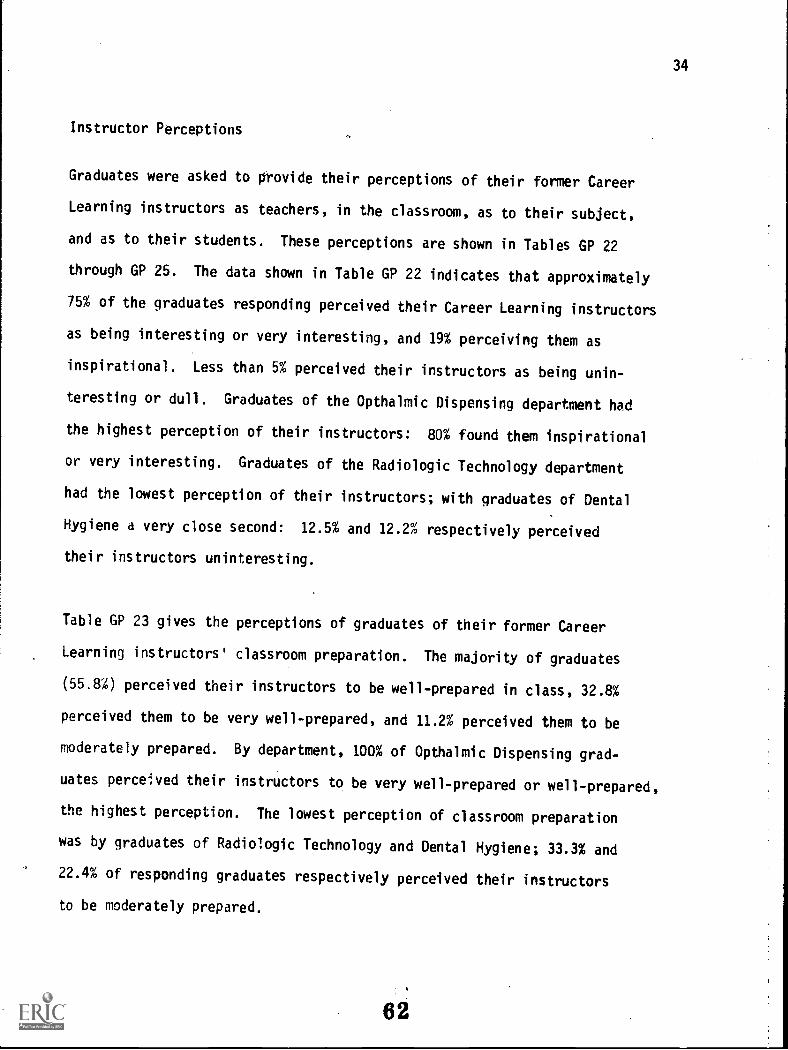
Graduates were asked to provide their perceptions of their former Career
Learning instructors as teachers, in the classroom, as to their subject,
and as to their students. These perceptions are shown in Tables GP 22
through GP 25. The data shown in Table GP 22 indicates that approximately
75% of the graduates responding perceived their Career Learning instructors
as being interesting or very interesting, and 19% perceiving them as
inspirational. Less than 5% perceived their instructors as being unin-
teresting or dull. Graduates of the Opthalmic Dispensing department had
the highest perception of their instructors: 80% found them inspirational
or very interesting. Graduates of the Radiologic Technology department
had the lowest perception of their instructors; with graduates of Dental
Hygiene a very close second: 12.5% and 12.2% respectively perceived
their instructors uninteresting.
Table GP 23 gives the perceptions of graduates of their former Career
Learning instructors' classroom preparation. The majority of graduates
(55.8%) perceived their instructors to be well-prepared in class, 32.8%
perceived them to be very well-prepared, and 11.2% perceived them to be
moderately prepared. By department, 100% of Opthalmic Dispensing grad-
uates perceived their instructors to be very well-prepared or well-prepared,
the highest perception. The lowest perception of classroom preparation
was by graduates of Radiologic Technology and Dental Hygiene; 33.3% and
22.4% of responding graduates respectively perceived their instructors
to be moderately prepared.
62
35
Graduates' perception of the interest of their Career Learning instructors
in their subject is shown in Table GP 24. It can be seen that 56,7% of
graduates perceived their former instructors to be interested, 31.8%
perceived their former instructors to be enthusiastic, and 11.1% perceived
some interest. By department, 100% of Opthalmic Dispensing graduates
perceived enthusiastic or interested instructors, while 96% of Chemical
Technology graduates perceived similar subject interest. Dental Hygiene
and Radiologic Technology graduates perceived the least subject interest
in their former instructors.
Table GP 25 analyzes graduates' perceptions of their former instructors'
interest in students. Forty-five percent perceived their instructors
to be concerned, 28.5% perceived their instructors to have some concern
for their students, and 24.5% perceived their instructors to be very
concerned. Graduates of Opthalmic Dispensing department perceived the
greatest concern in their instructors: 70% perceived instructors to.be
very concerned. Dental Hygiene and Chemical Technology graduates per-
ceived least concern in their former instructors.
The amount of individual assistance sought from, received from, and
offered by former instructors can be seen in Tables GP 26, GP 27, and
GP 28. Most graduates (72.6%) requested individual help seldom or a
few times, while 17.7% requested help often or very often, and 9.6% never
requested individual help. Of those requesting individual help, 69%
received the help they requested often or very often, 21.9% reported
6.3

receiving requested help a few times, and 9.2% reported seldom or never.
Opthalmic Dispensing graduates reported requesting and receiving the
greatest amount of individual help. Dental Hygiene graduates requested
the least individual help: 48.7% reported seldom or never requesting
assistance; they also reported receiving the least individual help:
16.7% reported seldom or never receiving assistance when needed.
The amount of individual help offered by instructors without being
requested is tabulated in Table GP 28. Thirty-four percent of reporting
graduates perceived instructors as offering help often, 22.1% reported
a few times, 21.7% reported very often, 15.0% reported seldom, and 6.7%
reported never. The greatest amount of individual help offered, by
department, was reported by Radiologic Technology graduates: 87.5%
responded very often and often. The least perceived offered individual
help was by graduates of Dental Hygiene department: 35.0% reported
individual help was offered seldom or never.
Tables GP 29 through.GP 33 provide graduates' perceptions of their Career
Learning instructors on non-teaching functions. The functions specified
are:
Availability for consultation
Ease of communication
Help with problems
Help with program planning
Accuracy of information.
64
36

37
It can be seen in these tables that the correlation perceived between
non-teaching tasks is relatively high. The most common response to
this section was usually, chosen by 35% to 51% of respondents. The
range of percentage was 31% to 36% for always, 10% to 20% for sometimes,
1.6% to 6.6% for seldom and 0.4% to 3.8% for never.
The non-teaching category receiving the highest percentage of positive
responses was Accuracy of information: 87.3% selected always or usually;
2.4/0 selected seldom or never. The non-teaching category receiving the
lowest percentage of positive responses was Help with program planning:
69% selected always or usually; 10.4% selected seldom or never. As is
apparent in prior analysis, Opthalmic Dispensing graduates rated their
former instructors highest: 95% to 100% selected always or usually
for all non-teaching functions. Dental Hygiene graduates rated their
former instructors lowest: 4.4% to 17.4% selected seldom or never for
all non-teaching functions.
Data indicating the frequency of college counselor interviews by graduates
of the division is presented in Table GP 34. It is apparent that 62.7%
of the responding graduates did not see a college counselor at all during
their enrollment at N.Y.C.C.C. Wthe 37.3% who did report interviews
with a college counselor 62.2% reported 1 or 2 visits, 28.9% reported 3 to
5 visits, and 9.1% reported more than 5 visits. With the exception of
Radiologic Technology graduates, graduates of all departments reported
similar visit percentages. Radiologic Technology graduate percentages
are distorted by the extremely small number reporting.
65

Curriculum Perceptions
38
Graduates were questioned as to the activity most conducive to satis-
factory completion of their Career Learning curriculum at N.Y.C.C.C.
The results are shown in Table GP 35. It can be seen in this table that
41.9% of responding graduates perceive high school to be the most signi-
ficant factor in satisfactory curriculum completion, although there is
considerable variation by department. 77.4% of Chemical Technology
department graduates perceive high school to be the primary factor but
only 16.0% of Medical Laboratory graduates perceive this to be true.
Conversely 49.4% of Medical Laboratory graduates perceive the Biology
Audio-tutorial laboratory to be the most important single factor in
satisfactory curriculum completion but 0.0% of Chemical Technology
graduates perceive this. The percentages shown for most other depart-
ments are not significantly different from the total percentages.
Graduates' perception of differences in techniques taught at N.Y.C.C.C.
and those used in actual practice are shown in Table GP 36. It can be
seen that 79.6% perceive no difference in techniques taught and used,
with little variation among departments. The single exception is
Medical Technology graduates: 41.7% perceive a difference between
taught and used methods to exist.
Table GP 37 presents the graduates' perception of N.Y.C.C.C. curriculum
as career preparation. Approximately 90% perceive the curriculum as
good, very good, or excellent. The two departments whose graduates
66

39
perceive the highest ratings are Medical Laboratory and Chemical Technology. .
Eighty-three percent and 79% respectively perceived the curriculum as
excellent or very good; 2.3% and 3.3% respectively perceived the curriculum
as fair or poor. The two departments whose graduates perceive the lowest
ratings are Dental Laboratory and Nursing: 22.7% and 16.1% respectively
of their graduates perceive the curriculum to be fair or poor.
It is apparent from the perceptions discussed in this section that a
very large percentage of responding graduates perceive their experience
and training at N.Y.C.C.C. to have been very good. Most graduates
perceive their general education courses to have been beneficial and an
even greater percentage perceive the various components of their Career
Learning courses to have been very helpful. Most graduates perceive
their instructors to have been competent in class and helpful in
non-teaching functions and almost all graduates perceive the entire
N.Y.C.C.C. curriculum as having prepared them properly for their Health
Service Career.
67

40
Table GP 1
Graduate perception of general educationlectures as a learning experience, byepartment
Perception-I el X CI I- C7 I- X = °v 4 70 ...4
fg W...4 mto = ai ma. 3 aim
IT C.C""I VI eI
m aA 0. 0et= a ...,. ei, 0 et 0 -A. v.Tli g' 3. -. DA3 ... m 00 'I Cli 'I A ma 41
O A = 4 glii 14 /. lb Z 3 .... 8 S..., op m es Fp ...11 .4.1 IA 3 ....3O ..... 0 0 ..."...
-.1 .3$
646
4.< 4C 4.0 40 46C o
Excellent Number 11 7 0 17 43 1 1 80
% ofdept.
18.6 6.1 0.0 19.1 16.3 4.8 11.1 13.8*
Very Number 26 32 7 38 88 12 3 206Good
% ofdept.
44.1 27.8 30.4 42.7 33.3 57.1 33.3 35.5
Good Number 19 52 10 28 114 6 3 232
% ofdept.
32.2 45.2 43.5 31.5 43.2 28.6 33.3 40.0
Fair Number 3 17 6 4 15 0 2 47
% ofdept.
5.1 14.8 26.1 4.5 5.7 0.0 22.2 8.1
Poor Number 0 4 0 1 2 0 0 7
% ofdept.
0.0 3.5 0.0 1.1 0.8 0.0 0.0 1.2
Not Number 0 3 0 1 2 2 0 I 8Applicable
% ofdept.
0.0 2.6 0.0 1.1 0.8 9.5 0.0 1.2
*Percent of total
68
as

41
Table GP 2
Graduate perception of general learningclass discussions as a learning experience,
by department
Perception-I c-m7'0 M7' 9= ..a.on..ta,
e) -610
T C:I'1C mICI =-a. etI'D 0a-.M
I- V12, mCl =0 et"1 0a-..el'0,
r- 3as CD1:7' 0.0 ....'1 nasCh....,0
zc-%0r.=ti*
W 0..17(I1 et"CI 7'ID PI= woeN 3solo ad.= n
....-I 70IV 00 0.S..7oo-wl-,,,,, 00 104/2 10
...IQet0
...a
Excellent Number 8 10 1 4 19 2 1 45
% ofdept.
13.8 8.6 4.3 4.6 7.1 9.5 11.1 7.8*
Very Number 13 15 6 32 72 8 2 148
Good% ofdept.
22.4 12.9 26.1 36.8 27.1 38.1 22.2 25.5
Good Number 24 58 9 31 116 7 4 249
% ofdept.
41.4 50.0 39.1 35.6 43.6 33.3 44.4 42.9
Fair Number 9 25 6 17 44 2 1 104
% ofdept.
15.5 21.6 26.1 19.5 16.5 9.5 11.1 17.9
Poor Number 3 7 1 2 9 0 1 23
% ofdept.
5.2 6.0 4.3 2.3 3.4 0.0 11.1 4.0
Not Number 1 1 0 1 6 2 0 11
Applicable% ofdept.
1.7 0.9 0.0 1.1 2.3 9.5 0.0 1.9
Percent of total
89
ow

42
Table GP 3
Graduate perception of general education,laboratories as a learning experience,by department
Perception--1 n s as r- C7 1-- 3 Z C7 CI -4 73 -I(D =" (D 13) (D 110 (D c .......0 m w 0fl (D tI) M ET = t7 Q. -1 an rP n 0. rt= a -.. rt. 0 rt. 0 ..... us *0 0" 0- -s wm w -s w+ -s n ..J. 11) 0.1 = 0 ..10 0 m --.1 Cu ....s 0) 0) = = .-../ 0 ....1.-. co M rt. rt. --. (CI us a ...a 00 .....a o 0 ..1. ..11. 0 1.0a.C" '.< 1C (CI %< n
Excellent Number 23 11 7 22 22 2 1 88
% ofdept.
38.3 9.6 30.4 24.7 8.2 9.5 11.1 15.1*
Very Number 17 21 2 28 72 7 2 149Good
% ofdept.
28.3 18.3 8.7 31.5 27.0 33.3 22.2 25.5
Good Number 12 48 7 25 108 5 4 209
% ofdept.
20.0 41.7 30.4 28.1 40.4 23.8 44.4 35.8
Fair Number 3 17 5 6 53 5 2 91
% ofdept.
5.0 14.8 21.7 6.7 19.9 23.8 22.2 15.6
Poor Number 0 4 1 1 4 1 0 11
% ofdept.
0.0 3.5 4.3 1.1 1.5 4.8 0.0 1.9
Not Number 5 14 1 7 8 1 0 36Applicable
% ofdept.
8.3 12.2 4.3 7.9 3.0 4.8 0.0 6.2
Percent of total
70

1
43
Table GP 4
Graduate perception of general educationreading materials as a learning experience,by department
Perception- n x C7 1- C7
fl) c m as mrms Mo (0 = Cr ==- a -. at 0 c+= -J. fD M 'I Oson =-r CU aomi...4 CU M r+0 ...4 0
1- 3as m0" CLo -6-S (10, 0,r+ -+0
Zc'Ior.Z
C0
C) CD-1."0in et'CP 7'M W7-+in 9...II. mole
-i XiM Osfl CL=" ...s.= 00 aomi. 00(0
i0etMemb
Excellent
VeryGood
Good
Fair
Poor
NotApplicable
Number
% ofdept.
Number
% ofdept.
Number
% ofdept.
Number
% ofdept.
Number
% ofdept.
Number
% ofdept.
9
15.3
13
22.0
25
42.4
10
16.9
0
0.0
2
3.4
5
4.3
27
23.5
58
50.4
20
17.4
4
3.5
1
0.9
1
4.3
4
17.4
12
52.2
3
13.0
3
13.0
0
0.0
16
18.6
21
24.4
37
43.0
12
14.0
0
0.0
0
0.0
46
17.2
70
26.2
123
46.1
24
9.0
2
0.7
2
0.7
2
9.5
4
19.0
11
52.4
2
9.5
1
4.8
1
4.8
0
0.0
5
55.6
3
33.3
1
11.1
0
0.0
0
0.0
1
79
13.6*
144
24.8
269
46.4
72
12.4
10
1.7
6
1.0
Percent of total.a

44
Table GP 5
Graduate perception of general educationwritten assignments ds a learning experience,by department
Perception-Icy x c) r- c)ID =" l< ID 0 ID0 M 4.0
e3+ ate-+= B ...J. cy. 0 e+= -J. M 0 'I 00 0 = --. 0 ....o
e) .-.8 0t0''.0 (.
,<
r30 ID
zC
ca c)-1.-ej -.1 711,M 0 -4o
0. e4. 0 Q. 4-00 -J. fl 'CI = = -I 0'"1 0 -a. M 0 = 0 --a0 0
....1=
ICI= .1VI a
0 ....I....s 0
0 a. ../. 0 110= 0t< 40 t< 0
Excellent Number 4 4 0 5 27 1 0 41
% ofdept.
6.7 3.5 0.0 5.6 10.2 5.0 0.0 7.1
Very Number 16 12 5 18 61 4 4 120
Good% ofdept.
26.7 10.4 21.7 20.2 23.0 20.0 44.4 20.7
Good Number 28 55 10 47 137 6 3 286
% ofdept.
46.7 47.8 43.5 52.8 51.7 30.0 33.3 49.2
Fair Number 11 34 4 16 34 6 2 107
% ofdept.
18.3 29.6 17.4 18.0 12.8 30.0 22.2 18.4
Poor Number 1 6 3 1 4 2 0 17
% ofdept.
1.7 5.2 13.0 1.1 1.5 10.0 0.0 2.9
Not Number 0 4 1 2 2 1 0 10
Applicable% ofdept.
0.0 3.5 4.3 2.2 0.8 5.0 0.0 1.7
Percent of total
72

45
Table GP 6
Graduate perception of general educationteacher comments as a learning experience,by department
Perception
.-i cl x cs r- C2 r 3 = C2 0 -1 74, ..1nA g ,.c .. . Cu tD
Cr 3 C4 a.) c, -....,IA re CD an o. 0
e+3' J. (+ 0 C+ 0 .... in vi = = -.. a0.... ID Cu -1 tu -1 A .... tD Do 3 0 opla0 n Z agaS M emil W W = Z ....4 o-+..... a, m cf. c.,. ..... cc in a ...A o
n ID -ila 4.< n
Enellent Number 5 7 4 14 26 4 2 62
% of
dept.
8.5 6.1 17.4 15.7 9.8 19.0 22.2 10.6*
Very Number 18 20 5 21 61 5 1 131Good
% ofdept.
30.5 17.4 21.7 23.6 23.0 23.8 11.1 22.5
Good Number 24 47 7 39 116 8 3 244
% ofdept.
40.7 40.9 30.4 43.8 43.8 38.1 33.3 42.0
Fair Number 9 32 6 9 52 2 2 112
% ofdept.
15.3 27.8 26.1 10.1 19.6 9.5 22.2 19.3'
Poor Number 2 6 1 4 4 0 1 18
% ofdept.
3.4 5.2 4.3 4.5 1.5 0.0 11.1 3.1
Not Number 1 3 0 2 6 2 0 14Applicable
% ofdept.
1.7 2.6 0.0 2.2 2.3 9.5 0.0 2.4
Percent of total
I
*
. 73
_. -

46
i-v-
Table GP 7
Graduate perception of general educationexaminations as a learning experience,by department
Perceptionr- o0 ID0* ='1 DIpa ....4rt0
r- 3Cli IDa C-O -I.3 nasrt ,-0
zc1W.4.7IC
ol o --1 XI..-16"0 m 0In et'CP S
0 CL=" -ID a = o= .... 0 owlIn B .., 0awl* awl* 0 IA
IC
Iait*CV
Excellent Number 5 4 1 10 21
% ofdept.
8.3 3.4 4.3 11.2 8.0
Very Number 12 17 4 26 64Good
% ofdept.
20.0 14.7 17.4 29.2 24.2
Good Number 31 57 9 39 117
% ofdept.
51.7 49.1 39.1 43.8 44.3
Fair Number 12 34 9 13 54
% ofdept.
20.0 29.3 39.1 14.6 20.5
Poor Number 0 2 0 0 6
% ofdept.
0.0 1.7 0.0 0.0 2.3
Not Number 0 2 0 1 2
Applicable% ofdept.
0.0 1.7 0.0 1.1 0.8
*Percent of total
74
2 1
9.5 11.1
5 5
23.8 55.6
10 1
47.8 11.1
44
7.6*
133
22.9
264
45.4
3 2 127
14.3 22.2 21.8
0 0 8
0.0 0.0 1.4
1 0 6
4.8 0.0 1.0
A

47
Table GP 8
Graduate perception of Career Learninglectures as a ledrning experience,by department
Perception--I c-, = Ci r com mr 1,4( M Cr mr) 0 tO 3 Cr 3S a -4. r+ 0 r+m ..... M cu .3 cuo n = 44 CU .-.6...o 13, cv r+
r- 3Cr m0* CL0 -J.-1 nOP CPr+ --0
=c'Su)....=tO
WI 0-.opLA e+'0 =fD W= O4/1 3
-I 7:20 cu11 CL=i .a.= o0 -6.-a 0
-I0rfcu....
O --. 0 0 .4. osa. 0 tOtO -RI 'S 3 el ICII.< 4G 4.< tO 4.< n
Excellent
VeryGood
Good
Fair
Poor
NotApplicable
Number
% ofdept.
Number
% ofdept.
Number
% ofdept.
Number
% ofdept.
Number
% ofdept.
Number
% ofdept.
21
35.0
26
43.3
11
18.3
2
3.3
0
0.0
0
0.0
24
20.7
35
30.2
41
35.3
14
12.1
1
0.9
1
0.9
2
10.0
7
35.0
5
25.0
6
30.0
0
0.0
0
0.0
31
35.2
34
38.6
19
21.6
4
4.5
0
0.0
0
0.0
57
22.4
87
34.1
97
38.0
10
3.9
2
0.8
2
0.8
9
42.9
9
42.9
2
9.5
0
0.0
0
0.0
1
4.8
0
0.0
5
55.6
3
33.3
1
11.1
0
0.0
0
0.0
1
144
25.3*
203
35.7
178
31.3
37
6.5'
3
0.5
4
0.7
Percent of totalti

48
Table GP 9
Graduate perception of Career Learningclass discussions as a learningexperience, by department
Perception-I fl 2 CP 1- CP r3 = v0 -4 7:1 -Im =r. i< m am am c -617 m as on g to z
-J. co.cr z0 rt. 17 O.0 -4. -1w vs e+
'a =n CI.= ... r+00 -s. M Cu -1a 'In -.. ma o0 ....on o-.8 a-.8 W W = Z o...+-.. gu M c+ rl - tO W 3 -4 00 -1 0 0tin
(.<'''S
'..<'''S
'..<
...1. mde 0 10Z40 44C n
Excellent Number 10 18 4 18 25 8 1 84
% ofdept.
16.9 15.5 20.0 20.7 9.8 38.1 12.5 14.8*
Very Number 26 25 4 29 83 9 3 179Good
% ofdept.
44.1 21.6 20.0 33.3 32.4 42.9 37.5 31.6
Good Number 15 46 7 23 100 1 3 195
% ofdept.
25.4 39.7 35.0 26.4 39.1 4.8 37.5 34.4
Fair Number 5 19 4 14 36 2 1 81
% ofdept.
8.5 16.4 20.0 16.1 14.1 9.5 12.5 14.3
Poor Number 2 4 1 1 7 0 0 15
% ofdept.
3.4 3.4 5.0 1.1 2.7 0.0 0.0 2.6
Not Number 1 4 0 2 5 1 0 13ApplicaWe
% ofdept.
1.7 3.4 0.0 2.3 2.0 4.8 0.0 2.3
*Percent of total - A
76

49
Table GP 10
Graduate perception of Career Learninglaboratories as a learning experience,by department
Perception-4 c-.)
2 g?0 0......a W0 ....I
4<ta
2vi< M4.0 Z...J. rf.M CU= .....1M
r- csCr MIT =0 rt"S CUW .....Ort0
t1C
r3Cr 0Cr CL0 ..J
nW Wrt. .....1
0t1C
zC-I(IJ.Z
U3
co co-a13
i iZ ....,w a...11. ..I.= 0
U3
-47vM Crr) CLZ. ''Z 00..4....1 00 In(0 ,.
4.< (-)
-I0W....O
Excellent Number 29 29 10 26 35 5 1 135
% ofdept.
48.3 24.8 50.0 29.5 13.6 23.8 11.1 23.6*
Very Number 21 27 2 33 75 7 2 167
Good% ofdept.
35.0 23.1 10.0 37.5 29.2 33.3 22.2 29.2
Good Number 7 34 3 20 87 7 4 162
% ofdept.
11.7 29.1 15.0 22.7 33.9 33.3 44.4 28.3
Fair Number 2 22 4 8 45 1 2 84
% ofdept.
3.3 18.8 20.0 9.1 17.5 4.8 22.2 14.7'
Poor Number 1 5 1 0 12 0 0 19
% ofdept.
1.7 4.3 5.0 0.0 4.7 0.0 0.0 3.3
Not Number 0 0 0 1 3 1 0 5
Applicable% ofdept.
0.0 0.0 0.0 1.1 1.2 4.8 0.0 0.9
*Percent of total
77

50
Table GP 11
Graduate perception of Career Learningreading materials as a learning experience,by department
Perception--4 c-.) = a2 g ..< m,.. .S -a. el
CD OP0 0......1 gs
-...10'..c
= JM
Excellent Number 12 19
% ofdept.
20.3 16.2
Very Number 21 31
Good% ofdept.
35.6 36.5
Good Number 16 46
% ofdept.
27.1 39.3
Fair Number 7 18
% ofdept.
11.9 15.4
Poor Number 1 3
% ofdept.
1.7 2.6
Not Number 2 0
Applicable% ofdept.
3.4 0.0
*Percent of total
r aCU MGT =0 r+-1 OAW Jr+0
g<-1
r mOA IDGT 0.0 -a'1 0W Wet0'1cc
zC'1III.....=10
c;) co...WOto et
= JW 9.4. III
4t2=
...-1 73(11 Of11 0.S -.1.=oC:, ....4..6
0o0 10Q A
4oetW=11
4 24 53 4 0 116
20.0 28.4 20.4 19.0 0.0 20.3*
7 18 83 5 5 170
35.0 21.2 31.9 23.8 55.6 29.8
4 37 101 7 3 214
20.0 43.5 38.8 33.3 33.3 31.5
3 5 18 2 1 54
15.0 5.9 6.9 9.5 11.1 9.5
2 1 3 2 0 12
10.0 1.2 1.2 9.5 0.0 2.1
0 0 2 1 0 j 5
0.0 0.0 0.8 4.8 0.0 0.9
78
.

51
Table GP 12
Graduate perception of Career Learningwritten assignments as a learningexperience, by department
Perception
Excellent Number 12 9
% of 20.0 7.8dept.
Very Number 18 12
Good% of 30.0 10.3
dept.
Good Number 20 59
Fair
% of 33.3 50.9
dept.
Number 8 28
% of 13.3 24.1
dept.
Poor Number 1 5
% of 1.7 4.3dept.
Not Number 1 3
Applicable% of 1.7 2.6
dept.
*Percent of total
2 10 21 2 0 56
10.5 11.8 8.1 10.0 0.0 9.9*
3 24 80 3 4 144
5 36 106 8 3 237
r- 0 r- 3 z C3 0 -I 70 ..412, (1)Cr = W (1)
Cr CLc-1
-1.1:3vb rt M W0 0. 0
et0 et 0 .J. 0 13 ? ='' -4. W'1 W 'I n ..... m a = o ....aa.... cu at = >-. 0 -.aet et ...a 4,0 0 9 ...a 00 0 ...a. ..11. 0 i0"1
4.< .< 1.0 C n
15.8 28.2 31.0 15.0 44.4 25.4
26.3 42.4 41.1 40.0 33.3 41.8
6 12 42 1 2 99
31.6 14.1 16.3 5.0 22.2 17.5
3 0 5 2 16
15.8 0.0 1.9 10.0 0.0 2.8
0 3 4 4 0 ' 15
0.0 3.5 1.6 20.0 0.0 2.6
:79
f.

52
Table GP 13
Graduate perception of Career Learningteacher comments as a learning experience,by department
Perception-4 rA Ili==-0 0..... Di0 .....to4
x ast< As'n =-4. etCD gio=-.M
r- csAl 0Cr =0 et, 0112, ......Ft0-I
4.4
r- XOa a.0''S ncu suel' ..-1o-s
4.4
=c-,W.....=40
CI Cs-1.13,,, et-0 =m tu>-rin 3Ifa le=to
-4 72m 0/n C.= .a=00-...1 00 coto -..4: 0
-40etW...I
Excellent Number 14 20 5 23 35 9 2 108
% ofdept.
24.1 17.2 25.0 26.4 13.5 42.9 22.2 18.9*
Very Number 17 26 5 24 74 8 2 156Good
% ofdept.
29.3 22.4 25.0 27.6 28.6 38.1 22.2 27.4
Good Number 23 40 4 32 99 2 3 203
% ofdept.
39.7 34.5 20.0 36.8 38.2 9.5 33.3 35.6
Fair Number 2 23 6 6 43 1 2 83
% ofdept.
3.4 19.8 30.0 6.9 16.6 4.8 22.2 14.6.
Poor Number 1 6 0 0 3 0 0 10
% ofdept.
1.7 5.2 0.0 0.0 1.2 0.0 0.0 1.8
Not Number 1 1 0 2 5 1 0 i 10Applicable
% ofdept.
1.7 0.9 0.0 2.3 1.9 4.8 0.0 1.8
*Percent of total
80
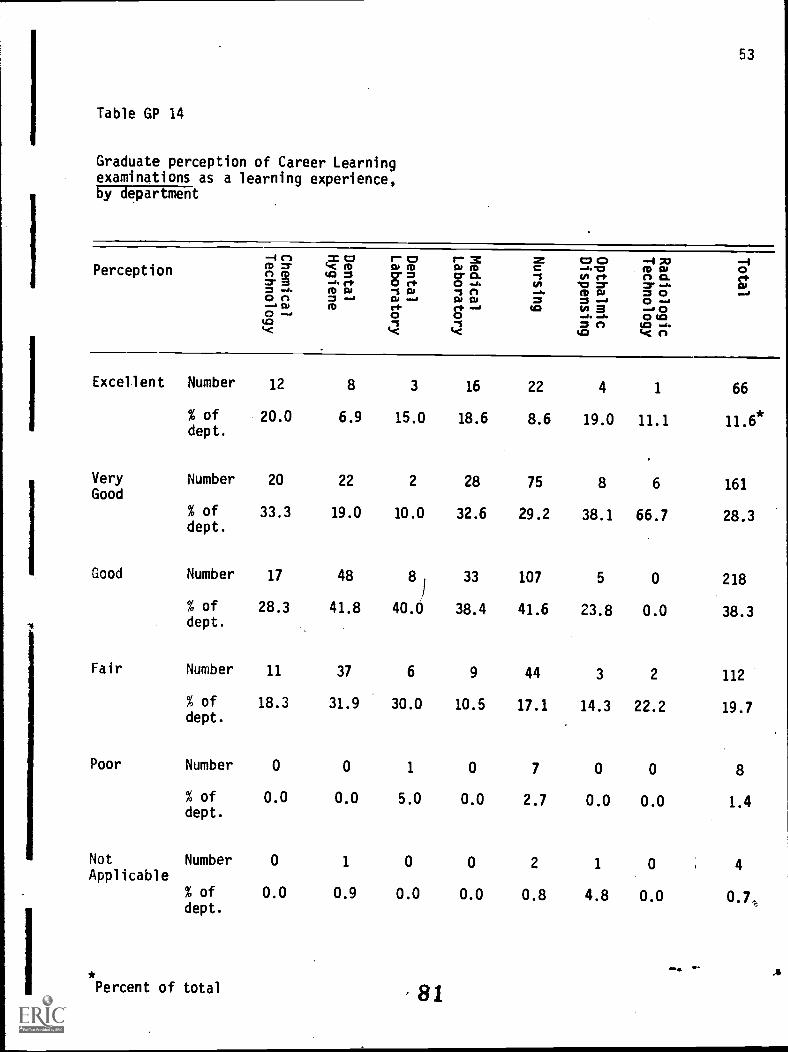
53
Table GP 14
Graduate perception of Career Learningexaminations as a learning experience,by department
Perception-I r) = cr r- crm t.c m W Mtg to =..I. ri g ;
r- 3CU M0. f1
zC'.$W
co 0......0W CO.0 =
--I XIM WCI O.
-I0ro
0 -.44.<
M ei.0I.(
ro0
4.<
.0.1. ../.= CI(0
0 10ICI i4IC fl
..../
Excellent Number 12 8 3 16 22 4 1 66
% ofdept.
20.0 6.9 15.0 18.6 8.6 19.0 11.1 11.6*
Very Number 20 22 2 28 75 8 6 161Good
% ofdept.
33.3 19.0 10.0 32.6 29.2 38.1 66.7 28.3
Good Number 17 48 8I
1 33 107 5 0 218
% ofdept.
28.3 41.8 40.0 38.4 41.6 23.8 0.0 38.3
Fair Number 11 37 6 9 44 3 2 112
% ofdept.
18.3 31.9 30.0 10.5 17.1 14.3 22.2 19.7
Poor Number 0 0 1 0 7 0 0 8
% ofdept.
0.0 0.0 5.0 0.0 2.7 0.0 0.0 1.4
Not Number 0 1 0 0 2 1 0 4Applicable
% ofdept.
0.0 0.9 0.0 0.0 0.8 4.8 0.0 0.7,
Percent of total .81
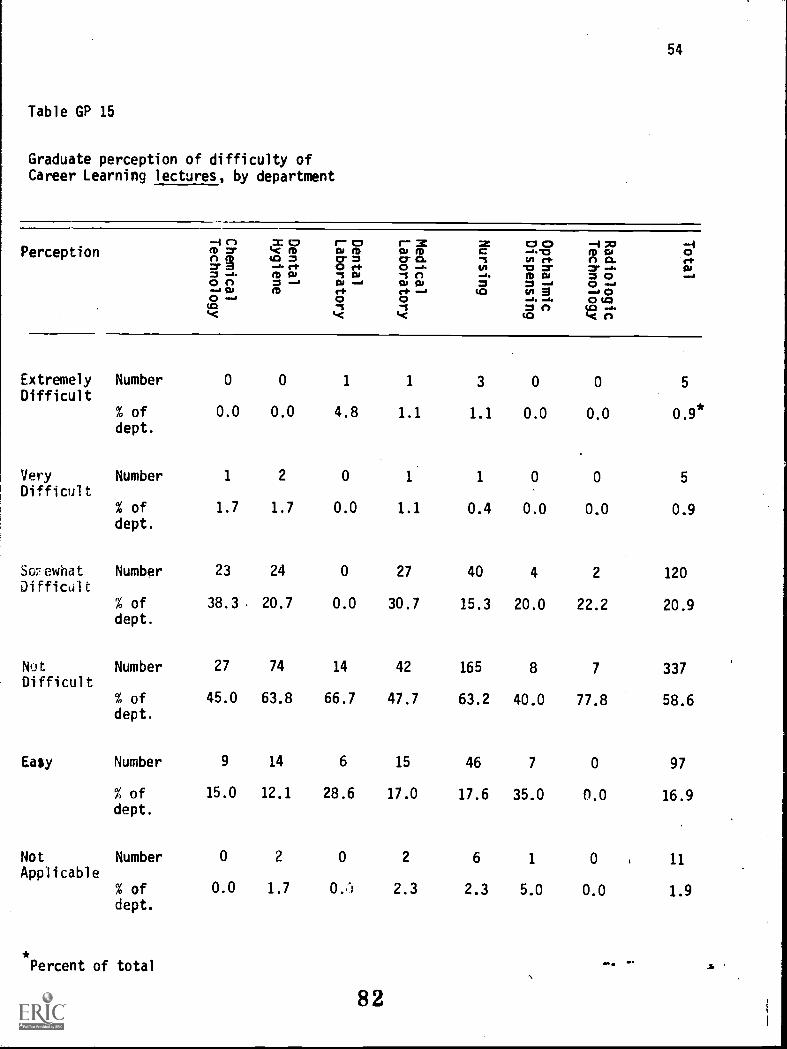
54
Table GP 15
Graduate perception of difficulty ofCareer Learning lectures, by department
Perception-1r x0 f- 0 r3 = v0 -170 -4ffP) g
..< IV4,0 7
131 MCT 7
W MCT 0.
C-S
-1.'0MI
rhfD DuA 0. 0ria ..J re 0 el- 0 r. 0 MI 7' = ..." 0= .4. n) 0 0 'ICI r. Boa 7 0 OlO n = a W =6 W W = = .... 0 O.. glo m ri el- --1 4,0 In 9 0o -I 0 0 ..4. 41. 0 CI
40 -S -S = A ,1< 1< C U3 4C n
Extremely Number 0 0 1 1 3 0 0 5
Difficult% of 0.0 0.0 4.8 1.1 1.1 0.0 0.0 0.9*dept.
Very Number 1 2 0 1 1 0 0 5
Difficult% of 1.7 1.7 0.0 1.1 0.4 0.0 0.0 0.9dept.
So7ewhat Number 23 24 0 27 40 4 2 120Difficult
% of 38.3 20.7 0.0 30.7 15.3 20.0 22.2 20.9dept.
Nut Number 27 74 14 42 165 8 7 337Difficult
% of 45.0 63.8 66.7 47.7 63.2 40.0 77.8 58.6dept.
Easy Number 9 14 6 15 46 7 0 97
% of 15.0 12.1 28.6 17.0 17.6 35.0 0.0 16.9dept.
Not Number 0 2 0 2 6 1 0 , 11Applicable
% of 0.0 1.7 OA 2.3 2.3 5.0 0.0 1.9dept.
Percent of total
82

55
Table GP 16
Graduate perception of difficulty ofCareer Learning class discussions,by department
Perception-4 in s0 r0 0 I-' 3 Z 00 -170 ....I
IA 3-C IV44:1 7..e. ch
0) M0" 70 el.0) M0- 0.0 .4.
C.1tn
-a 17IA c-t
M 0)0 0.7' -).
0rh
7 - M 0) "1 0) "1 0 a. M W 7 0 ...4on 7- a-+ Drat 7 >-+ 0 ..r-... al M ch ch -' i0 w 3 ...6 00 ...1 0 0 4.4 a 11. 0(040
40 4C el= 0 (0
1.< 4.< 4C
Extremely Number 0 0 1 1 1 0 0 3
Difficult% ofdept.
0.0 0.0 4.8 1.1 0.4 0.0 0.0 0.5*
Very 0 Number 3 1 0 0 1 0 0 5
Difficult% ofdept.
5.2 0.9 0.0 0.0 0.4 0.0 0.0 0.9
Somewhat N5ppr 12 6 0 12 26 1 1 58
Difficult% ofdept.
20.7 5.2 0.0 13.6 9.9 5.0 11.1 10.1
Not Number 27 71 13 46 164 8 7 336
Difficult% ofdept.
46.6 61.2 61.9 52.3 62.4 40.0 77.8 58.4
Easy Number 13 31 7 21 59 10 0 141
% ofdept.
22.4 26.7 33.3 23.9 22.4 50.0 0.0 24.5
Not Number 3 7 0 8 12 1 1 32
Applicable% ofdept.
5.2 6.0 0.0 9.1 4.6 5.0 1.1 5.6
*Percent of total
83
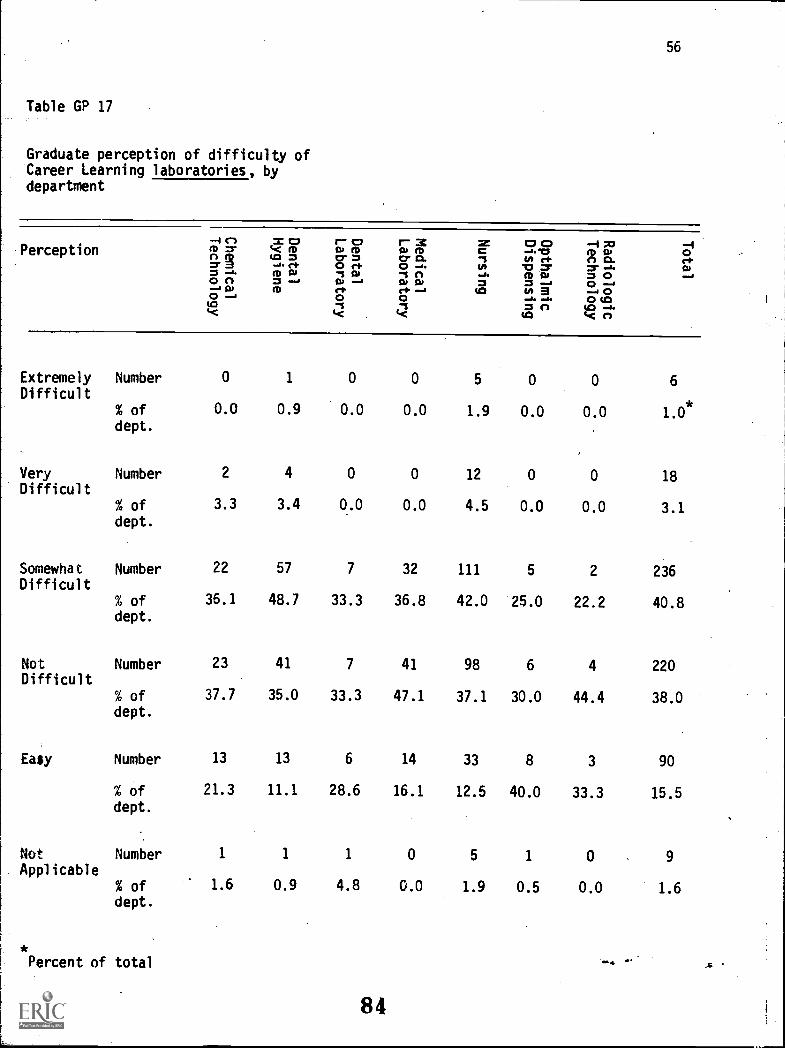
56
Table GP 17
Graduate perception of difficulty ofCareer Learning laboratories, bydepartment
Perception= CI r- P r- Z Z C7 A ...-1 XI -I
i-1 in, m. ..../. et
11, CD0' =0 e+
CD fD00' ..0..
C"SN
-a "01/1 C+'0 =
fD flaCI 0.S ..,6
0el.01= -.8. fD CV '''S AO .1 n .a. fD 00 = 0 ....to n = ..ma W emmi CV 01 = Z .../ 0 .../....1 01 M et et aw.I U3 Ina _. 0O em.1 0 0 .4. 010tO -1 -1 = el tO .A
Extremely Number 0 1 0 0 5 0 0 6Difficult
% ofdept.
0.0 0.9 0.0 0.0 1.9 0.0 0.0 1.0*
Very Number 2 4 0 0 12 0 0 18Difficult
% ofdept.
3.3 3.4 0.0 0.0 4.5 0.0 0.0 3.1
Somewhat Number 22 57 7 32 111 5 2 236Difficult
% ofdept.
36.1 48.7 33.3 36.8 42.0 25.0 22.2 40.8
Not Number 23 41 7 41 98 6 4 220Difficult
% ofdept.
37.7 35.0 33.3 47.1 37.1 30.0 44.4 38.0
Easy Number 13 13 6 14 33 8 3 90
% ofdept.
21.3 11.1 28.6 16.1 12.5 40.0 33.3 15.5
Not Number 1 1 1 0 5 1 0 9Applicable
% ofdept.
1.6 0.9 4.8 0.0 1.9 0.5 0.0 1.6
Percent of total
84
.4

1
Table GP 18
57
Graduate perception of difficulty ofCareer Learning reading materials,by department
Perception--I cs'A ii=- a= ..o n
= CII< MtO =-J. rt.(D OI= ....1
r- svCU IDer =o cs.-s a)as -,
r- 3CI, 14Cr 0.0 --e.-"S flCU 0+
= 17 CI --I X/C-sW-A.
=
.."1:1UI r+MI =ID Cu= .....a
(4 IIJCI 0.7' -a-= 00 .....1
-40et.0-.,
....4 12) ID ch ch -+ 10 1/1 9 --# 0o -, 0 0 ..a. ...e. o soum -s -s = n so ..a4 41( 41( U3 t< n
Extremely Number 1 0 0 0 2 0 0
Difficult% of 01.6 0.0 0.0 0.0 0.8 0.0 00.0
3
0.5*dept.
r
Very Number 0 4 0 0 1 1 0 6
Difficult% of 0.0 3.5 0.0 0.0 0.4 5.0 0.0 1.0
dept.
Somewhat Number 22 24 2 27 44 7 3 129Difficult
% of 36.1 20.9 9.5 31.0 16.7 35.0 33.3 22.4dept.
Not Number 30 73 11 48 170 8 3 343Difficult
% of 49.2 63.5 52.4 55.2 64.6 40.0 33.3 59.5dept.
Easy1
Number 6 12 8 O. 40 3 2 82
% of 9.8 10.4 38.1 12.6 15.2 15.0 22.2 14.2dept.
Not Number 2 2 0 1 6 1 1 13Applicable
% of 3.3 1.7 0.0 1.1 2.3 5.0 11.1 2.3dept.
Percent of total

58
Table GP 19
Graduate perception of difficulty ofCareer Learning written assignments,by department
Perception704 CI S C7 r- cl r- 3
4.,c m Do fD Do fD
g' g IC.=c+... 0IT =cl VI= -1. fD Do "S W '''S 00 0 = ..., W ...s W W...i
IDfla M et et ,...11 0 0
4"(
Z C7 CI --I 7J -4C -w0 M W 0-1 V) et 0 O. ehW 'Cl =" ? J. w= = - 0 -ID 0 3 -+0
-s. -I. 0 40= A CI -ID i< n
Extremely Number 0 0 0 0 2 0 0 2
Difficult% ofdept.
0.0 0.0 0.0 0.0 0.8 0.0 0.0 0.3
Very Number 0 2 0 3 7 0 1 13Difficult
% ofdept.
0.0 1.7 0.0 3.4 2.6 0.0 11.1 2.2
Somewhat Number 27 28 2 16 82 3. 0 158Difficult
% ofdept.
44.3 23.9 9.5 18.4 30.9 15.8 0.0 27.3
Not Number 30 72 12 - 50 142 9 5 320.
Difficult% ofdept.
49.2 61.5 57.1 57.5 53.6 47.4 55.6 55..3
Easy Number 3 12 5 12 25 3 2 62
% ofdept.
4.9 10.3 23.8 13.8 9.4 15.8 22.2 10.7
Not Number 1 3 2 6 7 4 1 24Applicable
% ofdept.
1.6 2.6 9.5 6.9 2.6 21.1 11.1 4.1
*Percent of total
86

59
Table GP 20
Graduate perception of difficulty ofCareer Learning examinations, bydepartment
Perception-4 c-) = C7 /- C7 r3 = 00 -170 -4rrl
4 mco = as mCT =
AI CDIT O.
C, -4'04/1 (-1
CD CD0 CL o
ir+7' 5 -0. ti 0 ti 0 -3. W 17 7* 7' .-c M
o n = .... al CU 7 = mall 0 ..../m..a al M Ft ri' ...a tO w 9 m..a 00 ...=.6 0 0 - -a. 0 tO
4.0tO7 41 4.0
.< lC IC
Extremely Number 0 1 0 0 3 0 1 5
Difficult% ofdept.
0.0 0.9 0.0 0.0 1.1 0.0 11.1 0.9*
Very Number 3 9 0 8 12 0 0 32
Difficult% ofdept.
5.0 7.7 0.0 9.1 4.6 0.0 0.0 5.5
Somewhat Number 36 63 6 46 134 5 3 293
Difficult% ofdept.
60.0 53.8 28.6 52.3 51.1 25.0 33.3 50.8
Not Number 16 37 11 28 100 11 4 207
Difficult% ofdept.
26.7 31.6 52.4 31.8 38.2 -55.0 44.4 35.9
Easy Number 4 5 4 6 9 3 0 31
% ofdept.
6.7 4.3 19.0 6.8 3.4 15.0 0.0 5.4
Not Number 1 2 0 0 4 1 1 9
Applicable% ofdept.
1.7 1.7 0.0 0.0 1.5 5.0 11.1 1.6
*Percent of total
87

60
Table GP 21
Graduate perception of frequency ofcheating on examinations bydepartment
Frequency
-4 r)M Sei 1m .....0 n-' a0 --140
SpI< Mto mm 0m .M
r- aCU M
"'S CU0 .rio-S
r3Cr M
"'S e)CU CUrt ...Io-S
zc(A...I.=
4.0
c; a-6-0in rtV =M CUM ..a0 a-A. -6= 0
-17J .m 0ri o.= -I.M 00 ...-- 0I.0 -,4< r)
-4oet0...I
Always Number 0 7 1 3 9 1 1 22
% ofdept.
0.0 7.1 7.7 4.5 5.1 5.6 14.3 5.3*
Very Number 1 13 0 0 8 1 0 23Often
% ofdept.
2.6 13.1 0.0 0.0 4.5 5.6 0.0 5.5
Often Number 1 12 1 3 16 3 1 37
% ofdept.
2.6 12.1 7.7 4.5 9.0 16.7 14.3 8.8
Sometimes Number 15 34 3 21 56 8 1 138
% ofdept.
39.5 34.3 23.1 31.8 31.5 44.4 14.3 32.9
Rarely Number 21 33 8 39 89 5 4 199
% ofdept.
55.3 33.3 61.5 59.1 50.0 27.8 57.1 47.5
*Percent of total
88

61
Table GP 22
Graduate perception of Career Learninginstructors as teachers, by department
Perception
x o I- o o --1 73 4M 3' 4.< M W M W M C -6 "0 M 13, 0S % to =
-1. cl0' 30 r$ '7 Ct.0 -J. in
1/1 clt A CLS --1.
etW
= ..m. fD CU "S CP -S 11 ..s. M CU =o ....j
0 n = -r W-1 13.0 141 = = ,.., 0 .....i....j pi M et et -t 1.0 0 a J 00 ....J 0 0 ...a. .... 0 4.0
Inspira-tional
Number 8 17 2 25 54 3 0 109
% ofdept.
13.3 14.8 8.7 29.1 21.0 14.3 0.0. 19.1
Very Number 26 21 6 36 66 14 1 170
Interesting% ofdept.
43.3 18.3 26.1 41.9 25.7 66.7 12.5 29.8
Interesting Number 25 63 14 24 128 4 6 264
% ofdept.
41.7 54.8 60.9 27.9 49.8 19.0 75.0 46.3
Uninter-esting
Number 0 14 1 0 8 0 1 24
% ofdept.
0.0 12.2 4.3 0.0 3.1 0.0 12.5 4.2
Dull Number I 0 0 1 1 0 0 3
% ofdept.
1.7 0.0 0.0 1.2 0.4 0.0 0.0 0.5
89

62
Table GP 23
Graduate perception of Career Learninginstructors in, class, by department
Perception
-4n =v r- cs I- x z v0 -I 73 -1M 7" 4.< M CII M Cle M c ...e."0 M 0 0gm
co =-J. r+ CT =0 e+ CT 0.0 ...I
.1W
cn r+'CI 7"
0 0.= ..... r+
gl,= J. m al .1 ill .1 n .../. ID gl, = 00 CI = I W ..; W W = = I 0..-6 a' m r+ r+ --1 0 in a -J 00 .... 0 0 ...a. 0 (0(0 ' .= n 4.0 ....CG CC C.0 U0 4.4 (3
Very well Number 15 31 7 39 81 12 3 188Prepared
% ofdept.
25.0 26.7 30.4 44.3 31.6 57.1 33.3 32.8
Well Number 39 59 13 45 152 9 3 320Prepared
% ofdept.
65.0 50.9 56.5 51.1 59.4 42.9 33.3 55.8
Moderately Number 6 26 3 4 22 0 3 64Prepared
% ofdept.
10.0 22.4 13.0 4.5 8.6 0.0 33.3 11.2
Unpre-pared
Number 0 0 0 0 1 0 0 1
% ofdept.
0.0 0.0 0.0 0.0 0.4 0.0 0.0 0.2
90

63
Table GP 24
Graduate perception of Career Learninginstructors' subject interest, bydepartment
Perception
--1 c--) =a r- a r- m z a a(1) =- IC (1) cl, m a (1) c -,.-on 2 um
-,. rt. 00'rt.
0- C-O -J. w""S v?
o n = _.. al J. 0 0 = = ...a....4 0.1
..
M rt. rt...a Up w a0 . 0 0 J. J.104.
'1 = 0< ( 11]
-173M 0 0
rtCU
00 0O LO
U:1 -I-
(.< n
Enthusi-astic
Number 19 34 8 41 66 12 1 181
% ofdept.
31.7 29.3 34.8 47.1 26.0 57.1 11.1 31.8
Interested Number 39 55 13 41 160 9 6 323
% ofdept.
65.0 47.4 56.5 47.1 63.0 42.9 66.7 56.7
Some Number 2 26 2 5 26 0 2 63
Interest% ofdept.
3.3 22.4 8.7 5.7 10.2 0.0 22.2 11.1
Not Number 0 0 0 0 1 0 0 1
Interested% ofdept.
0.0 0.0 0.0 0.0 0.4 0.0 0.0 0.2
Negative Number 0 1 0 0 1 0 0 2
% ofdept.
0.0 0.9 0.0 0.0 0.4 0.0 0.0 0.4
91

64
Table GP 25
Graduate perception of Career Learninginstructors' student interest, bydepartment
Perception
--I c-)M 7gon..a ai0 .-
x C7C M
c--0c)
=. et
= ...aM
r- C7Oa MC =o ro.Cy ....8eto
r- xslo 0C o.0 .J.aset -+o
4.<
=c'Io=
U2
co o...o.0In eh'0 ="= ..,e
4,, a..... ma.
AtO
-I 7-7 -Im slo o0 0. ri-=" -I. 17/
go ..a
-+ 00 to
CO4.< n
Very Number 12 21 4 25 56 14 2 134Concerned
% ofdept.
21.1 18.8 20.0 29.1 22.9 70.0 25.0 24.5
Concerned Number 31 52 10 38 109 4 5 249
% ofdept.
54.4 46.4 50.0 44.2 44.5 20.0 62.5 45.4
Some Number 12 34 6 22 79 2 1 156Concern
% ofdept.
21.1 30.4 30.0 25.6 32.2 10.0 12.5 28.5
Uncon-cerned
Number 2 4 0 1 1 0 0 8
% ofdept.
3.5 3.6 0.0 1.2 0.4 0.0 0.0 1.5
Antagon-istic
Number 0 1 0 0 0 0 0 1
% ofdept.
0.0 0.9 0.0 0.0 0.0 0.0 0.0 0.2
92
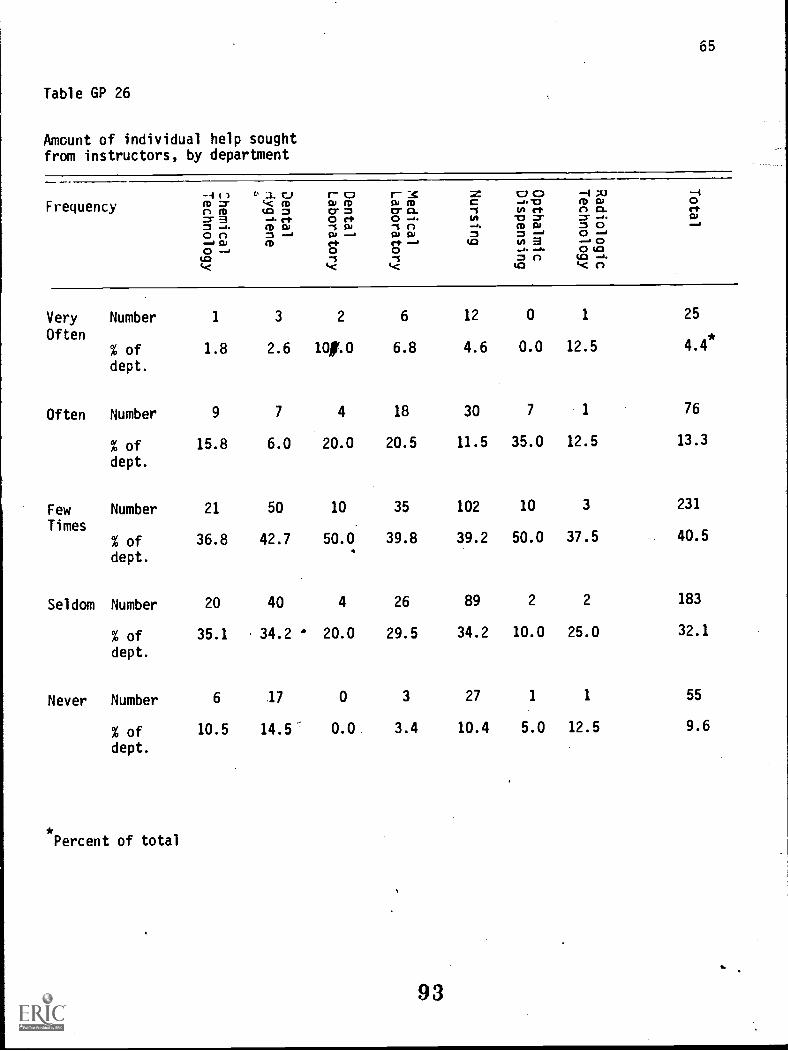
65
Table GP 26
Amount of individual help soughtfrom instructors, by department
Frequency-4 (1(D ?n 0= a= -1.o n..O apo -to
4.<
0 :1. C..)1-.< Mto =-. rt.(D 0m .....M
r" CI0 Mcr. =0 (4.-I 00, ....art.ot<-s
r- :_<0 Mo" is.o --.."I CIa) 0)et'0-s
=C-sin..J.=
4.0
C) CD.-..-0in e+-0 =.M cu= Ao a*Oa 11.= n
to
-I 317M 00 0.= -..= oo ...'i. 0o4.0to n.-1--
-ioe+0
Very Number 1 3 2 6 12 0 1 25
Often% ofdept.
1.8 2.6 14.0 6.8 4.6 0.0 12.5 4.4*
Often Number 9 7 4 18 30 7 1 76
% ofdept.
15.8 6.0 20.0 20.5 11.5 35.0 12.5 13.3
Few Number 21 50 10 35 102 10 3 231
Times% ofdept.
36.8 42.7 50.0 39.8 39.2 50.0 37.5 40.5
Seldom Number 20 40 4 26 89 2 2 183
% ofdept.
35.1 34.2 20.0 29.5 34.2 10.0 25.0 32.1
Never Number 6 .17 0 3 271
1 55
% ofdept.
10.5 14.5 0.0 3.4 10.4 5.0 12.5 9.6
Percent of total

Table GP 27
Amount of individual help receivedfrom instructors when requested,by department
66
Frequency-i CM 7'0 CD= _a.0 0....... ci,0 -+
LOi<
x c,4C' (DL0 7M CU7..-6m
r- c301 CDCT 7"I OJa-'0"S
4.<
r 3al CD0- 0.-1 0cu gm
.-- ,0"St<
zC-s
-0.=
c:2 o'CI
CA ci.
M CU= ,m.
J. J.7 nlia
-i 70(D Cun 0.7 0C) ....1
0 tOLO -a< n
-i0ci......1
Very Number 22 32 7 32 61 12 2 168Often
*% ofdept.
37.9 29.6 35.0 37.2 25.0 60.0 25.0 30.9
Often Number 23 36 6 31 100 7 4 207
% ofdept.
39.7 33.3 30.0 36.0 41.0 35.0 50.0 38.1
Few Number 9 22 6 18 63 0 1 119Times
% ofdept.
15.5 20.4 30.0 20.9 25.8 0.0 12.5 21.9
Seldom Number 4 11 1 4 15 0 0 35
% ofdept.
6.9 10.2 ° 5.0 4.7 6.1 0.0 0.0 6.4
Never Number 0 7 0 1 5 1 1 15
% ofdept.
0.0 6.5 0.0 1.2 2.0 5.0 12.5 2.8
Percent of total
94

67.
Table GP 28
Amount of individual help offeredby instructors, by department
Frequency-1 (--)(D=el (D= a=-+0 n''''.413)0 "...t<
s at< M10 =-. rt(Da= m...I(D
r- c:::1am0' =0 rt.""5 (Vta ..0CP0t<
r3amCT O.0 -..."1 CIta a)rt ".'0t<
=C''Sw....=
(0
co co....."-0l(1 rt..0 =(Da=_JW 3= ntO
...1 70maCI O.= -..=oo I....4 00 aatO .."C n
-10rt.0.....s
Very Number 17 15 3 23 50 8 4 120
Often% ofdept.
30.4 13.2 15.0 26.4 20.1 44.4 50.0 21.7*
Often Number 17 36 7 29 92 6 3 190
% ofdept.
30.4 31.6 35.0 33.3 36.9 33.3 37.5 34.4
Few Number 15 23 7 21 53 2 1 122
Times% ofdept.
26.8 20.2 36.0 24.1 21.3 11.1 12.5 22.1
Seldom Number 5 29 3 8 36 2 0 83
% ofdept.
8.9 25.4 15.0 9.2 14.5 11.1 0.0 15.0
Never Number 2 11 0 6 18 0 0 37
% ofdept.
3.6 9.6 0.0 6.9 7.2 0.0 0.0 6.7
*Percent of total
95

.
68
Table GP 29
Graduate perception of Career Learninginstructors' availability for consultationby department
-4 CIFrequency mom-
0 Ma
= -4.o n-... 0,
3: C7i< M40 =-.1. c+
m a= --,m
r- 0amOr =0 Ft-s DJ13, --,
ct
r- :cW Mor CI.0 ....-1 nw wVh --1
II!C,0-4.
=4.0
v0..... 10
0 cf.'0 =m a= -I0 a
-4 u -1CD W 0.0 CL cf.= .4. a= o .....0 .....1...Ala
o...4 0 0 ...I. ...I. 0 CO40 .1 = CI U3 -I
4G '(0 t< n
Always Number 17 24 7 27 88 10 2 175
% ofdept.
29.8 20.7 36.8 30.7 34.8 50.0 25.0 31.2*
Usually Number 30 52 9 43 113 10 5 262
% ofdept.
52.6 44.8 47.4 48.9 44.7 50.0 62.5 46.7
.
Sometimes Number 8 34 3 17 47 0 1 110
% ofdept.
14,0 29.3 15.8 19.3 18.6 0.0 12.5 19.6
.
Seldom Number 1 3 0 1 4 0 0 9
% ofdept.
1.8 2.6 0.0 1.1 1.6 0.0 0.0 1.6
Never Number 1 3 0 0 1 0 0 5
% ofdept.
1.8 2.6 0.0 0.0 0.4 0.0 0.0 0.9
*Percent of total
96

69
Table GP 30
Graduate perception of Career Learninginstructors' ease of communication,by department
Frequency-1 Cl 3: C7 r- CD r3 m. Cl CD -170 -Am? ',.< m am am C .....-0 ma 0n M 40 M Cr = cr cl -s 0 e+ 0 CL et? a rt 0 et 0 -a. 0 77 ::-J. =r .... Wmom. ma -1 W -In .... ma =o ...4
on m-4 a- a a m =-- o -,-,14, M e+ elh--. U3 0 a ..-A 0
0 .-a 0 0 o (10J.0 U3
1..c 1..c 1...c U3 4.0 n
Always Number 17 22 6 37 77 14 3 176
*% ofdept.
29.8 18.8 31.6 42.0 30.4 70.0 37.5 31.3
Usually Number 26 51 8 32 114 5 3 239
% ofdept.
45.6 43.6 42.1 36.4 45.1 25.0 37.5 42.5
.
Sometimes Number 14 36 5 17 56 1 1 130
% ofdept.
24.6 30.8 26.3 19.3 22.1 5.0 12.5 23.1
Seldom Number 0 6 0 1 5 0 0 12
% ofdept.
0.0 5.1 0.0 1.1 2.0 0.0 0.0 2.1
Never Number 0 2 0 1 1 0 1 5
% ofdept.
0.0 1.7 0.0 1.1 0.4 0.0 12.5 0.9
*Percent of total
97

70
Table GP 31
Graduate perception of Career Learninginstructors' help with problems, bydepartment
Frequency -4 c- = a r- cmm m- . M a) m(1 m ua m o- m
-I- rf 0 rt= -A. ma , Won >-A a-., as = = ,..4 0 ---,--a a M rt rf --.1 (17 0 3 -a 00 -. o 0 ~II II o uato -1 -1 m n ua,.< 4-c ,.< (17 t< 0
r- X 2: C7 CD -4 ;0 -ia m c -6-o m a oor C1 'I 0 et 0 Q. rt3 0 -I. CA 17 LT = -I. 0-5 0 -I. ma =o -1
Always Number 24 19 6 35 72 14 2 172
% ofdept.
41.4 16.5 31.6 39.8 29.3 70.0 25.0 31.0
Usually Number 26 50 9 35 112 6 3 241
% ofdept.
44.8 43.5 47.4 39.8 45.5 30.0 37.5 43.5
Sometimes Number 7 30 4 17 53 0 2 113
% ofdept.
12.1 26.1 21.1 19.3 21.5 0.0 25.0 20.4
Seldom Number 1 12 0 1 8 0 1 23
% ofdept.
1.7 10.4 0.0 1.1 3.3 0.0 12.5 4.2
Never Number 0 4 0 0 1 0 0 5
% ofdept.
0.0 3.5 0.0 0.0 0.4 0.0 0.0 0.9
Percent of total

71
Table GP 32
Graduate perception of Career Learninginstructors' help with program planning,
by department
Frequency-4 Cl = CD r v r- aC Mt C7 CD -4 20 --I
M or '< m a m a m C .J. -0 m a 0n m 113 = 0,- = or o. -s o ,-+ 0 CL es
Z- B -. rf 0 c-S 0 ....A. in -0 or or ..J. am ._.. m a -s a , 0 ..... m a a oo n a-44. am..., as = o-' o--+ CU M CI' rt ..... 4.0 0 9 .....4 0
O -- 0 0 -' ...a. 0 WO0 U3 -I.
44( 4( 4 40 4 0
Always Number 24 24 8 34 81 13 3 187
% ofdept.
42.1 21.1 44.4 38.6 ' 33.2 68.4 37.5 34.1*
Usually Number 18 39 3 30 93 5 3 191
% ofdept.
31.6 34.2 16.7 34.1 38.1 26.3 37.5 34.9
Sometimes Number 11 30 - 5 18 48 0 1 113
% ofdept.
19.3 26.3 27.8 20.5 19.7 0.0 12.5 20.6
Seldom Number 2 13 1 5 13 1 1 36
% ofdept.
3.5 11.4 5.6 5.7 5.3 5.3 12.5 6.6
Never Number 2 8 1 1 9 0 0 21
% ofdept.
3.5 7.0 5.6 1.1 3.7 0.0 0.0 3.8
Percent of total
99

72
Table GP 33
Graduate perception of Career Learninginstructors' accuracy of information,by department
Frequency-4 CI 2 C7 r- v r- x -...z
E 41.?-.4 7° -4
m :a- ,..c m w m w m c mw on m LO = Or ,Er a
-.1 . rh el Cl. rh=- 3 _.... c-} 0 r$ to 11 ..-.3- mr .... w= -..... m a -1 w -1 n _.... m a = o ......,
o n =--. 0, _, w cu = =-r o--........ W CD rt rh --. 1.0 in a J 00 -a 0 0 .a. ..a. C) (13ti] -I -I = n (D ..J,. ,..c t< (D 1-c n
Always Number 24 28 9 38 87 11 2 199
% ofdept.
42.1 24.6 47.4 43.7 34.4 55.0 25.0 35.7*
Usually Number 30 63 9 43 128 9 6 288
% ofdept.
52.6 55.3 47.4 49.4 50.6 45.0 75.0 51.6
.
Sometimes Number 3 18 1 5 31 0 0 58
% ofdept.
5.3 15.8 5.3 5.7 12.3 0.0 0.0 10.4
.
Seldom Number 0 4 0 1 6 0 0 11
% ofdept.
0.0 3.5 0.0 1.1 2.4 0.0 0.0 2.0
Never
,
Number , 0 1 0 0 1 0 0 2
% Lf
dept.
0.0 0.9 0.0 0.0 0.4 0.0 0.0 0.4
*Percent of total
100-

73
Table GP 34
Frequency of graduate interviewswith college counselor duringenrollment, by department
Frequency
(times)
-I CI SO I- a) r3 z 1::) o -i73 ---1fD = C<, (to 01 M 0) I'D C .-16) M W 0c-) m co = a- = Cr CL -S CA ef n a. et.=.- a -... c+ o c+ o -.. 0 -0 = = -... a=- M WI ''S 0) 'In ...i. M WI =oon =-1 W-' Cli Cli = m .-.4 0--'-.a al M C+ ii. ....6 (0 CA a -J 00 - 0 0 .-1. .-I. 0 1010 .1 '1 0 (.0 -In
.4.4 1.0 t<
1-2 Number 15 20 5 26 70 2 0 138
% ofdept.
65.2 62.5 55.6 65.0 63.1 66.7 0.0 62.2
3-5 Number 3 11 3 10 33 1 3 64
% ofdept.
13.0 37.4 33.3 25.0 29.7 33.3 75.0 28.9
6-13 Number 3 0 0 1 7 0 0 11
% ofdept.
13.0 0.0 0.0 2.5 6.3 0.0 0.0 5.0
11-15 Number 1 0 1 3 0 0 0 5
% ofdept.
over 15 Number
4.3
1
0.0
1
11.1
0
7.5
0
0.0
1
0.0
0
0.0
1
2.3
4
% ofdept.
4.3 3.1 0.0 0.0 0.9 0.0 25.0 1.8
Percent of total
101

74
Table GP 35
Graduate perception of educationalactivities most conducive to satisfactorycompletion of N.Y.C.C.C. curriculum
Activity
--4 c-, x C3 1- 1=1 r3 z c7 4:::) --4 7ze --4
IA= ac 0to =-4 co.
a+ 0cr- =O co.
a+ 0cr ra.O -a.
c-5cn
-67:3(A t-1.
-1Z1 7'
M 1110 O.S -0.0c1.W
= ...... M W , W , 0 ..... (D Cr- = 0 -,0 0 = -.1 cto -.1 MI 00 = = -1 0
..1 Cy M CO. rt ." Up 0 a .....1 00 . . 0 0 ../. .../. 0 4.0la .3 '3 = CI lat< t< t< u3 t< CI
High Number. 41 45 8 13 99 10 2 218
School% ofdept.
77.4 46.4 36.4 16.0 440.9 58.8 25.0 41.9
Biology Number 0 7 2 40 18 1 1 69
Audio-Tutorial % of 0.0 7.2 9.1 49.4 7.4 5.9 12.5 13.3
Lab. dept.
AHLC Number 2 15 3 7 57 2 1 87
StudentServices % of
dept.
3.8 15.5 13.6 8.6 23.6 11.8 12.5 16.7
Develop- Numbermental
2 8 2 4 18 2 1 37
Skills % of 3.8 8.2 9.1 4.9 7.4 11.8 12.5 7.1
Program dept.
Other Number 8 22 7 17 50 2 3 109
% ofdept.
15.1 22.7 31.8 21.0 20.7 11.8 37.5 21.0
102
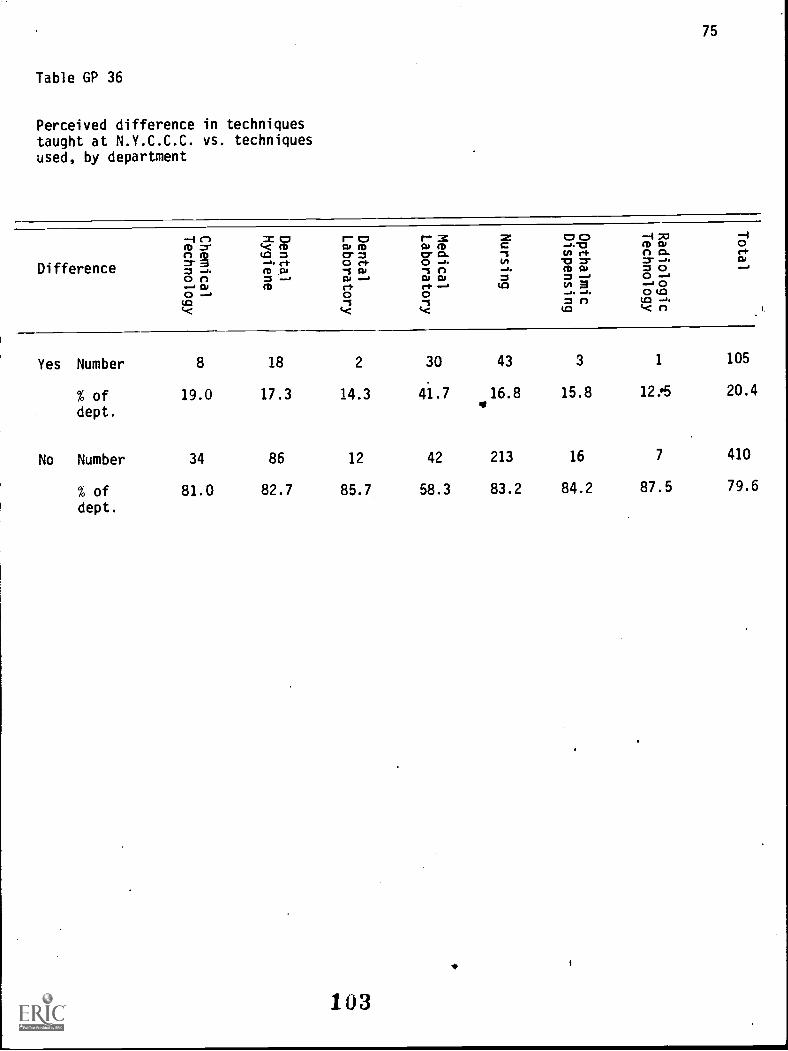
1
75
Table GP 36
Perceived difference in techniquestaught at N.Y.C.C.C. vs. techniquesused, by department
Difference
Mto
00M= -afD
r- X0 MCr0 a.
0.0.
, n0 0ei.o,
2EC-50=
a C,-1.00 c+'0 -a"
=9
....1 ...J0
(0=
-4 XI.M 00 CL= -A.
0 --,-.1 0C) 1.0
-0t
(0< n
.
--I
oc+a
Yes
No
Number
% ofdept.
Number
% ofdept.
8
19.0
34
81.0
18
17.3
86
82.7
2
14.3
12
85.7
30
41.7
42
58.3
43
16.8..
213
83.2
3
15.8
16
84.2
1
12.05
7
87.5
105
20.4
410
79.6
103

76
Table GP 37
Graduate perception of N.Y.C.C.C.curriculum as career preparation,by department
PerceptionI-- 00 MCr =0 rh-1 0\0 -aC+0-1(<
r313.1 CD
Ea.O"1 0CU CUC+ -i0""5(<
zC'1to-i.=
ICI
o.......g, -I xiVI c*
fD 00 0..MI S 7" .-1.M 0 = 0= .... 0 .."0 a ....4 0J. J. 0 la= 0 ICI J.
ICI t< n
-I0e+0
...o
Excellent Number 26 19 6 33 33 6 0 123
% ofdept.
42.6 16.4 27.3 37.9 12.3 28.6 0.0 21.1
Very Number 22 4( 3 39 100 10 6 266Good
% of.
dept.
36.1 39.7 13.6 44.8 37.3 47.6 66.7 38.7
Good Number 11 '41 8 13 92 5 2 172
% ofdept.
18.0 35.3 36.4 14.9 34.3 23.8 22.2 29.5
Fair Number 2 10 4 2 38 0 1 57
% ofdept.
3.3 8.6 18.2 2.3 14.2 0.0 11.1 9.8
Poor Number 0 0 1 0 5 0 0 6
% ofdept.
0.0 0.0 4.5 0.0 1.9 0.0 0.0 1.0
104
77-
Dental Hygiene Licensure Section
105

78
To evaluate the success of graduates of the Dental Hygiene department
of New York City Community Callege (N.Y.C.C.C.) on the National Board
Dental Hygiene Licensing (NBDHL) examination, and to determine their
perception of the value of various components of their N.Y.C.C.C.
curriculum as preparation for the NBDHL examination, this section of
the division evaluation was prepared. One-hundred-nineteen Dental
Hygiene department graduates responded to this questionnaire mailed
to all graduates; 99 respondents (83.2%) indicated they attempted the
NBDHL examination. The data herein is representative of these
respondents.
106
79
As stated above, 99 graduates reported taking the NBDHL examination.
Table DC-1 provides data describing the actual scores obtained by
graduates of N.Y.C.C.C. who reported taking the NBDHL examination and
7 graduates of N.Y.C.C.C. who did not report taking the examination.
Table DC-1 also provides selected statistics derived from the NBDHL
scores reported. It can be seen in Table DC-1 that approximately
76% of Dental Hygiene department graduates attempting NBDHL examination
scored 71 or over. The range of graduates' scores appears rather high
(83) with a high score of 93 and a low score of 10. Approximately
7% of the graduates attempting the examination scored 40 or below.
Tables DC-2 and DC-3 provide data showing the number of attempts
necessary to pass the NBDHL examination and the years in which the
first and second attempt were made. It is evident from Table DC-.2 that
95% of Dental Hygiene department graduates reporting passed the NBDHL
examination in their first or second attempt; 2% did not pass at all.
Table DC-3 shows 1974 to be the peak examination year for responding
graduates.
Respondents were asked to provide information about their attempts
at other certification examinations. Table DC-4 indicates that
approximately 85% of Dental Hygiene department graduates attempted
the New York State Practical Examination, the Northeast Regional
Board Examination, or both examinations. This was a slightly greater
107

80
percentage of graduates than reported attempting the NBDHL examination.
Tables DC-5 through DC-14 contain Dental Hygiene department graduates'
perception of the value of specific courses, in their curriculum at
N.Y.C.C.C., as preparation for each section of NBDHL examination. It
can be seen in Table DC-5 that graduates perceived Oral Hygiene Practice
II and Oral Hygiene Practice III to be the most valuable and second
most valuable courses respectively as preparation for the Oral Inspec-
tion section, and Public Health and Dental Specialties to be the least
valuable and second least valuable courses, respectively, as preparation
for the same section. Table DC-6 shows that the graduates perceive
Dental Radiology Lab I to be the most valuable course and Dental
Radiology Lab II the second most valuable course, and Organic Chemistry
to be the least valuable course and Public Health to be the second
least valuable course as preparation for the Radiograph section of
NBDHL examination.
Data in Table DC-7 provide information relative to the Diagnostic
Aids section of NBDHL. It is apparent that graduates perceive Oral
Hygiene Practice II to be the most valuable course and Oral Hygiene
Practice IV the second most valuable course as preparation for this
section. They also perceive Organic Chemistry to be the least valuable
course and Public Health to be the second least valuable course as
preparation for the same section. The relative perceived value of
courses as preparation for the Prophylaxis (Hand Scaling) section is

81
shown in Table DC-8. Oral Hygiene Practice III and Oral Hygiene
Practice II are considered the most valuable course and second most
valuable course, respectively; Public Health and Organic Chemistry
are considered the least valuable course and second least valuable
course, respectively. Table DC-9 provides the information that Dental
Hygiene department graduates perceived Oral Hygiene Practice IV to be
the most valuable course as preparation for the Prophylaxis (Ultra-
sonics) section of NBDHL and Oral Hygiene Practice III to be the second
most valuable course as preparation for the same section; Organic
Chemistry and Dental Specialties to be the least valuable course and
Dental Specialties to be the second least valuable course as preparation
for the same section.
Table DC-10 presents evidence that Oral Hygiene Practice IV and Oral
Hygiene Practice III are perceived to be the most valuable and second
most valuable course, respectively, as preparation for the Topical
Agents section of NBDHL. Dental Radiology Lab I and Dental Specialties
are perceived to be the least valuable and second least valuable
course, respectively, for the Topical Agents section. Perceived value
of courses as preparation for the Oral Health Instruction section is
shown in Table DC-11. Oral Hygiene Practice IV is rated as most
valuable and Oral Hygiene Practice III as second most valuable by
graduates of Dental Hygiene. Dental Radiology Lab I and Dental Radiology
Lab II are rated as least valuable and second least valuable, respec-
tively. It can be seen in Table DC-12 that graduates perceive Dental
109

82
Assisting and Dental-Materials to be the most valuable course and second
most valuable course as preparation for the Supportive Treatment section,
and Organic Chemistry and Microbiology to be the least valuable course
and second least valuable course, respectively, for the same section.
Table DC-13 shows graduates of Dental Hygiene perceive Pharmacology to
be the most valuable course as preparation for the Emergencies section
of NBDHL examination, and Oral Hygiene Theory to be the second most
valuable course as preparation for the same section. They also perceive
Organic Chemistry and Dental Specialties to be the least valuable and
second least valuable courses as preparation for the Emergencies
section. The relative value of courses as preparation for the
Community Health section are shown in Table DC-14. It can be seen
that graduates perceive Public Health to be the most valuable course,
Current Concepts in Dentistry the second most valuable course, Organic
Chemistry the least valuable course, and Dental Materials the second
least valuable course as preparation for this section.
Table DC-15 extends the same course by course ratings to Dental Hygiene
department graduates' perception of value as preparation for actual job
conditions. It can be seen from this table that graduates perceive
Oral Hygiene Practice III to be the most valuable and Oral Hygiene
Practice II to be the second most valuable course, respectively, and
Organic Chemistry to be the least valuable and Dental Assisting to be
the second least valuable course, respectively, as preparation for their
110'

83
actual health service employment. Ft should be noted that of 22
possible most valuable, or second most valuable, course preferences,
Oral Hygiene Practice II is specified five times, Oral Hygiene Practice
III is specified six times, and Oral Hygiene Practice IV is specified
four times. Of the 22 possible least valuable, or second least
valuable, course preferences, Organic Chemistry is specified eight
times, Dental Specialties is specified four times, and Public Health
is specified four times, but Public Health is also specified most
valuable one time.
Table DC-16 provides course grades of graduates of the Dental Hygiene
department for selected Career Learning courses. It can be seen that
the mean grade varies from 2.389 (Human Anatomy II) to 3.386 (Oral
Hygiene Practice IV), a difference that is statistically significant
at the .0001 level. The three courses perceived most valuable by
graduates of the department, Oral Hygiene Practice II, Oral Hygiene
Practice III, and Oral Hygiene Practice IV are also the three courses
in which the graduates scored the highest grades. The three courses
perceived least valuable by the graduates, Organic Chemistry, Public
Health, and Dental Specialties showed close to the lowest mean grades
and, in the case of Dental Specialties, showed no record of any
graduate.
Graduates' perception of the course component that was the best
preparation for each section of NBDHL is provided in Table DC-17.
111

84
It can be seen that the highest percentage of Dental Hygienedepart-
ment graduates perceive Laboratories to be the best preparation for
the Oral Inspection section, Radiographs section, Diagnostic Aids
section, Prophylaxis (Hand Scaling) section, Prophylaxis (Ultrasonics)
section, Topical Agents section and Supportive Treatment section.
They also perceive Lectures to be the best preparation for the Oral
Health Instruction section, Emergencies section, and Community Health
section. Extremely few graduates perceived Written Assignments to
be valuable as preparation for any section.
Tables DC-18 and DC-19 present Dental Hygiene department graduates'
perception of their Career Learning instructors and teaching strategies
as preparation for the various sections of NBDHL. It can be deter-
mined from Table DC-18 that the majority of graduates perceived their
instructors to be Very Good or Excellent as help in preparing for
the Oral Inspection section, Radiograph section, Prophylaxis Hand
Scaling section, and Oral Health section. The majority of graduates
perceived their instructors to be Good, Very Good, or Excellent as
help in preparing for all other sections of NBDHL. Instructors' help
was rated highest for the Oral Inspection section, lowest for the
Community Health section. Table DC-19 shows the graduates' perception
of teaching strategies most helpful as preparation for NBDHL. It
can be seen from this table that Subject Matter Stressed is rated
as most helpful for the Oral Inspection section; Method of Presenta-
tion is rated most helpful for the Radiographs section, Diagnostic
Aids section, Topical Agents section, Oral Health section, Emergencies
112

85
section, Supportive Treatment section and ;ommunity Health section;
Individual Assistance is rated most helpful for both Prophylaxis
sections.
Tables DC-20 and DC-21 show Dental Hygiene department graduates'
perceptions of their N.Y.C.C.C. curriculum as preparation for NBDHL
and for each section of NBDHL. It can be seen in Table DC-20 that
86% of the graduates perceive their overall training to be Good,
Very Good, or Excellent preparation for NBDHL and only 1.0% perceive
it to be poor preparation for the examination. When analyzed by
individual sections, as shown in Table DC-21, an extremely wide range
of value is perceived by graduates. From a maximum of approximately
85% of department graduates who perceive their N.Y.C.C.C. training to
be Good or Excellent preparation for the Prophylaxis Hand Scaling
section of NBDHL, the percentage drops to a minimum of 25% who
perceive their training to be Good or Excellent preparation for the
Community Health section. Confirmation of this spread of perception
is seen in the percentage of graduates who perceive their training
as Poor or Very Poor. Only 1% of graduates selected either of these
ratings for the Prophylaxis Hand Scaling section preparation whereas
31% selected them for Community Health section preparation. With
the exception of preparation for Prophylaxis Ultrasonics, Supportive
Treatment, Emergencies, and Community Health sections, over 85% of
responding graduates of the Dental Hygiene department perceived their
training to be Adequate, Good, or Excellent for the various sections
of NBDHL.
113

sae
To determine whether one or more course grades were predictive of
success on the NBDHL examination, correlations between graduates'
scores on the NBDHL and their course grades were computed. The
following subjects, listed in decreasing order of significance,
correlated at a significant level (P .7..01) with the NBDHL:
Dental Radiology Lab I
Pharmacology
Human Anatomy and Physiology.
A high grade in Dental Radiology Lab I was most predictive of a high
grade on the NBDHL examination, for all responding graduates of the
Dental Hygiene department.
The correlations computed, although significant at the 0.01 level,
were not particularly high. The highest correlation (Dental Radiology
Lab I) was r = 0.301. With a sample of this size, correlations of
the order of 0.5 and greater, with a significance level of 0.001, would
be expected. Additionally, no correlation was found between graduates'
course grades and the N.Y.S. Practical Examination or Northeast
Regional Board Examination, indicating that graduates' grades at
N.Y.C.C.C. were no indication of preparation for these examinations.
It is suggested that the methods of evaluation of subject mastery in
the Dental Hygiene department be thoroughly investigated as an initial
step to make student grades at N.Y.C.C.C. more predictive of students'
subject knowledge, ability, and eventual success on the various
licensing examinations.
114
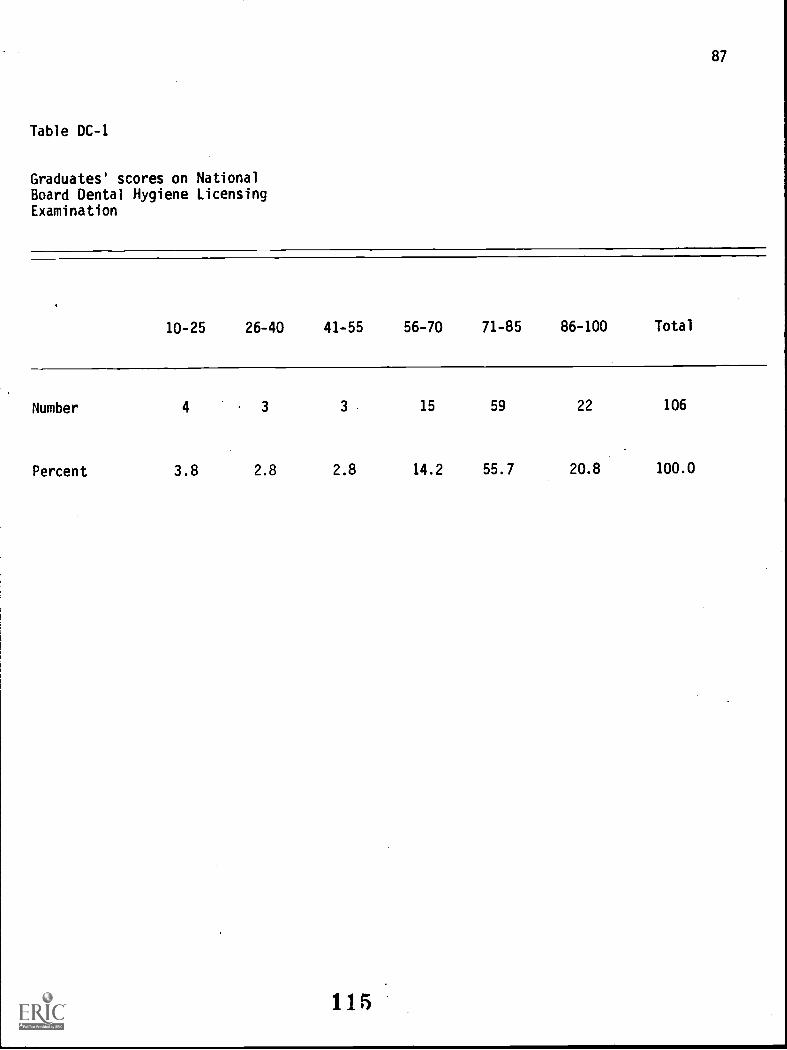
87
Table DC-1
Graduates' scores on NationalBoard Dental Hygiene LicensingExamination
10-25 26-40 41-55 56-70 71-85 86-100 Total
Number 4 3 3 15 59 22 106
Percent 3.8 2.8 2.8 14.2 55.7 20.8 100.0
115

88
Table DC-2
Graduates' report of number of attemptsneeded,to pass National Board DentalHygiene Licensing Examination
More than Did not
1 2 3 4 5 5 pass
Number 84 12 1 1 0 1 2
Percent 83.2 11.9 1.0 1.0 0.0 1.0 2.0
116

89
Table DC-3
Year of graduates' attempts atNational Board Dental Hygiene LicensingExamination
Year 1st attempt 2nd attempt Total
1968 -11 0 11
1969 10 0 10
1970 6 0 6
1971 15 0 15
1972 , 14 0 14
1973 21 0 21
1974 23 1 24
1975 0 2 2
117

90
Table DC-4
Graduates' report of otherexaminations attempted
Examination Number Percentage
N.Y.S. Practical Examination 35 29.4
Northeast Regional Board 10 8.4Examination
Both above examinations 56 47.1
None 18 15.1
118

Table DC-5
Graduates' perception of the valueof specific courses as preparation forthe Oral Inspection section of theNational Board Dental Hygiene Licensingexamination
91
CoursesVery
Useful Useful UselessVery
UselessDoes not
apply Rating
Oral Hygiene Number 41 46 18 2 4 9Theory
% 36.9 41.4 16.2 1.8 3.6
Oral Hygiene Number 70 23 13 2 2 4Practice I
% 63.6 20.9 11.8 1.8 1.8
Oral Number 73 27 10 3 0 3Anatomy
% 64.6 23.9 8.8 2.7 0.0
Microbiology Number 26 47 18 7 11 13
% * 23.9 43.1 16.5 6.4 10.1
Oral Hygiene Number 78 23 5 4 1 1
Practice II% 70.3 20.7 4.5 3.6 0.9
Dental Number 14 35 32 13 16 16Assisting
% 12.7 31.8 29.1 11.8 14.5
Human Number 20 59 21 7 6 11Anatomy
% 17.7 52.2 18.6 6.2 5;3
Organic Number 5 25 36 21 25 12Chemistry
% 4.5 22.3 32.1 18.8 22.3
Pathology Number 62 38 7 6 0 6
% 54.9 33.6 6.2 5.3 0.0
Oral Hygiene Number 78 22 6 3 2 2Practice III
% 70.3 19.8 5.4 2.7 1.8
Pharmacology Number 14 53 20 10 16 15
% 12.4 46.9 17.7 8.8 14.2
Dental Radiology Umber 60 24 9 11 6 8Lab I
% 54.5 21.8 8..2 10.0 5.5
119' (Cont. next page

92(Table DC-5 continued)
Very Very Does notCourses Useful Useful Useless Useless apply Rating
Periodontics Number 50 36 2 12 9 10
% 45.9 33.0 1.8 11.0 8.2
Public Number .12 30 34 16 21 19
Health% 10.6 26.5 30.1 14.2 18.6
Oral Hygiene Number 73 23 7 6 3 5
Practice IV% 65.2 20.5 6.3 5.4 2.7
Dental Number 15 39 22 12 20 17
Materials% 13.9 36.1 20.4 11.1 18.5
Dental Radio-logy Lab II
Number 62 26 12 5 6 7
% 55.9 23.4 10.8 4.5 5.4
Current Number 23 42 16 5 14 14
Concepts inDentistry % 23.0 42.0 16.0 5.0 14.0
Dental Number 15 39 12 1 29 18
Specialties% 15.6 40.6 12.5 1.0 30.2
120

Table DC-6
Graduates' perception of the value ofspecific courses as preparation forthe Radiographic section of the NationalBoard Dental Hygiene Licensing examination
93
CoursesVery Very Does not
Useful Useful Useless Useless apply Rating
Oral Hygiene Number 21 34Theory
% 19.6 31.8
Oral Hygiene Number 24 38Practice I
% 22.6 35.8
Oral Number 63 32Anatomy
% 57.8 29.4
Microbiology Number 7 24
% 7.4 25.5
Oral Hygiene Number 30 38Practice II
% 27.5 34.9
Dental Number 6 26Assisting
% 5.6 24.1
Human Number 23 43Anatomy
% 21.3 39.8
Organic Number 5 7
Chemistry
% 4.6 6.4
Pathology Number 52 42
% 43.7 35.3
Oral Hygiene Number 36 31Practice III
% 37.1 32.0
Pharmacology Number 10 19
% 9.4 17.9
Dental Radiology Number 85 20Lab I
77.3 18.2
121
28 6 18 11
26.2 5.6 16.8
24 2 18 10
22.6 1.9 17.0
3 6 5 3
2.8 5.5 4.6
28 5 30 14
29.8 5.3 31.9
24 0 17 7
22.0 0.0 15.6
38 9 29 13
35.2 8.3 26.9
24 5 13 8
22.2 4.6 12.0
42 36 10 19
38.5 17.4 33.0
8 1 5 4
6.7 0.8 4.2
15 0 15 9
15.5 0.0 15.5
35 6 36 15
33.0 5.7 34.0
3 1 1 1
2.7 0.9 0.9
(Cont. next page)

(Table DC-6 continued) 94
Very Very Does notCourses Useful Useful Useless Useless apply Rating
Periodontics Number 33 53 9 0 13 6
% 30.6 49.1 8.3 0.0 12:0
Public Number 5 12 40 12 40 18
Health% 4.6 11.0 36.7 11.0 36.7
Oral Hygiene Number 33 39 15 8 14 5
Practice IV% 30.3 35.8 13.8 7.3 12.8
Dental Number 6 27 24 12 37 16
Materials% 5.7 25.5 22.6 11.3 34.9
Dental Radio-logy Lab II
Number 72 24 4 4 6 2
% 65.5 21.8 3.6 3.6 5.5
Current Number 14 28 23 6 27 12
Concepts inDentistry % 14.3 28.6 23.5 6.1 27.6
Dental Number 6 23 16 7 44 17
Specialties% 6.3 24.0 16.7 7.3 45.8
122

Table DC-7
Graduates' perception of the value ofspecific courses as preparation for theDiagnostic Aids section of the NationalBoard Dental Hygiene Licensing examination
95
CoursesVery
Useful Useful UselessVery
UselessDoes notapply Rating
Oral Hygiene Number 39 40 3 6 6 7
Theory% 41.5 42.6 3.2 6.4 6.4
Oral Hygiene Number 42 37 4 2 8 6Practice I
% 45.2 39.8 4.3 2.2 8.8
Oral Number 39 37 5 8 1 5
Anatomy% 43.3 41.1 5.6 8.9 1.1
Microbiology Number 21 32 19 4 16 13
% 22.8 34.8 20.7 4.3 17.4
Oral Hygiene Number 45 37 0 0 4 1
Practice II% 52.3 43.0 0.0 0.0 4.7
Dental Number 16 40 19 3 12 12
Assisting% 17.8 44.4 21.1 3.3 13.3
Human Number 17 41 12 5 15 14
Anatomy% 18.9 45.6 13.3 5.6 16.7
Organic Number 0 17 29 13 29 19
Chemistry% 0.0 19.3 33.0 14.8 32.9
Pathology Number 30 45 4 7 4 9
.% 33.3 50.0 4.4 7.8 4.4
Oral Hygiene Number 38 40 2 3 6Practice III
% 42.7 44.9 2.3 3.4 6.7
Pharmacology Number 5 33 17 8 14 16
% 6.5 42.9 22.1 10.4 18.2
Dental Radiology Number 38 37 5 3 6 3
Lab I
% 42.7 41.6 5.6 3.4 6.7
123(Cont. next page)

(Table DC-7 continued) 96
Very Very Does notCourses Useful Useful Useless Useless apply Rating
Periodontics Number 25 44 4 1 12 10
% 29.1 51.2 4.7 1.2 14.0
Public Number 6 21 27 9 24 18
Health% 6.9 24.1 31.0 10.3 27.5
Oral Hygiene Number 42 39 0 0 9 2
Practice IV% 46.7 43.3 0.0 0.0 10.0
Dental Number 10 31 21 4 17 15
Materials% 12.0 37.3 25.3 4.8 20.5
Dental Radio-logy Lab II
Number 36 38 3 1 8 4
% 41.9 44.2 3.5 1.2 9.3
Current Number 19 39 13 1 12 11
Concepts inDentistry % 22.6 46.4 15.5 1.2 14.3
Dental Number 12 28 16 2 26 17
Specialties14.3 33.3 19.0 2.4 31.0
124
...e.

Table DC-8
97Graduates' perception of the value ofspecific courses as preparation for theProphylaxis A section of the NationalBoard Dental Hygiene Licensing examination
CoursesVery
Useful Useful UselessVery
UselessDoes notapply Rating
Oral Hygiene Number 55 29 5 2 4 6Theory
57.9 30.5 5.3 2.1 4.2
Oral Hygiene Number 86 18 1 0 1 3Practice I
79.6 16.7 2.8 0.0 0.9
Oral Number 67 29 5 0 6Anatomy
% 62.6 27.1 4.7 0.0 5.6
Microbiology Number 18 32 28 5 23 13
% 17.0 30.2 26.4 4.7 21.7
Oral Hygiene Number 84 22 1 0 0 2Practice II
% 78.5 20.6 0.9 0.0 0.0
Dental Number 10 31 31 8 23 16Assisting
% 9.7 30.1 30.1 7.8 22.3
Human Number 18 39 22 8 18 10Anatomy
% 17.1 37.1 21.0 7.6 17:1
Organic Number 5 19 34 14 32 18Chemistry
% 4.8 18.3 32.7 13.5 30.8
Pathology Number 36 35 20 1 14 8
% 34.0 33.0 18.9 0.9 13.2
Oral Hygiene Number 88 16 2 0 0 1
Practice III
% 83.0 15.1 1.9 0.0 0.0
Pharmacology Number 17 30 21 7 30 15
% 16.2 28.6 20.0 6.7 28.6
Dental Radiology Number 17 38 22 2 26 12Lab I
% 16.2 36.2 21.0 1.9 24.8
125(Cont. next page
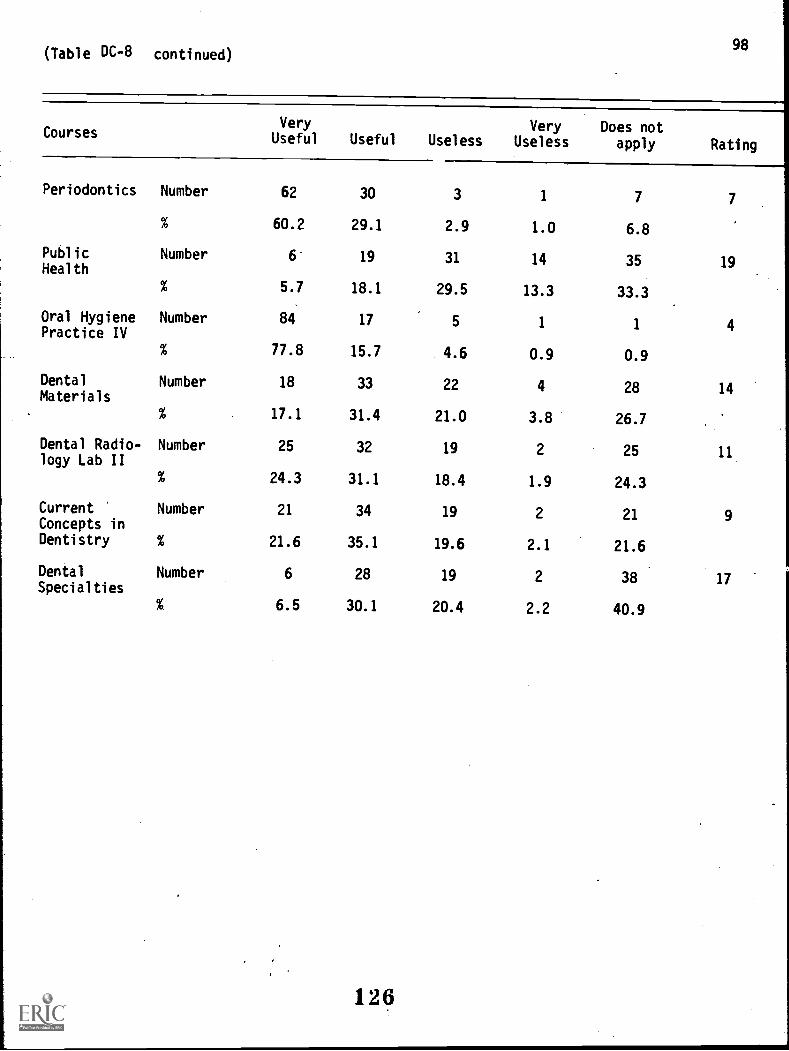
98(Table DC-8 continued)
Very Very Does notCourses Useful Useful Useless Useless apply Rating
Periodontics Number 62 30 3 1 7 7
% 60.2 29.1 2.9 1.0 6.8
Public Number 6 19 31 14 35 19Health
% 5.7 18.1 29.5 13.3 33.3
Oral Hygiene Number 84. 17 5 1 1Practice IV
% 77.8 15.7 4.6 0.9 0.9
Dental Number 18 33 22 4 28 14Materials
% 17.1 31.4 21.0 3.8 26.7
Dental Radio-logy Lab II
Number 25 32 19 2 25 11
% 24.3 31.1 18.4 1.9 24.3
Current Number 21 34 19 2 21 9Concepts inDentistry % 21.6 35.1 19.6 2.1 21.6
Dental Number 6 28 19 2 38 17Specialties
% 6.5 30.1 20.4 2.2 40.9
126

Table DC-9
Graduates' perception of the value ofspecific courses as preparation for theProphylaxis B section of the NationalBoard Dental. Hygiene Licensing examination
99
CoursesVery
Useful Useful Useless. VeryUseless
Does notapply Rating
Oral Hygiene Number 26 32 14 6 8 5 .
Theory
% 30.2 37.2 16.3 7.0 9.3
Oral Hygiene Number 37 26 18 7 10 6Practice I
% 37.8 26.5 18.4 7.1 10.2
Oral Number 36 31 14 4 14 7Anatomy
% 36.4 31.3 14.1 4.0 14.1
Microbiology Number 14 21 32 6 26 11
% 14.1 21.2 32.3 6.1 26.3
Oral Hygiene Number 40 32 12 4 10 3Practice II
% 40.8 32.7 12.2 4.1 10.2
Dental Number 8 28 26 10 24 13Assisting
% 8.3 29.2 27.1 10.4 25.0
Human Number 7 24 34 7, 27 15
Anatomy% 7.1 24.2 34.3 7.1 27.3
Organic Number 6 10 36 15 31 19Chemistry
% 6.1 10.2 36.7 15.3 31.6
Pathology Number 13 30 23 7 23 9
% 13.5 31.3 24.0 7.3 24.0
Oral Hygiene Number 55 28 8 3 5 2Practice III
% 55.6 28.3 8.1 3.0 5.1
Pharmacology Number 11 18 30 7 30 16
% 11.5 18.8 31.3 7.3 31.3
Dental Radiology Number 11 24 28 6 29 14Lab I
11.2 24.5 28.6 6.1 29.6
1-27 (Cont. next page)

100(Table pc-9 continued)
Very Very Does notCourses Useful . Useful Useless Useless apply Rating
Periodontics Number 40 31 9 5 13 4
% 40.8 31.6 9.2 5.1 13.3
Public Number 7 15 33 15 26 17Health
% 7.3 15.6 34.4 15.6 27.1
Oral Hygiene Number 59 27 5 4 26 1Practice IV
% 59.0 27.0 5.0 4.0 5.0
Dental Number 15 26 25 4 26 10Materials
% 15.6 27.1 26.0 4.2 27.1
Dental Radio-logy. Lab II
Number 12 24 27 5 28 12
% 12.5 25.0 28.1 5.2 29.2
Current Number 23 24 16 3 25 8Concepts inDentistry % 25.3 26.4 17.6 3.3 27.5
Dental Number 7 16 25 2 32 18Specialties
% 5.9 13.4 21.0 1.7 26.9
1448

Table DC-10
Graduates' perception of the value ofspecific courses as preparation for theTopical Agents section of the NationalBoard Dental Hygiene Licensing examination
101
Very Very Does notCoursesUseful Useful Useless Useless apply Rating
Oral Hygiene Number 35 47 6 1 6 4Theory
% 36.8 49.5 6.3 1.1 6.3
Oral Hygiene Number 34 38 12 3 9 5Practice I
% 35.4 39.6 12.5 3.1 9.4
Oral Number 23 36 19 3 15 6Anatomy
% 24.0 37.5 19.8 3.1 15.6
Microbiology Number 8 27 32 4 25 14
% 8.3 28.1 33.3 4.2 26.0
Oral Hygiene Number 48 34 8 1 5 3Practice II
% 50.0 35.4 8.3 1.0 5.2
Dental Number 7 45 25 5 15 9Assisting
% 7.2 46.4 25.8 5.2 15.5
Human Number 8 20 36 6 25 15Anatomy
% 8.4 21.1 37.9 6.3 26.3
Organic Number 5 21 37 8 24 16Chemistry
% 5.3 22.1 38.9 8.4 25.3
Pathology Number 9 32 28 3 23 12
% 9.5 33.7 29.5 3.2 24.3
Oral Hygiene Number 59 28 3 2 4 2Practice III
% 49.6 23.5 2.5 1.7 3.4
Pharmacology Number 15 38 21 4 18 10
% 15.6 39.6 21.9 4.2 18.8
Dental Radiology Number 8 18 30 4 35 19Lab I
% 8.4 18.9 31.6 4.2 36.8
129 (Cont. next page)

(Table DC-10 continued)102
Very Very Does notCourses Useful Useful Useless Useless apply Rating
Periodontics Number 9 32 21 2 25 13
% 10.1 36.0 23.6 2.2 28.1
Public Number 14 28 30 6 17 11Health
% 14.7 29.5 31.6 6.3 17.9
Oral Hygiene Number 58 30 3 2 3 1Practice IV
% 60.4 31.3 3.1 2.1 3.1
Dental Number 15 39 24 2 14 7Materials
% 16.0 41.5 25.5 2.1 14.9
Dental Radio-logy Lab II
Number 9 20 30 3 33 17
% 9.5 21.1 31.6 3.2 34.7
Current Number 14 38 14 2 20. 8Concepts inDentistry % 15.9 43.2 15.9 2.3 22.7
Dental Number 7 21 20 2 31 18.Specialties
% 8.6 25.9 24.7 2.5 38.3
130

Table DC-11
Graduates' perception of the value ofspecific courses as preparation for theOral Health Instruction section of the NationalBoard Dental Hygiene Licensing examination
103
CoursesVery
Useful Useful UselessVery
UselessDoes notapply Rating
Oral Hygiene Number 51 42 8 3 3 4Theory
% 47.7 39.3 7.5 2.8 2.8
Oral Hygiene Number 48 42 12 4 1 5Practice I
% 44.9 39.3 11.2 3.7 0.9
Oral Number 34 42 16 1 14 8Anatomy
% 31.8 39.3 15.0 0.9 13.1
Microbiology Number 24 47 17 0 15
% 23.1 45.2 16.3 0.0 15.4
Oral Hygiene Number 56 43 6 1 1 3Practice II
% 52.3 40.2 5.6 0.9 0.9
Dental Number 12 36 30 7 20 15Assisting
% 11.4 34.3 28.6 6.7 19.0
Human Number 18 34 28 6 20 13Anatomy
% 17.0 32.1 26.4 5.7 18.9
Organic Number 11 30 33 5 25 16Chemistry
% 10.6 28.8 31.7 4.8 24.0
Pathology Number 35 52 7 1 10 7
% 33.3 49.5 6.7 1.0 9.5
Oral Hygiene Number 62 39 5 1 0Practice III
% 57.9 36.4 4.7 0.9 0.0
Pharmacology Number 15 43 26 3 17 11
% 14.4 41.3 25.0 2.9 16.3
Dental Radiology Number 12 23 27 3 36 19Lab I
% 11.9 22.8 26.7 3.0 35.6
131(Cont. next page)

104(Table DC-11 continued)
CoursesVery
Useful Useful UselessVery
UselessDoes not
apply Rating
Periodontics Number 40 49 7 1 5 6
% 39.2 48.0 6.9 1.0 4.9
Public Number 19 36 23 8 17 12Health
% 18.4 35.0 22.3 7.8 16.5
Oral Hygiene Number 68 36 2 1 0 1Practice IV
% 63.6 33.6 1.9 0.9 0.0
Dental Number 15 36 22 , 7 19 14Materials
% 15.2 36.4 22.2 7.1 19.2
Dental Radio-logy Lab II
Number 11 30 27 2 32 18
% 10.8 29.4 26.5 1.0 31.4
Current Number 25 41 10 1 19 10Concepts inDentistry % 26.0 42.7 10.4 1.0 19.8
Dental Number 11 32 18 1 28 17Specialties
% 12.2 35.6 20.0 1.1 31.1
132

Table DC-12
Graduates' perception of the value ofspecific courses as preparation for theSupportive Treatment section of the NationalBoard Dental Hygiene Licensing examination
105
CoursesVery
Useful Useful UselessVery
UselessDoes notapply Rating
Oral Hygiene Number 15 39 17 0 14 5Theory
% 17.6 45.9 20.0 0.0 16.5
Oral Hygiene Number 15 32 21 1 15 7Practice I
% 17.9 38.1 25.0 1.2 17.9
Oral Number 7 31 24 2 27 13Anatomy
% 7.7 34.1 26.4 2.2 29.7
Microbiology Number 7 13 35 0 37 18
% 7.6 14.1 38.0 0.0 40.2
Oral Hygiene Number 24 33 19 0 16 4Practice II
Z 26.1 35.9 20.7 0.0 17.4
Dental Number 27 47 14 1 4 1
Assisting
% 29.0 50.5 15.1 1.1 4.3
Human Number 9 19 30 1 33 16Anatomy
% 9.8 20.7 32.6 1.1 35.9
Organic Number 3 20 28 6 35 19Chemistry
% 3.3 21.7 30.4 6.5 38.0
Pathology Number 6 27 25 2 31 15
% 6.6 29.7 27.5 2.2 34.1
Oral Hygiene Number 22 32 19 1 17 6Practice III
% 24.2 35.2 20.9 1.1 18.7
Pharmacology Number 8 36 23 3 22 11
% 8.7 39.1 25.0 3.3 23.9
Dental Radiology Number 14 28 25 0 27 12Lab I
% 14.9 29.8 26.6 0.0 28.7
(Cont. next page)
133

106(Table DC-12 continued)
Very Very Does notCoursesUseful Useful Useless Useless apply Rating
Periodontics Number 11 31 23 0 24 9
% 12.4 34.8 25.8 0.0 27.0
Public Number 6 14 32 7 31 17Health
% 6.7 15.6 35.6 7.8 34.4
Oral Hygiene Number 38 14 0 14Practice IV
% 28.3 41.3 15.2 0.0 15.2
Dental Number 42 25 15 2 9 2Materials% 45.2 26.9 16.1 2.2 9.7
Dental Radio-logy lab II
Number 14 27 25 2 24 10
% 15.2 29.3 27.2 2.2 26.1
Current Number 11 34 19 2 20 8Concepts inDentistry % 12.8 39.5 22.1 2.3 23.3
Dental Number 10 25 18 2 27 14Specialties
% 12.2 30.5 22.0 2.4 32.9
13.4,
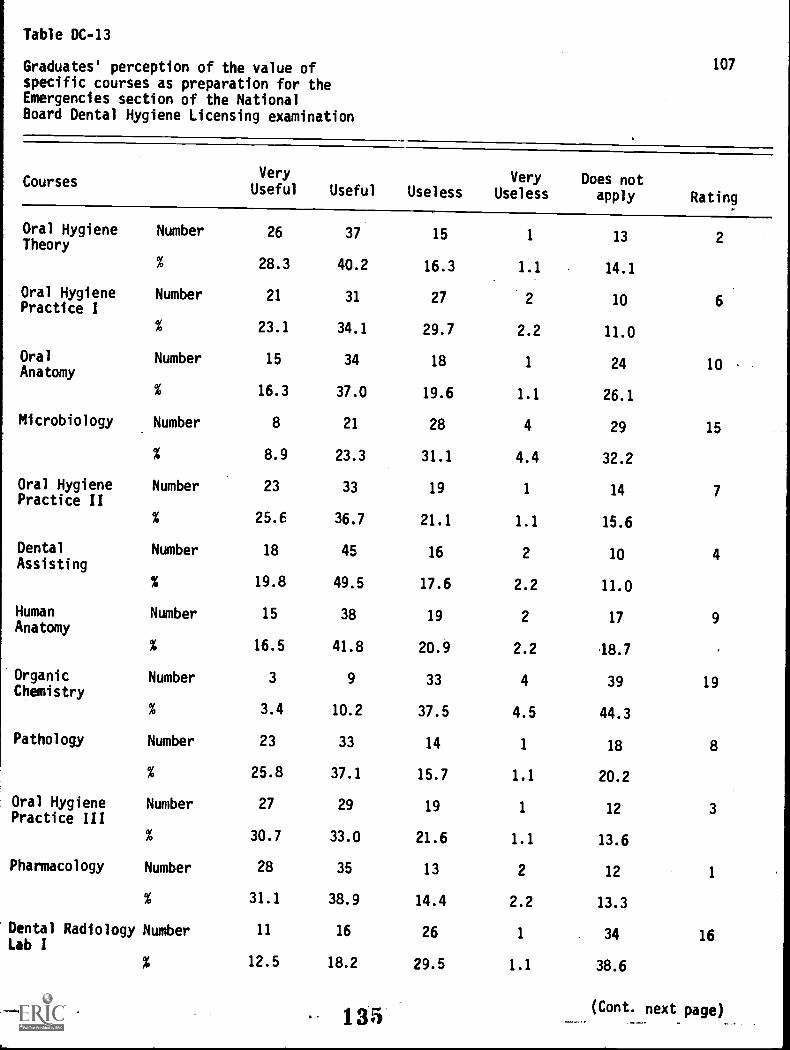
Table DC-13
Graduates' perception of the value ofspecific courses as preparation for theEmergencies section of the NationalBoard Dental Hygiene Licensing examination
107
CoursesVery
Useful Useful UselessVery
UselessDoes not
apply Rating
Oral Hygiene Number 26 37 15 1 13 2Theory
% 28.3 40.2 16.3 1.1 14.1
Oral Hygiene Number 21 31 27 2 10 6Practice I
% 23.1 34.1 29.7 2.2 11.0
Oral Number 15 34 18 1 24 10Anatomy
% 16.3 37.0 19.6 1.1 26.1
Microbiology Number 8 21 28 4 29 15
% 8.9 23.3 31.1 4.4 32.2
Oral Hygiene Number 23 33 19 1 14 7Practice II
% 25.6 36.7 21.1 1.1 15.6
Dental Number 18 45 16 2 10 4Assisting
% 19.8 49.5 17.6 2.2 11.0
Human Number 15 38 19 2 17 9Anatomy
% 16.5 41.8 20.9 2.2 18.7
Organic Number 3 9 33 4 39 19Chemistry
% 3.4 10.2 37.5 4.5 44.3
Pathology Number 23 33 14 1 18 8
% 25.8 37.1 15.7 1.1 20.2
Oral Hygiene Number 27 29 19 1 12 3Practice III
% 30.7 33.0 21.6 1.1 13.6
Pharmacology Number 28 35 13 2 12 1
% 31.1 38.9 14.4 2.2 13.3
Dental Radiology Number 11 16 26 1 34 16Lab I
% 12.5 18.2 29.5 1.1 38.6
135 (Cont. next page)

(Table DC-13 continued)108
Very Very Does notCoursesUseful Useful Useless Useless apply Rating
Periodontics Number 13 21 20 1 28 12
% 15.7 25.3 24.1 1.2 33.7
Public Number 8 20 26 7 26 14Health
% 9.2 23.0 29.9 8.0 29.9
Oral Hygiene Number 23 33 18 1 14 5Practice IV {
% 25.8 37.1 20.2 1.1 15.7
Dental Number 8 29 19 3 28 13Materials
% 9.2 33.3 21.8 3.4 32.2
Dental Radio-logy Lab II
Number 10 17 26 0 34 17
% 11.5 19.5 29.9 0.0 39.1
Current Number 12 29 15 4 21 11Concepts inDentistry % 14.8 35.8 18.5 4.9 25.9
Dental Number 7 18 18 4 31 18Specialties
% 9.0 23.1 23.1 5.1 39.7
136

Table DC-14
Graduates' perception of the value ofspecific courses as preparation for theCommunity Health section of the NationalBoard Dental Hygiene Licensing examination
109
CoursesVery
Useful Useful UselessVery
UselessDoes notapply Rating
Oral Hygiene Number 15 30 17 4 18 4Theory% 17.9 35.7 20.2 4.8 21.4
Oral Hygiene Number 12 22 22 6 21 10Practice I
% 14.5 26.5 26.5 7.2 25.3
Oral Number 11 23 24 7 27 15Anatomy
% 12.0 25.0 26.1 7.6 29.3
Microbiology Number 13 21 25 5 27 12
% 14.3 23.1 27.5 5.5 29.7
Oral Hygiene Number 19 24 23 3 22 5Practice II
% 20.9 26.4 25.3 3.3 24.2
Dental Number 17 24 20 5 24 8Assisting
5 18.9 26.9 22.2 5.6 26.7
Human Number 11 22 26 7 26 14Anatomy
5 12.0 23.9 28.3 7.6 28.3
Organic Number 3 13 30 10 35 19Chemistry
5 3.3 14.3 33.0 11.0 38.5
Pathology Number 12 30 22 5 24
5 12.9 32.3 23.7 5.4 25.8
Oral Hygiene Number 15 31 21 3 22 6PraCtice III
5 16.3 33.7 22.8 3.3 23.9
Pharmacology Number 7 32 21 5 27 13
5 7.6 34.8 22.8 5.4 29.3
Dental Radiology Number 17 12 24 8 31 17'Lab I
18.5 13.0 26.1 8.7 33.7
131 (Cont. next page)

(Table DC-14 continued) 110
Very Very Does notCourses Useful Useful Useless Useless apply Rating
Periodontics Number 13 29 19 4 23
% 14.8 33.0 21.6 4.5 26.1
Public Number 37 26 19 8 5 1Health
% 38.9 27.4 20.0 8.4 5.3
Oral Hygiene Number 20 28 19 3 22 3Practice IV
% 21.7 30.4 20.7 3.3 23.9
Dental Number 13 16 24 4 32 18Materials% 14.6 18.0 27.0 4.5 36.0
Dental Radio-logy Lab II
Number 17 11 27 4 32 16
% 18.7 12.1 29.7 4.4 35.2
Current Number 17 33 16 6 14 2Concepts inDentistry % 19.8 38.4 18.6 7.0 16.3
Dental Number 11 24 18 4 26 11Specialties
% 13.3 28.9 21.7 4.8 31.3
.138

Table DC-15
Graduates' perception of the value ofspecific courses as preparation foractual employment conditions
111
CoursesVery
Useful Useful UselessVery
UselessDoes not
apply Rating.
Oral Hygiene Number 42 47 7 1 6 10Theory
% 40.8 45.6 6.8 1.0 5.8
Oral Hygiene Number 53 32 9 3 5 8Practice I
% 52.0 31.4 8.8 2.9 4.9
Oral Number 52 44 3 0 2 3Anatomy
% 51.5 43.6 3.0 0.0 2.0
Microbiology Number 19 49 18 10 6 14
% 18.6 48.0 17.6 9.8 5.9
Oral Hygiene Number 63 27 6 1 4 2Practice II
% 62.4 26.7 5.9 1.0 4.0
Dental Number 25 38 24 10 3 18Assisting% 25.0 38.0 24.0 10.0 3.0
Human Number 25 55 15 3 4 13Anatomy
% 24.5 53.9 14.7 2.9 3.9
Organic Number 8 18 42 21 13 19Chemistry
% 7.8 17.6 41.2 20.6 12.7
Pathology Number 45 48 6 0 2 7
% 44.6 47.5 5.9 0.0 2.0
Oral Hygiene Number 68 23 8 0 3 1Practice III
% 66.7 22.5 7.8 0.0 2.9
Pharmacology Number 22 61 13 4 2 12
% 21.6 59.8 12.7 3.9 2.0
Dental Radiology Number 57 32 10 1 2 6Lab I
% 55.9 31.4 9.8 1.0 2.0
139(Cont. next page)

. (Table DC-15 continued) 112
Very Very Does notCourses Useful Useful Useless Useless apply Rating
Periodontics Number 46 40 5 0 7 9
% 46.9 40.8 5.1 0.0 7.1
Public Number 21 30 33 14 5 17Health
% 20.4 29.1 32.0 13.6 4.9
Oral Hygiene Number 73 21 6 0 3 4Practice IV
% 70.9 20.4 5.8 0.0 2.9
Dental Number 26 43 18 5 6 15Materials
% 26.3 43.4 18.2 5.1 6.1
Dental Radio-logy Lab II
Number 60 31 7 2 2 5
% 58.8 30.4 6.9 2.0 2.0
Current Number 32 44 5 6 6 11Concepts inDentistry % 34.4 47.3 5.4 6.5 6.5
Dental Number 21 36 11 3 - 16 16Specialties
% 24.1 41.4 12.6 3.4 18.4
140

Table DC-16
Graduates' grades for selectedCareer Learning courses
113
Course
Oral Hygiene NumberTheory
%
Oral Hygiene NumberPractice 1
%
Oral Hygiene NumberPractice 2
%
Oral Hygiene NumberPractice 3
%
Oral Hygiene NumberPractice 4
%
Oral NumberAnatomy
%
Microbiology Number1
%
Dental NumberAssisting
%
Human NumberAnatomy 1
%
Human NumberAnatomy 2
%
Organic NumberChemistry
%
A B C D Other
Mean Grade
Standard Deviati
10 16 10 0 83 3.000
8.4 13.4 8.4 0.0 69.7 0.756
32 49 19 2 17 3.088
26.9 41.2 16.0 1.7 14.3 0.759
34 57 12 0 16 3.214
28.6 47.9 10.1 0.0 13.4 0.636
27 67 5 1 19 3.200
22.7 56.3 4.2 0.8 16.0 0.569
42 56 3 0 18 3.386
35.3 47.1 2.5 0.0 15.1 0.547
37 44 20. 2 16 3.126
31.1 37.0 16.8 1.7 13.4 0.778
16 33 23 5 42 2.779
13.4 27.7 19.3 4.2 35.3 0.853
29 49 17 2 22 3.082
24.4 41.2 14.3 1.7 18.5 0.745
15 35 40 13 16 2.505
12.6 29.4 33.6 10.9 13.4 0.895
1 7 8 2 101 2.389
0.8 5.9 6.7 1.7 84.9 0.778
29 33 38 3 16 2.854
24.4 27.7 31.9 2.5 13.4 0.868
141(continued next page)
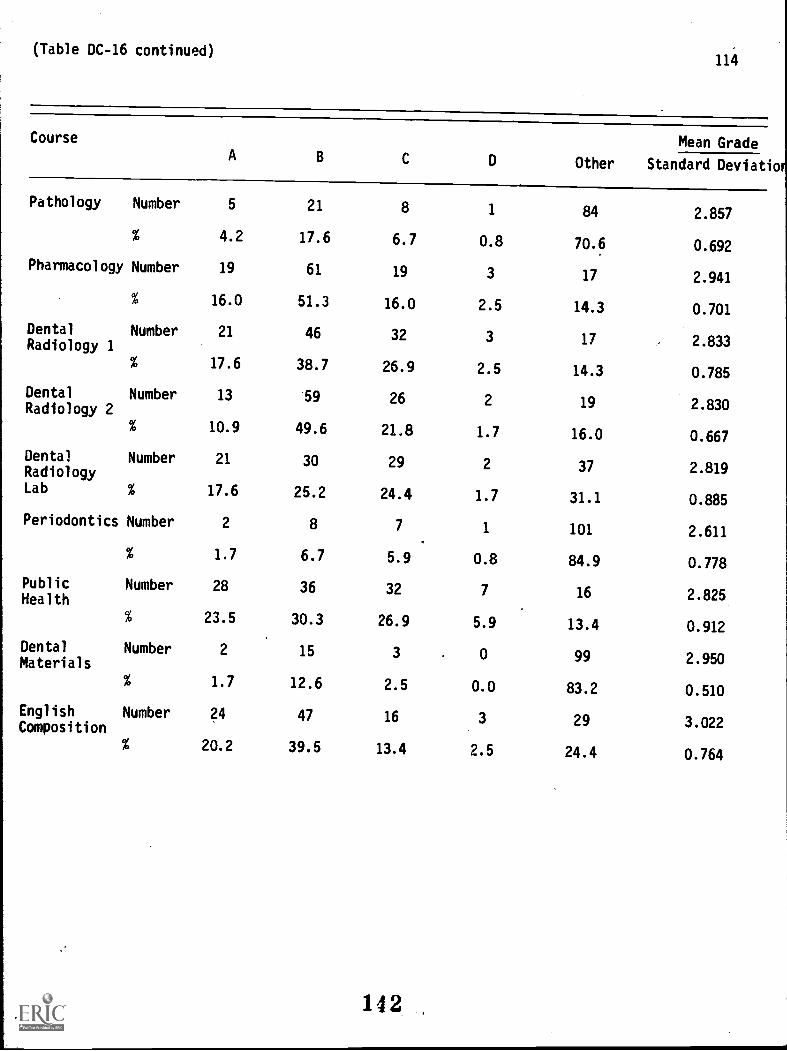
(Table DC-16 continued)114
CourseA
Pathology Number 5
% 4.2
Pharmacology Number 19
% 16.0
Dental Number 21Radiology 1
% 17.6
Dental Number 13Radiology 2
% 10.9
Dental Number 21RadiologyLab % 17.6
Periodontics Number 2
% 1.7
Public Number 28Health
% 23.5
Dental Number 2Materials
% 1.7
English Number 24Composition
% 20.2
B C D Other
Mean Grade
Standard Deviatio
21 8 1 84 2.857
17.6 6.7 0.8 70.6 0.692
61 19 3 17 2.941
51.3 16.0 2.5 14.3 0.701
46 32 3 17 2.833
38.7 26.9 2.5 14.3 0.785
59 26 2 19 2.830
49.6 21.8 1.7 16.0 0.667
30 29 2 37 2.819
25.2 24.4 1.7 31.1 0.885
8 7 1 101 2.611
6.7 5.9 0.8 84.9 0.778
36 32 7 16 2.825
30.3 26.9 5.9 13.4 0.912
15 3 0 99 2.950
12.6 2.5 0.0 83.2 0.510
47 16 3 29 3.022
39.5 13.4 2.5 24.4 0.764
142

Table DC-17
,duates' perception of coursecomponents for each section ofNational Board Dental HygieneLicensing Examination
115
Section 'LabsReadingMaterial
WrittenAssignments Exams
ReviewSeminars Lectures Discussion
Oral Number 68 10 0 3 8 10 10Inspection
5 62.4 9.2 0.0 2.8 7.3 9.2 9.2
Radiographs Number 53 4 2 7 10 24 9
% 48.6 3.7 1.8 6.4 9.2 22.0 8.3
Diagnostic Number 37 15 3 4 11 17 14Aids
% 36.6 14.9 3.0 4.0 10.9 16.8 13.9
Prophylaxisa. Hand
Number 84 1 1 0 2 2 4
Scaling 5 89.4 1.1 1.1 0.0 2.1 2.1 4.3
b. Ultra-sonics
Number 62 11 0 0 1 5 9
5 70.5 12.5 0.0 0.0 1.1 5.7 10.3
Topical Number 63 15 2 3 3 7 14Agents(fluorides) S 58.9 14.0 1.9 2.8 2.8 6.5 13.0
Oral Health Number 6 20 8 8 2 45 19InstructionNutrition % 5.8 19.4 7.8 7.8 1.9 43.7 13.6
Emergencies Number 6 26 3 2 7 44 12
5 6.0 26.0 3.0 2.0 7.0 44.0 12.0
Supportive Number 29 32 1 2 9 23 6TreatmentDental Mat. 5 28.4 31.4 1.0 2.0 8.8 22.5 5.9
Community Number 1 21 4 3 9 39 - 19Health
% 1.0 21.9 4.2 3.1 9.4 40.6 19.8

Table DC-18
Graduates' perception of CareerLearning instructors' help aspreparation for each section ofNational Board Dental Hygiene Licensing examination
116
Section ExcellentVeryGood Good Fair Poor
Oral Number 50' 30 19 2 2
Inspection
% 48.5 29.1 18.4 1.9 1.9
Radiographs Number 42 25 16 14 6
% 40.8 24.3 15.5 13.6 5.8
Diagnostic Number 16 26 34 15 0Aids
% 17.6 28.6 37.4 16.5 0.0
Prophylaxisa. Hand
Number 60 18 12 6 0
Scaling % 62.5 18.8 12.5 6.3 0.0
b. Ultra-sonics
Number 22 12 25 20 14
% 23.7 12.9 26.9 21.5 15.1
Topical Number 15 24 39 12 4Agents(fluorides) % 16.0 25.5 41.5 12.8 4.3
Oral Health Number 25 27 34 8 0InstructionNutrition % 26.6 28.7 36.2 8.5 0.0
Emergencies Number 11 12 35 25 10
% 11.8 12.9 37.6 26.9 10.8
SupportiveTreatment
Number 14 27 27 19 3
Dental Mat. S 15.6 30.0 30.0 21.! 3.3
Community Number 10 11 22 35 17Health
% 10.5 11.6 23.2 36.8 17.9
1 4 4
A

Table DC-19
Graduates' perception of teaching strategyas best preparation for each section ofNational Board Dental Hygiene Licensingexamination
117'
Section
Subjectmatterstressed
Method of
presentation Response toof material questions
Teachers'comments
Individual
assistanceTeachingaids
Oral Number 35 13 4 18 30 9Inspection
% 32.1 11.9 3.7 16.5 27.5 8.2
Radiographs Number 24 29 7 10 24 11
% 22.9 27.6 6.7 9.5 22.9 10.5
Diagnostic Number 14 26 5 9 15 13Aids
% 17.1 31.7 6.1 11.0 18.3 15.9
Prophylaxisa. Hand
Number 23 14 2 8 45 5
Scaling ft 23.7 14.4 2.1 8.2 46.4 5.2
b. Ultra-sonics
Number 7 15 6 7 39 14
% 8.0 17.0 6.8 8.0 44.3 15.9
Topical Number 19 45 8 3 21 7Agents(fluorides) % 18.4 43.7 7.8 2.9 20.4 6.8
Oral Health Number 35 42 13 13 1 3InstructionNutrition % 32.7 39.3 12.1 12.1 0.9 2.8
Emergencies Number 27 30 24 13 2 6
% 26.5 29.4 23.5 12.7 2.0 5.9
Supportive Number 23 36 16 13 2 9TreatmentDental Mat. % 23.2 36.4 16.2 13.1 2.0 9.1
Community Number 20 42 15 19 0 5Health
% 19.8 41.6 14.9 18.8 0.0 5.0
Ob.
145

118
Table DC-20
Graduates' perception of N.Y.C.C.C.curriculum as preparation for theNational Board Dental Hygiene Licensingexamination
ExcellentVeryGood Good Fair Poor Total
Number 15 28 43 13 1 100
Percent 15.0 28.0 43.0 13.0 1.0 100.0
146

Table DC-21
Graduates' perception of N.Y.C.C.C.curriculum as preparation for eachsection of National Board DentalLicensing examination
119
Section Excellent Good Adequate PoorVeryPoor
Oral Number 45 34 19 1 0Inspection
% 45.5 34.3 19.2 1.0 0.0
Radiographs Number 28 32 23 11 4
% 28.6 32.7 23.5 11.2 4.1
Diagnostic Number 15 33 44 1 0Aids
% 16.1 35.5 47.3 1.1 0.0
Prophylaxisa. Hand
Number 49 34 14 1 0
Scaling % 50.0 34.7 14.3 1.0 0.0
b. Ultra-
sonicsNumber 11 18 33 26 9
% 11.3 18.6 34.0 26.8 9.3
Topical Number 14 29 45 6 2Agents(fluorides) % 14.6 30.2 46.9 6.3 2.1
Oral Health Number 28 37 27 7 0InstructionNutrition % 28.3 37.4 27.3 7.1 0.0
Emergencies Number 8 25 41 18 4
% 8.3 26.0 42.7 18.8 4.2
Supportive Number 3 25 35 28 7TreatmentDental Mat. S 3.1 25.5 35.7 28.6 7.1
Community Number 5 20 43 20 11Health
5 5.1 20.2 43.4 20.2 11.1
OD.
117

120
Medical Laboratory Certification Section
148

121
To measure the success of graduates of the Medical Laboratory Department
of N.Y.C.C.C. on the MLT/ASCP Certification Examination (MLT/ASCP)
and to evaluate their perception of the value of various components of
N.Y.C.C.C. curriculum as preparation for MLT/ASCP, this section of the
division evaluation was prepared. Eighty-nine Medical Laboratory
department graduates responded to the questionnaire mailed to all
graduates; 16 respondents (17.9%) indicated they took the MLT/ASCP.
The data herein is representative of these respondents.

122
As indicated above, 16 Medical Laboratory department graduates reported
taking the MLT/ASCP. Of that number, 13 reported passing the examination
on the first attempt and 3 reported not passing the examination. None
of the 3 graduates reporting non-passing reported a second attempt at
passing. Scores on the MLT/ASCP were obtained for 5 graduates. They
are presented in Table MC-1. It can be seen that the mean score is
84.60, the lowest score is 60, and the highest score is 101.
Table MC-2 provides information indicating the year in which Medical
Laboratory department graduates attempted the MLT/ASCP. It can be
seen that the earliest year reported was 1969, and that the year in
which the greatest number of graduates (43.8%) attempted the examination
was 1973. Table MC-3 lists the number of respondents who attempted
other examinations. Thirty-eight Medical Laboratory department graduates
reported an attempt at one of the three examinations listed.
Tables MC-4 through MC-10 contain Medical Laboratory department grad-
uates' perception of the value of specific courses, in their curriculum
at N.Y.C.C.C., as preparation for each section of MLT/ASCP. It can
be seen in Table MC-4 that graduates perceive Clinical Lab (Hospital)
to be the most valuable course and Histology to be the least valuable
course as preparation for the Microbiology section of MLT/ASCP. Table
MC-5 indicates graduates' perception of the most valued course and least
valued course as preparation for the Serology section to be Clinical
150

123
Lab (Hospital) and Clinical Lab (Chemistry) respectively. Table MC-6
presents data showing Clinical Lab (Hospital) to be perceived as the
most valuable course as preparation for the Clinical Chemistry section
and Histology to be perceived as the least valuable course as prepara-
tion for the same section.
It is evident from Table MC-7 that Hemotology is the course perceived
most valued as preparation for the Hemotoloqy section of MLT/ASCP, and
Microbiology I is the least valued course as preparation for the same
section. The most valuable course as preparation for the Urinalysis
section is perceived to be Clinical Lab (Hospital), as shown in Table
MC-8. For the same section, Microbiology I is perceived to be the least
valuable course. Table MC-9 shows Medical Laboratory department grad-
uates' perception of the most valuable course as preparation for the
Blood Banking section is again Clinical Lab (Hospital) and the course
perceived least valuable as preparation for this section is Histology.
Table MC-10 lists the graduates' perception of the value of courses as
preparation for the Parasitology section. Clinical Lab(Hospital) is
perceived to be most valuable and Clinical Lab (Chemistry)is perceived
the least valuable.
Table MC-11 extends the same, course by course ratings to Medical
Laboratory department graduates' perception of value as preparation
for actual job conditions. It can be seen in this table that graduates
151

124
perceive Clinical Lab (Hospital) as the most valuable course, and
Histology as the least valuable course as preparation for actual health
service employment. It is apparent that certain courses are perceived
most valuable and least valuable as preparation for both actual employ-
ment conditions and MLT/ASCP sections. Clinical Lab (Hospital) was
perceived to be the most valuable course for six of the seven sections
of MLT/ASCP, and also for acual employment conditions. Histology was
perceived to be the least valuable course for three of the seven sections
of MLT/ASCP and also for actual employment conditions.
Table MC-12 provides course grades of graduates of the Medical Laboratory
department for selected Career Learning courses. It should be noted
that except for the three mathematics courses taken by less than 50%
of graduates, slightly more than 50% of the responding graduates took
any of the courses. It can be seen that the mean grade varies from a
high of 3.130 (Microbiology II) to a low of 2.037 (Math Analysis 2)
a difference that is statistically significant to a probability level
of .0001.
Graduates' perception of the course component that was the best pre-
paration for each section of the MLT/ASCP is provided in Table MC-13.
It can be seen that the highest percentage of Medical Laboratory
department graduates perceived Lectures to be the best preparation for
the Microbiology section of the MLT/ASCP; Reading Material to be the
152

best preparation for the Serology section; Laboratories to be the best
preparation for the Clinical Chemistry and Urinalysis sections;
Lectures to be the best preparation for the Hemotology section; Reading
Material to be the best preparation for the Blood Banking and Parasi-
tology sections.
Tables MC-14 and MC-15 present Medical Laboratory graduates' perception
of their Career Learning instructors and their teaching strategies as
help in preparing for the various sections of the MLT/ASCP. It can be
determined from Table MC-14 that the majority of graduates perceived
their instructors to be excellent, very good, or good as help in
preparing for all sections of the examination, but considerable varia-
tion existed between the various sections. Instructors' help. was most
highly rated for the Microbiology section, lowest rating for the
Parasitology section. Table MC-15 shows the graduates' perceptions of
teaching strategies most helpful as preparation for the MLT/ASCP
sections. It can be seen that for Clinical Chemistry and Hemotology,
subject matter stressed by the instructor was considered most helpful;
for Microbiology, Serology and Urinanalysis,method of presentation of
material was perceived most helpful; for Blood Banking and Parasitology
the data is inconclusive.
Tables MC-16 and MC-17 supply Medical Laboratory department graduates'
perceptions of their N.Y.C.C.C. curriculum as preparation for the
153
125

126
MLT/ASCP and for each section of MLT/ASCP. It can be seen in Table
MC-16 that 70% of all the graduates perceive their training at N.Y.C.C.C.
to be good, very good, or excellent preparation for MLT/ASCP and 10%
perceive the training to be poor preparation for the examination. A
section by section examination as shown in Table MC-17 indicates that
although a majority of graduates consider the N.Y.C.C.C. curriculum
to be good or excellent preparation for the Microbiology, Clinical
Chemistry, and Hemotology sections, a majority also consider the
N.Y.C.C.C. curriculum to be poor or very poor as preparation for the
Serology, Blood Banking, and Parasitology sections.
To determine whether one or more course grades were predictive of
success on the MLT/ASCP, correlations between graduates' scores on
the MLT/ASCP and their course grades were computed. The following
subject correlated at a significant level (P 7 .001) with the MLT/ASCP:
Microbiology I.
A high grade in Microbiology I was predictive of success in the MLT/ASCP
for responding graduates of the Medical Laboratory department. It is
suggested that the relatively small number of respondents who indicated
they attempted the MLT/ASCP be considered before any firm conclusions
be drawn from these results.
154

127
Table MC-1
Graduates' scores on MLT/ASCPCertification Examination
60 80 85 97 101 Total
1 1 1 1 1 5
Mean Score 84.60
Standard Deviation 16.19
Median Score 86.75
155

Table MC-2
MLT/ASCP CertificationExamination year
128
1969 1970 1971 1972 1973 1974 1975 Total
Number 1 0 2 1 7 3 2 16
% ofrespondents
6.3 0.0 12.5 6.3 43.8 18.8 12.5 100.0
156

129
Table MC-3
Graduates' report of otherexaminations attempted
Examination Number Percentage
Medical Tech/ASCP
N.Y.C. Dept. of Health/Medical Technologist
15 16.9
17 19.1
N.Y.C. Dept. of Health/ 6 6.7Medical Technician
None 51 57.3
157

Table MC-4
Graduates' perception of the value ofspecific courses as preparation forthe Microbiology section of the MLT/ASCPCertification Examination
130
Courses Very Very Does notUseful Useful Useless Useless apply Rating
Clinical Lab Number 7 7 2 1 5 5Science I(Hemotology) % of
dept.31.8 31.8 9.1 4.5 22.7
Microbiology I Number 15 5 0 2 0 3
% ofdept.
68.2 22.7 0.0 9.1 0.0
Clinical Lab Number 8 6 3 0 5 4Science II(Cl. Chem.) % of
dept.36.4 27.3 13.6 0.0 22.7
Histology Number 6 3 6 0 5 6
% ofdept.
30.0 15.0 30.0 0.0 25.0
Microbiology II Number 18 3 0 0 1 2
% of 81.8 13.6 0.0 0.0 4.5dept. _
Clinical Lab Number 16 5 0 0 0 1Practice(Hospital) % of
dept.
76.2 23.8 0.0 0.0 0.0
158

131Table MC-5
Graduates' perception of the value ofspecific courses as preparation forthe Serology section of the MLT/ASCPCertification Examination
Courses Very Very Does notUseful Useful Useless Useless apply Rating
Clinical Lab Number 9 6 3 0 1 2Science I(Hemotology) % of
dept.47.4 31.6 15.8 0.0 5.3
Microbiology I Number 5 8 3 1 2 4
% ofdept.
26.3 42.1 15.8 5.3 10.5
Clinical Lab Number 5 4 2 0 7 6Science II(Cl. Chem.) % of
dept.
27.8 22.2 11.1 0.0 38.9
Histology Number 3 2 7 0 7 5
% ofdept.
15.8 10.5 36.8 0.0 36.8
Microbiology II Number 6 10 1 0 2 3
% ofdept.
31.6 52.6 5.3 0.0 10.5
Clinical Lab Number 12 3 2 0 1 1
Practice(Hospital) % of
dept.
66.7 16.7 11.1 0.0 5.6
159
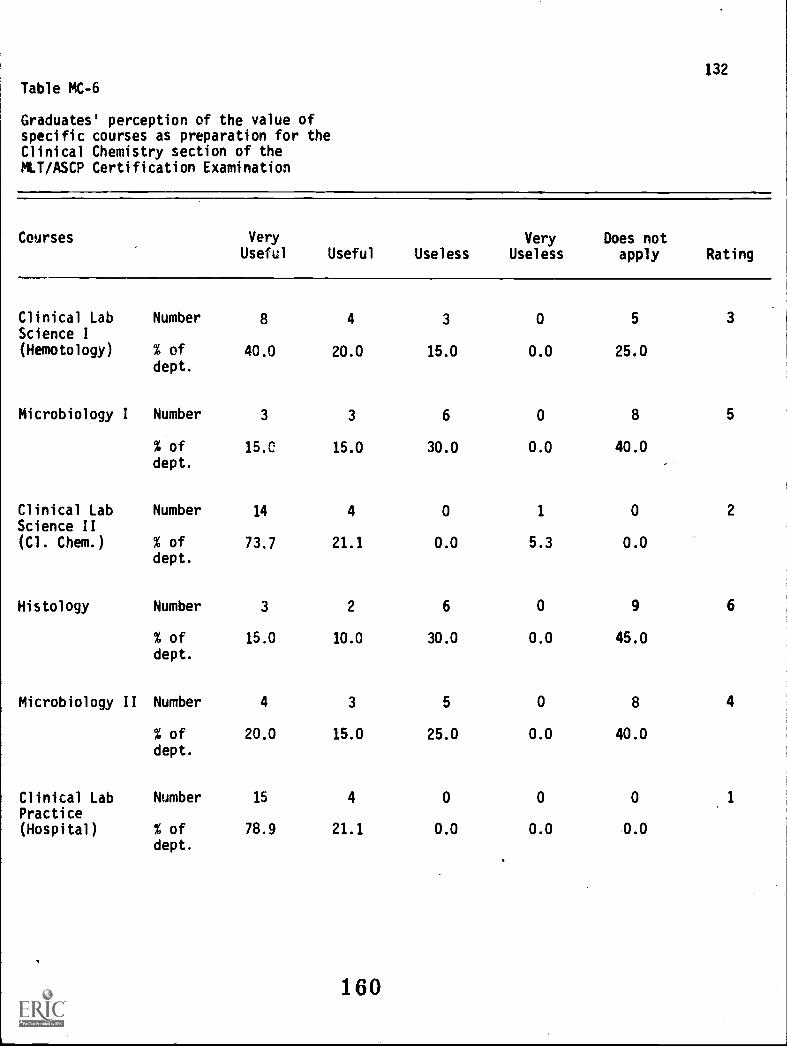
Table MC-6
Graduates' perception of the value ofspecific courses as preparation for theClinical Chemistry section of theMLT/ASCP Certification Examination
132
Courses Very Very Does notUseful Useful Useless Useless apply Rating
Clinical Lab Number 8 4 3 0 5 3
Science I(Hemotology) % of
dept.40.0 20.0 15.0 0.0 25.0
Microbiology I Number 3 3 6 0 8 5
% ofdept.
15.0 15.0 30.0 0.0 40.0
Clinical Lab Number 14 4 0 1 0 2
Science II(Cl. Chem.) % of
dept.73.7 21.1 0.0 5.3 0.0
Histology Number 3 2 6 0 9 6
% ofdept.
15.0 10.0 30.0 0.0 45.0
Microbiology II Number 4 3 5 0 8 4
% ofdept.
20.0 15.0 25.0 0.0 40.0
Clinical Lab Number 15 4 0 0 0Practice(Hospital) % of
dept.
78.9 21.1 0.0 0.0 0.0
160

133Table MC-7
Graduates' perception of the value ofspecific courses as preparation for theHemotology section of the MLT/ASCPCertification Examination
Courses VeryUseful Useful Useless
VeryUseless
Does notapply Rating
Clinical Lab Number 16 4 1 0 0 1Science I
(Hemotology) % ofdept.
76.2 19.0 4.8 0.0 0.0
Microbiology I Number 5 3 2 0 7 6
% ofdept.
23.8 14.3 28.6 0.0 33.3
Clinical Lab Number 8 .3 3 0 6 3Science II(Cl. Chem.) % of
dept.
40.0 15.0 15.0 0.0 30.0
Histology Number 7 4 4 0 6 4
% ofdept.
33.3 19.0 19.0 0.0 28.6
Microbiology II Number 5 4 5 0 7 5
% ofdept.
23.8 19.0 23.8 0.0 33.3
Clinical Lab Number 14 4 0 0 1 2Practice(Hospital) % of
dept.
73.7 21.1 0.0 0.0 5.3
161

Table MC-8
Graduates' perception of the value ofspecific courses as preparation for theUrinalysis section of the MLT/ASCP
Certification Examination
134
Courses Very Very Does notUseful Useful Useless Useless apply Rating
Clinical Lab. Number 11 6 2 1 1 2Science I(Hemotology) % of 52.4 28.6 9.5 4.8 4.8
dept.1
Microbiology I Number 4 5 3 1 6
% of 21.1 26.3 15.8 5.3 31.6dept.
Clinical Lab Number 6 7 1 0 5 3Science II(Cl. Chem.) % of 31.6 36.8 5.3 0.0 26.3
dept.
Histology Number 4 4 6 0 5 5
% of 21.1 21.1 31.6 0.0 26.3
dept.
Microbiology II Number 4 6 4 0 5 4
% of 21.1 31.6 21.1 0.0 26.3
dept.
Clinical Lab Number 14 3 1 0 1 1
Practice(Hospital) % of 73.7 15.8 5.3 0.0 5.3
dept.
162

135
Table MC-9
Graduates' perception of the value ofspecific courses as preparation for theBlood Banking section of the MLT/ASCPCertification Examination
Courses VeryUseful Useful Useless
VeryUseless
Does notapply Rating
Clinical Lab Number 8 8 2 1 0 2
Science I(Hemotology) % of
dept.
42.1 42.1 10.5 5.3 0.0
Microbiology I Number 2 3 4 0 9 4.5
% ofdept.
11.1 16.7 22.2 0.0 50.0
Clinical Lab Number 4 3 3 0 8 3
Science II(Cl. Chem.) % of
dept.
22.2 16.7 16.7 0.0 44.4
Histology Number 2 1 6 0 9 6
% ofdept.
11.1 5.6 33.3 0.0 50.0
Microbiology II Number 2 3 4 0 9 4.5
% ofdept.
11.1 16.7 22.2 0.0 50.0
Clinical Lab Number 14 3 0 0 1 1
Practice(Hospital) % of
dept.
77.8 16.7 0.0 0.0 5.6
163

136
Table MC-10
Graduates' perception of the value ofspecific courses as preparation for theParasitology section of the MLT/ASCPCertification Examination
Courses VeryUseful Useful Useless
VeryUseless
Does notapply Rating
Clinical Lab Number 5 3 0 7 4Science I(Hemotology) % of
dept.
16.7 27.8 16.7 0.0 38.9
Microbiology I Number 5 4 5 0 4 3
% ofdept.
27.8 22.2 27.8 0.0 22.2
Clinical Lab Number 3 2 4 0 9 6Science II(Cl. Chem.) % of
dept.
16.7 11.1 22.2 0.0 50.0
Histology Number 2 5 3 0 7 5
% ofdept.
11.8 29.4 17.6 0.0 41.2
Microbiology II Number 6 5 4 0 3 2
% ofdept.
33.3 27.8 22.2 0.0 16.7
Clinical Lab Number 11 3 1 0 2 1Practice(Hospital) % of
dept.
64.7 17.6 5.9 0.0 11.8
164

Table MC-11
Graduates' perception of the value ofspecific courses as preparation foractual employment conditions
137
Courses Very Very Does notUseful Useful Useless Useless apply Rating
Clinical Lab Number 20 13 2 0 1 3Science I(Hemotology) % of
dept.
55.6 36.1 5.6 0.0 2.5
Microbiology I Number 15 19 2 1 0
% ofdept.
40.5 51.4 5.4 2.7 0.0
Clinical Lab Number 20 12 2 0 2 4Science II(Cl. Chem.) % of
dept.
55.6 33.3 :).6 0.0 5.6
Histology Number 8 16 10 0 1 6
% ofdept.
22.9 45.7 28.6 0.0 2.9
Microbiology II Number 18 16 0 0 1 2
% of
dept.
51.4 45.7 0.0 0.0 2.9
Clinical Lab Number 26 6 1 0 1 1Practice(Hospital) % of
dept.
76.5 17.6 2.9 0.0 2.9

138
Table MC-12
Graduates' grades for selectedCareer. Learning courses
Course A B C D OtherMean Grade
Standard Deviation
Biology Number 13 17 19 1 39 2.840
Percent 14.6 19.1 21.3 1.1 43.8 0.842
General Number 8 14 27 2 38 2.549ChemistryI Percent 9.0 15.7 30.3 2.2 42.7 0.808
General Number 6 12 16 14 41 2.208Chemistry2 Percent 6.7 13.5 18.0 15.7 46.1 1.010
Anatomy and Number 5 3 9 0 72 2.611Plysiology
Percent 5.6 3.4 10.1 0.0 80.9 1.092
Microbic-logy 1
Number 13 18 19 1 38 2.843
Percent 14.6 20.2 21.3 1.1 42.7 0.834
Microbic-logy 2
Number 17 20 7 2 43 3.130
Percent 19.1 22.5 7.9 2.2 48.3 0.833
Histology Number 9 28 11 2 39 2.880
Percent 10.1 31.5 12.4 2.2 43.8 0.746
Clinical Number 13 15 17 3 41 2.792LabScience 1 Percent 14.6 16.9 19.1 3.4 46.1 0.922
Clinical Number 8 14 24 0 43 2.652LabScience 2 Percent 9.0 15.7 27.0 0.0 48.3 0.766
tBased on: A=4, B=3, C=2, D=1 166(continued next page)

(table MC-12 continued) 139
Course A B C D OtherMean Grade
Standard Deviatio
Physiology Number 4 9 14 2 60 2.517
Percent 4.5 10.1 15.7 2.2 67.4 0.829
Fundamentals Numberof Math
5 3 3 1 77 3.000
Percent 5.6 3.4 3.4 1.1 86.5 1.044
Math Number 10 9 14 10 46 2.442Analysis 1
Percent 11.2 10.1 15.7 11.2 51.7 1.098
Math . Number 3 6 8 9 63 2.037Analysis 2
Percent 3.4 6.7 9.0 10.1 70.8 1.091
English Number 12 15 17 1 44 2.844Composition
Percent 13.5 16.9 19.1 1.1 49.4 0.852
*Based on: A=4, B=3, C=2, D=1
167

140
Table MC-13
Graduates' perception of coursecomponent as best preparation for eachsection of MLT/ASCP CertificationExamination
Section LabsReadingMaterial
WrittenAssignments Exams
ReviewSeminars Lectures Discussions
Microbiology Number 5 3 2 3 0 6 1
% ofdept.
25.0 15.0 10.0 15.0 0.0 30.0 5.0
Serology Number 0 6 3 1 2 2 0
% ofdept.
0.0 42.9 21.4 7.1 14.3 14.3 0.0
Clinical Number 6 3 1 1 1 4 2Chemistry
% ofdept.
33.3 16.7 5.6 5.6 5.6 22.2 11.1
Hemotology Number 4 3 2 2 1 6 0
% ofdept.
22.2 16.7 11.1 11.1 5.6 33.3 0.0
Urinalysis Number 6 4 1 2 1 2 2
% ofdept.
33.3 22.2 5.6 11.1 5.6 11.1 11.1
Blood Banking Number 3 9 0 1 1 1 0
% ofdept.
20.0 60.0 0.0 6.7 6.7 6.7 0.0
Parasitology Number 1 9 0 1 2 2 0
% of
dept.6.7 60.0 0.0 6.7 13.3 13.3 0.0
168
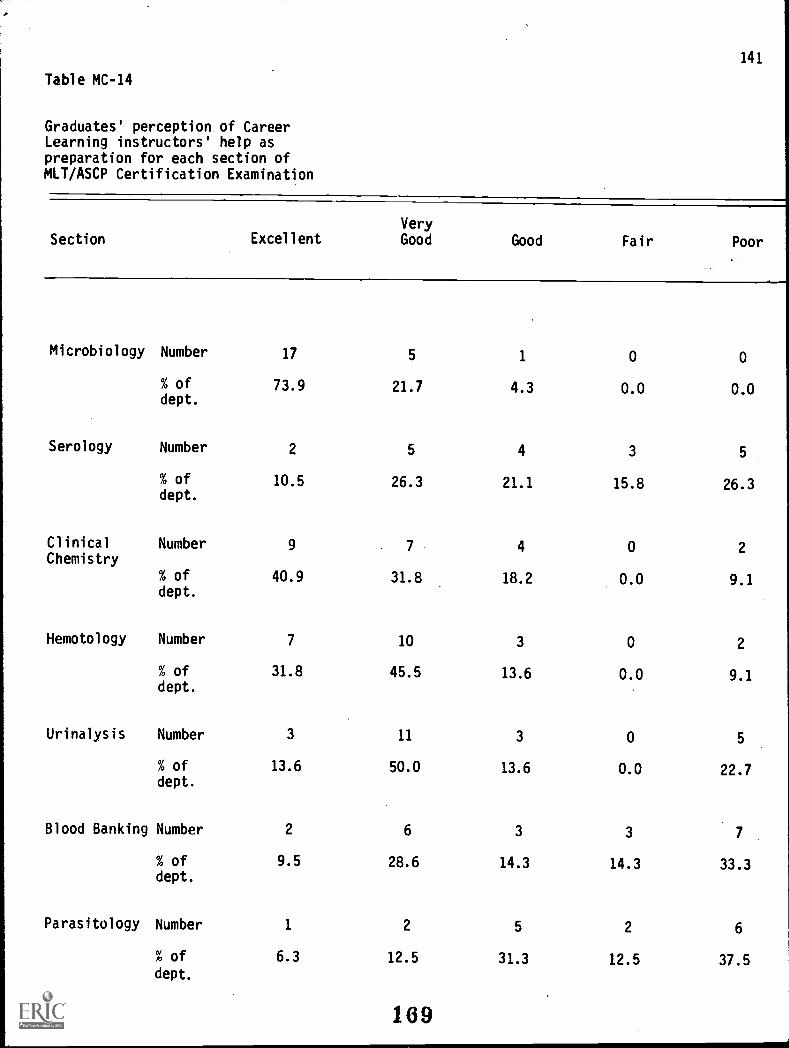
141
Table MC-14
Graduates' perception of CareerLearning instructors' help aspreparation for each section ofMLT/ASCP Certification Examination
VerySection Excellent Good Good Fair Poor
Microbiology Number 17 5 1 0 0
% ofdept.
73.9 21.7 4.3 0.0 0.0
Serology Number 2 5 4 3 5
% ofdept.
10.5 26.3 21.1 15.8 26.3
Clinical Number 9. 7 4 0 2
Chemistry% ofdept.
40.9 31.8 18.2 0.0 9.1
Hemotology Number 7 10 3 0 2
% ofdept.
31.8 45.5 13.6 0.0 9.1
Urinalysis Number 3 11 3 0 5
% ofdept.
13.6 50.0 13.6 0.0 22.7
Blood Banking Number 2 6 3 3 7
% ofdept.
9.5 28.6 14.3 14.3 33.3
Parasitology Number 1 2 5 2 6
% of
dept.
6.3 12.5 31.3 12.5 37.5
169

Table MC-15
Graduates' perception of teachingstrategy as best preparation for eachsection of MLT/ASCP CertificationExamination
142
Section
to v) o -o .07o n-1 cl, 6-, a-1eq. C -t "1 C3a
W ..11* m, CT M M 4/1 111 W CI. asDiM Ca. W 1:1 n I J. "zVt M a 2 rt 0 tD S W <in 0 et 7 -I.= 7 tD et ..mCD et CD et 0 0 et '1 Di 13. 7CI. "S CU 7 M V) V) 7 C 40a -.. et 0 - n aa 13, -i. et m WWI
et =ME 0 0etM-%
Microbiology Number
% ofdept.
6
33.3
Serology Number 1
% of 10.0dept.
Clinical Number 6
Chemistry% of 35.3
dept.
Hemotology Number 7
% of 46.7
dept.
Urinalysis. Number
% ofdept.
1
7.7
Blood Banking Number 3
% of 30.0
dept.
Parasitology Number
% of
dept.
2
20.0
=
9 0 1 0 2
50.0 0.0 5.6 0.0 11.1
4 1 0 2 2
40.0 10.0 0.0 20.0 20.0
3 2 3 2 1
17.6 11.8 17.6 11.8 5.9
3 2 2 1 0
20.0 13.3 13.3 6.7 0.0
5 2 1 1 0
38.5 15.4 7.7 7.7 0.0
2 1 0 1 3
20.0 10.0 0.0 10.0 30.0
0 2 0 3 3
0.0 20.0 0.0 30.0 30.0
170

143
Table MC-16
Graduates' perception of N.Y.C.C.C.curriculum as preparation for theMLT/ASCP Certification Examination
ExcellentVeryGood Good Fair Poor Total
Number 2 6 6 4 2 20
Percent 10.0 30.0 30.0 20.0 10.0 100.0
171

144
Table MC-17
Graduates' perception of N.Y.C.C.C.curriculum as preparation for each sectionof MLT/ASCP Certification Examination
SectionExcellent
Microbiology Number 10
% of 47.6dept.
Serology Number 3
% of 18.8
dept.
Clinical Number 4Chemistry
% of 20.0
dept.
Hemotology Number 7
% of 38.9
dept.
Urinalysis Number 4
% of 22.2
dept.
Blood Banking Number 1
% of 5.9
dept.
Parasitology Number 0
% of 0.0 20.0 26.7 26.7 26.7dept.
Good Adequate PoorVeryPoor
6 3 1 1
28.6 14.3 4.8 4.8
1 2 8 2
6.3 12.5 50.0 12.5
8 5 3 0
40.0 25.0 15.0 0.0
6 3 2 0
33.3 16.7 11.1 0.0
2 6 5 1
11.1 33.3 27.8 5.6
1 6 3 6
5.9 35.3 17.6 35.3
3 4 4 4
172

145
Nursing Licensure Section
173

146
One of the significant milestones in a nursing career is the New York
State Board Licensure Examination (NYSBLE). This examination consists
of 5 sections:
Medical
Surgical
Obstetrics
Pediatrics
Psychiatry.
To practice nursing as a professional in New York State an applicant
must receive a passing score on the examination.
To evaluate the success of N.Y.C.C.C. graduates on the NYSBLE and
their perception of the value of components of their N.Y.C.C.C.
curriculum as preparation for the NYSBLE, this section of the
division evaluation was prepared. Two hundred seventy-one Nursing
department graduates responded to the questionnaire mailed to all
graduates; 255 respondents (94.1%) indicated they attempted the NYSBLE.
,r her herein is representative of these respondents.
174

147
',able NC-1 provides data describing the actual scores obtained by gradu-
ates of N.Y.C.C.C. on the NYSBLE, and Table NC-2 provides selected
statistics based on the actual scores in order to properly analyze the
data presented. It can be seen in Table NC-2 that the variation in
mean score obtained for each section and for each repeat section was
relatively small: approximately 5.6% for all sections and approximately
14% for all repeat sections. Graduates, therefore, are not scoring
widely differently on the various sections of the NYSBLE, although the
differences between the lowest mean (Surgical section) and the other
four means are all significant at the .01 level.
Much more apparent, however, is the wide range of individual scores
obtained in the various sections. From Table NC-1 it can be seen that
there were 20 scores below 300 on the Pediatrics section. From Table NC-2
it can be seen that the lowest score on the Pediatrics section was 24
and the highest score 698. The range is unusually high, particularly
for a certification examination.
It can also be noted in Table NC-2 that the greatest range of scores
(690) was for the Surgical section;' the lowest range of scores (520)
was for the Obstetrics section. This would indicate that there is
considerably less difference in level of preparation in Obstetrics
among the graduates of the Nursing Department than there is in the
level of preparation for other sections.
175

148
It will be noted in Tables NC-1 and NC-2 that mean scores for the five
repeat sections of NYSBLE all tend to be significantly lower than the
first attempt scores. It should also be noted, however, that the minimum
scores for each repeat section are considerably higher (except in the
Obstetrics section) than the first attempt minimum scares. Although
the mean of the Psychiatry section is not the highest mean of the repeat
section means, the highest maximum score and median were both on the
Psychiatry section.
Tables NC-3 and NC-4 provide data showing the number of attempts neces-
sary to pass NYSBLE and the years in which graduates took the examinations.
It can be seen in Table NC-3 that 43.1% of Nursing Departments required
two or more attempts to pass NYSBLE, and 2.7% have not passed at the
time of responding. It is evident from Table NC-4 that the largest
number of respondents attempted NYSBLE the first time in 1973; the same
year the largest number of respondents made their second attempt to pass.
Tables NC-5 through NC-9 contain Nursing Department graduates' perception
of the value of specific courses,in their curriculum at N.Y.C.C.C., as
preparation for each section of NYSBLE. It is evident from Table NC-5
that the graduates perceive Anatomy and Physiology I to be the most
valuable course and Maternal Health the second most valuable course as
preparation for the Medical section of NYSBLE. It is also apparent that
Psychology of Adolescence and Anatomy and Physiology II were perceived
to be the least valuable course and second least valuable course,
176

149
respectively, as preparation for the Medical section of NYSBLE.
Data in Table NC-6 snow graduates to perceive Anatomy and Physiology I
and Psychiatric Nursing to be the most valuable course and second most
valuable course, respectively, as preparation for the Surgical section
of NYSBLE. Psychology of Adolescence and Maternal Health were perceived
to be the least valuable course and second least valuable course,
respectively, as preparation for the Surgical section. Table NC-7
referencing the Obstetrics section of NYSBLE shows graduates' perception
of the most valuable course and second most valuable course as prepara-
tion was Maternal Health and Anatomy and Physiology I respectively.
The least valuable course and second least valuable course as prepara-
tion for the same section was Psychology of Adolescence and Child
Psychology, respectively.
The relative value of courses as preparation for the Pediatrics section
of NYSBLE is provided in Table NC-8. Child Psychology and Anatomy and
Physiology I were perceived to be the most valuable course and second
most valuable course respectively, and Anatomy and Physiology II and
Microbiology were perceived to be the least valuable course and second
least valuable course, respectively, as preparation for this section.
Table NC-9 indicates that Nursing Department graduates perceived Psychi-
atric Nursing and Child Psychology to be the most valuable course and
second most valuable course, respectively, as preparation for the
Psychiatry section of NYSBLE. The graduates also perceived Microbiology
177

150
and Anatomy and Physiology II to be the least valuable course and second
least valuable course, respectively, as preparation for the same section.
Table NC-10 extends the same course by course ratings to Nursing Depart-
ment graduates' perception of value as preparation for actual job
conditions. It can be seen in this table that graduates perceived
Psychiatric Nursing and Introduction to Psychology as the most valuable
course and second most valuable course, respectively, and Anatomy and
Physiology II and Microbiology as the least valuable course and second
least valuable course respectively, as preparation for their actual
health service employment. It should be noted that Anatomy and Physio-
logy II is rather consistently perceived as one of the least most
valuable courses as preparation for the various sections of NYSBLE
and actual employment.
Table NC-11 provides course grades of graduates of the Nursing Depart-
ment for selected Career Learning courses. It can be seen that the
mean grade varies from 2.506 (Anatomy and Physiology) to 2.944 (Develop-
mental Psychology), a difference that is statistically significant to
a level of .0001. There is undoubtedly a relationship between the
significantly lower mean grade received for Anatomy and Physiology and
the consistency of low ratings for value given Anatomy and Physiology II
by graduates. It should also be noted that although one of the strongest,
most often repeated criticisms expressed by faculty (see Faculty Analysis
Section, page 7) was the inability nc students to read and/or communicate,
178

151
the mean score for English Composition was one of the highest listed.
Graduates' perception of the course component that was the best prepara-
tion for each section of NYSBLE is provided in Table NC-12. It can be
seen that the highest percentege of Nursing Department graduates
perceive reading material to be the best preparation for the Medical
section of NYSBLE; lectures to be the best preparation for the Surgical
section, the Obstetrics section, and the Pediatrics section; discussions
to be the best preparation for the Psychiatry section.
Tables NC-13 and NC-14 present Nursing Department graduates' perception
of their Career Learning instructors and teaching strategies as prepara-
tion for the various sections of NYSBLE. It can be determined from
Table NC-13 that the majority of graduates perceived their instructors'
efforts to be excellent or very good as help in preparing for all sections
of NYSBLE. Instructors' help was rated highest for the Medical section,
lowest for the Pediatrics section. Table NC-14 shows the graduates'
perceptions of teaching strategies most helpful as preparation for
NYSBLE. It can be seen that for every section, subject matter stressed
by the instructor was considered most helpful as preparation for the
section, and the method of presentation of material the second most
helpful strategy. Teaching aids were perceived to be least helpful
as preparation for the various sections of NYSBLE.
Tables NC-15 and NC-16 provide Nursing Department graduates' perceptions
of their N.Y.C.C.C. curriculum as preparation for NYSBLE and for each
179

152
section of NYSBLE. It can be seen in Table NC-15 that 80.4% of gradu-
ates perceive their training at N.Y.C.C.C. to be good, very good, or
excellent preparation for NYSBLE and only 5.8% perceive their training
to be poor preparation for the examination. When analyzed by NYSBLE
section, several interesting observations can be made. Although the
smallest percentage of graduates (15.9%) perceive their N.Y.C.C.C.
curriculum to be excellent preparation for the Medical :Action of' NYSBLE,
the smallest percentage (6.9%) also perceive it to be poor or very poor
preparation for the same section. The largest percentage of graduates
(30.8%) perceive their N.Y.C.C.C. curriculum to be excellent preparation
for the Psychiatry section of NYSBLE, but the largest percentage (13.5%)
also perceive it to be poor or very poor preparation for the same
section. This apparent anomaly is undoubtedly related to the variation
in range of scores received in the sections of NYSBLE, as shown in
Table NC-2. It will be recalled that the greatest range, as well as
the highest mean score, was in the Psychiatry section. Overall analysis
of Table NC-16 indicates that although there is a slight deviation in
perceived quality of the N.Y.C.C.C. curriculum from that shown in
Table NC-15, the mean perception of N.Y.C.C.C. curriculum is adequate
to good with approximately 90% of Nursing Department graduates perceiving
their curriculum as adequate, good, or excellent preparation for NYSBLE.
To determine whether one or more course grades were predictive of success
on the various sections of NYSBLE, correlations between graduates'
scores on each section of NYSBLE and their course grades were computed.
180

153
The following subjects, listed in decreasing order of significance,
correlated at a significant level (P :....001) with all sections of
NYSBLE:
P and M Illness I
Childhood Health
Maternal Health
Microbiology
Fundamentals of Nursing
Anatomy and Physiology
P and M Illness II
Principles of Chemistry and Biology.
A high grade in P and M Illness I was most predictive of a high grade
in all sections of NYSBLE, for the responding Nursing department gradu-
ates, than any other single factor analyzed in this study. It is
suggested that the structure, content, and evaluation techniques of this
course be thoroughly examined and used as a model for those courses not
Providing content or evaluation consistent with needs and requirements
of students.
181

154
Table NC-1
Graduates' scores on sections of theU.Y.S. Board licensure Examination
SectionLa f-C:) 11:004/t
4/1
CP?
(A)Co0I
C.4CAo
C.4U'i.'
CO)
41.0i6I4
CA0
41.($1*...1I0100
010i6I
cryCA0
01(71i6I0100
Ot09666
I01U10
0101P-6I
...400
....10P-6I
....1CTI0
-I046+al
Medical Number 26 19 31 29 28 27 12 9 8 1 190
Percent 13.7 10.0 16.3 15.3 14.7 14.2 6.3 4.7 4.2 0.5 100.0
Surgical Number 31 24 30 38 26 13 16 5 4 3 190
Percent 16.3 12.6 15.8 20.0 13.7 6.8 8.4 2.6 2.1 1.6 100.0
Obstetrics Number 23 27 35 26 27 20 18 6 6 0 188
Percent 12.2 14.4 18.6 13.8 14.4 10.6 9.6 3.2 3.2 0.0 100.0
Pediatrics Number 20 27 28 26 31 19 15 9 6 0 181
Percent 11.0 14.9 15.5 14.4 17.1 10.5 8.3 4.9 3.3 0.0 100.0
Psychiatry Number 23 16 37 21 30 23 14 10 3 3 180
Percent 12.8 8.9 20.6 11.7 16.6 12.8 7.8 5.6 1.7 1.7 100.0
Medical Number 6 5 2 3 0 0 0 0 0 0 16Repeat
Percent 37.5 31.3 12.5 18.8 0.0 0.0 0.0 0.0 0.0 0.0 100.0
Surgical Number 8 8 6 4 0 0 0 0 0 0 26Repeat
Percent 30.8 30.8 23.1 15.4 0.0 0.0 0.0 0.0 0.0 0.0 100.0
Obstetrics Number 5 4 4 4 0 0 0 0 0 0 17Repeat
Percent 29.4 23.5 23.5 23.5 0.0 0.0 0.0 0.0 0.0 0.0 100.0
Pediatrics Number 6 4 6 5 2 0 0 0 0 0 23Repeat
Percent 26.1 17.4 26.1 21.7 8.7 0.0 0.0 0.0 0.0 0.0 100.0
Psychology Number 7 2 6 2 1 1 0 0 0 0 19Repeat
Percent 36.8 10.5 31.6 10.5 5.3 5.3 0.0 0.0 0.0 0.0 100.0
182

155
Table NC-2
Selected statistics for each section ofthe New York State Board Licensure Examination
SectionMean
StandardDeviation
MinimumScore
MaximumScore Median
Medical 430.624 123.914 91 709 436.63
Surgical 408.526 130.588 33 723 408.50
ObstPtrics 428.377 111.531 171 691 423.00
Pediatrics 430.569 116.123 24 698 433.75
Psychiatry 436.366 120.770 73 750 442.50
MedicalRepeat 304.438 97.694 121 443 321.50
SurgicalRepeatRepeat 326.154 79.818 141 441. 343.00
ObstetricsRepeat 325.588 93.943 102 445 342.00
PediatricsRepeat 349.522 77.707 221 493 355.00
PsychiatryRepeat 328.947 103.260 112 521 367.00
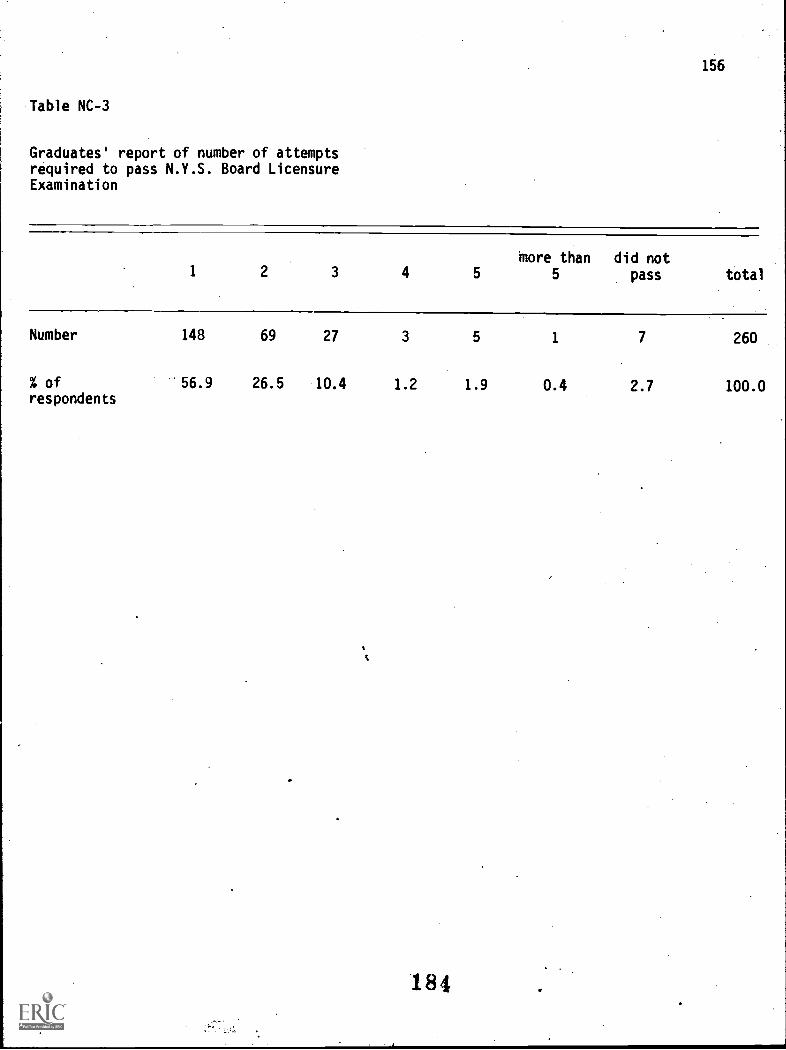
156
Table NC-3
Graduates' report of number of attemptsrequired to pass N.Y.S. Board LicensureExamination
more than did not1 2 3 4 5 5 pass total
Number 148 69 27 3 5 1 7 260
% ofrespondents
56.9 26.5 10.4 1.2 1.9 0.4 2.7 100.0
184

157.
Table NC-4
N.Y.S. Board Licensure Examinationyear by attempt
Year
1st
attempt2nd
attempt3rd
attempt4th
attempt
1968
1969
1970
1971
1972
1973
1974
1975
10
24
32
43
50
63
36
1
2
4
3
9
5
4
1
1
2
'"4.
2 2
185

Table NC-5
Graduates' perception of the value of
specific courses as preparation for theMedical section of the N.Y.S. BoardLicensure Examination
158
CoursesVery Very Does not Rating
Useful Useful Useless Useless Apply._ .... .............
Fundamentals Number. of Nursing
% of dept.
Microbiology Number
% of dept.
Intro. to NumberPsychology
% of dept.
Maternal NumberHealth
% of dept.
Psychiatric NumberNursing
% of dept.
Anatomy and NumberPhysiology I
% of dept.
Chid NumberPsychology
% of dept.
Adult and Child NumberNursing I
% of dept.
Adult and Child NumberNursing II
% of dept.
Anatomy and NumberPhysiology II
% of dept.
Psychology of NumberAdolescence
% of dept.
Adult and Child NumberNursing III
% of dept.
Adult and Child NumberNur-sing IV
% of *It.
124 107 9 1 11 3
49.2 42.5. 3.6 0.4 4.4
66 148 27 4- 2 9
26.6 59.7 10.9 1.6 0.8.
105 105 27 3 5 6
42.9 42.9 11.0 1.2 2.0
100 99 17 1 25 11
41.3 40.9 7.0 0.4 10.3
139 92 12 1 3 2
56.3 37.2 4.9 0.4 1.2
142 101 6 0 4 1
56.1 39.9 2.4 0.0 1.6
87 117 20 2 15 10
36.1 48.5 8.3 0.8 6.2
112 111 3 0 14 4
46.7 46.3 1.3 0.0 5.8
110 106 2 0 15 5
47.2 45.5 0.9 0.0 6.4
102 90 4 0 35 12
44.2 39.0 1.7 0.0 15.2
78 96 15 1 38 13
34.2 42.1 6.6 0.4 16.7
107 104 1 0 19 7
39.5 38.4 0.4 0.0 8.2
107 103 2 0 20 8
39.5 38.0 0.7 0.0 7.4 1.86

Table NC-6
Graduates' perception of the value of specificcourses as preparation for the Surgical sectionof the N.Y.S. Board Licensure Examination
159
CoursesVery
Useful Useful UselessVeryUseless
Does notApply
Rating
Fundamentals Numberof Nursing
% of dept.
117
47.8
108
44.1
10
4.1
1
0.4
9
3.7
3
Microbiology Number 91 120 23 4 7
% of dept. 37.0 48.8 9.3 1.6 2.8
Intro. to Number 80 121 25 4 12 9Psychology
% of dept. 33.1 50.0 10.3 1.7 5.0
Maternal Number 58 119 26 1 33 12Health
% of dept. 24.5 50.2 11.0 0.4 13.9
Psychiatric Number 123 97 16 1 7
Nursing
% of dept. 50.4 39.8 6.6 0.4 2.9
Anatomy and Number 150 95 2 2 2 1
Physiology I% of dept. 59.8 37.8 0.8 0.8 0.8
(Child Number 65 122 26 3 22 11Psychology
% of dept. 27.3 51.3 10:8 1.3 9.2
Adult and Child Number 102 118 5 0 13 4Nursing I
% of dept. 42.9 49.6 2.1 0.0 5.5
Adult and Child Number 96 117 3 1 15 7
Nursing II% of dept. 41.0 50.0 1.3 0.4 6.4
Anatomy and Number 114 76 0 0 36 10Physiology II
% of dept. 50.4 33.6 0.0 0.0 15.9
Psychology of Number 64 96 21 0 45 13Adolescence
% of dept. 28.3 42.5 9.3 0.0 19.9
Adult and Child Number 102 105 3 0 19 5Nursing III
% of dept. 44.5 45.9 1.3 0.0 8.3
Adult and Child Number 101 103 4 0 19 6Nursing IV
% of dept. 44.5 45.4 1.8 0.0 8.4
187

Table NC-7
Graduates' perception of the value of specificcourses as preparation for the Obstetrics sectionof the N.Y.S. Board Licensure Examination
160
CoursesVery
Useful Useful UselessVery
UselessDoes not
ApplyRating
Fundamentals Numberof Nursing
% of dept.
92
39.0
112
47.5
15
6.4
2
0.8
15
6.4
4
Microbiology Number 50 121 38 3 19 11
% of dept. 21.6 52.4 16.5 1.3 8.2
Intro. to Number 91 102 18 2 15
Psychology% of dept. 39.9 44.7 7.9 0.9 6.6
Maternal Number 177 61 1 0 3 1
Health% of dept. 73.1 25.2 0.4 0.0 1.2
Psychiatric Number 122 95 8 1 8
Nursing% of dept. 52.1 40.6 3.4 0.4 3.4
Anatomy and Number 135 98 5 0 2 2
Physiology I% of dept. 56.3 40.8 2.1 0.0 0.8
Child Number 56 97 30. 2 35 12
Psychology% of dept. 25.5 44.1 13.6 0.9 15.9
Adult and Child Number 89 101 9 0 21 6
Nursing I% of dept. 4L.5 45.9 4.1 0.0 9.5
Adult and Child Number 84 103 9 0 25 7
Nursing II% of dept. 38.0 46.6 4.1 0.0 11.3
Anatomy and Number 102 72 9 0 35
Physiology II% of dept. 46.8 33.0 4.1 0.0 16.1
Psychology of Number 53 92 22 2. 46 13
Adolescence% of dept. 24.7 42.8 10.2 0.9 21.4
Adult and Child Number 82 99 10 0 29
Nursing III% of dept. 37.3 45.0 4.5 0.0 13.2
Adult and Child Number 78 104 9 0 29 10
Nursing IV% of dept. 35.5 47.3 4.1 0.0 13.2
183.

Table NC-8
Graduates' perception of the value of specificcourses as preparation for the Pediatrics sectionof the N.Y.S. Boardlicensure Examination
161
Courses VeryUseful Useful Useless
VeryUseless
Does notApply
Rating
Fundamentals Numberof Nursing
% of dept.
98
42.2
101
43.5
16
6.9
2
0.9
15
6.5
9
Microbiology Number 64 109 37 4 16 12
% of dept. 27.7 47.2 16.0 1.7 6.9
Intro. to Number 107 104 11 2 9 5Psychology
% of dept. 45.9 44.6 4.7 0.9 3.9
Maternal Number 85 117 14 1 15 10Health
% of dept. 36.6 50.4 6.0 0.4 6.5
Psychiatric Number 122 97 11 1 5 3Nursing
% of dept. 51.7 41.1 4.7 0.4 2.1
Anatomy and Number 118 103 6 0 6 2Physiology I
% of dept. 50.6 44.2 2.6 0.0 2.6
Child Number 174 60 2 0 2 1Psychology% of dept. 73.1 25.2 0.8 0.0 0.8
Adult and Child Number 120 101 2 0 9 4Nursing I
% of dept. 51.7 43.5 0.9 0.0 3.9
Adult and Child Number 108 98 2 0 17 6Nursing II
g of dept. 48.0 43.6 0.9 0.0 7.6
Anatomy and Number 83 90 6 1 38 13Physiology II% of dept. 38.1 41.3 2.8 0.5 17.4
Psychology of Number 106 83 7 0 26 11Adolescence .
% of dept. 47.7 37.4 3.2 0.0 ,11.7
Adult and Child Number 105 95 3 0 21 8Nursing III
.% of dept. 46.9 42.4 1.3 0.0 9.4
Adult and Child Number 102 94 2 0 20Nursing IV
% of dept. 46.8 43.1 0.9 0.0 9.2
189

Table NC-9
162Graduates' perception of the value of specificcourses as preparation for the Psychiatry sectionfif th K Y_S Roard LirpnsurP_Examination
CoursesVery
Useful Useful UselessVery
UselessDoes not
ApplyRating
Fundamentals Numberof Nursing
% of dept.
65
28.1
92
39.8
42
18.2
5
2.2
27
11.7
9
Microbiology Number 21 66 78 14 51 13
% of dept. 9.1 28.6 33.8 6.1 22.1
Intro. to Number 143 91 6 2 2 3Psychology
% of dept. 58.6 37.3 2.5 0.8 0.8
Maternal Number 53 104 32 3 35 11Health
% of dept. 23.3 45.8 14.1 1.3 15.4
Psychiatric Number -182 59 3 3 I 1
Nursing
% of dept. 73.4 23.8 1.2 1.2 0.4
Anatomy and Number 68 102 34 3 28 10Physiology I
% of dept. 28.9 43.4 14.5 1.3 11.9
Child Number 150 82 4 0 6
Psychologyof dept. 62.0 33.9 1.7 0.0 2.5
Adult and Child Number 64 124 11 2 22 5Nursing I
% of dept. 28.7 55.6 4.9 0.9 9.9
Adult and Child Number 60 124 10 2 26 6Nursing II
% of dept. 27.0 55.9 4.5 0.9 11.7
Anatomy and Number 53 89 25 2 54 12
Physiology II% of dept. 23.8 39.5 11.2 0.9 24.2
Psychology of Number 130 77 3 1 25 4
Adolescence% of dept. 55.1 32.6 1.3 0.4 10.6
Adult and Child Number 64 118 9 2 30 7
Nursing III
% of dept. 28.7 52.9 4.0 0.9 13.5
Adult and Child Number 63 117 11 2 30 8Nursing IV
% of dept. 28.3 52.5' 4.9 0.9 13.5
190

Table NC-10
Graduates' perception of the value of specificcourses as preparation for actual employmentconditions
Courses
Fundamentalsof Nursing
Number
% of dept.
Microbiology Number
% of dept.
Intro. to NumberPsychology
% of dept.
Maternal NumberHealth
% of dept.
Psychiatric NumberNursing
% of dept.
Anatomy and NumberPhysiology I
% of dept.
Child NumberPsychology
% of dept.
Adult and Child NumberNursing I
% of dept.
Adult and Child NumberNursing II
% of dept.
Anatomy and NumberPhysiology II
% of dept.
Psychology of NumberAdolescence
% of dept.
Adult and Child NumberNursing III
% of dept.
Adult and Child NumberNursing IV
% of dept.
163
Very Very Does not RatingUseful Useful Useless Useless Apply
128 96 6 3
52.5 39.2 2.4 1.2
82 122 25 6
33.6 50.0 10.2 2.5
138 100 8 1
55.4 40.2 3.2 0.4
115 118 3 0
46.6 47.8 1.2 0.0
160 79 5 1
63.7 31.5 2.0 0.4
134 100 6 0
54.3 40.5 2.4 0.0
133 108 3 0
53.0 43.0 1.2 0.0
119 102 1 0
50.2 43.0 0.4 0.0
111 102 1 0
47.6 43.8 0.4 0.0
91 91 3 0
41.4 41.4 1.4 0.0
118 89 4 0
50.6 38.2 1.7 0.0
109 95 1 0
48.0 41.9 0.4 0.0
109 97 1 0
47.8 42.5 0.4 0.0
191
12 5
4.9
9 12
3.7
2 2
0.8
11 6
4.5
6 1
2.4
7 4
2.8
7 3
2.8
15 7
6.3
19 8
8.2
35 13
15.9
22 9
9.4
22 11
9.7
21 10
9.2
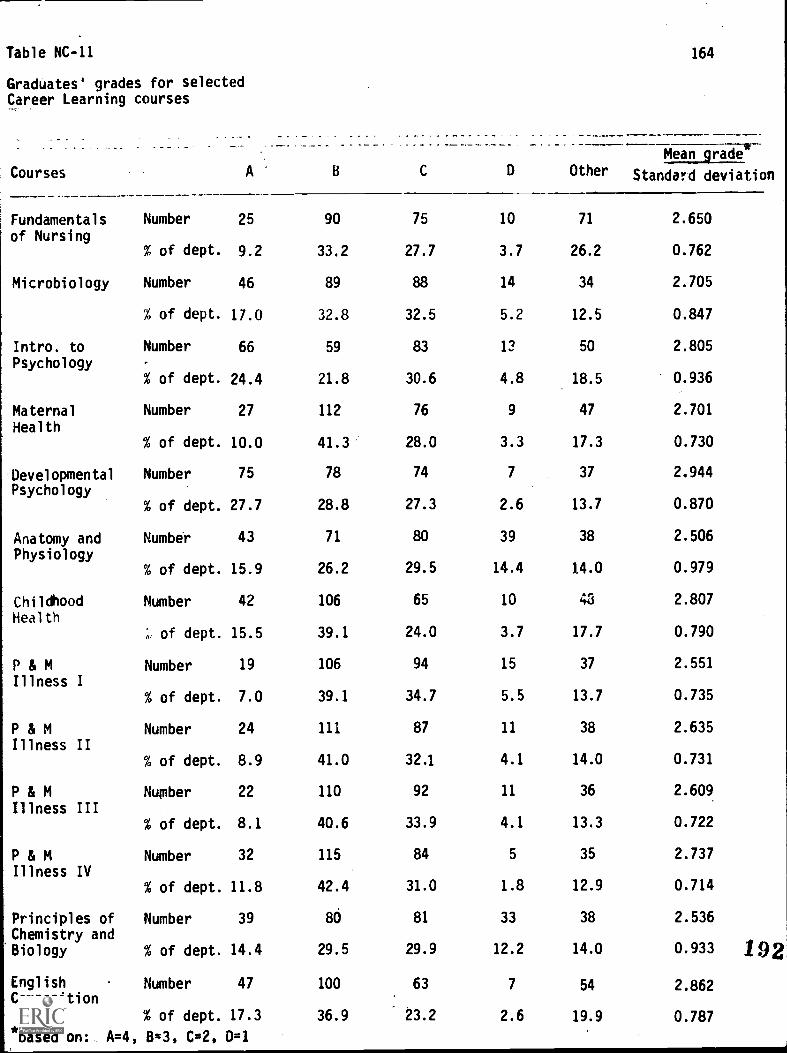
Table NC-11
Graduates' grades for selectedCareer Learning courses
164
MeapAnmii*-Courses A D C D Other Standard deviation
Fundamentalsof Nursing
Number 25 90 75 10 71 2.650
% of dept. 9.2 33.2 27.7 3.7 26.2 0.762
Microbiology Number 46 89 88 14 34 2.705
% of dept. 17.0 32.8 32.5 5.2 12.5 0.847
Intro, to Number 66 59 83 13 50 2.805
Psychology% of dept. 24.4 21.8 30.6 4.8 18.5 0.936
Maternal Number 27 112 76 9 47 2.701
Health% of dept. 10.0 41.3 28.0 3.3 17.3 0.730
Developmental Number 75 78 74 7 37 2.944
Psychology% of dept. 27.7 28.8 27.3 2.6 13.7 0.870
Anatomy and Number 43 71 80 39 38 2.506
Physiology% of dept. 15.9 26.2 29.5 14.4 14.0 0.979
Childhood Number 42 106 65 10 43 2.807
Health;, of dept. 15.5 39.1 24.0 3.7 17.7 0.790
P & M Number 19 106 94 15 37 2.551
Illness I% of dept. 7.0 39.1 34.7 5.5 13.7 0.735
P & M Number 24 111 87 11 38 2.635
Illness II% of dept. 8.9 41.0 32.1 4.1 14.0 0.731
P & M Number 22 110 92 11 36 2.609
Illness III% of dept. 8.1 40.6 33.9 4.1 13.3 0.722
P & M Number 32 115 84 5 35 2.737
Illness IV% of dept. 11.8 42.4 31.0 1.8 12.9 0.714
Principles of Number 39 80 81 33 38 2.536
Chemistry andBiology % of dept. 14.4 29.5 29.9 12.2 14.0 0.933
EnglishComposition
Number 47 100 63 7 54 2.862
% of dept. 17.3 36.9 23.2 2.6 19.9 0.787
*based on: A=4, B=3, C=2, 0=1
/92

Table NC-12
165
Graduates' perception of course componentas btst preparation for each section,ofN.Y.S% Board Licensure Examination
SectionReading Written Review
Labs material assignments Exams seminars Lectures Discussions
Medical Number 25 67 26 25 21 53 25
% ofdept.
10.3 27.7 10.7 10.3 8.7 21.9 10.3
Surgical Number 17 51 20 25 34 80 16
% ofdept.
7.0 21.0 8.2 10.3 14.0 32.9 6.6
Obstetrics Number 34 51 20 22 13 68 24
of
dept.14.7 22.0 8.6 9.5 5.6 29.3 10.3
Pediatrics Number 22 70 14 19 12 75 27
% ofdept.
9.2 29.3 5.9 7.9 5.0 31.4 11.3
Psychiatry Number 41 51 12 16 21 48 54
% ofdept.
16.9 21.0 4.9 6.6 8.6 19.8 22.2
193

Table NC-13
Graduates' perception of CareerLearning instructors' help aspreparation for each section ofN.Y.S. Board Licensure Examination
166
Very
et ion Excellent Good Good Fair Poor
Medical Number 90 85 63 17 4
ofdept.
34.7 32.8 24.3 6.6 1.5
Surgical Number 97 67 63 24 8
% ofdept.
37.5 25.9 24.3 9.3 3.1
Obstetrics Number 92 54 60 34 9
% ofdept.
36.9 21.7 24.1 13.7 3.6
Pediatrics Number 84 67 62 30 10
% ofdept.
33.2 26.5 24.5 11.9 4.0
Psychiatry Number 101 61 37 33 26
% ofdept.
39.1 23.6 14.3 12.8 10.1
194.

Table NC-14
Graduates' perception of teaching strategyas best preparation for each section ofN.Y.S. Board Licensure Exlmination
167
Section
in 1/14-11 IPS W
.0 X/et C C A-1 crto
es et7 In4.4.
6.1va et '''-"* iit ia.....
2 4E2. le"..et 1lia i et0et
A'I
A1 gm or 0, .-4CP V) C. CI. falA -,.. -8. In n=z A t+
in <et 11 flo C.eatn fn = C
A 4
Medical Number 98 66 17 27 8 13
% ofdept.
42.8 28.8 7.4 11.8 3.5 5.7
Surgical Number 95 71 16 31 14 8
% ofdept.
40.4 30.2 6.8 13.2 6.0 3.4
Obstetrics Number 74 69 17 39 10, 11
% ofdept.
33.5 31.2 7.7 17.6 4.5 5.0
Pediatrics Number 82 , 77 12 37 9 9
% ofdept.
36.3 34.1 5.3 16.4 4.0 4.0
Psychiatry Number 80 66 20 40 15 9
X ofdept.
34.8 28.7 8.7 17.4 6.5 3.9
195

168
dTable NC-15
Graduates' perception of N.Y.C.C.C. curriculumas preparation for N.Y.S. Board Licensure
Examination
ExcellentVeryGood Good Fair Poor
Number 46 83 80 36 15
% of respondents 17.7 31.9 30.8 13.8 5.8
196.

able NC-16
raduates' perception of N.Y.C.C.C.urriculum as preparation for eachection of N.Y.S. Board Licensurexamination
169
ection Very
Excellent Good Adequate Poor Poor
edical Number 39 98 91 14 3
% ofdept.
15.9 40.0 37.1 5.7 1.2
urgical Number 52 88 79 20 6
% ofdept.
21.2 35.9 32.2 8.2 2.4
Obstetrics Number 63 80 69 21 6
% ofdept.
26.4 33.5 28.9 8.8 2.5'
Pediatrics Number 49 96 71 17 10
% ofdept.
20.2 39.5 29.2 7.0 4.1
Psychiatry Number 73 70 62 20 10
% ofdept.
30.8 29.5 26.2 8.4 5.1
197

170
Opthalmic Dispensary Licensure Section
198

171
To evaluate the success of New York City Community College (N.Y.C.C.C.)
graduates of the Opthalmic Dispensing department on the New York State
Board for Opthalmic Dispensary Licensure (NYSBODL) examination, and to
,measure their perception of the value of various components of their
N.Y.C.C.C. curriculum as preparation for NYSBODL, this section of the
division evaluation was prepared. Twenty-one Opthalmic Dispensing
graduates responded to the questionnaire mailed to all graduates;
20 respondents (95.2%) indicated they attempted the NYSBODL examination.
The data herein is representative of these respondents.
199

172
Table 0C-1 provides data describing the scores achieved by graduates of
the Opthalmic Dispensing department of N.Y.C.C.C. on the NYSBODL
examination, and Table OC-2 provides selected statistics based on the
actual scores obtained, in order to properly analyze the data presented.
It can be seen in Table OC -T that a wide variation exists in the number
of graduates attempting each section, from a low of four graduates
attempting Contact Lenses, Written and Contact Lenses, Oral Procedures
sections to a high of thirteen attempting the Contact Lenses, Practical
section. Table OC-2 shows the mean of graduates' scores of each section
to be relatively similar, that is, within 12%. High and low scores
for each section vary consideraly, however. It can be seen in Table
0C-2 that sections on which some graduates scored lowest are the same
sections on which other graduates scored highest (e.g. Contact Lenses,
Fitting), a situation which is confirmed by the unusually high standard
deviation for those sections.
Tables OC-3 and 0C-4 show the number of attempts reported necessary
to pass the NYSBODL examination, and the year reported for first and
second attempt. It can be seen in Table OC-3 that 60% of Opthalmic
Dispensing graduates reported passing NYSBODL on their first attempt;
10% did not pass at all. Table OC-4 indicates that 1971 and 1972 were
the peak reported years for graduates to attempt the NYSBODL examina-
tion; six respondents attempted the examination in each year. 1969 was
the earliest year of attempt reported by any respondent.
2)0
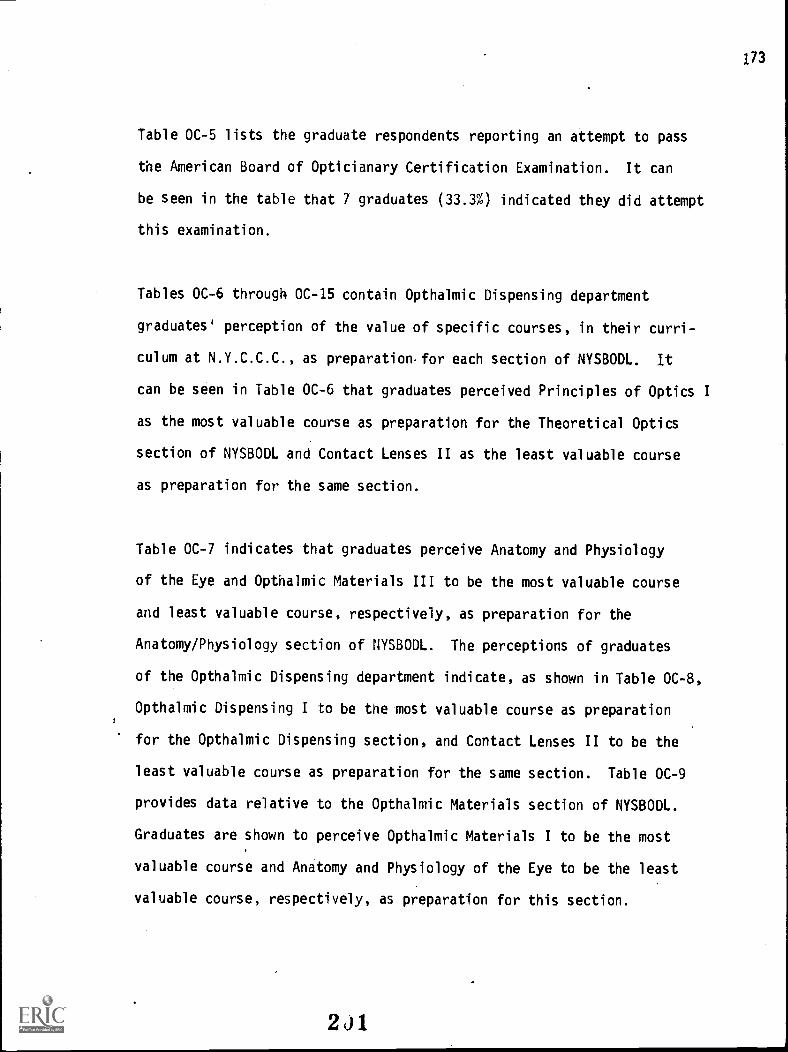
173
Table OC-5 lists the graduate respondents reporting an attempt to pass
the American Board of Opticianary Certification Examination. It can
be seen in the table that 7 graduates (33.3%) indicated they did attempt
this examination.
Tables OC-6 through 0C-15 contain Opthalmic Dispensing department
graduates' perception of the value of specific courses, in their curri-
culum at N.Y.C.C.C., as preparation. for each section of NYSBODL. It
can be seen in Table OC-6 that graduates perceived Principles of Optics I
as the most valuable course as preparation for the Theoretical Optics
section of NYSBODL and Contact Lenses II as the least valuable course
as preparation for the same section.
Table OC-7 indicates that graduates perceive Anatomy and Physiology
of the Eye and Opthalmic Materials III to be the most valuable course
and least valuable course, respectively, as preparation for the
Anatomy/Physiology section of NYSBODL. The perceptions of graduates
of the Opthalmic Dispensing department indicate, as shown in Table OC-8,
Opthalmic Dispensing I to be the most valuable course as preparation
for the Opthalmic Dispensing section, and Contact Lenses II to be the
least valuable course as preparation for the same section. Table OC-9
provides data relative to the Opthalmic Materials section of NYSBODL.
Graduates are shown to perceive Opthalmic Materials I to be the most
valuable course and Anatomy and Physiology of the Eye to be the least
valuable course, respectively, as preparation for this section.
2J1

174
Table OC-10 indicates that graduates' perceptions of the most valuable
course and least valuable course as preparation for the Opthalmic
Optics section are Principles of Optics II and Contact Lenses II,
respectively. Opthalmic Dispensing department graduates perceive
Opthalmic Dispensing I to be the most valuable course as preparation
for the Practical Dispensing section and Contact Lenses II to be the
least valuable course as preparation for the same section, as shown
in Table 0C-11. Table 0C-12 showing graduates' perceptions of most
valuable course as preparation for the Contact Lenses Written section
is Contact Lenses I and the least valuable course as preparation for
the same section is Opthalmic Materials II.
Table OC-13 provides information indicating graduates of the Opthalmic
Dispensing department perceive the most valuable course as preparation
for the Contact Lenses Oral Procedures section is ContaCt Lenses II,
and the least valuable course as preparation for the same section is
Opthalmic Materials I. Table 0C-14 shows graduates' perception of the
most valuable course and least valuable course as preparation for the
Contact Lenses Fitting section are Contact Lenses II and Opthalmic
Materials I, respectively. Graduates' perceptions of the most
valuable course and least valuable course as preparation for the Contact
Lenses Practical section are shown in Table 0C-16. The courses are
Contact Lenses I and Opthalmic Materials II, respectively.
Table OC-16 extends the same course by course ratings to Opthalmic
202

175
Dispensing department graduates' perception orvalue as preparation
for actual employment conditions. It can be seen in this table that
graduates perceive Opthalmic Dispensing II to be the most valuable
course and Special Visual Aids to be the least valuable course as pre-
paration for their health service employment. It can be determined
from Tables OC-6 through OC-16 that of the 22 possible choices as most
valuable and second most valuable course as preparation for the various
sections of NYSBODL and actual employment, Contact Lenses I was selected
five times, Contact Lenses II and Opthalmic Dispensing I were selected
four times each and Opthalmic Dispensing II was selected three times.
Of the 22 possible choices as least valuable and second least valuable
course as preparation for the same areas, Contact Lenses II and Opthalmic
Materials I were selected five times each and Opthalmic Materials II
was selected four times.
Table OC-17 lists the course grades, of graduates of the Opthalmic
Dispensing department, for selected Career Learning courses. It can
be seen that the mean grade varies from 2.842 (Contact Lenses I) to
3.842 (Opthalmic Materials I) a difference that is statistically signi-
ficant to a level of .0001. The mean grade for English Composition,
2.615, is unusually low, based on the mean grades for English Composition
of other departments in the division.
Graduates' perception of the course component that was the best
preparation for each section of NYSBODL is shown in Table 0C-18. It
2J3

176
can be seen that graduates of the Opthalmic Dispensing department
perceive Lectures to be the best preparation for the Theoretical Optics
section, Opthalmic Dispensing section, and Opthalmic Optics section.
They perceive Lectures and Reading Material to be equally good prepara-
tion for the Anatomy/Physiology section and Contact Lenses Oral Procedures
section; Laboratories to be the best preparation for the Opthalmic
Materials section, Practical Dispensing section, Contact Lenses Fitting
section, and Contact Lenses Practical section; Discussion to be the best
preparation for the Contact Lenses Written section.
Tables OC-19 and 0C-20 present the Opthalmic Dispensing department
graduates' perception of their Career Learning instructors and teaching
strategies as preparation for the various sections of NYSBODL. It can
be seen in Table 0C-19 that the majority of graduates perceived their
instructors to be Very Good or Excellent as help in preparing for all
sections of the examination. Instructors' help was rated highest for
the Opthalmic Dispensing and Opthalmic Materials sections; lowest for
the Anatomy/Physiology and Contact Lenses Written section where 36.8%
and 22.2% of the graduates, respectively, rated instructors' help as
Poor. Table 0C-20 indicates graduates' perceptions of teaching strategy
most helpful as preparation for the various sections of NYSBODL. It
is shown that graduates perceive Subject Matter Stressed to be most
helpful for all sections except Opthalmic Dispensing and Opthalmic
Materials for which graduates perceive Teachers' Comments and Method
of Presentation , respectively, to be most helpful.
204

177
Tables OC-21 and OC-22 provide Opthalmic Dispensing department graduates'
perception of their N.Y.C.C.C. curriculum as preparation for NYSBODL
and for each section of NYSBODL. It can be seen in Table OC-21 that
47.6% of graduates perceive their training at N.Y.C.C.C. to be Very
Good or Excellent preparation for NYSBODL and only 4.8% perceive their
training to be poor preparation for the examination. Table OC-22
provides an analysis by section and shows a rather wide variation in
perception of N.Y.C.C.C. curriculum as preparation for NYSBODL.
Eighty to ninety percent of the graduates perceive their curriculum
to be Excellent or Good as preparation for the Opthalmic Dispensing
section, Opthalmic Materials section, and Practical Dispensing section.
Less than 40% of graduates perceive their training to be Excellent or
Good preparation for the Contact Lenses Written section, Contact Lenses
Oral section, and Contact Lenses Fitting section. Twenty percent or
greater perceive their N.Y.C.C.C. curriculum to be Poor or Very Poor for
the Anatomy/Physiology saction, Contact Lenses Written section, Contact
Lenses Fitting section, &nd Contact Lenses Practical section.
Referring back to Table 0C-21, however, more than 85% of graduates
perceive their N.Y.C.C.Z. training to be Good, Very Good, or Excellent,
on an overall basis.
To determine whether one or more course grades were predictive of success
on the various sections of NYSBODL, correlations between graduates'
scores on each section of NYSBODL and their course grades were computed.
The following subjects, listed in order of decreasing significance,
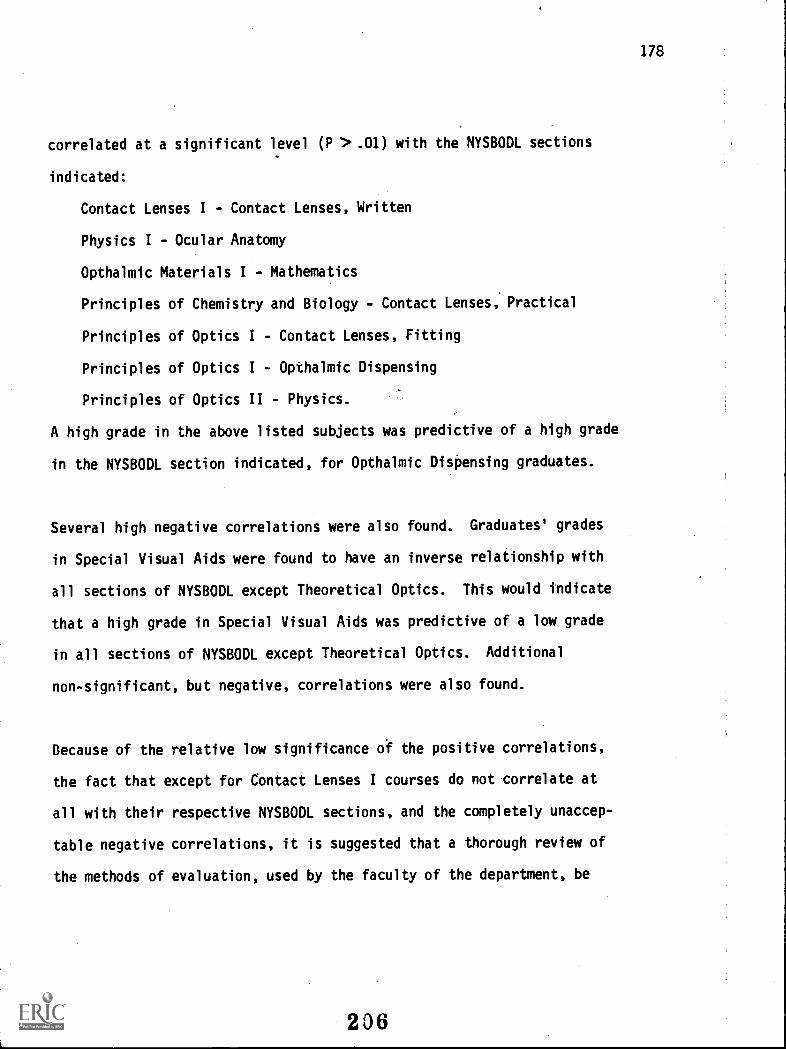
178
correlated at a significant level (P > .01) with the NYSBODL sections
indicated:
Contact Lenses I - Contact Lenses, Written
Physics I - Ocular Anatomy
Opthalmic Materials I - Mathematics
Principles of Chemistry and Biology - Contact Lenses, Practical
Principles of Optics I - Contact Lenses, Fitting
Principles of Optics I - Opthalmic Dispensing
Principles of Optics II - Physics.
A high grade in the above listed subjects was predictive of a high grade
in the NYSBODL section indicated, for Opthalmic Dispensing graduates.
Several high negative correlations were also found. Graduates' grades
in Special Visual Aids were found to have an inverse relationship with
all sections of NYSBODL except Theoretical Optics. This would indicate
that a high grade in Special Visual Aids was predictive of a low grade
in all sections of NYSBODL except Theoretical Optics. Additional
non-significant, but negative, correlations were also found.
Because of the relative low significance of the positive correlations,
the fact that except for Contact Lenses I courses do not correlate at
all with their respective NYSBODL sections, and the completely unaccep-
table negative correlations, it is suggested that a thorough review of
the methods of evaluation, used by the faculty of the department, be
206

179
instigated. Evaluation of students' subject knowledge and ability
should be highly predictive of their success on the NYSBODL examination.
2J7

Table 0C-1
Graduates' scores on each section of N.Y.S.B' rd for Opthalmic Disc ns r n
180
t'on
Section 41-50 51-60 61-70 71-80 81-90 91-100 Total
Physics 1
Math 0 0
Opthalmic 0 0
Materials
Opthalmic 0 0
Optics
0 2 3 1 7
1 1 1 3 6
1 4 5 1 11
1 3 6 0 10
Opthalmic 0 1 0 6 5 0 12Dispensing
Contact Lenses, 1
Fitting
Contact Lenses, 0Practical
TheoreticalOptics
OcularAnatomy
0
0
Contact Lenses, 0Written
1 2 2 3 2 11
0 0 1 11 13
Contact Lenses, 0 0 0 1 2 1 4Oral Procedures
208

Table OC-2
Selected statistics describing sections of N.Y.S.Board for Opthalmic Dispensary Licensure Examination
181
Section Mean StandardDeviation
Low
Score
High
Score
Median
Score
Physics 76.857 17.004 40 90 82.00
Math 84.667 10.577 68 95 87.00
Opthalmic 82.500 7.379 68 95 82.50Materials
Opthalmic 78.250 10.244 51 89 80.00Optics
Opthalmic 79.750 8.069 60 90 79.75Dispensing
Contact Lenses, 75.909 15.488- 44 96 77.75Fitting
Contact Lenses, 85.231 4.304 78 93 84.25Practical
Theoretical 82.400 2.966 78 86 82.25Optics
Ocular 79.000 3.082 75 83 79.25Anatomy
Contact Lenses, 78.000 4.546 72 82 79.00Written
Contact Lenses, 84:250 6.131 78 92 83.50Oral Procedures
2J9

182
Table OC-3
Number of attempts necessaryfor graduates to pass N.Y.SBoard for Opthalmic DispensaryLicensure Examination
Graduates 1 2 3 4 5
More than5
Did notpass
Total
Number
Percent
12
60.0
2
10.0
3
15.0
0
0.0
0
0.0
1
5.0
2
10.0
20
100.0
210

183
Table OC-4
N.Y.S. Board for Opthalmic DispensaryLicensure Examination year, by attempt
Year 1st attempt 2nd attempt Total
1969 2 0 2
1970 2 0 2
1971 6 0 6
1972 6 0 6
1973 4 1 5
1974 1 1 2

184
Table 0C-5
Graduates' attempt at American Board of-Opticianary Certification Examination
Graduates Yes No
Number 7 14
Percent 33.3 66.7
212

Table OC-6
Graduates' perception of the value of specificcourses as preparation for the Theoretical Opticssection of N.Y.S. Board for Opthalmic Dispensary Licensure Examination
185\)
...1.,Course
VeryUseful Useful Useless
VeryUseless
Does notapply Rating
Opthalmic Numbermaterials I
7 7 2 0 3 7
36.8 36.8 10.5 0.0 15.8
Opthalmic Numbermaterials II
8 6 2 0 3 5
42.1 31.6 10.5 0.0 15.8
Anatomy and Number 5 7 3 2 3 10
Physiologyof Eye % 26.3 36.8 10.5 10.5 15.8
Principles ofNumber 12 6 1 0 0 1
Optics I% 63.2 31.6 5.3 0.0 0.0
Opthalmic Numbermaterials III
6 8 2 0 3 8
31.6 42.1 10.5 0.0 15.8
Opthalmic Number 6 7 2 1 1 4
Dispensing I
% 35.3 41.2 11.8 5.9 5.9
Principles ofNumber 11 6 1 0 0 2
Optics II% 61.1 33.3 5.6 0.0 0.0
Contact Number 3 7 5 0 2 9
Lenses I% 17.6 41.2 29.4 0.0 11.8
Opthalmic Number 8 4 3 0 2 3
Dispensing II% 47.1 23.5 17.6 0.0 11.8
Special Number 7 5 3 1 2 6
Visual Aids% 38.9 27.8 16.7 5.6 11.1
Contact Number 3 6 6 0 2 11
Lenses II% 17.6 35.3 35.3 0.0 11.8
213

Table OC-7
Graduates' perception of the value of specific coursesas preparation for the Anatomy/Physiology section of N.Y.S.Board for Opthalmic Dispensary Licensure Examination
186
Course, VeryUseful Useful Useless
Very
UselessDoes not
apply
Opthalmic Numbermaterials I
1 6 4 1 6
5.6 33.3 .22.2 5.6 33.3
Opthalmic Numbermaterials II
%
1
5.6
6
33.3
4
22.2
1
5.6
6
33.3
Anatomy and Number 9 4 2 2 1
Physiologyof Eye % 50.0 22.2 11.1 11.1 5.6
Principles ofNumber 3 9 1 1 4Optics I
% 16.7 50.0 5.6 5.6 22.2
Opthalmic Numbermaterials III
1 7 4 1 5
5.6 38.9 22.2 5.6 27.8
Opthalmic Number 3 6 2 1 6Dispensing I
16.7 33.3 11.1 5.6 33.3
Principles ofNumber 4 8 1 1 4Optics II
% 22.2 44,4 5.6 5.6 22.2
Contact Number 6 8 1. 0 2
Lenses I35.3 47.1 5.9 0.0 11.8
Opthalmic Number 4 6 2 1 5Dispensing II
% 22.2 33.3 11.1 5.6 27.8
Special Number 3 8 1 1 4Visual Aids
% 17.6 47.1 5.9 5.9 23.5
Contact Number 5 7 1 1 2Lenses II
31.3 43.8 6.3 6.3 12.5
Rating
6
7
1
5
11
10
4
2
9
8
3

Table OC-8
Graduates' perception of the value of specific courses aspreparation for the Opthalmic Dispensing section of N.Y.S.Board for Opthalmic Dispensary Licensure Examination
18;
CoursesVery.
Useful Useful UselessVery
UselessDoes not
apply Rating
Opthalmic Numbermaterials I
.%
7
38.9
10
55.6
1
5.6
0
0.0
0
0.0
5
Opthalmic Numbermaterials II
%
8
44.4
9
50.0
1
5.6
0
0.0
0
0.0
4
Anatomy and Number 4 6 2 1 4Physiologyof Eye % 23.5 35.3 11.8 5.9 23.5
Principles ofNumber 5 7 1 1 2 8Optics I
% 31.3 43.8 6.3 6.3 12.5
Opthalmic Numbermaterials III
%
8
44.4
9
50.0
1
5.6
0
0.0
0
0.0
3
Opthalmic Number 15 3 0 0 0 1Dispensing I
83.3 16.7 0.0 0.0 0.0
Principles ofNumber 6 7 1 1 2 6Optics II
- % 35.3 41.2 5.9 5.9 11.8
Contact Number 2 7 4 0 3 10Lenses I
% 12.5 43.8 25.0 0.0 18.8
Opthalmic Number 13 4 0 0 0
Dispensing II% 76.5 23.5 0.0 0.0 0.0
Special Number 4 8 0 1 4 9Visual Aids
% 23.5 47.1 0.0 5.9 23.5
Contact Number 2 7 3 0 4 11Lenses II
% 12.5 43.8 18.8 0.0 25.0
2 15

Table OC-9
Graduates' perception of the value of specific coursesas preparation for the Opthalmic Materials section ofN.Y.S. Board for Opthalmic Dispensary Licensure Examination
188
CourSi't.
e*,
,Very.
Useful Useful UselessVery
UselessDoes not
apply Rating
Opthalmic Numbermaterials I
%
15
83.3
3
16.7
0
0.0
0
0.0
0
0.0
1
Opthalmic Numbermaterials II
%
15
83.3
3
16.7
0
0.0
0
0.0
0
0.0
2
Anatomy and Number 1 . 6 3 3 4 11Physiologyof Eye % 5.9 35.3 17.6 17.6 23.5
Principles ofNumber 5 7 3 1 2 6Optics I
. % 27.8 38.9 16.7 5.6 11.1
Opthalmic Numbermaterials III
%
13
72.2
4
22.2
0
0.0
0
0.0
1
5.6
3
Opthalmic Number 7 11 0 0 0 4Dispensing I
% 38.9 61.1 0.0 0.0 0.0
Principles ofNumber 5 6 3 1 2 7
Optics II% 29.4 35.3 17.6 5.9 11.8
Contact Number 2 6 4 1 3 8Lenses I
% 12.5 37.5 25.0 6.3 1858
Opthalmic Number 7 10 1 0 0 5
Dispensing II% 38.9, 55.6 5.6 0.0 0.0
Special Number 3 7 2 1 4 9Visual Aids
% 17.6 41.2 11.8 5.9 23.5
Contact Number 2 6 4 0 4 10Lenses II
% 12.5 37.5 25.0 0.0 25.0
216

Table OC-10 189
Graduates' perception of the value of specific courses aspreparation for the Opthalmic Optics section of N.Y.S.Board for Opthalmic Dispensary Licensure Examination
Courses Very. Very Does notUseful Useful Useless Useless apply Rating
Opthalmic Numbermaterials I
%
6
37.5
4
25.0
4
25.0
0
0.0
2
12.5
5
Opthalmic Numbermaterials II
%
5
31.3
5
31.3
4
25.0
0
0.0
2
12.5
6
Anatomy and Number 5 6 1 3 3Physiologyof Eye % 27.8 33.3 5.6 16.7 16.7
Principles ofNumber 10 4 0 1 2 3Optics I
% 58.8 '23.5 0.0 5.9 11.8
Opthalmic Numbermaterials III
%
5
31.3
5
31.3
4
25.0
0
0.0
2
12.5
7
Opthalmic Number 8 5 2 0 1 2Dispensing I
% 50.0 31.3 12.5 0.0 6.3
Principles ofNumber 9 6 0 1 1 1Optics II
% 52.5 35.3 0.0 5.9 5.9
Contact Number 4 5 3 1 3Lenses I
% 25.0 31.3 18.8 6.3 18.8
Opthalmic Number 7 7 1 0 2 4Dispensing II
% 41.2 41.2 5.9 0.0 11.8
Special Number 4 4 4 0 4 10Visual Aids
% 25.0 25.0 25.0 0.0 25.0
Contact Number 4 3 3 1 4 11Lenses II
% 26.7 20.0 20.0 6.7 26.7
217

Table 0C-11
Graduates' perception of the value of specific courses as
preparation for the Practical Dispensing section of N.Y.S.Board for Opthalmic Dispensary Licensure Examination
190
Courses Very.
Useful Useful UselessVery
Useless-Does not
apply Rating
Opthalmic Numbermaterials I
10 6 2 0 0 3
55.6 33.3 11.1 0.0 0.0
Opthalmic Numbermaterials II
%
10
55.6
6
33.3
2
11.1
0
0.0
0
0.0
4
Anatomy and Number 5 4 2 2 4 10Physiologyof Eye % 29.4 23.5 11.8 11.8 23.5
Principles ofNumber 7 3 2 2 3Optics 1
% 41.2 17.6 11.8 11.8 17.6
Opthalmic Numbermaterials III
10 6 2 0 0 5
55.6 33.3 11.1 0.0 0.0
Opthalmic Number 15 3 0 0 0 1Dispensing I
% 83.3 16.7 0.0 0.0 0.0
Principles ofNumber 8 4 1 1 3 6Optics II
- % 47.1 23.5 5.9 5.9 17.6
Contact Number 3 6 3 1 3 9Lenses I Igo
% 18.8 37.5 18.8 6.3 18.8
Opthalmic Number 13 4 1 0 0 2Dispensing II
% 72.2 22.2 5.6 0.0 0.0
Special Number 5 5 3 0 3 7Visual Aids
% 31.3 31.3 18.8 0.0 18.8
Contact Number 2 6 3 0 4 11Lenses II
% 13.3 40.0 20.0 0.0 26.7
218

Table OC-12 191
Graduates' perception of the value of specific courses aspreparation for the Contact Lenses Written section ofN.Y.S. Board for Opthalmic Dispensary Licensure Examination
CoursesVery
Useful Useful Useless
VeryUseless
Does notapply Rating
Opthalmic Numbermaterials I
%
Opthalmic Numbermaterials II
%
Anatomy and NumberPhysiologyof Eye %
Principles of Number
3
20.0
3
20.0'
7
46.7
5
4
26.7
4
26.7
4
26.7
7
3
20.0
3
20.0
1
6.7
2
1
6.7
1
6.7
3
20.0
0
4
26.7
4
26.7
0
0.0
2
10
11
4
5Optics I
% 31.3 43.8 12.5 0.0 12.5
Opthalmic Numbermaterials III
%
3
20.0
6
40.0
2
13.3
1
6.7
3
20.0
7
Opthalmic Number 4 5 2 1 3 6Dispensing I
% 26.7 33.3 13.3 6.7 20.0
Principles of Number 6 7 2 0 1 3Optics II
% 37.5 43.8 12.5 0.0 6.34
Contact Number 12 4 0 0 1 1Lenses I
% 70.6 23.5 0.0 0.0 5.9
Opthalmic Number 4 5 2 1 4 9Dispensing II
% 25.0 31.3 12.5 6.3 25.0
Special Number 5 3 2 1 4 8Visual Aids
% 33.3 20.0 13.3 6.7 26.7
Contact Number 10 4 0 0 2
Lenses II% 62.5 25.0 0.0 0.0 12.5
2i9

Table OC-13 192
Graduates' perception of the value of specific courses aspreparation for the Contact Lenses Oral Procedures sectionof N.Y.S. Board for Opthalmic Dispensary Licensure Examination
Course,, Very.
Useful Useful UselessVery
UselessDoes notapply Rating
Opthalmic Numbermaterials I
%
1
7.7
5
38,5
2
15.4
0
0.0
5
38.5
11
Opthalmic Numbermaterials II
%
1
7.7
5
38.5
2
15.4
0
0.0
5
38.5
10
Anatomy and Number 5 5 0 2 2 3Physiologyof Eye % 35.7 35.7 0.0 14.3 14.3
Principles of Number 3 6 1 1 3 4Optics I
% 21.4 42.9 7.1 7.1 21.4
Opthalmic Numbermaterials III
%
2
14.3
5
35.7
1
7.1
0
0.0
6
42.9
9
Opthalmic Number 2 5 1 0 5 7Dispensing I
% 15.4 38.4 7.7 0,0 38.5
Principles of Number 3 6 1 1 3 5Optics II
% 21.4 42.9 7.1 7.1 21.4
Contact Number 8 5 0 0 2 2Lenses I
% 53.3 33.3 0.0 0.0 13.3
Opthalmic Number 2 4 2 0 5 8Dispensing II
% 15.4 30.8 15.4 0.0 38.5
Special Number 3 4 1 0 5 6Visual Aids
% 23.1 30.8 7.7 0.0 38.5
Contact Number 9 4 0 0 1 1Lenses II
% 64.3 28.6 0.0 0.0 7.1
220:

Table OC-14
Graduates' perception of the value of specific courses aspreparation for the Contact Lenses Fitting section ofN.Y.S. Board for OpthalmicDispensary Licensure Examination
193
Lourse VeryUseful Useful Useless
VeryUseless
Does notapply Rating
Opthalmic Numbermaterials I
%
2
15.4
3
23'.1
1
7.7
1
7.7
6
46.2
11
Opthalmic Numbermaterials II
%
2
15.4
4
30.8
1
7.7
1
7.7
5
38.5
10
Anatomy and Number 8 1 0 2 3 3Physiologyof Eye % 57.1 7.1 0.0 14.3 21.4
Principles ofNumber 3 5 0 1 4 5
Optics I% 23.1 36.5 0.0 7.7 30.8
Opthalmic Numbermaterials III
%
2
15.4
4
30.8
1
7.7
1
7.7
5
38.5
9
Opthalmic Number 3 3 1 1 5 8Dispensing I
% 23.1 23.1 7.7 7.7 38.5
Principles ofNumber 5 5 0 0 4 4Optics II
% 35.7 35.7 0.0 0.0 28.6
Contact Number 10 3 0 0 1 2
Lenses I% 71.4 21.4 0.0 0.0 7.1
Opthalmic Number 5 2 1 1 5 6Dispensing II
% 35.7 14.3 7.1 7.1 35.7
Special Number 4 2 1 1 6 7Visual Aids
% 28.6 14.3 7.1 7.1 42.9
Contact Number 11 2 0 0 1 1
Lenses II% 78.6 14.3 0.0 0.0 7.1
221

Table OC-15
Graduates' perception of the value of specific coursesas preparation for the Contact Lenses Practical sectionof N.Y.S. Board for Opthalmic Dispensary Licensure Examination
194
Coursc VeryUseful Useful Useless
VeryUseless
Does notapply Rating
Opthalmic Numbermaterials I
1 4 2 2 4 10
7.7 30.8 15.4 15.4 30.8
Opthalmic Numbermaterials II
1 4 2 2 4 11
7.7 30.8 15.4 30.8
Anatomy and Number 8 1 0 3 3 3Physiologyof Eye % 53.3 6.7 0.0 20.0 20.0
Principles of Number 4 4 1 2 3 5Optics I
% 28.6 28.6 7.1 14.3 21.4
Opthalmic Numbermaterials III
2 4 2 2 5
13.3 26.7 13.3 13.3 33.3
Opthalmic Number 4 2 2 2 3 6Dispensing I
% 30.8 15.4 15.4 15.4 23.1
Principles of Number 4 6 1 1 4 4Optics II
% 25.0 37.5 6.3 6.3 25.0
Contact Number 11 3 1 0 0 1Lenses I
% 73.3 20.0 6.7 0.0 0.0
Opthalmic Number 4 3 2 2 4Dispensing II
% 26.7 20.0 13.3 13.3 26.7
Special Number 4 3 2 1 5 8Visual Aids
% 26.7 20.0 13.3 6.7 33.3
Contact Number 11 2 1 0 1 2Lenses II
% 73.3 13.3 -6.7 0,0 6.7

qable OC-16
Graduates' perception of the value of specific'courses as preparation for actual employmentconditions
195
Course:,Very
Useful Useful UselessVery
UselessDoes notapply Rating
Opthalmic Numbermaterials I
Opthalmic Numbermaterials II
%
Anatomy and NumberPhysiologyof Eye %
Principles ofNumberOptics I
%
Opthalmic Numbermaterials III
%
Opthalmic NumberDispensing I
%
Principles ofNumberOptics II
%
Contact NumberLenses I
Opthalmic NumberDispensing II
%
Special NumberVisual Aids
%
Contact NumberLenses II
8
40.0
9
45.0
6
30.0
5
15.0
10
50.0
13
65.0
6
30.0
7
35.0
15
75.0
4
20.0
7
35.0
12
60.0
11
55.0
8
40.0
13
65.0
10
50.0
7
35.0
11
55.0
9
45.0
5
25.0
8
40.0
9
45.0
0
0.0
0
0.0
2
10.0
0
0.0
0
0.0
0
0.0
1
5.0
0
0.0
0
0.0
6
30.0
0
0.0
0
0.0
0
0.0
3
15.0
1
5.0
0
0.0
0
0.0
1
5.0
3
15.0
0
0.0
1
5.0
2
10.0
0
0.0
0
0.0
1
5.0
1
5.0
0
0.0
0
0.0
1
5.0
1
5.0
0
0.0
1
5.0
2
10.0
5
4
10
6
3
2
7
8
1
11
9
223

Table OC-17
Graduates' grades for selectedCareer Learning courses
196
Courses A C D OtherMean Grade
Standard Deviation
Opthalmicmaterials I
Number 16 3 0 0 2 3.842
76.2 14.3 0.0 0.0 9.5 0.375
Opthalmicmaterials II
Number 15 3 0 1 2 3.684
% 71.4 14.3 0.0 4.8 9.5 0.749
Opthalmicmaterials III
Number 9 7 2 1 2 3.263
42.9 33.3 9.5 4.8 9.5 0.872
Anatomy and Number 9 7 2 1 2 3.263Physiologyof Eye % 42.9 33.3 9.5 4.8 9.5 0.872
Principlesof Optics I
Number 7 7 5 0 2 3.105
% 33.3 33.3 23.8 0.0 9.5 0.809
Principles of Number 6 7 5 1 2 2.947Optics II
28.6 33.3 23.8 4.8 9.5 0.911
Opthalmic Number 11- 7 1 0 2 3.526Dispensing I
52.4 33.3 4.8 0.0 9.5 0.612
Opthalmic Number 9 8 2 0 2 3.368Dispensing II
42.9 38.1 9.5 0.0 9.5 0.684
Contact Lenses Number 5 6 8 0 2 2.842I
% 23.8 28.6 38.1 0.0 9.5 0.834
Contact Lenses Number 5 9 2 0 5 3.188II
% 23.8 42.9 9.5 0.0 23.8 0.655
Special Number 4 10 5 0 2 2.947Visual Aids
it,,, 19.0 47.6 23.8 0.0 9.5 0.705
English Number 1 6 6 0 8 2.615Composition
% 4.8 28.6 28.6 0.0 38.1 0.650
224

Table OC-18 197
Graduates' perception of course component asbest preparation for each section of N.Y.S. Boardfor Opthalmic Dispensary Licensure Examination
LabsReadingMaterial
WrittenAssignments Exams
ReviewSeminars
.
Lectures Discussion
Theoretical Number 1 4 1 1 3 7 1Optics
% 5.6 22.2 5.6 5.6 16.7 38.9 5.6
Anatomy/ Number 0 6 1 1 4 6 0Physiology
. 0.0 33.3 5.6 5.6 22.2 33.3 0.0
Opthalmic Number 1 1 0 1 4 10 1Dispensing
% 5.6 5.6 0.0 5.6 22.2 55.6 5.6
Opthalmic Number 8 0 0 1 4 4 1Materials
44.4 0.0 0.0 5.6 22.2 22.2 5.6
Opthalmic Number 0 2 1 1 6 7 1Optics
0.0 11.1 5.6 5.6 33.3 38.9 5.6
Practical Number 13 0 0 0 2 3 0Dispensing
72.2 0.0 0.0 0.0 11.1 16.7 0.0
Contact Lens Number 0 5 1 1 3 4 2Written
0.0 31.3 6.3 6.3 18.8 25.0 12.5
Contact Lens Number 1 3 0 1 2 3 4Oral
7.1 21.4 0.0 7.1 14.3 21.4 28.6
Contact Lens Number 8 2 0 0 2 2 1Fitting
53.3 13.3 0.0 0.0 13.3 13.3 6.7
Contact Lens Number 11 2 0 0 2 1 1Practical
64.7 11.8 0.0 0.0 11.8 5.9 5.9
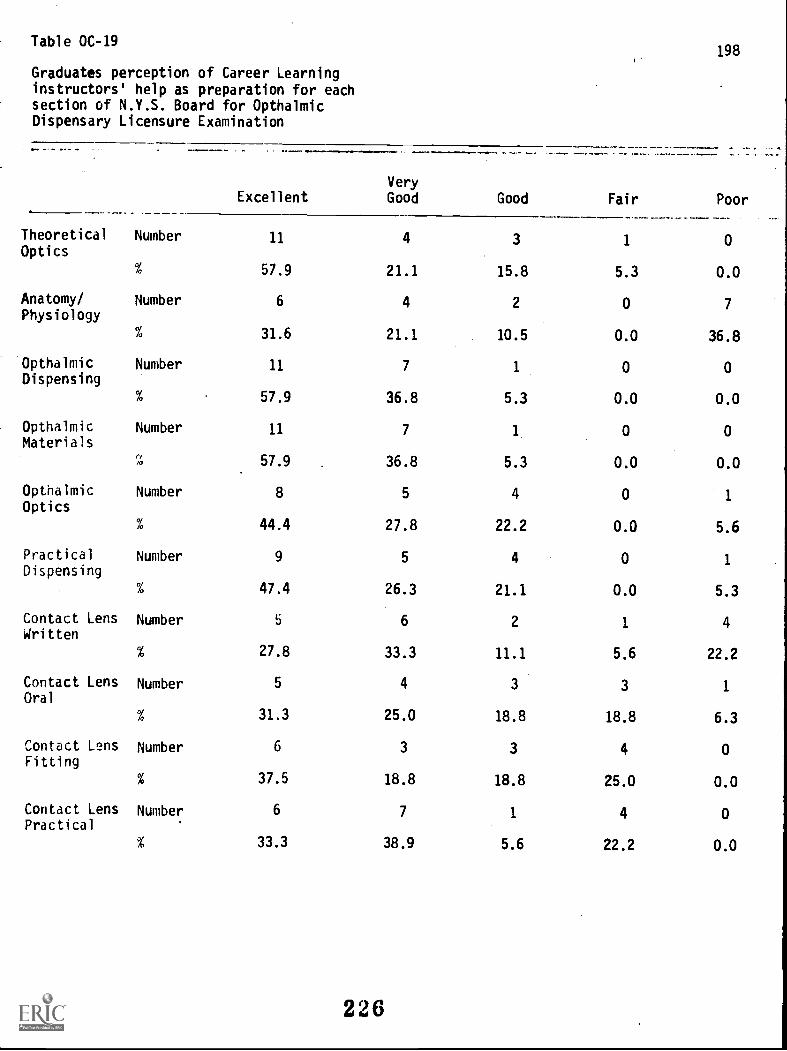
Table 0C-19
Graduates perception of Career Learninginstructors' help as preparation for eachsection of N.Y.S. Board for OpthalmicDispensary Licensure Examination
ExcellentVeryGood Good Fair
198
Poor
Theoretical Number 11 4 3 1 0Optics
% 57.9 21.1 15.8 5.3 0.0
Anatomy/ Number 6 4 2 0 7Physiology
% 31.6 21.1 10.5 0.0 36.8
Opthalmic Number 11 7 1 0 0Dispensing
% 57.9 36.8 5.3 0.0 0.0
Opthalmic Number 11 7 1 0 0Materials
1757.9 36.8 5.3 0.0 0.0
Opthalmic Number 8 5 4 0 1
Optics
44.4 27.8 22.2 0.0 5.6
Practical Number 9 5 4 0 1Dispensing
47.4 26.3 21.1 0.0 5.3
Contact Lens Number 5 6 2 1 4Written
27.8 33.3 11.1 5.6 22.2
Contact Lens Number 5 4 3 3 1
Oral
31.3 25.0 18.8 18.8 6.3
Contact Lens Number 6 3 3 4 0Fitting
% 37.5 18.8 18.8 25.0 0.0
Contact Lens Number 6 7 1 4 0Practical
% 33.3 38.9 5.6 22.2 0.0
226

Table 0C-20
Graduates' perception of teaching strategyas best preparation for each section of N.Y.S.Board for Opthalmic Dispensary LicensureExamination
199
Subjectmatterstressed
Method ofpresentationof material
Response
to
questionsTeachers'comments
Individual
assistance
Teachingaids
Theoretical Number 6 5 1 2 2 1
Optics35.3 29.4 5.9 11.8 11.8 5.9
Anatomy/ Number 6 3 1 3 2 1
Physiology37.5 18.8 6.3 18.8 12.5 6.3
Opthalmic Number 4 4 2 6 0 1
Dispensing% 23.5 23.5 11.8 35.3 0.0 5.9
Opthalmic Number 5 6 1 4 0 1
Materials29.4 35.3 5.9 23.5 0.0 5.9
Opthalmic Number 4 2 2 3 3 2
Optics25.0 12.5 12.5 18.8 18.8 12.5
Practical Number 7 2 1 4 1 1
Dispensing% 43.8 12.5 6.3 25.0 6.3 6.3
Contact Lens Number 5 5 1 1 1 1
Written% 35.7 35.7 7.1 7.1 7.1 7.1
Contact Lens Number 4 2 1 3 2 1
Oral
% 30.8 15.4 7.7 23.1 15.4 7.7
Contact Lens Number 5 1 2 2 1 1
Fitting38.5 7.7 15.4 15.4 7.7 7.7
Contact Lens Number 5 2 1 3 2 2
Practical33.3 13.3 6.7 20.0 13.3 13.3

200
Table OC-21
Graduates' perception of their N.Y.C.C.C.curriculum as preparation for N.Y.S. Boardfor Opthalmic Dispensary Licensure Examination
VeryGraduates Excellent Good Good Fair Poor
Number 5 5 8 1 1
Percent 23.8 23.8 38.1 4.8 4.8
228

Table OC-22
Graduates' perception of N.Y.C.C.C. curriculumas preparation for each section of N.Y.S. Boardof Opthalmic Dispensary Licensure Examination
201
Poor
VeryPoorExcellent Good Adequate
Theoretical Number 4 11 4 1 0
Optics% 20.0 55.0 20.0 5.0 0.0
Anatomy/ Number 4 7 3 3 3
Physiology
% 20.0 35.0 15.0 15.0 15.0
Opthalmic Number 11 5 4 0 0
Dispensing55.0 25.0 20.0 0.0 0.0
Opthalmic Number 11 7 2 0 0
Materials
% t-,5.0 35.0 10.0 0.0 0.0
Opthalmic Number 4 10 3 2 1
Optics20.0 50.0 15.0 10.0 5.0
Practical Number 10 6 1 2 1
Dispensing50.0 30.0 5.0 10.0 5.0
Contact Lens Number 2 5 8 3 2
Written10.0 25.0 40.0 15.0 10.0
Contact Lens Number 3 3 10 1 1
Oral16.7 16.7 55.6 5.6 5.6
Contact Lens Number 2 5 5 5 1
Fitting
% 11.1 27.8 27.8 27.8 5.6
Contact Lens Number 4 6 6 2 2
Practical
% 20.0 30.0 30.0 10.0 10.0

202
Radiologic Technology Licensure Section
230

203
To determine the success of graduates of the Radiologic Technology
department of New York City Community College (N.Y.C.C.C.) on the
New York State Licensing Examination (NYSL), and the graduates'
perception of their N.Y.C.C.C. curriculum as preparation for the
NYSL examination, this section of the division evaluation was
prepared. Nine graduates of Radiologic Technology responded to the
questionnaire mailed to all graduates; all nine respondents indicated
they attempted the NYSL examination. The data herein is representative
of the nine respondents, but caution should be exercized in generalizing
conclusion based on data from this relatively small sample to the entire
population of graduates.

204
Table RC-1 provides data describing scores obtained by responding
graduates of Radiologic Technology department of N.Y.C.C.C. on the
NYSL examination. Selected statistics describing the scores are also
presented in Table RC-1. It can be seen that six graduates (66.7%)
scored 70 or over on the examination. The highest score was 91;
the lowest score was 52. Additional information provided by the
respondents indicates that eight graduates (88.9%) made one attempt
at the examination; one graduate (11.1%) made two attempts. Only
one graduate provided information about the year of NYSL examination
attempt: 1971. Eight respondents. (88.9%) stated they also attempted
the American Registry of Radiologic Technologists examination.
Tables RC-2 through RC-9 contain Radiologic Technology graduates'
perception of the value of specific courses, in their curriculum at
N.Y.C.C.C., as preparation for each section of the NYSL exapnation.
Each table provides the number and percentage of responding graduates
selecting each perceived value listing, as well as a rating of each
course relative to the other listed courses. Because of the small
number of respondents, and therefore the identity of value means,
more than0
one course may occupy each rating position. It can be seen
in Table4C-2 that Radiologic Technology graduates' perception of the
most valuable course as preparation for the Radiographic Techniques
section of NYSL examination was Radiologic Technique Lab II and
232

205
Clinical Practice II. Graduates' perception of the least valuable
course as preparation for the same section was Dental Radiography.
Graduates' perception of the most valuable course and least valuable
course as preparation for the Standard Positioning section are shown
in Table RC-3. They are Positioning II and Radiation Therapy,
respectively.
Table RC-4 presents Radiologic Technology graduates' perception of
the most valuable courses as preparation for the Anatomy and Physiology
section. The courses selected are Positioning II and Positioning III.
The least valuable courses for the same section are perceived to be
X-Ray Physics and Radiation Therapy. Table RC-5 shows the graduates
perceived X-Ray Physics to be the most valuable course as preparation
for the X-Ray Physics section and Dental Radiography to be the least
valuable course as preparation for the same section. Graduates'
perception of the most valuable course and least valuable course as
preparation for the Radiation Therapy section is shown in Table RC-6
to be X-Ray Physics and Dental Radiography, respectively.
Table RC-7 indicates graduates of the Radiologic Technology department
perceived Special Procedures to be the most valuable course as pre-
paration for the Special Procedures section and Radiation Therapy to
be the least valuable course as preparation for the same section.
The course graduates perceived to be the most valuable as preparation
for the General Physics section is shown in Table RC-8 to be X-Ray

206
Physics. The course perceived to be least valuable as preparation
for the same section is Dental Radiography. It can be seen from
Table RC-9 that graduates perceived their Radiation Therapy course
to be the best preparation for the Therapy section and Dental Radio-
graphy to be least valuable as preparation for the same section.
Table RC-10 extends the same course by course ratings to Radiologic
Technology graduates' perception of value as preparation for actual
employment conditions. It can be seen in Table RC-10 that graduates
perceived Positioning III to be the most valuable course as prepara-
tion for their actual health service employment and Radiation Therapy
to be the least valuable course as preparation for employment. It
can be determined from Tables RC-2 through RC-10 that of a possible
nine selection positions, X-Ray Physics was selected as most valuable
course three times and least valuable course one time. Radiation
Therapy was selected as least valuable course four times and most
valuable course one time. Dental Radiography was selected as least
valuable course five_times.
Table RC-11 provides course grades of graduates of the Radiologic
Technology department for selected Career Learning courses. It can
be seen that the mean grade varies from a low of 1.875 (X-Ray Physics)
to a high of 3.625 (Clinical Practice II). This difference is statis-
tically significant to a level of 0.01. There is undoubtedly a
relationship between the relatively low mean grade for Radiation
234

207
Therapy and its choice as least valuable course by a large percentage
of graduates. Dental Radiography, the course perceived least valuable
by a majority of graduates is not listed because no grades were
reported for this course for responding graduates.
Graduates' perception of the course component that was perceived best
preparation for each section of NYSL examination is provided in
Table RC-12. It can be seen that Laboratories are perceived by
Radiologic Technology graduates to be the best preparation for the
Radiographic Technique section and Standard Positioning section.
Reading Material is perceived to be the bist preparation for the
Radiation Therapy section, Special Procedures section, and General
Physics section. No component is clearly selected as best preparation
for the Anatomy/Physiology section, X-Ray Physics section, or Therapy
section.
Tables RC-13 and RC-14 present Radiologic Technology department
graduates' perception of their Career Learning instructors and
teaching strategies as preparation for the various sections of NYSL
examination. It can be determined from Table RC -13 that the majority
of graduates perceived their instructors to be Excellent as help in
preparing for the Anatomy/Physiology section, Very Good or Excellent
as help in preparing for the Radiographic Techniques section and
Standard Positioning section, and Good, Very Good, or Excellent as
2 3,5

help in preparing for the X-Ray Physics section, Radiation Therapy
section, and Special Procedures section. The majority of graduates
perceived their instructors to be Good, or Very Good as help in
preparing for the General Physics section and Therapy section.
Their instructors were perceived as least helpful as preparation for
the Special Procedures section and General Physics section where
44.4% of graduates perceived their instructors' help as Fair or Poor.
Table RC-14 shows graduates' perceptions of teaching strategies most
helpful as preparation for NYSL examination. It can be seen in this
table that Subject Matter Stressed was perceived to be the most help
as preparation for the Radiographic Techniques section, Standard
Positioning section, and X-Ray Physics section. Method of Presentation
of Material was perceived to be the most help as preparation for the
Anatomy/Physiology section and General Physics section. Teachers'
Comments was perceived to be the most help as preparation for the
Radiation Therapy section and, with Method of Presentation of
Material, the Therapy section.
Tables RC-15 and RC-16 provide Radiologic Technology graduates'
perceptions of their N.Y.C.C.C. curriculum as preparation for NYSL
examination, and for each section of the examination. It can be seen
in Table RC-15 that 88.9% of the respondents perceive their overall
training at N.Y.C.C.C. to be Good,. Very Good, or Excellent. None
of the respondents perceive their training to be Poor. When analyzed

a,
by NYSL section, as shown in Table RC-16, it is evident that 44% of
responding graduates perceived their training at N.Y.C.C.C. to be
poor or very poor for the Therapy section and Special Procedures
section, and 22% perceived their training to be poor or very poor
for the General Physics section and Radiation Therapy section. A
majority of respondents, however, perceived their training at N.Y.C.C.C.
to be Excellent, Good, or Adequate for all sections of the NYSL
examination.
To determine whether one or more course grades were predictive of
success on the NYSL examination, correlations between graduates' scores
on the NYSL and their course grades were computed. The following
subjects, listed in decreasing order of significance, correlated at a
significant level (P 7 .025 ) with the NYSL examination:
Radiographic Technique I
Clinical Practice III
Radiographic Technique II
Positioning I.
A high grade in the above four subjects was predictive of success in
the NYSL examination for the nine responding graduates of the Radiologic
Technology department. It is suggested that a larger sample of Radiologic
Technology graduates be examined before any firm conclusions be drawn
from these results.

,a
Table RC-1
Graduates' scores on the New YorkState Licensing Examination
210
Graduates 50-59 60-69 70-79 80-89 90-99
Number
Percent
1
12.5
1
12.5
2
25.0
3
37.5
1
12.5
Mean Score 75.875
Low Score 52
High Score 91
Median Score 79.50
238

Table RC-2
,raduatess perception of the value ofspecific courses as preparation for theRadiographic Techniques section of N.Y.S.Licensing Examination
211
CoursesVery
Useful Useful UselessVery
UselessDoes notapply Rating
Radiologic Number 3 5 0 0 0 5Technic I
% 37.5 62.5 0.0 0.0 - 0.0
Radiologic Number 5 4 0 0 0 3Technic Lab I
% 55.6 44.4 0.0 0.0 0.0
Positioning I Number 3 5 1 0 0 7
% 33.3 55.6 11.1 0.0 0.0
Gross Number 3 6 0 0 0 6Anatomy I
% 33.3 66.7 0.0 0.0 0.0
Radiologic Number 5 4 0 0 0 3Technic II
% 55.6 44.4 0.0 0.0 0.0
Radiologic Number 6 3 0 0 0 1
Technic Lab II% 66.7 33.3 0.0 0.0 0.0
Positioning II Number 5 4 0 0 0 3
% 55.6 44.4 0.0 0.0 0.0
Clinical Number 4 5 0 0 0 4Practice I
% 44.4 55.6 0.0 0.0 0.0
'Gross Number 5 4 0 0 0 3Anatomy II
% 55.6 44.4 0.0 0.0 0.0
Clinical Number 6 3 0 0 0 1
Practice II% 66.7 33.3 0.0 0.0 0.0
Medical/ Number 5 4 0 0 0 3SurgicalDiseases % 55.6 44.4 0.0 0.0 0.0
Positioning III Number 5 4 0 0 0
% 55.6 44.4 0.0 0.0 0.0
239 (continued next page)

212
(Table RC-2 continued)
CoursesVery
Useful Useful UselessVery
UselessDoes not
apply Rating
Patient Number 1 8 0 0 0 8Care
% 11.1 88.9 0.0 0.0 0'.0
Radiologic Number 4 4 1 0 0 6Technic III
% 44.4 44.4 11.1 0.0 0.0
Clinical Number 5 3 0 0 0 2Practice III
% 62.5 37.5 0.0 0.0 0.0
X-Ray Physics Number 2 6 1 0 0 8
% 22.2 66.7 11.1 0.0 0.0
Radiation Number 1 6 1 1 0 10Therapy
% 11.1 66.7 11.1. 11.1 0.0
Dental Number 1 5 2 0 1 11Radiography
% 11.1 55.6 22.2 0.0 11.1
Special Num6er 1 6 2 0 0Procedures
% 11.1 66.7 22.2 0.0 0.0
Clinical Number 5 4 0 0 0 3.Practice IV
55.6 44.4 0.0 0.0 0.0
Clinical Number 5 4 0 0 0 3Practice V
55.6 44.4 0.0 0.0 0.0
240
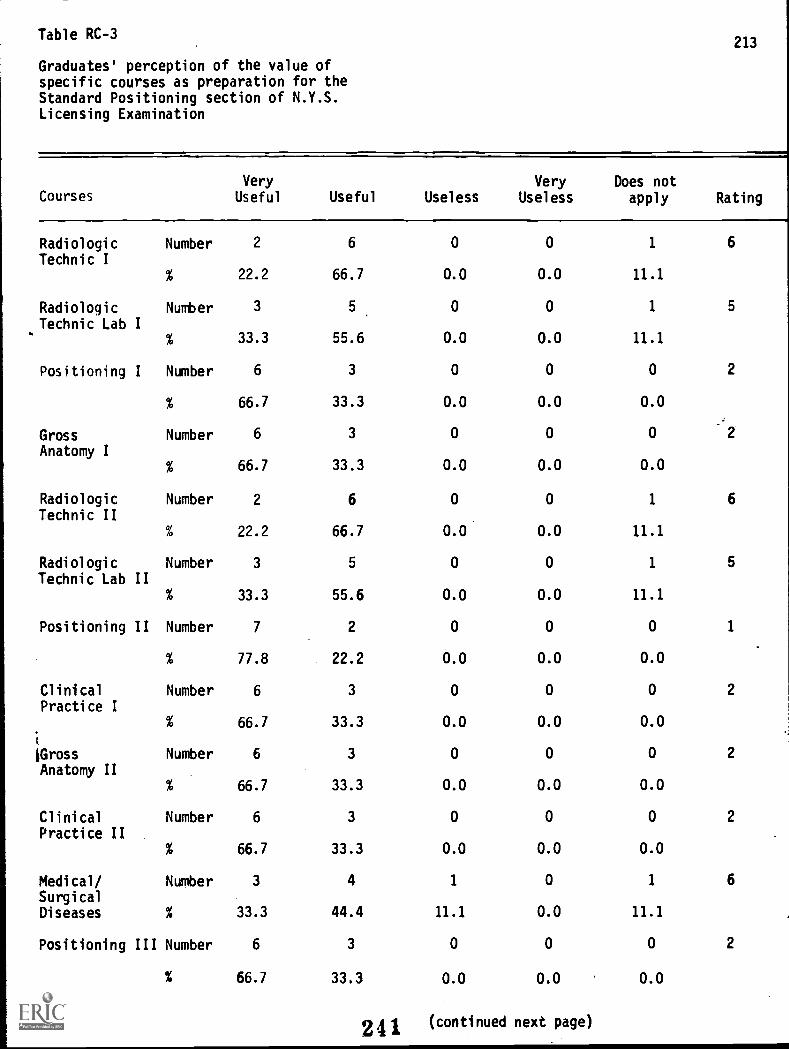
Table RC-3
Graduates' perception of the value ofspecific courses as preparation for theStandard Positioning section of N.Y.S.Licensing Examination
213
CoursesVery
Useful Useful UselessVery
UselessDoes not
apply Rating
Radiologic Number 2 6 0 0 1 6
Technic I% 22.2 66.7 0.0 0.0 11.1
Radiologic Number 3 5 0 0 1 5
Technic Lab I% 33.3 55.6 0.0 0.0 11.1
Positioning I Number 6 3 0 0 0 2
% 66.7 33.3 0.0 0.0 0.0
Gross Number 6 3 0 0 0
Anatomy I% 66.7 33.3 0.0 0.0 0.0
Radiologic Number 2 6 0 0 1 6
Technic II% 22.2 66.7 0.0 0.0 11.1
Radiologic Number 3 5 0 0 1 5
Technic Lab II% 33.3 55.6 0.0 0.0 11.1
Positioning II Number 7 2 0 0 0 1
% 77.8 22.2 0.0 0.0 0.0
Clinical Number 6 3 0 0 0 2
Practice I
i
% 66.7 33.3 0.0 0.0 0.0
/Gross Number 6 3 0 0 0 2
Anatomy II% 66.7 33.3 0.0 0.0 0.0
Clinical Number 6 3 0 0 0 2
Practice II% 66.7 33.3 0.0 0.0 0.0
Medical/ Number 3 4 1 0 1 6
SurgicalDiseases % 33.3 44.4 11.1 0.0 11.1
Positioning III Number 6 3 0 0 0 2
% 66.7 33.3 0.0 0.0 0.0
24 1(continued next page)

214
(Table RC-3 continued)
Courses
Very Very Does not
Useful Useful Useless Useless apply Rating
Patient Number 0 8 0 0 1
Care% 0.0 88.9 0.0 0.0 11.1
Radiologic Number 4 4 0 0 1
Technic III% 44.4 44.4 0.0 0.0 11.1
Clinical Number 6 3 0 0 0
Practice III% 66.7 33.3 0.0 0.0 0.0
X-Ray Physics Number 1 5 2 0 1
% 11.1 55.6 22.2 0.0 11.1
Radiation Number 2 3 2 1 1
Therapy% 22.2 33.3 22.2 11.1 11.1
Dental Number 0 7 1 0 1
Radiography% 0.0 77.8 11.1 0.0 11.1
Special Number 1 7 1 0 0
Procedures% 11.1 77.8 11.1 0.0 0.0
Clinical Number 6 3 0 0 0
Practice IV% 66.7 33.3 0.0 0.0 0.0
Clinical Number 6 3 0 0 0
Practice V66.7 33.3 0.0 0.0 0.0
242
7
4
2
8
9
8
5
2
2

Table RC-4
Graduates' perception of the value ofspecific courses as preparation for theAnatomy Physiology section of N.Y.S.Licensing Examination
215
CoursesVery
Useful Useful UselessVery
UselessDoes not
apply Rating
Radiologic Number 2 5 1 0 1 9
Technic I% 22.2 55.6 11.1 0.0 11.1
Radiologic Number 2 6 0 0 1 8Technic Lab I
22.2 66.7 0.0 0.0 11.1
Positioning I Number 5 4 0 0 0 3
% 55.6 44.4 0.0 0.0 0.0
Gross Number 6 3 0 0 0 2
Anatomy I% 66.7 33.3 0.0 0.0 0.0
Radiologic Number 2 5 1 0 1 9
Technic II% 22.2 55.6 11.1 0.0 11.1
Radiologic Number 3 5 0 0 1 7
Technic Lab II33.3 55.6 0.0 0.0 11.1
Positioning II Number 7 2 0 0 0 1
77.8 22.2 0.0 0.0 0.0
Clinical Number 6 3 0 0 0 2
Practice I% 66.7 33.3 0.0 0.0 0.0
`Gross Number 5 4 0 0 0 3
Anatomy II% 55.6 44.4 0.0 0.0 0.0
Clinical Number 6 3 0 0 0 2
Practice II% 66.7 33.3 0.0 0.0 0.0
Medical/ Number 4 5 0 0 0 4
SurgicalDiseases % 44.4 55.6 0.0 0.0 0.0
Positioning III Number 7 2 0 0 0 1
% 77.8 22.2 0.0 0.0 0.0
243 (continued next page)

216
(Table RC-4 continued)
CoursesVery
Useful Useful UselessVery
UselessDoes notapply Rating
Patient Number 1 4 3 0 1 10Care
11.1 44.4. 33.3 u.0 11.1
Radiologic Number 5 3 0 0 1 5Technic III
% 55.6 33.3 0.0 0.0 11.1
Clinical Number 5 3 0 0 1 5Practice III
% 55.6 33.3 0.0 0.0 11.1
X-Ray Physics Number 1 3 4 0 1 11
% 11.1 33.3 44.4 0.0 11.1
Radiation Number 1 3 4 0 1 11Therapy
11.1 33.3 44.4 0.0 11.1
Dental Number 1 4 3 0 1 10Radiography
11.1 44.3 33.3 0.0 11.1
Special Number 4 4 0 0 1 6Procedures
44.4 44.4 0.0 11.1
Clinical Number 6 3 0 0 0 2Practice IV
66.7 33.3 0.0 0.0 0.0
Clinical Number 6 3 0 0 0 2Practice V
66.7 33.3 0.0 0.0 0.0

Table RC-5
Graduates' perception of the value ofspecific courses as preparation for theX-Ray Physics section of N.Y.S.Licensing Examination
217
CoursesVery
Useful Useful Useless
VeryUseless
Does notapply Rating
Radiologic Number 4 4 1 0 0 2
Technic I% 44.4 44.4 11.1 0.0 0.0
Radiologic Number 3 4 1 0 0Technic Lab I
% 37.5 50.0 12.5 0.0 0.0
Positioning I Number 1 2 4 0 1 9
% 12.5 25.0 50.0 0.0 12.5
Gross Number 1 3 3 0 1 8
Anatomy I% 12.5 37.5 37.5 0.0 12.5
Radiologic Number 3 4 2 0 0 4
Technic II% 33.3 44.4 22.2 0.0 0.0
Radiologic Number 3 3 2 0 0 4
Technic Lab II% 37.5 37.5 25.0 0.0 'OA
Positioning II Number 1 3 3 0 1 8
% 12.5 37.5 37.5 0.0 12.5
Clinical Number 2 3 2 0 1 6
Practice I% 25.0 37.5 25.0 0.0 12.5
`Gross Number 0 5 2 0 1 8
Anatomy II% 0.0 62.5 25.0 0.0 12.5
Clinical Number 2 3 2 0 1 6
Practice II% 25.0 37.5 25.0 0.0 12.5
Medical/ Number 1 4 2 0 1 7
SurgicalDiseases % 12.5 50.0 25.0 0.0 12.5
Positioning III Number 2 2 3 0 1 7
% 25.0 25.0 37.5 0.0 ,-11.5
245 (continued next page)

218
(Table RC-5 continued)
Very Very Does not
Courses Useful Useful Useless Useless apply Rating
Patient . Number 0 4 3 0 1 9
Care% 0.0 50.0 37.5 0.0 12.5
Radiologic Number 5 2 2 0 0 2 I
Technic III% 55.6 22.2 22.2 0.0 0.0
Clinical Number 1 4 2 0 1 7
Practice III% 12.5 50.0 25.0 0.0 12.5
X-Ray Physics Number 5 3 0 0 0 1
% 62.5 37.5 0.0 0.0 0.0
Radiation Number 3 3 2 1 0 5
Therapy% 33.3 33.3 22.2 11.1 0.0
Dental Number 0 2 4 1 1 10
RadiographyA, 0.0 25.0 50.0 12.5 12.5
Special Number 1 4 2 0 1 7
Procedures12.5 50.0 25.0 0.0 12.5
Clinical Number 2 3 1 1 1 7
Practice IV25.0 37.5 12.5 12.5 12.5
Clinical Number 2 3 1 1 1 7
Practice V25.0 37.5 12.5 12.5 12.5
246

Table RC-6
Graduates' perception of the value ofspecific courses as preparation for theRadiation Therapy section of N.Y.S.Licensing Examination
219
CoursesVery
Useful Useful UselessVery
UselessDoes not
apply Rating
Radiologic Number 2 4 1 0 1 3Technic I
% 25.0 50.0 12.5 0.0 12.5
Radiologic Number 2 3 2 0 1 4Technic Lab I% 25.0 37.5 25.0 0.0 12.5
Positioning I Number 3 2, 2 0 1 3
% 37.5 25.0 25.0 0.0 12.5
Gross Number 2 4 1 0 1 3Anatomy I
% 25.0 50.0 12.5 0.0 12.5
Radiologic Number 2 4 2 0 1 4Technic II
% 22.2 44.4 22.2 0.0 11.1
Radiologic Number 0 3 3 0 1 6Technic Lab II
% 0.0 42.9 42.9 0.0 14.3
Positioning II Number 2 3 2 0 1 4
% 25.0 37.5 25.0 0.0 12.5
Clinical Number 2 4 1 0 1 3Practice I
% 25.0 50.0 12.5 0.0 12.5
;Gross Number 2 4 1 0 1 3Anatomy II% 25.0 50.0 12.5 0.0 12.5
Clinical Number 2 4 1 0 1 3Practice II% 25.0 50.0 12.5 0.0 12.5
Medical/ Number 1 4 2 0 1 5SurgicalDiseases % 12.5 50.0 25.0 0.0 12.5
Positioning III Number 2 3 2 0 . 1 4
% 25.0 37.5 25.0 0.0 12.5
(continued next page)247

220
(Table RC-6 continued)
CoursesVery
Useful Useful UselessVery
UselessDoes not
apply Rating
Patient Number 2 3 2 0 1Care
% 25.0 37.5 25.0 0.0 12.5
Radiologic Number 2 3 3 0 1 5Technic III
% 22.2 33.3 33.3 0.0 11.1
Clinical Number 2 4 1 0 1Practice III
% 25.0 50.0 12.5 0.0 12.5
X-Ray Physics Number 4 3 2 0 0 1
% 44.4 33.3 22.2 0.0 0.0
Radiation Number 5 2 1 0 1 2Therapy
55.6 22.2 11.1 0.0 11.1
Dental Number 0 2 4 1 1 7Radiography
% 0.0 25.0 50.0 12.5 12.5
Special Number 0 5 2 0 1 6Procedures
% 0.0 62.5 25.0 0.0 12.5
Clinical Number 2 4 0 1 1 4Practice IV
% 25.0 50.0 0.0 12.5 12.5
Clinical Number 2 4 0 1 1 4Practice V
% 25.0 50.0 0.0 12.5 12.5
248

Table RC-7
Graduates' perception of the value ofspecific courses as preparation for theSpecial Procedures section of N.Y.S.Licensing Examination
221
CoursesVery
Useful Useful UselessVery
UselessDoes not
apply Rating
Radiologic Number 1 3 2 0 2 7Technic I
12.5 37.5 25.0 0.0 25.0
Radiologic Number 1 4 1 0 2 6Technic Lab I
12.5 50.0 12.5 0.0 25.0
Positioning I Number 3 4 0 0 1 3
37.5 50.0 0.0 0.0 12.5
Gross Number 4 3 0 0 1 2Anatomy I
50.0 37.5 0.0 0.0 12.5
Radiologic Number 1 5 0 0 2Technic II
12.5 62.5 0.0 0.0 25.0
Radiologic Number 1 5 0 0 2 5Technic Lab II
% 12.5 62.5 0.0 0.0 25.0
Positioning II Number 3 4 0 0 1 3
37.5 50.0 0.0 0.0 12.5
Clinical Number 4 2 1 1 4Practice I
50.0 25.0 0.0 12.5 12.5
Gross Number 4 3 0 0 1 2Anatomy II
50.0 37.5 0.0 0.0 12.5
Clinical Number 4 3 0 0 1 2Practice II
50.0 37.5 0.0 0.0 12.5
Medical/ Number 4 2 1 0 1SurgicalDiseases % 50.0 25.0 12.5 0.0 12.5
Positioning III Number 4 3 0 0 1 2
50.0 37.5 0.0 0.0 12.5
249 (continued next page)

222
(Table 11C-7 continued)
CoursesVery
Useful Useful UselessVery
UselessDoes not
apply Rating
Patient Number 1 4 1 0 2 6Care
% 12.5 50.0 12.5 0.0 25.0
Radiologic Number 2 3 1 0 2 5
Technic III% 25.0 37.5 12.5 0.0 25.0
Clinical Number 4 3. 1 0 1 2
Practice III% 44.4 33.3 11.1 0.0 11.1
X-Ray Physics Number 1 4 1 0 2 6
% 12.5 50.0 12.5 0.0 25.0
Radiation Number 0 2 3 0 3
Therapy% 0.0 25.0 37.5 0.0 37.5
Dental Number 0 2 3 1 2 8Radiography
% 0.0 25.0 37.5 12.5 25.0
Special Number 6 1 0 0 0 1
Procedures% 85.7 14.3 0.0 0.0 *0.0
Clinical Number 4 3 0 0 1 2
Practice IV% 50.0 37.5 0.0 0.0 12.5
Clinical Number 4 3 0 0 1 2
Practice V% 50.0 37.5 0.0 0.0 12.5
250

Table RC-8 223
Graduates' perception of the value ofspecific courses as preparation for theGeneral Physics section of N.Y.S.Licensing Examination
CoursesVery
Useful Useful UselessVery
UselessDoes not
apply Rating
Radiologic Number 3 4 2 0 0 2Technic I
33.3 44.4 22.2 0.0 0.0
Radiologic Number 2 4 2 0 1 4'
Technic Lab I% 22.2 44.4 22.2 0.0 11.1
Positioning I Number 0 4 3 0 2 7
0.0 44.4 33.3 0.0 22.2
Gross Number 0 3 4 0 2 8Anatomy I
% 0.0 33.3 44.4 0.0 22.2
Radiologic Number 2 5 1 0 1 3Technic II
% 22.2 55.6 11.1 0.0 11.1
Radiologic Number 2 4 2 0 1
Technic Lab II% 22.2 44.4 22.2 0.0 11.1
Positioning II Number 0 3 4 0 2
% 0.0 33.3 44.4 0.0 22.2
Clinical Number 1 3 3 0 2 6Practice I
%.
t
11.1 33.3 33.3 0.0 22.2
`Gross . NumberwAnatomy.II
%
0
0.0
3
33.3
4
44.4
0
0.0
2
22.2
8
Clinical Number 1 4 2 0 2 5Practice II
% 11.1 44.4 22.2 0.0 22.2
Medical/ Number 0 3 4 0 2 8SurgicalDiseases % 0.0 33.3 44.4 0.0 22.2
Positioning III Number 0 2 5 0 2 9
% 0.0 22.2 55.6 0.0 22.2
251(continued next page)

224
(Table RC-8 continued)
CoursesVeryUseful Useful Useless
Very
UselessDoes not
apply Rating
Patient Number 0 3 4 0 2 8Care
% 0.0 33.3 44.4 0.0 22.2
Radiologic Number 1 0 7 0 1 4Technic III
% 11.1 0.0 77.8 0.0 11.1
Clinical Number 0 4 3 0 2 7Practice III
N0 0.0 44.4 33.3 0.0 22.2
X-Ray Physics Number 3 6 0 0 0 1
33.3 66.7 0.0 0.0 0.0
Radiation Number 2 4 2 0 1 4Therapy
% 22.2 44.4 22.2 0.0 11.1
Dental Number 0 1 5 1 2 10Radiography
% 0.0 11.1 55.6 11.1 22.2
Special Number 0 3 4 0 2 8Procedures
% 0.0 33.3 44.4 0.0 22.2
Clinical Number 1 4 2 0 2 5Practice IV
11.1 44.4 22.2 0.0 22.2
Clinical Number 1 4 2 0 2 5Practice V
11.1 44.4 22.2 0.0 22.2
252
.:

Table RC-9225
Graduates' perception of the value ofspecific courses as preparation for theTherapy section of N.Y.S. LicensingExamination
Very
Courses Useful Useful
Radiologic Number 1 4
Technic I% 12.5 50.0
Radiologic Number 1 4
Technic Lab I% 12.5 50.0
Positioning I Number 2 2
% 25.0 25.0
Gross Number 2 5
Anatomy I% 25.0 62.5
Radiologic Number 1 4
Technic II% 12.5 50.0
Radiologic Number 1 4
Technic Lab II% 12.5 50.0
Positioning II Number 2 2
% 25.0 25.0
Clinical Number 3 1
Practice I% 37.5 12.5
11Gross Number 2 5
Anatomy II% 25.0 62.5
Clinical Number 3 2
Practice II% 37.5 25.0
Medical/ Number 2 5
SurgicalDiseases % 25.0 62.5
Positioning III Number 2 2
UselessVery
UselessDoes not
apply Rating
1 1 1 8
12.5 12.5 12.5
1 1 1 8
12.5 12.5 12.5
2 1 1 8
25.0 12.5 12.5
1 0 0 2
12.5 0.0 0.0
1 1 1 8
12.5 12.5 12.5
1 1 1 8
12.5 12.5 12.5
2 1 1
25.0 12.5 12.5
1 1 2 9
12.5 12.5 25.0
1 0 0 2
12.5 0.0 0.0
1 0 2 7
12.5 0.0 25.0
1 0' 0 2
12.5 0.0 0.0
2 1 1 8
% 25.0 25.0 25.0 12.5 12.5
253(continued next page)

226
(Table RC-9 continued)
Very Very Does not
Courses Useful Useful Useless Useless apply Rating
Patient Number 2 4 1 1 1 4
Care% 22.2 44.4 11.1 11.1 11.1
Radiologic Number 2 2 2 1 1 8 1
Technic III i
% 25.0 25.0 25.0 12.5 12.5
Clinical Number 3 2 1 1 1 6
Practice III% 37.5 25.0 12.5 12.5 12.5 t
i
X-Ray Physics Number 3 3 1 0 1
% 37.5 37.5 12.5 0.0 12.5
Radiation Number 4 3 0 0 1 1
Therapy0/ 50.0 37.5 0.0 0.0 12.5%
Dental Number 0 1 4 1 2 11
Radiography% 0.0 12.5 50.0 12.5 25.0
Special Number 0 4 2 0 2 10
Procedures0.0 50.0 25.0 0.0 25.0
Clinical Number 3 2 1 1 1 5
Practice IV% 37.5 25.0 12.5 12.5 12.5
Clinical Nu.mber 3 3 0 1 1 4
Practice V% 37.5 37.5 0.0 -12.5 12.5
2 5.4+

Table RC-10
227Graduates' perception of the value ofspecific courses as preparation foractual employment conditions
Courses
RadiologicTechnic I
RadiologicTechnic Lab I
Positioning I
GrossAnatomy I
RadiologicTechnic II
Radiologic.Technic Lab II
Positioning II
VeryUseful Useful
Number 1 6
% 12.5 75.0
Number 1 6
% 12.5 75.0
Number 4 3
% 50.0 37.5
Number 5 3
% 62.5 37.5
Number 1 7
% 12.5 87.5
Number 1 7
% 12.5 87.5
Number 6 3
6 % 66.7 33.3
ClinicalPractice I
iGross
Anatomy II
ClinicalPractice II
Medical/Surgical
Number 6
% 66.7
Number 5
% 62.5
Number 6
% 66.7
Number 4
3
13.3
3
37.5
3
33.3
4
Diseases % 50.0 50.0
Positioning III Number 6 2
UselessVery
UselessDoes notapply Rating
1 0 0 9
12.5 0.0 0.0
1 0 0 9
12.5 0.0 0.0
1 0 0 6
12.5 0.0 0.0
0 0 0 3
0.0 0.0 0.0
0 0 0 8
0.0 0.0 0.0
0 0 0 8
0.0 0.0 0.0
0 0 0 2
0.0 0.0 0.0
0 0 0 2
0.0 0.0 0.0
0 0 0 3
0.0 0.0 0.0
0 0 0
0.0 0.0 0.0
0 0 0 4
0.0 0.0 0.0
0 0 0 1
%75.0 25.0 0.0 0.0 0.0 255
(continued mixt map)

228
(Table RC-10 continued)
Courses
Very
Useful Useful UselessVery
UselessDoes not
apply Rating
Patient Number ,,' 5 0 0 0 6
Care37.5 62.5 0.0 0.0 0.0
Radiologic Number 2 6 0 0 0 7
Technic III25.0 75.0 0.0 0.0 0.0
Clinical Number 4 5 0 0 0 5
Practice III44.4 55.6 0.0 0.0 0.0
X-Ray Physics Number 6 2 0 0 0 10
(y,0 75.0 25.0 0.0 0.0 0.0
Radiation Number 0 2 4 2 0 12
Therapy% 0.0 25.0 50.0 25.0 0.0
Dental Number 0 3 3 2 0 11
Radiography0.0 37.5 37.5 25.0 0.0
Special Number 0 7 0 0 0 9
Procedures% 0.0 . 100.0 0.0 0.0 0.0
Clinical Number 6 3 0 0 0 2
Practice IV% 66.7 33.3 0.0 0.0 0.0
Clinical Number 6 3 0 0 0 2
Practice V% 66.7 33.3 0.0 0.0 0.0
256

Table RC-11
Graduates' grades for selectedCareer Learning courses
229
Course A B C D Other
Mean Grade
Standard Deviation
Radiographic Number 1 4 1 2 1 2.500Technique I
% 11.1 44.4 11.1 22.2 11.1 1.069
Radiographic Number 0 3 0 0 6 3.000TechniqueLab I % 0.0 33.3 0.0 0.0 66.7 0.000
Positioning Number 2 4 2 0 1 3.000I
% 22.2 44.4 22.2 0.0 11.1 0.756
Gross Number 1 1 5 1 1 2.250Anatomy I
% 11.1 11.1 55.6 11.1 11.1 0.886
Radiologic Number 0 7 1 0 1 2.875Technique II
% 0.0 77.8 11.1 0.0 11.1 0.354
Positioning Number 4 1 3 0 1 3.125II
% 44.4 11.1 33.3 0.0 11.1 0.991
Gross Number 3 2 2 1 1 2.875Anatomy II
% 33.3 22.2 22.2 11.1 11.1 1.126
Clinical Number 6 1 1 0 1 3.625Practice II
% 66.7 11.1 11.1 0.0 11.1 0.744
Radiographic Number 3 5 0 0 1 3.375Technique III
% 33.3 55.6 0.0 0.0 11.1 0.518
Clinical Number 1 4 1 0 3 3.000Practices III
% 11.1 44.4 11.1 0.0 33.3 0.632
X-Ray Number 0 1 5 2 1 1.875Physics
% 0.0 11.1 55.6 22.1 11.1 0.641
257
(continued next page)

230
(Table RC-11 continued)
CourseA C D 'Other
Mean Grade
Standard Deviation
Radiation Number 0 3 3 2 1 2.125Therapy
% 0.0 33.3 33.3 22.2 11.1 0.835
Clinical Number 1 0 1 0 7 3.500Practice IV
% 11.1 0.0 11.1 0.0 77.8 0.707
English Number 0 2 5 1 1 2.125Composition
% 0.0 22.2 55.6 11.1 11.1 0.641
258

Table RC-12
Graduates' perception of course componentas best preparation for each section ofNew York State Licensing Examination
231
Section Labs Material Assignments Exams Seminars Lectures Discussion
Radiographic Number 4 2 0 0 1 0 1Techniques
50.0 25.0 0.0 0.0 12.5 0.0 12.5
Standard Number 4 0 0 1 1 1 2Positioning
44.4 0.0 0.0 11.1 11.1 11.1 22.2
Anatomy/ Number 2 2 2 0 1 0 2Physiology
22.2 22.2 22.2 0.0 11.1 0.0 22.2
X-Ray Number 1 2 1 1 1 1 2Physics
11.1 22.2 11.1 11.1 11.1 11.1 22.2
Radiation Number 0 3 2 0 0 2 1Therapy
% 0.0 37.5 25.0 0.0 0.0 25.0 12.5
tSpecial Number 1 3 1 0 0 2 1Procedures
% 12.5 37.5 12.5 0.0 0.0 25.0 12.5
General Number 1 3 1 1 0 2 0Physics
12.5 37.5 12.5 12.5 0.0 25.0 0.0
Therapy Number 1 2 0 1 1 2 0
14.3 28.6 0.0 14.3 14.3 28.6 0.0
259

232
Table RC-13
Graduates' perception of Career Learninginstructors' help as preparation for eachsection of the New York State LicensingExamination
Section Excellent Good Good Fair Poor
Radiographic Number 1 5 3 0 0
Techniques11.1 55.6 33.3 0.0 0.0
Standard Number 4 1 4 0
Positioning44.4 11.1 44.4 0.0 0.0
Anatomy/ Number 6 1 1 1
Physiology66.7 11.1 11.1 11.1 0.0
X-Ray Number 3 1 3 1 1
Physics33.3 11.1 33.3 11.1 11.1
Radiation Number 1 2 3 2 1
Therapy11.1 22.2 33.3 22.2 11.1
Special Number 1 1 3 2 2
Procedures11.1 11.1 33.3 22.2 22.2
General Number 0 3 2 2 2
Physics0.0 33.3 22.2 22.2 22.2
Therapy Number 0 2 5 2
0.0 22.2 55.6 22.2 0.0
260
1

233
Table RC-14
Graduates' perception of teaching strategyas best preparation for each section of NewYork State Licensing Examination
Section
subjectmatterstressed
Method ofpresentationof material
Responseto questions
Teachers' Individualcomments assistance
Teachingaids
Radiographic Number 5 1 1 1
Techniques55.6 11.1 11.1 11.1 0.0 0.0
Standard Number 4 1 0 0 2 2
Positioning44.4 11.1 0.0 0.0 22.2 22.2
Anatomy! Number 3 4 1 1 0 0
Physiology33.3 44.4 11.1 11.1 0.0 0.0
X-Ray Number 4 1 0 2 1 0
Physics50.0 12.5 0.0 25.0 12.5 0.0
Radiation Number 1 2 2 3 0 0
Therapy12.5 25.0 25.0, 37.5 0.0 0.0
Special Number 2 2 2 1 1 0
Procedures25.5 25.5 25.5 12.5 12.5 0.0
General Number 1 4 0 3 0 0
Physics12.5 50.0 0.0 37.5 0.0 0.0
Therapy Number 1 3 0 3 1
12.5 37.5 0.0 37.5 12.5 0.0
261

234
Table RC-15 .
Graduates' perception of their N.Y.C.C.C.curriculum as preparation for New YorkState licensing Examination
VeryGraduates Excellent Good Good Fair Poor
Number 1 4 3 1 0
Percent 11.1 44.4 33.3 11.1 0.0
262

235
Table RC-16
Graduates' perception of N.Y.C.C.C.as preparation for each section of NewYork State Licensing Examination
Section Excellent Good Adequate Poor
VeryPoor
Radiographic Number 1 5 3
Techniques11.1 55.6 33.3 0.0 0.0
Standard Number 3 3 3 0 0
Positioning33.3 33.3 33.3 0.0 0.0
Anatomy/ Number 5 2 1 1 0
Physiology55.6 22.2 11.1 11.1 0.0
X-Ray Number 1 2 5 0 1
Physics11.1 22.2 55.6 0.0 11.1
Radiation Number 0 3 4 1 1
Therapy0.0 33.3 44.4 11.1 11.1
Special Number 0 3 2 2 2
Procedures0.0 33.3 22.2 22.2 22.2
General. Number 0 3 4 2 0
Physics0.0 33.3 4434 22.2 0.0
Therapy Number 0 2 3 2 2
0.0 22.2 33.3 22.2 22.2
263

236
Faculty Analysis Section
261

237
One component of the evaluation of the Allied Health Learning Division
of ftw York City Community College is an analysis of the faculty, its
perceptions, and its instructional methods and techniques. This section
of the report of the evaluation considers these factors. The section
is divided into three main subsections:
I. The Faculty
II. Faculty Perceptions
III. Instructional Methods and Techniques.
Subsection I provides an analysis of the faculty by department, position,
rank, tenure, length of service and prior teaching experience. Number
of respondents and percentages are provided where applicable.
Subsection II analyzes faculty perceptions of their department and
their students prior to open admissions and currently as well as their
perceptions of certification/licensure examination importance, impact
of student evaluations on instructional practices, graduates, and
examination cheating.
Subsection III is an analysis of current teaching loads for various
instructional activities and extent of use of selected instructional
techniques.
265

I. The Faculty
238
Ninety-three faculty members responded to the questionnaire circulated
to obtain data on which this study is based. Faculty were divided by
department as shown in Table F-1.
To further determine the composition of faculty respondents, faculty
were subdivided by Position, Rank, Tenure, Length of Service, and Prior
Teaching Experience. The results of this subdivision are shown in
Tables F-2 through F-6. It can be seen from Table F-2 that only four
adjunct faculty responded to the questionnaire. Analysis by position,
therefore, will not be attempted. Table F-3 shows a normal distribution
of faculty by rank; Table F-4 shows an even distribution of faculty by
tenure.
Table F-5 showing length of service at N.Y.C.C.C. by department also
provides the data to determine that mean length of service is 8.69 years
with a standard deviation of 7.5 years. Median length of service is
6.67 years, while maximum is 28 years. Table F-6 provides the data
to determine that mean prior teaching experience is 4.95 years with a
standard deviation of 6.49 years. Median prior teaching experience is
3.08 years, and maximum is 39 years.
266

239
II. Faculty Perceptions
One of the primary purposes of this inquiry was to examine faculty
perceptions of their department, their students, the relative importance
of licensure/certification (if applicable), and the effects of student
evaluation on selected areas of instruction. Faculty were also asked
their perceptions of certain factors both before and after open admission.
Faculty perceptions have been tabulated and are presented below.
Faculty perceptions of the academic quality of their department, by
department, are shown in Tables F-7 and F-8. It can be seen from these
two tables that with the exception of the Dental Laboratory and Nursing
departments, faculty perceive the academic quality of their departments
as having increased since the advent of open admissions. Considering
the division as a whole, and eliminating "No Response" category, the
percentage of the division responding "Very High" and "High" was 60.2%
for perception of academic quality prior to open admissions and 60.0%
currently. When analyzed by rank, faculty perception of their depart-
ments was evenly dispersed across rank by category.
Tables F-9 through F-11 outline faculty perceptions of academic quality
of students prior to open admissions and currently. It is immediately
apparent from these tables that there is considerable difference in the
perceived academic quality of students by faculty when grouped by
department.- Prior to open admissions 0.0 percent of Chemical Technology
faculty perceived their students as "Very High" or "High" and 83.3%
267

240
perceived their students as "Average". During this same period 58.4% .
of Dental Hygiene faculty perceived their students as "Very High" or
"High" and 40% of Nursing faculty perceived their students as "Very High"
or "High". In this same period only 8.6% of faculty of the Division
perceived their students' academic quality as "Low" and none perceived
their students'as "Very Low."
There is virtually no change in faculty perceptions of academic quality
of students between the period prior to open admissions and the present,
both by department subdivision and the division as a whole. Forty-seven
percent of division faculty perceived their students to be of "Average"
academic quality prior to open admissions and 46.2% currently. There
is, however, a significant difference in perceptions of current regular
students and open admi sions students. Tables F-9 and F-10 show that
division faculty perceive the percentage of current regular students
rated "Low" and "Very Low" in academic quality to be 15.1%; the percen-
tage of current open admissions students perceived in the same categories
is'56.0%. Only 25.8% of open admissions students are perceived as
"Average" or "High," while 66.4% of current regular students are perceived
as being in these quality categories. Most departments follow the division
percentages with the exception of Opthalmic Dispensing and Radiologic
Technology. The percentage of Opthalmic Dispensing faculty to perceive
the academic quality of their students to be "Average" or "High" is
71.4%. The percentage of Radiologic Technology faculty to respond to
the same categories is 0.0%.
268

241
To determine faculty perceptions of students completing their program
and graduates of the Allied Health Division, faculty were asked to respond
to questions soliciting this information. Their responses, by department,
are tabulated in Tables F-12 and F-13. It can be seen that almost all
faculty of Chemical Technology, Dental Hygiene, Dental Laboratory and
Medical Laboratory perceive less than 26% of their advanced students to
be without adequate preparation, but only 33.3% of the Nursing faculty,
57.2% of the Opthalmic Dispensing Faculty and 60% of the Radiologic
Technology faculty perceive the same percentage of unpreparedness to
be true. Fifty-eight percent of the Nursing faculty perceive the
unprepared percentage of their students to be between 26% and 100%.
Similar results can be seen in Table F-13 which indicates 91.7% of
Chemical Technology faculty and 100.0% of Dental Hygiene and Medical
Laboratory faculty perceive their graduates to possess necessary know-
ledge and skill for satisfactory job performance while only 66.7% of
Nursing faculty perceive this to be true.
Faculty perceptions of the importance of passing the certification/
licensure examination are shown in Table F-14. For those departments
whose students must pass a certification/licensing examination prior to
obtaining employment in their discipline there is unanimity in the
perception that passing the examination is "Extremely" or "Very" important.
When queried as to the importance of passing or obtaining a high score
in the examination, 81.0% of those respondents from departments whose
students must take certification/licensing examinations indicated that
"Passing" was most important; only 19.0% perceived "Obtaining eHigh
269

242
Score" to be most important.
The number and percentage of faculty by department, perceiving any effect
of student evaluation on selected instructional components is Shown in
Table F-15. It can be seen that faculty of Chemical Technology and
Dental Laboratory perceive almost no influence of student evaluation while
other departments perceive increasing influence in varying degrees.
Overall, the division appears to perceive the maximum influence affecting
lectures and laboratories; the least affecting seminars and grading. When
subdivided by condition of tenure, a statistically significant difference
appears between non - tenured and tenured faculty in their perception of
effect of student evaluation on lectures, laboratories, and testing. These
results are displayed in Table F-16.
The occurrence of cheating on examinations as perceived by faculty is
shown in Table F-17. It is apparent that most of the division faculty,
92.5%, perceive cheating occurs "Rarely" or "Sometimes." There is very
little discrepancy by department from the overall division perceptions.
Faculty were asked to provide their comments and opinions of weaknesses
in the Allied Health program, the manner in which students can be better
served by their department, and perceptions of open admissions students.
Many comments in the first two categories overlapped and will be grouped
for synthesis:
Unprepared students are being admitted
Laboratory classes are too large
270

243
Program should be brought up to industry currency
More equipment needed
Laboratory/clinic hours inappropriate
Insufficient clinical experience for students
Department standards should be raised.
The above comments were repeated many times in various ways as were those
related to open admissions students:
Inability to read
Extremely poor academic background
Lack of basic skills.
271

244
III. Instructional Methods and Techniques
An analysis of the relative amount of time spent in various instructional
functions teaching general course related materials, as opposed to
teaching specifically for the certification/licensure examination, was
made. The results, by teaching function, cross tabulated by department,
are shown in Tables F-18 through F-29. The results of this analysis
indicate that a significant number of faculty do not utilize seminars or
individualized instruction at any time, nor laboratory or evaluation
techniques when teaching specifically toward the certification/licensure
examinations. The faculty was further subdivided by rank and tenure to
determine whether any significant differences in time spent in various
instructional functions were related to these variables. When subdivided
by tenure, no differences were found. The results of the subdivision by
rank are shown in Tables F-30 through F-41. It can be seen in these tables
that faculty with the rank of Professor do not use seminars for any
instructional function, whereas other faculty make some use of this
instructional technique. It can also be seen that considerable portion
of the faculty indicate they spend no time on evaluation and testing
for any instructional function.
The extensiveness of use of several other instructional techniques was
investigated including:
Pass/Fail examinations
Curve grading
Behavioral Objectives
272

245
Individualized instruction
Audio/visual media
The results of this investigation divided by department are shown in
Tables F-42 through F-46. From these tables it can be seen that there
is a wide disparity in the use of all the instructional techniques listed,
except individualized instruction, by department. Pass/fail examinations
are never used by Chemical Technology and Radiologic Technology depart-
ments but are used in varying degrees by up to 50% of other departments.
Curve grading is never used by Radiologic Technology but is used in varying
degrees by up to 100% of other departments. Behavioral objectives are
used "Always" or "Usually" oy 100% of the Nursing department and 91% of
the Dental Hygiene department but in decreasing amounts to 24% of the
Chemical Technology department. Audio/visual media are used "Always" or
"Usually" by 80% of the Radiologic Technology department and in decreasing
amounts to 0.0% for the Opthalmic Dispensing department for the same
category responses. This should not suggest that the Opthalmic Dispensing
department does not utilize audio/visual media -- 71% of the department
indicate they use audio/visual media "Sometimes" -- the prior figures
pertain only to the "Always" and "Usually" responses.
To further investigate the patterns of use of the selected instructional
techniques the faculty responses were divided by rank. The results are
presented in Tables F-47 through F-51. These tables show that the use
of the specified instructional techniques is relatively evenly dispersed
-across rank by response category. There are no si'gni'ficant exceptions
to the response patterns.
273

246
Table F-1
Faculty Respondentsby Department
Chemical Dental Dental Medical Opthalmic RadiologicDepartment Technology Hygiene Lab Lab Nursing Dispensing Technology Total
Number ofrespondents 12 12 6 20 31 7 5 93
Percentage ofrespondents 12.9 12.9 6.5 21.5 33.3 7.5 5.4 100.0
274

247
Table F-2
Faculty Positionby Department
DepartmentChemical
TechnologyDental
HygieneDental
LabMedical
Lab NursingOpthalmicDispensing
RadiologicTechnology Total
Position:
Full time Number ofrespondents 12 11 6 20 31 5 4 89
Percent. ofrespondents 12.9 11.8 6.5 21.5 33.3 5.4 4.3 95.7
Adjunct Number ofrespondents 0 1 0 0 0 2 1 4
Percent. ofrespondents 0.0 1.1 0.0 0.0 0.0 2.2 1.1 4.3
27E

248
Table F-3
Faculty Rank by DepartMent
Department
Rank:Professor Number of
respondents
% of
respondents
Assoc. Number ofProfessor respondents
% of
respondents
Assist. Number ofProfessor respondents
% ofrespondents
Lecturer Number ofrespondents
% ofrespondents
Instructor Number ofrespondents
% ofrespondents
Percentage of total
-4 CI I" I"'" 3 =0 7- 4fl? W M III M Cn m ici = CT...I. in= a J. rt 0 e+= -a. ma' eu -1 01 ii n ...1.
0 el = .ma 120 ....11110 0,0 =....6 al ID rt et ... CI0 -el 0 0IC) "I ^5'IC 4C 4.0
a 0 .-1 7J -4.-..."0 M W D
ci. 0 ck. rt.13 = =" .." Oemop =O ...4
vii0 .....in 9 --e 0-a. ..a 0 10= 0 tta a
tial1 4C n
5 3 1 2 1 1 0 13
41.7 25.0 16.7 10.0 3.2 14.3 0.0 14.0*
3 4 2 3 3 1 1 17
25.0 33.3 33.3 15.0 9.7 14.3 20.0 18.3
4 2 1 7 14 2 2 32
33.3 16.7 16.7 35.0 45.2 28.6 40.0 34.4
0 1 0 2 9 2 2 16
0.0 8.3 0.0 10.0 29.0 28.6 40.0 17.2
0 2 2 6 4 1 0 15
0.0 16.7 33.3 30.0 12.9 14.3 0.0 16.2
276

249
Table
F-4
Faculty
Tenure
by
Department
Department
IDs
erg I- C:I l'
ID S C M
CI D
I
ID or
0 ID I Z CT Z
= a -+ rt o rio 0 ...
= --i 0 Or
-.5
cm -1 n
Oft = ....e
CV ....0
OP IL0 C
D
C+ et ...a
ICI
'1 'I
I< I< I<
C
Tenured
Number
of
respondents
12 7 3 7 12 3 1 45
% of
dept.
100.0
58.3
50.0
35.0
38.7
42.9
20.0
48.4*
Non-
Number
of
tenured
respondents
0 5 3 13
19 4 4 48
% of
dept.
0.0
41.7
50.0
65.0
61.3
57.1
80.0
51.6
Percentage
of
total
277

250
Table F-5
Faculty Length ofService by Department
Department
r- a r- = = 0 0 -4 73 -4121 fD 93.1 fD C -0.-0 M CU ooCT = CT 0. -S 111 c+ 0 0. e+c+ 0 -,. rn 1:1 z" = -1. a-s at -s n .... m a = o m..1W J W at = = J 0 JC+ c+ --1 U2 U a _... 0o o ..4. ..a 0 100 0U3 .1< 1< 10 4C
Length of Service:
1 year Number ofrespondents 0 1 1 5 1 0 1 9
% of
respondents 0.0 8.3 16.7 25.0 3.2 0.0 20.0 9.7*
2 years Number of
respondents 0 0 0 5 1 0 1 7
% ofrespondents 0.0 0.0 0.0 25.0 3.2 0.0 20.0 7.5
3-5 Number ofyears respondents 0 2 1 3 13 2 23
% ofrespondents 0.0 16.7 16.7 15.0 41.9 28.6 40.0 24.7
6-10 Number ofyears respondents 5 5 1 5 11 5 1 33
% ofrespondents 41.7 41.7 16.7 25.0 35.5 71.4 20.0 35.5
11-20 Number ofyears respondents 7 4 3 2 5 0 0 21
*
% ofrespondents 58.3 33.3 50.0 10.0 16.1 0.0 0.0 22.6
Percentage of total
278

Table F-6
Faculty Prior TeachingExperience by Department
Department
m
o no1<
251
fW tr-or Cl.0 J.-5AW Wri- --,0-544,C
4:-.
C-SW...c.0ua
LO Li'J.10W rt1,?row0 ...Iw aJ. J.l ia
A
.041M MCI 0.=r J.= 00 J.-.1 00440LO 164.4C A
0etMmmi
Prior Teaching Experience:
None Number ofrespondents: 1 5
% of dept. 8.3 41.7
1 year Number ofrespondents 2 0
% of dept. 16.7 0,0
2 years Number ofrespondents 2 3
% of dept. 16.7 25.0
3-5 years Number ofrespondents 2 3
% of dept. 16.7 25.0
6-10 years Number ofrespondents 4 1
% of dept. 33.3 8.3
11-18 years Number ofrespondents 1 0
% of dept. 8.3 O.0
Over 19 years Number ofrespondents 0 0
% of dept. 0.0 0.0
*Percentage of total
2
33.3
0
0.0
1
16.7
3
50.0
0
0.0
0
0.0
0
0.0
279
3 6 6 1 24
15.0 19.4 85.7 20.0 25.8*
3 2 0 1 8
15.0 6.5 0.0 20.0 8.6
3 2 0 0 11
15.0 6.5 0.0 0.0 11.8
1 9 1 0 19
5.0 29.0 14.3 0.0 20.4
4 9 0 1 19
20.0 29.0 0.0 20.0 20.4
4 2 0 0 7
20.0 6.5 0.0 0.0 . 7.5
2 1 0 2 5
10.0 3.2 0.0 40.0 5.4

252Table F-7
Faculty Perceptions of the academic quality oftheir department prior to open admissions bydepartment
.Perception --4 c--) 2 C7 r- 0 I- X Z 00 -.I77 11rD = ..< m cm m co m c -wo m cm o0 1 - ci cr =o ei.CT 0.0 -1. to
UI c+"CI s ? -I. 0)= -I. M 01 -.I 01 -.I 0 -o. M 0) = 0 ,./on =-i al .1 al 0) = =-a O-+-. 0) fD e ri. .1 U7 w 2 ...a 00 -.4 0 0 ...a I O CO0 ICI I
4.< '< 4.< tin 44 n
Very Number 0 4 2 8 1 0 0 15High
% of
dept. 0.0 33.3 33.3 40.0 3.2 0.0 0.0 16.1/20.5*
High Number 6 6 0 5 8 3 1 29
% ofdept. 50.0 50.0 0.0 25.0 25.0 42.9 20.0 31.2/39.7
Average Number 5 1 1 0 16 4 2 29
% ofdept. 41.7 8.3 16.7 0.0 51.6 57.1 40.0 31.2/39.7
Low Number 0 0 0 0 0 0 0 0
% ofdept. 0.0 0.0 0.0 0.0 0.0 0.0 0.0 0.0
Very Number 0 0 0 0 0 0 0 0Low
% ofdept. 0.0 0.0 0.0 0.0 0.0 0.0 0.0 0.0
No Number 1 1 3 7 6 0 2 20Response
% ofdept. 8.3 8.3 50.0 35.0 19.4 0.0 40.0 21.5
*Percentage of total/Percentage of responses
280
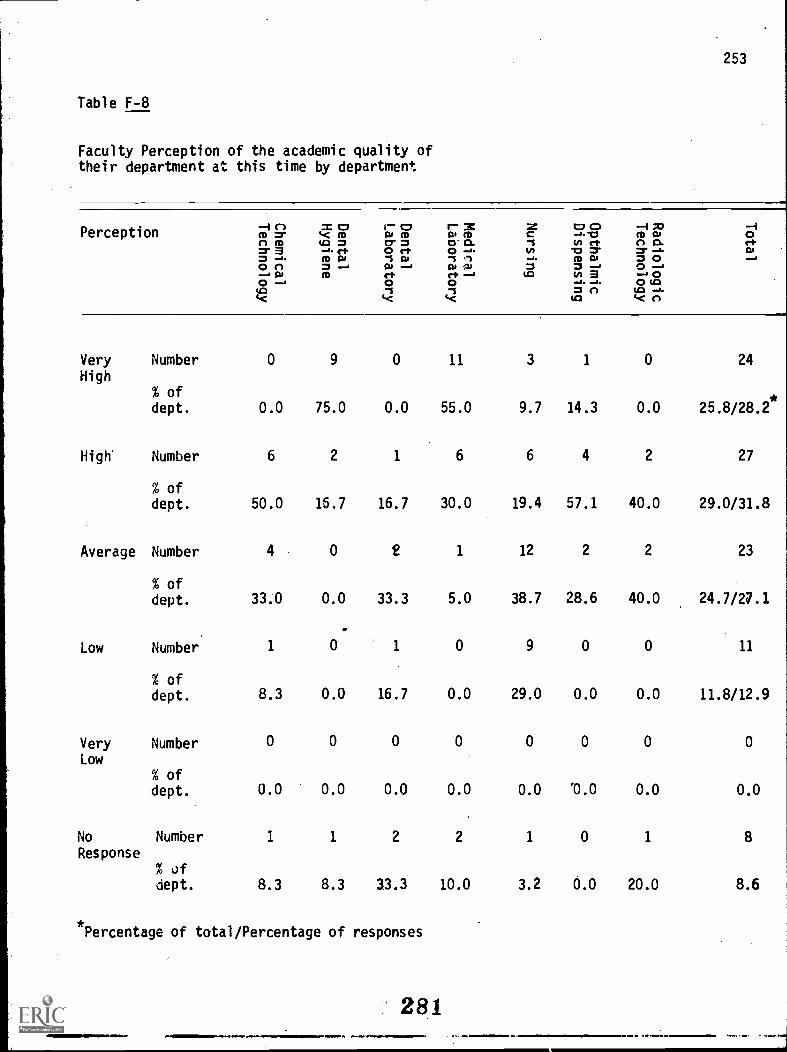
253
Table F-8
Faculty Perception of the academic quality oftheir department at this time by department
Perception-4 CI =: CD r- 0m cr kic m us mn o ua m o- == a .... c+ o 0-a -h m us -1 uson a-' W ..... o 0 et0 - 0ua -sJ. c<
r- Xw mo' CL0 6-s .1W0)C+ ."0-sc<
2r.c"I0_..
=ua
0 0-8.100 ct13 ra-m us= Jta a.... ..A.= nua
-4 MIm us0 Cl= -J.m o0 .....1_. 0C) (13ua -6t.c n
-Iortus-.
Very Number 0 9 0 11 3 1 0 24
High% ofdept. 0.0 75.0 0.0 55.0 9.7 14.3 0.0 25.8/28.2*
High' Number 6 2 1 6 6 4 2 27
% ofdept. 50.0 16.7 16.7 30.0 19.4 57.1 40.0 29.0/31.8
Average Number 4 0 2 1 12 2 2 23
% ofdept. 33.0 0.0 33.3 5.0 38.7 28.6 40.0 24.7/27.1
Low Number 1 0 1 0 9 0 0 11
% ofdept. 8.3 0.0 16.7 0.0 29.0 0.0 0.0 11.8/12.9
Very Number 0 0 0 0 0 0 0 0
Low% ofdept. 0.0 0.0 0.0 0.0 0.0 '0.0 0.0 0.0
No Number 1 1 2 2 1 0 1 8
Response% ofdept. 8.3 8.3 3.3.3 10.0 3.2 0.0 20.0 8.6
*Percentage of total/Percentage of responses
ON.**
281

254
Table F-9
Faculty Perception of academic quality ofstudents prior to open admissions by department
Perception- 4 Cl 2 C7 r--. o r- x ZE C7 CD -4 70 -iM l.r t< m w M W M C -6-0 M W 00 ua =
_,. c+or =0 rh
Cr 0-0 -.I. IA
"SLT
0 rh17
m a -I a -I 0 -. m a0 0 = --; as 4 W W = = "..4
4411) m rh rh --a 647 W 30 -a
4.
04,C
04,C
0
Very Number 0 2 0 3 0 0
High% ofdept. 0.0 16.7 0.0 15.0 0.0 0.0
High Number 0 5 2 5 2 2
% ofdept. 0.0 41.7 33.3 25.0 6.5 28.6
Average Number 10 4 5 17 5
% ofdept. 83.3 33.3 16.7 25.0 54.8 71.4
Low Number 1 0 0 0 7 0
% ofdept. 8.3 0.0 0.0 0.0 22.6 0.0
Very Number 0 0 0 0 0 0Low
% ofdept. 0.0 0.0 0.0 0.0 0.0 0.0
No Number 1 1 3 7 5 0
Response% ofdept. 8.3 8.3 50.0 35.0 16.1 0.0
*Percentage of total
282
0-0=r -.I.
c+a
= 0 _a0 o- 00 (.0
J.647
I< 0
0 5
0.0 5.4
1 17
20.0 18.3
2 44
40.0 47.3
0 8
0.0 8.6
0 0
0.0 0.0
2 19
40.0 20.4

255
Table F-10
Faculty Perception of academic qualityof current regular students by department
Perception (D--1 el x 0 r- 0 r. z7' G M 0 M 0) fD41 fD (0 = CT = CT 0.= 3 -J. c+ o c+ o -a.= -... M A) -"S 0 -"S 0o 41 m 61 a, ._, a cu...a as fD et et -)
zC"Tw...o.=
tCt
c2 0...w0111 etv =fD 0= J111 a
--I X)M 041 0.= -a.= 00 J../I 0
I0eta-oO 0 0 wok =1 0 tCt0 tCt ....
I< n
Very NumberHigh
% ofdept.
0
0.0
High Number 1
% of 8.3dept.
Average Number
% ofdept.
7
58.3
Low Number 3
% of 25.0dept.
Very Number 0Low
% of 0.0dept.
No Number 1
Response% of 8.3dept.
*Pettentage of total
4 0 1 0 1 0 6
*33.3 0.0 5.0 0.0 14.3 0.0 6.5
6 0 7 1 3 1 19
50.0 0.0 35.0 3.2 42.9 20.0 20.4
2 3 8 18 2 3 43
16.7 50.0 40.0 58.1 28.6 60.0 46.2
0 0 2 8 1 0 14
0.0 0.0 10:0 25.8 14.3 0.0 15.1
0 0 0 0 0 0 0
0.0 0.0 0.0 0.0 0.0 0.0 0.0
0 3 2 4 0 1 11
0.0 50.0 10.0 12.9 0.0 20.0 11.8
283

Table F-11 256
Faculty Perception of academic quality ofcurrent open admissions students bydepartment
Perception -4(1 3:C2 r-c, r-:c ze C70 .-470 .--1
:4 M4.< fDCI = 131 fD
Cr =Di fDCr O.
.0, -I. 'CIVI et (D 1:11
el Ct. 0et7' 11. et 0 et 0 ...a. W 3:1 ? = -1. 0(Da '1 1:11 '1 0 -a. fD- DI =o .......O 0 0 ..-4 ai ...a 0 0 .= = ...a o ...a...a ai ID et et ...a la (A 3 ....1 0O .....4 0 0 -a. ...s. 0 CI
la= CI 10 aC 4C 4..0 (IC
Very NumberHigh
% ofdept.
High Number
% ofdept.
Average Number
% ofdept.
Low Number
% ofdept. .
Very NumberLow
% ofdept.
No NumberResponse
% ofdept.
0
0.0
1
8.3
2
16.7
6
50.0
2
16.7
1
8.3
0
0.0
0
0.0
3
25.0
.
2
16.7
ro
0
0.0
7
58.3
0
0.0
0
0.0
2
33.3
2
33.3
1
16.7
1
16.7
0
0.0
1
5.0
4
20.0
12
60.0
1
5.0
2
10.0
0
0.0
0
0.0
6
19.4
17
54.8
4
12.9
4
12.9
0
0.0
1
14.3
4
57.1
1
14.3
1
14.3
0
0.0
0
0.0
0
0.0
0
0.0
2
40.0
1
20.0
2
40.0
0
0.0*
3
3.2
21
22.6
42
45.2
10
10.8
17
18.3
Percentage of total
281MEM. ...MVO

257
Table F-12
Faculty Perception of percentage ofadvanced students without necessaryknowledge or skills by department
Percentage
--I CI 2 CIID 7" 4.( 0 0; F t 7, fo tD 4.0 Z= a ....,.. o irib o -..= ...... ID or ..s al -1 non Z ...41 $21 -a 121 al=mil CM (1) et et. --Ato ..-6 0 0
UZI 'I 'I
0% Number 3 6 0
% ofdept. 25.0 50.0 0.0
1-10% Number 4 5 4
% ofdept. 33.3 41.7 66.7
11-25% Number 2 0 1
% ofdept. 16.7 0.0 16.7
26-50% Number 2 0 0
% ofdept. 16.7 0.0 0.0
51-75% Number 0 0 0
% ofdept. 0.0 0.0 0.0
76-100% Number 0 0 0
% ofdept. 0.0 0.0 0.0
No. Number 1 1 1Response
% ofdept. 8.3 8.3 16.7
=c'Im-ii.=
UZI
C:0 CD
m goZ ....a1/1 a.... -I.Z CI
(CI
-1 7r). .n CL=--..= 0-0 -.a....a 00 tO
4.0 .naI<
..4.riamosi
4 0 0 0 3
20.0 0.0 0.0 0.0 3.2
9 3 2 2 4
45.0 9.7 28.6 40.0 4.3
5 7 2 1 19
25.0 22.6 28.6 20.0 20.4
2 13 1 1 18
10.0 41.9 14.3 20.0 19.4
0 2 2 0 29
0.0 6.5 28.6 0.0 31.2
0 3 0 0 13
0.0 9.7 0.0 0.0 13.9
0 3 0 1 6
0.0 9.7 0.0 20.0 6.5
'285

258
Table F-13
Faculty Perception of AHD graduates withnecessary knowledge and skill for satis-factory job performance, by department
Perception Chemical Dental ' Dental Medical Opthalmic RadiologicTechnology Hygiene Lab Lab Nursing Dispensing Technology Total
Number 11 12 4 20 21 6 4 78
Percentageof dept. 91.7 100.0 66.7 100.0 67.7 85.7 80.0 83.9
236

259
Table F-14
Faculty Perception of importance ofpassing certification/licensure examination
by department
Perception
c-)CD 7'cg. g
0
xv4 CD
CD CM
CD
ryC1P CDcr zo
CIP
r3Pi fp0.co nC1P C1Pet 01
Z 0 01/1"0 7'CD CIP
01In 3
-173CIP0 0--4*00 01w
(< 0
-10et
Extremely numberImportant
% ofdept.
Very Number
Important% ofdept.
Important Number
% ofdept.
Unimpor- Numbertant
% ofdept.
Not NumberApplicable
% ofdept.
0
0.0
0
0.0
0
0.0
0
0.0
12
100.0
12
100.0
0
0.0
0
0.0
0
0.0
0
0.0
1
16.7
0
0.0
3
50.0
1
16.7
1
16.7
11
55.0
4
20.0
5
25.0
0
0.0
0
0.0
28
90.2
3
9.8
0
0.0
0
0.0
0
0.0
5
71.4
2
28.6
0
0.0
0
0.0
0
0.0
5
100.0
0
0.0
0
0.0
0
0.0
0
0.0
62
66.7/84.7*
9
9.7/12.5
8
8.6/6.9
1
1.1/0.0
13
13.9/0.0
Certification/licensing not applicable
**Percentage of total/percentage of certification/licensure department total
287

260
Table F-15
Faculty perceiving influence ofstudent evaluation on selectedinstructional components by department
Component
-I (-) = cv a = a a -I 73 -ICD 7' 4.4 M OA m ra-, w c .......0 0 0, 0CI M (0 7 0 A 0- 0. -5 0 et 0 0. r S.= 3 owls cp 0 ....16 W 'a ? 7' -4. W= -e. M DA -S DA '1 CI -o. M W = 0 -a0 0 = -a cy -.a W W 7 = -a 0 Il....1 p, m 0. 0 -, 40 r, g 008o.-.. 0 oU3 -% n4.< ,..c
'I4.< U3 4C n
Lectures Number 0 5 0 10 12 4 3 34
% of 0.0 41.7 0.0 50.0 38.7 57.1 60.0 36.6dept.
Seminars Number 0 1 0 2 4 1 0 8
% of 0.0 8.3 0.0 10.0 12.9 14.3 0.0 8.6dept.
Labora- Number 0 6 0 9 8 4 2 29tories
% of 0.0 50.0 0.0 45.0 25.8 57.1 40.0 31.2dept.
Testing Number 0 2 0 6 7 1 3 19
4 of 0,0 16.7 0.0 30.0 22.6 14.3 60.0 20.422.crept.
Grading Number 2 0 1 3 3 1 1 11
% of 16.7 0.0 16.7 15.0 9.7 14.3 20.0 11.8dept.
Individ. NumberAssistance
% ofdept.
1 3 0 7 9 2 0 22
8.3 25.0 0.0 35.0 29.0 28.6 0.0 23.7
288

261
Table F-16
Faculty perceiving influence of studentevaluation on selected instructionalcomponents by tenure
Component Tenured Non-tenured
Lectures Number 13 21*
% ofcondition
28.9 43.8
Seminars Number 4 4
% ofcondition
8.9 8.3
Labora- Numbertories
% ofcondition
9
20.0
20*
41.7
Testing Number 7 12*
% ofcondition
15.6 25.5
Grading Number 6 5
% ofcondition
13.3 10.4
Individ. Number 11 11Assistance
% of
condition24.4 22.9
*
Chi Square P < .02
289

2E2
Table F-17
Faculty Perception of occurrence ofcheating on examinations, by department
Occurrence
Always Number 0
% of 0.0dept.
Usually Number 0
% of 0.0dept.
Sometimes Number 5
% of 41.7
dept.
Rarely Number 7
% of 58.3dept.
Never Number 0
% of 0.0dept.
No Response Number 0
of 0.0dept.
'.< fD CUr-
fl)LO = Q'=...J. c+ 0 C+fD 0) -I 0= -a or -Im c+ rr J
o o
r- 3W M0" CIL0 ...., e)0 0
C'IVI...J.Z
Cf CD...J. -pI-aM c+
="fD DI= J
-f 70M W<1S CL
-J.= 00 J
--I0Oh01
4.0 IA S .....100 f.0
4.0 '.< 0
0 0 0 1 0 0 1
0.0 0.0 0.0 3.2 0.0 0.0 1.1
0 1 1 0 0 0 2
0.0 16.7 5.0 0.0 0.0 0.0 2.2
10 0 11 2 6 2 54
83.3 0.0 55.0 6.4 85.7 40.0 58.1
2 3 7 9 1 3 32
16.7 50.0 35.0 29.0 14.3 60.0 34.4
0 0 1 0 0 0 1
0.0 0.0 5.0 0.0 0.0 0.0 1.1
0 2 0 1 0 0 3
0.0 33.3 0.0 3.2 0.0 0.0 3.2
290

263
Table F-18
Relative faculty use of lecturesfor general course material bydepartment
Percentage ofTeaching Load
--4 c--) = c) r- ci r3 z v0 -ix/ -1t< m am am c -6-0 ma o(r1 I to..c cif
CT =0 rf cr o.O -11.-sv)
in ci--o = =r, cl..--1.
c-s-a= - ma -s sa) -s r) ...h m cu o0 ......o r, o...., a, -a as CU = o-4 0 ,.....a-a ci) e et ch--, lia o a _l 00 -J 0
0% Number 2 6 0
of 16.7 50.0 0.0dept.
1-25% Number 0 1 5
% of 0.0 8.3 83.3dept.
26-50% Number 7 5 0
% of 58.3 41.7 0.0dept.
51-75% Number 3 0 0
% of 25.0 0.0 0.0dept.
76-100% Number 0 0 1
% of 0.0 0.0 16.7dept.
Percentage of total
0 0 10
3 6 0 3 20
15.0 19.4 0.0 60.6 21.5*
1 121
0 20
5.0 38.7 14.3 0.0 21.5
11 13 1, 0 37
55.0 41.9 14.3 0.0 39.8
5 0 2 1 11
25.0 0.0 28.6 20.0 11.8
0 0 3 1 5
0.0 0.0 42.9 20.0 5.4
291

264
Table F-19
Relative faculty use of lecturesfor specific certification exammaterial by department
Percentage ofTeaching Load
--I c-) =a r- a r3 z a a -i70 -IfD 7' '.< M cu CD D.I CD C ..."1.3 (D Di 00 1p ICI Z..16 rt Cr Z0 rh o 0. , W rt-.0 = 0 0.= rt.= J. M 0 .1 0 , 0 ...I. M 0 = 0 Jo0 =-.' 0J as = =-r 0-.1J DJ fD rt. rt --I CO 0 a ....I 00 ...... 0 0 0 4.0J.
0% Number 12 10 5 18 30 4 5 84
% of 100.0 83.3 83.3 90.0 96.8 51.1 100.0 90.3*dept.
1-25% Number 0 1 1 1 0 1 0 4
% of 0.0 8.3 16.7 5.0 0.0 14.3 0.0 4.3dept.
26-50% Number 0 1 0 0 0 0 0 1
% of 0.0 8.3 0.0 0.0 0.0 0.0 0.0 1.1dept.
51-75% Number 0 0 0 1 0 0 0 1
% of 0.0 0.0 0.0 5.0 0.0 0.0 0.0 1.1dept.
76-100% Number 0 0 0 0 1 2 0 3
% of 0.0 0.0 0.0 0.0 3.2 28.6 0.0 3.2dept.
Percentage of total
292.

265
Table F-20
Relative faculty use of seminars forgeneral course material by department
Percentage ofTeaching Load
-i r) =D r- P r3 z D0 -I 7J -.-i
A."( CDUZI =
DI mCT =
DI CDCT C.
C-S
. 13111 ri fD Do
0 Cl.oet
7- ...t. rt 0 eh 0 -6. vb -0 = = -,. a0 0 = ....-a 0,1 .....1 0) 00 = = J 0. ...II 0) m C+ rt. I UZI w a - o0 ....., 0 0 ....,. ...,. o UZI
0% Number 12 11 6 17 22 7 5 80*
% of 100.0 91.7 100.0 85.0 71.0 100.0 100.0 86.0
dept.
1-25% Number 0 1 0 3 9 0 0 13
% of 0.0 8.3 0.0 15.0 29.0 0.0 0.0 14.0
dept.
26-50% Number 0 0 0 0 0 0 0 0
% of 0.0 0.0 0.0 0.0 0.0 0.0 0.0 0.0
dept.
51-75% Number 0 0 0 0 0 0 0 0
% of 0.0 0.0 0.0 0.0 0.0 0.0 0.0 0.0
dept.
76-100% Number 0 0 0 0 0 0 0 0
% of 0.0 0.0 0.0 0.0 0.0 0.0 0.0 0.0
dept.
Percentage of total
293

266Table F-21
Relative faculty use of seminarsfor specific certification exammaterial by department
Percentage ofTeaching Load
--ICI SD (-O r3 2 0 0 -4 PD -Im .1-r i< m o m 0 m c .. -0 m 0 o0 m to = a, = ar CL 'S 0 el. 0 0. rt3- a ..A ct 0 rt 0 -I. 0 '0 3' mr .... tzu= -.. (D 0 -s 0 -s n -.. m of = 0 -'0 0 = -, 0 -.a o 0 = = A 0 ...a40 M rt rh -I (0 0 a -. 00 -, 0 0 0 cao
-I = 0 tO A.t< l< t< (.0 (< 0
0% Number 12 12 6 19 31 6 5 91
% of 100.0 100.0 100.0 95.0 100.0 85.7 100.0 97.8*dept.
1-25% Number 0 0 0 1 0 0 0 1
% of 0.0 0.0 0.0 5.0 0.0 0.0 0.0 1.1dept.
26-50% Number 0 0 0 0 0 1 0 1
% of 0.0 0.0 0.0 0.0 0.0 14.3 0.0 1.1dept.
51-75% Number 0 0 0 0 0 0 0 0
% of 0.0 0.0 0.0 0.0 0.0 0.0 0.0 0.0dept.
76-100% Number 0 0 0 0 0 0 0 0
% of 0.0 0.0 0.0 0.0 0.0 0.0 0.0 0.0dept.
*Percentage of total
261

267
Table F-22
Relative faculty use of laboratoryfor general course material bydepartment
Percentage ofTeaching Load
r-00) m0- =o e.-1 aal JCI'0.1t<
r- m0) m0- a.o --s n110 110
CI' '...10
''S
I.<
zc-Ius......=la
DO--h-ous e.-o =m a=-J0 a..I. J.
= nta
--; xim0.n a.=- -4.= 00 --..... 00 tata nc
-1oe.aJ
0% Number 2 1
% of 16.7 8.3dept.
1-25% Number 0 0
% of 0.0 0.0dept.
26-50% Number 7 2
% of 58.3 16.7dept.
51-75% Number 3 5
% of 25.0 41.7dept.
76-100% Number 0 4
% of 0.0 33.3dept.
41111
1 2 3 3 3 15
16.7 10.0 9.7 42.9 60.0 16.1
1 3 0 1 2 7
16.7 15.0 0.0 14.3 40.0 7.5
2 12 11 2 0 36
33.3 60.0 35.5 28.6 0.0 38.7
1 2 11 1 0 23
16.7 10.0 35.5 14.3 0.0 24.7
1 1 6 0 0 12
16.7 5.0 19.4 0.0 0.0 12.9
29

268
Table F-23
Relative faculty use of laboratoryfor specific certification exammaterial by department
Percentage ofTeaching Load
-i C") = CD r- CD r x ZE C, CD -1 ;D. --Im LT ,...c m am am c --...o m a, oSm 4.0 D 0' Z Cr CL -1 W et- 0 CL e,=- a -4. 44- o ri. 0 -8. W 77 LT 7" -a. 0= J. M W -I W -I 0 J. M W = 0 40 0 = 4 W 4 W W = = .m4 o.......4 W M0 -4 0 0 J. J. 0 4J0
J.4..0 1< 1,..t 4.0 ,4c 0
0% Number
% ofdept.
12 7 6 19 31 6 5 86
100.0 58.3 100.0 95.0 100.0 85.7 100.0 92.5
1-25% Number 0 0 0 0 0 0 0 0
% of 0.0 0.0 0.0 0.0 0.0 0.0 0.0 0.0dept.
26-50% Number 0 1 0 1 0 1 0 3
% of 0.0 8.3 0.0 5.0 0.0 14.3 0.0 3.2dept.
51-75% Number 0 1
% of 0.0 8.3 0.0 0.0 0.0 0.0 0.0 1.1dept.
76-100% Number 0 3 0 0 0 0 0 3
% of 0.0 25.0 0.0 0.0 0.0 0.0 0.0 3.2dept.
g'9

269
Table F-24
Relative faculty use of individualizedinstruction for general course materialby department
Percentage ofTeaching Load
e-I r-) s7' I.< a$ al a$0 a$ 4.0 7 CT 7=- a -- e+ 0 cf.= ..1. M W ''S fil0 n m ...... W a. a, m r+0 ....I 0
UZI .1t< t<
r. Xal ft0- CL0 -1.'I CI01 alc+ =.40
4.<
ZC-%0...=la
0 0-Om4/1 cf.V 7'M go .
= .,'W 3..11. ..I.
0g2=
.--1 X7M W--n is.? .Z 00a=11 00 10tC3 ...i< 0
10rtW...r
0% Number 11 7
% of 91.7 98.3dept.
1-25% Number
% ofdept.
26-50% Number
% ofdept.
51-75% Number
% ofdept.
76-100% Number
% ofdept.
Percentage of total
1 3
8.3 25.0
0 0 1
1 10 9 4 4 46
16.7 50.0 29.0 57.1 80.0 49.5*
3 8 20 1 1 37
50.0 40.0 64.5 14.3 20.0 39.8
0.0 0.0 16.7
0' 0 1
0.0 0.0 16.7
0 2 0
0.0 16.7 0.0
297
2 2 2 0
10.0 6.5 28.6 0.0 7.5
0 0 0 0 1
0.0 0.0 0.0 0.0 1.1
0 0 0 0 2
0.0 0.0 0.0 0.0 2.2

270
Table F-25
Relative faculty use of individualizedinstruction for specific certificationexam material by department
Percentage ofTeaching Load
-i CI 2v I- 0 r3 Z v0 a-4 73 a-4m? C m 13) I'D 13) CD C -, 13 ID ta) 0("1 fD LO M CT M 00' 0...... , n c+13 ? CI a. e+= a - c+ 0 (4- til m- -... am ..... m a -s a -s n ...,. m a m 0 ......O n z ..._. 0, _. a a m = ...... 0 J...-4 CV ID c-1- c-1- - 1.0 Ul a - 0O -' 0 0 -a. ...a. 0 U:1
M CI (0 -a(.0 c n
0% Number
% ofdept.
1-25% Number
% ofdept.
26-50% NAber
% ofdept.
51-75% Number
% ofdept.
76-100% Number
% ofdept.
12 8 6 19 31 6 5 87
100.0 66.7 100.0 95.0 100.0 85.7 100.0 93.5
0 2
0.0 16.7
0 0
0.0 0.0
0 1
0.0 8.3
0 1
0.0 8.3
0 0 0 0 0 2
0.0 0.0 0.0 0.0 0.0 2.2
.
0 1 0 1 0 2
0.0 5.0 0.0 14.3 0.0 2.2
0 0 0 0 0 1
0.0 0.0 0.0 0.0 0.0 1.1
0 0 0 0 0 1
0.0 0.0 0.0 0.0 0.0 1.1
298

271
Table F-26
Relative faculty use of evaluationand testing for general coursematerial by department
Percentage ofTeaching Load
--icy x as r- c3 r3 z cp o -4 72M 7" (..( M cu so am C ......0 ma o
0 0 7 --5 0) I al al = = ...=1 0 ..../....i 0 so c+ fp ....J tin 0 a -00 4 0 0 ...I. aa. 0 int< 0 t< iC in '.0 0
0% Number 7 6 2 9 9 3 3 39
% of 58.3 50.0 33.3 45.0 29.0 42.9 60.0 41.9*dept.
1-25% Number 5 6 4 10 22 3 2 52
% of 41.7 50.0 66.7 50.0 71.0 42.9 40.0 55.9
dept.
26-50% Number 0 0 0 0 0 0 0 0
% of 0.0 0.0 0.0 0.0 0.0 0.0 0.0 0.0
dept.
51-75% Number 0 0 0 1 0 1 0 2
% of 0.0 0.0 0.0 5.0 0.0 14.3 0.0 2.2
dept.
76-100% Number 0 0 0 0 0 0 0 0
% of 0.0 0.0 0.0 0.0 0.0 0.0 0.0 0.0
dept.
Percentage of total
299

272
Table F-27
Relative faculty use of evaluationand testing for specific certificationexam material by department
Percentage ofTeaching Load
--I CI S C:3 I- C:3(D S G M 0 M0 (D CO = CT ==- 3 -A. c-P 0 et.= -.. M 0 , 00 0 0 a 0 a
Or (D et0 a 0la -1
l< CC
I- 30 M=C
C:3 0-..-0 --I ):,(D 0
0- CL0 .. ,0 VP et.'CI =0 CL7' ...o., 0 -1. M 0 = 0
0.1 0.10 .....
CP ...a In 0 a ..., 00 0 (a,
(17 4.0 0
--I0etOr--
0% Number
% ofdept.
1-25% Number
% ofdept.
26-50% Number
% ofdept.
51-75% Number
% ofdept.
76-100% Number
*
% ofdept.
Percentage of total
12 9 6
100.7 75.0 100.0
0 3
0.0 25.0
0.0 0.0
0 0
0.0 0.0
0 0
0.0 0.0
19 31 5 5
95.0 100.0 71.4 100.0
0 0 0 1 0
0.0 0.0 0.0 14.3 0.0
1 0
0.0 0.0 0.0 14.3 0.0
0 1 0 0 0
0.0 5.0 0.0 0.0 0.0
0 0 0 0 0
0.0 0.0 0.0 0.0 0.0
330
87
93.5*
4
4.3
1
0
0.0

273
Table F-28
Relative faculty use of advisement,library research and administrativefunctions for general course materialby department
Percentage ofTeaching Load
-1 c-) =O r- c:1 r3 z C7 0 -1v --Ima- '< tro m(I) CU It C -1. 'V m0.1 00 al (0 = CT = Cr a. rt CI 0- et=- a .." C+ 0 C+ 0 -a. W 'V =" = -4. W= -A. ID 13) -% 13) 41 CI tD su =o ...O n = A a) mI CU CU = 3-a 0 -aI al M C+ C+ "..4 tO in a . 00 - 0 0 ..1. -a. 0 lala t'lt<
, "I = nI.<o 4
t< t< (0
0% Number 12 10 6 17 23 5 4 78
% ofdept.
100.0 83.3 100.0 85.0 74.2 85.7 80.0 83.9*
1 -25% Number 0 1 0 2 7 1 0 11
% ofdept.
0.0 8.3 0.0 10.0 22.6 14.3 0.0 11.8
26-50% Number 0 0 0 0 1 0 0 1
51-75%
% ofdept.,
Nur.7:oer
0.0
0
0.0
1
0.0
0
0.0
0
3.2
0
0.0
0
0.0
1
1.1
2
% ofdept.
0.0 8.3 0.0 0.0 0.0 0.0 20.0 2.2
76-106% Number 0 0 0 1 0 0 0 1
% ofdept.
0.0 0.0 0.0 5.0 0.0 0.0 0.0 1.1
*Percentage of total

274
Table F-29
Relative faculty use of advisement, libraryresearch, and administrative functions forspecific certification exam material bydepartment
Percentage ofTeaching Load
-1r =O r" cr)10 S 4.< M 0) I'DCl I'D In = CT == a -- c+ o rt.= ..... M 0) "I 0)O n = ....I 12) ...-....1 0, (D et0 ot< t<
r30) I'DCT (10 --.."I Cl0) 0)et -0ot<
=C'1to...A=
I f3
v0 -I 70-. zi m cuto et (1 O.1:3 S = -4.M W = 00 ...4a
0to ..-. 0
O 441JCI If3to t< Cl
0% Number
% ofdept.
1-25% Number
% ofdept.
26-50% Number
% ofdept.
51-75% Number
% ofdept.
76-100% Number
% ofdept.
*
12 11 6 20 31 7
100.0 91.7 100.0 100.0 100.0 100.0
Percentage of total
0 1 0 0 0 0
0.0 8.3 0.0 0.0 0.0 0.0
0 0 0 0. 0 0
0.0 0.0 0.0 0.0 0.0 0.0
"
0 0 0 0 0 0
0.0 0.0 0.0 0.0 0.0 0.0
0 0 0 0 0 0
0.0 0.0 0.0 0.0 0.0 0.0
32
5 92
100.0 98.9*
0 1
0.0 1.1
0 0
0.0 0.0
0 0
0.0 0.0
0 0
0.0 0.0

275
Table F-30
Relative faculty use of lectures forgeneral course material by rank
Percentage ofTeaching Load
- S '1 up> >
'1 up mo o to o o CI
%-m m n w cN In .4 mIn r+ 'Iw w W w W MO 0 rt. 0 = '1
0% Number
% ofdept.
1-25% Number
% ofdept.
26-50% Number
% ofdept.
51-75% Number
% ofdept.
76-100% Number
% ofdept.
5 2 5 4
38.5 11.8 15.6 25.0
4
26.7
0 5 7 3 5
0.0 29.4 21.9 18.8 33.3
6 7 15 5 4
46.2 41.2 46.9 31.3 26.7
0 2 4 4
0.0 11.8 12.5 25.0
2 1 1 0
15.4 5.9 3.1 0.0
3d3
1
6.7
1
6.7

276
Table F-31
Relative faculty use of lectures forspecific certification exam materialby rank
Percentage ofTeaching Load
-13-50
ra 2.-5 1/10 vi
73 2:VI.
-50 VI
I-Mn0) A 0 -ts - CI.M M 0 M W C0 Vi 101 cf. "Itn tn OA UV OA M0 0 rt. 0 = '''S
0% Num,*
% ofdept.
1-25% Number
% ofdept.
26-50% Number
% ofdept.
51-75% Number
% ofdept.
6-100% Number
% ofdept.
10 17 29 14
76.9 100.0 90.6 87.5
2 0 0 1
15.4 0.0 0.0 6.3
0 0 1 0
0.0 0.0 3.1 0.0
0 0 0 1
0.0 0.0 0.0 6.3
1 0 2 0
7.7 0.0 6.3 0.0
3
14
93.3
6.7
0
0.0
0
0.0
0
0.0

277
Table F-32
Relative faculty use of seminars forgeneral course material by rank
Percentage ofTeaching Load
'CP-1oftNw0-1
'V 1:,-1 tA0 inIVin
0-a.
tA 0+0 el,"I A)
"V 31:3.
-1 V)0 in-a
(1) intA ettA a+0 7-1 of
r-(1)nclC-1
1
0% Number
% ofdept.
1-25% Number
% ofdept.
26-50% Number
% ofdept.
51-75% Number
% ofdept.
76-100% Number
% ofdept.
13 14 27. 12 14
100.0 82.4 84.4 75.0 93.7
0 3 5 4
0.0 17.6 15.6 25.0
0 o
0.0 0.0 0.0 0.0
0 0 0 0
0.0 0.0 0.0 0.0
0 0 0 0
0.0 0.0 0.0 0.0
3 05
1
6.3
0.0
0
0.0
0
0.0

278
Table F-33
Relative faculty ute of seminarsfor specific certification exammaterial by rank
Percentage ofTeaching Load
"V-S
°+1etMWWo'I
'V X-7 -1 w
VI- 0M nw r.W0 el.00
'I M
'V >-.1 w0-1
w-I-
M DIIll rt111 Di0 ='I rt
fDn1-1.C-I'fD I
0% Number
% ofdept.
1-25% Number
% ofdept.
26-50% Number
% ofdept.
51-75% Number
% ofdept.
76-100% Number
% ofdept.
13 17 32 14
100.0 100.0 100.0 75.0
0 0 0 0
0.0 0.0 0.0 6.0
0 0 0 1.
0.0 0.0 0.0 12.5
0 0
0.0 0.0 0.0 0.0
0 0 0 1
0.0 0.0 0.0 12.5
3 J 6'
15
100.0
0
0.0
0
0.0
0.0
0.0

279
Table F-34
,Relative faculty use of laboratoriesfor general course material by rank
Percentage ofTeaching Load
"0 '0 3b
o, 0, 00-h -41 0it M n0 w -40 0 WO 0 t-t5 5M
-0 .
0, 00..., ....m 0w e+0 W0 =5 cf.
r-mnc-*C'1CD'1
i..0c-*
-1C11rt.05
0% Number
% ofdept.
5 2
38.5 11.8
1-25% Number 1 0
% of 7.7 0.0
dept.
26-50% Number
% ofdept.
51-75% Number
% ofdept.
76-100% Number
% ofdept.
4
30.8
6
35.3
3 1 4
9.4 6.3 26.7
4 1 1
12.5 6.3 6.3
14 7 5
43.8 43.8 33.3
.
2 5 8 5 3
15.4 29.4 25.0 31.3 20.0
1 4 3 2 2
7.7 23.5 9.4 12.5 13.3
3 J 7

280
Table F-35
Relative faculty use of laboratoriesfor specific certification exammaterial by rank
Percentage ofTeaching Load
-C)
0-4)m00o
"V 1:.
0 0-1 om n0 _.,.w oo c+
"0 1::.
0 0-4, _...m ww c+0 oO =
1-nc+c-1m-1
-S , m -1 c+
0% Number
% ofdept.
1-25% Number
% ofdept.
26-50% Number
% ofdept.
51-75% Number
% ofdept.
6-i00% Number
% ofdept.
12
92.3
16
94.1
31
96.9
14 13
87.5 86.7
0 0 0 0
0.0 0.0 0.0 0.0
0 0 1 2
0.0 0.0 3.1 12.5
0 0 0 0
0.0 0.0 0.0 0.0
1 1 0 0
7.7 5.9 0.0 0.0
3u8
0
0.0
0
0.0
1
6.7
1
6.7

Table F-36
Relative faculty use of individualizedinstruction for general course materialby rank
281
"VPercentage of 'I0Teaching Load 00
V*0Z
"V :t.al V*0 V*m n0 -ain fao0 rtal m
"V laal V)0 InJ.m 00 1-s-1/1 flo0 7"I rt
f0(1etC'I0al
0% Number 10 10
% of 76.9 58.8dept.
1-25% Number 2 5
% of 15.4 29.4dept.
26-50% Number 1 1
% of 7.7 5.9dept.
51-75% Number
7 ofdept.
0 0
0.0 0.0
76-100% Number 0 1
% of 0.0 5,9dept.
3 19
15 2 9
46.9 12.5 60.0
14 12 4
43.8 75.0 26.7
3 2 0
9.4 12.5 0.0
0 0 1
0.0 0.0 6.7
0 0 1
0.0 0.0 6.7

282
Table F-37
Relative faculty use of individualizedinstruction for specific certificationexam material by rank
Percentage of oTeaching Load -ti
-0 X.-$0 0-ti 0
-0 3:."I 00 0-ti
1Melet
M M CI M N c0 VI -a. VI et -%VI VI 0 N 0 M-% -I M , et
0% Number
% ofdept.
1-25% Number
% ofdept.
26-50% Number
% ofdept.
51-75% Number
% ofdept.
6 -100% Number
% ofdept.
12 16 31 14 14
92.3 94.1 96.9 87.5 93.3
1 0 1 0
7.7 0.0 3.1 0.0
0 0 2
0.0 0.0 0.0 12.5
0 0 0 0
0.0 0.0 0.0 0.0
0 1
0.0 5.9 0.0 0.0
3i0
0
0.0
0
0.0
1
6.7
0.0

283
Table F-38
Relative faculty use of evaluationand testing for general coursematerial by rank
Percentage ofTeaching Load
-a-50
-v D"05 w
w1;*
0 VI
rm
-41 -+w 0 J. rtM CD 0 al ill .04 Cw in J. rt.w W 0) VI PI coo 0 r+ 0'I -1M
0% Number
% ofdept.
1-25% Number
% ofdept.
26-50% Number
% ofdept.
51-75% Number
% ofdept.
76-100% Number
% ofdept.
10 7 9 4
76,9 41.2 28.1 25.0
3 10 23 10
23.1 58.8 71.9 62.5
0 0 0 0
0.0 0.0 0.0 0.0
0 0 0 2
0.0 0.0 0.0 12.5
0 0 0 0
0.0 0.0 0.0 0.0
311
9
60.0
6
40.0
0
0.0
0.0
0
0.0

284
Table F-39
Relative faculty use of evaluationand testing for specific certificationexam material by rank
Percentage ofTeaching Load
73.1o
'V 3>-1 vlo vs
'V ,-1 oo vl
r-m0
-+1 ...h ...hM M 0 M 0 C0 0 -J. 0 rt "S0 0 W 0 W M0 0 rt 0 = "S-S -I M "S rt
0% Number
% ofdept.
1-25% Number
% of
dept.
6-50% Number
% ofdept.
1-75% Number
% ofdept.
-100% Number
% ofdept.
12 17 30 14 14
92.3 100.0 93.8 87.5 93.3
1 0 2 0
7.7 0.0 6.2 0.0
,
0 0 0 1
0.0 0.0 0.0 6.3
0 0 0 1
0.0 0.0 0.0 6.3
0 0 0 0
0.0 0.0 0.0 0.0
312
1
6.7
0
0.0
0
0.0
0
0.0

285
Table F-40
Relative faculty use of advisement,library research and administrativefunctions for general course materialby rank
Percentage ofTeaching Load
-10 V Ti-s , VI0 0 W0-A -INO
M AV) tol, ..«.W VI 00 0 et1 '1 A
To 23. r--I Ino on mn-IN-0. etM W CUf et 'IN or m0 = -, et
0% Number
% ofdept.
1-25% Number
% ofdept.
26-50% Number
% ofdept.
51-75% Number
% ofdept.
76-100% Number
% ofdept.
11 15 23 14 15
84.6 88.2 71.9 87.5 100.0
0 2 8 1
0.0 11.8 25.0 6.3
0 0 0 1
0.0 0.0 0.0 6.3
1 0 1
7.7 0.0 3.1 0.0
1 0 0 0
7.7 0.0 0.0 0.0
313
0
0.0
0
0.0
0
0.0
0
0.0

286
Table F-41
Relative faculty use of advisement,library research, and administrativefunctions for specific certificationexam material by rank
Percentage ofTeaching Load
"V-s
"V'z 'I V2:0I
'V 2:"I IA (D0 0 VI 0 in r)
'41 "41 0 .4% .... ff.M CD CI 41 VI CUs VI a in et .1U10 V) al0 et in 0,0 (D, .1 M .1
0% Number
% ofdept.
1-25% Number
% ofdept.
26-50% Number
% ofdept.
51-75% Number
% ofdept.
76-100% Number
% ofdept.
13 17 31 16
100.0 100.0 96.9 100.0
0 0 1
0.0 0.0 3.1 0.0
0 0
0.0 0.0 0.0 0.0
0.0 0.0 0.0 0.0
0 0 0 0
0.0 0.0 0.0 0.0
314
15
100,&
0.0
0.0
0.0
0
0.0
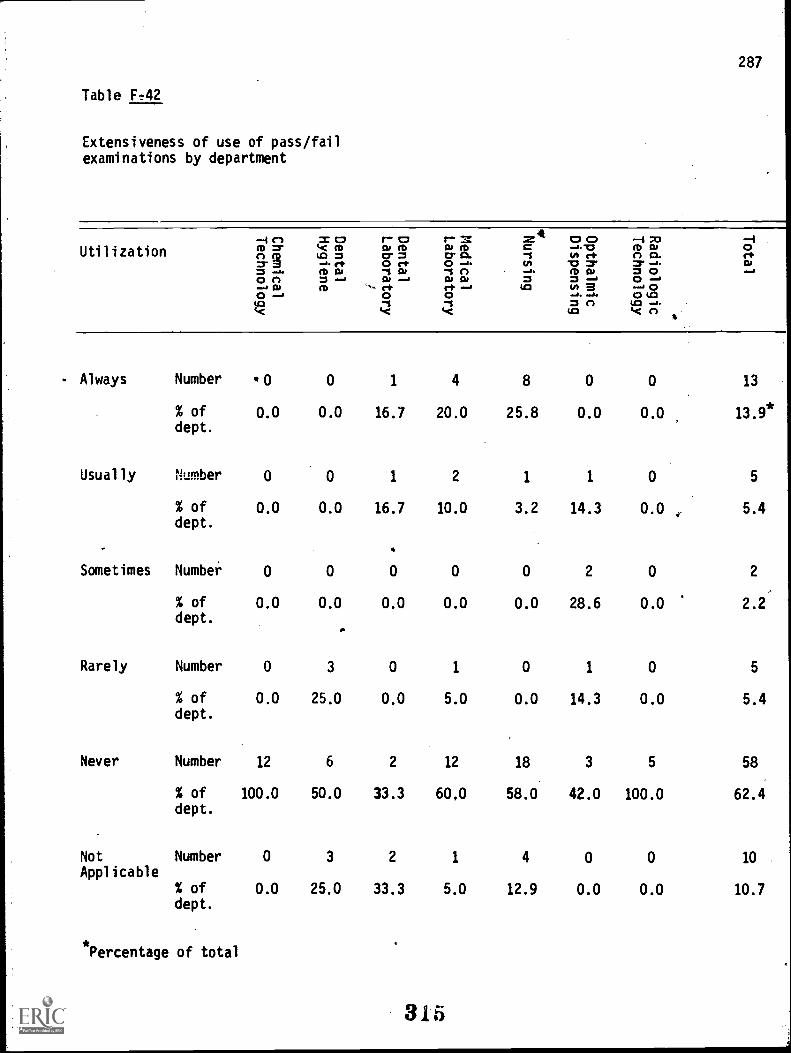
287
Table FT42
Extensiveness of use of pass/failexaminations by department
Utilization=4--1 r) = r- Mt ID CD -I 7a -I
k< CD DI M 11; fD C .....0 M W 02 2 sr, =-.. ,-/.
CT Z0 irt ona.0 --i W"S vset
=.n .=- -.cs. m
el.
= - fD DI "S DI "S A -,., fD DI Z 0 ...O f) = ....1 12, -.1 DI DI Z = ....1
in0 -.4
12-I , M `-'' el' et -0 tin a ...1 0O ....1 0 0 er ow& 0 10
14:3 -15 -15 0 n 40 1NC I< I< la 1.( n
Always Number *0 0 1 4 8 0 0 13
% ofdept.
0.0 0.0 16.7 20.0 25.8 0.0 0.0 13.9*
Usually Number 0 0 1 2 1 1 0 5
% ofdept.
0.0 0.0 16.7 10.0 3.2 14.3 0.0 5.4
Sometimes Number 0 0 0 0 0 2 0 2
% ofdept.
0.0 0.0 0.0 0.0 0.0 28.6 0.0 2.2
Rarely Number 0 3 0 1 0 1 0 5
% ofdept.
0.0 25.0 0.0 5.0 0.0 14.3 0.0 5.4
Never Number 12 6 2 12 18 3 5 58
% ofdept.
100.0 50.0 33.3 60,0 58.0 42.0 100.0 62.4
Not Number 0 3 2 1 4 0 0 10
Applicable% ofdept.
0.0 25.0 33.3 5.0 12.9 0.0 0.0 10.7
Percentage of total
315

288
Table F-43
Extensiveness of use of curvegrading by department
Utilization- 4 Cl 3: 2.T.
F. 4?4 PO .....4M Cr 1..0 M M M M M C M M 00 g (0 = or O
Er a-i 0 et 0 0. et...e rt. 0 et 0 17 LT = ..... cu .
= .... ma -s m -1 n
:. ::
M W = 0 4on = .....4 M 4 as = 0 4* OM 0 rt. el. ...... (0 0 a 4 0
0 (04,0
1<= n 4,0 ...
n4
g< L4c ua 4,..c
Always Number 0 0 0 0 0 0 0 0
% ofdept.
0.0 0.0 0.0 0.0 0.0 0.0 0.0 0.0
Usually Number 1 0 1 1 0 1 0 4
% ofdept.
8.3 0.0 16.7 5.0 0.0 14.3 0.0 4.3*
Sometimes Number 4 2 0 1 1 3 0 11
% ofdept.
33.3 16.7 0.0 5.0 3.2 42.9 0.0 11.8
Rarely Number 6 1 3 6 0 2 0 18
% ofdept.
50.0 8.3 50.0 30.0 0.0 28.6 0.0 19.4
Never Number 1 7 1 12 28 1 5 55
% ofdept.
8.3 58.3 16.7 60.0 90.3 14.3 100.0 59.1
Not Number 0 2 1 0 2 0 0 5Applicable
% ofdept.
0.0 16.7 16.7 0.0 6.5 0.0 0.0 5.4
*Percentage of total
316

289
Table F-44
Extensiveness of use of behavioralobjectives by department
Utilization.--4 CI 2 CI r''' a; r- z z 00 -i70 -4m7' 4C M am am G -1.'0 ma 0(g. g to
.-a. c+CT0 c+ CT O.0 .". In
in et17 S 0 0-7' -J.
etWZ-' 41 W 'S a ''S A al W = 0 4O n = ...a W ....I W W = = .1 0 ...1
...an) M et et -I 40 in a ._, 0O -- 0 0 ..r. ..a. 0 tOnc t.< c 40 l< n
Always Number 1 10 2 2 29 1 0 45
% ofdept.
8.3 83.3 33.3 10.0 93.5 14.3 0.0 48.4*
Usually Number 2 1 1 8 2 2 4 20
% ofdept.
16.7 8.3 16.7 40.0 6.5 28.6 80.0 21.5
.
Sometimes Number 5 0 1 6 0 1 0 13
% ofdept.
41.7 0.0 16.7 30.0 0.0 14.3 0.0 19.9
Rarely Number 1 0 0 1 0 0 1 3
% ofdept.
8.3 0.0 0.0 5.0 0.0 0.0 20.0 3.2
Never Number 3 0 0 3 0 1 0 7
% ofdept.
25.0 0.0 0.0 15.0 0.0 14.3 0.0 7.5
Not Number 0 1 2 0 0 2 0 5Applicable
% ofdept.
0.0 8.3 33.3 0.0 0.0 28.6 0.0 5.4
Percentage of total
3174

290
Table F-45
Extensiveness of use of individualizedinstruction by department
Utilization--4 n x cz r- cz r- x z cr Q -I 73 -1Z.) i ,C M03 = 01 M
C7' =0) M0 0. C, )* '0
N re.m 0)n 0. 0
ti-J. cf. 0 re' 0 0 '0 = = 1 00
0 A = .....1 al .. 0) 01 = = ..... 0 ...JI 00 M CI' cf. ...01 1.0 0 a .00 ... 0 0 ...a. J. 0 03= 0 030...).
1.< , '6( 4'C 413 4..<
Always Number 0 2 2 2 7 1 0 14
% of 0.0 16.7 33.3 10.0 22.6 14.3 0.0 15.1*dept.
Usually Number 3 4 2 6 7 2 1 25
% of 25.5 33.3 33.3 30.0 22.6 28.6 20.0 26.9dept.
Sometimes Number 5 6 2 9 17 3 2 44
% of 41.7 50.0 33.3 45.0 54.8 42.9 40.0 47.3dept.
Rarely Number 1 0 0 1 0 0 1 3
% of 8.3 0.0 0.0 5.0 0.0 0.0 20.0 3.2dept.
Never Number 3 0 0 1 0 0 1 5
% of 25.0 0.0 0.0 5.0 0.0 0.0 20.0 5.4dept.
Not Number 0 0 0 1 0 1 0 2
Applicable% of 0.0 0.0 0.0 5.0 0.0 14.3 0.0 2.2dept.
Percentage of total
318

291
Table F-46
Extenisveness of use of audio/visual
media by department
--IC'sUtilization CI n27' 5
mom.0 0....1 Clo0 .....4014(
2 1:7C al1.0 7-a. etA) OP= 4at
r- r7OP CD0. 70 t+"1 orW ...8rt.0"SlC
r- zCu ID007 .9..
"I 0W Wrt -I0"1
4C
zc"SW....=40
C7 CD-1. 'VIn et'V 7'(D 0/= .riIn a-a. ...e.7 0(0
-4 7Z)ID C0 Cu.7' -I.7o0 .....,..... 00 ta(0 -a.I< n
Always Number 0 5 0 3 5 0 1 14
*
% of 0.0 41.7 0.0 15.0 16.1 0.0 20.0 15.1
dept.
Usually Number 2 2 2 9 8 0 3 26
% of 16.7 16.7 33.3 45.0 25.8 0.0 60.0 27.9
dept.
,
Sometimes Number 8 5 2 6 18 5 1 45
% of 66.7 41.7 33.3 30.0 58.1 71.4 20.0 48.4
dept.
Rarely Number
% ofdept.
Never Number
% ofdept.
Not NumberApplicable
% ofdept.
Percentage of total
-
1 0 1 1 0 1 0
8.3 0.0 16.7 5.0 0.0 14.3 0.0
1 0 1 1 0 1 0
8.3 0.0 16.7 5.0 0.0 14.3 0.0
0 0 0 0 0 0 0
0.0 0.0 0.0 0.0 0.0 0.0 0.0
319
4
4.3
4
4.3
0
0.0

Table F-47
Extensiveness of use of pass/failexaminations by rank
292
Utilization-0 -0 X). 77 1:a r-o'I 'I 0 , 0 M0 0 0 0 nctCD ID n CD V) C0 0 -s 0 et -IV) 0a 0 12. ID0 0 ct 0= -"S'I "I CD "I et
Always Number 3 1 3 3 3
% ofdept.
23.1 5.9 9.4 18.8 20.0
'Usually Number 0 3 2 0 0
% ofdept.
0.0 17.6 6.2 0.0 0.0
Sometimes Number 1 0 1 0 0
% ofdept.
7.7 0.0 3.1 0.0 0.0
Rarely Number 1 1 1 1 1
% ofdept.
7.7 5.9 3.1 6.3 6.7
Never Number .7 12 22 8 9
% ofdept.
53,8 70.6 68.7 50.0 50.0
Not Number 1 0 3 4 2Applicable
% ofdept.
7.7 0.0 9.4 25.5 13.3
320
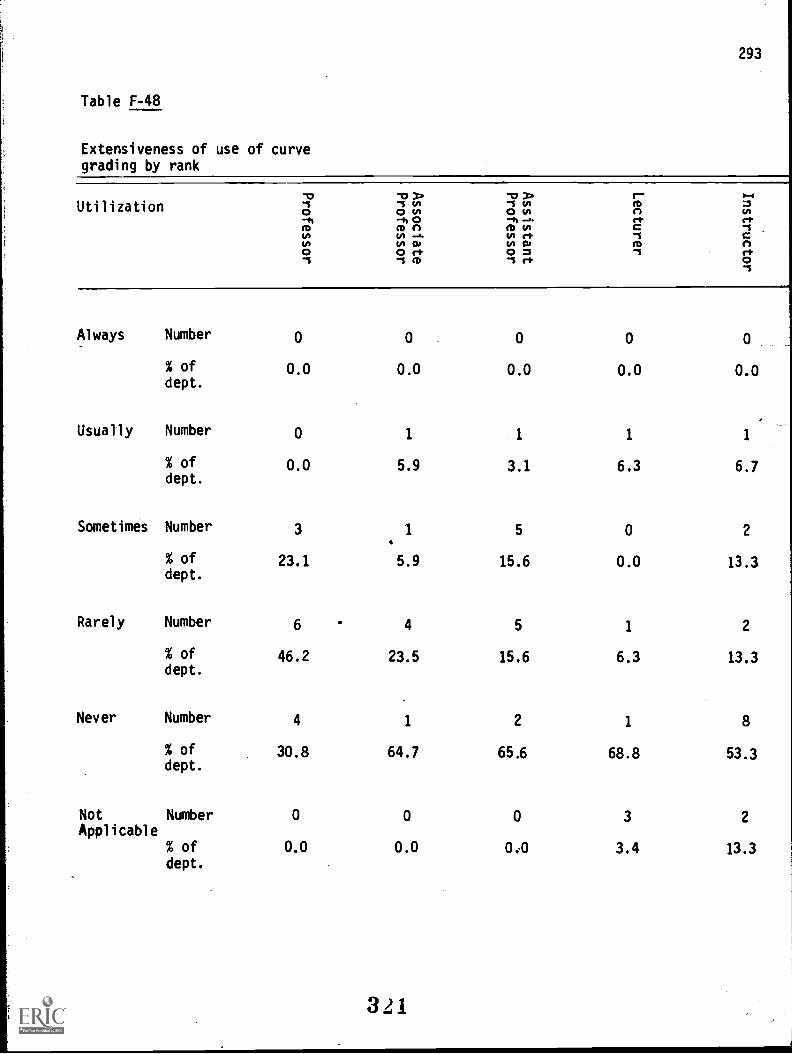
293
Table F-48
Extensiveness of use of curvegrading by rank
Utilization-0 -0 > "V A I--S -1 In -S In fD0 0 In 0 0 0-h -h 0 -it -I. chM M 0 ID 0 C0 In -J. In rt. -S0 In 0.) 1.01 13) fD0 0 of O = "I'I -S M -S cf.
Always Number 0 0 0 0
% ofdept.
0.0 0.0 0.0 0.0
Usually Number 0 1 1
% ofdept.
0.0 5.9 3.1 6.3
Sometimes Number 3 1 5 0
% ofdept.
23.1 5.9 15.6 0.0
Rarely Number 6 4 5 1
% ofdept.
46.2 23.5 15.6 6.3
Never Number 4 1 2 1
% ofdept.
30.8 64.7 65.6 68.8
0
0.0
1
6.7
2
13.3
2
13.3
8
53.3
Not Number 0 0 0 3 2Applicable
% ofdept.
0.0 0.0 0.0 3.4 13.3
321

294
Table F-49
Extensiveness of use of behavioralobjectives by rank
Utilization"0 "0 3:. "0 330 1-'1 "I 1/1 'I IAo 0 VD 0 U M
s n-A -A 0 -4 -4 rtM M n M 0 CW 1/1 -A. lib rt '10 0 r+ 0 = '1-1 '1 (0 'I r+
Always Number 6 9 15 10 5
% ofdept.
46.2 52.9 46.9 62.5 33.3
Usually Number 3 4 4 3 6
% ofdept.
23.1 23.5 12.5 18.8 40.0
Sometimes Number 3 1.
7 1 1
% ofdept.
23.1 5.9 21.9 6.3 6.7
Rarely Number 0 1 1 1 0
% ofdept.
0.0 5.9 3.1 6.3 0.0
Never Number 1 1 4 0 1
% ofdept.
7.7 5.9 12.5 0.0 6.7
Not Number 0 1 1 1 2Applicable
% ofdept.
0.0 5.9 3.1 6.3 13.3
322

295
Table F-50
Extensiveness of use of individualinstruction by rank
-I,
-sUtilization o-c 3>-s w0 w
12 3'-s wo w
r-mn
p.....
w-h -4h0 -4, -. rf. ci
M M 0 M W c -1
w to .... w et -1 CW W W w W M 00 0 el' 0 = "I ci
-1 -$ M -1 et 0'I
Always Number 0 1 4 4 5
% ofdept.
0.0 5.9 12.5 25.0 33.3
Usually Number 4 7 8 4 2
% ofdept.
30.8 41.2 25.0 25.0 13.3
Sometimes Number 8 7 17 7 5
% ofdept.
61.5 41.2 53.1 43.8 33.3
Rarely Number 0 . 1 1 1 0
% ofdept.
0.0 5.9 3.1 6.3 0.0
Never Number 1 1 2 0 1
% ofdept.
7.7 5.9 6.3 0.0 6.7
Not Number 0 0 0 0 2
Applicable% ofdept.
0.7 0.0 0.0 0.0 13.3
323

Table F-51
Extensiveness of use of audio/visualmedia by rank
296
Utilization"13 77 , 77 3> I--I -1 0 -1 0 MO 0 0 0 0 0-h -111 0 -41, ..a c+M M n min cM o ..... in r+ -.1o o w o w mo o c+ O = -.1
-.1 -.1 m -1 c+
Always Number 3 4 3 2 2
% ofdept.
23.1 23.5 9.4 12.5 13.3
Usually Number 3 2 13 3 5
% ofdept.
23.1 11.8 40.6 18.8 33.3
Sometimes Number 49
14 11 7
% ofdept.
30.8 52.9 43.8 68.8 46.7
Rarely Number 1 - 1 2 0 0
% ofdept.
7.7 5.9 6.3 0.0 0.0
Never Number 2 1 0 0 1
% ofdept.
15.1 5.9 0.0 0.0 6.7
Not Number 0 0 0 0 0
Applicable% ofdept.
0.0 0.0 0.0 0.0 0.0
324

297
Employer Perception Section
325

298
In any training endeavor the ultimate measure of the quality of the
training is the ability of the trainees to perform the tasks for which
they were trained. Within the Allied Health field the "ability to
perform" is, in some cases, certified by the state, or some licensing
entity, but actual employment conditions usually provide a much more
stringent test of the trainees' knowledge and ability.
Three-hundred-fifty employers of graduates of the Allied Health
Division of New York City Community College were asked to provide
their perceptions of the knowledge and ability of the graduates.
Thirty-two responses were received, twenty-one from present or past
employers of graduates. The data herein is based on their responses.
326

299
Tables EP -1 and EP-2 provide data showing the number of present and
past employers of graduates of the Allied Health Division of New
York City Community College (N.Y.C.C.C.) by number of present or past
graduate employees and department. It can be seen from these tables
that the greatest response was received from employers of Dental
Hygiene graduates.
Tables EP-3 and EP-4 present the employers' perceptions of N.Y.C.C.C.
graduates referenced to the average entry level employee of the
employer. Although responses within each department are too few to
be reliable, responses across departments indicate that 23.8% of
current employers perceive all N.Y.C.C.C. graduates to be superior to
average entry level employees and an additional 52% of current employers
to perceive some or most N.Y.C.C.C. graduates to be superior to the
average entry level employee. Table EP-4,however, indicates that
at least 23.8% of current employers perceive some N.Y.C.C.C. graduates
to be inferior to the average entry level employee.
Employers were asked to compare the number of hours of in-service
training provided to average new employees and new N.Y.C.C.C. employees.
Responses indicated no typical training period, but varied from 3 hours
(an employer of a Dental Hygiene graduate) to 1500 hours (an employer
of an Opthalmic Dispensing graduate). Of the twenty-one employers
who responded, two indicated N.Y.C.C.C. graduates required more in-service
327

300
training than their average new employee. The employers who indicate
more than average training is required for N.Y.C.C.C. graduates are
currently employing Nursing graduates; the employers who.indicate
less than average training is required for N.Y.C.C.C. graduates are
currently employing Medical Laboratory, Opthalmic Dispensing, and
Radiologic Technology graduates.
Tables EP-5 through EP-12 present employers' perceptions of twenty
employee characteristics, and an overall employee rating, of N.Y.C.C.C.
graduate employees, across departments and by department. It can be
seen from Table EP-5 that 27.1% of respondents perceive N.Y.C.C.C.
graduates to be Excellent in employee characteristics and an additional
44.5% perceive graduates to be Very Good or Good in employee char-
acteristics. Characteristics on which graduates rated particularly
strong include Punctuality, Organizational Loyalty, and Personal
Appearance. Characteristics on which graduates rated particularly
weak include Technical Knowledge, Theoretical Knowledge and Communi-
cation Skills, Written. Tables EP-6 through EP-12, showing present
employers' perceptions of employee ' haracteristics by department, may
contain too few responses to be reliable, but are included herein for
information value.
Employers were requested to indicate reasons for unsatisfactory per-
formance termination of N.Y.C.C.C. graduate employment,'if applicable.
Three Dental Hygiene graduate employers responded indicating the
following reasons:
328

301
TechniCal Competence
Technical 'Knowledge
Manipulative Skills
Adaptabiliiy'(2)'
Peer Relationships
Supervisor Relationships
Client -Patient Relationships (2)
Cooperation.
One RadiolOgicJechnology graduate employer responded indicating the
employee had been "unable to piss license exam."
Most empl4irs 'indicated theydo expect to emplOy future N.Y.C.C.C.'
graduates except forLtwo Nursing departMint employers who Stated they
will emphasiie baccalaureite degree entry requirements for the fore-
seeable4
future. Employers commented on the need to teach "basics"
during the'students' N.Y.t.C.C! training, the need for stressing
accuracy, and the need for practical or'clinicarpractice.
329

302
Table EP-1
Number of A.Y.C.C.C. graduates employedby respondents, by department
GraduatesEmployed
None
One
Two
Three
Over Three
Total Numberof CurrentEmployers
Na.
A
2 1 3 2 1 1 3 13
1 5 1 0 1 1 1 10
0 1 0 2 1 0 0 4I
0 0 0 1 0 1 3
0 0 0 0 1 0 1
1 6 1 3 1 3
330

303
Table EP-2
Number of N.Y.C.C.C. graduatespreviously employed byrespondents, by department
GraduatesPreviouslyEmployed
1 c-) x 1:72 r- c) r- Xclg ? k< m a m
t- 0- =0 a.
S I .-i es. 0 rt g -I.= ...A. M 0 n a n n0 0 = ..... W ....a 0 0...I op e r+ et .....0 0 o
-st.c
-5t<
zc''SUp.....=IC
CI a-4'0IA etV 7'0 CM= .....tn 3.... -,= n
u:1
I 70m a0 C.3" -4305
.....5
--+ 0040to -4,..c n
-40el,0.m1
None
1 - 3
4 - 6
7 - 10
Over ten
Total numberof employers
0 2 4 5 4 1 3 19
1 3 0 1 0 1 2 8
0 1 0 1 0 0 0 2
1 0 0 0 0 0 1
0 0 0 0 1 0 1 2
1 5 0 2 1 1 3
331
AM.

304
Table EP-3
Employers' perceptions of numberof N.Y.C.C.C. graduates superiorto average entry level employee,by department
-ira sO f C2 f Z Z Cr/ Ia' I
4< M 0. ....vrP:r
m mn=' me.
e t
= .4. ID DI 10' "I CI ID DOO n at at 4 44.
Oet U2
O 0 0 Oct0
c 'C 0 CI
None Number 0 0 0 2 0 2 4
0.0 0.0 0.0 0.0 50.0 0.0 40.0 19.0*
Very Number 0 0 0 0 1 0 . 0 1
Few0.0 0.0 0.0 , 0.0 25.0. -AO 0.0 4.8
Some Number 0 2 0 3 0 1 2 8
0.0 33.3 0.0 75.0 0.0 100.0 40.0 38.0
Most Number 0 2 0 0 0 0 1 3
0.0 33.3 0.0 0.0 0.0 0.0 20.0 14.3
All Number 0 2 1 1 1 0 0 5
0.0 33.3 100.0 25.0 25.0 0.0 0.0 23.8
*Percent of total
332
.4

305
Table EP-4
Employers' perceptions of numberof N.Y.C.C.C. graduates inferiorto average entry level employee,by department
-1 c- x c r- C) r x z C1 0 .-1 70 -..4l< fD Oa M 12) M C ...)03 M W 0E i (0 = 17 =0 el Cr 0.0 -1H 1/1 rt.'0 =" A 0,
7" el.-.... M 01 'I 0) 'I n .... m a z o owlO Z .$ W J W = Z mid 0 ...I
m...s fal m r+ ff -J U2 vii 3 ..-1 0o .... 0 0 OAP 0 4010 "S Z et U3 ....hig)
None Number 0 3 1 4 1 0 3 12
0.0 50.0 100.0 100.0 25.0 0.0 60.0 57.1*
Very Number 0 1 0 0 1 0 , 1 3Few
% 0.0 16.7 0.0 0.0 25.0 0.0 20.0 14.3
Some Number 0 2 0 0 1 1 1 5
0.0 33.3 0.0 0.0 25.0 100.0 20.0 23.8
Most Number 0 0 0 0 1 0 0 1
0.0 0.0 0.0 0.0 25.0 0.0 0.0 4.8
All Number 0 0 0 0 0 0 0 0
0.0 0.0 0.0 0.0 0.0 0.0 0.0 0.0
Percent of total
333

306
Table EP-5
Employers' perception of N.Y.C.C.C.graduates' employee characteristics
Characteristics ExcellentVeryGood Good Fair Poor
NotAcceptable
Doesn'tApply
Technicalcompetency
5 5 5 5 1 -
Technical 5 4 6 6 2
knowledge
Theoreticalknowledge
3 4 4 5 3 -
Manipulativeskills
6 4 6 3 2 -
Communicationskills, oral
5 2 8 4 2 -
Communicationskills, written
4 2 5 4 4 -
Mathematiccompetency
2 3 2 3 4 4
Basic sciencebackground
6 2 7 3 3
Adaptability 3 8 5 1 0 1 CO
Responsibility 7 6 3 2 3
Reliability 7 6 4 3 1
Punctuality 6 8 5 1 1
Peer relation-ships 7 6 5 3 0
Supervisorrelationships 6 4 5 3 2
Client/patientrelationships 6 3 5 3 0 410
(continued next page)
334

307
(TaLie EP-5 continued)
Characteristics ExcellentVeryGood Good Fair Poor
NotAcceptable
Doesn'tApply
Initiative
Cooperation
Enthusiasm
Organizationalloyalty
Personal
appearance
Overallrating
Number ofresponses(not including"overall rating")
Percentage ofrespondents
4
6
7
9
10
6
114
27.1
7
6
5
4
3
6
92
21.9
3
3
5
4
5
4
95
22.6
3
3
3
1
3
4
57
13.6
3
1
1
2
0
1
35
8.3
-
-
1
0.2
-
-
6
1.4
335

Table EP-6
Employers' perceptions ofChemical Technology, graduates'employee characteristics
308
CharacteristicsVery Not Doesn't
Excellent Good Good Fair Poor Acceptable APO?'
Technical 1
competency
Technical 1
knowledge
Theoretical 1
knowledge
Manipulative 1
skills
Communication 1
skills, oral
Communication 1
skills, written
Mathematic 1
competency
Basic science 1
background
Adaptability
Responsibility 1
Reliability 1
Punctuality 1
Peer relation-ships 1
Supervisorrelationships 1
Client/patientrelationships 1
(continued next page)
336

309
(Table EP-6 continued)
CharacteristicsVery Not Doesn't
Excellent Good Good Fair Poor Acceptable Apply
Initiative
Cooperation
1
Enthusiasm
Organizationalloyalty
Personalappearance
Overallrating 1
337

Table EP-7
Employers' perceptions of DentalHygiene graduates' employeecharacteristics
310
Characteristics ExcellentVeryGood Good Fair
NotPoor Acceptable
Doesn'tApply
Technicalcompetency
2 2 1 1
Technicalknowledge
2 1 2 1
Theoreticalknowledge
1 2 1 1 1
Manipulativeskills
3 1 2
Communicationskills, oral
1 2 2 1
Communicationskills, written
1 1 2 1 1
Mathematiccompetency
2 1 3
Basic sciencebackground
1 1 3 1
Adaptability 6
Responsibility 4 1
Reliability 4 1 1
Punctuality 3 3
Peer relation-ships 2 3 1
Supervisorrelationships 1 2 1 2
Client/patientrelationships 2 3 1
338
(continued next page)

311
(Table EP-7 continued)
Characteristics ExcellentVeryGood Good Fair
Not Doesn't
Poor Acceptable Apply
Initiative 1 3 1 1
Cooperation 4 2
Enthusiasm 3 2 1
Organizationalloyalty 5
Personalappearance 5
Overallrating 2 3 1
I
339
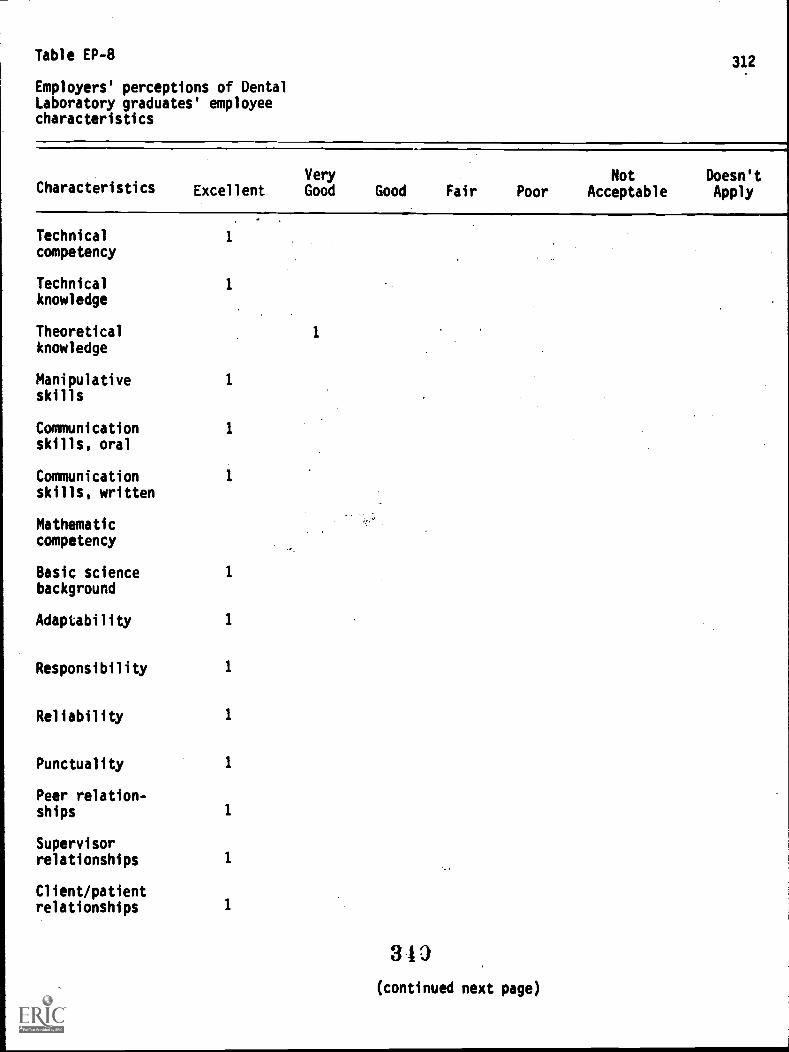
Table EP-8
Employers' perceptions of DentalLaboratory graduates' employeecharacteristics
312
CharacteristicsVery Not Doesn't
Excellent Good Good Fair Poor Acceptable Apply
Technical 1
competency
Technical 1
knowledge
Theoreticalknowledge
Manipulative 1
skills
Communication 1
skills, oral
Communicationskills, written
Mathematiccompetency
Basic science 1
background
Adaptability 1
Responsibility 1
Reliability 1
Punctuality 1
Peer relation-ships 1
Supervisorrelationships 1
Client/patientrelationships 1
1
31J(continued next page)

313
(Table EP-8 continued)
CharacteristicsVery Not Doesn't
Excellent Good Good Fair Poor Acceptable Apply
Initiative
Cooperation
Enthusiasm
Organizationalloyalty
Personalappearance
Overallrating
$
1
1
1
1
1
341

Table EP-9
Employers' percept;ons ofMedical Laboratory graduates'employee characteristics
314
Characteristics ExcellentVeryGood
Technicalcompetency
1 2
Technicalknowledge
1 1
Theoreticalknowledge
1 1
Manipulativeskills
1 2
Communicationskills, oral
1
Communicationskills, written
1
Mathematiccompetency
1
Basic sciencebackground
1
Adaptability 1 2
Responsibility 1 2
Reliability 1 2
Punctuality 1 2
Peer relation-ships 1 2
Supervisorrelationships 2
Client/patientrelationships 2
Not Doesn'tGood Fair Poor Acceptable Apply
1
2
1
3
3
1 2
1 2'
1
1
1
1
1
1
1
342(continued next page)

315
(Table EP -9 continued)
Characteristics ExcellentVeryGood
Not Doesn'tGood Fair Poor Acceptable Apply
Initiative 1 2 1
*Cooperation 1 2 1
Enthusiasm 1 1
Orvnizationalloyalty 2 1
Personalappearance 1 2 1
Overallrating
3 43

Table EP-10
Employers' perceptions ofNursing graduates' employeecharacteristics
316
CharacteristicsVery
Excellent Good Good Fair PoorNot Doesn't
Acceptable Apply
Technicalcompetency
1 2 1
Technicalknowledge
1 2 1
Theoreticalknowledge
1 1 1 1
Manipulativeskills
1 1 2
Communicationskills, oral
1 2 1
Communicationskills, written
1 1 1 1
Mathematiccompetency
1 3
Basic sciencebackground
1 2
Adaptability 1 1 1 1
Responsibility 1 3
Reliability 1 2
Punctuality 1 1 1 1
Peer relation-ships 1 2 1
Supervisorrelationships 1 1 2
Client/patientrelationships 1 1 2
t
(continued next page)

317
(Table EP-10 continued)
CharacteristicsVery
Excellent Good Good FairNot Doesn't
Poor Acceptable Apply
Initiative 1 2 1
Cooperation 1 2 1
Enthusiasm 1 1 1
Organizationalloyalty 2 2 1
Personalappearance 1 1 2
Overall
rating 1 2 1
345

Table EP-11
Employers' perceptions ofOpthalmic Dispensing graduates'employee characteristics
318
CharacteristicsVery Not Doesn't
Excellent Good Good Fair Poor Acceptable Apply
Technicalcompetency
Technicalknowledge
Theoreticalknowledge
Manipulativeskills
Communicationskills, oral
Communicationskills, written
1
Mathematiccompetency
Basic science 1
background
Adaptability 1
Responsibility 1
Reliability 1
Punctuality 1
Peer relation-ships 1
Supervisorrelationships 1
Client/patientrelationships 1
346
1
1
1
1
1
1
(continued next page)
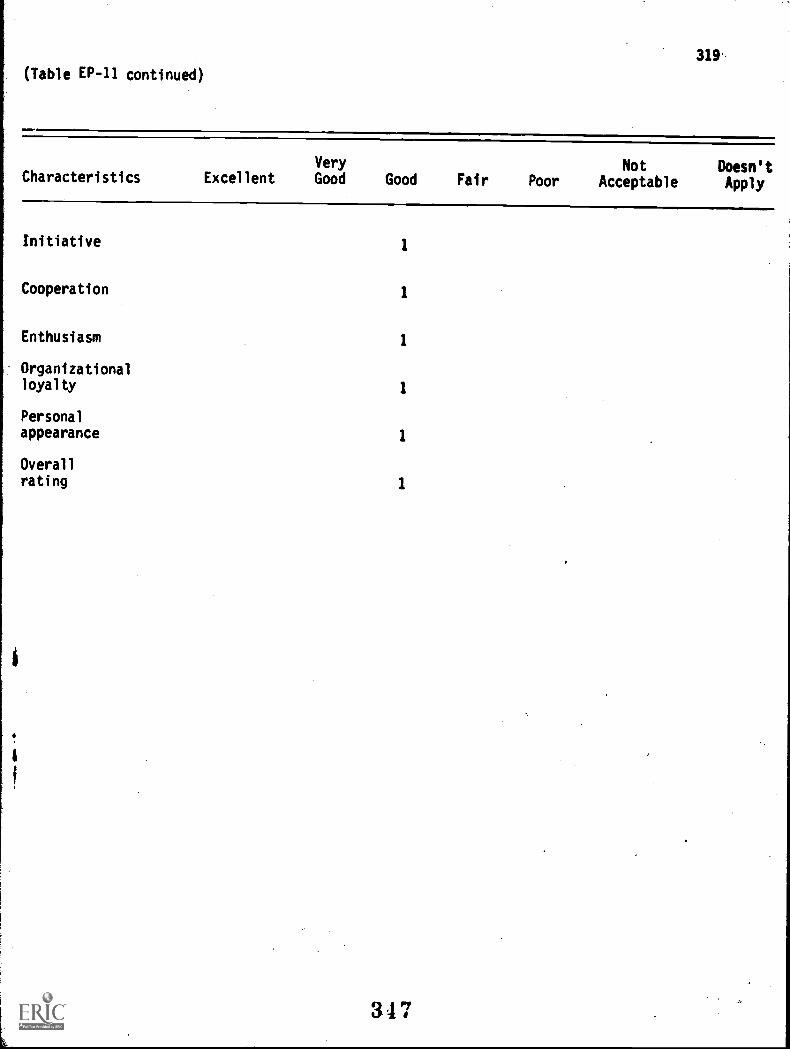
319(Table EP-11 continued)
CharacteristicsVery Not Doesn't
Excellent Good Good Fair Poor Acceptable Apply
Initiative 1
Cooperation 1
Enthusiasm 1
Organizationalloyalty 1
Personalappearance 1
Overall
rating 1
347

Table EP-12
Employers' perceptions ofRadiologic Technology graduates'employee characteristics
320
Characteristics ExcellentVeryGood Good Fair
Not Doesn'tPoor Acceptable Apply
Technicalcompetency
1 2 1
Technicalknowledge
1 2 1
Theoreticalknowledge
1 2 1
Manipulativeskills
1 2 1
Communicationskills, oral
1 2 1
Communicationskills, written
1 1 1
Mathematiccompetency
1 1 1
Basic sciencebackground
1 1 1
Adaptability 2 2
Responsibility 2 1 1
Reliability 2 1
Punctuality 2 2
Peer relation-ships 1 1 1, 1
Supervisorrelationships 1 1 1 1
Client/patientrelationships 2 1 1
(continued next page)
318 a

321
(Table EP-12 continued)
Characteristics ExcellentVeryGood Good Fair
Not Doesn'tPoor Acceptable Apply
Initiative 2 1 1
Cooperation 1 1 1 1
Enthusiasm 1 1 1 1
OrganizationalI loyalty 1 1 1 1
Personalappearance 1 1 1 1
Overallrating 1 1 1 1
319

322
ALLIED HEALTH LEARNING CENTER Section
350

323
Introduction
The Allied Health Learning Center (AHLC) provides various services to
students and faculty of New York City Community College, and has been
providing these services for over two years. During this period some of
the original functions of AHLC were modified, others were added, and
many clients, both student and faculty, were served.
Service may vary both quantitatively and qualitatively and may be evaluated
in many ways, but primarily it must provide the client with the results
desired with a minimum of extraneous effort, time, and procedural waste.
This report provides the results of an evaluation of the services
provided to students and faculty by AHLC.
351

Index to AHLC Subsection
Page
Introduction
History (AHLC and Allied Health Division)
Method and Organization of the Study
Description of AHLC Clients
Patterns of Utilization
Perceived Effectiveness of AHLC
Synthesis and Implication
Tables
352
324

325
BACKGROUND OF AHLC
Many facets of education have become highly systematized, and with systemiza-
tion has come specialization and technology to assist in both smoothing
process flow and diminishing system input deficits. This phenomenon is
particularly apparent in community colleges where all manners of specialized
functions and technological assistance are employed to assure process success:
graduation of an individual meeting at least the minimum academic standards
of the institution. Difficult as the educational process is, the difficulty
is 4ntensely aggravated by extreme heterogeneity of process input, that is,
the diverse proficiency in basic skills possessed by entering students.
A comprehensive support system is required to reduce the degenerative effects
of wide variation of student skills. The Allied Health Learning Center (AHLC)
of New York City Community College was established during the 1972-1973
academic year to provide such support for the Division of Allied Health and
Natural Sciences.
The Division is one of four divisions at New York City Community College
and consists of approximately 1800 students and 180 faculty. The Health
Services programs currently offered by the Division are:
Chemical Technology
Dental Hygiene
Dental Laboratory Technology
Medical Laboratory Technology
Nursing
Opthalmic Dispensing
Radiologic Technology.
353

326
AHLC has developed aid implemented methods and techniques to increase the
probability of academic success of students in the Division. Additionally,
materials have been developed to assist faculty in achieving instructional
goals. The major services of AHLC are:
1. Preparation of Instructional Aids --
primarily a faculty assistance service, includes assistance in
development and preparation of charts, transparencies, models,
slides, etc:
2. Student Services --
includes freshman learning skills program, effective reading program,
open learning lab, peer futuring, adjunct tutoring, and certification
study seminars
3. Faculty Workshops --
for Division faculty; given by AHLC personnel and/or outside
consultants
4. Student Record Services --
for department chairmen, advisors, etc.; includes record review,
computerized student reporting, etc.
5. Audio/Visual Equipment --
includes supplying audio/visual equipment to faculty on request.
327
ORGANIZATION
To reduce student skill variation in Allied Health programs, the Allied
Health Learning Center provides training and remediation in freshman
learning skills and reading in addition to open learning labs, study guides,
certification seminars; and assistance to the faculty for development of
instructional aids, faculty workshops, student record services, etc. The
research reported herein examines clients of the Allied Health Learning
Center (AHLC), their utilization patterns, perceived effectiveness of the
Center, and provides a synthesis of open ended responses and suggestions.
The results reported are in four sections:
Analysis of AHLC clients
Patterns of utilization
Perceived effectiveness
Synthesis and comments.
Sections IV, V, and VI are further divided into two subsections:
A. Faculty
B. Student.
All data herein have been obtained from questionnaires completed by faculty
and students in the Allied Health Division of N.Y.C.C.C. It is assumed
that respondents are representative of the entire faculty and student body
of the division. Possible sampling errors should be considered
ellen examining the data. All tables will be found in the appendix.
355

Analysis of AHLC Clients
A. Faculty
A total of 92 members of the faculty responded to the AHLC questionnaire.
These faculty members were divided by department, position, rank-and tenure
as shown in Tables 1 through 4, and by position, rank and tenure, cross tabu-
lated by department in Tables 5 through 7. Two additional factors were
considered relative to faculty interaction with AHLC: length of service at
N.Y.C.C.C. and prior teaching experience. This data is shown in Tables 8 and 9.
328
B. Students
A total of 495 questionnaires were received from student respondents.
Of these, 52 were discarded because respondents listed their departments as
other than Allied Health Division departments (secretarial sciefte, liberal
arts, etc.), leaving a valid sample of 443 students. As stated above no
responses were received from students of Opthalmic Dispensing. Students
were divided by department as shown in Table 10. Students were further
subdivided by attendance category, enrollment pattern, year of graduation,
year of start, age, and credits transferred into N.r.C.C.C. This informa-
tion is presented in Tables 11 through 16. Additional demographic informa-
tion relative to prior experience and employment was requested of respondents.
This information is presented in Tables 17 and 18.

329
Patterns of Utilization
A. Faculty
For this investigation the various services of AHLC were divided into
five major categories:
1. Preparation of Instructional Aids
2. Student Services, including certification seminars, freshman
learning skills program, effective reading program, open learning
lab (student assistance, faculty and graduate. assistance)
3. Student Record Services (record review, computerized student
reporting)
4. Use of audio/visual equipment
5. Faculty workshops
Faculty use and/or recommendation of the above AHLC services, by department,
were as shown in Table 19. Faculty use of AHLC services was further
analyzed by rank, tenure, and length of service. These results, with
percentages of category are as shown in Tables 20, 21, and 22. It can be
seen from Tables 20, 21, and 22 that, with statistically insignificant
fluctuations, faculty use of AHLC services increases, with rank and tenure,
and, to some extent, with length of service. A mean of approximately 71%
of all responding professors utilize AHLC services with 100% of all responding
professors indicating they use and/or recommend AHLC Student Services. The
percentage of responding faculty using AHLC services decreases to 48.56% for
instruetors. Faculty use of AHLC services decreases from 65.22% for tenured
respondents to 56.96% for non-tenured respondents.
357

330
A similar pattern, although not as definitive, can be seen in Table 22
showing AHLC services utilization by length of service. Responding faculty
with one year service use AHLC services 42.65%. The utilization increases
sharply to 62.86% in, the second year of faculty service and remains within
10% of that figure with continued longevity.
A principal service of AHLC is to provide aid to students with academic
problems. An investigation was made as to whether faculty recommended the
services of AHLC to such students. The results are shown in Tables 23 through
26. It can be seen that almost all categories of faculty make extensive
use of AHLC remedial services. The sole exception is Dental Laboratory
faculty whose utilization rate is 33.3%.
A function of AHLC specifically available to faculty is that of modular
instruction development for both classroom and independent study use. An
investigation of the utilization of this function provided results as shown
in Tables 27 through 30. Nursing and Opthalmic Dispensing faculty appear
to make far greater use of,AHLC facilities for modular instruction develop-
ment than any other department. No other pattern of utilization by faculty
subdivision is indicated.
Another measure of AHLC utilization, the number of professional contacts
between faculty and AHLC personnel per semester was investigated. The
results are shown in Tables 31 through 34. It is apparent that mean numbers
of professional contacts between faculty and AHLC personnel, per semester,
vary widely on all faculty subdivisions:
358.

331
by Department - from a low of 2.5 (Dental Laboratory) to a high of
7.1 (Opthalmic Dispensing)
by Tenure - from a low of 2.5 (Non-tenured) to a high of 5.7
(Tenured)
by Rank - from a low of 2.2 (Lecturer) to a high of 6.8
(Professor)
by Length of - from a low of 1.6 (1 year) to a high of 5.3 (11-30Service
years)
Since there is a relatively high correlation* between Length of Service,
Rank and Tenure, it is not unexpected that these three faculty subdivisions
would provide the same relationships with mean number of AHLC personnel
contacts. The wide disparity in contacts by department does not present
such obvious relationships.
To determine whether utilization of AHLC services were largely a result
of knowledge of availability of those services or some other factor
or factors, faculty awareness of AHLC services was investigated. The results
are shown in Tables 35 through 38. In each faculty subdivision, with the
single exception of Dental Laboratory in the Department subdivision, the
percentage of the subdivision having moderate to complete awareness of
available AHLC services is 60 to 100 percent. With the same exception, no
faculty subdivision exceeds 20% in the percentage that claim no awareness
of available AHLC services.
Pearson r = 0.79, P > 0.001
359

332
B. Students
Of the five major categories of AHLC service, one interacts directly
with students: Student Services. In this study four components of Student
Services were investigated for student utilization:
1. Freshman Learning Skills Program
2. Effective Reading Program
3. Open Lab Program
4. Certification Seminars
In order to become aware of the services available to them at AHLC, students
generally require an explanation of those services and/or a recommendation
of the services. The pattern of explanation/recommendation of AHLC by
department is shown in Tables 39 through 44. It is apparent from Tables 39
through 44 that most students become familiar with AHLC services available
to them from explanations and recommendations by their instructors. Table 39
indicates a total of 66.4% of students receive explanation of the services
from their instructors. If Dental Laboratory Department students, who appar-
ently have very little contact with AHLC, are not included in the computations,
the percentage of students receiving explanation of AHLC services from their
instructors becomes approximately 70%.
Actual use of AHLC services by students is provided in Tables 45 through 50.
From the data in these tables it can be seen that AHLC serves at least 25%
of Allied Health Division students in at least 3 of its Student Services
subcategories. Additionally, the low percentage shown for students attending
Certification seminars may reflect circumstance that those students most
36();

333
likely to have attended certification seminars, those students currently
graduating, probably did not receive questionnaires to complete.
In order to further investigate patterns of utilization, a series of Chi
Square procedures were performed on the factors of source of explanation/
recommendation of AHLC services and attendance at AHLC programs. The results
are shown in Table 51. The Chi Square statistic is an indication of one
(or more) groups' deviation from a "no difference" condition on some measure,
and the Probability (P) indicates the relative certainty that deviation was
caused by chance factors alone. In condition #1 above it is shown that those
students whose instructors explained the services available at AHLC attended
Freshman Skills Lab to a significantly greater level than did those whose
instructors did not. The probability that this greater attendance level was
caused by chance factors alone is less than 0.0000. Condition #2, above,
shows that when instructors recommended AHLC services, the attendance level
is even greater. These same relationships hold true to a lesser extent, for
Student Personnel Services Counselors, and, to the same extent, for Department
Academic Advisors. The effect of advising and/or recommending on Open Lab
attendance is considerably smaller but still significant. There is no effect
of advising and/or recommending on Certification Seminar attendance, most
likely for the reasons stated in the remarks concerning Tables 45 through 50.
361

334
Perceived Effectiveness of AHLC Services
A. Faculty
Perceived effectiveness, of student and faculty services of AHLC,
by members of faculty has been investigated as a part of this research.
Faculty were questioned about their assessment of the value and usefulness
of each major category of AHLC service and several subcategories of those
services.
The results, shown in Tables 52 through 60, indicate number of faculty
responding to each category. Percentages are based on number of faculty
that reported actual use of each service. Because there were no significant
deviations from faculty subdivision percentages, results are reported for
the division as a whole. "Not Applicable" responses are not reported.
In each response in Table 52 (except "red tape"), 75% to 90% of the users of
Instructional Aid Preparation Service believed the service was Always or
Usually helpful.
From the data in Table 53 it can be seen that over 90% of the reporting
faculty believe that student learning was increased as a result of Instruc-
tional Aids prepared by AHLC.
For each of the subcategories analyzed in Table 54, approximately 80% of
faculty responding to the questions believe the service to be necessary
Always or Usually. In each case, however, a slightly smaller percentage
believe the service to be effectively provided Always or Usually. When
362

335
queried as to the advisability of expanding Student Services of AHLC,
45 faculty, 63.4% of those responding, were in favor of such expansion.
It can be seen from the data in Table 55 that a considerably smaller per-
centage of faculty utilize Student Record Services than use most other AHLC
services. Although 39.1% of faculty report using these services (Table 19)
only 28.3% of faculty responded to this section of the questionnaire. These
services are perceived very effective by over 90% of the users in every
aspect except "sufficient detail" where the percentage drops to 80%.
87.5% of responding faculty believe Student Record Services of AHLC facili-
tated their efforts in student placement.
It can be seen in Tables 56 and 57 that both the perceived effectiveness and
benefits of AHLC A/V Equipment Services are high. Over 90% of responding
faculty perceive the scheduling and mechanical quality of the equipment to
be satisfactory and over 80% believe that increased student learning is
attributable to the use of the A/V Equipment Services.
If the No Opinion responses in Table 58 are assumed not to have attended
the workshop in question, the percentage of faculty perceiving Faculty
Workshops of AHLC to be Very Useful or Somewhat Useful is approximately 75%.
It can be seen from Table 59 that 85% to 95% of those faculty utilizing
AHLC Modular Instruction Services believed it to be Always or Usually
effective.
363

336
To investigate perceived effectiveness of AHLC as a unit, one of the final
questions asked of faculty was their rating of AHLC value to students and
faculty of N.Y.C.C.C. This question was asked toward the end of the
questionnaire to allow faculty the opportunity of reviewing their percep-
tions while answering questions about individual AHLC services. The results
of this question, by department and total faculty are shown in Table 60.
It can be seen from Table 60 that 64.2% of all responding faculty consider
AHLC services Extremely Valuable or Very Valuable, and 34.6% consider the
services Somewhat Valuable. Only one individual respondent considers AHLC
services Not Valuable.
B. Students
Perceived effectiveness by Allied Health Division students of various
subcategories of Student Services was investigated as a part of this study.
Students were surveyed to determine their belief as to the help and/or
improvement gained as a 'result of using the service. Results are provided
in Tables 61 through 66. In each table, percentages are based on those
students using the service and responding to the question.
It can be seen from Table 61 that approximately 71% of those students
attending the Freshman Learning Skills Program believe the program increased
their reading skill and improved their study skills, and 83% believed the
program was providing a necessary service. As is shown in Table 62, approx-
imately 70% of those students attending the Effective Reading Program
believed their reading rate and comprehension was improved, and 76% believed
the program was providing a necessary service. In both of these instances,
36 4

337
however, a smaller percentage believed the program increased their confidence
in their ability. Confidence in one's ability and/or awareness of one's
confidence may not be a function of an improvement in that ability, but may
be related to success when using that ability competitively.
Table 63 indicates that approximately 80% of students attending the Open
Lab Program believed assistance obtained was sufficient and helpful. Table
64 provides information that while only 10 students responding to the ques-
tionnaire attended certification seminars, 80% believed them to increase
knowledge in specific subject areas. Of those students responding, 45% plan
to attend future seminars.
Tables 65 and 66 provide an indication of student beliefs as to responsiveness
and effectiveness of AHLC in toto. Approximately 70% of those students
responding believe AHLC is responsive to student needs all or some of the
time and 84% believe AHLC is somewhat, very or extremely helpful.
338
Synthesis and Comments
As might be anticipated, faculty were considerably more expressive than
students in open ended responses, but a sufficient number of responses were
obtained from both groups to justify an analysis. There were, of course, a
great many comments from both faculty and students expressing appreciation
for assistance provided by AHLC, for the quality of that assistance, and for
the time and effort expended in behalf of many individuals. The overall
acceptance and appreciation of AHLC has been documented in Section III:
64% of faculty and 84% of students are shown to believe services of AHLC
are valuable and useful. This section, therefore, must not be construed as
censure of what is obviously a well accepted and valued service, but is a
compilation of the suggestions, comments, and a few criticisms.
Because ultimately the function of AHLC is to increase students' learning,
both indirectly through faculty assistance and directly through various
student programs, it is appropriate to initially examine student comment
and use the analysis of their comments as a base to discuss faculty remarks.
Students, and their comments, can be divided into two groups, and each
primary group divided into two subgroups. The basic groups are, obviously,
those who used AHLC services and those who didn't. The students who did
not use AHLC services did not do so for two reasons, the basis for subdivi-
sion: those who believe they did not need AHLC services and those who never
knew about AHLC services. The students who did use AHLC services can be
subdivided into those who attended voluntarily, believe they were helped,
and desire additional functions to be made a part of AHLC; and those who
attended under duress and have only criticism of AHLC.
366

339
Those students who did not utilize AHLC because they believe they did not
need additional help provided many favorable comments about AHLC, comments
usually based on the help provided to friends and/or fellow classmates.
These comments included "helpful for those with problems," "help when
needed," and similar remarks. This subdivision of students provided a
large percentage of the "Very Helpful" and "Somewhat Helpful" responses to
the questionnaire item pertaining to overall effectiveness of AHLC. Even
though these students may never have visited AHLC they were well aware of
the help AHLC was providing to their peers in academic difficulty.
Students who did not utilize AHLC because they did not know about AHLC were
morl than a small minority and lead one to believe that AHLC's existence
may be one of the better kep secrets at N.Y.C.C.C. Comments from this
subgroup included "Never heard of AHLC," "no knowledge of seminars,"
"instructors should tell us about these programs," and the plaintive
"where were you when I needed you?" These students represent those who
could be helped if a systematic and consistent path of communication could
be established between AHLC and the student body, without bypassing the
faculty.
Students who attended AHLC and attended voluntarily are those who provided
the most positive responses as to the effectiveness of AHLC, and also the
most constructive criticism. Comments included "need more people to help,"
"need more tutors for specific subjects," "should have films for each subject,"
"should have more tapes," and "should provide a place to type reports."
367

340
These comments indicate acceptance of AHLC as a student oriented study
center and the belief that it should be expanded to include many of the
functions of a multi-media library.
Students who attended AHLC involuntarily were, for the most part, quite
bitter about the experience. Most of this subgroup appear to be Dental
Hygiene students and they provided 64% of the "Not Very Helpful" and
"Useless" responses to the questionnaire item pertaining to perceived
effectiveness of AHLC. Their comments ranged from mild: "too noisy" and
"sometimes very boring," through moderately antagonistic: "no one there
who knows anything," to outright hostility: "a complete waste of time,"
and "close it down." A large number of this subgroup believe that compulsory
attendance is an encroachment on their personal time which would be better
spent studying individually.
With the above analysis of student comments and beliefs about AHLC as a
reference, faculty comments can be examined and discussed. The most often
repeated comment appeared as response to questionnaire items pertaining to
expanded and improved Stuaent Services: increased and expanded tutoring
services. Among the suggestions were:
More individual assistance
Saturday and Sunday tutoring sessions
Increased daily hours of operation
Manual skills tutoring
Professional tutors
368
341
Rotating faculty as tutors
Technical language tutoring
Tutoring for non-English speaking students
Mandatory tutorial attendance.
All suggestions except the final one concur with student beliefs about
utilization of AHLC Student Services. Mandatory AHLC attendance by students
will probably not achieve increased learning. AHLC attendance should be
perceived as both voluntary and valuable by students prior to their initial
attendance; from that point on AHLC should be interesting and effective to
maintain attendance.
Many suggestions for additional AHLC services were received from faculty.
These included:
Reports to faculty recommending students as to students' progress,
services used, attendance, etc.
Published list of available services
Published list of A/V aids for each department
Additional departmentally oriented A/V aids
Student academic counseling
Sepirate departmentally oriented tutoring laboratories
Pre-acceptance interview for applicants with learning difficulties
These suggestions for expanded AHLC services also concur with students'
perception of AHLC as a multi-purpose learning laboratory and additionally
reflect the lack of general knowledge of AHLC services among some faculty
as well as students. For the most part there is concordance between faculty
and students who make use of AHLC student services as to form and direction
of expansion.
339.

342
The questionnaire item pertaining to AHLC Faculty Workshop .Improvement
generated a number of suggestions. These included:
Summer workshops when faculty have more free time
Workshops by outside "experts"
Workshops providing more faculty involvement
Future workshops on:
current job markets
current field information
test construction
non-medical healing
health insurance
mental health
alcoholism
modules for student use
modules for faculty use
AHLC facilities
The few negative comments about Faculty Workshops included "insufficient
notice" and "uninteresting."
The questionnaire item referencing AHLC Instructional Aid production drew
almost no response. Several "very satisfactory" and similar comments appeared
along with one suggesting "shorter production time" and one suggesting "more
help." Those faculty using this AHLC service are generally content with its
operation.
When responding to the question pertaining to the future role of AHLC most
faculty believe AHLC should serve functions of remediation and tutorially
370

343
meet specific learning needs of students. Many faculty additionally believe
AHLC should serve as an academic information center or resource center for
faculty. One faculty member neatly summed up the suggestions (and provided
a future motto) with "help students and help faculty help students."
There are, and may always be, those faculty and students who do not want,
nor believe they need, any help teaching or learning. With diligence and
patience many of these individuals may be made aware of the benefits of
AHLC services and some of them may eventually come to use the services.
Most of the faculty and students are aware of AHLC services, use at least
some of them, and believe they are helpful, beneficial, and should be
expanded.
371,.

344
Table 1
Faculty Respondentsby Department
Chemical Dental Dental Medical Opthalmic RadiologicDepartment Technology Hygiene Lab 'Lab Nursing Dispensing Technology Total
Number ofRespondents 12 12 6 19 31 7 5 92
Pericent of
Total 13.0% 13.0% 6.5% 20.7% 33.79 7.6% 5.4% 100.0
372

345
Table 2
Faculty Responseby Position
Positions
Nimber ofRespondents
Percent ofRespondents
Full time faculty 86 93.5%
Part time faculty 4 4.3%
Department chairmen 2- 2,2%
373

346
Table 3
Faculty Responseby Rank
Ranks
Number ofRespondents
Percent ofRespondents
Professor 15 16.3%
Associate Professor 16 17.4%
Assistant Professor 32 34.8%
Lecturer 15 16.3%
Instructor 14 15.2%
37.4

Table Li
Faculty Rasponseby Tenure
Tenures
Tenured
lion-tenured
ofRespondents
46
46
375
347
Percent ofRespondents
50,450.0%

348
Table 5
Faculty Positionby Department
Positions
Chemical Dental Dental Medical Uptnamic HomologicTechnology Hygiene Lab Lab Nursing Dispensing Technology
Full timefaculty
Part timefaculty
Dept.chairman
NuMbr ofrespoe ildents
of dept.*% of total**
0 Edgts% of dept.*% of total**
N rdeno
res nfts
12 11 6 18
100.0%' 91.7% 100.0% 94.7%13.0% 12.0% 6.5% 19.6%
0 1 0 0
0.0% 8.3% 0.0% 0.0%0.0% 1.1% 0.0% 0.0%
0 0 0 1
% of dept.* 0.0% 0.0% 0.0% 5.3%% of total** 0.0% 0.0% 0.0% 1.1%
*Throughout this report "Percentage ofdepartment's total response.
**Throughout this report "Percentage ofresponse.
31 4100.0% 57.1%
33.7% 4.3%
0 20.0% 28.6%0.0% 2.2%
0 1
0.0% 14.3%0.0% 1.1%
480.0%4.3%
20.0%1.1%
00.0%0.0%
department" is defined as percentage of a
total" is defined as percentage of total
3'76

349
Table 6
Faculty Rankby Department
Rankse ca
Technologynta
Hygienental Medical
Lab Lab NursingOpthalmic ,RadiologiODispensing Technology
ProfessorPVIVEdSAts% of dept.% of total
AssociatePrOgdgAts
Professor% of dept.% of total
Assistant VASEdgtsProfessor
% of dept.% of total
Lecturer Numberrespondeonfts
% of dept.% of total
Instructor PillWagts
% of dept.% of total
541.7%
5.4%
3 .
25.0%3.3%
433.3%
4.3%
0
0.0%0.0%
0
0.0%0.0%
325.0%3.3%
433.0%4.3%
2
16.7%2.2%
1
8.3%1.1%
2
16.7%2.2%
1
16.7%1.1%
233.3%
2.2%
16.7%1.1%
2
33.3%2.2%
1025%2.2%
210,5%2.2%
36.87%
7.6%
210.5%
2.2%
6
31.6%6.5%
3
9.7%3.3%
39.7%
3.3%
1445.2%15.2%
8
25.8%8.7%
3
9.7%3.3%
1
14.3%1.1%
1
14.3%1.1%
228.6%2.2%
228.6%2.2%
1
14.3%1.1%
0,0.6%0.0%
1
20.0%1.1%
240.0%2.2%
240.0%2.2%
00.0%0.0%
377

350
Table 7
Faculty Tenureby Department
Tenure:
e caTechnology
0-n TV
Hygiene- nLab
c
Lab Nursing
TN
Dispensing
'r T.
Technology
Tenured
Non -
tenured
Number ofrespondents
% of dept.% of total
NuMber.ofrespondents% of dept.% of total
12
100.0%13.0%
0
0.0%0.0%
758.3%7.6%
541.7%5.4%
3
50.0%3.3%.
3
50.0%3.3%
736.8%7.6%
1263.2%
13.0%
13
41.9%14.1%
18
58.1%19.6%
3
42.9%3.3%
457.1%4.3%
1
20.0%1.1%
4
80,0%4.3%
378
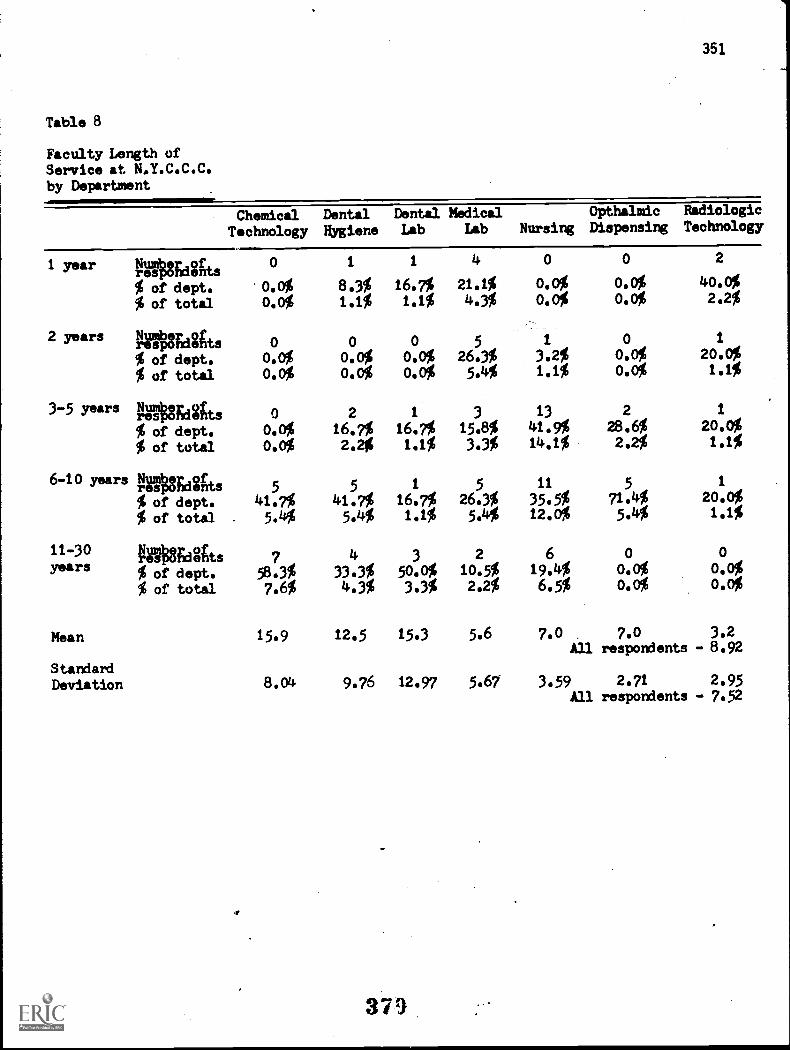
Table 8
Faculty Length ofService at N.Y.C.C.C.by Department
1 year Netumber of
2 years
3-5 years
ndentsrpo% of dept.% of total
giViSfidelts
% of dept.% of total
getiaEaSgts% of dept.% of total
6-10 years 410EdSgts
% of dept.% of total
11-30YVVIOdggts
years% of dept.% of total
Mean
StandardDeviation
351
Chemical Dental Dental Medical Opthalmic Radiologic
Technology Hygiene Lab Lab Nursing Dispensing Technology
0 1 1 4 0
'0.0% 8.3% 16.7% 21.1% 0.0% 0.0% 40.0%
0.0% 1.1% 1.1% 4.3% 0.0% 0.0% 2.2%
0 0 0 5 1 0 I
0.0% 0.0% 0.0% 26.3% 3.2% 0.0% 20.0%
0.0% 0.0% 0.0% 5.4% 1.1% 0.0% 1.1%
0 2 1 3 13 2 1
0.0% 16.7% 16.7% 15.8% 41.9% 28.6% 20.0%
0.0% 2.20 1.1% 3.3% 14.1% 2.2% 1.1%
5 5 1 5 11 5 1
41.7% 41.7% 16.7% 26.3% 35.5% 71.4% 20.0%
5.44 5.4% 1.1% 5.4% 12.0% 5.4% 1.1%
7 4 3 2 6 0 0
58.3% 33.3% 50.0% 10.5% 19.4% 0.0% 0.0%
7.6% 4.3% 3.3% 2.2% 6.5% 0.0% 0.0%
15.9 /2.5 15.3 5.6 7.0 7.0 3.2All respondents - 8.92
8.04 9.76 12.97 5.67 3.59 2.71 2.95All respondents - 7.52
0 2
379

352
Table 9
Faculty Prior TeachingExperience by Department
None WEdgts% of dept.% of total
1 year Nutbe.ofresponraents% of dept.% of total
2 years WEdgits% of dept.% of total
3-5 years Numbe orespondents% of dept.% of total
6-10years
11-30years
Mean
StandardDeviation
WEdgts% of dept.% of total
Number ofrespondents% of dept.% of total
ChemicalTechnology
DentalHygiene
Dental MedicalLab Lab Nursing
OpthalmicDispensing
RadiologicTechnology
8.13%1.1%
541.7%5.4%
233.3%2.2%
526.3%5.4%
722.6%7.6%
6
85.7%6.5%
120.0%lel%
2 0 0 3 1 0 116.7% 0.0% 0.0% 15.8% 3.2% 0.0% 20.0%2.2% 0.0% 0.0% 3.3% 1.1% 0.0% 1.1$
2 3 1 2 2 0 016.7% 25.0% 16.7% 10.5% 6.5% 0.0% 0.0%2.2% 3.3% 1.1% 2.2% 2.2% 0.0% 0.0%
2 3 3 0 8 1 1
16.7% 25.0% 50.0% 0.0% 25.8% 14.3% 20.0%2.2% 3.3% 3,3% 0.0% 8.7% 1.1% 1.1%
4 1 0 3 9 0 1
33.3% 8.3% 0.0% 15.8% 29.0% 0.0% 20.0%4.3% 1.1% 0.0% 3.3% 9.8% 0.0% 1.1%
1 0 0 6 4 0 18.3% 0.0% 0.0% 31.6% 13.0% .0.0% 20.0%1.1% 0.0% 0.0% 6.5% 4.3% 0.0% 1.1%
4.6 2.2 2.3 7.4 5.3 0.6 7.0All respondents - 4.47
3.63 2.91 2.07 10.01 5.10 1.51 8.25
330
All respondents - 6.23

Table 10
Student Respondents
by Department
Chemical
Dental
Dental
Medical
Radiologic
Ophthalmic
Department
Technology
Hygiene
Lab
Lab
Nursing
Technology
Disputing
Number of
Respondents
371
17
175
130
47
46
....1
00
Percent of
CO
Total
0.6%
14.51
3.5%
35.8%
26.6%
9.6%
9.4%

Table 11
Student Attendance
Category by Department
Attendance
Category:
Chemical
Dental
Dental Medical
Radiologic
Ophthalmic
Technology Hygiene
Lab
Lab
Nursing
Technology
Diapanaing
Full time,
day
Part time,
day
Full time,
everirr
Part time,
evening
respondents
f
% of dept.
% of total
Number
respondoenfts
% of dept.
% of total
revser$dgts
% of dept.
4 of total
4018;4ts
i of dept.
1 of total
369
16
115
111
100.0%
97.21
94.1%
65.7%
85.44
0.6%
162%
3.3%
23.6%
22.8%
0
0.0%
0.0%
11
4
1.4%
5.9%
2.3%
0.2%
0.2%
0.8%
44
25
93.6%
54.3%
9.0%
5.1%
52
03.8%
1.54
0.0%
1.0%
0.4%
0.0%
00
028
30
00%
0.0%
0.0%
16.0%
2.36:
0.04
8.7%
0.0%
0.0%
340%
5.7%
.6%
0.04
0.8%
,
01
00%
1.4%
0.0%
0.2%
028
10
017
0.0%
16.0i
7.7%
0.0
37.0%
0.0%
5.7%
2.1%
0.04
3.5%

Table 12
Student Enrollment
Pattern by Department
oo
00
'
00
Enrollment
Pattern,
Chemical
Technology
Dental
Hygiene
Dental Medical
Lab
Lab
Nursing
nadiologic
Technology
Ophthalmic
Dispensing
Continuous N
r of
re
ndents
% of dept.
% of total
Nor.-
Number.of
responnents
continuous
% of dept.
% of total
3
100.0%
0.6%
0
0.0%
0.0%
67
94.4%
14.40
0.0%
0.0%
16
94.1%
3.4%
1
5.91
0.2%
162
92.6%
34.8%
6
3.4%
1.3%
116
89.2%
24.9%
4
3.1%
0.9%
44
93.6%
9.5%
0
0.O
0.0i
44
95.7%
9.5%
24.3%
0.4%
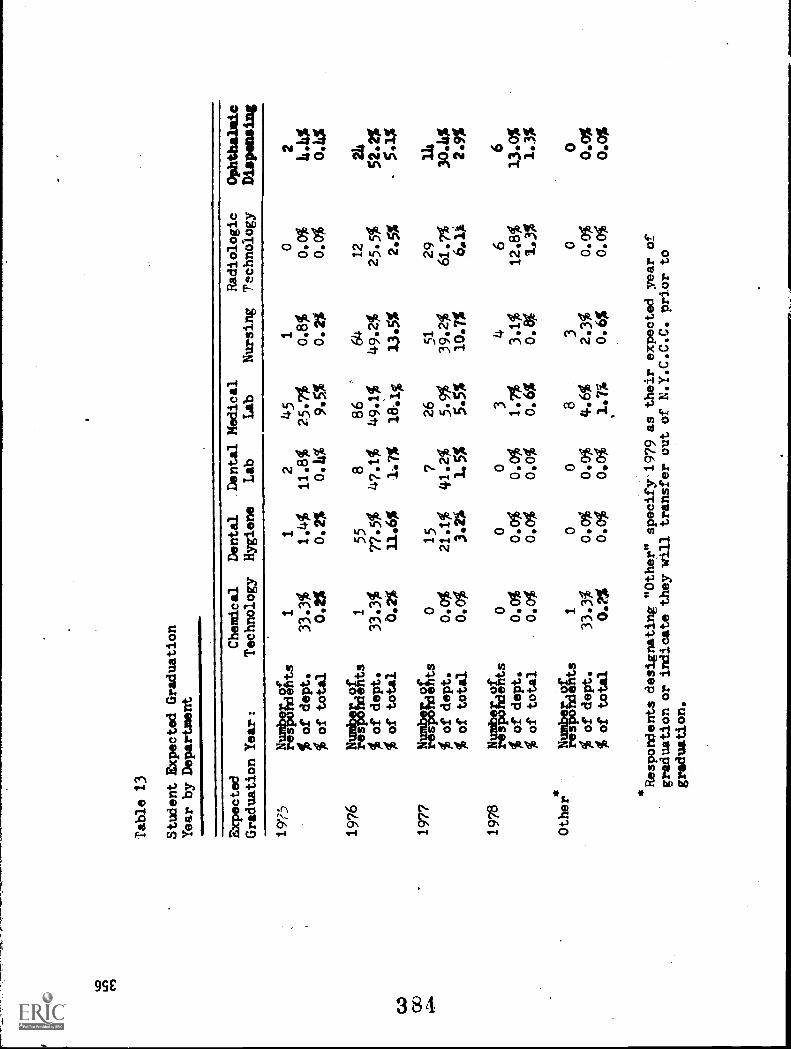
Table 13
Student Expected Graduation
Year by Department
Expected
Chemical
Graduation Year:
Technology
1973
AVEdegts
1
% of dept.
33.3%
% of total
0.2%
1976
PeutardS4is
1
% of dept.
33.3%
41
% of total
0.2%
CO
1977
1108EdSC
b.,.
is
0
% of dept.
0.0%
% of total
0.04
1978
Number.of
respondents
0
% of dept.
0.0%
% of total
.0.0%
*Other
PgregEdgits
1
% of dept.
33.3%
% of total
0.2%
Dental
Hygiene
Dental Medical
Lab
Lab
Nursing
Radiologic
Technology
Ophthalmic
Dispeosing
1
1.4%
0.2%
55
77.5%
11.6%
2
11.8%
0.4%
8
47.1%
1.7%
45
25.7%
9.5%
86
,
49.1%
1841%
1
0.84
0.2%
64
49.2%
13.5%
0
0.0%
0.0%
12
25.5%
2.5%
2
4.4%
0.4%
24
52.2%
5'1%
15
21.1%
3.2%
7
41.2%
1.5%
26
5.9%
5.5%
51
39.2%
10.7%
29
61.74
6Ilji
14
30*4%
2.9%
00
34
66
0.0%
0.0%
1.7%
3.1%
12.8%
13.0%
0.04
0.0%
0.6%
0.8%
1,3%
1.3%
00
83
00
0.0%
0.0%
4.64
2.3%
0.0%
0.0%
0.0%
0,0%
1.7A
0.6%
0.0%
0.0%
Respondents designating "Other" specify 1979 as their expected year of
graduation or indicate they will transfer out of N.Y.C.C.C. prior to
graduation.

Tal:le 14
Stxlent Starting Year
by Department
Starting Year:
,.._
1971
Number.f
responmeonts
% of dept.
% of total
1.72
ileVEderlts
% of dept.
% of total
ic:--
PalMagts
19--
19-=
Otner
% of dept.
% of total
4f18Edegts
% of dept.
% of total
Chemical
Technology
Dental
Hygiene*
Dental Medical
Lab
Lab
Nursing
Radiologic
Technology
Ophthalmic
Dispensing
01
06
60
1
0.0%
1.4%
0.0%
3.4%
4.6%
0.0
2.2%
0.0%
0.2%
0.0%
1.2%
1.2%
0.0%
0.23
01
136
29
31
0.0%
1.4%
5.9%
20.1%
22.3%
6.4%
2.2%
0.0%
0.2%
0.24
7.4%
6.0%
0.6%
0.2%
ilt
11
370
34
54
r0
33.3%
1.4%
17.6%
40.0%
26.2%
10.6%
8.7%
co)
0.2%
0.2%
0.0
14.4%
7.0%
1.0
0.8%
1
33.3%
0.2%
66
93.0%
13.6%
6
41.2%
1.2%
425.1%
8.6%
Number.of
respondents
% of dept.
% of total
1
33.3%
0.2%
2
2.8%
0.4%
741.2%
1.4%
95.1%
1.9%
igglarldSgts
00
09
% of dept.
0.0%
0.0
0.0%
5.1%
% of total
0.0%
0.0%
0.0%
1.9%
55
42.3%
11.3%
32.3%
0.6%
32.3%
0.0
36
76.4%
7.4%
36.4%
0.6%
00.0%
0.0%
19
41.3%
3.9%
21
45.6%
4.3%
00.0%
0.0%
*Respondents designating "Other" as their starting year specify 1968, 1969,
and 1970.

Table 1%
co
ul
Student Age
by Department
Age:
Less
NuMber of
respondents
than 10
% of dept.
% of total
19-20
140 Eats
% of dept.
% of total
21-23
NuMbe
of
responr dents
% of dept.
% of total
GO
Coo
24-26
AVEats
% of dept.
% of total
27-29
Number ndof
respondents
% of dept.
tg of total
30 -35
41138;d&S
% of dept.
4 of total
36-40
NuMbe
of
responr dents
% of dept.
% of total
Over .:.:
114423138EtAgts
% of dept.
% of total
Chemical
Technology
Dental
Hygiene
Dental Medical
Lab
Lab
Nursing
Radiologic
Technology
Ophthalmic
Dispensing
135
112
14
14
133.3%
49.3%
5.9%
6.9%
10.8%
29.8%
2.2%
0.2%
7.3%
0.2%
2.5%
2.9%
2.9%
0.2%
024
759
24
22
16
0.0%
33.8%
41.2%
33.7%
18.5%
46.8%
34.8%
0.0%
5.0%
1.5%
12.2%
5.0%
4.6g
3.3%
17
530
11
213
33.3%
9.9%
29.4%
17.1%
8.5%
4.3%
28.3%
0.2%
1.0%
1.0%
6.2%
2.3%
0.4%
2.7%
03
127
13
36
0.0%
4.2%
5.9%
15.4%
10.0%
6.4%
13.0%
0.0%
0.6%
0.2%
5.6%
2.7g
0.6%
1.2%
00
215
12
46
0.0%
0.0%
11.8%
8.6%
9.2%
8.5%
13.0%
0.0%
0.0%
0.4g
3.1g
2.5%
0.8%
1.2%
11
121
22
12
33.3%
1.4%
5.9%
12.0%
16.9%
2.1%
4.3%
0.2%
0.2%
0.2%
4.4%
4.6%
0.2%
0.4%
00
02
20
01
0.0%
0.0%
0.0%
1.1%
15.4%
0.0%
2.2%
0.0%
0.0%
0.0%
0.4%
4.2%
0.0%
0.2%
01
06
10
11
0.0%
1.4%
0.0%
3.4%
7.7%
2.1%
2.2%
0.0%
0.2%
-.00.0%
1.2%
4.2%
0.2%
0.2%
4 A
411
1 A
na10r
oils
1_

359
Table 16
Student. Credits TransferredIn by Department
Credits:
Chemical Dental Dental Medical
Toehnolory Hyviene Lab Lab
0
1
2
3
4
5
6
7
Numberrespondoenfts 3 60 9 143
% of dept.
Numbersofrespondents% of dept.% of total
40U:its% of dept.% of total
Numberrespondeonfts
% of dept.% of total
AIVErigts% of dept.% of total
Numbrespoenr doenfts
% of dept.% of total
Va111318EdgritS
% of dept.% of total
Numbrespoenr doenfts
% of dept.% of total
8 Number ofrespondents% of dept.% of total
9 or more Number ofrespondents% of dept.% of total
Mean Credits Trans-ferred by Department
Mean Credits Transferredof Those Students Trans-ferring Credits
*Percentage of total
100,0% 84.5% 52.9
0 0 1
0.0% 0.0% 5,9%0.0% 0,0% 0.2%
0 0 30.0% 0.0% 17.6%0.0% 0.0 0.0
0 1 0
0.0% 1.4% 0.0%0.0% 0.2% 0.0%
0 4 1
0.0% 5.6% 5.9%0.0% 0. % 0.2%
0 0 1
0.0% 0.0% 5.9%
0.0% 0.0% 0.2%
0 1 0
0.0% 1.4% 0.00,0% 0.2% 0.0%
0 2 1
0.0% 2.8% 5.9%0,0% 0,4% 0.2%
0 2 0
0.0% 2.8% 0.0%0.0% 0.4% 00%
0 1 1
0.0% 1.4% 5.9%0.0% 0,2% 0.2%
0.0 0.9 1.9
0.0 5.8 4.1
81.7
0
0.0%0.0%
387
6
3.4%1.28
Nursing
RadiologicTechnology
114 3987.7 83.0
1 0
0.8% 0.0%0,2% 0.0%
0 0
0.0 0.0%0,0% 0.0%
21.1%0.1%
7
53.8%1.0%
3
36.4%o.6%
2
4.0% 2.3% 4.3%1.4 0,6% o. ht
7 2 04,0% 1.c% 0,0%1.4% 0.4% 0.0%
4
5 4 1
2.9% 3.1% 2,1%1.0% 0.8% 0,2%
3 1 1
1.7% 0.8% 2.1%0, 0.2% 0.2%
2 0 0
1.1% 0.0% 0.0%0;1$ 0.0 o, 0%
0 0 1
0.0% 0.04 2.1%0.0% 0,0% 0.2%
0.8 0,5 0.9
4,6 4,3 5.0
OphthalmicDispensing
4083.3
00.0%0.0%
00.0%0.0%
00.0%0.0%
00.0%0.0%
00.0%0.0%
00.0%0.0%
0 .
0.0%0.0%
00.0%0.0%
166.7%
1.2%
1.2
9.0

Table 17
Students' Prior Experience
in the Health Field by
Department
Chemical
Dental
Dental Medical
Hadiologic
Prior Experience:
Technology Hygiene
Lab
Lab
Nursing
Technology
Dispensing
None
Aide
LPN
Number of
respondents
% of dept.
% of total
VeliWag ts
% of dept.
% of total
N umber
respondoenfts
% of dept.
% of total
Technician Number of
respondents
of dept.
%.of total
Corpsman
(military)
respondents
4 of dept.
of total
Orderly
Number of
respondents
% of dept.
% of total
2
66.7%
0.4%
0 0.0%
0.0%
1
33.3%
0.2%
0
0.0%
0.0%
0.0%
0.0%
0
0.0%
0.0%
62
87.3%
12.7%
79.9%
1.4%
1 1.4%
0.2%
1
1.4%
0.2%
0,0%
0.0%
0
0.0%
0.0%
15
88.2%
3.11
0
0.0%
0.0%
0
0.0%
0.0%
2
11.8%
0.4%
0 0,0%
0.0%
0
0.0%
0.0%
147
84.0%
30.0%
11 6.3%
2.3%
2
1.1%
0.4%
12
6.9%
2.5%
2
1.1%
0.4
1
0.6%
0.2%
70
53.8%
14.3%
19
14.6%
.3.9%
37
28.5%
7.61
3
2.3%
0.6%
0.0%
0.0%
1
0.8%
0.2%
39
82.9%
7.9%
2
4.3%
0.4%
2
4.3%
0.4%
2
4.3%
0.4%
1
2.1%
0.2%
1
2.1%
0.2i
43
93.5%
8.8%
12.2%
0.2%
00.0%
0.0%
23.4%
0.4%
0 0.0%
0.,04A
0.0%
0.0%

Table 18
_Student Salaried Employment
by Department
Chemical
Dental
Dental Medical
Radiologic
Ophthalmic
Hours EMployeds
Technology Hygiene
Lab
Lab
Nursing Technology
Dispensing
None
Number.of
responaents
2
% of dept.
66.7%
% of total
0.4%
1-10
1144138Edgts
0
% of dept.
0.0%
% of total
0.0%
11-20
Number of
respondents
1
39
'
54.9%
7.9%
952.9%
1.8%
78
44.6%
16.0
53
40.8%
10.8%
2757.4%
5.5%
1430.4%
2.9%
15
211
3,
21.1%
11.8%
6.3%
2.3%
3.14
0.4%
2.2%
0.6%
14
324
23
% of dept.
33.3%.
19.4%
% of total
0.2%
2.9%
21-30
488Edg is
02
% of dept.
0.0%
2.8%
of total
0.0%
0.4%
31-40
Over 40
Number.of
responaents
0
% of dept.
0.0%
% of total
0.0%
Number.of
responaents
% of dept.
0
0.0%
% of total
0.0%
Mean hours
5.0
employed
1
17.6%
13.7%
17.7%
0.6%
1t.9%
4.8%
211
13
11.8%
6.3%
10.0%
0.4%
2.2%
2.7%
I:44
34
45
8.%
10.9 %
0.0%
1. 0%
10
7
21.3%
15.2 %
2,0%
1.5 %
46
8.5%
13.0 50.64
1.2 5
110
1.4%
5.9%
25.1%
26.2%
2.1%
21.7 %
0.2%
0.2%
9.1%
7,017,
0.24
2.1 5
00
74
0.0%
0.0%
4.0%
3.1%
0.0%
0.0%
1.54
0.8%
5.2
8.2
14.5
15,8
14
2.1%
8.7 %
0.2%
0.8 %
7.4
17.1

362
19
Faculty Use of AHLCServices by Department
Services'Chem. Dental Dental. Medical Opthalmic Radio.Tech. Hygiene Lab Lab Nursing Dispensing Tech. Total
Instruct-ional Aids
StudentServices
StudentRecords
A/V Equip-ment
FacultyWorkshops
Wants% of dept.
s Edgrits
% of dept.
respond ants
% of dept.
Num be ofrespondents% of dept.
Ne orespondents% of dept.
Percent of total
3 6 0 12 15 6 4 4625.0% 50.0% 0.0% 63.2% 48.4% 85.7% 80.0% 50.0:
11 10 3 17 30 6 3 8091.6% 83.3% 50.0% 89.5% 96.8% 85.7% 60.0% 86.9
5 5 2 6 12 4 2 3641.7% 41.7% 33.3% 31.6% 38.7% 57.1% 40.0% 39.1%"
5 9 1 14 24 5 3 6141.7% 75.0% 16.7% 73.7% 77.4% 71.4% 60.0% 66.3%"
7 9 1 14 23 5 2 61
58.3% 75.0% 16.7% 73.7% 74.2% 71.4% 40.0% 66.39
300

363
Table 20
Faculty Use of AHLCServices by Rank
Servicess
Associate AssistantProfessor Professor Professor
Instruct-ional Aids
StudentServices
StudentRecords
A/V Equip-ment
FacultyWorkshops
Numberrespondoenfts
% of dept.7
46.7%8
500%19
59.4%
re' lWagts% of dept.
Numbe oresponr denfts
% of dept.
re` rigEdSrits
% of dept.
408EdSgts% of dept.
Mean Percent Use
15100.0%
960.0%
14 2787.5% 84.4%
5 14
31.3% 43.8%
10 11 24
66.7% 68.8% 75.0%
12 11 2280.0% 68.8% 68.8%
70.68 61.28 66.28
391
Lecturer Instructor
746.7%
13
535.7%
11
86.7% 78.6%
5 3
33.3% 21.4%
9 760.0% 50.0%
8 8
53.3% 57.1%
56.0% 48.56
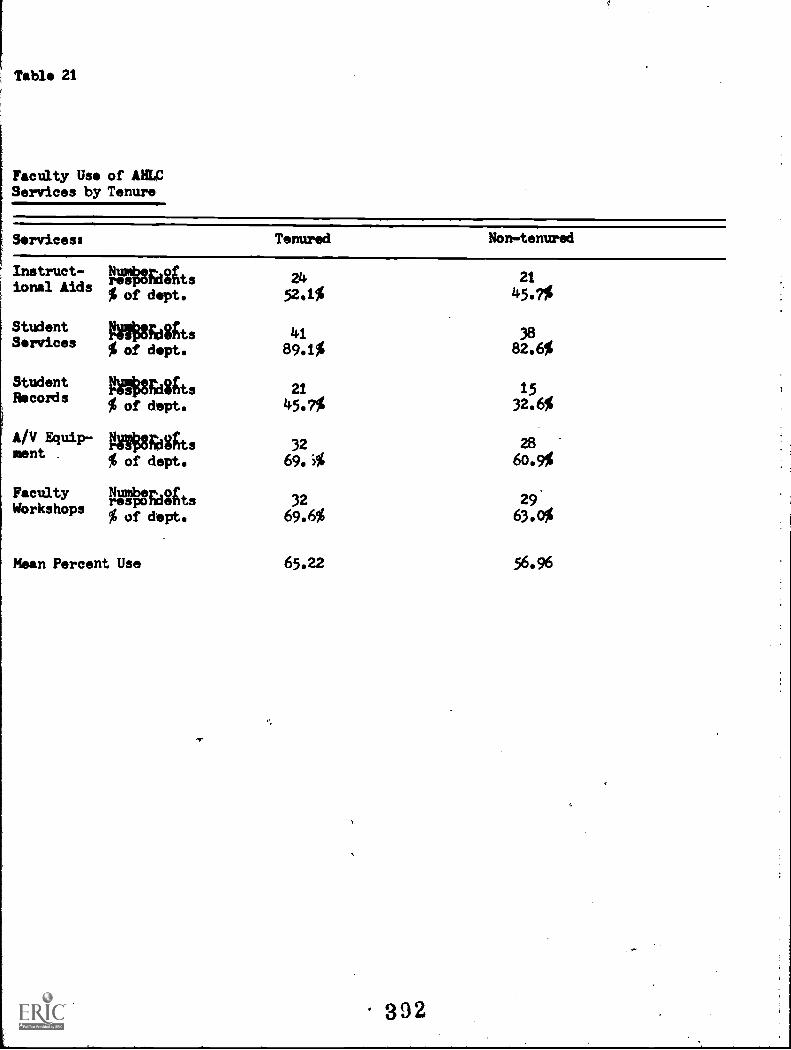
Table 21
Faculty Use of AILServices by Tenure
Servicess Tenured Non-tenured
Instruct-ional Aids
StudentServices
StudentRecords
PAVidggts% of dept.
0g0138E44ts% of dept.
PIESSEdgts% of dept.
2452.1%
89.1%
214%7%
2145.7%
828.6%
1532.6%
A/V Equip-ment .
038Aagts% of dept.
Faculty Number.ofresponnents
Workshops% of dept.
Mean Percent Use
3269.3%
3269.6%
65.22
28
60.9%
29'63.0%
56.96
392

365
fable 22
Faculty Use of AHLCServices by Length of Service
Services:
Instruct-ional Aids
StudentServices
StudentRecords
A/V Equip-ment
FacultyWorkshops
NEdSgts
% of dept.
huSgEdgg ts% of dept.
Numb ofrespoenr dents
% of dept.
1 year 2 years 3-5 years 6-10 years 11 -30 years
4 3 9 21 950.0%. 42.9% 40.9% 63.6% 400%
7 6 18 29 20
87.5% 85.7% 81.8% 87.9% 900%
0 3 7 16 10
0.0% 42.9% 31.8% 48.5% 45.5%
Numbe ofresponr dents 4
% of dept. 50.0%
Number .of.responaents 2
% of dept. 25.0%
Mean Percent Use 42.65
.`1
6 12 26 13
85.7% 54.5% 78.8% 59.1%
4 16 23 16
57.1% 72.7% 69.7% 72.7%
62.86 56.32 69.7 61.82
393

366
Table 23
.Faculty Recommendation of AHLCServices to Students with AcademicProblems by Department
Chemical Dental Dental Medical Opthalmic NadiologicTechnology Hygiene Lab Lab Nursing Dispensing Technology
hirgEdgrits 9 11
% by dept. 75.0% 91.7%
2 17 30 6 4
33.3% 89.5% 96.9% 85.7% 80.0%
394

367
Table 24
Faculty Recommendation of AHLCServices to Students with AcademicProblems by Tenure
Tenured Non-tenured
Number ofrespondents 39 39
% of TenureCondition 84.8% 84.8%
3

368
Table 25
Faculty Recommendation of AHLC .
Services to Students with AcademicProblems by Rank
Associate AssistantProfessor Professor Professor Lecturer Instructor
Number ofrespondents 13 12 29 14 11
% of rank 86.7% 75.0% 90.6% 93.3% 78.6%
396

369
Table 26
Faculty Reconnendation of ABLCServices to Students with AcademicProblems by Length of Service
1 year 2 years 3-5 years 6-10 years 11 -30 years
Number ofrespondents 7 6 20 29 17
% of category 4 87.5% 854% 90.9% 87.9% 100.0%
397

370
Table 27
Faculty Use of ModularInstruction Developmentby Department
Modular Instruction'
For class-room use
For inde-pendentstudy use
Number ofrespondents% of dept.
gas ndsflts% of dept.
ChemicalTechnology
DentalHygiene
Dental MedicalLab Lab Nursing
OpthalaicDispensing
RadiologicTechnology
1 2 0 3 20 38.3% 16.7% 0.0% 15.8% 64.5% 42.9% 20.0%
1 3 3 17 48.3% 25:0% 16.7% 15.8% 54.8% 57.1% 20.0%
333

371
Table 28
Faculty Use of ModularInstruction Developmentby Tenure
Tenured Non-tenured
For class- palmogts
% of categoryroom uses
For inde- N
pendentstudy use
gdSgtsf category
14 1630.4% 34.8%
17 1336.9% 28.3%
399

372
Table 29
Faculty Use of ModularInstruction Developmentby Rank
Associate AssistantProfessor Professor Professor Lecturer Instructor
For class-room use
Numberrespondoenfts
% of waft.2 5 16 6 2
13.3% 31.3% 50.0% 40.0% 14.3%
For rode- Number.ofresponcents 4 8 12 . 5 1pendent study%
of categ. 26.7% 53.3Use % 37.5% 33.3% 7.1%
4 A'

373
Table 30
Faculty Use of ModularInstruction Developnentby Length of Service
Fnr class-room use
For inde-pendentstudy use
41138Edlits% of categ.
Nr of.respouebnnd4nts
% of categ.
1 year 2 years 3-5 years 6-10 years 11-30 years
0 9 16 412.5% 0.0% 40.1% 48.5% 18.9%
0 1 7 16 60.0% 14.3% 31.8% 48.5% 27.3%
4)1

Table 31
Professional Contact BetweenFaculty and AHLC Personnel perSemester by DepartMent
Number of Contacts:
None
1-2 con-tacts/sem.
3-5 con-tacts/sem.
6-8 con-tacts/sem.
9-11 con-tacts/sem.
12 or morecontacts/sem.
11138Edegts% of dept.
gralEdligts% of dept.
448EdSgts% of dept.
Number ofrespondents% of dept.
Number.ofrespondents% of dept.
N umberrespondenofts% of dept.
Mean number ofcontacts perfaculty member
374
ChemicalTechnology
DentalHygiene
Dental MedicalLab Lab Nursing
OpthalmicDispensing
RadiologicTechnology
5 3 4 4 2 2415.7% 41.7% 50.0% 21.1% 12.9%. 28.6% 40.0%
4 1 2 8 18 1 233.3% 8.3% 33.3% 42.1% 58.1% 14.3% 40.0%
3 3 0 2 1 0 025.0% 25.0% 0.0% 10.5% 3.2% 0.0% 0.0%
0 3 0 3 2 2 00.0% 25.0% 0.0% 15.8% 6.5% 28.6% 0.0%
0 0 0 1 2 1 00.0% 0.0% 0.0% 5.3% 6.5% 14.3% 0.0%
2 2 1 3 4 2 116.7% 16.7% 33.3% /5.8% 12.9% 28.6% 20.0%
3.5 4.9 2.5 4.6 3.5 7.1 3.0
4 2

Table 32
Professional Contact BetweenFaculty and AHLC Personnel perSemester by Tenure
Tenured Non-tenured
0
1-2
3-5
6-8
9-11
Over 12
1.1838Eats 7 11
% of categ. 15.2% 23.9%
N r ofreli::ndents% of categ.
1244;::Eagts% of categ.
gglWats% of categ.
NIVEdSgts% of categ.
NuMbe oresponr denf ts
% of categ.
11
23.9%
6
13.0%
715.2%
36.5%
12
26.1%
25
54.3%
36.5%
3
6.5%
1
2.2%
36.5%
Mean Number ofContacts by Tenure 5.7 2.5
4)3
375
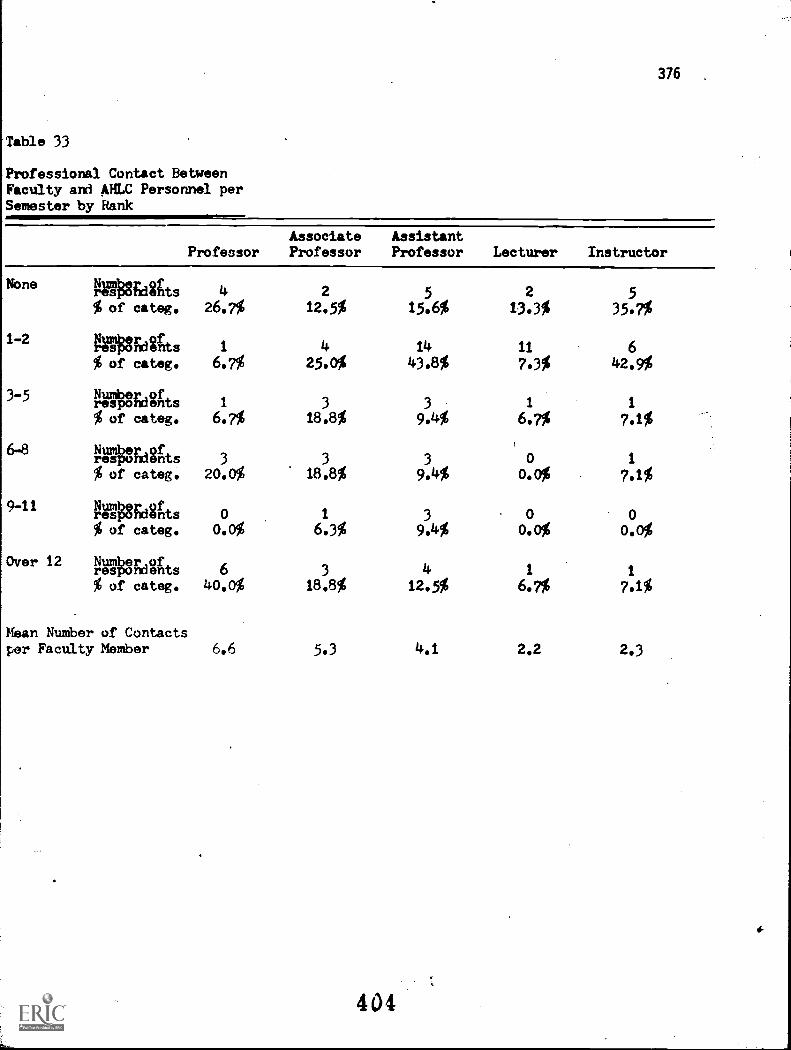
376
Table 33
Professional Contact BetweenFaculty and AHLC Personnel perSemester by Rank
ProfessorAssociate AssistantProfessor Professor Lecturer Instructor
None
1-2
3-5
6-8
9-11
Over 12
gglWagts% of categ.
NuMber ofrespondents% of categ.
Numbe.ofrespornaents
4 2 5 2 526.7% 12.5% 15.6% 13.3% 35.7%
1 4 14 11 6
6.7% 25.0% 43.8% 7.3% 42.9%
1 3 3 1 1
% of categ. 6.7%
Numb orespoenr denfts
% of categ.
Number.ofresponaents% of categ.
Numbefresponr doents
% of categ.
Mean Number of Contactsper Faculty Member
18.8% 9.4% 6.7% 7.1%
3 3 3 0 1
20.0% 18.8% 9.4% o.o% 7.1%
0 1 3 0 00.0% 6.3% 9.4% o.o% o.o%
6 3 1 1
40.0% 18.8% 12.5% 6.7% 7.1%
6.6 5.3 4.1 2.2 2.3
404

377
Table 34
Professional Contact BetweenFaculty and ABLC Personnel perSemester by Length of Service
1 year 2 years 3-5 years 6-10 years 11-30 years
None NuMber orespondenfts 5
% of categ. 62.5%
1-2 Number ofrespondents 1
% of categ. 12.5%
3-5 Migrate 1
% of categ. 12.5%
6-8 NuMber of
00.0%
313.6%
412.1%
6
9.1%
6 15 10 485.7% 68.2% 30.3% 18.2%
0 1 4 30.0% 4.5% 12.1% 13.6%
repandents 1 0 1 6 2
% of categ. 12.5% 0.0% 4.5% 48.2% '9.1%
9-11 Wynagts% of catege
Over 12 %%Regis% of categ.
Mean Number of Contactsby Length of Service
0
0.0%
0
0
0.0%
1
1
4.5%
1
0.0% 14.3% 4.5%
1.6 3.0 2.5
405
3
9.1%
0
0.0%
3.2
0
0.0%
731.8%
5.3
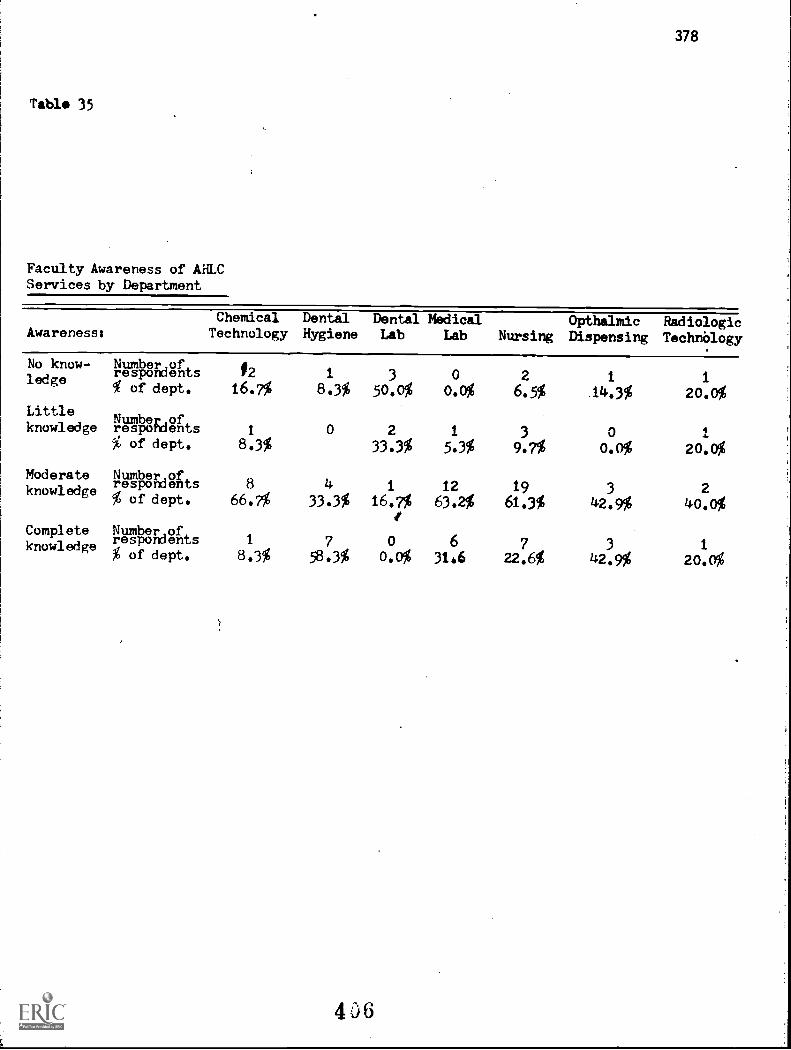
378
Tabl 35
Faculty Awareness of AHLCServices by Department
Awareness*Chemical Dental Dental Medical Opthalmic RadiologicTechnology Hygiene Lab Lab Nursing Dispensing Technology
No know-ledge
Littleknowledge
Moderateknowledge
Completeknowledge
Number orespondenfts
% of dept.
Numb oresponer denfts% of dept.
Number ofrespondents% of dept.
Numberrespondeonfts% of dept.
02 1 3 0 2 1 116.7% 8.3% 50.0% 0.0% 6.5% 14.3% 20.0%
1 2 3 18.3% 33.3% 5.3% 9.7% 0.0% 20.0%
8 4 1 12 19 366.7% 33.3% 16.7% 63.2% 61.3% 42.9%
240.0%
1 7 0 6 7 3 18.3% 58.3% 0.0% 31.6 22.6% 42.9% 20.0%
406

379
Table 36
Faculty Awareness of AHLCServices by Tenure
Tenured Non-tenured
No know-ledge
Littleknowledge
Moderateknowledge
Completeknowledge
Numberponresioenfts
% of tenured
Number.ofresporments% of tenured
Numberrespondoenfts
of tenured
Numbresponer deonfts(% of tenured
5 610.9% 13.0%
2413%
21
613.0%
2745.7% 58.7%
18 739.1% 15.2%
437

380
Table 37
Faculty Awareness of AHLCServices by Rank
AssociateProfessor Professor
AssistantProfessor Lecturer Instructor
No know-ledge
Littleknowledge
Moderateknowledge
Completeknowledge
Numbresponer doenfts% of rank 20.0%
Number ofrespondents 1
% of rank 6.7%
Numerresbpondoenfts 4% of rank
Numresbponer doenfts% of rank
*ft
26.7%
1 3 1 26.3% 9.8% 6.7% 14.3%
0 2 2 300% 6.3% 13.3% 21.4%
850.0%
1856.3%
1280.0%
750.0%
7 7. 9 0 2
46.7% 43.7% 28.1% 0.0% 14.3%
408

381.
Table 38
Faculty Awareness of AHLCServices by Length of Service
1 year 2 years 3-5 years 6-10 years 11-30 years
No know-ledge
Littleknowledge
Moderateknowledge
Completeknowledge
ieurgaftdSrits 1
% of category 12.5%
respondents 1
% of category 12.5%
14481;c1Sints 5% of category 62.5%
i:NeuRbp8Edgrits 1
% of category 12.5%
0
0.0%
2
2
9.1%
2
3
9.1%
2
418.2%
28.6% 9.1% 6.1% 4.5%
5 14 15 1071.4% 77,8% 45.5% 45.5%
0 4 13 70.0% 18.2% 39.4% 31.8%
469

382
Table 39
Explanation of AHLC ServicesFrom Instructors by Department
ChemicalTechnology
DentalHygiene
Dental MedicalLab Lab Nursing
RadiologicTechnology Total
Yes NuMber.ofrespohoenti 2 6o 1 104 97 30 2944 of dept. 65.7% 84.5% 5.9% 59.4% 74.6% 63.8% 66.4%
No NaMber ofrespondents 1 11 16 71 33 17 149% of dept. 33.3% 15.5% 94.1% 40.6% 25.4% 36.2% 33.6%
4 0

383
Tabl. 40
Recommendation of ABLC ServicesFrom Instructors by Department
Chemical
TechnologyDentalHygiene
Dental MedicalLab Lab Nursing
RadiologicTechnology Total
Yes
No
hldegts% of dept.
Number orespondenfts% of dept.
1
33.3%
2
66.7%
6388.7%
811.3%
2
11.8
15
88.2%
101
57.7%
74
42.3%
8666.2%
4433.8%
3063.8%
1736.2%
283
63.9%
16036.1%
411

384
Table 41
Explanation of AHLC ServicesFrom Student Personnel ServicesCounselors by Department
ChemicalTechnology
DentalHygiene
Dental MedicalLab Lab Nursing
RadiologicTechnology
Total
Yes
No
Number ofrespondents% of dept.
Numberesponr denofis% of dept.
1
33.3%
2
66.7%
32
45.1%
39
54.9%
1
5.9%
16
94.1%
45
25.7%
130
74.3%
38
29.2%
92
70.8%
17.
36.2%
3063.8%
13430.2f
30969.8%
4i2

Table 42
Recommendation of AHLC ServicesFrom Student Personnel ServicesCounselors by Department
385
Chemical Dental Dental Plecticir
Technology Hygiene Lab Lab Nursing Technology Total
Yes
No
gglilliEdggts 1
% of dept. 33.3%
gg1138Edelgts 2% of dept. 66.7%
28- 0 41 38 15 123
39.4% 0.0% 23.4% 29.2% 31.9% 27.8%
43 17 134 92 32 320
60.6% 100.0% 76.6% 70,8% 68,1% 72.2%
413
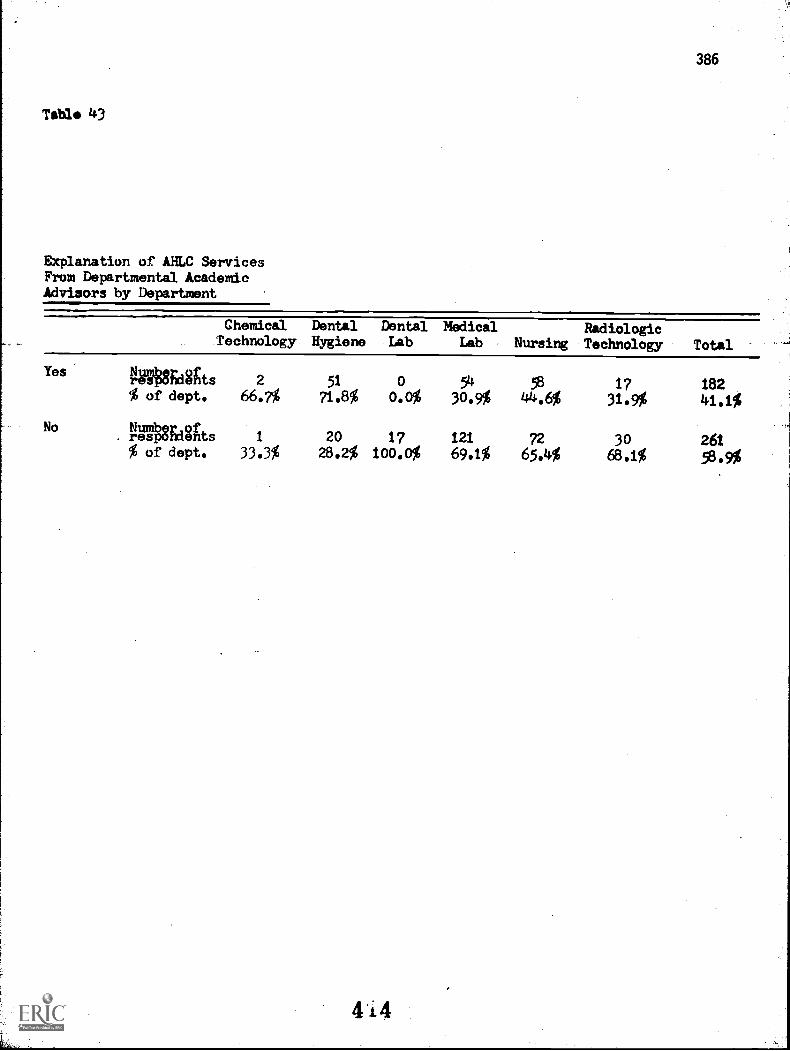
386
Table 43
Explanation of. AHLC ServicesFrom Departmental AcademicAdvisors by Department
ChemicalTechnology
Yes gMEats 2
% of dept. 66.7%
No Number ofrespondents 1
% of dept. 33.3%
DentalHygiene
DentalLab
MedicalLab Nursing
RadiologicTechnology Total
51 0 54 58 17 18271.8% 0.0% 30.9% 44.6% 31.9% 41.1%
20 17 121 72 30 26128.2% 100.0% 69.1% 65.4% 68.1% 58.9%
4 4

387
Table 44
Recommendation of AHLC ServicesFrom Departmental AcademicAdvisors by Department
Chemical Dental Dental MedicalTechnology Hygiene Lab Lab Nursing
RadiologicTechnology Total
Yes
No
1108Edegts% of dept.
438Edgits% of dapt.
1
33.3%
2
66.7%
47 0 47 5766.2% 0.0% 26.9% 43.8%
24 17 128 7343.8% 100.0% 73.1% 56.2%
415
17 16931.9% 38.1%
30 268.1% 61.749%

388
Table 45
Students Attending FreshmanLearning Skills Laboratoryby Department
Yes
No
432Edgits% of dept.
Numbrespoenr doenfts% of dept.
ChemicalTechnology
DentalHygiene
DentalLab
MedicalLab Nursing
RadiologicTechnology Total.
1 48 0 9 49 6 11333.3% 67.6% 0.0% 5.1% 37.7% 12.8% 25.5%
2 23 17 166 81 41 33066.7% 32.4% 100.0% 94.9% 62.3% 87.2% 74.5%

389
Table 46
Students Attending EffectiveReading Program by Department
ChemicalTechnology
DentalHygiene
DentalLab
MedicalLab Nursing
RadiologicTechnology Total
Yes Number ofrespondents 0 67 0 13 62 6 148
of dept. 0.0% 94.4% 0.0% 7.4% 47.7% 12.8% 33.4%
No Number ofrespondents 3 4. 17 162 68 41 295% of dept. 100.0% 5.6% 100.0% 92.6% 52.3% 87.2% 66.6%
417

390
Table 47
Students' Attendance of EffectiveReading Program Sessions by Department
ChemicalTechnology
DentalHygiene
Dental
LabMedical
Lab NursingRadiologicTechnology Total
1 0 5 0 1 3 0 9
2 0 3 0 1 7 0 11
3 0 0 0 1 4 0 5
4 0 0 0 0 5 0 5
5 0 2 0 0 4 1 $
6 0 5 0 1 7 0 13
7 0 40 0 1 8 0 50
8 0 t 0 1 3 0 7
9 0 2 0 0 3 0 5
4 i 8

391
Table 48
Students Attending Open LabProgram by Department
ChemicalTechnology
DentalHygiene
Dental MedicalLab Lab Nursing
RadiologicTechnology Total
Yes
No
Number ofrespondents% of dept.
Number ofrespondents% of dept.
2
66.7%
1
33.3%
27
38.0%
4462.0%
1
5.9%
16
94.1%
3117.7%
144
82.3%
3930.0%
91
70.7%
11
23.4%
3676.6
111
25.1%
332
74.9%
419

392
Table 49
Students' Use of Open LabFacility by Department
Assistance Obtained:Chemical Dental Dental Medical Radiologic
Technology Hygiene Lab Lab Nursing Technology Total
Peer Assis-tance
Graduate/FacultyAssistance
IndividualStudyModules
StudyGuides
StudyMaterial s
Numb oresponer denfts
74, of dept.
Plumber of
% of dept.
Number orespondenftsof dept.
Number orespondenfts
of dept.
Number orespo ndenfts
% of dept..
2 4 0 20 17 4 4766.7% 5.6% 0.0% 11.4% 13.1% 8.5% 10.6%
1 9 0 7 11 3 3133.13 12.7% 0.0% 4.0% 8.5% 6.4% 7.0%
2 19 1 17 34 8 8166.7% 26.7% 5.9% 9.7% 26.2% 17,0 18.3%
0 8 0 9 19 1 370.0% 11.3% 0.0% 5.1% 14.6% 2.2% 8.4%
0 15 0 12 22 4 530.0% 21.1% 0.0% 6.9% 16.9% 8.5% 12.0%
420

393
Table 50
Students Attending CertificationSeminars by Department
Chemical Dental Dental Medical RadiologicTechnology Hygiene Lab Lab Nursing Technology Total
Yes Number ofrespondents 0 2 1 5 2 0 10% of dept. 0.0% 2.8% 5.9% 2.9% 1.5% 0.0% 2.3%
No Number ofrespondents 3 69 16 170 128 47 433% of dept. 100.0% 97.2% 94.1% 97.1% 98.5% 100.0% 97.7%

394
Table 51
Results of 2x2 Chi Square ProceduresOn Source of Information vs. Use ofAHLC Services
Condition Source
1 Instructor Explained
2 to t,
3 n
L i. ft It
5 Instructor Recommended
6 n n
7 n"
6 n u
9 S.P.S. CounselorsExplained
10 u n
11 1, u
12 t, tt
13 1;PcgAeCgrelors
14 u u
15 u u
16 u u
17 Dept. Acad. AdvisorsExplained
18 it t,
19 n
20 t,
21 Dept. Acad. AdvisorsRecommended
22 " ft
23 u n
24 n ,,
Service NChi
Square
Attended Fresh. Skills Lab 452 29.188 0.0000
nEffective Reading Prgm. 446 39.661 0.0000
uOpen Lab 433 9.912 0.0016
It
n
t,
Certification Seminar
Fresh. Skills Lab
Effective Reading Prgm.
299
454
445
0.694
45.568
57.144
0.4045
0.0000
0.0000
" Open Lab 434 8.349 0.0039
" Certification Seminar 299 0.155 0.6937
Fresh. Skills Lab 447 23.650 0,0000
ft
Effective Reading Prgm. 435 20.497 0.0000
Open Lab 425 8.473 0.0036
tt
Certification Seminar 290 0.106 0.7445
,,
Fresh. Skills Lab 446 13.061 0.0003
HEffective Reading Prgm. 434 20.114 0.0000
uOpen Lab 422 8.061 0.0045
uCertification Seminar 290 0.001 0.9707
1,
1,
"
Fresh. Skills Lab
Effective Reading Prgm.
Open Lab
455
446
434
43.943
60.252
12.293
0.0000
0.0000
0.0005
1,
Certification Seminar 299 0.431 0.5115
" Fresh. Skills Lab 449 40.288 0.0000
" Effective Reading Prgm. 438 54.963 0.0000
,,
Open Lab 430 13.012 0.0003
" Certification Seminar 295 0.091 0.7629
422

395
Table 52
Perceived Effectiveness inInstructional Aid Preparation
Effectiveness
Was assistance in developmentof materials provided
% of fac.
Were materials correctlyproduced
Were materials producedeffective
Did materials arrive on time
Was reproduction and distri-bution of materialssatisfactory
Was "red tape" excessive
NuMber ofrespondentsof fac.
b-Numer.ofrespondents
of fac.
Number.ofrespondents% of fac.
AVEdgtsof fac.
Ner oreuMbspondenftsof fac.
Always Usually Sometimes Never
33 9 1
68.8% 18.8% 10.54% 2.1%
28 12 562.2% 26.7% 11.1% 0.0%
29 11 4
65.9% 25.0% 9.1% 0.0%
25 10 759.596 23.8% 16.696 0.0%
28 7 668.3% 17.1% 15.6% 0.0%
1 1 7 282.7%
2°7% 18.9% 75.7%
423

396
Table 53
Perceived Benefit ofInstructional Aid Preparation
Benefit Yes Sometimes No
Allowed use of materialsnot otherwise available
Students learning wasincreased by thesematerials
Number orespoendenfts 21 15 13% of fac. 42.9% 30.6% 26.5%
AT1138Edgts 34 9 4% of fac. 72.3% 19.1% 8.5%
4%4

397
Table 54
Perceived Effectiveness ofAHLC Student Services
Effectiveness:
Certification Seminars Always Usually Sometimes Never
Provide a necessaryservice
Increase student.,
knowledge
Increase certifi-cation/licensuretest passing pro-bability
Increase studentconfidence
Freshman LearningSkills Program
Provides a neces-sary service
Increases studentreading and studyskills
Increases certifi-cation/licensuretest passing pro -babil ity
Effective ReadingProgram
Provides a necessaryservice
lncreases studentreading rate andcomprehension
Increases studentconfidence
Numberrespondeonfts
% of fac.
NuMbresponer deonfts
% of fac.
Numberrespondoenfts
% of fac.
Numerresbpondeonfts
% of fac.
Numer oresbpondenfts
of fac.
Numbresponer deonftsof fac.
Numberrespondeonftsof fac.
Number ofrespondents% of fac.
Numerresbpondeonfts
of fac.
Numbresponer deonfts
of fac.
22 2445.8% 50.0%
14 27
15 21
31.3% 43.7%
16 2232.7% 44.9%
25 2242.4% 37.3%
16 2227.9% 37.9%
13 2425.5% 47.1%
27 1650.0% 29.6%
18 20
32.7% 36.4%
16 2130.2% 39.696
425
24.2%
9
1225.0%
1122.4%
1220.3%
2034.5%
1427.5%
11
.20.4%
1527.3%
1528.3%
0
o.o%
0
o.o%
0
o.o%
0
0.0%
o.o%
1
1.7%
0
o.o%
1
1.9%
23.6%
(continued next page)

(Table 54 continued)
Open Learning Lab Always Dually Sometimes NOM"
Provides a necessaryservice
Increases studentknoWledge
Increases studentconfidence
Numerresbpondoenfts
% of fac.
Number ofrespondents% of fac.
Numerresbpondeonfts% of fac.
21 27 13 0
34.4% 44.3% 21.3% 0.0%
1524.6%
1727.9%
4 ' 6 .
26 20 0
42.6% 32.8% 0.0%
2 18 1
4266% 29.5% 1.6%
398

399
Table 55
Perceived Effectiveness of AHLCStudent RecoN Services
Effectiveness:
Student Data and RecordReview Schedules havebeen Always Usually Sometimes Never
Prompt Number ofrespondents
% of fac.
Helpful VOSEdgts% of fac.
In useable format 41117.0fndehts
% of fac.
In sufficientdetail
Number ofrespondents% of fac.
16 9 1 061.5% 34.6% 3.8% 0.0%
14 11 1 053.8% 42.3% 3.8% 0.0%
13 11 2 050.0% 42.3% 7.7% 0.0%
12 9 4 146.2% 34.6% 15.4% 3.8%
427

400
Table 56
Perceived Effectiveness ofAHLC A/V Equipment Services
Effectiveness:
olhen requesting A/V
Equipment, was it Always Usually Sometimes Never
Available asscheduled
In goodcondition
Numberrespondents 26 9 2 0% of fac. 70.3% 33.3% 7.4% 0.0%
Numberrespondents 26 11 1 0% of fac. 68.4% 28.9% 2.6% 0.0%
428

Table 57
Perceived Benefits of AHLCA/V Equipment Services
Benefits:Yes Sometimes No
Allowed use of more A/Vequipment than other-,wise possible
Students' learning wasincreased by use ofequipment
Numberresbpond oenfts 22of fac. 55.0%
Number of 26reondents% of fac. 68.4%
429
11 727.5% 17.5%
7 518.4% 13.2%
401

402
Table 58
Perceived Effectiveness ofAMC Faculty Workshops
Faculty Workshops forsVery
UsefulSomewhatUseful Useless
NoOpinion
Writing instructionalobjectives
Design and prepara-tion of instructionalmaterials
Design and productionof modular -instruct-tion
Allied Health facultyorientation
Determination oftextbook readability
Systems approach toinstruction
Techniques for validstudent performanceevaluation
ii-Sq8Edgts% of fac.
ri-andegts% of fac.
N;:mber.of.responaents%"of fac.
gragagts% of fac.
NuMbe ofresponr dents
% of fac.
Peglindgits% of fac.
Numbponer
frespondents% of fac.
18
43.9%
I
1024.4%
49.8%
922.0%
16
39.0%16
39.0%3
7.3%6
14.6
10 18 5 625.6 46.2% 12.8% 15.4%
14 10 5 1234.1% 24.4% 12.2% 29.3%
10 15 3 827.8% 41.7% 8.3% 22.2%
6 8 5 1617.1% 22.9% 14.3% 45.7%
7 10 5 1419.4% 27.8% 13.9% 38.9%
430
.
.

403
Table 59
Perceived Effectiveness of AHLCModular Instruction for Student Use
Modular Instruction was Always Usually Sometimes Never
Helpful
In useableformat
Available tostudents
NuMb orespoenr d ef nts
% of fac.
Number orespondenfts% of fac.
Number ofrespondents% of fac.
9 13
39.1% 56.5%
8 1336,4% 59.1%
12 754.5% 31.8%
431
1
4,3%
1
4.5%
1
4.5%
00.0%
00.0
2
9.1%.

404
Table 60
Perceived Value of AHLC toStudents and Faculty of N.Y.C.C.C.
Chemical Dental Dental Medical Opthalmic Radio.Technology Hygiene Lab Lab Nursing Dispensing Tech. Total
Extremelyvaluable
Very valu-able
Somewhatvaluable
Not valu-able
Wrespondents% of dept.% of total
Number ofrespondents% of dept.% of total
0 5 0 1 100.0% 45.5% 0.0% 5.3% 35.7%04% 6.2% 0.0% 1.2% 12.3%
40.0%4.9%
Number ofrespondents 6
% of dept. 60.0%% of total 6.9%
NuMerresbpondoenfts 0
% of dept. 0.0%' of total 0.0%
5 2 1145.5% 66.7% 57.9%6.2% 2.5% 13.6%
1 1 79.1% 33.3% 36.8%1.2% 1.2% 8.6%
517.9%6.2%
1242.9%14.8%
1716.7% 00%1.2% 0.0% 21.0%
5 383.3% 75.0%
35
6.2% 3.7% 43.2%
0 1 280.0% 25.0%0.0% 1.2% 34.6%
0 0 0 1
0.0% 0.0% 0.0% 3.6% 0.0% 0.0%0.9% 0.0% 0.0% 1.2% 0.0% 0.0% 1.2%
432

Table 1
Student Pr'rceivrld Effectiveness ofFrPshman Learning Skills Program
Objective:
Helped Yes Sometimes No
Improve reading skill Number frespondeonts 65 17 30% of students 5B.0% 15.2% 26.8%
Improve study skills Number ofrespondents 30 37% of students 37.6% 27.5% 33.9%
Increase biostatistic Number ofunderstanding respondents 31 33 39
of students 30.1% 32.0% 37.9%
Increase confidence
Provides a necessaryservice
Number ofrespondents 39 25 39'14 of students 37.9% 24.3% 37.9%
Numbefresponr dents 43 44 17g of students 41.3% 42.3% 16.3%
433,,
405

Tabl. 62
Student Perceived Effectivenessof Effective Reading Program
Objectives
Helped Yes Sometimes No
Improve reading rate
Improve reading com-prehension
Increase confidence inability
Number orespondenfts 79 25 37
of students 56.0% 17.7% 26.2%
NuMberresponde
onfts 71 31 42
% of students 49.3% 21.5% 29.2%
respond oenfts
of students55 35 48
39.9% 25.4% 34.8%
Provides a necessary service Number ofrespondents 67 35 31% of students 50.4% 26.3% 23.3%

Table 3
Student Perceived Effectivenessof Open Lab Program
Objective, Yes Sometimes No
WA assistance helpful
?Jas assistance sufficient
Were study qnides helpful
Number ofrespondentsof students
Number ofrespondentsof students
Number orespondents% of students
7468.5%
60
57.7%
4558.4%
2220.4%
31
29.8%
1620.8%
12
11.1%
13
12.5%
1620.8%
Were study materia)s helpfulVgnsilladgts
% of students 58.2% 25.3% 16.5%53 23 15
435
407

Table 64
Student Perceived Effectivenessof Certification Seminars
Objectives
Increased Yes No
Knowlcde in subject areas
Confidence in ability
Plan to attend future seminars
Numerresbpondoenfts
% of students
responNumber doenfts
% of students
Numresbponer doenfts
% of students
880.0%
770.0
9945,8%
2
20.0%
330.0%
IV?54.2%
436
408

409
Table 65
Student Perceived Responsive-ness of AHLC
Yes Sometimes No
Responsive to students' needs Number ofrespondents
% of students
82
29.6%
109
39.4%
86
31.0%

410
Table 66
Students Perceived Effectivenessof AHLC by Department
RatingsChemical Dental Dental Medical Radiologic
Technology Hygiene Lab Lab Nursing Technology Total
Extremelyhelpful
Very help-ful
Somewhat
helpful
Not veryhelpful
Useless
Numbresponer doenfts 0 3 0 8 13 9 33 Jo% of dept. 0.0% 4.2% 0.0% 4.6% 10.0% 19.1% 12.6%
respondentso
0 10 1 32 34 11 88% of dept. 0.0% 14.1% 5.9% 18.3% 26.2% 23.4% 33.611
Numberrespondeonfts 1 27 2 29 34 6 99 *% of dept. 33.3% 38.0% 11.8% 16.6% 26.2% 12.8% 37.8%
bNume ofresponr dents 0 14 1 5 2 1 23 .% of dept. 0.0% 19.7% 5.9% 2.9% 1.5% 2.1% 8.8$r
Numberrespondoenfts 0 13 2 1 2 1 19% of dept. 0.0% 18.3% 11.8% 0.6% 1.5% 2.1% 7.39
Percent of total responding to this item
438

411
Appendix
439

412
Graduate Biography and Perceptions Questionnaire
440

New York City Community CollegeOF THE CITY UNIVERSITY OF NEW YORK, 300 JAY STREET, BROOKLYN, N.Y. 11201
ALLIED HEALTH PROGRAM SURVEY
Please CIRCLE the number of the response that is your current answer toeach multiple choice question. If the question requires a write-inanswer, please PRINT your response.
413
1. Name:
2. Social Security Number:
10 3. Program:
11 4. What was your predominant attendance category?
1. Full time/Day 2. Part time/Day 3. Full time/Evening 4. Part time/Evening
12 5. What was your enrollment pattern?
1. Continuous 2. Non-continuous
13 6. What was your year of graduation?
1. 1968 2. 1969 3. 1970 4. 1971 5. 1972 6. 1973 7. 1974 8. 1975
.14 7. Which year did you start New York City Community College (N.Y.C.C.C.)?
1. 1965 2. 1966 3. 1967 4. 1968 5. 1969 6. 1970 7. 1971 8. 1972 9. 1973
15 8. Did you transfer into N.Y.C.C.C. from another college and how many creditsdid you transfer .
O. Did not transfer in Number of credits transfered: Z
9. If you transfered into N. Y. C. C. C., from what college did you transfer?
17 10. What is your present age?
1. 19 2. 20 3. 21 4. 22 5. 23 6. 24 7. 25-30 8. 30-40 9. over 40
18 11. What type of experience in the Health Field did you have before or during yourenrollment in N. Y. C. C. C.?
O. None 1. Aide 2. Licensed Practical Nurse 3. Technicial 4. Orderly(civilian)
5. Corpsman(military) 6. Transfer from Associate program
7. Transfer from BS program 8. Other
19 12. On the average, hom many hours per week were you employed for a salaryduring your enrollment at N. Y. C. C. C.?
O. 0 hours 1. 1 to 10 hours 2. 10 to 20 hours 3. 20 to 30 hours 441
4. 30 to 40 hours 5. more than 40 hours per week

20 13. Are you currently employed in the field directly related to the departmentin which you were trained at N. Y. C. C. C.?
O. No 1. Yes, full time 2. Yes, part time
14. Who is your current employer?
15. What is your job title?
21 16. If you are not currently employed in the field for which you were directlytrained at N. Y. C. C. C. indicate the main reason:
1. Continuing education 2. Serving in Armed Services 3. Inadequate salary
4. Married and/or raising children 5. Health reasons 6. Loss of interest
7. No jobs available 8. Not certified 9. Other (explain)
22 17. If you are not currently employed in the field for which you were trained andhave changed to another health related field indicate the main reason:
O. Did not change fields 1. Better salary 2.More opportunity for advancement
3. More jobs available 4. More interesting Work
231
18. What is your current salary?
O. $0.00 1. Below $5000.00 2. $5000 - $7000 3. $7001 - $9000 4. $9001-$11,000
5. $11,001 - $13,000 6. $13,001 - $15,000 7. $15001 - $17,000 8. Over $17,000
24 19. How many different positions have you had since you graduated from N. Y. C. C. C.
O. None 1. One 2. Two 3. Three 4. Four 5. Five 0. More than Five
25 20. What additional education after graduation from N.Y.C.C.C. have youundertaken (University, college, medical school, technical school etc.)?
O. None 1. Now attending full time 2.Attended full time, degree completed
3. Attended full time, withdrew 4. Now attending part time
5. Attended part time, degree completed 6.Attended part time, withdrew
26 21. If you continued your education and completed it, what degree did you receive?
O. None 1. B.A. 2. B.S. 3. M.A. 4. M.S. 5. MD/PhD 6. Other
22. If you continued your education, which institution(s) did you attend?
23. If you continued your education, what was your major field of study?
412

415
27 24. If you attended another institution, how many credits did you transfer from N.Y.C.C.C.?
O. None 1. 1 - 10 2. 11 - 20 3. 21 - 30 4. 31 - 40 5. 41 - 50 6. Over 50
28 25. In the performance of your duties in a health related position, are any of the
techniques you use significantly different from those taught to you at N.Y.C.C.C.?
1. Yes 2. No.
26. If your answer to Question #25 was yes, identify the areas of greatest difference:
29 27. What is your overall impression of your N.Y.C.C.C. curriculum as preparation
for your career?
1. Excellent 2. Very good 3. Good 4. Fair 5. Poor
For the following questions please check ONE box in each row
"28. Please rate the following components of your General Educationcourses at
N. Y. C. C. C. as a learning experiencs:
30
31
32
33
35
36
37 29.
Excellent Very GoodGood
1 2 3
Fair Poor Does not
5APPV
64
Lectures
Class Discussions
Laboratories
Reading Materials
Written Assignments
Teacher Comments.
Examinations _
Which of the following educational activities helped you most to complete
your curriculum at N. Y. C. C. C.?
1. High School 2. Biology Audio-tutorial laboratory
3. Allied Health Learning Centerfreshman study skills course,
4. Developmental skills program
activities (certification seminars,study guides, open labs, etc.)
5. Other
443

45. Please comment on any question in this study that you feel deservesadditional comment:
444

Itt
(43
119
417
30. Please rate the following components of your Career Learning courses at
N. Y. C. C. C. as a learning experience:
Excellent VeryGood
1 2
Good Fair Poor Does not
Apply3 4 5
Lectures
Class Discussions
Laboratories
Reading Materials
Written Assignments..
Teacher Comments
.
Examinations
31. Please rate the following components of your Career Learning courses at
N. Y. C. C. C. as to the amount of difficulty they presented to you:
Extremely Very Somewhat Not Easy Does not
Difficult Difficult Difficult Difficult Apply
1 2 3 4 5 6
Lectures
Class Discussions
.
.
.
Laboratories
Reading Materials
Written Assignments
Examinations
On the following scales please circle the one rating that
best describes MOST of your Career Learning instructors
1151 32. Your Career Learning instructors as Teachers:
1. Inspirational 2. Very Interesting 3. Interesting 4. Uninteresting 5. Dull
1/52 33. Your Career Learning instructors in Class:
1. Very well prepared 2. Well prepared 3. Moderately prepared 4. Unprepared
1153
34. Your Career Learning instructors regarding their Subject:
1. Enthusiastic 2. Interested 3. Some interest 4. Not interested 5. Negative
445

54 35. Your Career Learning instructors regarding their Students:
1. Very concerned 2. Concerned 3. Some concern 4. Unconcerned 5. Antagonistic
55
56
36.
37.
57 38.
Please rate your Career Learning instructors according to the amountof extra help they provided to you.
Very Often Fewoften times
1 2 3
Seldom Never
2 5How often did you seek individualhelp from your instructors?
Did they provide extraassistance when needed?
How often did your instructorsoffer individual help?
58 39. Please rate your Career Learning instructors on each of the following:
59
60
61
62
63
Always Usually Sometimes Seldom Never
Available forconsultation
Easy totalk toHe pfu witProblemsHelpful inPlanning programAccurateInformation
40. If you have had an outstanding instructor, please write his/her name here:
64 41. How often did you see a College Counselor (other than your departmentalAcademic Advisor) during your enrollment at N.Y.C.C.C.?
O. Never 1. 1 - 2 times 3. 3 - 5 times 4. 6-10 times 5. 11-15 times 6. over 15
65 42. To the best of your knowledge, how often did cheating take place duringexaminations of Career Curriculum subjects at N.Y.C.C.C.?
O. Never 1. Rarely 2. Sometimes 3. Often 4. Very often 5. Always
43. List the three courses you have taken at N.Y.C.C.C. that have helped you mostin your job experience:
44 List the three courses you hive taken at N.Y.C.C.t. that have helped you leastin your job experience:
446

419
Dental Hygiene Licensing Questionnaire
417

New York City Community CollegeIMF NC CITY {MN /MTV OF NOVI VOCC. NO JAY MUM smesstmom Y. sum
ALLIED HEALTH PROGRAM SURVEYDental Hygiene Licensing Section
420
66 46. Did you take the National Board Dental Hygiene Licensing (NBDHL) Examination
appropriate to your curriculum?
1. Yes 2. No
67 47. How many examination attempts were required for you to obtain licensing?
I. One 2. Two 3. Three 4. Four 5. Five 6. More than five 7. Did not pass
68 48. What is your overall impression of your N.Y.C.C.C. curriculum as preparation
for the National Board Dental Hygiene Licensing (NBDHL) examination?
I. Excellent 2. Very Good 3. Good 4. Fair 5. Poor
49. How could you have been better prepared for Licensing? Please be specific.
69 50. Did you take any of the following examinations?
70
71
72
73
74
75
76
77
78
79
I. None 2. New York State Practical Examination (performance)
3. Northeast Regional Board Exam (performance) 4. Both
51 In the chart below, rate each section of the National Board Dental Hygiene
Licensing examination in terms of your preparation at N.Y.C.C.C. and how
difficult you found each section. Use the numbers on the following scale for
ratings, placing one number in each box.
1 2 3 4 5
very poor poor adequate good excellent
preparation/ preparation/ preparation/ preparation/ preparation/
very difficult difficult fair section easy section very easy section
section section
Section
your preparationat N. Y. C. C. C.
difficultyof section
Oral Inspection
Radiographs
Diagnostic AidsProphylaxisa. Hand Scaling
b. UltrasonicsTopical Agents(fluorides)
.
Oral-Health Instruction(Nutrition, Plaque Contrl.)
Supportive Treatment(Dental Materials)
Emergencies
Community Health
--_, - 448

12
13
14
15
16
17
18
19
20
21
23
24
25
1261
127
29
30
31
32
52. Please check the component of your Career Learning courses that was thebest preparation for each section of the NBDH Licensing Examination:
Labs Reading Written Exams Review Lectures Discussion
Material assignments seminars1 2 3 4 5 6 7
Oral
Inspection.
RadiographsDiagnosticAids
, _
Prophylaxisa. Hand Scaling
b. Ultrasonics
Topical AgentsIfluorides)
-
Deal Hlth.Inst.Nutrition
Emergencies
Supportive TrtDental MAterin
.
CommunityHealth I
53. On the following chart please check the item that was most helpful aspreparation for each section of the NDBH Licensing Examination:
Subject Presentation Response Teachers Individual Teachingmatter of material to comments assistance aidsstrPSSed 1 2 4
OralInspection _
_
RadiographsDiagnosticAids
-
Prophylaxisa.Hand Scaling
b.Ultrasonics
Topical Agents_Muorides)Oral Hlth.Tnst(Nutrition)
Emergencies
Supportive TriDental Materiel
.
CommunityHealth
. _

34
35
36
37
38
39
40
41,
42
43
45
46
47
48
49
50
51
52
Please rate each of your Career Learning courses
as preparation for each section of the NOSH Licensing Exam.
54. For the Oral Inspection section:
Very Useful Useless
Useful1 2
Very
Useless4
Does notapply
Oral HygieneTheory
_
Oral HygienePractice I
.
.
Oral Anatomy
MicrobiologyOral HygienePractice II
DentalAssisting
,
Human AnatomyOrganicChemistry
Pathology
_
Oral HygienePractice III
PharmacologyDentalRadiology Lab I
Periodontics
Public HealthOral HygienePractice IVDentalMaterialsDentalRadiology Lab IICurrent Conceptsin DentistryDental
Specialties,
450
422

55
56
57
58
59'
60
61
62
63
64
65
66
67
68
69
70
71
72
73
Please rate each of your Career Learning coursesas preparation for each section of the NBOH Licensing Exam.
55. For the Radiograph section:
VeryUseful
Useful Useless Very Does not
Useless apply
2
Oral HygieneTheoryOral HygienePractice I
Oral Anatomy
MicrobiologyOral HygienePractice IIDentalAssisting
Human AnatomyOrganicChemistry
.
PatholonOral HygienePractice III
PharmacologyDentalRadiology Lab I
Periodontics
Public HealthOral HygienePractice IV
,
DentalMaterialsDentalRadiology Lab IICurrent Conceptsin DentistryDentalSpecialties _ ,

Please rate each of your Career Learning courses
as preparation for each section of the NM Licensing Exam.
56. For the Diagnostic Aids section:
Very Useful
Sti-3 Useful
12
13
14
15
16
17
18
18
20
21
22
23
25
26
27
28
29
30
Useless Very Does not
Useless apply
D7iTRiiieneTheoryOral HygienePractice I
Oral Anatomy
MicrobiologyOral HygienePractice IIDentalAssisting -
Human AnatomyOrganicChemistry ,
PathologyOral HygienePractice III ,
PharmacologyDentalRadiology Lab I
Periodontics
Public HealthOral HygienePractice IVDentalMaterialsDentalRadiology Lab IICurrent Conceptsin DentistryDentalSpecialties
.
452
424

33
34
35
36
37
as. ;
39
40
41
42
43
44
45
46
. 47
48
49
so
51
Please rate each of your Career Learning coursesas preparation for each section of the NBOH Licensing Exam.
57. For the Prophylaxis section a. Hand Scaling:
Very Useful
Useful
Useless Very
Useless
Does not
apply
Oral HygieneTheory
1-
1570HygienePractice I
Oral Anatomy
MicrobiologyOral HygienePractice IIDentalAssisting
Human Anatomy
,
.
OrganicChemistry
PathologyOral HygienePractice III
.
PharmacologyDentalRadiology Lab I 1
Periodontics
Public HealthOral HygienePractice IV ..
DentalMaterialsDentalRadiology Lab IICurrent Conceptsin DentistryDentalSpecialties

426
Please rate each of your Career Learning courses
as preparation for each section of the NBDH Licensing Exam.
58. For the Prophylaxis section b. Ultrasonics:
Very Useful Useless
Useful1
Very
Useless
Does notapply
Oral HygieneTheory6rallligienePractice I
Oral Anatomy
MicrobiologyOral HygienePractice II
._
.
DentalAssisting
Human AnatomyOrganicChemistry
.
PathologyOral HygienePractice III
PharmacologyDentalRadiology Lab I
Periodontics*-
Public HealthOral HygienePractice IV
DentalMaterialsDental'Radiology Lab II
.
Current Conceptsin DentistryDentalSpecialties ,
454

sn-4
12
13
14
15.
16
17
18
19
20
21
22
23
24
25
26
27
28
29
30
Please rate each of your Career Lei7Fing coursesas preparation for each section of.the NBDH Licensing Exam.
59. For the Topical Agents (fluorides) section
Very Useful Useless
Useful1 2
Very
Useless4
Does not
apply
Tal HygieneTheoryOral ygienePractice I
Oial Anatomy
MicrobiologyOral HygienePractice IIDentalAssisting
.
Human AnatomyOrganicChemistry
.
PathologyOral HygienePractice III
PharmacologyDentalRadiology Lab I
Periodontics
Public HealthNil-HygienePractice IVDentalMaterialsDentalRadiology Lab IICurrent Conceptsin DentistryDentalS ecialties .
455.

33
34
35
36
178
49
0
41
2
3
44
45
46
47
8
49
50
51
1
Please rate each of your Career Learning courses
as preparation for each section of the N8OH Licensing Exam.
60.' For the Oral Health Instruction (Nutrition, Plaque Control) section:
Very Useful Useless Very Does not
Useless apply3 4 5
Useful1 2
Oral HygieneTheoryOral HygienePractice I
.
Oral Anatomy
MicrobiologyOral HygienePractice IIDentalAssisting
Human Anatomy ...
OrganicChemistry
PathologyOral HygienePractice III
PharmacologyDentalRadiology Lab I
Periodontics
Public HealthOral HygienePractice IV
DentalMaterials .
k
DentalRadiology Lab IICurrent Conceptsin DentistryDentalSpecialties ,
.
4 5.6
428

52
53
54
55
76
58
59
60
61
62
63
64
65
66
67
68
69
70
S.Please rate each of your Career Learning courses
as preparation for each section of the NUN Licensing Exam.
61. For the Supportive Treatment (Dental Materials) section:
Very Useful Useless Very
Useful Useless
1 2 3 4
Does not
apply
Oral HygieneTheoryOral HygienePractice I
Oral Anatomy
MicrobiologyOW -HygienePractice IIDentalAssisting _
Human AnatomyOrganicChemistry
__ .
Pathology
- ,
Oral HygienePractice III
PharmacologyDentalRadiology Lab I
Periodontics
Public HealthOral HygienePractice IV
-
DentaMaterials
4
DentalRadiology Lab IICurrent Conceptsin Dentistry
. .
DentalSpecialties
457

430
rPlease rate each of your Career Learning courses
as preparation for each section of the MOH Licensing Exam.
62. For the Emergencies section:
VeryUseful
1
Useful Useless VeryUseless
2 3
Does notapply
5
Oral HygieneTheoryOral HygienePractice I
.
6.
.
Oral Anatomy
,
.
MicrobiologyOral HygienePractice II
DentalAssisting
. .
Human AnatomyOrganicChemistry
PathologyOral HygienePractice III
PharmacologyDentalRadiology Lab I
Periodontics
Public Health ,
Oral HygienePractice IVDentalMaterialsDentalRadiology Lab IICurrent Conceptsin DentistryDentalSpecialties
458

31
32
33
34
35
36
37
38
39
0
41
42
3
44
145
46
47
48
49
Please rate each of your Career Learning courses
as preparation for each section of the NBDH Licensing Exam.
63. For the Community Health section:.
Very Useful
Useful1 2
Useless Very Does not
Useless apply
3
Oral HygieneTheoryDral Hygiene;Practice I
.
Oral Anatomy
MicrobiologyOral HygienePractice II
DentalAssitting
,
Human AnatomyOrganicChemistry
PathologyOral HygienePractice III
PharmacologyDentalRadiology Lab I
Periodontics
Public HealthOral HygienePractice IVDentalMaterialsDental
Radiolo' Lab II
urrent onceptsin Dentistry
DentalSpecialties [ .
4.59

50
51
52
53
54
55
56
57
58
59
60
61
62
63
64
65
66
67
68
64. Please rate your Career Learning courses as preparation for the Real World:
VeryUseful
Useful Useless .Very Does not
Useless apply
2 3 4 5
Oral HygieneTheoryOral-HygienePractice I
Oral Anatomy
Microbiology ,Oral HygienePractice II
. ,
DentalAssisting
Human Anatomy
-
.
OrganicChemistry _
-
PathologyOral HygienePractice III
.
PharmacologyDentalRadiology Lab I
Periodontics
,
.
Public Health _
Oral HygienePractice IV _DentalMaterialsDentalRadiology Lab II _
Current Conceptsin DentistryDentalSpecialties _
460.
432

69
70
71
72
73
74
75
76
77
78
65. Please rate your Career Learning instructors for their help in preparing
you for the Certification Examination sections:
Excellent Very Good
Good1 2 3
Fair Poor
Oral Inspection
Radiographs
Diagnostic AidsProphylaxisa. Hand Scaling
. .
b. Ultrasonics
Topical Agents
Oral Health Instruct.
Supportive Treatment
Emergencies
Community Health
66. Which year did you take the National Board Dental Hygiene Licensing Exam?
79 O. Did not take 1. 1968 2. 1969 3. 1970 4. 1971 5. 1972
6. 1973 7. 1974 8. 1975
If the exam was taken more than once, please circle all years in whichit was taken.
461

434
Medical Laboratory Certification Questionnaire
462
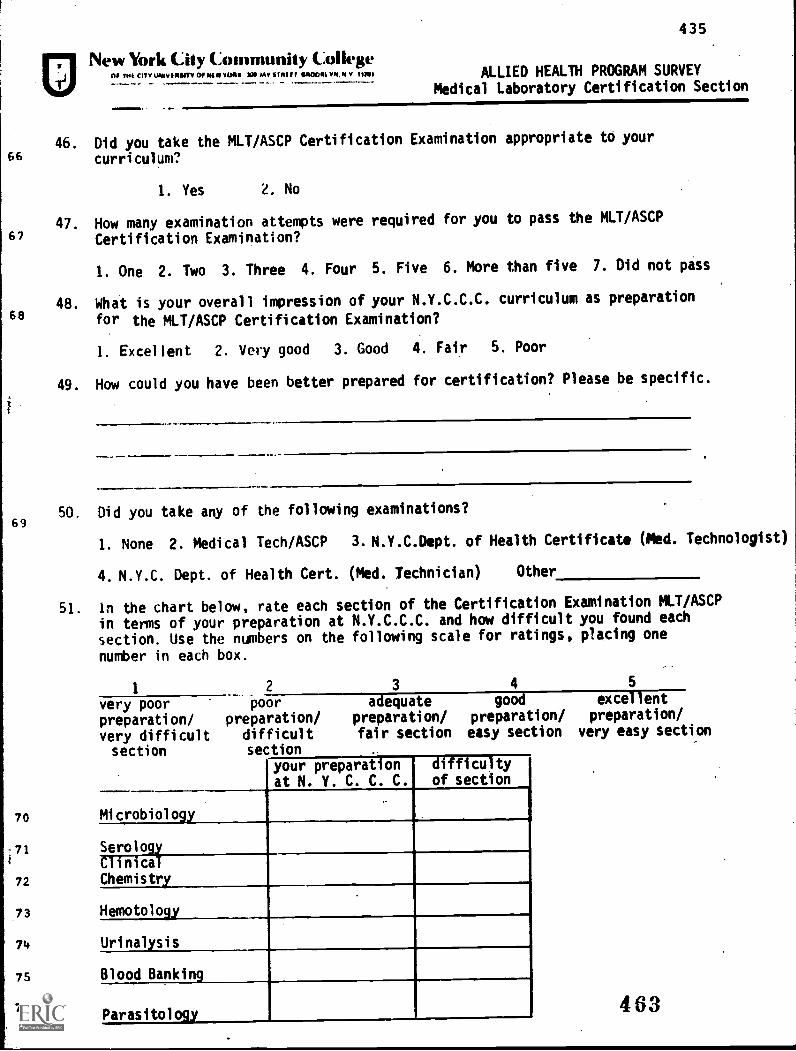
66
67
68
69
70
71
72
73
74
75
76
New York City Community CollegeOF Mt Cif V UNMAXIIITV Of NOV VOINs NS MN %MIFF MOM YN.N V TINT
435
ALLIED HEALTH PROGRAM SURVEYMedical Laboratory Certification Section
46. Did you take the MLT/ASCP Certification Examination appropriate to your
curriculum?
I. Yes 2. No
47. How many examination attempts were required for you to pass the MLT/ASCP
Certification Examination?
I. One 2. Two 3. Three 4. Four 5. Five 6. More than five 7. Did not piss
48. What is your overall impression of your N.Y.C.C.C. curriculum as preparation
for the MLT/ASCP Certification Examination?
I. Excellent 2. Very good 3. Good 4. Fair 5. Poor
49. How could you have been better prepared for certification? Please be specific.
50. Did you take any of the following examinations?
1. None 2. Medical Tech/ASCP 3. N.Y.C.Dept. of Health Certificate (Med. Technologist)
4. N.Y.C. Dept. of Health Cert. (Med. Technician) Other
51. in the chart below, rate each section of the Certification Examination MLT/ASCP
in terms of your preparation at N.Y.C.C.C. and how difficult you found each
section. Use the numbers on the following scale for ratings, placing one
number in each box.
1
very poorpreparation/very difficultsection
2 3 4 5
poor
preparation/difficultsection
adequate good excellent
preparation/ preparation/ preparation/
fair section easy section very easy section
your preparationat N. Y. C. C. C.
difficultyof section
Microbiology
SerologyClinicalChemistry
Hemotology
Urinalysis
Blood Banking L
Parasitology463

5t1-2
12
13
14
15
16
17
18
19
20
21
22
23
24
25
52. Please check the component of your Career Learning courses that was thebest preparation for each section of the MLT/ASCP Certification Examination.
Labs Reading Written Exams Review Lectures Discussions
Material Assignments Seminars1 2 3 4 5 6 7
Microbiology
Serology
.
ClinicalChemistry
.
Hemotology
,
Urinalysis
. .
Blood Banking
_
Parasitology .
53. On the following chart please check the item that was most helpful aspreparation for each section of the MLT/ASCP Certification Examination.
Subject Presentation Response Teachers Individual Teaching
matter of material to comments assistance aids
stressed questions
Microbiology
1 2 3
.,
4 5 6
Serology ..
ClinicalChemistry
Hemotology
Urinalysis
Blood Banking
_
Parasitology 4,
4J4

Please rate your Career Learning courses as preparationfor each section of the Certification exam.
54. For the Microbiology section:
VeryUseful
Useful Useless VeryUseless
Does notapply
C mica a.
Science I (Hemotlgy) ,
Microbiology I _
Clinical LabScience II (Cl.Chem)
Histology -
Microbiolo' II
inica ab
Practice (Hospital)
65. For the Serology section:
Very Useful
useful'1 2
Useless Very Does not
Useless. apply3 4 5
Clinical LabScience I (Hemotlgy)
I
.
Microbiology I ,
Clinical LabScience II (Cl.Chee4 .
Histology
Microbiology II .
Clinical LabPractice (Hospital) _
56. For the Clinical Chemistry section:
VeryUteful
1
Useful Useless Very Does notUseless apply
2 3 4 5
Clinical LabScience I (Hemotlgy)
Microbiology I .
Clinical LabScience II (Cl.Chem)
,
Histology
Microbiology IIClinica 0
Practice (Hospital)
437
46.5.

44
45
46
47
48
49
so
51
52
53
54
55
56
57
58
59
60
61
Please rate your Career Learning courses as preparation
for each section of the Certification exam.
57. For the Hemotology section:
Very
Useful1
Useful Useless Very Does not
Useless apply52 3 4
Clinical LabScience I (Hemotlgy)
,
Microbiology I ,
Clinical LabScience II(Cl.Chem)
.
-
Histologyi
Microbiology IIClinical LabPractice Hos.ital
58. For the Urinalysis section:
Very
useful
Useful Useless Very Does not
ARVUseless
Clinical LabScience I (Hemotlgy)
I
UMW LaScience II Cl.Chem)
1
Histology
Microbiology II I.
Clinical LabPractice (Hospital) I
59. For the Blood Banking section:
VeryUseful
1
Useful Useless VeryUseless
2 3 4
Does not
apply5
mica a.
Science I (Hemotlgy)
Microbiology I
L
1
Clinical LabScience II (Cl.Chem)
Histology
,
Microbiology IIraiffial LPractice ospital)
. - ,
4 UV

62
63
64
65
66
67
68
69
70
71
72
73
sn-3
12
14
15
16
17
18
439
Please rate your Career Lp4rning courses as preparationfor each section of the Certification exam.
60. For the Parasitology section:.
VeryUseful
Useful Useless Very
Useless43
Does notapply
5
Clinical labScience I (Hemotlgy)
Microbiology IClinical LabScience II Cl.Chem)
Histology
Microbiology II -Clinical LibPractice ( Hospital)
61. Please rate your career learning courses as preparation for the Real World:
Very Useful Useless Very Does not
useful1 2 3
Useless4
apply
Clinical LabScience I (Hemotlgy)
Microbiology I ---
Clinical LibScience II (Cl.Chem)
Histology
Microbiology II .
Clinical LabPractice (Hospital)
-
62. Please rate your Career Learning instructors for their help in preparingyou for each Certification Exarksection:
Excellini Very Good Fair1 Good 2 3 4
Poor5
Microbiology
SerologyClinicalChemistry
Hemotology
__.
.
Urinalysis
. _ _
1
Blood Banking.
Parasitology

63. Which year did you take the MLT/ASCP Certification Examination?
19 0. Did not take 1. 1968 2. 1969 3. 1970 4. 1971 5. 1972
6. 1973 7. 1974 8. 1975
7

441
Nursing Licensing Questionnaire
469

New York City Community CollegeOf Tilt CITY ustvuurtv Of mawVONA. AA JAY ttttt T. IINOCIIEL TN, N V. Wel
ALLIED HEALTH PROGRAM SURVEYNursing Licensure Section
46. Did you take the New York State Board Licensure Examination appropriate to
66 your curriculum?
1. Yes 2. No
47. How many examination attempts were required for you to:pass the New York
State Board Licensure Examination?
1. One 2. Two 3. Three 4. Four 5. Five 6. More than five 7. Did not pass
48. What is your overall impression of your N.Y.C.C.C. curriculum as preparation
for the New York State Board Licensure Examination?
1. Excellent 2. Very good 3. Good 4. Fair 5. Poor
49 How could you have been better prepared for licensure? please be specific.
67
68
70
71
72
73
74
50.
Please note: all references to Licensure refer to the
New York State Board Licensure Examination.
51. In the chart below, please rate each section of the licensure examination
in terms of your preparation at N.Y.C.C.C. and how difficult you found
each section. Use the numbers on the following scale for ratings, placing
one number in each box.
1 2 3 4 5
Very poor poor adequate good excel ent
preparation/ preparation/ preparation/ preparation/ preparation/
very difficult difficult fair section easy section very easy section
section section
I your preparationat N. Y. C. C. C.
difficultyof section
Medical
Surgical
Obstetrics
Pediatrics
Psychiatry I
470
442
J

sn-2
12
13
14
15
16
17
18
19
20
21
52. Please check the component of your Career Learning courses that was the
best preparation for each section of the Licensure Examination.
Labs Reading Written Exams Review Lectures Discussions
material assignments seminars
Medical
1 2 2 4 s 6 7
Surgical
Obstetrics
Pediatrics
Psychiatry ,
53. On the following chart please check the item that was most helpful as
preparation for each section of the Licensure Examination.
Subject Presentation Response Teachers Individual Teaching
matter of material to comments assistance aids
stressed questions lk
Medical
1 2 3 4 s 6
Surgical - ,).
Obstetrics---
Pediatrics
Psychiatry I
471

444
Rate your Caree'r Learning courses as preparation for each section of the Examination I
54. For the Medical section:
VeryUsefull
Useful2
Useless Very Does not3 Useless 4 aoDly 5
Fundamentalsof Nursing__
_
MicrobiologyIntro. toPsychology
Maternal HealthPsychiatricNursingAnatomy andPhysiology I
Child PsychologyAdult and ChildNursing IAdult and ChildNursing IIAnatomy andPhysiology IIPsychology ofAdolescenceAdult and ChildNursing IIIAdult and ChildNursing IV
___
55. For the Surgical section:
Very Useful
Useful 1 2Useless
3Very
Useless 4Does notao ly 5
Fundamentalsof Nursing
MicrobiologyIntro. toPsychology
Maternal HealthPsychiatricNursinginatomy andPhysiology I
Child PsychologyAdult and ChildNursing IAdult and ChildNursing IIAnatomy andPhysiology IIPsychology ofAdolescence
..,
Adult and Child.Nursing 111
.
Adult and ChildNursing IV
_
.
.
472

48
49
50
51
52'
53
54
55
56
57
58
59
60
61
E3
56
57
68
69
70
71
72
73
Rate your Career Learning courses as preparation for each section of the Examinatiu:i
56. For the Obstetrics section:
Very Useful Useless Very Does notUseful 1 2 3 Useless 4 . aaply 5
Fundamentalsof Nursing .
MicrobiologyIntro, toPsychology
Maternal HealthPsychiatricNursing
Anatomy andPhysiology I
Child PsychologyAdult and ChildNursing I
Adult and ChildNursing IIAnatomy andphysiolmy_IIPS-Y-dvocofAdolescenceAdult and ChildNursing IIImoult and ChildNursing IV
57. For the Pediatrics section:
Very UsefulUseful 1 2
Useless3
VeryUseless 4
Does notapR1y 5
Fundamentalsof Nursing
Microbiology-... . -. . .. ,o
-.-ology
Maternal HealthPsychiatricNurs4hcAnatomy andPhysiology I
Child PsychologyAdult and ChildNursing IAdult and allr-Nursing II
_
Anatomy andPhysiology IIPsychology ofAdolescenceAdult and ChildNursing IIIAdult and ChildNursing IV
.
4 7 3 ,

IRate your Careerlearning courses as preparation for each section of the Examination-1
. 58. For the Psychiatry section:
sn-3 VeryUseful 1
12
13
14
15
16
17
18
19
20
21
22
23
24
25
26
27
28
29
30
31
32
33
34
35
36
37
Useful2
Useless Very Does not3 Useless 4 apply s
Fundamentalsof Nursing
MicrobiologyIntro. toPsychology
Maternal HealthPsychiatricNursingAnatomy andPhysiology I
Child PsychologyAdult and ChildNursing IAdult and ChildNursing IIAnatomy andPhysiology IIPsychology ofAdolescenceAdult and ChildNursing IIIAdult and ChildNursing IV
59. Please rate your Career Learning courses as preparation for the Real World:
Very Useful Useless Very Does not
Useful 2 Useless a apply
Fundamentalsof Nursing
MicrobiologyIntro. toPsychology
Maternal HealthPsychiatricNursing'natomy andPhysiology I
Child PsychologyAdult and ChildNursing IAdult and ChildNursing IIAnatomy andPhysiology IIPsychology ofAdolescenceAdult and ChildNursin ili
Adult and hi dNursing IV --
47 4

38
39
40
41
42
60. Please rate your Career Learning instructors for their help in preparingyou for each section of the Licensure Examination.
Excellent Very Good Fair Poor* Good
1 2 3 4 5
Medical
Surgical
Obstetrics
Pediatrics
Psychiatry
61. Which year did you take the New York State Board Licensure Examination?
43O. did not take. 1. 1968 2. 1969 3. 1970 4. 1971 5. 1972
6. 1973 7. 1974 8. 1975
4 7 5
448
Opthalmic Dispensing Licensure Questionnaire
476

New York City Community CollegeOF 7141 CITY UNIVERSITY OF NEW VORK.300 JAY STREEF.11000KLY N. N Y 11201
449
ALLIED HEALTH PROGRAM SURVEYOpthalmic Dispensing Licensure Section
46. Did you take the New York State Board for Opthalmic Dispensary Licensure
66 Examination?
1. Yes 2. No
67 47 How many examination attempts were required for you to pass the N. Y. S. Bd. Exam.
1. One 2. Two 3. Three 4. Four 5. Five 6. More than five 7. Did not pass
48 What is your overall impression of your N. Y. C. C. C. Curriculum68 as preparation for the N. Y. State Board for Opthalmic Dispensary Licensure?
1. Excellent 2. Very Good 3. Good 4. Fair 5. Poor
49. How could you have been better prepared for Licensure? Please be specific.
69
70
71
72
73
74
75
76
77
78
79
50. Did you take the American Bd. of Opticianary Certification Examination?
1. Yes 2. No
51, In the chart below, please rate each section of the N. Y. State Board for
Opthalmic Dispensary Licensure Examination in terms of your preparation at
N.Y,C.C.C. and how difficult you found each section. Use the numbers on the
following scale for ratings, placing one number in each box..
1 2 3 4 5
very poor poor a equate goo exce ent
preparation/ preparation/ preparation/ preparation/ Preparation/
very difficult difficult fair section easy section very easy sectionon
our preparation,...t N. Y. C. C. C.
difficultyof section
TheoreticalOpticsAnatomy/PhysiologyOpthalmicDispensingOpthalmic
MgqrjalsUpthalmicOpticsPracticalDispensingContact LensesWrittenContact LensesOral ProceduresContact LensesFitting_Contact lensesPractical
477.

sn-2
12
13
14
15
16
17
18
19
20
21
22
23
24
25
26
27
28
29
30
31
Please Note: all reference to Licensure refers to the
New York State Board for Opthalmic Dispensary Licensure Examination
52. Please check the component of your Career Learning courses that was the
best preparation for each section of the Licensure Examination.
Labs Reading Written Exams Review Lectures Discussion
Material assignments seminars
1 2 3 4 5
TheoreticalOpticsAnatomy/PhysiologyOpthalmicDispensingOpthalmicMaterialsOpthalmitOpticsPracticalDispensingContact LensWrittencontact LensOral
,
Contact LensFittingContact LensPractical
53. On the following chart please check the item that was most helpful as
preparation for each section of the Licensure Examination.
Subject Presentation Response Teachers Individual Teaching
matter of material to comments assistance aids
stressed Questions
TheoreticalOptics.
1 2 3 4 5 6
Anatomy/PhysiologyOpthalmicgispersingOpthalmicMaterialsOpthalmicOpticsPracticalDispensingContact LensWrittenContact LensOral
Contact LensFittingContact LensPractical
4 7 8

32
33
34
35
36
37
38
39
40
41
42
43
44
45
46
47
48
49
50.
51
52
53
Please rate your Career Learning courses as preparation
for each section of the Licensure Examination.
54. For the Theoretical Optics section:
Very Useful Useless Very
Useful Useless
1 2 3
Does notapply
Opthalmicmaterials I
Opthalmicmaterials IIAnatomy andPhriology of EyePrinciples ofOptics I
Opthalmicmaterials IIIOptlialmicDispensing IPrinciples ofOptics IIContactLenses I
OpthalmicDispensing IISpecialVisual AidsContactLenses II .
55. For the Anatomy/Physiology section:
Very Useful Useless Very Does not
Useful Useless apply
Opthalmicmaterials I
OTiiiiIiiiic
materials II'natomy andPhysiology of EyePrinciples ofOptics IOpthalmicmaterials III ,
OpthalmicDispensing IPrinciples ofOptics II
.
ContactLenses I
OpthalmicDispensing IISpecialVisual Aids
.
4
ContactLenses II
4 ---.
451
479

Please rate your Career Learning courses as preparation
for each section of the Licensure Examination.
56. For the Opthalmic Dispensing section:
Very Useful
Useful
1
Useless VeryUseless
2 3 4
Does notapply
Opthalmicmaterials I
Opthalmicmaterials IIAnatomy andPh Biology of EyePrinciples ofOptics I
Opthalmicmaterials IIIOpthalmicDispensing IPrinciples ofOptics IIContactLenses IOpthalmicDispensing IISpecialVisual AidsContactLenses II
57. For the Opthalmic Materials section:
VeryUseful
1
Useful Useless Very Does not
Useless apply
2 3 4 5
Opthalmicmaterials I
Opthalthicmaterials IIAnatomy andPhsiology of EyePrincipTes ofOptics IOpthalmicmaterials IIIOpthalmicDispensing IPrinciples ofOptics IIContactLenses IOpthalmicDispensing IISpecialVisual Aids
ContactLenses II
4 i--3 0

12
13
F.
15
16
17
18
18
20
21
22
23
24
25
26
27
28
29
30
31
32
33
Please rate your Career Learning courses as preparation
for each section of the Licensure Examination.
58. For the Opthalmic Optics section:
Very Useful Useless Very
sn-3 Useful Useless1 2 3 4
Does notapply
5
Opthalmicmaterials I.
Opthalmicmaterials IIAnatomy andPh'siology of EyePrinciples ofOptics IOpthalmicmaterials IIIOpthalmicDispensing IPrinciples ofOptics IIContactLenses I
OpthalmicDispensing IISpecialVisual AidsContactLenses II
59. For the Practical Dispensing Section:
VeryUseful
Useful Useless VeryUseless
2
Does notapply
Opthalmicmaterials IOpthalmicmaterials II
.
Anatomy andPhriology of EyePrinciples ofOptics I
Opthalmicmaterials IIIOpthalmicDispensing IVrinciples ofOptics IIContactLenses I6IthalmicDispensing IISpecialVisual Aids
ContactLenses II 481
45

34
35
36
37
38
39
40
41
42
43
44
45
46
47
48
49
50
51
52
53
54
55
Please rate your Career Learning courses as preparation
for each section of the Licensure Examination.
60. For the Contact Lenses written section:
Very Useful
Useful2
Useless Very
Useless3 4
Does notapply
Opthalmicmaterials I
Opthalmicmaterials IIAnatomy andPh'siology of EyePrinciples ofOptics IOpthalmicmaterials IIIOpthalmicDispensing IPrinciples ofOptics IIContactLenses IOpthalmicDispensing II
.
SpecialVisual AidsContactLenses II
61. For the Contact Lenses Oral Procedured section:
Very Useful Useless Very
Useful Useless
1 2
Does notapply
Opthalmicmaterials I
Opthalmic.
materials IIAnatomy andPqsiology of EyePrinciples ofOptics IOpthalmicmaterials IIIOpthalmicDispensing IPrinciples ofOptics IIContactLenses I
OpthalmicDispensing IISpecialVisual Aids
ContactLenses II 48,2

56
57
58
59
60
61
62
63
64
65
66
Please rate your Career Learning courses as preparation
for each section of the Licensure Examination.
62. For the Contact Lenses Fitting section:
Very Useful
Useful1
Useless Very Does not
Useless apply
2 3 4 5
Opthalmicmaterials IOpthalmicmaterials II.
Anatomy andPhriology of Eye
. . _ . ___ _ ____ _ _ . _ _ ___ __ _ .
Principles ofOptics I
. .
Opthalmicmaterials IIIOpthalmicDispensing IPrinciples ofOptics IIContactLenses IOpthalmicDispensing IISpecialVisual AidsContactLenses II
63. For the Contact Lenses Practical section:
Very Useful Useless Very Does not
Useful Useless apply
1 2 3 4 5
67Opthalmicmaterials I
68Opthalmicmaterials II
69. Anatomy and
Ph.ysiology of Eye
70Principles of
Optics I
71Opthalmicmaterials III
72OpthalmicDispensing I
73Vrinciples ofOptics II
74ContactLenses I
75OpthalmicDispensing II
76SpecialVisual Aids 483
17 Contact

V1-4
12
13
15
16
17
18
19
20
21
22
23
25
26
27
28
29
30
11
32
33
64. Please rate your Career Learning courses as preparation for the Real World.
Very
Useful1
Useful Useless Vel Does not
Useless apply
2 3 4
Opthalmicmaterials I
Opthalmicmaterials IIAnatomy andPh.piology of Eye- -------
Principles ofOptics I
Opthalmicmaterials IIIOpthalmicDispensing IPrinciples ofOptics IIContactLenses IOpthalmicDispensing II
SpecialVisual AidsContactLenses II I
65. Please rate your Career Learning instructors for their help in preparing
you for each of the Licensure Examination sections:
Excellent Very Good
1 boodFair Poor
Theoretic Optics
,
Anatomy/Physiology
Opthalmic Dispensing
Opthalmic Materials
Opthalmic Optics
Practical Dispensing
Contact Lens,Written
Contact Lens, Oral
Contact Lens, Fitting
Contact Lens,Practicl
66. Which year did you take the N. Y. S. Bd. Opthalmic Dispensary Examination?
O. Did not take 1. 1968 2. 1969 3. 1970 4. 1971 5. 1912
6. 1973 7. 1974 8. 1975
481

457
Radiologic Technology Licensure Questionnaire
485

1
11
72
13114
75
17
New York City Community CollegeOF TNT CITY UNIVERSITY OF NETT YORK, MS AV STREET. 111100111.1111.141 V moll
458
ALLIED HEALTH PROGRAM SURVEYRadiologic Technology Licensure Section
46. Did you take the New York State Licensing Examination appropriate to
your curriculum?
1. Yes 2. No
47. How many examination attempts were required for you to pass the Licensing Exam.
I. One 2.Two 3. Three 4. Four 5. Five 6. More than five 7. Didn't pass
48. What is your overall impression of your N.Y.C.C.C.curriculum as preparation
for the New York State Licensing Examination?
I. Excellent 2. Very Good 3. Good 4. Fair 5. Poor
49. How could you have been better prepared for licensing? Please be specific.
50. Did you take the American Registry of Radiologic Technologists registry exam?
I. Yes 2. No.
51. In the chart below, please rate each section of the New York State Licensing
Examination in terms of your preparation at N.Y.C.C.C., and how difficult
you found each section. Use the numbers on the following scale for ratings,
placing one number in each box.
1 2 3 4 5
very poorpreparation/very difficult
poor
preparation/difficult
adequatepreparation/fair section
good excellentpreparation/reparation/
easy section very easy section
--your preparationat N. Y. C. C. C.
difficultyof section
RadiographicTechniquesStandardPositionAnatomy/Physiology
X-racy PhysicsRadiationTherapySpecialProcedures .
GeneralPhysics
Therapy
486

sn-2
12
13
14
15
16
17
18
19
23
24
25
26
27
28
29
30
62. Please check the component of your Career Learning courses that was thebest preparation for each section of the Licensing Examination:
Labs Reading Written Exams Review Lectures DiscussionMaterial assignments seminars
1 2 3 4 5 6 7
RadiographicTechniquesStandardPositioningAnatomy/PhysiologyX-rayPhysicsRadiationTherapy
-
SpecialProcedures
.
GeneralPhysics
Therapy
53. On the following chart please check the item that was most helpful aspreparation for each section of the Licensing Examination:
Subjectmatterstressed
Presentation Response Teachers Individualof material to comments assistance
uestions
Teachingaids
RadiographicTechniques
1 2 3 4 5 6
StandardPositioningAnatomy/PhysiologyX-rayPhysicsRadiationTherapySpecialProceduresGeneralPhysics
Therapy
47

1
1
34
35
36
37
38
39
40
42
43
44
45
46
47
148
49
50
51
52
53
Please rate your Career Learning courses as preparation
for each section of the Licensing Examination.
54. For the Radiographic Techniques section:
Very
useful1
Useful Useless VeryUseless
2 3 4
Does notapply
5
Radiologic Technic I 1
Radiologic TechnicLab I
Positionong I
Gross Anatomy I
Radiologic Technic IIRadiologic TechnicLab II
Positioning II
Clinical Practice I
Gross Anatomy II
Clinical Practice IIMedical/SurgicalDiseases
Positioning III
Patient Care I
Radiologic Technic ,III
Clinical Practice III
X-ray Physics
Radiation Therapy
Dental Radiography
Special Procedures
Clinical Practice IV
Clinical Practice V
488

55
56
57
58
59
60
61
62
63
64
65
66
67
68
69
70
71
72
73
74
75
Please rate your Career Learning courses as preparationfor each section of the Licensing examination.
55. For the Standard Positioning section:
Very Usefuluseful
1 2
Useless Very Does notUseless apply
3 4 5
Radiologic Technic IRadiologic TechnicLab I
Positionong I
Gross Anatomy I
Radiologic Technic IIRadiologic TechnicLab II
Positioning II
Clinical Practice I
Gross Anatomy II
Clinical Practice IIMedical/SurgicalDiseases
Positioning III
Patient Care
Radiologic Technic III
Clinical Practice III
X-ray Physics
Radiation Therapy
Dental Radiography
Special Procedures
Clinical Practice IV
Clinical Practice V
._
4S9.

sn-3
12
15
16
21
12
24
115.
27
119
1930
111
12
Please rate your Career Learning courses as preparationfor each section of the Licensing Examination.
56. For the Anatomy/Physiology section:
Veryuseful
1
Useful 'iseless Very
Useless2 3 4
Does notapply
5
Radiologic Technic IRadiologic TechnicLab I
Positionong I
Gross Anatomy I
Radiologic Technic IIRadiologic TechnicLab II
Positioning II
Clinical Practice I
Gross Anatomy II
Clinical Practice IIMedical/girgicalDiseases
Positioning III
Patient Care
Radiologic Technic III
Clinical Practice III
X-ray Physics
Radiation Therapy
Dental Radiography
Special Procedures
Clinical Practice IV
Clinical Practice V
490

33
34
35
36
37
38
39
40
41
42
43
4 7
48
49
51
52
53
Please rate your Career Learning courses as preparationfor each section of the Licensing Examination.
57. For the X-ray Physics section.
Very
useful1
Useful Useless VeryUseless
2 3 4
Does notapply
5
Radiologic Technic IRadiologic TechnicLab I
Positionong I
Gross Anatomy I
Radiologic Technic IIRadiologic TechnicLab II
Positioning II
Clinical Practice I
Gross Anatomy II
Clinical Practice IIMedical/SurgicalDiseases
Positioning III
Patient Care
Radiologic Technic III
Clinical Practice III
X-ray Physics
Radiation Therapy
Dental Radiography
Special Procedures
Clinical Practice IV
Clinical Practice V
4911

1
Please rate your Career Learning courses as preparationfor each section of the Licensing txamination.
58. For the Radiation Therapy section:
Veryuseful
Useful Useless Very Does notUseless apply
2 3 4 5
Radiologic Technic IRadiologic TechnicLab I
Positionong I
Gross Anatomy I
Radiologic Technic IIRadiologic TechnicLab II
Positioning II
Clinical Practice I
Gross Anatomy II
Clinical Practice IIPRica /SurgicalDiseases
Positioning III
Patient Care
Radiologic Technic III
Clinical Practice III
X-ray Physics
Radiation Therapy
Dental Radiography
Special Procedures
Clinical Practice IV
Clinical Practice V
492

sn -
12
13
P+
15
16
17
18
19
20
22
23
24
25
26
27.
28
29
30
31
32
Please rate your Career Learning courses as preparationfor each section of the Licensing Examination.
59. For the Special Procedures section:
Very Useful
useful1
Useless VeryUseless
2 3 4
Does notapply
5
Radiologic Technic IRadiologic TechnicLab I
Positionong I
Gross Anatomy I
Radiologic Technic IIRadiologic TechnicLab II
Positioning II
Clinical Practice I
Gross Anatomy II
Clinical Practice IIMedical/SurgicalDiseases
Positioning III
Patient Care
Radiologic Technic III
Clinical Practice III
X-ray Physics
Radiation Therapy
Dental Radiography
Special Procedures
Clinical Practice IV
Clinical Practice V
433 1

466
11
13
11
19
1
12
Please rate your Career Learning courses as preparationfor each section of the Licensing Examinatior.
60. For the General Physics section:
Veryuseful
Useful Useless Very Does notUseless apply
2 3 4 5
1
Radiologic Technic IRadiologic TechnicLab 1
Positionong I
Gross Anatomy I
Radiologic Technic IIRadiologic TechnicLab II
Positioning II
Clinical Practice I
Gross Anatomy II
Clinical Practice IIMedical/SurgicalDiseases
Positioning III
Patient Care
Radiologic Technic III
_.. ,
Clinical Practice III
X-ray Physics:...
Radiation Thera.e
Dental Radiography
.
.
Special Procedures
Clinical Practice IV
Clinical Practice V,
494,

54
55
56
57
58
59
60
61
62
63
64
65
66
67
68
69
70
71
72.
73
74
Please rate your Career Learning courses as preparationfor each section of the Licensing Examination.
61. For the Therapy section:
Very
useful
Useful Useless Very
Useless2 3 4
Does notapply
5
Radiologic Technic IRadiologic TechnicLab I
Positionong I
Gross Anatomy I
Radiologic Technic IIRadiologic TechnicLab II
Positioning II
Clinical Practice I
Gross Anatomy II
Clinical Practice IIMedical/Surgical
Diseases
Positioning III
Patient Care
Radiologic Technic III
Clinical Practice III
X-ray Physics,
Radiation Therapy
Dental Radiography
Special Procedures
Clinical Practice IV
Clinical Practice V
495
1

17
21
1123
21
21
26
21
29
31
31
32
62. Please rate your Career Learning courses as preparation for the Real World:
useful
Very Useful Useless
1 2
VeryUseless
3 4
Does notapply
5
Radiologic Technic IRadiologic TechnicLab I
Positionong I
Gross Anatomy I
Radiologic Technic IIRadiologic TechnicLab II
Positioning II
Clinical Practice I
Gross Anatomy II
Clinical Practice IIMedical/SurgicalDiseases
Positioning III
Patient Care
Radiologic Technic III
Clinical Practice III
X-ray Physics
Radiation Therapy
Dental Radiography
Special Procedures
Clinical Practice IV
Clinical Practice V
496
468

63. Please rate your Career Learning instructors for their help in preparing
you for each section of the Licensing Examination:
Excellent Very Good Fair Poor
Good1 2 3 4 5
RadiographicTechniquesStandardPositioningAnatomy/PhysiologyX-rayPhysicsRadiationTherapy
._
SpecialProceduresGeneralPhysics
Therapy
64. Which year did you take the New York State Licensing Examination?
0. Did not take 1. 1968 2. 1969 3. 1970 4. 1971 5. 1972
6. 1973 7. 1974 8. 1975
497
1
1

470
Faculty Perceptions Questionnaire
498

1
2
471
New York City Community CollegeOF THE CITY UNIVERSITY OF NEW YORK, 300 JAY STREET, BROOKLYN, N.Y. 11201
ALLIED HEALTH PROGRAM SURVEYFaculty Perception Questionnaire
Please CIRCLE the number of the response that is your current answer toeach multiple choice question. If the question requires a write-inanswer, please PRINT your response.
I. What is your position?
1. Faculty, full time 2. Faculty, part time, day 3. Faculty, part time,evening
4. Faculty, adjunct 5. Other (specify)
2. What is your rank?
I. Professor 2. Associate Prof. 3. Assistant Prof. 4. Lecturer
5. Instructor 6. Other (specify)
3. What is your length of service at N.Y.C.C.C.?
3 years
4. What is your teaching experience prior to coming to N.Y.C.C.C.?
5 years
5. What department are you in?
7 I. Chemical Tech. 2. Dental Hygiene 3. Dental Lab. 4. Medical Lab.
5. Nursing 6. Opthalmic Dispensing 7. Radiologic Tech.
8. Other (specify)
6. Are you tenured?
8 I. Yes 2. No
7. What courses do you teach during the academic year?
9

21
25
29
33
37
41
42
43
44
45
47
48
49
50
51
8. Please complete the following chart indicating the approximate percentage of yourteaching load required for each function.
FunctionPercent for
Classroom and/or LabPercent for
Certification Exam
Lectures
Seminars
Laboratory
Individualized Instruction
Evaluation and Testing
Other (specify)
9. Please indicate the extensiveness of your use of the following techniques in yourcourses.
NotAlways Usually Sometimes Rarely Never Applic.
1 2 3
Past/Fail Examinations
Curve Grading
Behavioral Objectives
Individualized Instruction
Audio/Visual Media
10. Please indicate your perceptions of the academic quality of the department and studentsentering the program as listed below.
VeryHigh High
1 2
Average3
VeryLow Low
14
Department, prior toopen admissionsStudents, prior toopen admissionsDepartment, currently
Current students,regular admissionCurrent students,open admission
11. How important do you believe it is for students in your department to pass theappropriate certification/licensure examination?
52 1. Extremely important 2. Very important 3. Important 4. Unimportant
5. No opinion 6. Not applicable
5i0
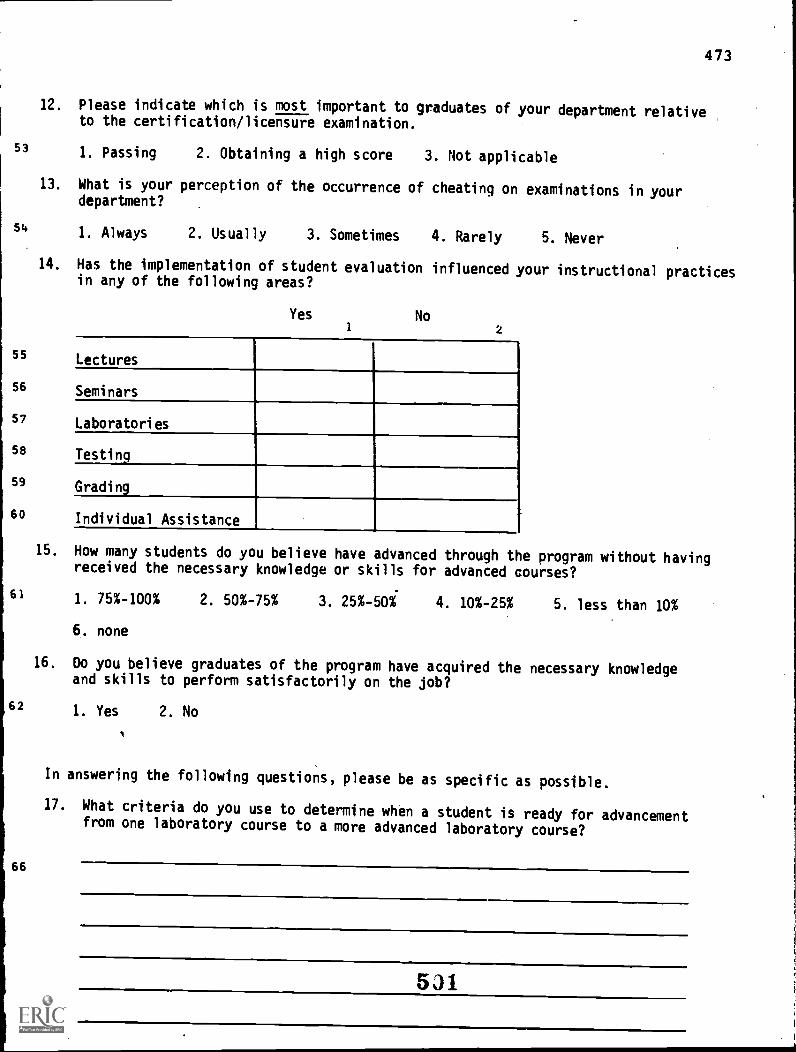
473
12. Please indicate which is most important to graduates of your department relativeto the certification/licensure examination.
53 1. Passing 2. Obtaining a high score 3. Not applicable
13. What is your perception of the occurrence of cheating on examinations in yourdepartment?
54 1. Always 2. Usually 3. Sometimes 4. Rarely 5. Never
14. Has the implementation of student evaluation influenced your instructional practicesin any of the following areas?
Yes1
No2
55 Lectures
56 Seminars
57 Laboratories
58 Testing
59 Gradin9
60 Individual Assistance
15. How many students do you believe have advanced through the program without havingreceived the necessary knowledge or skills for advanced courses?
61 1. 75%-100% 2. 50%-75% 3. 25%-50% 4. 10%-25% 5. less than 10%
62
66
6, none
16. Do you believe graduates of the program have acquired the necessary knowledgeand skills to perform satisfactorily on the job?
1. Yes 2. No
In answering the following questions, please be as specific as possible.
17. What criteria do you use to determine when a student is ready for advancementfrom one laboratory course to a more advanced laboratory course?
531

70
73
76
18. What do you perceive to be weaknesses in the program and how can they be corrected?
19. How can the students be better served by the department?
20. Please describe your perceptions of the typical open admissions student enteringyour department.
5.)2

475
Employer Perceptions Questionnaires
503

476
New York City Community College ALLIEDHEALTH
DEPARTMENTOF THE CITY UNIVERSITY OF NEW YORK, 300 JAY STREET, BROOKLYN, N.Y. 11201 SURVEY
EMPLOYER EVALUATION
MEDICAL LABORATORY TECHNOLOGY DEPARTMENTPlease consider graduates of the above referenced program. ONLY when responding.
Please CIRCLE the number of the response that is your currentanswer to each multiple choice question. If the question req-
a write-in answer, please PRINT your response.
I. Organization name
Your name
Address
2. Do you have any graduates of the above program of New York City Community College (N.Y.C.C.C.) in
your employ at this time?
1. Yes 2. No
3. How many graduates of the above program of New York City Community College are you currently employing?
graduates
4. Have you employed any graduates of the above program of N.Y.C.C.C. in the past?
1. Yes 2. No
5. What is the total number of graduates of the above program at N.Y.C.C.C. that you have employed,not including those currently employed?
graduates
6. How many graduates of the above program of N.Y.C.C.C. have been superior to the average entry level employee?
1. None 2. Very few 3. Some 4. Most 5. All
7. How many graduates of the above program of N.Y.C.C.C. nave been inferior to the average entry level employee?
1. None 2. Very few 3. Some 4. Most 5. All
8. How much orientation and/or in-service training do you expect to provide the average new employee?
number of hours
9. How much orientation and/or in-service training is required for a typical N.Y.C.C.C. graduate of the aboveprogram?
number of hours
10. Do you expect to employ future graduates of the above program of N.Y.C.C.C. if you hire specialists in the
future?1. Yes 2. No
11. Please indicate where your hiring emphasis will be for the next five years.
1. Associate degree level 2. Baccalaureate degree level 3. No emphasis
4. Can't forecast 5. Don't plan to hire 6. Other
5.J4

12. On the chart below, please rate the Initial Entry Characteristics of most of theN. Y. C. C. C. graduates in your employ, in each area specified.
VeryExcellent good Good Fair Pbor Acceptable Apply
Not Doesn't
Technical competency
Technical knowledge
Theoretical knowledge
Manipulative skills
Communication skills, oral
Communication skills, written
Mathematic competency
Basic science background
Adaptability1
.
Responsibility
Reliability1
Punctuality
Peer relationships _
Supervisor relationships
Client/patient relationships
Initiative
Cooperation
Enthusiasm
Organizational loyalty
Personal appearance
Overall rating
13. If you have terminated the employment of a NYCCC graduate for unsatisfactory performance, circle the reasons:
1. Technical competence 2. Technical knowledge 3. Theoretical knowledge 4. Manipulative skills
5. Communication skills, oral 6. Communication skills, written 7. Adatability 8. Responsibility
9. Reliability 10. Punctuality 11. Peer relationships 12. Supervisor Relationships 13. Initiative
14.Client/patient relationships 15. Cooperation 16.Enthusiasm 17. Organizational loyalty
18.Personal appearance 19. Other (please specify)
14. Have you had opportunities to make your employment needs known to the appropriate departments at N. Y. C. C. C.?
1. Yes 2. No
15. If the means were available, would you make your needs and opinions known to N.Y.C.C.C. on a regular basis?
1. Yes 2. No
16. Please tell us how we may better prepare our graduates for employment in your organization. Please be specific.
5 ;)5

New York City Community CollegeOF THE CITY UNIVERSITY OF NEW YORK, 300 JAY STREET, BROOKLYN, N.Y. 11201
EMPLOYER EVALUATION
ALLIEDHEALTH
DEPARTMENTSURVEY
478
DENTAL LABORATORY DEPARTMENTPlease consider graduates of the above referenced program ONLY when responding.
1 1. Organization name
Your name
Address
Please CIRCLE the number of the response that is your currentanswer to each multiple choice question. If the question req-
a write-in answer. please PRINT your response.
2. Do you have any graduates of the above program of New York City Community College (N.Y.C.C.C.) inyour employ at this time?
10 1. Yes 2. No
3. How many graduates of the above program of New York City Community College are you currently employing?
11 graduates
4. Have you employed any graduates of the above program of N.Y.C.C.C. in the past?
13 1. Yes 2. No
5. What is the total number of graduates of the above program at N.Y.C.C.C. that you have employed,not including those currently employed?
14graduates
6. How many graduates of the above program of N.Y.C.C.C. have been superior to the average entry level employee?
161. None 2. Very few 3. Some 4. Most 5. All
7. How many graduates of the above program of N.Y.C.C.C. nave been inferior to the average entry level employee?
171. None 2. Very few 3. Some 4. Most 5. All
8. How much orientation and/or in-service training do you expect to provide the average new employee?
10number of hours
9. How much orientation and/or in-service training is required for a typical N.Y.C.C.C. graduate of the aboveprogram?
21 number of hours
10. Do you expect to employ future graduates of the above prog.-am of N.Y.C.C.C. if you hire specialists in thefuture?
24 1. Yes 2. No
25
11. Please indicate where your hiring emphasis will be for the next five years.
1. Associate degree level 2. Baccalaureate degree level
4. Can't forecast 5. Don't plan to hire
5J6
3. No emphasis
6. Other

26
27
26
25
30
31
32
33
35
36
37
36
39
40
41
42
45
46
12. On the chart below, please rate the Initial Entry Characteristics of most of theN. Y. C. C. C. graduates in your employ, in each area specified.
VeryExcellent good Good Fair Poor Acceptable Apply
Not Doesn't
Technical competency
Technical knowledge
Theoretical knowlee
Manipulative skills
Communication skills, oral
Communication skills, written
Mathematic competency
Basic science background
Adaptability
Responsibility
Reliability
Punctuality
Peer relationships
Su ervisor relationshi s
Client/patient relationships
Initiative
Cooperation
Enthusiasm
Organizational loyalty
Personal appearance
Overall rating ,
13. If you have terminated the employment of a NYCCC graduate for unsatisfactory performance, circle the reasons:
47 1. Technical competence 2. Technical knowledge 3. Theoretical knowledge 4. Manipulative skills51
5. Communication skills, oral 6. Communication skills, written 7. Adatability 8. Responsibility55 9. Reliability 10. Punctuality 11. Peer relationships 12. Supervisor Relationships 13. Initiative60
14.Client/patient relationships 15. Cooperation 16.Enthusiasm 17. Organizational loyalty64
18.Personal appearance 19. Other (please specify)
14. Have you had opportunities to make your employment needs known to the appropriate departments at N. Y. C. C. C.?66
1. Yes 2. No
15. If the means were available, would you make your needs and opinions known to N.Y.C.C.C. on a regular basis?67
1. Yes 2. No
16. Please tell us how we may better prepare our graduates for employment in your organization. Please be specific.
5

New York City Community College!OF THE CITY UNIVERSITY OF NEW YORK, 300 JAY STREET, BROOKLYN, NW. 11201
EMPLOYER EVALUATION
ALLIEDHEALTH
DEPARTMENTSURVEY
480
DENTAL HYGIENE DEPARTMENTPlease consider graduates of the above referenced program ONLY when responding.
. .
1. Organization name
Your name
Address
Please CIRCLE the number of the response that is your currentanswer to each multiple choice question. if the opestion req-
a write-in answer, please PRINT your response,-
2. Do you have any graduates of the above program of New York City Community College (N.Y.C.C.C.) inyour employ at this time?
I. Yes 2. No
3. How many graduates of the above program of New York City Community College are you currently employing?
graduates
4. Have you employed any graduates of the above program of N.Y.C.C.C. in the put?
I. Yes 2. No
5. What is the total number of graduates of the above program at N.Y.C.C.C. that you have employed,not including those currently employed?
graduates
6. How many graduates of the above program of N.Y.C.C.C. have been superior to the average entry level employee?
I. None 2. Very few 3. Some 4. Most 5. All
7. How many graduates of the above program of N.Y.C.C.C. nave been inferior to the average entry level employee?
I. None 2. Very few 3. Some 4. Most 5. All
8. How much orientation and/or in-service training do you expect to provide the average new employee?
number of hours
9. How much orientation and/ar in-service training is required for a typical N.Y.C.C.C. graduate of the aboveprogram?
number of hours
10. Do you expect to employ future graduates of the above program of N.Y.C.C.C. if you hire specialists in thefuture?
I. Yes 2. No
11. Please indicate where your hiring emphasis will be for the next five years.
1. Associate degree level 2. Baccalaureate degree level
4. Can't forecast 5, Don't plan to hire
508
3. No emphasis
6. Other

12. On the chart below, please rate the Initial Entry Characteristics of most of theN. Y. C. C. C. graduates in your employ, in each area specified.
26
27
2$
29
30
31
32
.33
35
36
37
38
39
40
41
43
45
46
VeryExcellent good Good Fair Poor Acceptable Apply
Not Doesn't
Technical competency
Technical knowledge
Theoretical knowledge
Manipulative skills
Communication skills, oral
Communication skills, written
Mathematic competency
Basic science background
Adaptability
Responsibility
Reliability
Punctuality
Peer relationships
Supervisor relationships
Client/patient relationships
Initiative
Cooperatton
Enthusiasm
Organizational loyalty
Personal appearance
Overall rating ,
13. If you have terminated the employment of a NYCCC graduate for unsatisfactory performance, circle the reasons:
1. Technical competence 2. Technical knowledge 3. Theoretical knowledge 4. Manipulative skills
sl 5. Communication skills, oral 6. Communication skills, written 7. Adatability 8. Responsibility
S5 9. Reliability 10. Punctuality 11. Peer relationships 12. Supervisor Relationships 13. Initiative
Go 14.Client/patient relationships 15. Cooperation 16.Enthusiasm 17. Organizational loyalty
64 18.Personal appearance 19. Other (please specify)
14. Have you had opportunities to make your employment needs known to the appropriate departments at N. Y. C. C. C.?
661. Yes 2. No
15. If the means were available, would you make your needs and opinions known to N.Y.C.C.C. on a regular basis?
471. Yes 2. No
16. Please tell us how we may better prepare our graduates for employment in your organization. Please be specific.
5

ALLIEDNew York City Community College HEALTHDEPARTMENT
OF THE CITY UNIVERSITY OF NEW YORK, 300 JAY STREET, BROOKLYN, N.Y. 11201 SURVEY
EMPLOYER EVALUATION
482
CHEMICAL TECHNOLOGY DEPARTMENTPlease consider graduates of the above referenced program ONLY when responding.
I. Organization name
Your name
Address
Please CIRCLE the number of the response that is your currentarswer to each multiple choice question. If the question req-
1 write-in answer, please PRINT your response.
2. Do you have any graduates of the above program of New York City Community College (N.Y.C.C.C.) inyour employ at this time?
I. Yes 2: No
3. How many graduates of the above program of New York City Community College are you currently employing?
graduates
4. Have you employed any graduates of the above program of N.Y.C.C.C. in the past?
I. Yes 2. No
5. What is the total number of graduates of the above program at N.Y.C.C.C. that you have employed,not including those currently employed?
graduates
6. How many graduates of the above program of N.Y.C.C.C. have been superior to the average entry level employee?'
I. None 2. Very few 3. Some 4. Most 5. All
7. How many graduates of the above program of N.Y.C.C.C. nave been inferior to the average entry level employee?
I. None 2. Very few 3. Some 4. Most 5. All
8. How much orientation and/or in-service training do you expect to provide the average new employee?
number of hours
9. How much orientation and /or in-service training is required for a typical N.Y.C.C.C. graduate of the aboveprogram'
number of hours
10. Do you expect to employ future graduates of the above program of N.Y.C.C.C. if you hire specialists in thefuture?
1 Yes 2. No
11. Please indicate where your hiring emphasis will be for the next five years.
I. Associate degree level
4. Can't forecast
2. Baccalaureate degree level 3. No emphasis
5. Don't plan to hire 6. Other
510

26
27
28
29
30
31
32
33
34
35
36
37
38
39
40
41
42
43
44
45
46
12. On the chart below, please rate the Initial Entry Characteristics of most of theN. Y. C. C. C. graduates in your employ, in each area specified.
VeryExcellent good Good Fair Poor Acceptable Apply
Not Doesn't
Technical competency
Technical knowledge
Theoretical knowledge
Manipulative skills
Communication skills, oral
Communication skills, written
Mathematic comptency
Basic science background
Adaptability
Responsibility
Reliability
Punctuality
Peer relationships
Supervisor relationships
Client/patient relationships
Initiative
Cooperaticvi
Enthusiasm
Organizational loyalty
Personal appearance
Overall rating
13. If you have terminated the employment of a NYCCC graduate for unsatisfactory performance, circle the reasons:
47 1. Technical compPtence 2. Technical knowledge 3. Theoretical knowledge 4. Manipulative skills
51 5. Communication skills, oral 6. Communication skills, written 7. Adatability 8. Responsibility
55 9, Reliability 10, Punctuality 11. Peer relationships 12. Supervisor Relationships 13. Initiative
60 14.Client/patient relationships 15. Cooperation 16.Enthusiasm 17. Organizational loyalty
64 18.Personal appearance 19. Other (please specify)
14. Have you had opportunities to make your employment needs known to the appropriate departments at N. Y. C. C. C.?
661. Yes 2, No
15. If the means we(e available, would you make your needs and opinions known to N.Y.C.C.C. on a regular basis?
671. Yes 2. No
16. Please tell us how we may better prepare our graduates for employment in your organization. Please be specific.
511

New York City Community CollegeOF THE CITY UNIVERSITY OF NEW YORK, 300 JAY STREET, BROOKLYN, N.Y. 11201
EMPLOYER EVALUATION
ALLIEDHEALTH
DEPARTMENTSURVEY
484
NURSING DEPARTMENTPlease consider graduates of the above referenced program ONLY when responding.
1. Organization name
Your name
Address
Please CIRCLE the number of the response that is your currentanswer to each multiple choice question. if the question req-
a write-in answer, please PRINT your response.
2. Do you have any graduates of the above program of New York City Community College (N.Y.C.C.C.) inyour employ at this time?
1. Yes 2. No
3. How many graduates of the above program of New York City Community College are you currently employing?
graduates
4. Have you employed any graduates of the above program of N.Y.C.C.C. in the past?
1. Yes 2. No
5. What is the total number of graduates of the above program at N.Y.C.C.C. that you have employed,not including those currently employed?
graduates
6. How many graduates of the above program of N.Y.C.C.C. have been superior to the average entry level employee?
1. None 2. Very few 3. Some 4. Most 5. All
7. How many graduates of the above program of N.Y.C.C.C. nave been inferior to the average entry level employee?
1. None 2. Very few 3. Some 4. Most 5. All
8. How much orientation and/or in-service training do you expect to provide the average new employee?
number of hours
9. How much orientation and/or in-service training is required for a typical N.Y.C.C.C. graduate of the aboveprogram?
number of hours
10. Do you expect to employ future graduates of the above program of N.Y.C.C.C. if you hire specialists in thefuture?
1. Yes 2. No
11. Please indicate where your hiring emphasis will be for the next five years.
1. Associate degree level 2. Baccalaureate degree level 3. No emphasis
4. Can't forecast 5. Don't plan to hire 6. Other
,.512

26
/7
28
29
30
31
32
33
314
35
36
37
38
39
140
41
42
43
1414
45
1.6
12. On the chart below, please rate the Initial Entry Characteristics of most of theN. Y. C. C. C. graduates in your employ, in each area specified.
VeryExcellent good Good Fair Poor Acceptable Apply
Not Doesn't
Technical competency
Technicallcnowledge
Theoretical knowledge
Manipulative skills
Communication skills, oral
Communication skills, written
Mathematic competency
Basic science background
Adaptability
Responsibility
Reliability
Punctuality
Peer relationships
Supervisor relationships
Client/patient relationships
Initiative
Cooperation
Enthusiasm
Organizational loyalty
Personal appearance
Overall rating
13. If you have terminated the employment of a NYCCC graduate for unsatisfactory performance, circle the reasons:'
47 1. Technical competence 2. Technical knowledge 3. Theoretical knowledge 4. Manipulative skills
51 5. Communication skills, oral 6. Communication skills, written 7. Adatability 8. Responsibility
55 9. Reliability 10. Punctuality 11. Peer relationships 12. Supervisor Relationships 13. Initiative
60 14.Client/patient relationships 15. Cooperation 16.Enthusiasm 17. Organizational loyalty
64 18.Personal appearance 19. Other (please specify)
14. Have you had opportunities to make your employment needs known to the appropriate departments at N. Y. C. C. C.?
661. Yes 2. No
15. If the means were available, would you make your needs and opinions known to N.Y.C.C.C. on a regular basis?
671. Yes 2. No
16. Please tell us how we may better prepare our graduates for employment in your organization. Please be specific.
;51.3

New York City Community CollegeOF THE CITY UNIVERSITY OF NEW YORK, 300 JAY STREET, BROOKLYN, h.Y. 11201
EMPLOYER EVALUATION
ALLIEDHEALTH
DEPARTMENTSURVEY
486
OPTHALMIC DISPENSING DEPARTMENTPlease consider graduates of the above referenced program ONLY when responding.
1 1. Organization name
Your name
5 Address
Please CIRCLE the number of the response that is your currentanswer to each multiple choice question. If the question req-
a write-in answer, please PRINT your response.
2. Do you have any graduates of the above program of New York City Community College (N.Y.C.C.C.) inyour employ at this time?
10 1. Yes 2. No
3. How many graduates of the above program of New York City Community College are you currently employing?
11 graduates
4. Have you employed any graduates of the above program of N.Y.C.C.C. in the past?
13 I. Yes 2. No
14
5. What is the total number of graduates of the above program at N.Y.C.C.C. that you have employed,not including those currently employed?
graduates
6. How many graduates of the above program of N.Y.C.C.C. have been superior to the average entry level employee?
161. None 2. Very few 3. Some 4. Most 5. All
7. How many graduates of the above program of N.Y.C.C.C. nave been inferior to the average entry level employee?
71. None 2. Very few 3. Some 4. Most 5. All
8. How much orientation and/or in-service training do you expect to provide the average new employee?
8number of hours
9. How much orientation and/or in-service training is required for a typical N.Y.C.C.C. graduate of the aboveprogram?
number of hours
10. Do you expect to employ future graduates of the above program of N.Y.C.C.C. if you hire specialists in thefuture?
4 1. Yes 2. No
5
11. Please indicate where your hiring emphasis will be for the next five years.
1, Associate degree level
4. Can't forecast
2. Baccalaureate degree level 3. No emphasis
5. Don't plan to hire 6. Other

26
27
28
29
30
31
32
33
34
35
36
37
38
39
40
42
43
44
45
46
12. On the chart below, please rate the Initial Entry Characteristics of most of theN. Y. C. C. C. graduates in your employ, in each area specified.
VeryExcellent good Good Fair Poor Acceptable Apply
Not Doesn't
Technical competency
Technical knowledge.
Theoretical knowledge
Manipulative skills
Communication skills, oral
Communication skills, written-.
Mathematic competency
Basic science background
Adaptability
Responsibility
Reliability
Punctuality
Peer relationships
Supervisor relationships
Client/patient relationships
Initiative
Cooperation
Enthusiasm
Organizational loyalty
Personal appearance
Overall rating
13. If you have terminated the employment of a NYCCC graduate for unsatisfactory performance, circle the reasons:
47 1. Technical competence 2. Technical knowledge 3. Theoretical knowledge 4. Manipulative skills
si 5. Communication skills, oral 6. Communication skills, written 7. Adatability 8. Responsibility
55 9, Reliability 10. Punctuality 11. Peer relationships 12. Supervisor Relationships 13. Initiative
60 14.Client/patient relationships 15. Cooperation 16.Enthusiasm 17. Organizational loyalty
64 18.Personal appearance 19. Other (please specify)
14. Have you had opportunities to make your employment needs known to the appropriate departments at N. Y. C. C. C.?
661. Yes 2. No
15. If the means were available, would you make your needs and opinions known to N.Y.C.C.C. on a regular basis?
671. Yes 2. No
16. Please tell us how we may better prepare our graduates for employment in your organization. Please be specific.

New York City Community CollegeOF THE CITY UNIVERSITY OF NEW YORK, 300 JAY STREET, BROOKLYN, N.Y. 11201
EMPLOYER EVALUATION
ALLIEDHEALTH
DEPARTMENTSURVEY
488
RADIOLOGIC TECHNOLOGY DEPARTMENTPlease consider graduates of the above referenced program ONLY when responding.
1. Organization name
Your name
Address
Please CIRCLE the number of the response that is your currentanswer to each multiple choice question. If the question req-
a write-in answer, please PRINT your response.
2. Do you have any graduates of the above program of New York City Community College (N.Y.C.C.C.) inyour employ at this time?
1. Yes 2. No
3. How many graduates of the above program of New York City Community College are you currently employing?
graduates
4. Have you employed any graduates of the above program of N.Y.C.C.C. in the past?
1. Yes 2. No
5. What is the total number of graduates of the above program at N.Y.C.C.C. that you have employed,not including those currently employed?
graduates
6. How many graduates of the above program of N.Y.C.C.C. have been superior
1. None 2. Very few 3. Some 4. Most 5. All
7. How many graduates of the above program of N.Y.C.C.C. nave been inferior
1. None 2. Very few 3. Some 4. Most 5. All
8. How much orientation and/or in-service training do you expect to provide
number of hours
to the average entry level employee?
to the average entry level employee?
the average new employee?
9. How, much orientation and/or in-service training is required for a typical N.Y.C.C.C. graduate of the aboveprogram?
number of hours
10. Do you expect to employ future graduates of the above program of N.Y.C.C.C. if you hire specialists in thefuture?
1. Yes 2. No
11. Please indicate where your hiring emphasis will be for the next five years.
1. Associate degree level
4. Can't forecast
2. Baccalaureate degree level 3. No emphasis
5. Don't plan to hire 6. Other

26
27
28
29
30
31
32
33
34
35
36
37
38
39
40
41
42
43
44
45
46
12. On the chart below, please rate the Initial Entry Characteristics of most of theN. Y. C. C. C. graduates in your employ, in each area specified.
VeryExcellent good Good Fair Poor Acceptable Apply
Not Doesn't
Technical competency
Technical knowledge
Theoretical knowledge
Manipulative skills
Communication skills, oral
Communication skills, written ;
Mathematic competency
Basic science background
Adaptability
Responsibility
Reliability.
Punctuality.
Peer relationships
Supervisor relationships
Client/patient relationshipsH
Initiative
Cooperation
Enthusiasml
Organizational loyalty
Personal appearance
Overall ratingi .
13. If you have terminated the employment of a NYCCC graduate for unsatisfactory performance, circle the reasOnc
47 1. Technical competence 2. Technical knowledge 3. Theoretical knowledge 4. Manipulative skills
51 5. Communication skills, oral 6. Communication skills, written 7. Adatability 8. Responsibility
55 9. Reliability 10. Punctuality 11. Peer relationships 12. Supervisor Relationships 13. Initiative
60 14.Client/patient relationships 15. Cooperation 16.Enthusiasm 17. Organizational loyalty
6418.Personal appearance 19. Other (please specify)
14. Have you had opportunities to make your employment needs known to the appropriate departments at N. Y. C. C. C.?
661. Yes 2. No
15. If the means were available, would you make your needs and opinions known to N.Y.C.C.C. on a regular basis?
671. Yes 2. No
16. Please tell us how we may better prepare our graduates for employment in your organization. Please be specific.
517

490
Allied Health Learning Center Evaluation
Student Questionnaire
518

1
2
491
New York City Community CollegeOF THE CITY UNIVERSITY OF NEW YORK, 300 JAY STREET, BROOKLYN, N.Y. 11201
ALLIED HEALTH PROGRAM SURVEYAllied Health Learning Center Student Questionnaire
Please CIRCLE the number of the response that is your current answer to eachmultiple cnoice question. If the question requires a write-in answer, please
PRINT your response.
1. What is your program?
1. Chemical Technology 2. Dental Hygiene 3. Dental Laboratory 4. Medical Lab.
5. Nursing 6. Opthalmic Dispensing 7. Radiologic Technology
2. What is your predominant attendance category?
1. Full time/Day 2. Part time/Day 3. Full time/Evening 4. Part time/Evening
3. What is your enrollment pattern?
3 1. Continuous 2. Non-continuous
4. What is your expected year of graduation?
4 1. 1975 2. 1976 3. 1977 4. 1978 5. Other (specify)
5. What year did you start New York City Community College (N.Y.C.C.C.)?
5 1. 1971 2. 1972 3. 1973 4. 1974 5. 1975 6. Other (specify)
6. Did you transfer into N.Y.C.C.C. Allied Health program from another program at N.Y.C.C.C.or another college and how many credits did you transfer?
6 O. Did not transfer in 1. Number of credits transferred:
7. If you transferred into N.Y.C.C.C., from what college and/or what program did you
transfer?
8 College /Program
8. What is your present age?
10 1. Below 19 2. 19-20 3. 21-23 4. 24-26 5. 27-29 6. 30-35 7. 35-40
8. Over 40
519.

9. What was your experience in the Health Field before your enrollment in N. Y. C. C. C.?
11 O. None 1. Aide' 2. Licensed Prectical Nurse 3. Technician 4. Corpsman (military)
5. Orderly 6. Transfer from Associate Program 7. Transfer from BS pgm 8. Other
10. On the average, how many hours per week have you been employed for a salary whileyou have been a student at N. Y. C. C. C.?
12 O. 0 hours 1. 1-10 hours 2. 11-20 hours 3. 21-30 hours 4. 31-40 hours 5 over 40 hrs
11. Have any of your instructors ever ex lained the services available to you atAllied Health Learning Center (calle A in this questionnaire)?
13 1. Yes 2. No.
12. Have any of your instructors ever recommended the services of AHLC to you?
14 1. Yes 2. No.
13. Have any of your Student Personnel Services Counselors ever explained theservices available to you at AHLC?
15 1. Yes 2. No
14. Have any of your Student Personnel Services Counselors ever recommended theservices of AHLC to you?
16 1. Yes 2. No.
15. Have any of your Departmental Academic Advisors ever explained the servicesavailable to you at AHLC?
17 1. Yes 2. No.
16. Have any of your Departmental Academic Advisors ever recommended the servicesof AHLC to you?
18 1. Yes 2. No
17. Have you attended the FRESHMAN LEARNING SKILLS/PROFESSIONAL LEARNING SYSTEMScourse (for Allied Health students in Pearl 503)?
19 1. Yes. 2. No.
ZO
21
22
23
.24
18. If your answer to #17 was Yes, please complete the following by checking the boxes:
The Freshman Learning Skills/ProfessionalLearning Systems course:
Yes Sometimes No1 2 3
Provides a necessary service
Helped improve your reading skill
. .
Helped improve your study skillsHelped increase yourbiostatistic understandinHelped increase your confITTFririn your overall ability _

49319. Have you attended the EFFECTIVE READING PROGRAM using the reading accelerator?
25 1. Yes 2. No.
IF your answer to question #19 was Yes, please answer questions 20 thru 22.
76 20. How many times did you attend?
27 21. How many passages did you read?
30
31
3
33
313
35
37
38
39
'40
41
42-
le 3
22. Please complete the following chart by checking the appropriate boxes:
The Effective Reading Program:Yes Sometimes No.
1 2 3
Provides a necessary service
Helped improve your reading rateHelped improve your readingcomprehensionHeT0ed increase your confidencein your overall ability
._
.
23. Have you attended the OPEN LAB in Pearl 506 for assistance in Allied Health courses?
1. Yes 2. No.
IF your answer to question 23 was Yes, please answer.questions 24 thru 29.
24. What type of assistance did you obtain?
Student assistance 1. Yes 2. No
Graduate of faculty assistance 1. Yes 2. No.
Individual use of materials 1. Yes 2. No.
25. Please evaluate the assistance by checking the boxes in the chart below:
Yes Sometimes No1 2 3
Was the assistance helpful?
Was the assistance sufficient?Did you request the useof Study Guides?
Were the study guides helpful?Did you use materials in theAHLC?
Were the materials helpful?
26. Have you attended Certification Seminars?
441. Yes 2. No.
45 27. How many Certification Seminar sessions did you attend?
5211

IF you did attend Certification Seminars, please answer questions 28 81 29.
28. Did the Certification Seminars help to increase your knowledge in the subjectareas they covered?
47 I. Yes 2. No.
29. Did the Certification Seminars help to increase your confidence in your abilityto pass the Certification Exam?
48 1. Yes 2. No.
30. Do you plan to attend Certification Seminars in the future?
49 1. Yes 2. No.
31. Has the Allied Health Learning Center been responsive to your needs?
50 1. Yes 2. Sometimes 3. No.
Please explain your answer.
32. How helpful do you believe the Allied Health Learning. Center is?
51 1. Extremely helpful 2. Very helpful 3. Somewhat helpful
4. Not very helpful 5. Useless
Please explain your answer.
33. What additional services can the Allied Health Learning, Center provide tostudents at N. Y. C. C. C.? Please be specific.
522
495
Allied Health Learning Center Evaluation
Faculty Questionnaire
523,

2
3
5
7
New York City Community CollegeOF THE CITY UNIVERSITY OF NEW YORK. 300 JAY STREET, BROOKLYN, N.Y. 11201 Faculty Questionnaire
Allied Health Learning Center
ALLIED HEALTH PROGRAM SURVEY
Please CIRCLE the number of the response that is your current answer to each multiple choice question.If the question requires a write-in answer, please PRINT your response.
1. What is your position?
1. Faculty, full time
4. Faculty, adjunct
2. What is your rank?
1. Professor 2. Associate Prof. 3. Assistant Prof. 4 Lecturer 5. Instructor 6. Other
3. What is your length of service at New York City Community College (N. Y. C. C. C.)?
years
4. What is your teaching experience prior to coming to N. Y. C. C. C.?
years
5. What department are you in?
1. Chemical Tech. 2. Dental Hygiene 3. Dental Lab 4. Medical Lab 5. Nursing
6. Opthalmic Dispensing 7. Radiologic Tech 8. Other
2. Faculty, part time, day
5. Department Chairperson
3. Faculty, part time, evening
6. Other
6. Are you tenured?
8 1. Yes 2. No
7. What courses do you teach during the academic year,
9
21
22
23
24
25
496
8. Have you used, or recommended that your students use the services of the Allied Health Learning Center (AHLC)in any of the following five major service categories?
Yes No1 2
A. Preparation of Instructional AidsStudent Service, including certification seminars, freshman learning skills
B. program. effective reading pgm., open learning_ lab, peer and adjunct assistance
C. Student Record Services (record review, computerized student reporting)
D. Use of audio/visual equipment
E. Faculty Workshops
26
27
2a
29
30
31
IF you have used AHLC services for the preparation of INSTRUCTIONAL AIDS, please answer questions 9 thru 12
9. Please indicate your assesment of AHLC Instructional Aids preparation by checking the boxes in the chart below.
Always Usually Sometimes Never Not Applicable2 3 4 5
Assistance in the developmentof materials was provided
Materials were produced correctly
Materials produced were effective
Materials arrived on time/Reproduction and distribution of
matorialc was catisfartnry
Redtarte' was excessive .
524

10. Did the Instructional Aid services provided by AHLC allow you to use materials that would otherwise havebeen unavailable to you?
3) 1. Yes 2. Sometimes 3. No
11. Do you believe your students learning was increased by your use of Instructional Aids prepared by AHLC?
13 1. Yes 2. Sometimes 3. No
Please explain
12. How can the production of Instructional Aids by AHLC be improved? Please be specific.
34
36
17
-48
19
:
IF you have recommended that your students use the AHLC STUDENT SERVICES, please answer questions 13 thru 16
13. Please indicate your assesment of components of AHLC Student Services by checking the boxes in the chart below.
Component
CERTIFICATION SEMINARS
NotAlways Usually Sometimes Never Applicable
2
A. Provide necessary service 1---'B. Increase student knowledge
Increase certificationC. passing probability
D. Increase student confidencernrr....mu 11-mn.YMff r.UVT1V V.....nr.rin.
Professional Learning Systems
A..Provide necessary servicei
Increase student readingB. and study skills
Increase certification/C. licensure passing probability
EFFECTIVE READING PROGRAM
A. PrOvides necessary serviceIncreases student reading
B. rate and comprehension
C. Increases student confidenceAnr. IVAMITUF. I*1.1 re.....1___.. __-,....____ A
9
graduate instruction, Instructional modules)
A. Provides necessary service
4B. Increases student knowledge
4` C. Increases student confidence
14. Do you believe the Student Services of AHLC should be expanded?
I. Yes 2. No.
15. If your answer to question 014 was Yes, please provide your suggestions for expansion.
5 ?5

49816. In what other ways can.Student Services of AHLC be improved? Please be specific.
49
49
50
51
IF you have used the STUDENT RECORD SERVICES of AHLC please answer questions 17 thru 19.
17. Please indicate your assesment of AHLC Student Record Services by checking the boxes in the chart below.
Student Data/Record ReviewSchedules have been:
Always1
Usually Sometimes Never Not Applicable2 3 4
Prompt
Helpful
In usable format
In sufficient detail
18. Did the Student Record Services provided by AHLC facilitate your efforts, in student placement?
52 1. Yes 2. Sometimes 3. No.
19. How can Student Record Services provided by AHLC be improved? Please be specific.
IF you have used AHLC services for AUDIO/VISUAL EQUIPMENT, please answer questions 20 thru 23.
20. Please indicate your assesment of AHLC Equipment Services by checking the boxes in the chart below.
NotAlways Usually Sometimes Never Applicable
1 2 3 4 5
53 Equipment available as scheduled
54 Equipment in good condition
21. Did the services provided by AHLC allow you to use more audio/visual equipment than you would havewithout the existence of these services?
55 1. Yes 2. Sometimes 3. No.
22. Do you believe your students learning was increased by your use of audio/visual equipment from AHLC?
56 1. Yes 2. Sometimes 3. No.
23. How can the audio/visual equipment services of AHLC be improved? Please be specific.
IF you have participated in any FACULTY WORKSHOPS sponsered by AHLC please answer questions 24 i 25
24. How can AHLC Faculty Workshops be improved and what additional topics can you recommend?
526

57
58
59
60
61
62
63
64
25. Please check the box that indicates your opinion of AHLC Faculty Workshops you have attended.
Very Somewhat NoUseful Useful Useless Opinion
1 2 3
Writing, instructional objectivesDesign and preparation oinstructional materials
-5-7a7&:iroLlicoisigilailomodular instructionDivision of Allied Health.aryermina
ion o reads yof curriculum textbook
II
Systems approach to instruction
-
-.TiChniques for valid evaluationof student performance
Other-
26. In your opinion, which method is most effective to inform students of available services of AHLC?
65 1. Handouts 2. Classroom announcements 3. Posters 4. Classroom orientation by AHLC representatives
27. Do you advise students with academic problems to use AHLC Student Services?
66 1. Yes 2, No.
28. Have you participated in the development of moaular instruction for use in:
67 Classroom 1. Yes 2, No.
68 Independent study in AHLC 1, Yes 2. No.
29. If you answered Yes to question f28, please rate modular instruction in the chart below.
Modular instruction was:Alwaysi Usually Sometimes3 Never
4Don't Know
69 Helpful
70 In useable format
71 Available for student use
30. How can the development of modules to support instruction be expanded and improved?
31. How many times do you have professional contact with personnel of AHLC per semester?
72 O. None 1. one - three 2. four - six 3. six - eight 4. nine - eleven 5. twelve or more
32. Overall, how valuable is AHLC to students and faculty of N. Y. C. C. C.?
73 1. Extremely valuable 2, Very Valuable 3. Somewhat valuable 4. Not valuable 5. Valueless
33. Have you been made aware of the full range of services offered by AHLC?
74 1. Yes 2, No,
34, To what degree are you aware of the full range of services offered by AHLC?
75 1. Completely aware 2. Somewhat aware 3. Little awareness 4. No knowledge
35. What additional services can AHLC provide to assist you and/or increase your students knowledge? Be specific.
36. What role do you think AHLC should play in the future of the Allied Health Division? Please be specific.
27