5/15/2015agec 495.3 business proposal. 5/15/2015agec 495.3 business proposal outline overview of...
TRANSCRIPT

04/18/23 AgEc 495.3 Business Proposal

04/18/23 AgEc 495.3 Business Proposal
Outline Overview of Business Planning Operations Plan Human Resources Plan Marketing Plan Financial Plan Conclusion

04/18/23 AgEc 495.3 Business Proposal
Production Facility
Insulated Door
Cherry Sorter and Conveyer
Cherry Pitter
Table
Ice Cream Batch
Freezer
Cooler
12X 24 Walk-in Freezer
40' X 40' Building
Table
3 Compartment
SinkEmployee Washroom
Vacuum Sealer andWeigh Scale Table
Cooler

04/18/23 AgEc 495.3 Business Proposal
Flow of Work

04/18/23 AgEc 495.3 Business Proposal
Average Business Week
About 11.7 L/ 15 minutes
374.4 L/ day 1 day/week on
marketing 1 day/week on
distribution About 90,000 L/ year
at maximum production capacity

04/18/23 AgEc 495.3 Business Proposal
Cost of Goods Manufactured
Cost of Goods Manufactured
Description Estimated Cost ($) Direct Expenses: Fruit: Cherries $1.59/kg 623 Apples $3.37/kg 661 Rhubarb $3.49/kg 570 Raspberries$5.13/kg 3,352 Saskatoon berries $4.58/kg 299 Strawberries $2.70/kg 265 Total Fruit Expense 5,769 Ice Cream Mix Expense 14,400 Packaging Cost Pails 6,260 Lids 2,184 Shipping and Handling 200 Sticker Label 769 Total Packaging Cost 9,413 Total Direct Expenses 29,582 Total Direct Labour 7,100 Total Direct Labour Benefits 676 Manufacturing Overhead Depreciation 6,013 Insurance 200 Accounting 1,500 Utilities 1,000 Variable Overhead Costs 6,350 Total Manufacturing Overhead 15,063
COST OF GOODS MANUFACTURED $52,421

04/18/23 AgEc 495.3 Business Proposal
Cost of Goods Sold
Cost of Goods Sold
Beginning Inventory 0
Cost of Goods Manufactured 52,421
Cost of Goods Available for Sale 52,421
Total Ending Inventory 4,309
COST OF GOODS SOLD 48,112

04/18/23 AgEc 495.3 Business Proposal
Human Resources Plan

04/18/23 AgEc 495.3 Business Proposal
Organizational Structure
Board of Advisors
Owners
Ice Cream Production Manager
(1)
Sales & Marketing Managers
(2)
Fruit Inventory & Processing Manager
(1)

04/18/23 AgEc 495.3 Business Proposal
Marketing Mix
Product Promotion Place Price

04/18/23 AgEc 495.3 Business Proposal
SWOT AnalysisStrengths Weaknesses
Human Resources Education in ice cream production Experience with product and customers Ease of communication due to small work
force Prior knowledge of fruit processing
Seasonal labour will be difficult to gauge and rely on
Intense workload for employees
Physical Resources Land is already purchased Fruit is grown in close proximity to
processing facility Facility located off of a paved road
Buildings and equipment need to be purchased which will come at a high cost
Freezer space will be an important part of the facilities but the company’s needs may change drastically over time
Financial Resources More land for building expansion is easily acquired
Transport costs are still minimal and done Situated in lower tax assessed area Cost split
Initial start-up costs will be large and take a large amount of capital
Seasonal labour wages will be difficult to gauge based on quality of work

04/18/23 AgEc 495.3 Business Proposal
SWOT Analysis
Opportunities Threats
Need for premium ice cream in hotel and convention centers
Contracting product out during the slow season will reduce the effects of market flux
Need for this type of premium dessert product in special events market
Market trend in ice cream has been decreasing (Goff, 2007)
Competitors in the market will fight for the market to acquire
Contracts may be difficult to maintain year-round
Seasonal inventory needs to be stored until it is needed

04/18/23 AgEc 495.3 Business Proposal
Competitive Analysis of SK Ice Cream Producers
Premium Price
Low Price
High Quality
Low Quality Fast Food
Restaurants
Generic
Industry dominated by Nestle (25.5%) & Unilever (23.5%)
Ben & Jerry’s
Chapman’s
Dairy Queen
Jerry’sHomestead

04/18/23 AgEc 495.3 Business Proposal
Customer Analysis of SK Ice Cream Buyers
Not Currently Serviced with Ice Cream
Currently Serviced with Ice Cream
Need for Generic , Low Quality Ice
Cream
Need for Premium , High Quality Ice
Cream
FarmerÕs Market
Summer Ice Cream Stands Grocery Stores
High-end Local
Restaurants
Sask -Made Market Place
Hotels & Convention Centers

04/18/23 AgEc 495.3 Business Proposal
The Opportunity
“To explore a niche market in the Saskatchewan premium ice cream industry by positioning a company that provides a
unique option allowing customers to tailor a signature ice cream brand to meet the
needs of the menu at their locale.”

04/18/23 AgEc 495.3 Business Proposal
Marketing Budget
Marketing Expenses Marketing Personnel (Part of Salary) 10,000 Marketing Tools (Website, Pamphlets, etc) 5,000 Samples (Approx. 150 pails X $ 20.00/pail) 3,00
Total Marketing Expenses $15,000

04/18/23 AgEc 495.3 Business Proposal
Financial Plan
04/18/23 AgEc 495.3 Business Proposal
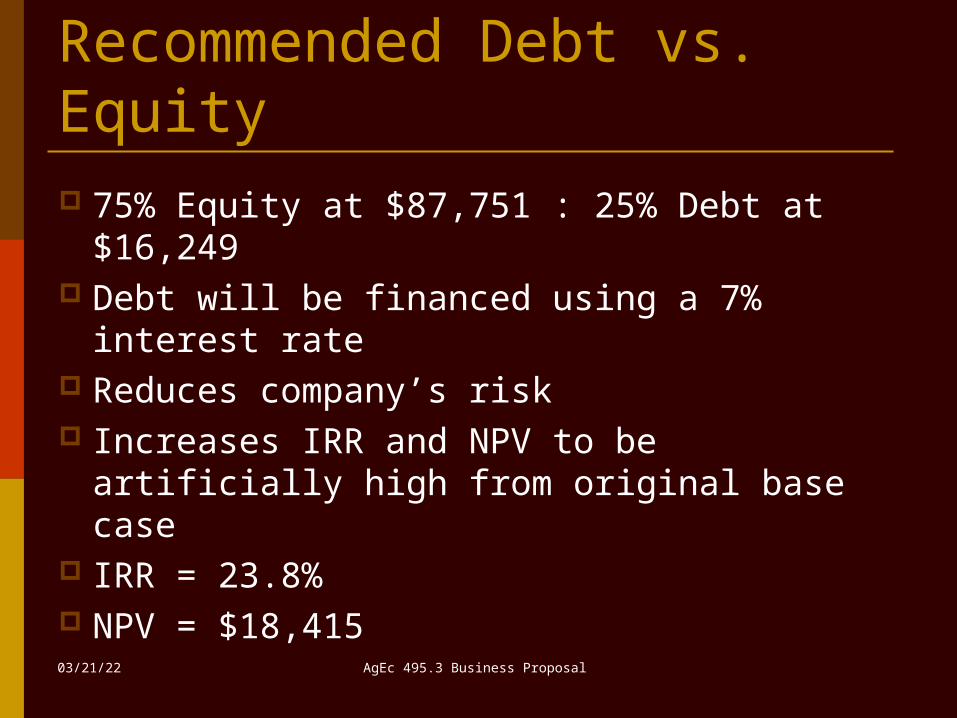
Recommended Debt vs. Equity 75% Equity at $87,751 : 25% Debt at
$16,249 Debt will be financed using a 7% interest
rate Reduces company’s risk Increases IRR and NPV to be artificially
high from original base case IRR = 23.8% NPV = $18,415

04/18/23 AgEc 495.3 Business Proposal
Risk AnalysisRisk Analysis
Critical Value Base Case IRR=0% Allowable % Change
Selling Price $2.99 $2.62 12%
Production 18,000L 15,260L 15%
Labour $7,100 $13,277 87%
Manager $7,200 $33,978 372%
Marketing Salary $12,900 $39,676 208%
Ice Cream Mix $14,400 $21,157 47%
Fruit Expense $5,769 $12,521 117%
Packaging $9,413 $16,198 72%
Sales Revenue $53,820 $45,628 15%

04/18/23 AgEc 495.3 Business Proposal
Break-Even Analysis
$0.00
$0.50
$1.00
$1.50
$2.00
$2.50
$3.00
$3.50
$4.00
$4.50
2008 2009 2010 2011 2012 2013 2014 2015 2016 2017
Year
Sale
s P
rice
/Lit
er
Net Income Break Even Price Cash Flow Break Even Price
Economic (NPV) Break Even Price Base Case
Break-Even Sales Price

04/18/23 AgEc 495.3 Business Proposal
Break-Even Analysis
Break-Even Sales Quantity
0
10
20
30
40
50
60
70
80
90
100
2008 2009 2010 2011 2012 2013 2014 2015 2016 2017
Year
Sale
s Q
uanti
ty (
In T
housa
nds)
Net Income Break Even Sales Quantity Cash Flow Break Even Sales Quantity
Economic (NPV) Break Even Sales Quantity Base Case
04/18/23 AgEc 495.3 Business Proposal
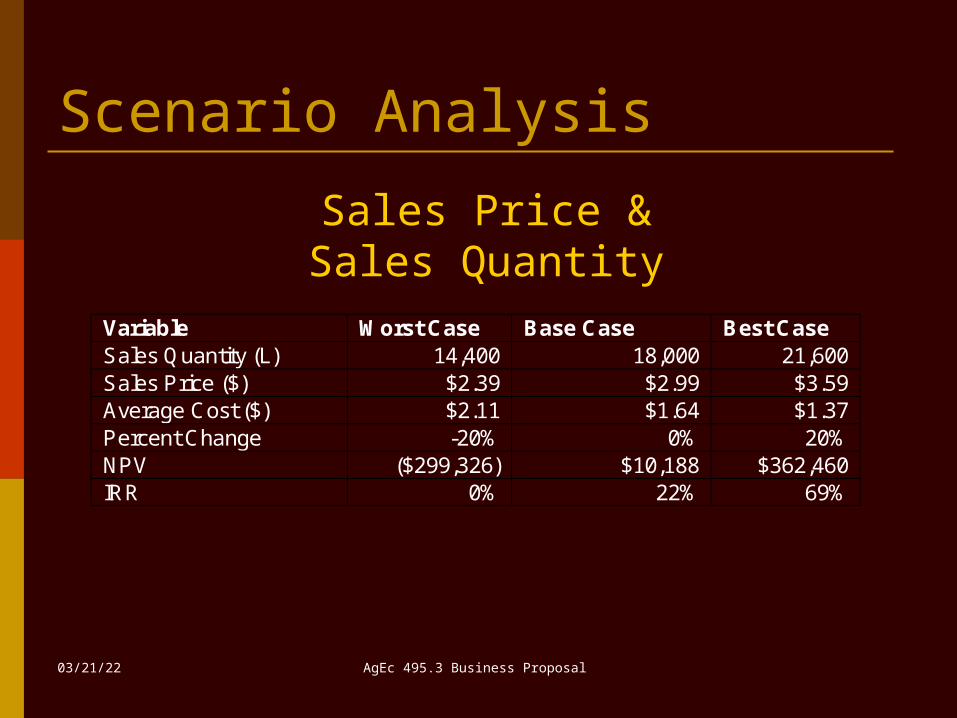
Scenario Analysis
Variable Worst Case Base Case Best Case Sales Quantity (L) 14,400 18,000 21,600 Sales Price ($) $2.39 $2.99 $3.59 Average Cost ($) $2.11 $1.64 $1.37 Percent Change -20% 0% 20% NPV ($299,326) $10,188 $362,460 IRR 0% 22% 69%
Sales Price & Sales Quantity
04/18/23 AgEc 495.3 Business Proposal
Conclusions

04/18/23 AgEc 495.3 Business Proposal
Questions?